Article

Enhancing Energy Efficiency in Retail within Smart Cities through Demand-Side Management Models

1
Department of Information Management, Chinese Culture University, Taipei 111396, Taiwan
2
Department of Computer Science & Information Management, Soochow University, Taipei 100006, Taiwan
*
Author to whom correspondence should be addressed.
Appl. Sci. 2023, 13(24), 13040; https://doi.org/10.3390/app132413040
Submission received: 26 October 2023 / Revised: 29 November 2023 / Accepted: 5 December 2023 / Published: 6 December 2023
(This article belongs to the Special Issue IoT in Smart Cities and Homes)

Abstract

:
The energy discourse is multifaceted, encompassing energy creation, storage, and conservation. Beyond the imperative of conserving energy consumption, effective energy management is a critical aspect of achieving overall energy efficiency. Despite being traditionally regarded as low electricity consumers, retailers play a pivotal role in economic activity. While categorized as non-productive energy users, the retail industry operates numerous establishments, facing substantial energy costs that make energy management integral to its operations. Historically, smaller retail stores have lacked awareness of energy saving. However, by connecting these stores, even modest reductions in individual electricity consumption can yield significant overall energy savings. This study aims to investigate the feasibility of implementing the demand-side management (DSM) aggregator model in the retail industry. Through surveys on awareness of energy saving and the application of deep learning techniques to analyze the effectiveness of the Aggregator model, the results reveal that the mean squared prediction error (MSPE) of this research is below 2.05%. This indicates substantial accuracy and offers meaningful reference value for Energy Service Company (ESCO) providers. The findings contribute practical recommendations for the sustainable and competitive implementation of DSM energy management practices in smart cities.

1. Introduction

Energy has a significant impact on a country’s economic development and people’s livelihoods, particularly in terms of electricity demand. In pursuit of zero carbon emissions by 2050, companies are endeavoring to implement carbon reduction measures, and every step of their supply chain, from production to end use, must achieve the goal of utilizing 100% renewable energy before 2050. Energy management comprises three primary directions: creating energy, storing energy, and conserving energy. The government actively promotes renewable energy sources such as wind and solar power, while companies, under the regulation of the Electricity Act, establish renewable energy and energy storage facilities, and sell excess energy back to the Taipower (Taiwan Power Company (Taipei City, Taiwan)). Additionally, the promotion of energy conservation to businesses and the public is also encouraged. Energy management, aside from increasing energy supply, considers the regulation of energy usage from the demand side as an important approach to address the energy challenge. More studies have focused on energy management in household electricity usage [1]. While managing energy at the household level is crucial, greater benefits can be achieved by implementing energy management strategies at the industrial level. Past research has analyzed and confirmed that the proposed algorithms are effective in minimizing peak loads, demonstrating the feasibility of electricity demand analysis and prediction through power data analysis [2].
Industrial electricity consumption can generally be categorized into productive and non-productive sectors, which encompass various industries, including electronics manufacturing, chemicals, textiles, food, metals, papermaking, finance, insurance, real estate, wholesale, retail, catering, transportation, warehousing, communications, and social services. Given that the retail industry is a domestic industry and a significant economic driver, this study focuses on the retail sector. There have been some demand-side management studies in the past that have collected data through the Internet of Things (IoT) architecture [3] and have conducted energy management through analytical methods [4], but they have not specifically focused on the aggregator. This article examines the demand-side management (DSM) practices of major international countries, investigates the awareness and willingness of the domestic retail industry to participate in DSM through surveys, and ultimately evaluates the model’s effectiveness through system simulations. DSM is an important method for sustainable energy management. However, regulations, ecology, and environments surrounding the power industry vary greatly around the world. Due to significant differences in the power industry in different regions, data collection can be challenging in some areas (such as Taiwan). Despite this, progress is being made within the existing framework to render electricity more sustainable based on the concept of ‘sustainable development.’ This method can also be applied in regions with similar power industry environments. Large electricity consumers are typically enterprises, and various governments have corresponding energy policies in place. However, smaller retail stores generally lack awareness of energy saving. Yet, by connecting a considerable number of retail stores, each store making a small reduction in electricity consumption can result in substantial overall energy savings. Since the retail industry belongs to the service sector, achieving autonomous electricity conservation without incentives can be challenging. This study aims to explore innovative DSM applications in the retail industry by examining industry players’ willingness to adopt such solutions. Therefore, this study aims to explore the feasibility of the DSM aggregator model in the retail industry. Through surveys to understand the energy-saving awareness in the retail sector and employing deep learning techniques to analyze whether the aggregator model can effectively reduce electricity consumption for retailers, the experiments demonstrate significant positive results. The findings provide valuable insights into sustainable energy management practices for the retail sector, which could significantly impact energy consumption and carbon emissions. By leveraging the potential of DSM, retailers can reduce energy costs, promote environmental sustainability, and enhance their market competitiveness. The retail industry’s role in the economy underscores the need for energy management to ensure sustainable and profitable operations. With a conducive environment for DSM, the retail industry has an opportunity to adopt innovative energy management practices that can support national energy conservation and carbon reduction goals.
In summary, demand-side management (DSM) in the retail industry is a crucial aspect of industrial energy management. The willingness to save energy may vary across regions, and there is a need for a model or approach to serve as empirical evidence for the feasibility of DSM. This study introduces a novel DSM model that proactively investigates its potential applicability to the retail industry in Taiwan and validates its feasibility through rigorous small-scale experiments. While the analytical model used in the study is unable to explain how individual stores consume or conserve electricity, it does enable aggregators to quickly select which group of retailers to approach for demand reduction when the power company needs it. The proposed approach has yielded positive outcomes under simulated conditions, and it is expected that this model will aid the industry in saving energy and achieving the corporate philosophy of sustainable ESG (environmental, social, and governance) operations in the future.

2. Literature Review

Various DSM measures have achieved outstanding results in reducing overall peak demand and peak load capacity. These DSM programs include energy efficiency measures, load management, automated control systems, and advanced metering technologies, with the residential and commercial sectors having the lowest technical and implementation costs for energy-saving and carbon reduction measures, while achieving, in relative terms, the largest energy-saving and carbon reduction effects [5,6]. This is because the residential and commercial sectors are the largest energy-consuming sectors, and implementing energy-saving and carbon reduction measures in these areas can achieve greater energy-saving and carbon reduction effects [7,8,9,10,11]. Therefore, governments, businesses, and individuals should prioritize the importance of implementing energy-saving and carbon reduction measures in the residential and commercial sectors. By providing more effective energy-saving technologies and implementation measures, environmental protection and economic benefits can be achieved while reducing energy waste.
The trend in the DSM of electricity is to suppress load (with load as a capacity resource), interruptible load, direct load control, and time-of-use pricing, with time-of-use pricing and load control being the DSM schemes that can achieve the maximum benefit for the commercial sector. However, considering time-of-use pricing and load control, the biggest challenges are threefold [12,13,14,15]:
  • Retail customers should be aggregated for DSM, but it is difficult to aggregate them effectively.
  • DSM should provide forecasting tools for retail customers to consider, otherwise they will not appreciate its effectiveness, and their willingness to participate will be low.
  • The implementation of DSM largely focuses on load reduction or adjusting through time-of-use pricing. A reward-based mechanism may be a necessary approach.
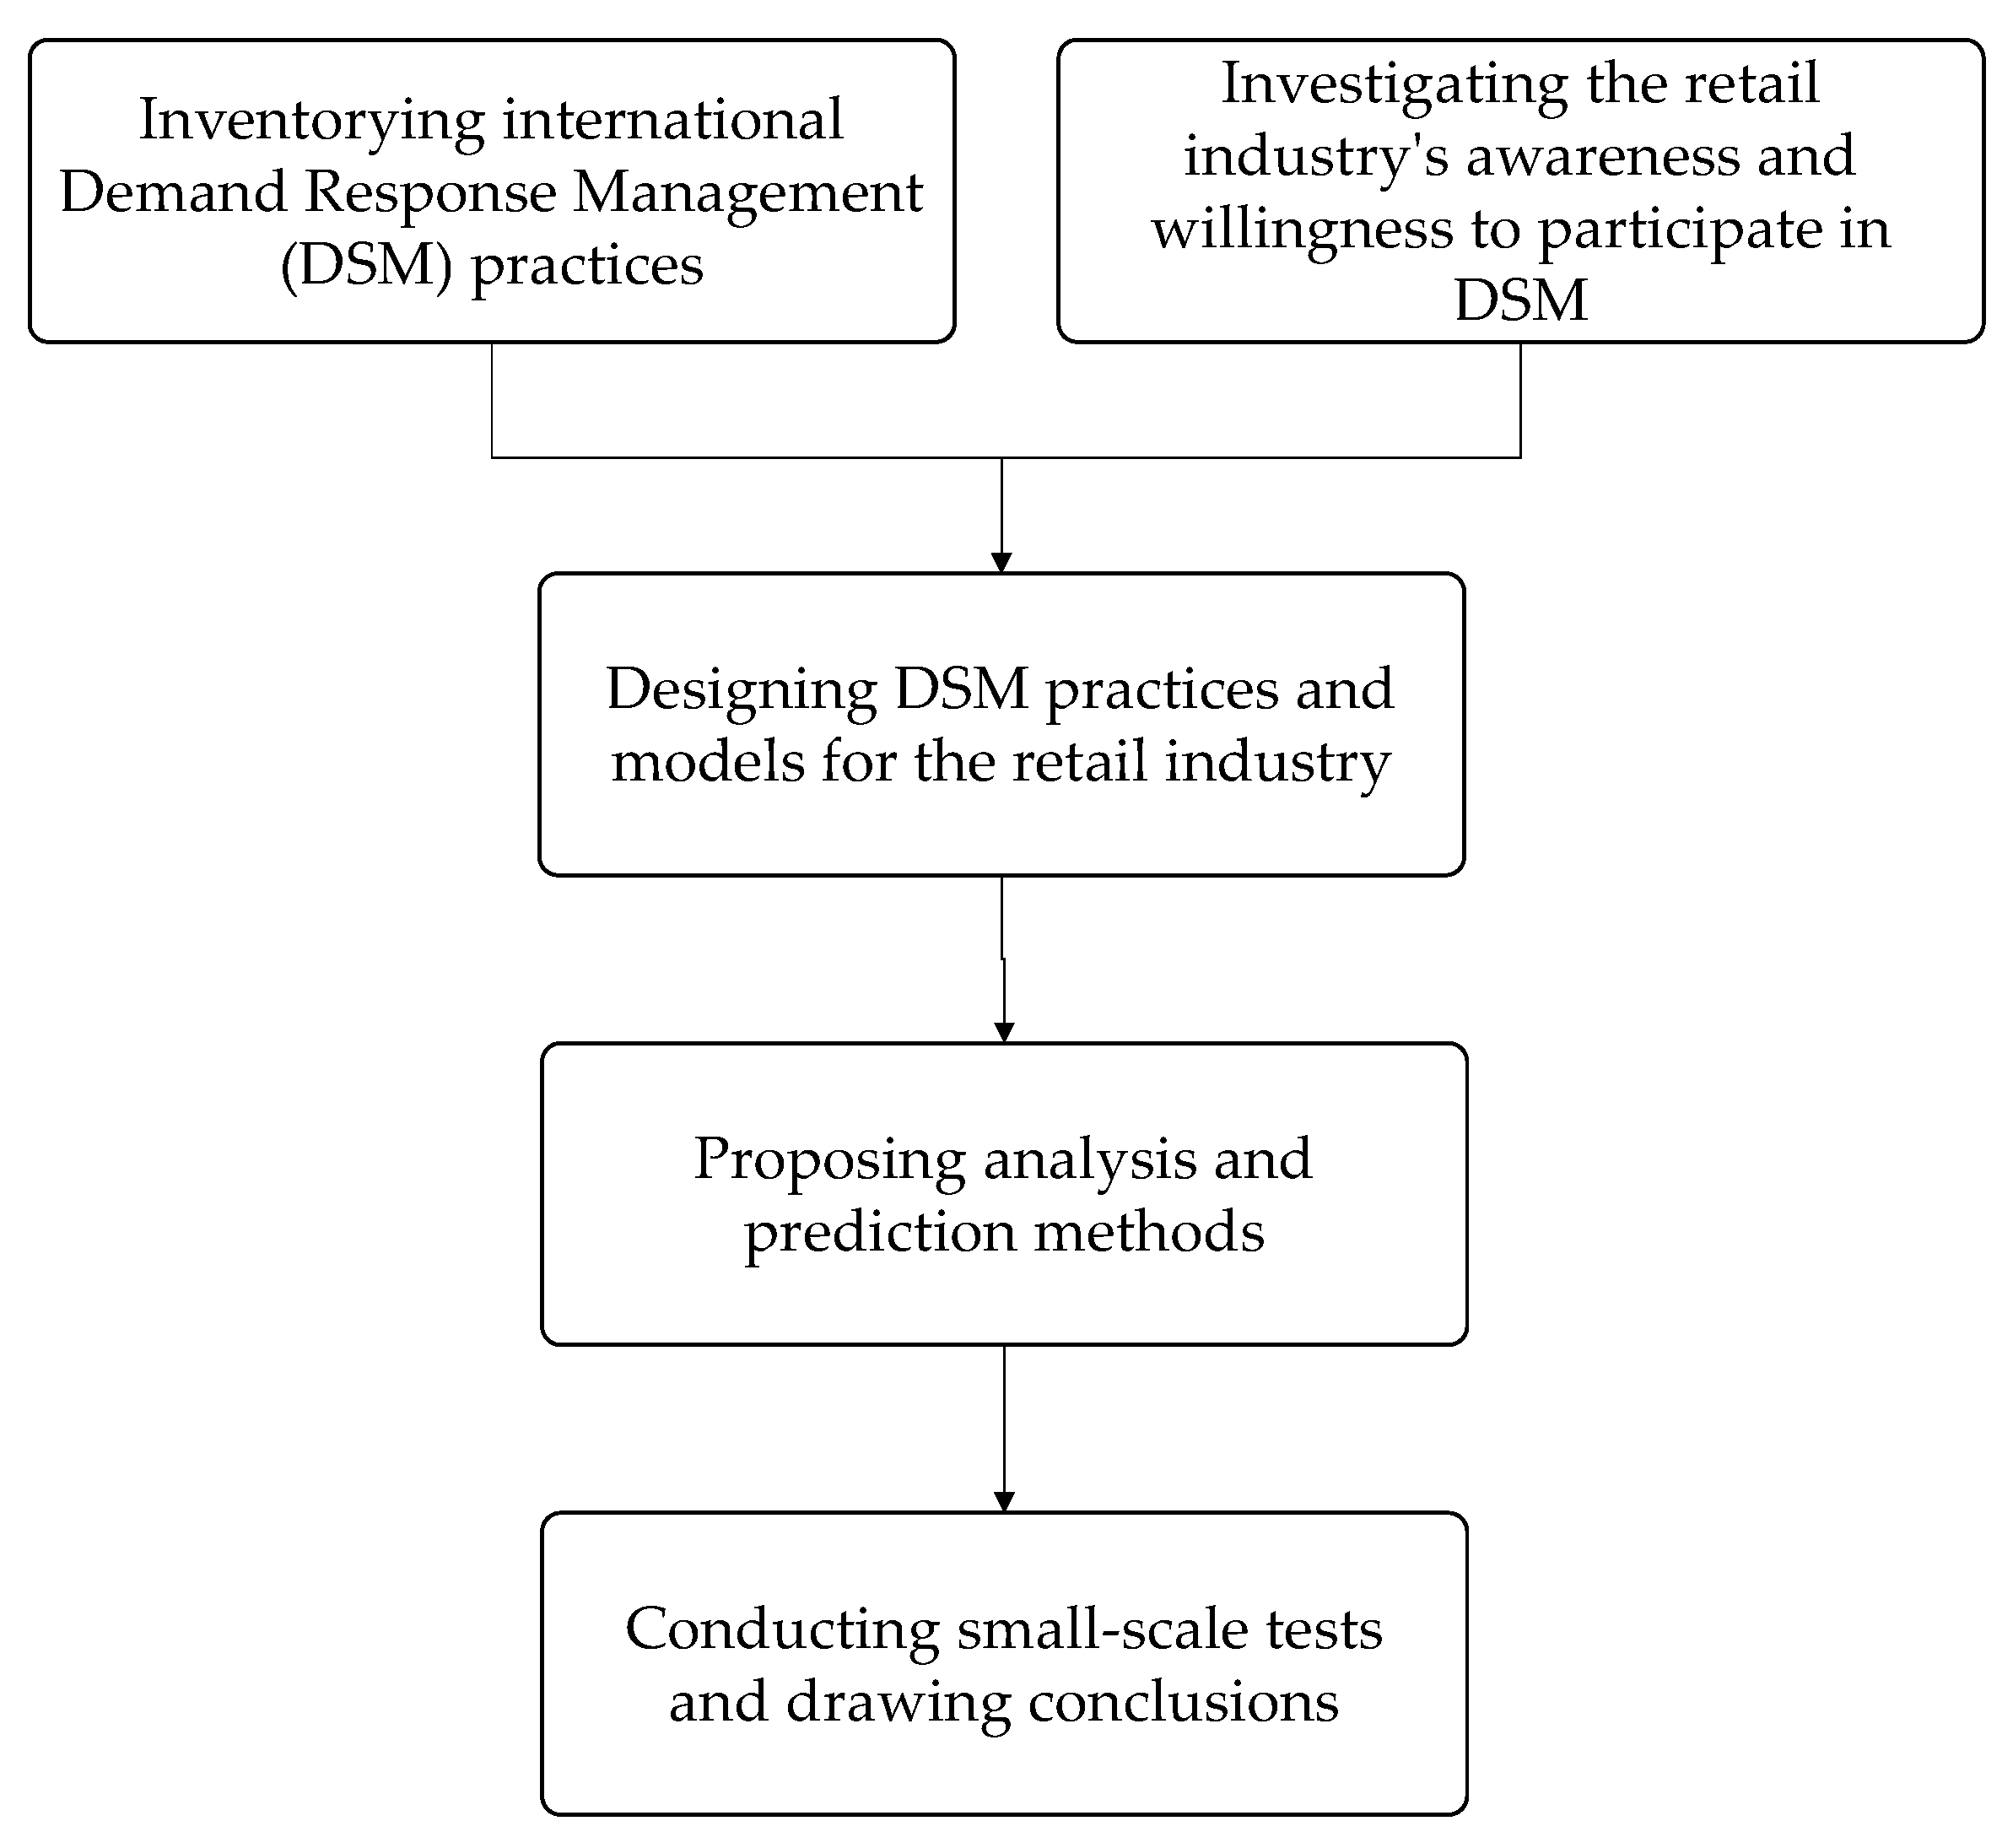
The commercial and industrial sectors are the two industries with the highest participation in DSM programs in the United States (Federal Energy Regulatory Commission). However, different countries and regions have different customs and practices, so before implementing such programs, each country or region should conduct surveys to understand local enterprises’ awareness and willingness to adopt DSM programs.
The forecasting tool for DSM should be applied to all participating users, and the service provider that aggregates all the participating users’ demand is called an aggregator [16,17,18,19]. The aggregator collects all users’ electricity consumption data to predict electricity consumption trends. Each country or region’s power companies will also have corresponding incentive systems, and the aggregator should respond to the temporary power outage incentives offered by the power company and provide DSM services that adjust users’ loads in real time to achieve energy-saving and carbon-reduction policy objectives [17,20,21,22].
Electricity prediction is a crucial part of DSM, and there have been many prediction models developed in the past. Predictions are seen as the foundation of management and are often used to plan future budgets, capacity, and production. As the target of the prediction becomes more unstable, the accuracy of the prediction becomes more important, such as in the case of electricity demand [23]. This review examines the application of machine learning techniques in electricity demand prediction. After comparison and analysis, the authors found that different machine learning algorithms have different levels of accuracy and stability in predicting electricity demand, and the accuracy of the model is also influenced by multiple factors. One study proposed a hybrid model based on wavelet transform and artificial intelligence technology [24] for hourly electricity demand prediction. The results showed that the model could improve the accuracy of electricity demand prediction. A. Jain et al. [25] proposed a short-term electricity demand prediction method based on seasonal double exponential smoothing. This method can accurately predict future electricity demand without the need for any external factors, while also handling complex seasonal trends. M. H. Amini et al. reviewed the application of deep learning techniques in electricity demand prediction [26]. After comparison and analysis, the authors found that deep learning algorithms can improve the accuracy and efficiency of electricity demand prediction, but there are also some challenges and limitations. F.L. Chen et al. [27] proposed the development of an integrated grey relational analysis and multi-layer functional link neural network for retail sales forecasting. According to the research of Chen and Yao [28], artificial neural networks have significantly better predictive capabilities and efficiency than traditional statistical methods and other related reasoning prediction models [29,30,31].
In this study, we first observe international DSM practices and develop a suitable DSM plan. We then use a questionnaire to understand the retail industry’s perception and willingness to participate in the DSM plan, and propose a prediction method to aggregate all users’ electricity usage information and predict electricity demand.

3. Proposed Method

The research framework is mainly divided into three modules and a system simulation, including inventory of the DSM practices in major countries worldwide, understanding the awareness and willingness of domestic retailers towards DSM through surveys, and finally evaluating the effectiveness of the model through system simulation.
The literature review in this article discusses conceptual ideas around DSM, and uses survey results to make overall electricity usage predictions using a simple predictive model. It is hoped that this can be a reference for aggregators to use in the future.
The research framework is shown in Figure 1.
The present study adopts multiple research methods, including a literature review, questionnaire survey, and experimental methods. During the stage of inventorying international DSM practices, a literature review was conducted to understand DSM practices in various countries. In the stage of investigating the retail industry’s awareness and willingness to participate in DSM, a questionnaire survey was used to understand the energy-saving practices and awareness of Taiwan’s retail industry. In the stage of emergency demand response and the proposition of analysis and prediction methods, the total electricity consumption of each retail store was analyzed using historical data from the past seven days. When there is a demand for load reduction in the future, it is possible to quickly determine whether the electricity consumption of a group of retail stores meets the load reduction requirements of the aggregator.

3.1. Inventorying International Demand-Side Management Practices

Referring to international DSM practices [32,33,34,35], there are several approaches such as direct load control, interruptible/curtailable programs, demand bidding/ancillary services market provision, emergency demand response, time-of-use pricing, critical peak pricing, real-time pricing, decoupling, system benefits charges/public goods charges, general information and marketing programs, indoor temperature limitation, rolling blackouts/brownouts, agreements with industrial companies, and more. However, some of these approaches are subsidy programs, while others are applicable to production sectors rather than the retail industry. Therefore, this study first identified the DSM practices of each country, referred to the research report “The Energy Conservation Measures and Applied Technologies for Demand-Side Management” [36] conducted by the Taiwan Institute for Information Industry under the project of the Energy Bureau of the Ministry of Economic Affairs, and summarized them as shown in Table 1.
  • Direct load control
In the United States, direct load control is one of the most common DSM measures. Many states in the U.S. have plans to incorporate it into their DSM programs. In Japan, direct load control is also one of the DSM measures adopted by the Japanese power company, but it has been restricted in recent years due to the impact of energy market liberalization policies.
  • Interruptible/curtailable programs
Several power companies in the United States have interruptible/curtailable programs. However, the implementation of this measure in some states is restricted due to the potential negative impact on the financial status of power companies. Taiwan has also adopted interruptible programs, where large electricity consumers such as high-tech industries can stop their electricity usage for several hours in exchange for a discount on their electricity price, subject to advance notice.
  • Demand bidding/ancillary services market provision
Demand bidding and ancillary services market provision are widely used in DSM programs in the United States, and are regarded as an important part of sustainable energy development. However, the competitiveness of the market makes the issue of ensuring stable power supply more complicated. In the European Union, demand bidding and ancillary services market provision are supported through reforms of the electricity market. However, the implementation of this measure is not widespread in some countries due to the need for high market openness and technical support.
  • Emergency demand response
Emergency demand response is also considered very important in DSM programs in the United States. In some U.S. states, government agencies require power companies to develop emergency demand response plans.

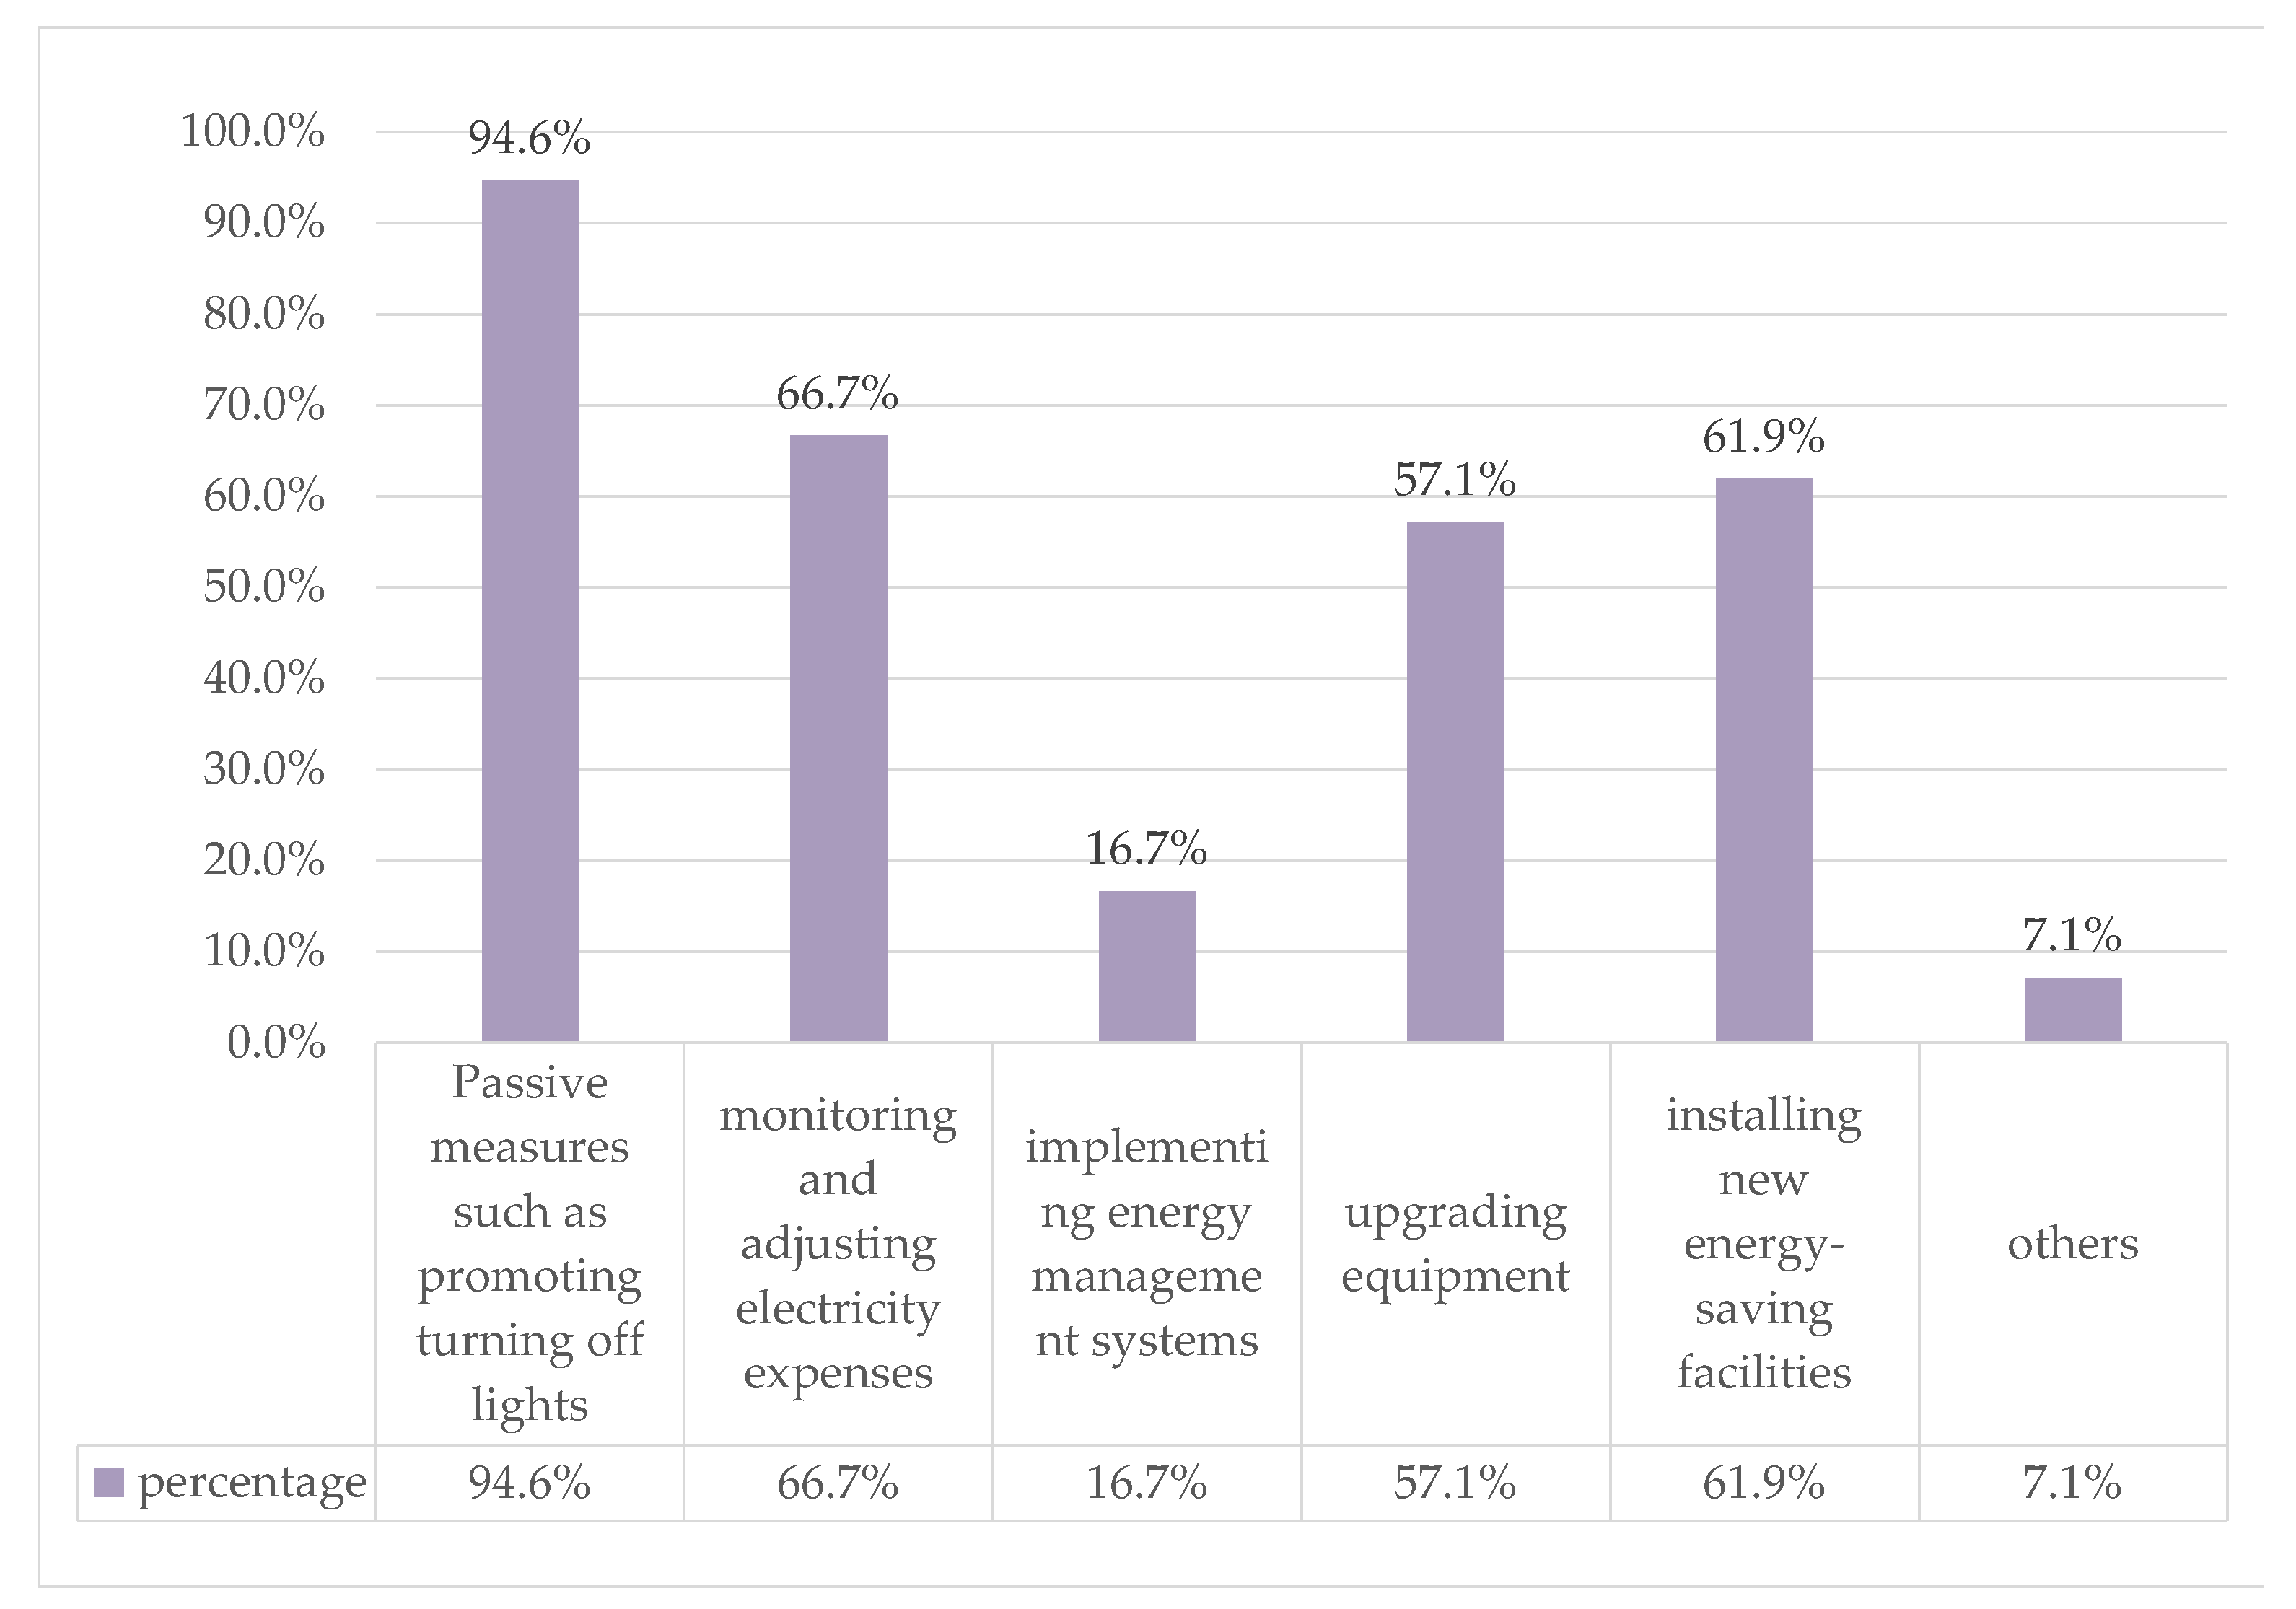
3.2. Investigating the Retail Industry’s Awareness and Willingness to Participate in DSM

This study surveyed the energy efficiency data [37] in the energy-saving service network of Taiwan’s service industry. Referring to the research report “The Energy Conservation Measures and Applied Technologies for Demand-Side Management” [36] executed by the Taiwan Institute for Information Industry and the Ministry of Economic Affairs Energy Bureau project, the electricity consumption status and energy usage intensity (EUI) of each floor space in the retail industry were compiled. As shown in Figure 2 below, the top three industries with the highest electricity consumption were convenience stores, fast food restaurants, and fresh supermarkets. Additionally, high-energy-consuming retail stores include convenience stores, bakeries, fast food restaurants, hot pot restaurants, and department stores.
This research adopts a descriptive statistical approach, targeting 56 retail stores within a specific region in Taiwan. The aim is to understand their current energy-saving status and energy-saving awareness. According to EUI, this study classifies the electricity usage of the retail industry into six levels, with Level 1 being the lowest electricity consumption and Level 6 being the highest. As shown in Figure 3 below, this study focuses on investigating high-electricity-consumption retail stores in Level 5 and Level 6, including 56 establishments such as convenience stores, restaurants with electricity-consuming devices on every table, department stores, supermarkets with refrigeration facilities, and hotels. The survey covers 10 shopping malls/department stores, 12 markets/supermarkets, 20 restaurants, 6 hotels, and 8 convenience stores. The investigation found that the retail industry has a high awareness of energy conservation (implementing passive measures such as promoting turning off lights). However, the operating costs of the retail industry are relatively high, and not all retail businesses can afford to replace their energy-saving facilities (e.g., replacing energy equipment or installing new energy-saving facilities). Only large-scale retail businesses have the ability to do so. Although the number of retail businesses that have introduced energy management systems is limited, they have a relatively high willingness to manage demand-side electricity needs (monitoring electricity bills to adjust usage).
This study adopts a descriptive statistical approach, focusing on 56 retail stores within a specific region in Taiwan as the research target. The purpose is to assess their current energy-saving status and energy-saving awareness.
To understand the energy-saving awareness of retail stores, a questionnaire consisting of six items was used:
  • Passive measures, such as promoting turning off lights;
  • Monitoring and adjusting electricity expenses;
  • Implementing energy management systems;
  • Upgrading equipment;
  • Installing new energy-saving facilities;
  • Others.
The data reveal that for Item 1, retail operators are willing to adopt some measures for energy conservation. However, for Items 4 and 5, which involve investing in equipment upgrades and installing new facilities, their willingness is not as significant. This might be attributed to the fact that the retail industry includes many small stores that may not have the financial capability to bear such costs. Moreover, the implementation of Item 3, which involves establishing energy management systems, poses practical difficulties.
Interestingly, for Item 2, which involves monitoring and adjusting electricity consumption, the proportion of willingness is relatively high. This suggests that small retail stores have a willingness to save energy and have a favorable acceptance of DSM practices. DSM does not necessarily require equipment upgrades; instead, it relies on providing sufficient information to enable retail businesses to adjust their electricity usage. The choice of a specific DSM model will be explored in the following section.
Table 2 is a section of the questionnaire used to evaluate Figure 3.
For retailers with high levels of energy consumption, such as convenience stores, restaurants with electric devices at every table, department stores, supermarkets (with freezing facilities), and hotels, the following section proposes an approach to designing aggregators that meet their needs for DSM. The next section introduces a prediction method for aggregators and retailers to consider. By understanding how much energy can be saved through this approach, both aggregators and retailers will be more likely to promote and succeed in this model in the future.

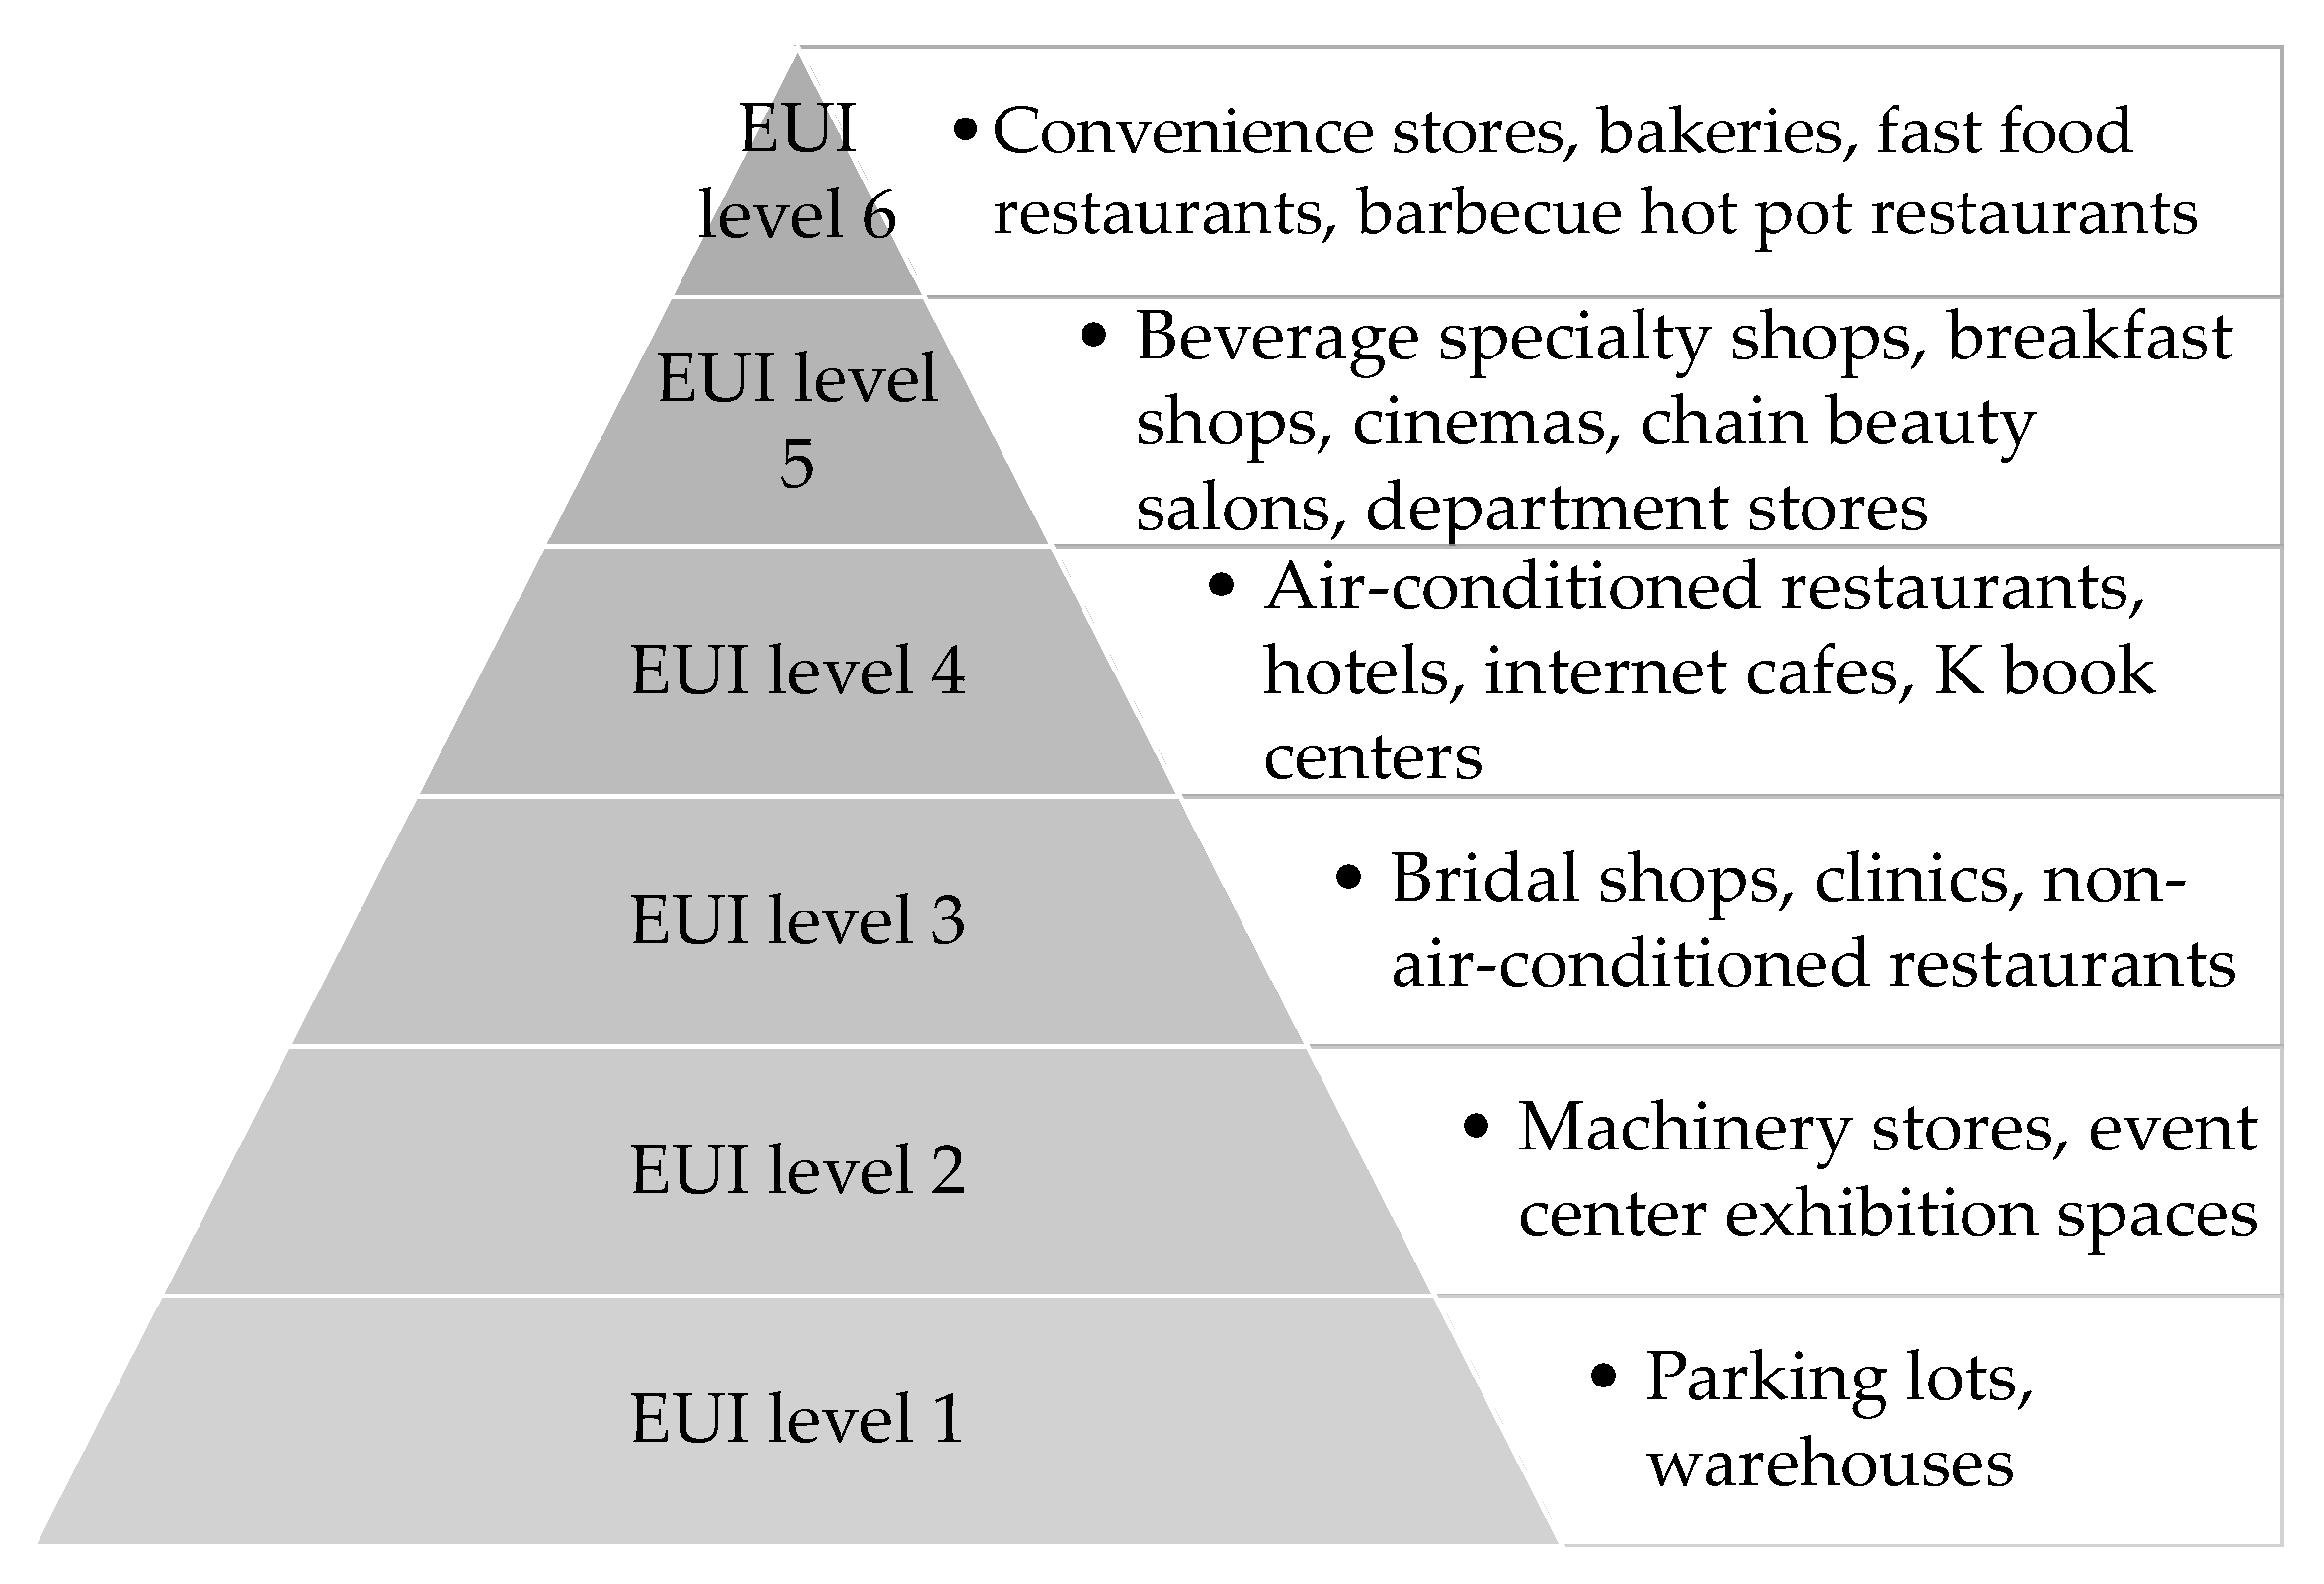
3.3. DSM Practices and Concepts for the Retail Industry

There are various approaches and models for DSM. Based on the references [38,39,40,41] from previous relevant studies, we have compiled possible models, which may include the following. (1) A mediator model: energy management service (EMS) providers act as mediators, executing tasks such as energy management and demand response on behalf of electricity suppliers, and delivering products and services directly to end-users. (2) An indirect provision model, which provides products and services to electricity suppliers (who in turn provide energy analysis results and services to end-users), and offers products, analysis, consulting, and customer management services to electricity suppliers. (3) A direct provision model, which directly provides products and services to end-users. (4) A mediator model for integrated demand management, which combines energy efficiency programs provided by energy service providers with demand response programs provided by electricity suppliers to serve end-users. (5) A direct provision service model for integrated energy storage, which integrates energy management systems with other energy equipment such as solar systems, energy storage, and electric vehicles used by customers. (6) A direct provision service model with an incentive mechanism, which provides incentives such as subsidies, point discounts, cash subsidies/rewards, etc. upon achieving energy efficiency improvement and demand response events.
There are six DSM models, with the first being the energy management systems provider (the Energy Service Company (ESCO)), the second and third models not requiring intermediaries. The “mediator model for integrated demand management” within the fourth model is based on the aggregator as the core, coordinating between electricity consumers and electricity providers, and is the model adopted in this study. The fifth being an energy-based energy storage and creation model, and the sixth being a reward model for end-use electricity consumers. The aggregator model is a pyramid-like DSM energy management approach, and previous research has already studied scattered electricity consumers [42]. The model used in this study is the mediator model for integrated demand management. The aggregator is the main actor in this model, finding retailers to participate in the model and helping to notify them of the demand from the electricity company. The aggregator also establishes an energy management system for retailers, providing them with the service of temporarily stopping electricity use when the electricity company has demand. Retailers can accumulate electricity during the temporary shutdown, and if it meets the range specified by the electricity company, the electricity company will provide a reward to the aggregator, who will then share it with the retailers.
In this model, the electricity company can stably provide electricity by temporarily stopping some electricity use during peak hours, and the aggregator and retailers can receive rewards. More importantly, energy resources can be properly utilized, creating a sustainable and continuous information energy management model. From a governmental perspective, there is an almost game-like interaction between aggregators and dispersed consumers [42]. Therefore, data analysis services can effectively transform this game-like interaction into a feasible DSM model [43].
ESCO providers are the best aggregators because they already have a mature energy management system. However, they currently do not have energy consumption prediction technology, so they cannot provide reference to retailers about the effectiveness and economic benefits of this model.
If ESCO providers can successfully develop energy data analysis and prediction technologies, they can provide software to power suppliers with relevant features, and power suppliers will pay licensing fees to ESCO providers. However, in Taiwan, the power industry is focused on the strategic development of the Taiwan Power Company, and unfortunately, the Taiwan Power Company has not implemented such measures.
In the industrial or production sector, there are already many energy management methods, and the possibility of suppressing or shifting peak electricity usage is relatively low. Retail electricity users, such as supermarkets, convenience stores, and restaurants, constitute a unique “small”, “multiple”, and “miscellaneous” market. If they can be integrated through DSM aggregator models, during times of possible electricity shortages, power suppliers (such as the Taiwan Power Company) can issue demands to electricity aggregators and provide rewards to them and all participating retail stores. In addition to effectively managing the use of electricity, the electricity aggregators and all participating retailers can also make a profit. Therefore, developing DSM measures such as aggregators and energy consumption prediction analysis may be an effective approach to energy saving, carbon reduction, and sustainable operations in the retail industry.

4. Experience Result

This section will elaborate on the results of the proposed analysis and prediction methods, as well as conducting small-scale tests.

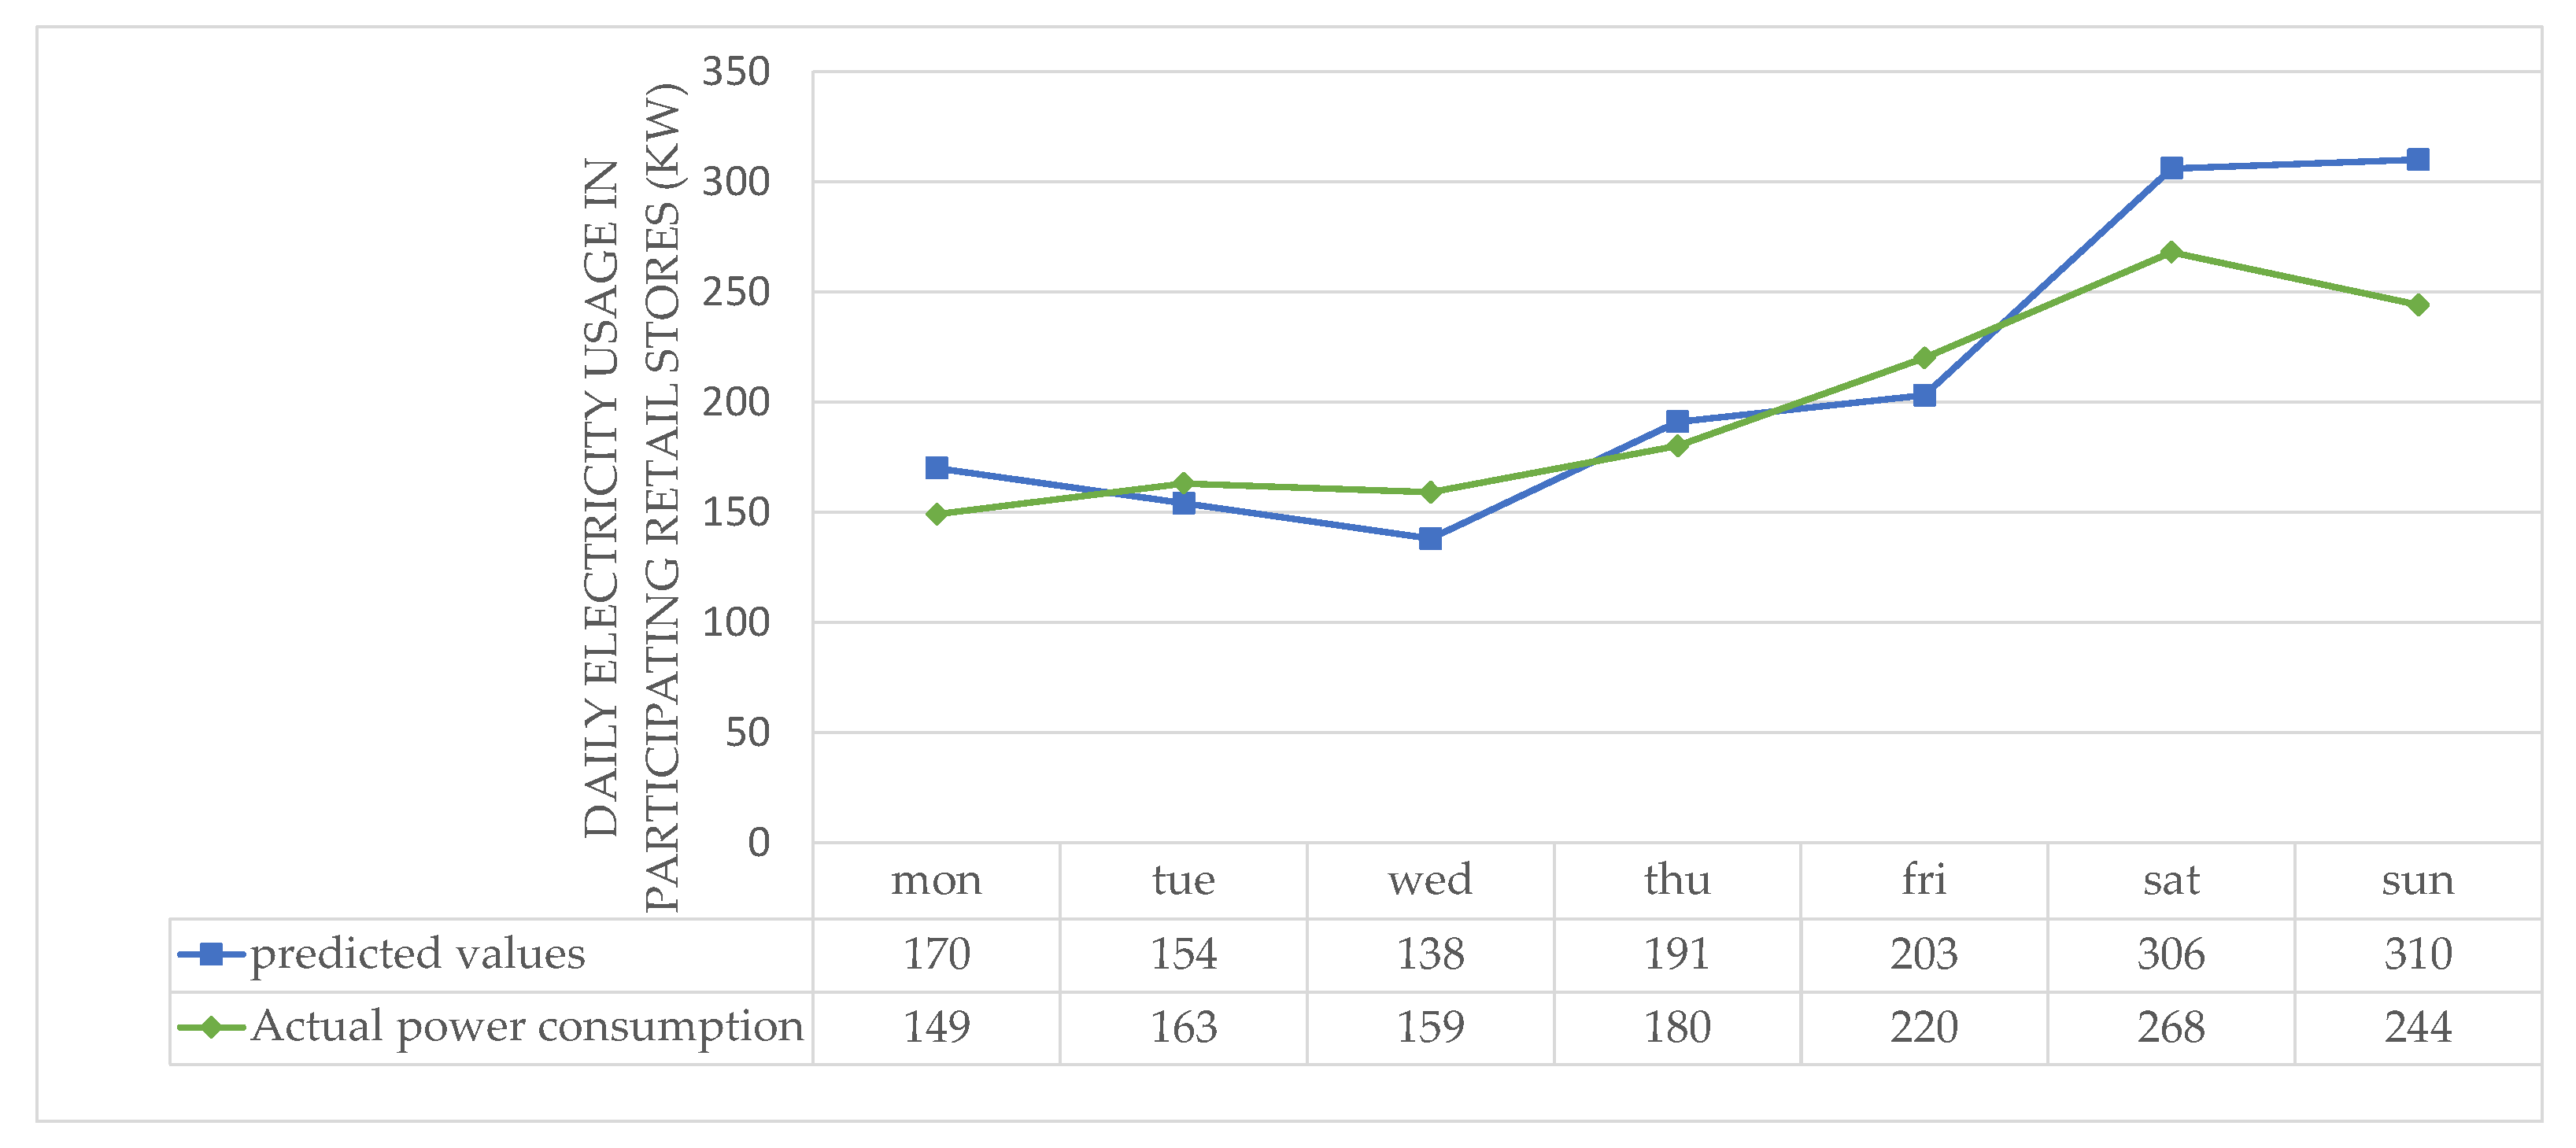
4.1. Proposed Analysis and Prediction Methods

Under this approach, it is not possible to predict the electricity consumption and behavior of each retail store, nor to explain the electricity consumption habits of each store. Although this may seem unfortunate, it still aligns with the original purpose of this study. The aggregator’s DSM approach requires a group of retail stores to be willing to reduce their electricity consumption simultaneously. Therefore, we analyzed the electricity consumption of a group of retail stores to simulate the future scenario wherein an aggregator operator may request a reduction in electricity consumption from this group of stores. The actual reduction in electricity consumption from this group of stores indeed met the aggregator’s demand for reducing electricity consumption. Whether the total reduction in electricity consumption from this group of stores meets the aggregator’s (or more precisely, the power company’s) demand for reducing electricity consumption can be observed through this analytical model.
In the previous survey, 28 out of 56 retail stores expressed their willingness to use electricity consumption monitoring to adjust their energy usage, and 17 of them provided their business-related information for research analysis after learning about the DSM aggregator model proposed in this study.
The purpose of DSM is to aggregate the total electricity consumption of each store and reduce power consumption through temporary power outages or reductions. The primary energy consumption in the retail industry comes from heating water, air conditioning, cooking, and lighting, all of which rely on electricity. To effectively reduce the electrical demand of the service industry, it is essential to actively improve the energy efficiency of various energy-consuming devices. However, based on current practical data, the study subjects targeted by this research are limited by Taiwan’s existing power facilities and infrastructure, making it challenging to obtain detailed data. This means that individual data for retail businesses cannot be analyzed, and analysis and electricity predictions must be based on the total electricity consumption of each retail business. Therefore, we adopt this simpler approach as much as possible in our calculations. In our model, electricity predictions are calculated on a daily basis, meaning each store has only 30 data points. All 17 stores are considered as a single unit producing total power output at the same time. Thus, this study analyzes and predicts electricity consumption based on the total electricity consumption of each retail business. There are a total of 4 convenience stores, 2 department stores, 1 supermarket, and 1 hotel, as well as 9 catering enterprises, totaling 17 businesses, with their total electricity consumption as our parameter. As the previous experiments were based on total electricity consumption, the daily electricity consumption of each enterprise is parameter R, R: 1~17, as shown in Table 3.
R1 represents the total electricity consumption of the first convenience store, R2 represents the total electricity consumption of the second convenience store, R5 represents the total electricity consumption of the first department store, R7 represents the total electricity consumption of the hotel, R8 represents the total electricity consumption of the supermarket, R9 represents the total electricity consumption of the first restaurant, R10 represents the total electricity consumption of the second restaurant, and so on. We observed that electricity consumption in the retail industry follows a regular cycle, which coincides with people’s weekly habits, over a seven-day period. Therefore, this study uses data from the previous day up to the previous seven days as training data, specifically the total electricity consumption of retail stores during this period. The study aims to demonstrate the feasibility of aggregator’s DSM approach by utilizing past electricity consumption for simple prediction.
This study uses a back-propagation neural network (BPNN) for electricity consumption prediction, which has been widely adopted by many researchers for predictive analysis. Like other deep learning models, a BPNN consists of an input layer, hidden layer, and output layer. The BPNN uses the hidden layer to convert the independent variables from the input layer into a nonlinear function. The output layer then further transforms the nonlinear function from the hidden layer. By repeating this process and undergoing repeated learning, the BPNN can generate a prediction model. BPNNs have been applied in various fields of research [44,45,46].
In this study, due to its small-scale nature, the choice to use a back-propagation neural network (BPNN) over long short-term memory (LSTM) for electricity consumption prediction analysis is based on the following factors:
Data Volume and Characteristics: The dataset is relatively small, and the time series data have limited length, making a BPNN more suitable than LSTM. LSTM requires more data to capture long-term dependencies in time series, and in some cases, a BPNN may exhibit more robust performance on small datasets.
Model Complexity: LSTM, being a variant of a recurrent neural network (RNN), can handle both long-term and short-term dependencies, but it comes with higher model complexity. In this study with a small dataset, the simpler structure of BPNN may be easier to implement and adjust.
Adaptability to the Problem: BPNN, in the context of electricity consumption prediction, is more focused on capturing rapid changes and real-time trends. The iterative learning and updating pattern of BPNN may be better suited for the specific requirements of the electricity prediction problem in this study.
In this study, the network parameters include the learning rate, momentum, number of training iterations, and acceptable error range. Next, we will set up the network architecture and parameters, and initialize the network’s weight values W_xh, W_hy, and bias values θ_h and θ_y with uniformly distributed random numbers. The calculation steps for the hidden layer’s output during the training phase are described simply, without complicated mathematical formulas. The formula is as follows:
n e t h = i W _ x h i h X i θ _ h h
H h = f n e t j = 1 1 + exp n e t h
The calculation formula for the output value of the inference in the output layer is as follows:
n e t j = h W _ h y h j H h θ _ y j
Y j = f n e t j = 1 1 + exp n e t j
In this study, the focus lies on exploring the training process of a neural network model with various network parameters, including the learning rate, momentum, number of training iterations, and acceptable error range. The network architecture and parameters are established, and the weight values and bias values of the network are initialized with uniformly distributed random numbers. The study introduces the formulas for calculating the output values of the inference in both the output and hidden layers. The delta (δ) difference between the output and hidden layers is calculated using specific formulas for each layer. Correction values for the weighted value and bias value of the hidden layer are derived, and the weight values and bias values for both the output and hidden layers are updated until the network converges.
(1) and (2) represent the calculation steps for the hidden layer’s output during the training phase. (3) and (4) represent the calculation formulas for the output value of the inference in the output layer. The weight and bias values are updated until the network converges during the training phase of the model.
The advantages of BPNNs in prediction primarily include the following aspects:
Strong Generalization: A BPNN is capable of modeling non-linear relationships of various forms, endowing it with strong generalization abilities. It can provide accurate predictions on previously unseen data.
Good Interpretability: The BPNN’s structure is relatively simple, making it possible to intuitively understand its working principles. As a result, it possesses good interpretability.
In particular, BPNNs are effective in capturing trends and seasonal variations in time series data, making them well-suited to the current research. This indicates the completion of the training phase of the model. This study uses R language and installs packages such as neuralnet, nnet, and caret, so no further introduction is given to the complex mathematical calculations. The proposed prediction model is executed, and the error values between the historical data and the predicted results are compared to serve as the basis for predicting the total electricity consumption. The training process involves 17 retail stores’ daily electricity consumption data for 30 days (1 month), and the model is used to predict the 7-day electricity consumption, which is then compared to actual data for observation.

4.2. Conducting Small-Scale Tests

The electricity consumption prediction method described in the previous section was trained using the daily electricity consumption of 17 retail stores over a period of 30 days. The model was then used to predict the electricity consumption for the next 7 days and compared against the actual electricity consumption during that period. The experimental results are shown in Figure 4.
The proposed model evaluated the prediction errors of the validation data using the mean absolute percentage error (MAPE) and mean squared percentage error (MSPE). As shown in Table 4 below, the absolute error for MAPE should be approximately 12.5%, while for MSPE, it should be around 2%. These results indicate favorable predictive outcomes for the application of this method in the DSM aggregator. In the literature in Section 3 [42,43,47], it is further elucidated that this research model, in addition to being innovative, presents a novel approach for ESCO providers. This contributes both academically and practically, offering practical recommendations for the sustainable and competitive implementation of DSM energy management practices in smart cities.
Neural networks are a powerful method that falls within the scope of machine learning, and as such, they are very effective for prediction. However, the biggest issue is that they are difficult to explain. From this method, it can be observed that the electricity consumption prediction for weekdays from Monday to Friday is good, but there are significant differences in prediction for Saturday and Sunday. This is likely due to the fact that retail electricity is closely related to people’s daily lives. On weekends, people tend to engage in activities such as outings, family activities, and various social needs, which leads to greater differences in prediction compared to weekdays. Overall, based on the small-scale experiments conducted in this study, the prediction model is quite close to actual practice, so it should be feasible.
The aggregator has a “strength in numbers” effect by gathering many small users into a virtual large user for the target market, cooperating with the power company to reduce demand during peak or critical peak hours. However, because the structure of retail users is relatively diverse and there is no dedicated management mode for handling electricity consultation and management, the aggregator is the core of this innovative and sustainable DSM model, and the method of predicting user electricity consumption is a key focus of this core.
The user electricity consumption prediction method centered on the aggregator provides feedback and rewards for both the electricity aggregator and the retail industry when the power supplier needs to reduce demand. This serves as a reference model for sustainable energy consumption as a business innovation.
In addition, after predicting electricity consumption, when the power supplier, Taipower, needs to reduce demand, the demand can be transmitted to the aggregator, which can then evaluate the potential load reduction based on the electricity consumption prediction proposed in this study, and can respond to the power supplier.
There are some research limitations within our model, as electricity prediction is calculated on a daily basis, which means each store only has 30 data points. In the future, if additional data can be collected, adopting a multi-objective model [48] may lead to even more precise results. All 17 stores produce total electricity output as a single unit at the same time. As pointed out, there are difficulties in collecting electricity data in some regions (such as Taiwan), and the amount of data is slightly insufficient. Additionally, our model is a simple BPNN, which may not fit well with complex nonlinear relationships, and usually requires more neurons and layers to increase its prediction capability.

5. Conclusions

The retail industry, classified as a non-production sector electricity consumer, faces unique challenges compared to its production sector counterparts. As a provider of services to consumers, the retail sector’s electricity usage cannot be stored, setting it apart from high-pressure electricity users in the production sector with cogeneration functions. Despite these challenges, the retail sector falls under the residential and commercial user category, exhibiting significant diversity in electricity usage among numerous households. This diversity allows for relatively low implementation costs for energy-saving and carbon reduction measures, presenting an opportunity to achieve maximum effectiveness in suppressing electricity consumption. This study introduces a forward-looking DSM model tailored to the retail industry in Taiwan. Through small-scale experiments, the study not only assesses the model’s applicability but also verifies its feasibility. Aggregators play a pivotal role in collecting and analyzing electricity consumption information from the users they oversee. By conducting a small review of DSM programs globally and understanding the execution status and willingness of the retail industry to engage in such initiatives, this study designs an appropriate retail industry DSM aggregation model. By applying deep learning techniques to analyze the effectiveness of the aggregator model, the experiments also demonstrate that the MSPE of this research is below 2.05%. This indicates a high level of accuracy and provides meaningful reference value for ESCO. The study offers valuable insights into contemporary debates surrounding energy efficiency and DSM policies and methodologies. Simultaneously, it provides practical recommendations for DSM energy management practices in smart cities.

Author Contributions

Conceptualization, C.-Y.K. and C.-B.Y.; methodology, C.-Y.K.; validation, C.-Y.K.; formal analysis, C.-Y.K. and C.-B.Y.; investigation, C.-Y.K.; data curation, C.-Y.K. and C.-B.Y.; writing—original draft preparation, C.-Y.K.; writing—review and editing, C.-B.Y. and C.-Y.K.; visualization, C.-Y.K.; supervision, C.-B.Y. and C.-Y.K. All authors have read and agreed to the published version of the manuscript.

Funding

This research received no external funding.

Institutional Review Board Statement

Not applicable.

Informed Consent Statement

Informed consent was obtained from all subjects involved in the study.

Data Availability Statement

The data presented in this study are available on request from the corresponding author. The data are not publicly available due to this study has data usage rights only, and does not have data ownership.

Conflicts of Interest

The authors declare no conflict of interest.

References

  1. Khan, M.; Silva, B.N.; Khattab, O.; Alothman, B.; Joumaa, C. A Transfer Reinforcement Learning Framework for Smart Home Energy Management Systems. IEEE Sens. J. 2022, 23, 4060–4068. [Google Scholar] [CrossRef]
  2. Silva, B.; Khan, M.; Wijesinghe, R.; Wijenayake, U. Meta-heuristic optimization based cost efficient demand-side management for sustainable smart communities. Energy Build. 2023, in press. [Google Scholar] [CrossRef]
  3. Silva, B.N.; Khan, M.; Han, K. Futuristic Sustainable Energy Management in Smart Environments: A Review of Peak Load Shaving and Demand Response Strategies, Challenges, and Opportunities. Sustainability 2020, 12, 5561. [Google Scholar] [CrossRef]
  4. Silva, B.N.; Han, K. Mutation operator integrated ant colony optimization based domestic appliance scheduling for lucrative demand side management. Future Gener. Comput. Syst. 2019, 100, 557–568. [Google Scholar] [CrossRef]
  5. Ullah, M.A.; Islam, M.A.; Islam, M.F.; Uddin, M.N. Demand-side management to reduce electricity peak demand: A review. J. Clean. Prod. 2016, 112, 198–213. [Google Scholar] [CrossRef]
  6. Solís-García, R.; Ponce-Ortega, M.; Belman-Flores, J.C.; Sánchez-Cifuentes, S.S. Demand-side management potential for peak load reduction in residential buildings: A review. Renew. Sustain. Energy Rev. 2018, 92, 551–561. [Google Scholar] [CrossRef]
  7. Labanca, N.; Pereira, G.; Watson, M.; Krieger, K.; Padovan, D.; Watts, L.; Moezzi, M.; Wallenborn, G.; Wright, R.; Laes, E.; et al. Transforming innovation for decarbonisation? Insights from combining complex systems and social practice perspectives. Energy Res. Soc. Sci. 2020, 65, 101452. [Google Scholar] [CrossRef]
  8. Hafez, F.S.; Sa’Di, B.; Safa-Gamal, M.; Taufiq-Yap, Y.; Alrifaey, M.; Seyedmahmoudian, M.; Stojcevski, A.; Horan, B.; Mekhilef, S. Energy Efficiency in Sustainable Buildings: A Systematic Review with Taxonomy, Challenges, Motivations, Methodological Aspects, Recommendations, and Pathways for Future Research. Energy Strategy Rev. 2023, 45, 101013. [Google Scholar] [CrossRef]
  9. Amoruso, G.; Donevska, N.; Skomedal, G. German and Norwegian policy approach to residential buildings’ energy efficiency—A comparative assessment. Energy Effic. 2018, 11, 1375–1395. [Google Scholar] [CrossRef]
  10. Corrado, V. Energy efficiency in buildings research perspectives and trends. Therm. Sci. 2018, 22, 971–976. [Google Scholar] [CrossRef]
  11. Broer, S.; Titheridge, H. Enabling low-carbon living in new UK housing developments. Manag. Environ. Qual. Int. J. 2010, 21, 90–107. [Google Scholar] [CrossRef]
  12. Albadi, M.H.; El-Saadany, E.F. Demand Response in Electricity Markets: An Overview. In Proceedings of the 2007 IEEE Power Engineering Society General Meeting, Tampa, FL, USA, 24–28 June 2007; pp. 1–5. [Google Scholar] [CrossRef]
  13. Hussain, M.; Gao, Y. A review of demand response in an efficient smart grid environment. Electr. J. 2018, 31, 55–63. [Google Scholar] [CrossRef]
  14. Ponnaganti, P.; Jayakrishnan, P.; Birgitte, B.J. Opportunities and challenges of demand response in active distribution networks: Opportunities and challenges of demand response. Wiley Interdiscip. Rev. Energy Environ. 2017, 7, e271. [Google Scholar] [CrossRef]
  15. Stanelyte, D.; Radziukyniene, N.; Radziukynas, V. Overview of Demand-Response Services: A Review. Energies 2022, 15, 1659. [Google Scholar] [CrossRef]
  16. Arias, L.A.; Rivas, E.; Santamaria, F.; Hernandez, V. A Review and Analysis of Trends Related to Demand Response. Energies 2018, 11, 1617. [Google Scholar] [CrossRef]
  17. Ponds, K.T.; Arefi, A.; Sayigh, A.; Ledwich, G. Aggregator of Demand Response for Renewable Integration and Customer Engagement: Strengths, Weaknesses, Opportunities, and Threats. Energies 2018, 11, 2391. [Google Scholar] [CrossRef]
  18. Chasparis, G.C.; Pichler, M.; Spreitzhofer, J.; Esterl, T. A cooperative demand-response framework for day-ahead optimization in battery pools. Energy Inform. 2019, 2 (Suppl. S1), 29. [Google Scholar] [CrossRef]
  19. Binyet, E.; Chiu, M.-C.; Hsu, H.-W.; Lee, M.-Y.; Wen, C.-Y. Potential of Demand Response for Power Reallocation, a Literature Review. Energies 2022, 15, 863. [Google Scholar] [CrossRef]
  20. Faria, P.; Spínola, J.; Vale, Z. Methods for Aggregation and Remuneration of Distributed Energy Resources. Appl. Sci. 2018, 8, 1283. [Google Scholar] [CrossRef]
  21. Lu, X.; Ge, X.; Li, K.; Wang, F.; Shen, H.; Tao, P.; Hu, J.; Lai, J.; Zhen, Z.; Shafie-Khah, M.; et al. Optimal Bidding Strategy of Demand Response Aggregator Based on Customers’ Responsiveness Behaviors Modeling under Different Incentives. IEEE Trans. Ind. Appl. 2021, 57, 3329–3340. [Google Scholar] [CrossRef]
  22. Fang, C.; Zhao, X.; Xu, Q.; Feng, D.; Wang, H.; Zhou, Y. Aggregator-based demand response mechanism for electric vehicles participating in peak regulation in valley time of receiving-end power grid. Glob. Energy Interconnect. 2020, 3, 453–463. [Google Scholar] [CrossRef]
  23. Meliani, M.; El Barkany, A.; El Abbassi, I.; Darcherif, A.M.; Mahmoudi, M. Energy management in the smart grid: State-of-the-art and future trends. Int. J. Eng. Bus. Manag. 2021, 13, 2920. [Google Scholar] [CrossRef]
  24. Pawar, S.; Mole, P.; Phadtare, S.; Aghor, D.; Vadtile, P. Electricity Forecasting Using Machine Learning: A Review. Mach. Learn. Inf. Process. 2021, 1311, 127–134. [Google Scholar] [CrossRef]
  25. Çevik, H.H.; Harmanci, H.; Çunkaç, M. Forecasting hourly electricity demand using a hybrid method. In Proceedings of the 2017 International Conference on Consumer Electronics and Devices (ICCED), London, UK, 14–17 July 2017; pp. 8–12. [Google Scholar] [CrossRef]
  26. Taylor, J.W. Short-term electricity demand forecasting using double seasonal exponential smoothing. J. Oper. Res. Soc. 2003, 54, 799–805. [Google Scholar] [CrossRef]
  27. Kang, T.; Lim, D.Y.; Tayara, H.; Chong, K.T. Forecasting of Power Demands Using Deep Learning. Appl. Sci. 2020, 10, 7241. [Google Scholar] [CrossRef]
  28. Chen, Y.; Yao, Y. Multiview intelligent data analysis based on granular computing. In Proceedings of the 2006 IEEE International Conference on Granular Computing, Atlanta, GA, USA, 8 November 2006; pp. 281–286. [Google Scholar] [CrossRef]
  29. Chen, F.; Ou, T. Gray relation analysis and multilayer functional link network sales forecasting model for perishable food in convenience store. Expert Syst. Appl. 2009, 36, 7054–7063. [Google Scholar] [CrossRef]
  30. Araujo, D.A.; Hentges, A.R.; Rigo, S.J.; Silva, R.R.R. Applying parallelization strategies for inference mechanisms performance improvement. IEEE Lat. Am. Trans. 2018, 16, 2881–2887. [Google Scholar] [CrossRef]
  31. Buelens, B.; Burger, J.; Brakel, J.A.v.D. Comparing Inference Methods for Non-Probability Samples. Int. Stat. Rev. 2018, 86, 322–343. [Google Scholar] [CrossRef]
  32. Emilia, G.; Tzanko, G.; Kostadin, K. Comparative study of the inference mechanisms in PROLOG and SPIDER. TEM J. 2018, 7, 892–901. [Google Scholar] [CrossRef]
  33. Oh, H.; Chu, H.Y. Demand response in the retail electricity market. Energy Effic. 2021, 14, 53. [Google Scholar] [CrossRef]
  34. Chehri, A.; Saadane, R.; Fofana, I.; Jeon, G. Smart Grid for Sustainable Cities: Strategies and Pathways for Energy Efficiency Solutions. Sustain. Energy Build. 2021, 263, 317–327. [Google Scholar] [CrossRef]
  35. U.S. Department of Energy. Available online: https://www.energy.gov/eere/buildings/building-technologies-office (accessed on 21 March 2022).
  36. European Energy Agency. Available online: https://www.eea.europa.eu/themes/energy/ (accessed on 13 February 2022).
  37. Taiwan Energy Knowledge Base. Available online: https://km.twenergy.org.tw/Knowledge/knowledge_more?id=1687 (accessed on 25 July 2022).
  38. Service Industry. Available online: https://www.ecct.org.tw/consumption/service_industry (accessed on 21 March 2022).
  39. Khan, I. Energy-saving behaviour as a demand-side management strategy in the developing world: The case of Bangladesh. Int. J. Energy Environ. Eng. 2019, 10, 493–510. [Google Scholar] [CrossRef]
  40. Ma, Z.; Zheng, Y.; Mu, C.; Ding, T.; Zang, H. Optimal trading strategy for integrated energy company based on integrated demand response considering load classifications. Int. J. Electr. Power Energy Syst. 2021, 128, 106673. [Google Scholar] [CrossRef]
  41. Nawaz, A.; Zhou, M.; Wu, J.; Long, C. A comprehensive review on energy management, demand response, and coordination schemes utilization in multi-microgrids network. Appl. Energy 2022, 323, 119596. [Google Scholar] [CrossRef]
  42. Yan, X.; Ozturk, Y.; Hu, Z.; Song, Y. A review on price-driven residential demand response. Renew. Sustain. Energy Rev. 2018, 96, 411–419. [Google Scholar] [CrossRef]
  43. Bruninx, K.; Pandžić, H.; Le Cadre, H.; Delarue, E. On the Interaction between Aggregators, Electricity Markets and Residential Demand Response Providers. IEEE Trans. Power Syst. 2020, 35, 840–853. [Google Scholar] [CrossRef]
  44. Mohseni, S.; Brent, A.C.; Kelly, S.; Browne, W.N.; Burmester, D. Modelling utility-aggregator-customer interactions in interruptible load programmes using non-cooperative game theory. Int. J. Electr. Power Energy Syst. 2021, 133, 107183. [Google Scholar] [CrossRef]
  45. Zhang, L.; Zhang, G.; Zhao, Y. Improved Back Propagation Neural Network Model for Stock Price Prediction. J. Phys. Conf. Ser. 2018, 1069, 012004. [Google Scholar] [CrossRef]
  46. Yang, X.; Zhang, L.; Xie, W. Forecasting Model for Urban Traffic Flow with BP Neural Network based on Genetic Algorithm. In Proceedings of the 2019 Chinese Control and Decision Conference (CCDC), Nanchang, China, 3–5 July 2019; pp. 4395–4399. [Google Scholar] [CrossRef]
  47. Ghosh, A.K.; Bhattacharyya, N.; Chattopadhyay, S.K. Short-Term Load Forecasting Using Back-Propagation Neural Network with Memory-Based Error Correction. Int. J. Electr. Power Energy Syst. 2019, 107, 143–155. [Google Scholar] [CrossRef]
  48. Tian, G.; Zhang, C.; Fathollahi-Fard, A.M.; Li, Z.; Zhang, C.; Jiang, Z. An Enhanced Social Engineering Optimizer for Solving an Energy-Efficient Disassembly Line Balancing Problem Based on Bucket Brigades and Cloud Theory. IEEE Trans. Ind. Inform. 2022, 19, 7148–7159. [Google Scholar] [CrossRef]
Figure 1. Research framework.
Applsci 13 13040 g001
Figure 2. Retail spaces classified according to electricity consumption levels based on EUI.
Applsci 13 13040 g002
Figure 3. Survey on energy-saving practices and awareness in the retail industry.
Applsci 13 13040 g003
Figure 4. Daily electricity consumption prediction and comparison of actual power consumption in participating retail stores.
Applsci 13 13040 g004
Table 1. DSM practices in the retail industry across countries.
CountryDSM Plan Explanation
USA
Time-of-Use Pricing: electricity rates are higher during peak hours and lower during off-peak hours.
Capacity Market Scheme: this is used during unexpected power outages; customers are notified to reduce their pre-designated load within a specified timeframe.
Emergency Demand Response: customers are urgently notified to reduce their load when there is a shortage of reserve capacity during peak hours or when peak electricity rates are too high.
Load Curtailment Scheme for smaller loads: a scheme to reduce the load for smaller consumers.
Direct Load Control: this scheme provides customers with prices based on equipment type, control degree, and average load suppression amount, and direct load control is conducted accordingly.
Japan
Emergency Peak Electricity Pricing Scheme: this scheme provides incentives for demand reduction by increasing peak electricity prices and reducing regular and nighttime electricity prices.
Aggregation Model for Demand Response refers to cooperation between demand response aggregators.
Temporary Electricity Reduction Scheme: cooperating with the electricity company to reduce load
UK
Time-of-Use Pricing: this term is divided into stepped pricing, time-of-use pricing, and real-time pricing.
Strategic Reserve Mechanism: proposing a “target reserve capacity” and purchasing different types of capacity during electricity supply shortages.
Germany
Smart Meter Required Features: installing a smart measurement system and disclosing its features.
Energy Efficiency Consulting for Small- and Medium-sized Enterprises: providing energy-saving consulting services for small- and medium-sized enterprises.
Korea
Mandatory Indoor Temperature Regulations during Winter.
Large Gap between Peak and Off-Peak Electricity Pricing: introducing peak day and peak hour electricity pricing during high-demand periods.
Planned Electricity Reduction Measures: notifying commercial and industrial users to unload their loads.
Ice Storage Air-Conditioning System Peak Shifting Scheme: customers establish an ice storage air-conditioning system to shift peak loads.
Table 2. Retail sector energy efficiency awareness ratio.
ItemNumber of Stores%
What energy-saving measures are currently being used?Passive measures such as promoting turning off lights5394.6
Monitoring and adjusting electricity expenses2866.7
Implementing energy management systems716.7
Upgrading equipment2457.1
Installing new energy-saving facilities2661.9
Others37.1
Table 3. The types and numbers of retail stores in the DSM aggregator model.
VariablesTypes of RetailNumber of Stores
R1~R4convenience stores4
R5~R6department stores2
R7supermarket1
R8hotel1
R9~R17restaurants9
Table 4. Comparison of the error indicators.
MAPEMSPE
Forecasting model12.56%2.05%
Disclaimer/Publisher’s Note: The statements, opinions and data contained in all publications are solely those of the individual author(s) and contributor(s) and not of MDPI and/or the editor(s). MDPI and/or the editor(s) disclaim responsibility for any injury to people or property resulting from any ideas, methods, instructions or products referred to in the content.

