Article

Effect of Loading Frequency on the Fatigue Response of Adhesive Joints up to the VHCF Range

1
Department of Mechanical and Aerospace Engineering, Politecnico di Torino, 10129 Turin, Italy
2
Advanced Joining Technologies Laboratory (J-Tech), Politecnico di Torino, 10129 Turin, Italy
*
Author to whom correspondence should be addressed.
Appl. Sci. 2023, 13(23), 12967; https://doi.org/10.3390/app132312967
Submission received: 30 October 2023 / Revised: 29 November 2023 / Accepted: 29 November 2023 / Published: 4 December 2023
(This article belongs to the Special Issue Advanced Diagnosis/Monitoring of Jointed Structures)

Abstract

:
Modern structures are designed to withstand in-service loads over a broad frequency spectrum. Nonetheless, mechanical properties in numerical codes are assumed to be frequency-independent to simplify calculations or due to a lack of experimental data, and this approach could lead to overdesign or failures. This study aims to quantify the frequency effects in the fatigue applications of a bi-material adhesive joint through analytical, numerical, and experimental procedures. Analytical and finite element models allowed the specimen design, whereas the frequency effects were investigated through a conventional servo-hydraulic apparatus at 5, 25, and 50 Hz and with an ultrasonic fatigue testing machine at 20 kHz. Experimentally, the fatigue life increases with the applied test frequency. Run-out stress data at 109 cycles follow the same trend: at 25 Hz and 50 Hz, the run-out data were found at 10 MPa, increasing to 15 MPa at 20 kHz. The P–S–N curves showed that frequency effects have a minor impact on the experimental variability and that standard deviation values lie in the range of 0.3038–0.7691 between 5 Hz and 20 kHz. Finally, the trend of fatigue strengths at 2·106 cycles with the applied loading frequency for selected probability levels was estimated.

1. Introduction

In many engineering fields, complex mechanical structures are required to withstand fluctuating loads over a broad frequency spectrum during nominal working conditions. Such loads are typically non-stationary, and detailed investigations based on response spectra [1] are performed during the development of components to assess their performance [2,3].
For example, mechanical systems in the aerospace industry are designed to sustain launch loads that are ascribable to quasi-statics events (i.e., ≈0 Hz), sinusoidal excitations (i.e., 5–100 Hz), mechanical random vibrations (i.e., 20–2000 Hz), acoustic pressure loads (i.e., 20–8000 Hz), and shocks (i.e., 100–10,000 Hz) [4]. Dedicated structural analyses are thus performed in advance during the design, qualification, and acceptance campaign to assess and confirm that the system can comply with the frequency spectrum of interest. In the meanwhile, structures are required to demonstrate their safe-life or fail-safe performances to avoid jeopardizing the structural integrity [5,6].
In this context, the design phase is usually approached using numerical tools, such as finite element (FE) analyses, where the analyst in charge of executing simulations translates the physical model into a numerical description. In this context, to simplify calculations or due to a lack of experimental data, designers tend to assume constant and load/frequency-independent material properties within the simulation environment. While this hypothesis could be considered valid for some metals [7] or non-critical equipment, to consider material properties in this way could be dangerous for high-performance structures. These types of structures are usually produced with engineered materials, such as composites or adhesives, that can be sensitive to the nature of loads, such as thermal loads [8,9], impact loads [10], and strain rate-dependent loads [11,12], the load direction [13], and the applied loading frequency [14,15].
With a particular emphasis on adhesives, such materials have become even more popular in current engineering products for joining different materials (e.g., metal–composites, metal–glass, ceramic–composites, …) [16]. Indeed, adhesives allow a smoother stress distribution along the bonding area compared to conventional joining technologies [17] and, at the same time, are efficient for mass-saving purposes and repair applications.
The specific nature of adhesives has been recognized as being particularly responsive to dynamic excitations in terms of damages and reductions in material properties, and such effects were mainly attributable to the applied loading frequency and mode shapes [18]. Recently, research has highlighted that, under vibration loads, both the absorbed energy and the ultimate load sustained by the adhesive layer decrease as the applied number of cycles increases [19]. Under multiple frequencies of excitation fatigue loads, a relevant degradation of modal properties as the fatigue cycles increase [20] has been observed depending on the adhesive type. Mechanical strengths were found to be highly subjected to vibration loads, and experimental results demonstrated a complex interaction between the adhesive layer and the substrate [21]. Specifically, certain load magnitudes lead to an increase in the strength compared to others. The stress distribution was also investigated through analytical and numerical models and results demonstrated the existence of specific patterns and intensities for different magnitudes, with variations in the frequency content [22]. The substantial interest in loading frequency effects and the dynamic behaviors of adhesive joints has accelerated research on up-to-date calculation models and applicable numerical techniques [23], as well as the exploitation of frequency-related effects for improving the performance of this joining technique [24].
Another peculiarity that is typically exhibited by adhesive joints refers to the presence of stress-singularities. This feature is particularly important in the case of adhesive joints as it can trigger cracks and premature failures [25]. Indeed, the scientific and technical interest in detecting, quantifying, and assessing stress-singularities in adhesive joints is demonstrated by several remarkable studies, such as [26,27], two of the oldest studies concerning bi-material wedges [28,29], which concern bi-material coupons; and [30] where stress singularities were analyzed in the frame of a failure initiation. In [31], singularity analyses were performed on joint configurations not explored before; [32,33,34] offered stress evaluations based on stress-singular terms, whereas [35] produced a profound literature review regarding the presence of stress singularities in components and their effects on the structural integrity. Additionally, mixed adhesive joints have been investigated [36], as well as the magnitude of the singular field with respect to the variation in the elastic modulus [37]. More recently, detailed analyses exploiting cohesive zone modelling studied the effects of stress singularity for failure assessments [38].
However, in recent years, research and investigation have concentrated on the development of safer components by removing the stress singularity. This goal is achievable through the analysis of mechanical and geometrical conditions that prevent this issue [39,40]; additionally, innovative testing methods for better material characterization have become accessible [41,42]. Furthermore, a significant increase in fatigue performance has been exhibited when a stress singularity is removed from a specimen under investigation [43].
Moreover, due to the increased lifetime of components, experimental investigations of fatigue responses should focus also on the very high cycle fatigue (VHCF, N > 10 7 ) life range with low-amplitude loads [44,45] applied for a long time or with a high frequency, e.g., those due to vibrations. For example, in recent years, VHCF tests have been carried out to investigate a wide set of materials such as stainless steel [46], steels produced with different processes [47], steels with large risk volume [48], and adhesively bonded joints [49,50], confirming the industrial and academic interest towards this research field. Particular attention has also been paid to the quantification of the influence of stress singularities on the joint life [43], size effects [51], and, in general, the fatigue responses of adhesives under the VHCF regime.
The research presented in this paper aimed to investigate loading frequency-related effects on the fatigue response of a structural adhesive. Ultrasonic fatigue tests at a loading frequency of 20 kHz and conventional frequencies of 5, 25, and 50 Hz were performed with a servo-hydraulic testing machine. Adhesively bonded butt joints, with a geometry limiting the adhesive singularity (epoxy resin SikaPower®-1277—aluminium 7075 T6) were subjected to symmetrical tension–compression loading (R = −1) tests. The non-singular specimen was accurately designed through analytical relationships based on the inverse Bogy formulation [40], numerically verified with finite element (FE) procedures, and thus tested under fatigue conditions.
The experimental outcomes showed a relevant difference between ultrasonic and conventional fatigue tests, thus confirming a significant loading frequency effect for the investigated adhesive. Indeed, the estimated S–N curves demonstrated an increased fatigue response as the applied frequency increased.
The fatigue strength at 2 × 10⁶ cycles was found to follow a linear trend in a bi-logarithmic chart. Data scattering is present among the test conditions, but this effect had a minor impact on experimental outcomes.
The paper is organized as follows: Section 2 describes the material, analytical, and numerical methods followed to design the specimens and the experimental activity. Section 3 focuses on the fatigue results and the related analysis. Section 4 discusses the experimental outcomes. Finally, Section 5 collects the main findings of this work.

2. Materials and Methods

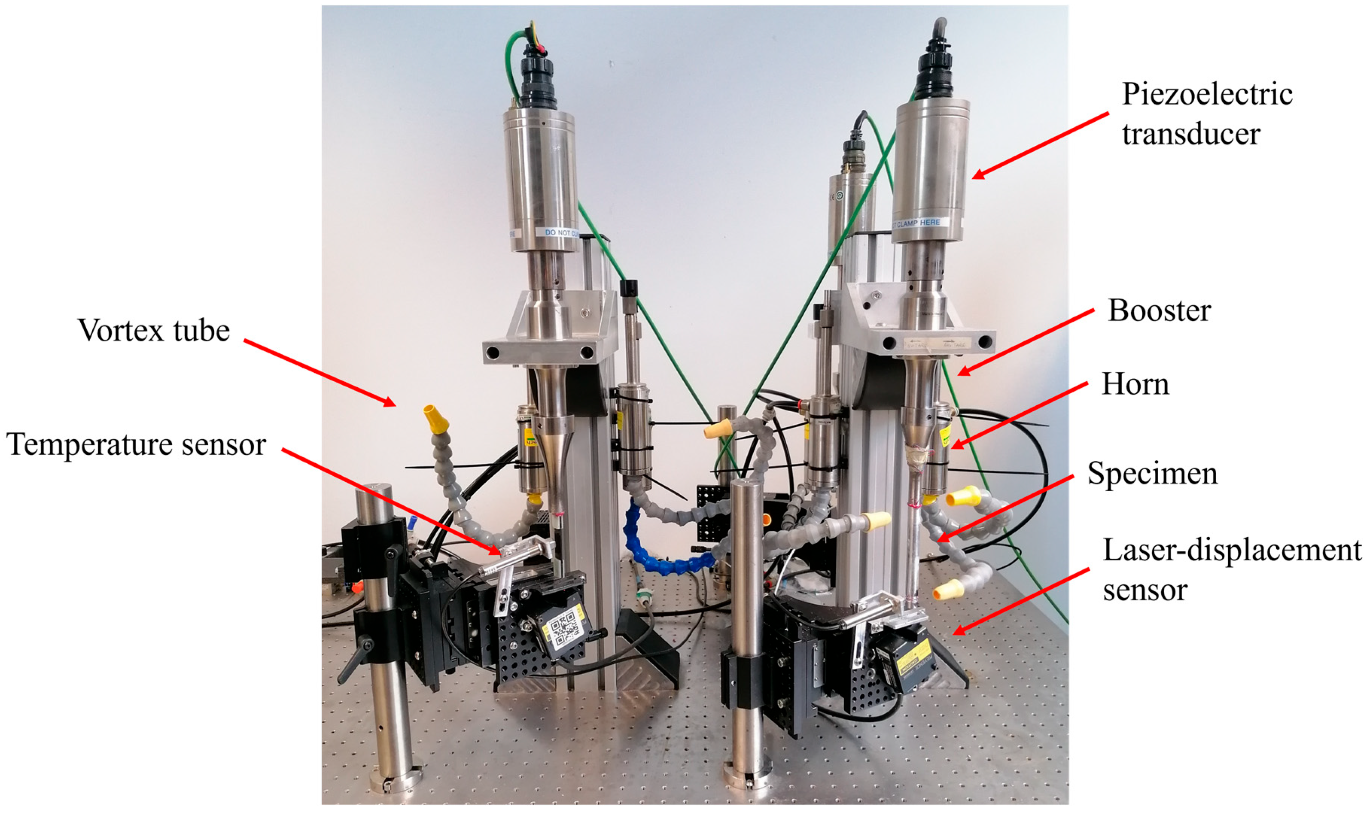
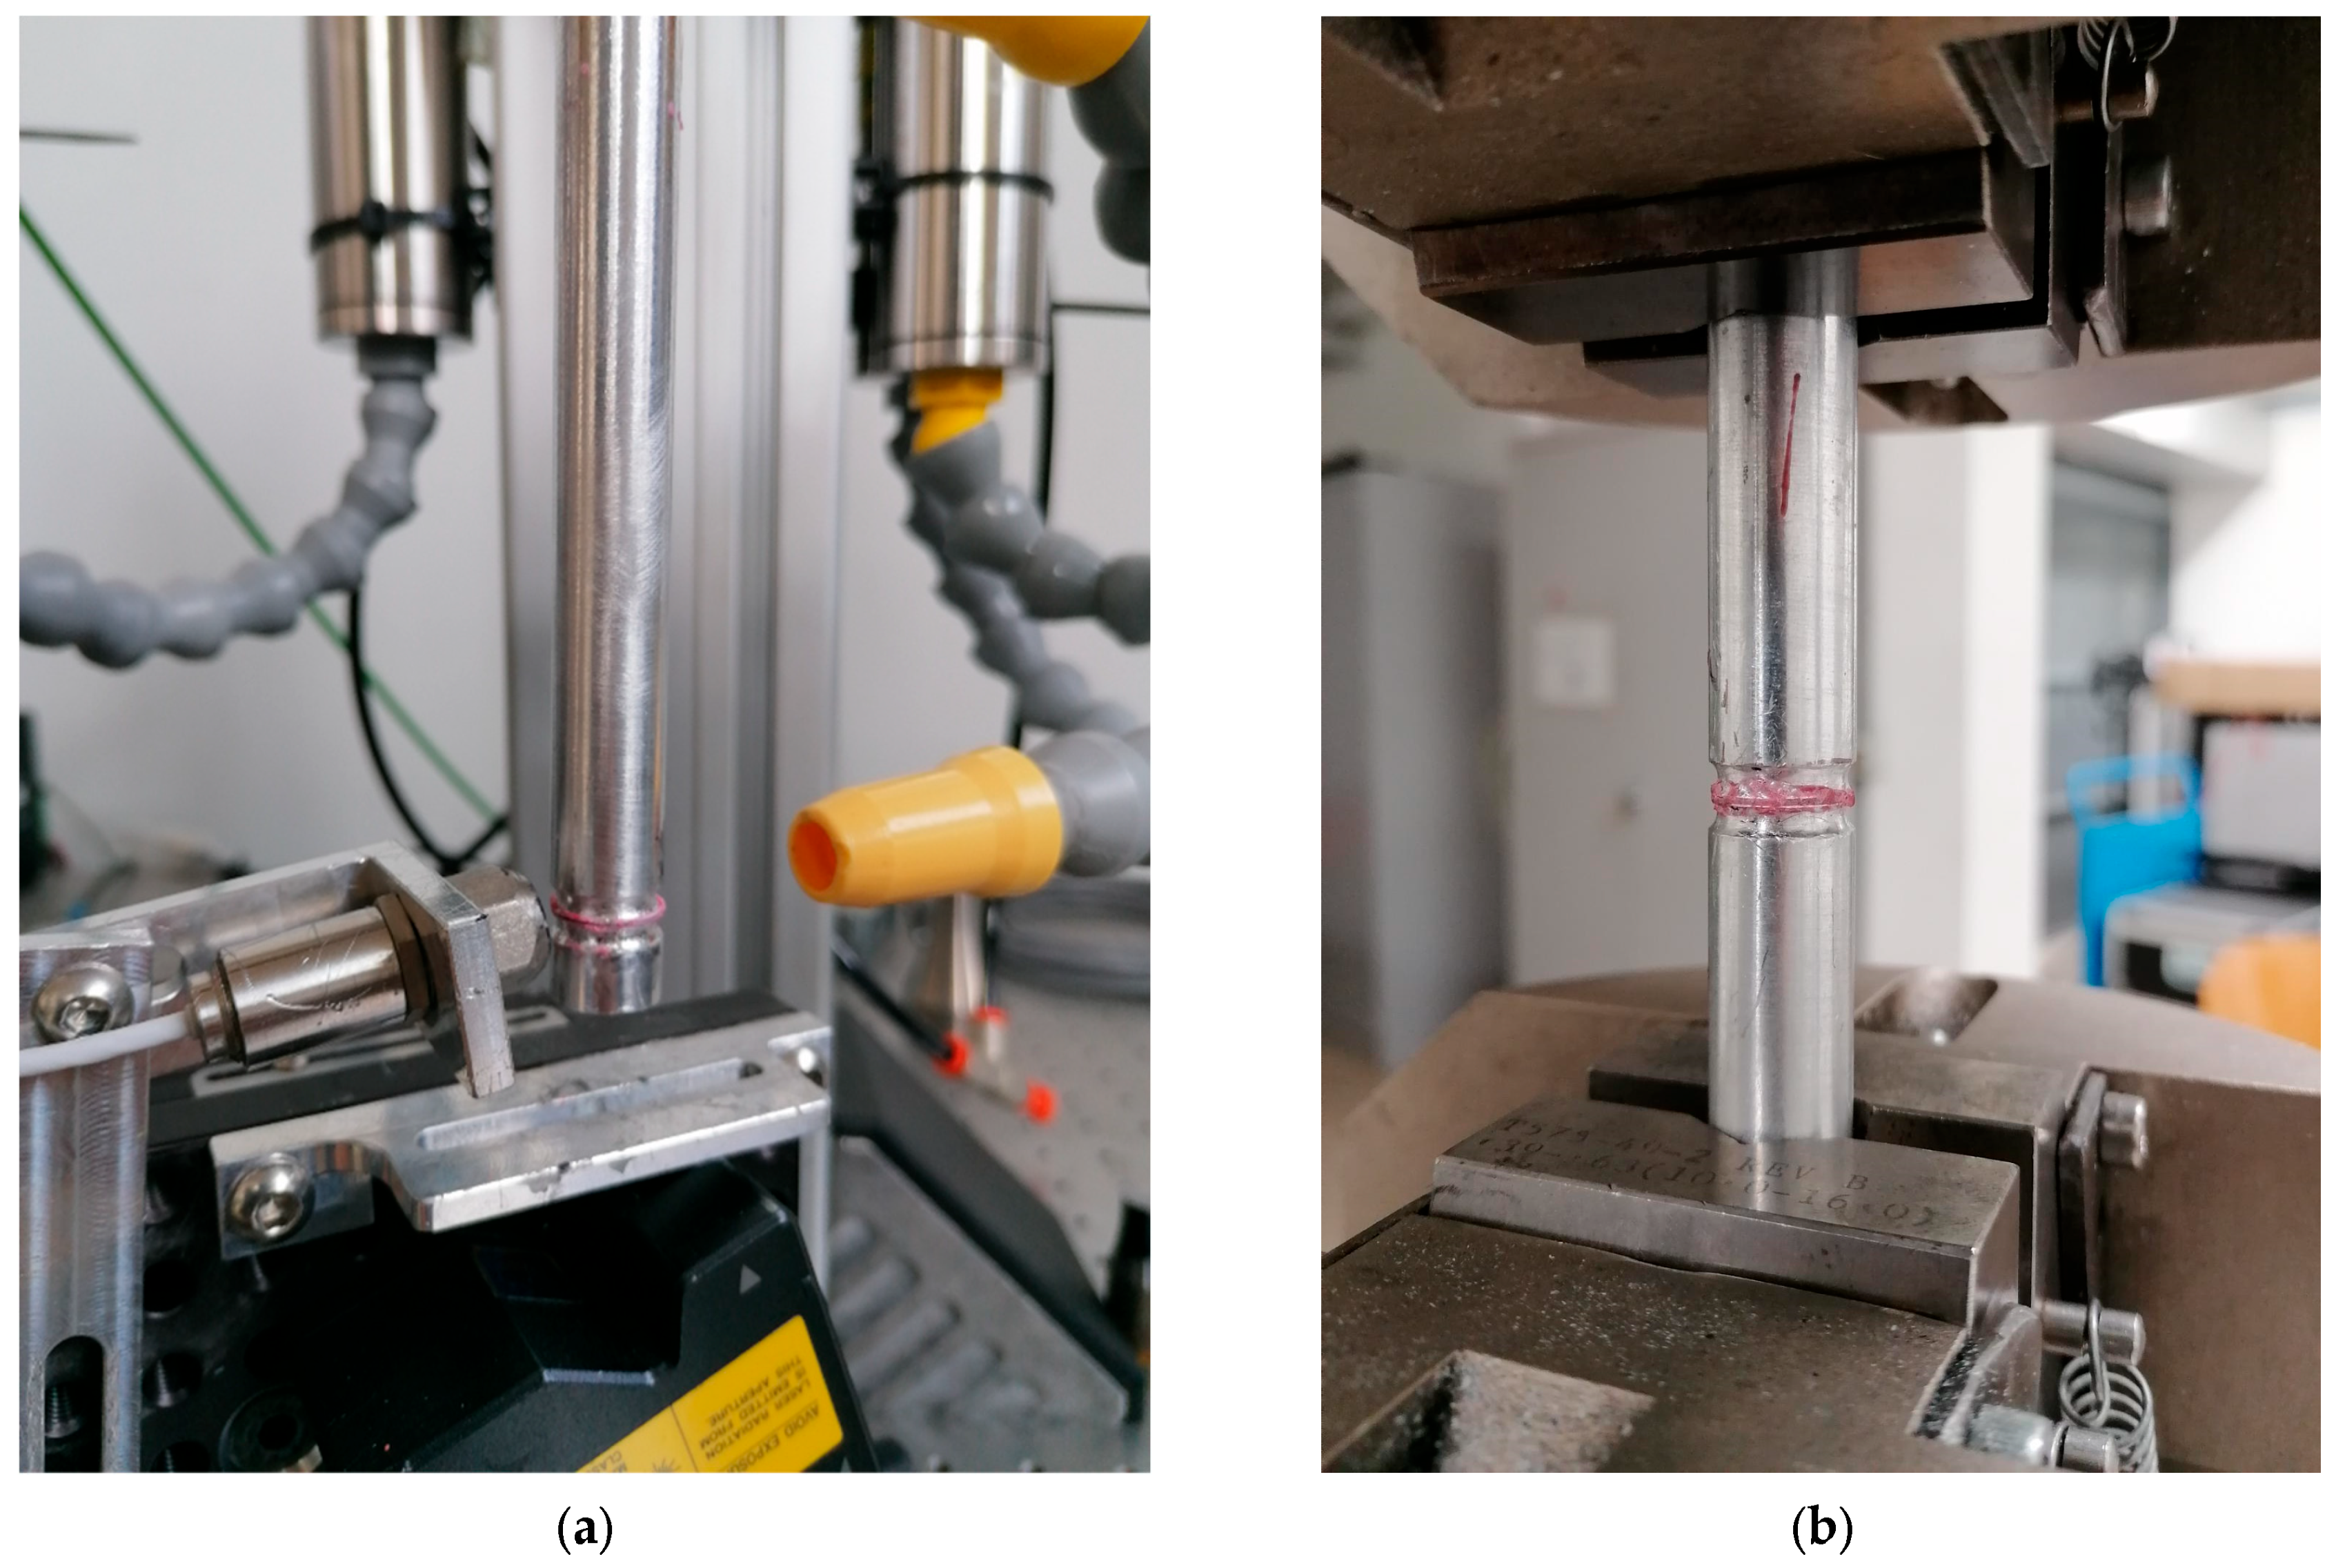
2.1. Material and Testing Devices

Experimental tests were carried out on an adhesively bonded cylindrical butt joint that was 14.6 mm in diameter. Aluminum 7075 T6 composed the cylindrical substrates that were bonded together with a thin 0.3 mm layer of bi-component SikaPower®-1277 epoxy resin. This adhesive is adopted for bonding structural components in transportation and general industry. Its characteristics make it a good choice for repair purposes in combination with spot welding or riveting. Glass spheres were pre-mixed by the producer in the resin tube, and these are responsible for maintaining the 0.3 mm thickness.
In Table 1, the mechanical properties of the adopted material for both design and testing purposes are collected. These properties were extracted through specific preliminary tests or extracted from published scientific works [50,52]. Six specimens of aluminum 7075 T6 and six specimens of SikaPower®-1277 epoxy resin were tested in compliance with [53,54], respectively, whereases values for Ti-6Al-4V were already known from a past study [50]. The viscosity value was assumed to be valid based on the datasheet [55] and no additional tests were performed regarding the variation in the quantity with respect to the temperature. Extracted values for SikaPower®-1277 refer to a hardening period of 24 h at 23 °C, as suggested by the adhesive supplier.
The capability of sustaining and transmitting loads between Aluminum 7075 T6 and SikaPower®-1277 epoxy resin was assessed in [43], where dedicated tensile tests were performed at 2.5 mm/min. The load–displacement curves were comparable, and processed stress data were in line with those extracted from the bulk adhesive in Table 1. Moreover, specimens failed fully cohesively without the macroscopic presence of adhesive detachments, further validating the test results.
The adopted experimental equipment for performing VHCF tests was an ultrasonic fatigue testing machine (UFTM). The UFTM is shown in Figure 1 and was developed at Politecnico di Torino for testing components in the chosen fatigue range. The UFTM can perform tests at 20 ± 0.5 kHz under fully reversed tension–compression stress R = 1 , which significantly reduces the testing time compared to conventional testing apparatuses. To perform fatigue tests, the UFTM adopts the following devices: (i) an electric generator (Branson DCX 4 kW, not visible in Figure 1) which generates an electrical sinusoidal wave at 20 kHz; (ii) a piezoelectric transducer, responsible for converting the electrical wave into a mechanical vibration; (iii) a booster and a horn made of Ti–6Al–4V that amplify and convey the vibration to the specimen under testing; (iv) the specimen under investigation, which was designed for the UFTM resonance conditions; (v) a laser displacement sensor that measures the displacement at the specimen free end; (vi) vortex tubes to keep the temperature controlled in the range (20–24) °C; and (vii) a temperature sensor to observe the temperature evolution during the test execution.
Performing fatigue tests with the UFTM consists of the application of alternated stress in specimens that are designed to work in resonance conditions. The specimen and the vibration components are thus designed to have a resonance frequency corresponding to a longitudinal mode of vibration close to 20 kHz. Moreover, the UFTM adopts a closed-loop proportional–integrative–derivative (PID) control logic where the displacement measured at the specimen tip is the feedback signal for correcting excitations. Due to the high testing frequency, the internal dissipations can significantly increase the temperature, and this effect must be properly monitored during the tests. Finally, the test is stopped when the resonance conditions are no longer met by the specimen. In this case, manual actions were required for separating the butt joint.
The HCF tests were performed using an Instron® 8801 (Norwood, MA, USA) hydraulic testing machine with loading frequencies below 100 Hz. The low-frequency fatigue tests were load-controlled and performed at 5, 25, and 50 Hz.

2.2. Specimen Mechanical Design

The cylindrical bi-material butt joint under analysis was designed for ultrasonic fatigue tests. In a previous study [47], it was observed that a nominal cylindrical bi-material configuration is affected by stress singularity issues. A specific design methodology [43] should be adopted to collect fatigue properties without the presence of this detrimental effect, which reduces the joint mechanical performance.
In the following sections, the fundamental aspects related to the removal of the stress singularity (Section 2.2.1) and the VHCF specimen design (Section 2.2.2) are presented.

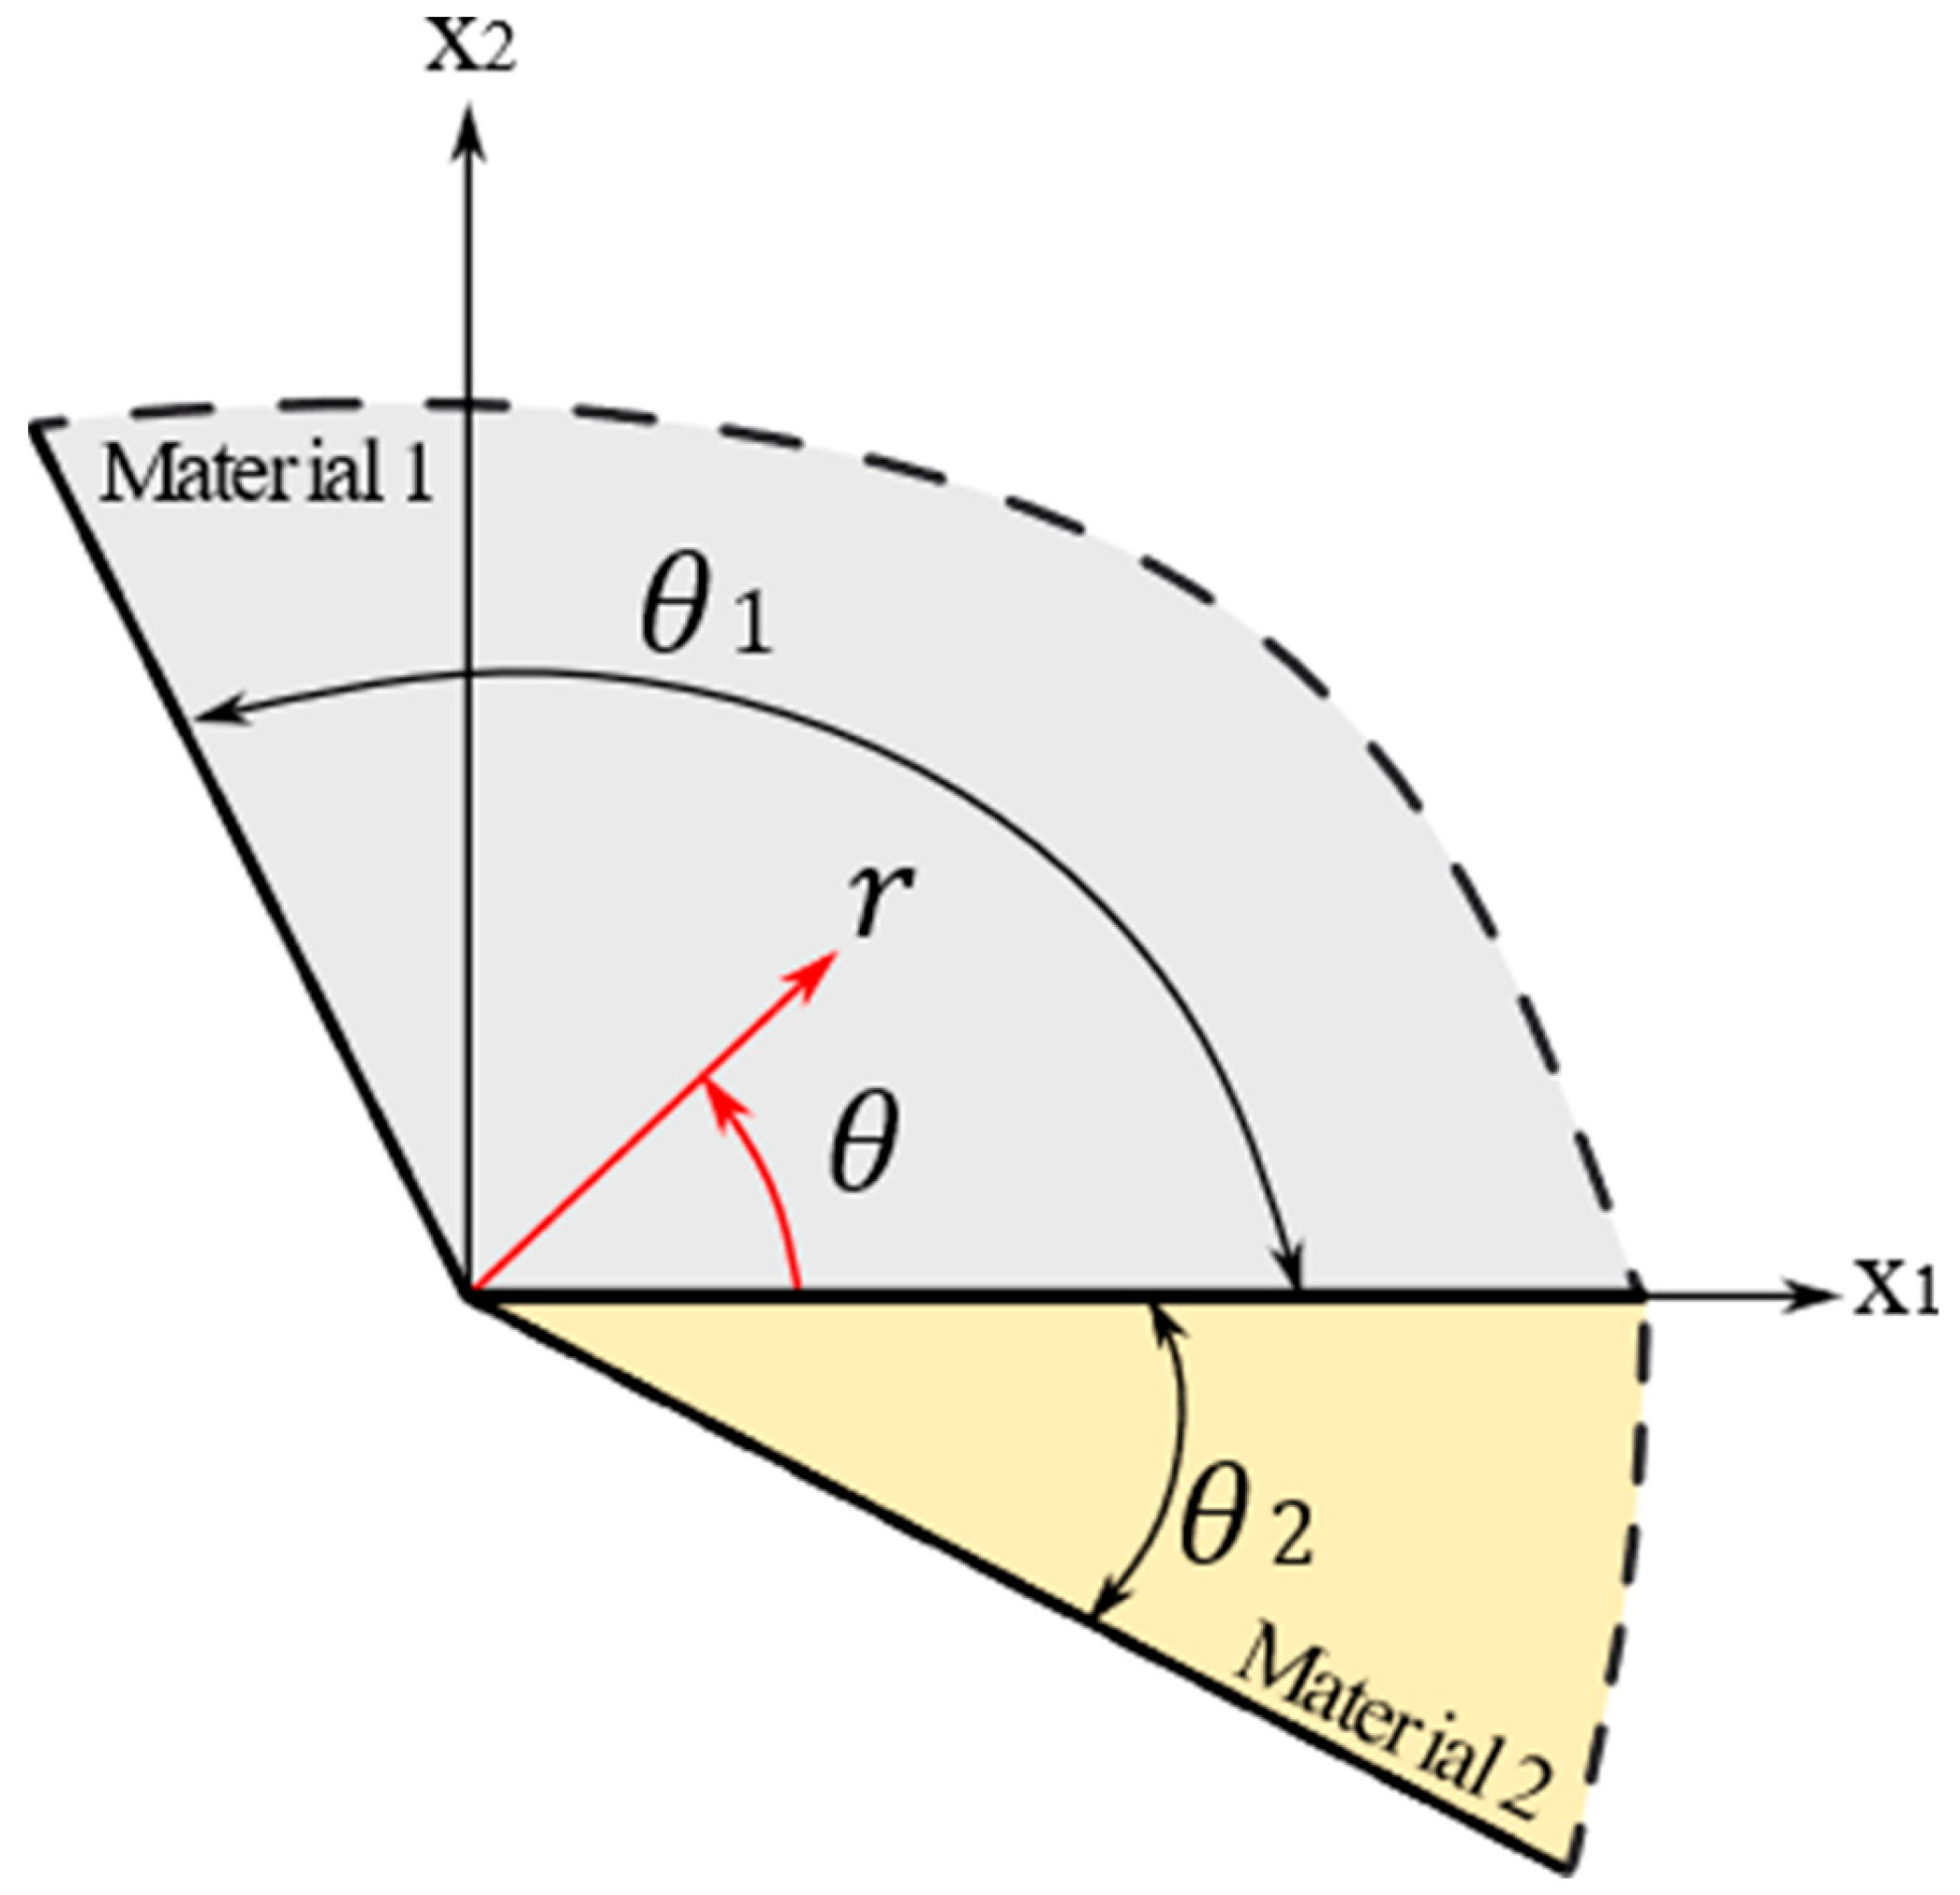
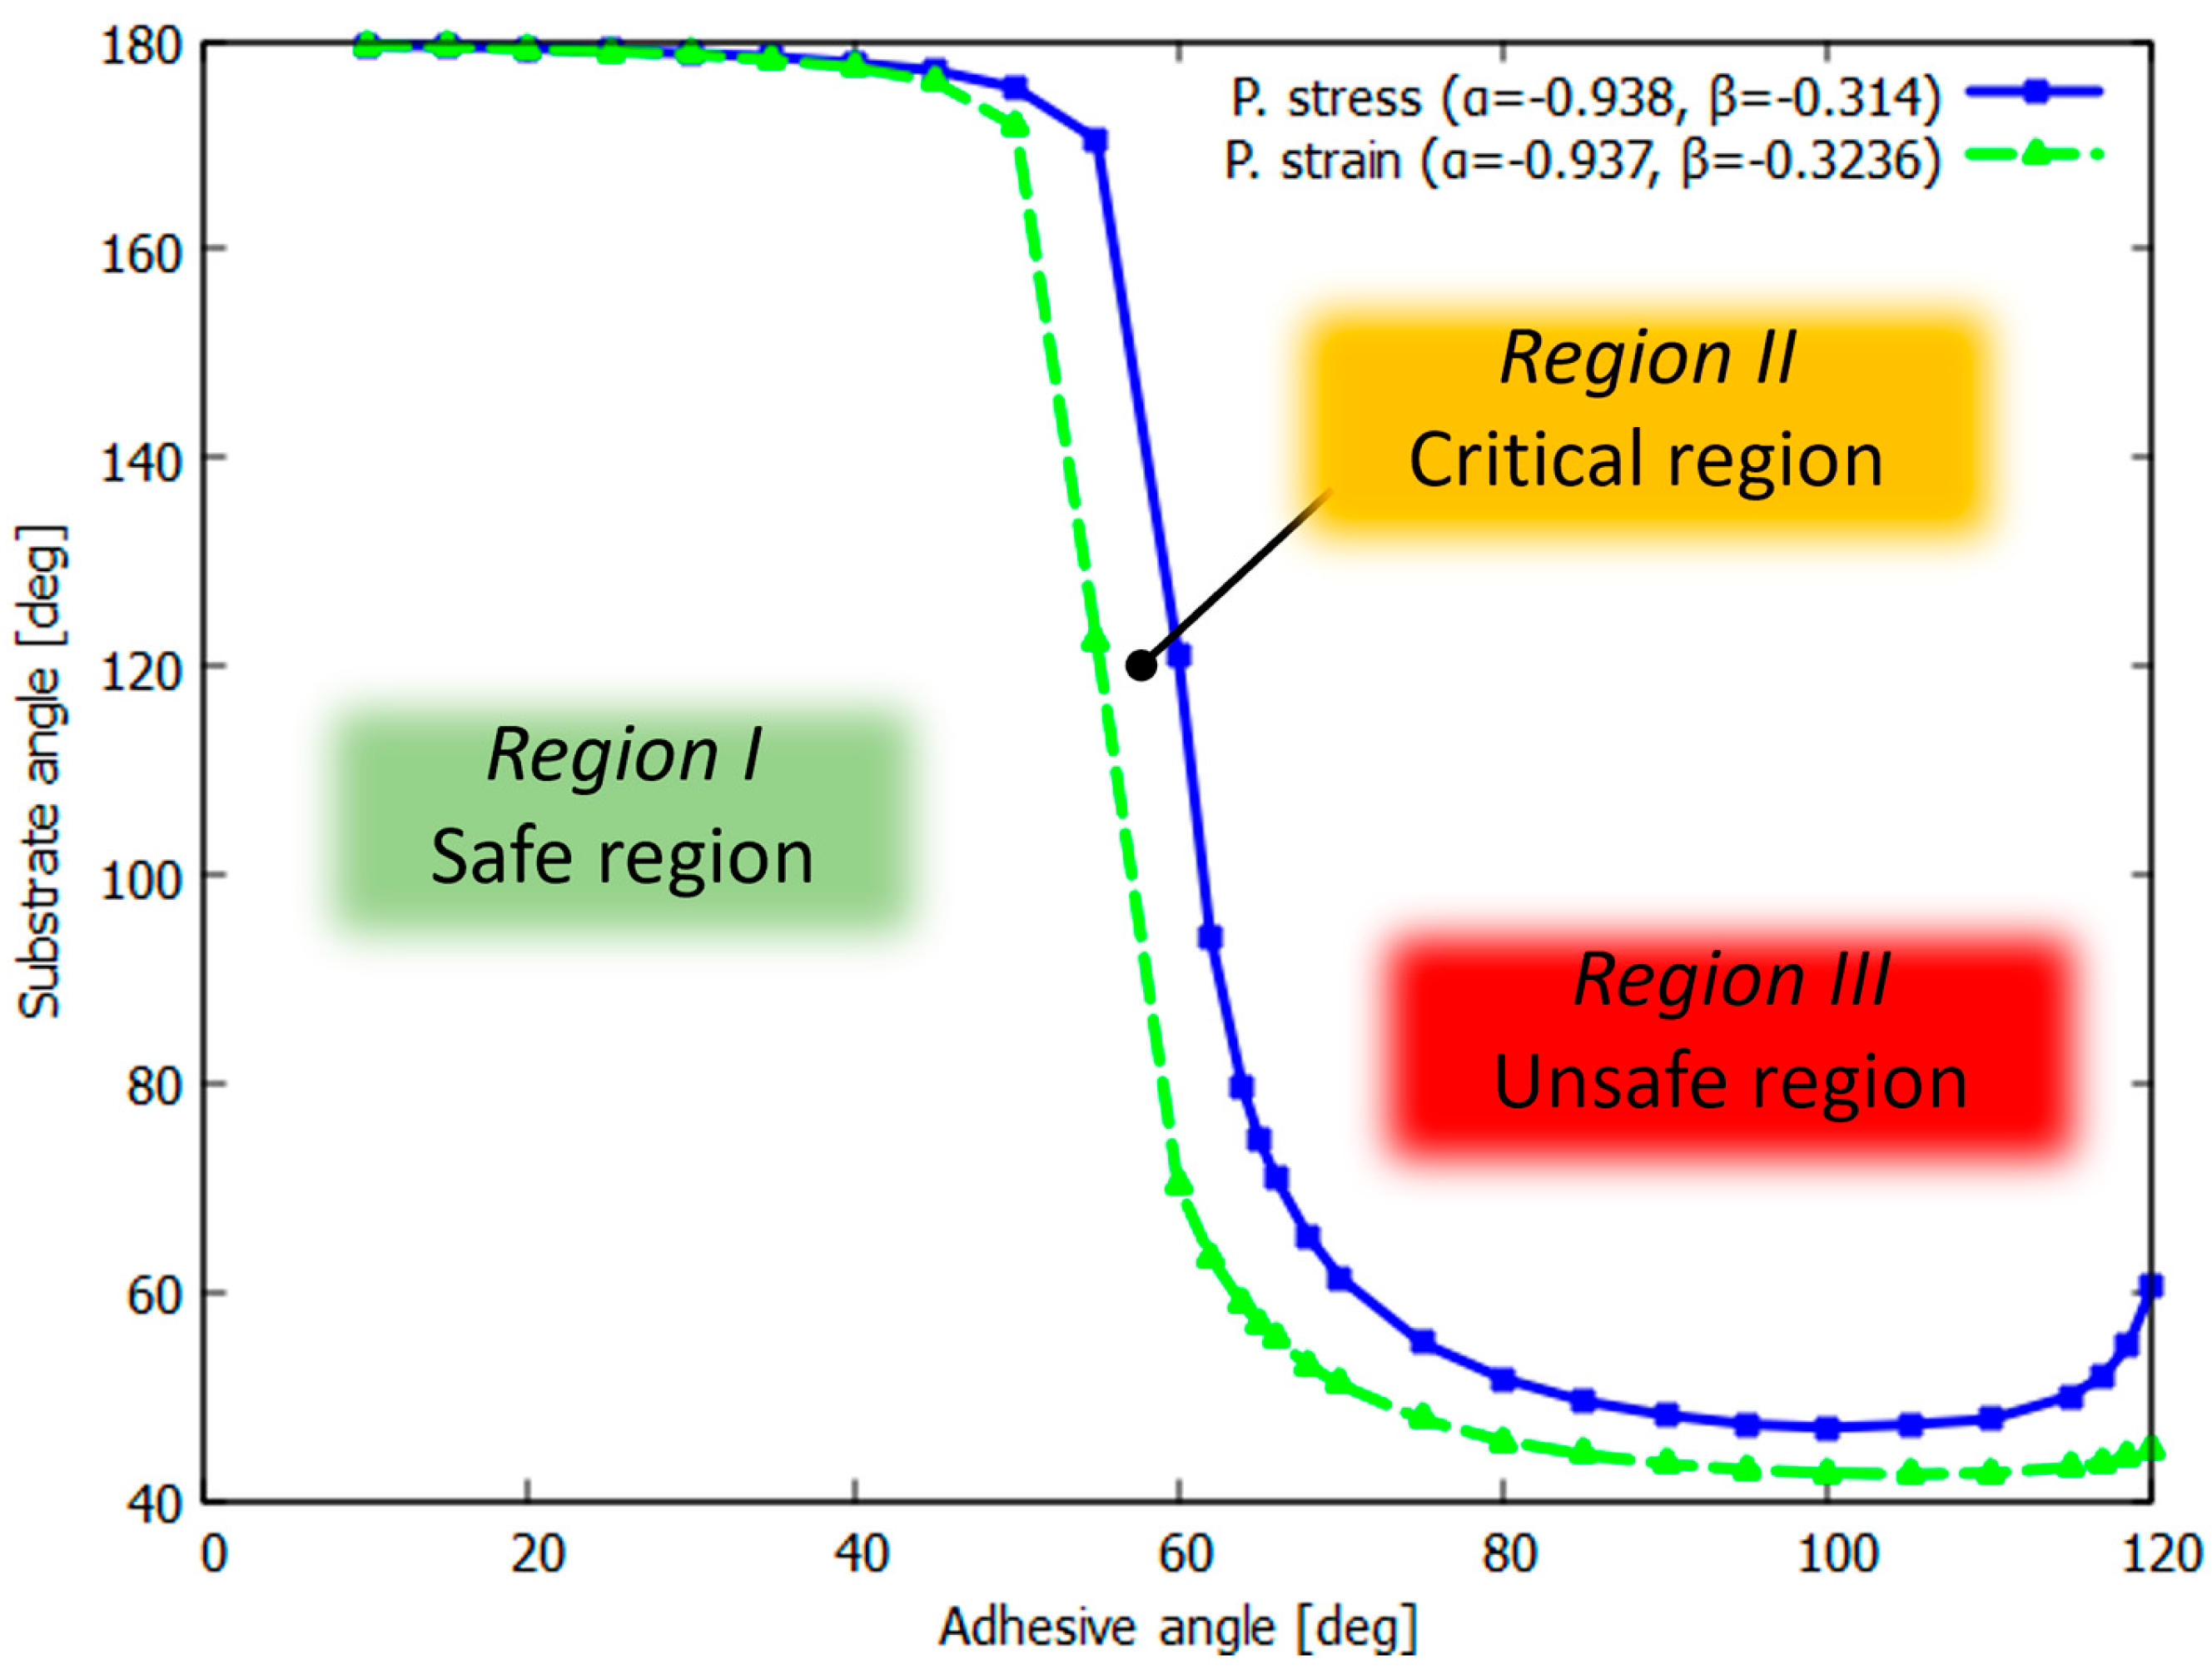
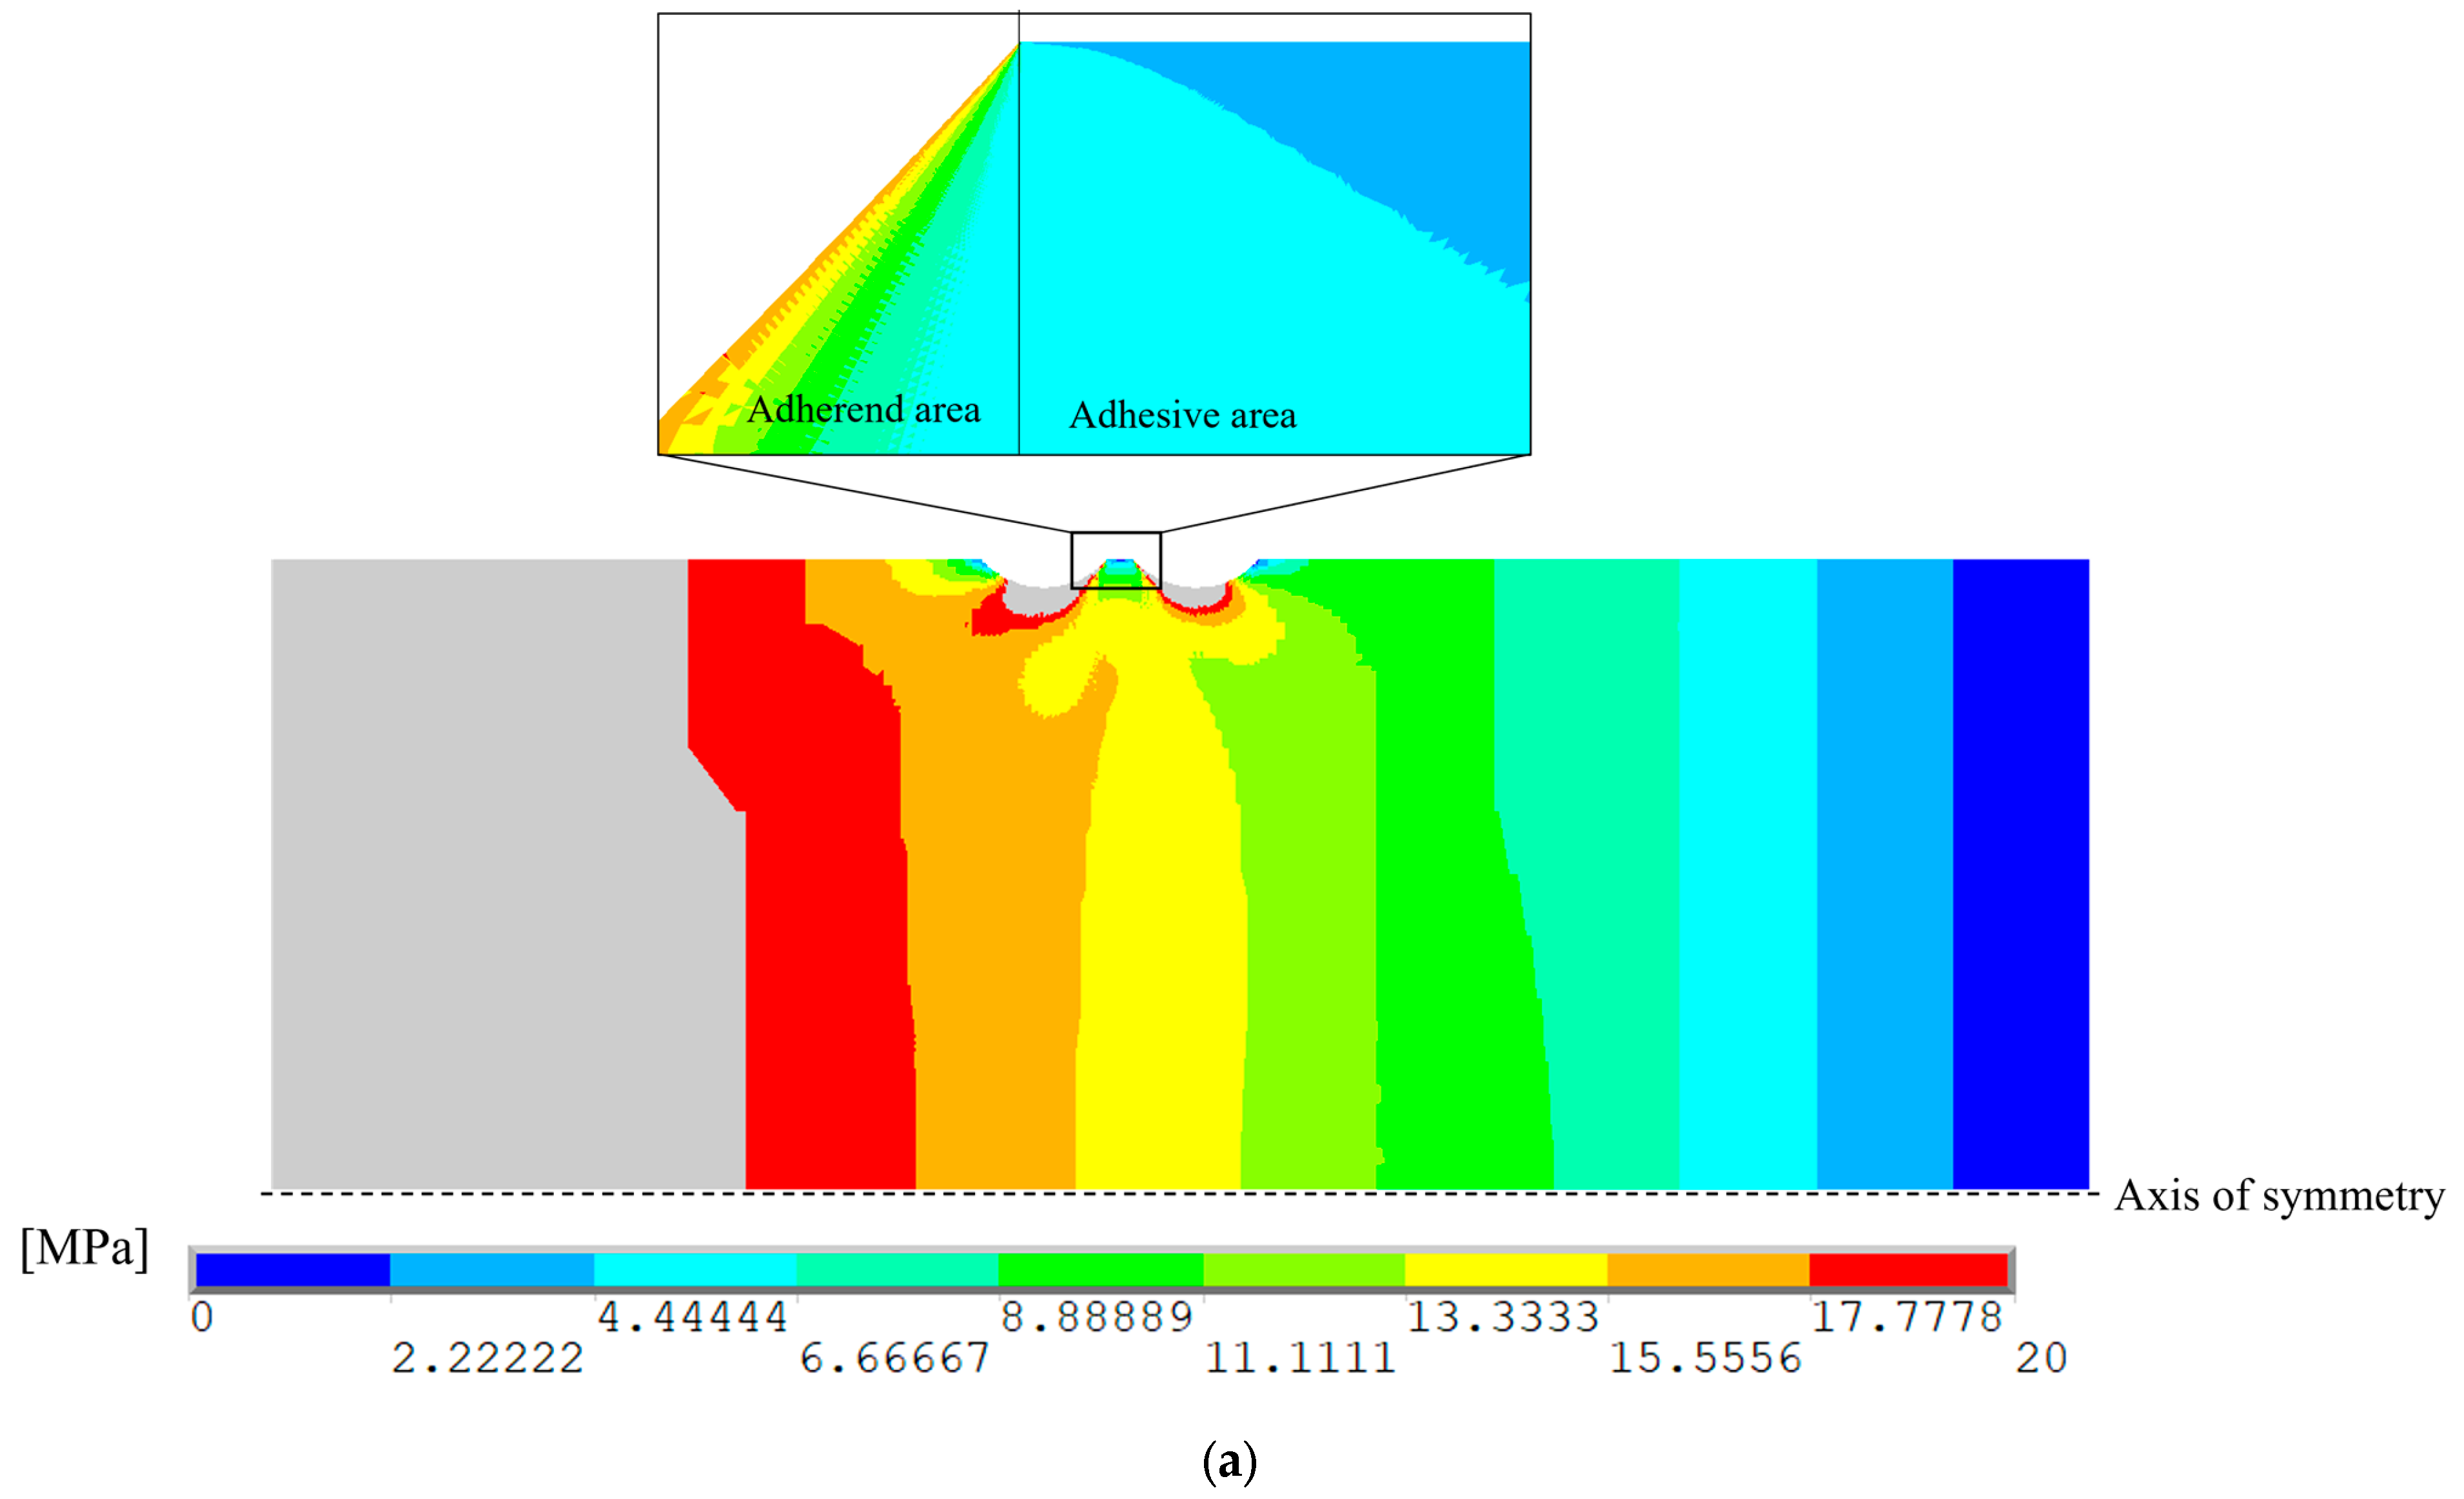
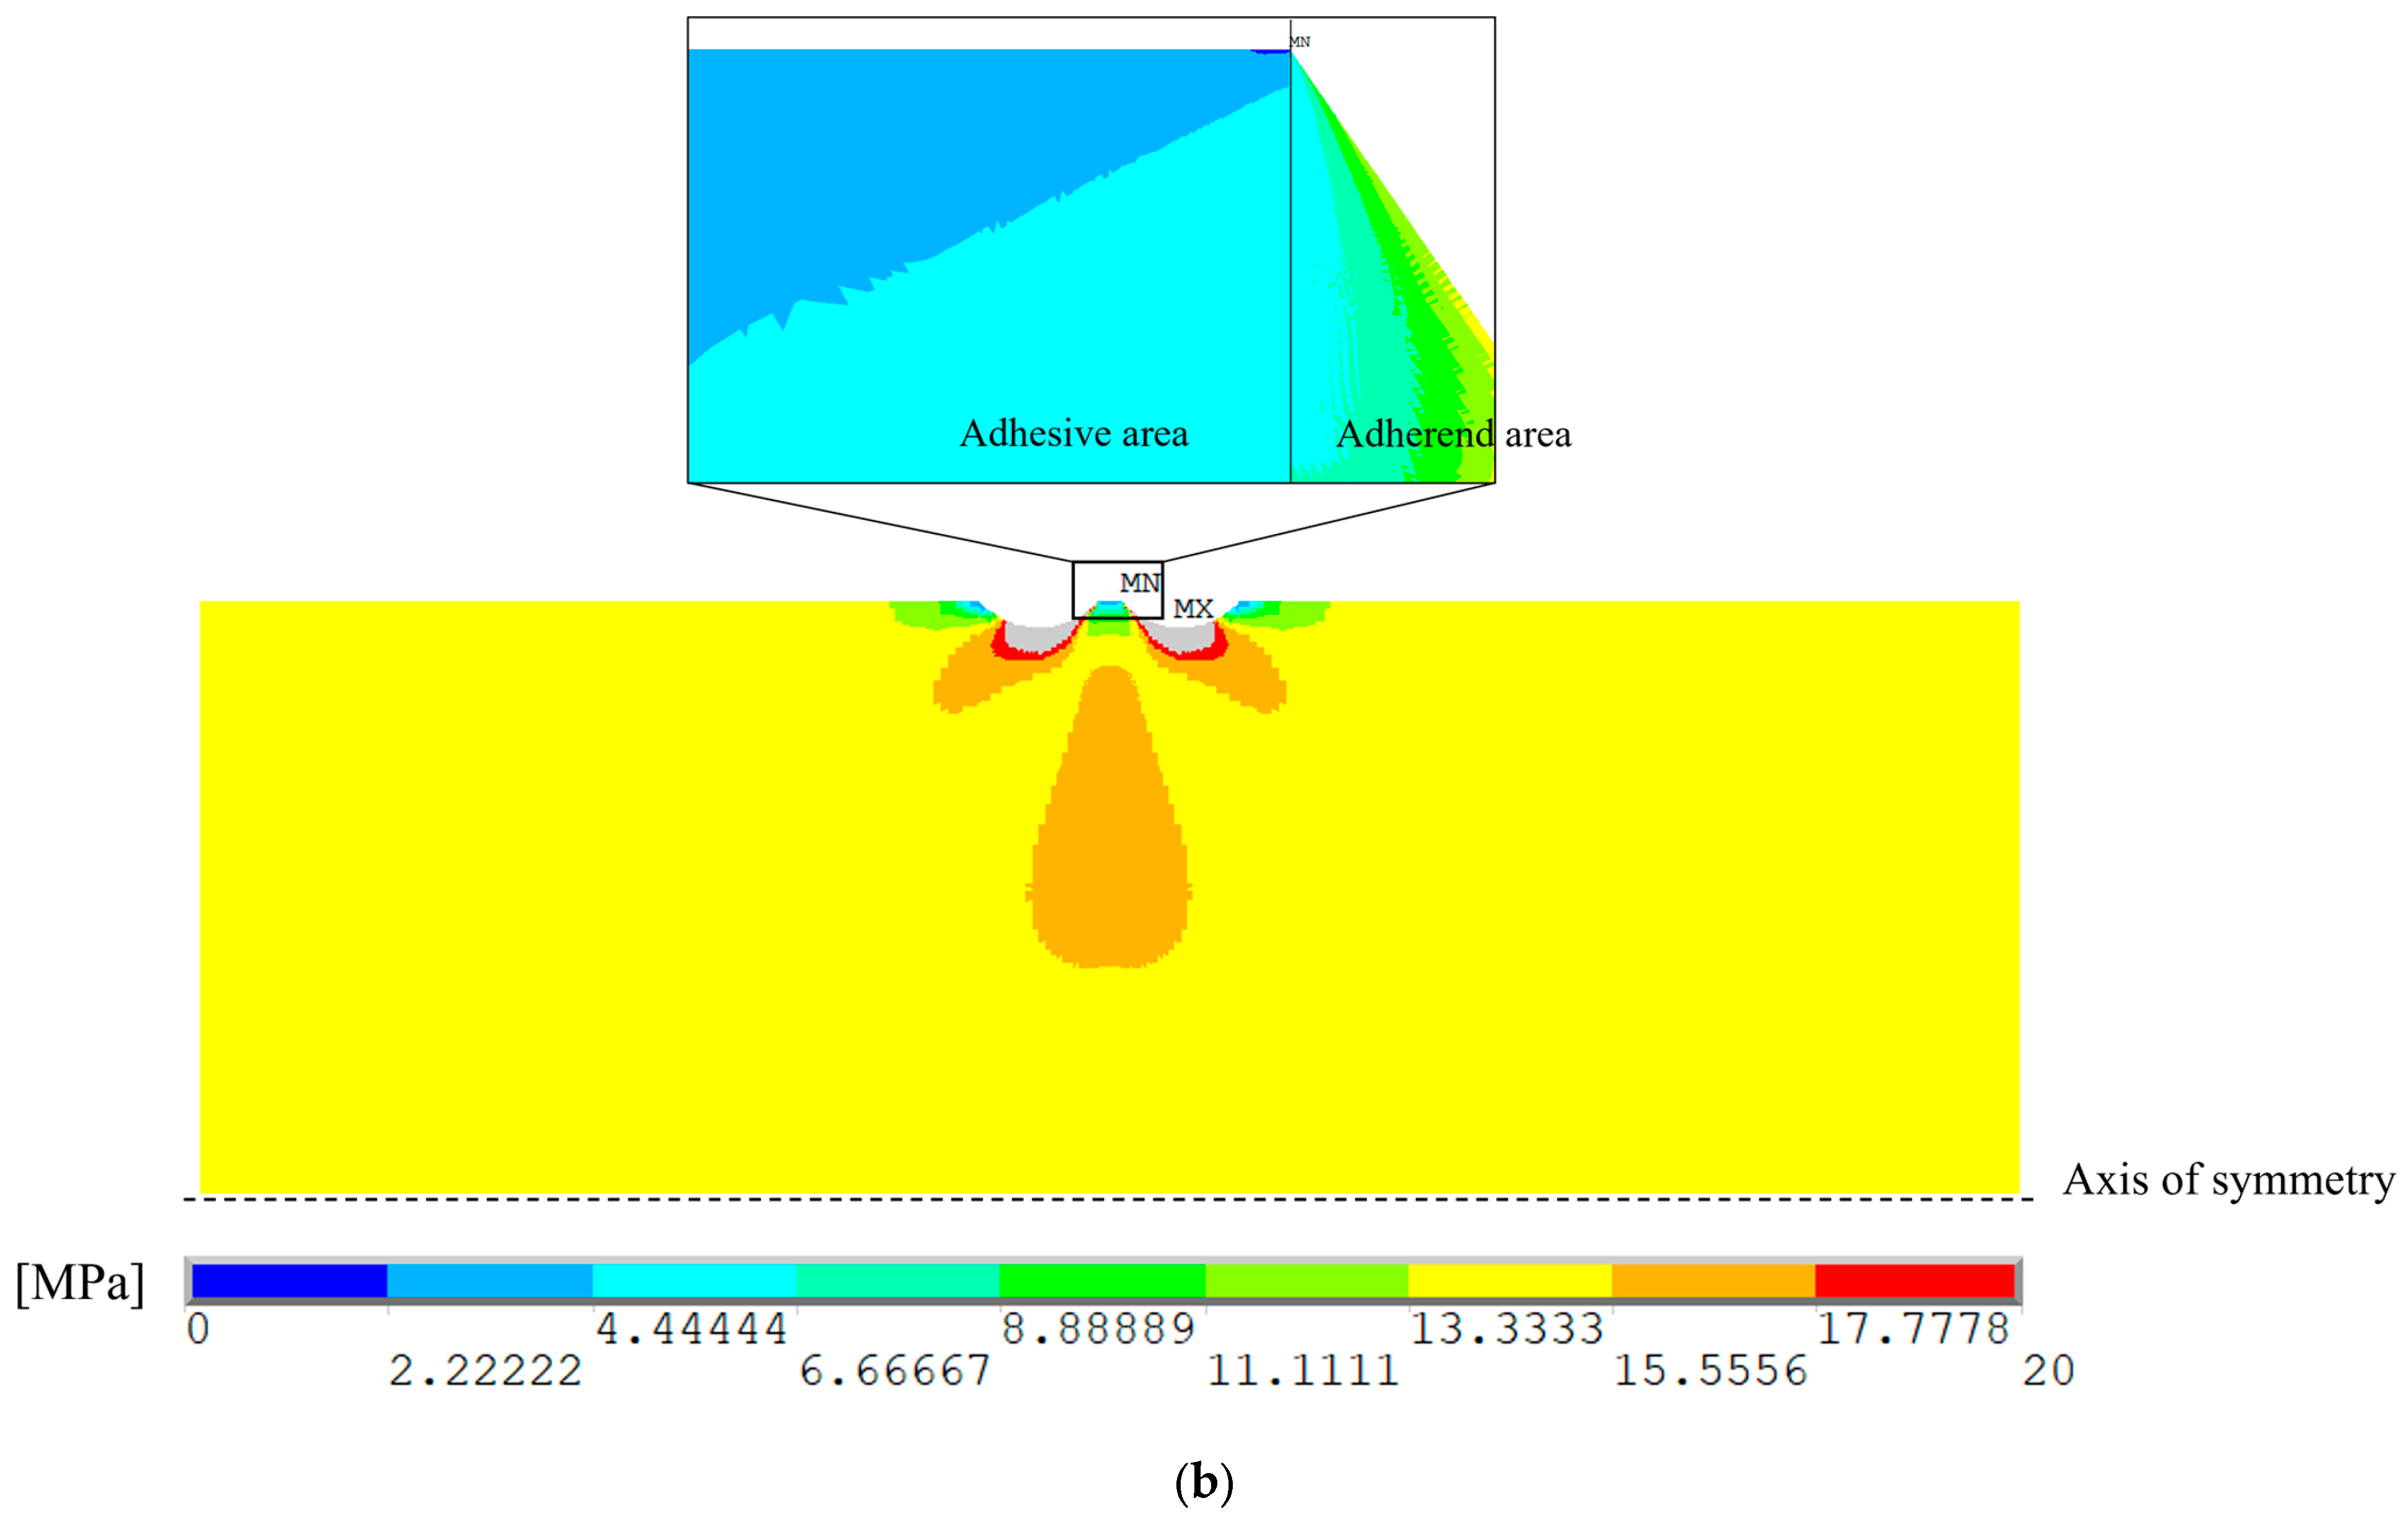
2.2.1. Removal of the Stress Singularity

The detection and quantification of model features that can endanger the structural integrity of a component has always been an important topic in structural engineering. Among these features, stress singularities are point regions where stress theoretically trends toward infinite values. In homogenous materials, stress singularities originate in presence of sharp angular notches [26] and crack fronts, whereas for multi-material unions such features arise at the material interface under prescribed loads [28]. Stress singularities are particularly dangerous as their presence has been demonstrated to critically impact safety and to be a root source of failures [25,56].
To properly understand the physical conditions for removing singularities, the basic mathematical framework should first be introduced and clarified. In this study, the problem is restricted to the special case of a bi-material union, which is the simplest and the most straightforward problem to address, as shown in Figure 2, where x1 and x2 are Cartesian coordinates and r and θ are polar coordinates that are introduced for the treatment of the mathematical problem.
The wedge prototype presented in Figure 2 is characterized by a specific set of material properties such as the elasticity modulus E j , the Poisson’s ratio ν j , and the shear modulus ( μ j ) , where the j index represents the material number. Bogy [29] approached the problem by manipulating the equilibrium equations in the frame of the Mellin transformation for passing from a physical to an auxiliary plane (i.e., the p-plane), thus solving the system in terms of the singularity exponent. Under this hypothesis, the so-called Bogy determinant reported in Equation (1) became one of the fundamental theoretical tools for studying stress singularities in the case of bi-material unions.
D θ 1 , θ 2 , α , β ; p = A α 2 + B α β + C β 2 + D α + E β + F ,
Here, θ 1 ,   θ 2 are the opening angles of material wedges; p is a complex root defined within the interval ]0, 1[ that identifies the singularity exponent; and A–F are functions that depend on trigonometric expressions and on the singularity exponent. The α and β parameters are the Dundurs’ parameters shown in Equation (2).
α = E 1 ¯ E 2 ¯ E 1 ¯ + E 2 ¯ , β = μ 1 1 2 k 2 μ 2 1 2 k 1 2 μ 1 1 k 2 + μ 2 1 k 1
Here, E j ¯ is the elasticity modulus under plane stress or plane strain and k j is the Kolosoff parameter, which depends on the Poisson ratio.
In general, solving Equation (1) leads to a complex solution p = p R + i p I ,   i = 1 that is associated with one of the following possible stress forms: (i) hyperbolic solutions; (ii) oscillatory unbounded solutions; (iii) logarithmic solutions; and (iv) constant solutions, in proximity to the singular corner ( r 0 ) . The latter are reported in Equation (3), where σ is the stress vector.
σ = O r p 1 i f   p = p R O r p R 1 cos ( p I log r )   o r   r p R 1 sin ( p I log r ) i f   p = p R + i p I O log r i f   D 0   f   o r   p R ] 0 1 [ , d D d p = 0   a t   p = 1 O 1 i f   D 0   f   o r   p R ] 0 1 [ , d D d p 0   a t   p = 1
Mathematically, Equations (1)–(3) represent the “direct” Bogy problem as it is classically developed, where the principal unknown is the magnitude of the stress singularity. However, from a design perspective, this framework uniquely states whether the bi-material joint is singular or not and, in the case of a singular field, it is informed about the severity of the singularity (eigenvalue) and the associated stress form (eigenvector).
In contrast, the “inverse” problem consists of manipulating Equation (1) to understand the system conditions that prevent the stress singularities under prescribed acting loads. It was first explored by Wu [39] and its solution requires knowledge of the mechanical or geometrical parameters to insert within the mathematical framework, as well as a guess value of the singularity exponent. Wu [39] illustrated that, to obtain a valid solution, the value of the real part of the solution must satisfy the condition p R 1 in any circumstances to achieve a non-singular geometry. Moreover, the convergency is guaranteed using p R = 1 + 10 4 in a non-linear strategy framework.
For this work, mechanical data were considered totally known and applicable. The unknown of the problem was the substrate angle at the material interface, which ensured the absence of a singular field at a fixed adhesive angle. In this way, by restricting the problem to a 1D variable, one can easily explore multiple adhesive–adherend conditions and choose the final configuration that fits better within the whole mechanical project.
The work logic described above was applied in the angular adhesive range of 10–120° to explore a broad set of solutions. A Newton–Raphson strategy manages the non-linear problem defined by the A–F functions within the determinant definition.
In Table 2, the obtained substrate angles are reported for both plane stress and plane strain conditions, whereas in Figure 3, these are graphically subdivided.
The trends illustrated in Figure 3 should be interpreted as the upper conditions to avoid stress singularities and can be adopted as a design tool for similar bi-material joints. Thus, with a fixed adhesive angle and plane strain/stress conditions, substrate values lower than those lying on the curve present singularity-free circumstances.
Three separated regions can exist and are highlighted: (i) a safe region in which the local adhesive–adherend geometry always prevents stress singularities for any kind of geometrical combination; (ii) a critical region in which the presence of the singular feature strongly depends on the modelling assumption. If plane strain conditions are assumed, the singularity is expected, whereas, in the case of plane stress, this characteristic is removed; and (iii) an unsafe region where a singularity is surely present for any modelling case.
As mentioned above, in general, all the valid substrate–adhesive configurations are suitable for removing the singularity from the mechanical system. However, in this work a pair of angles 43.5° and 90° is selected, as this configuration is easy to achieve and a 90° adhesive angle can be reached using simple manufacturing procedures.
Even though the inverse mathematical model provides information concerning singularity-free circumstances, nothing is stated for the stress experienced by the current joint under prescribed loads. This was made accessible through numerical analyses as described in the following section.

2.2.2. VHCF Specimen Design: FE Model Development and Analyses

This section revises the key passages that are adopted for preparing and analyzing a suitable VHCF specimen, in accordance with [43], and exposes the current numerical outcomes that have been extracted to approach the experimental ultrasonic/low-frequency test campaign.
The VHCF specimen was designed to work in resonance conditions within the UFTM operative range. The development of FE models exploited the Ansys APDL capabilities. Axisymmetric four-node bi-dimensional elements were adopted for preparing the models. Two classes of FE models were prepared: (i) a global model for studying the overall structural behavior, keeping the number of elements, nodes, and degrees of freedom low, and (ii) a local model to study the effects introduced by the removal of the stress singularity in detail. Indeed, for the sake of clarity, the FE global model works with the presence of a singular joint, whereas the removal of this feature takes place separately, within the local description. This approach, called the sub-modelling technique or the global–local technique [57], is particularly helpful for investigating local structural details such as fillets or unions of elements that require a specific modelling strategy for their analysis.
The global model, presented in Figure 4, is constituted by 2500 elements, and aims to simulate the overall testing configuration (i.e., the horn and specimen) under resonance conditions. Moreover, the global description is adopted for design purposes, and it is necessary to define the local boundary conditions to apply to local models.
The main steps to prepare the global model are as follows:
  • The numerical model of the titanium horn is first analyzed through a modal analysis under free–free conditions to collect the closest natural frequency and mode shape to the UFTM operative range. An operative frequency of f n = 20,195 Hz is thus selected and adopted for design purposes.
  • The 1D elastic wave equations [58] reported in Equation (4) permit the definition of the specimen total length L t o t , where f n is the frequency of interest and E , ρ are the mechanical properties of the aluminium. This calculation results in L t o t = 125.5 mm:
    L t o t = 1 2 f n E / ρ
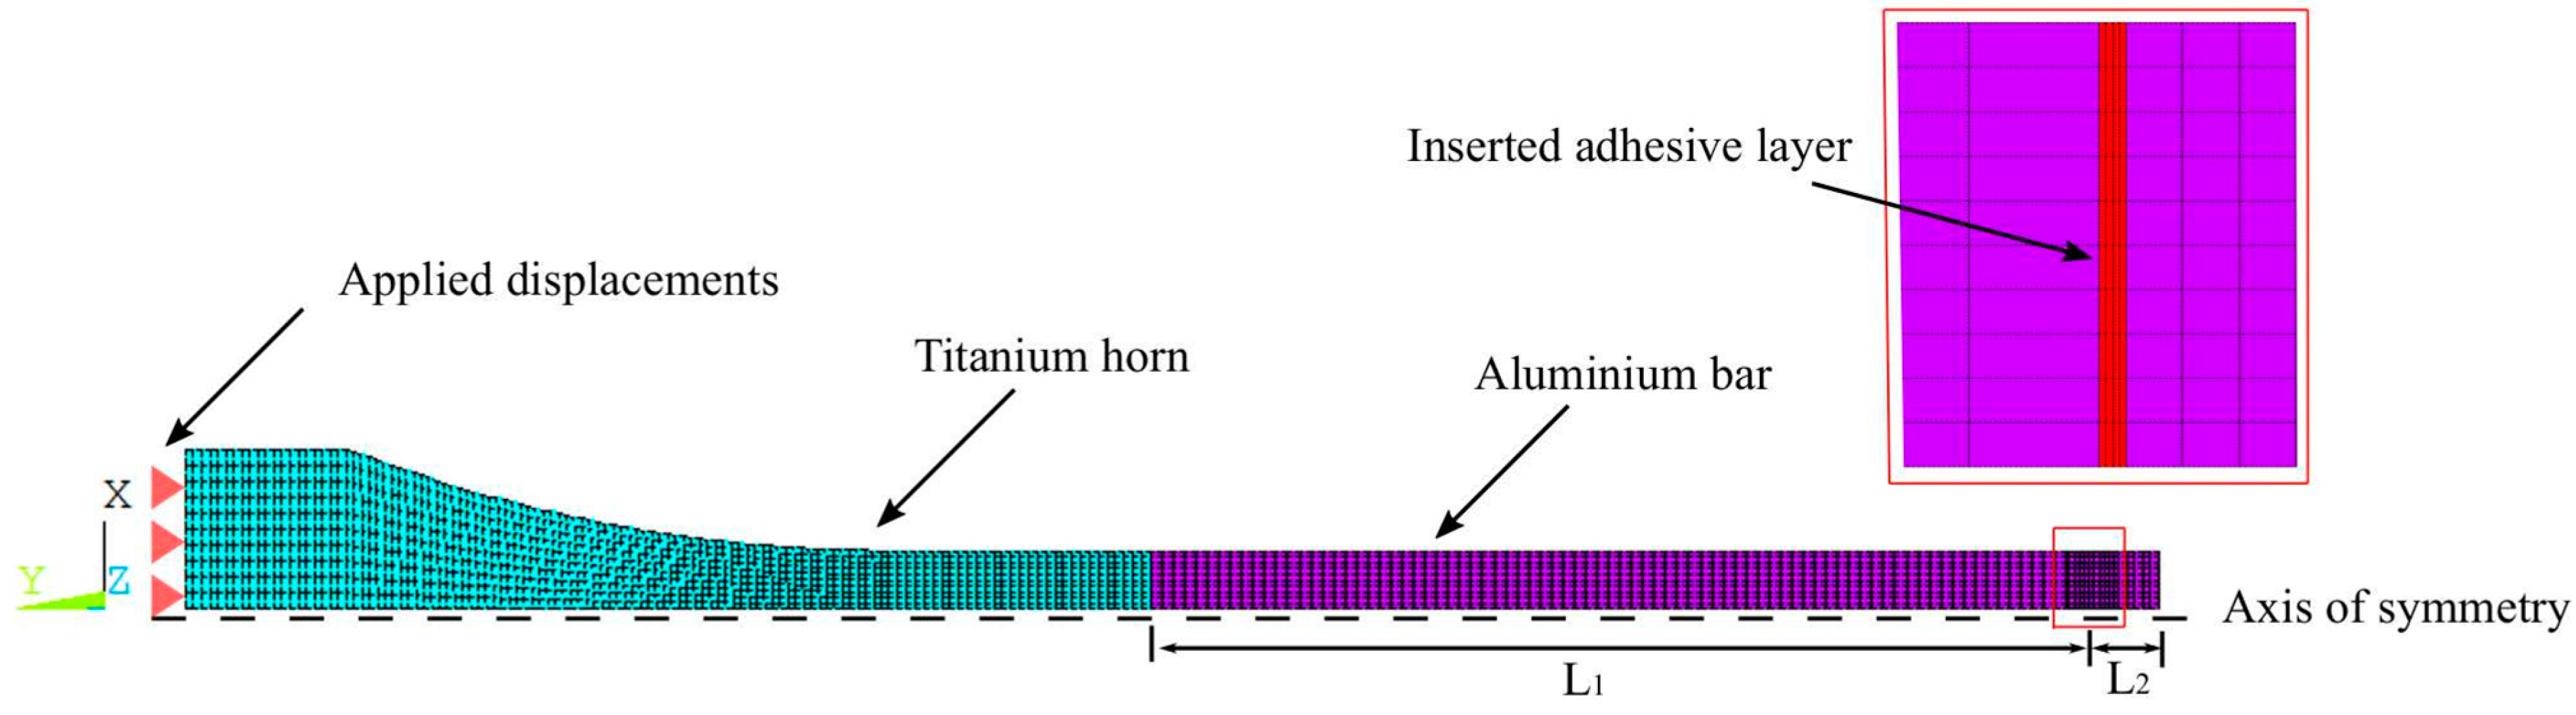
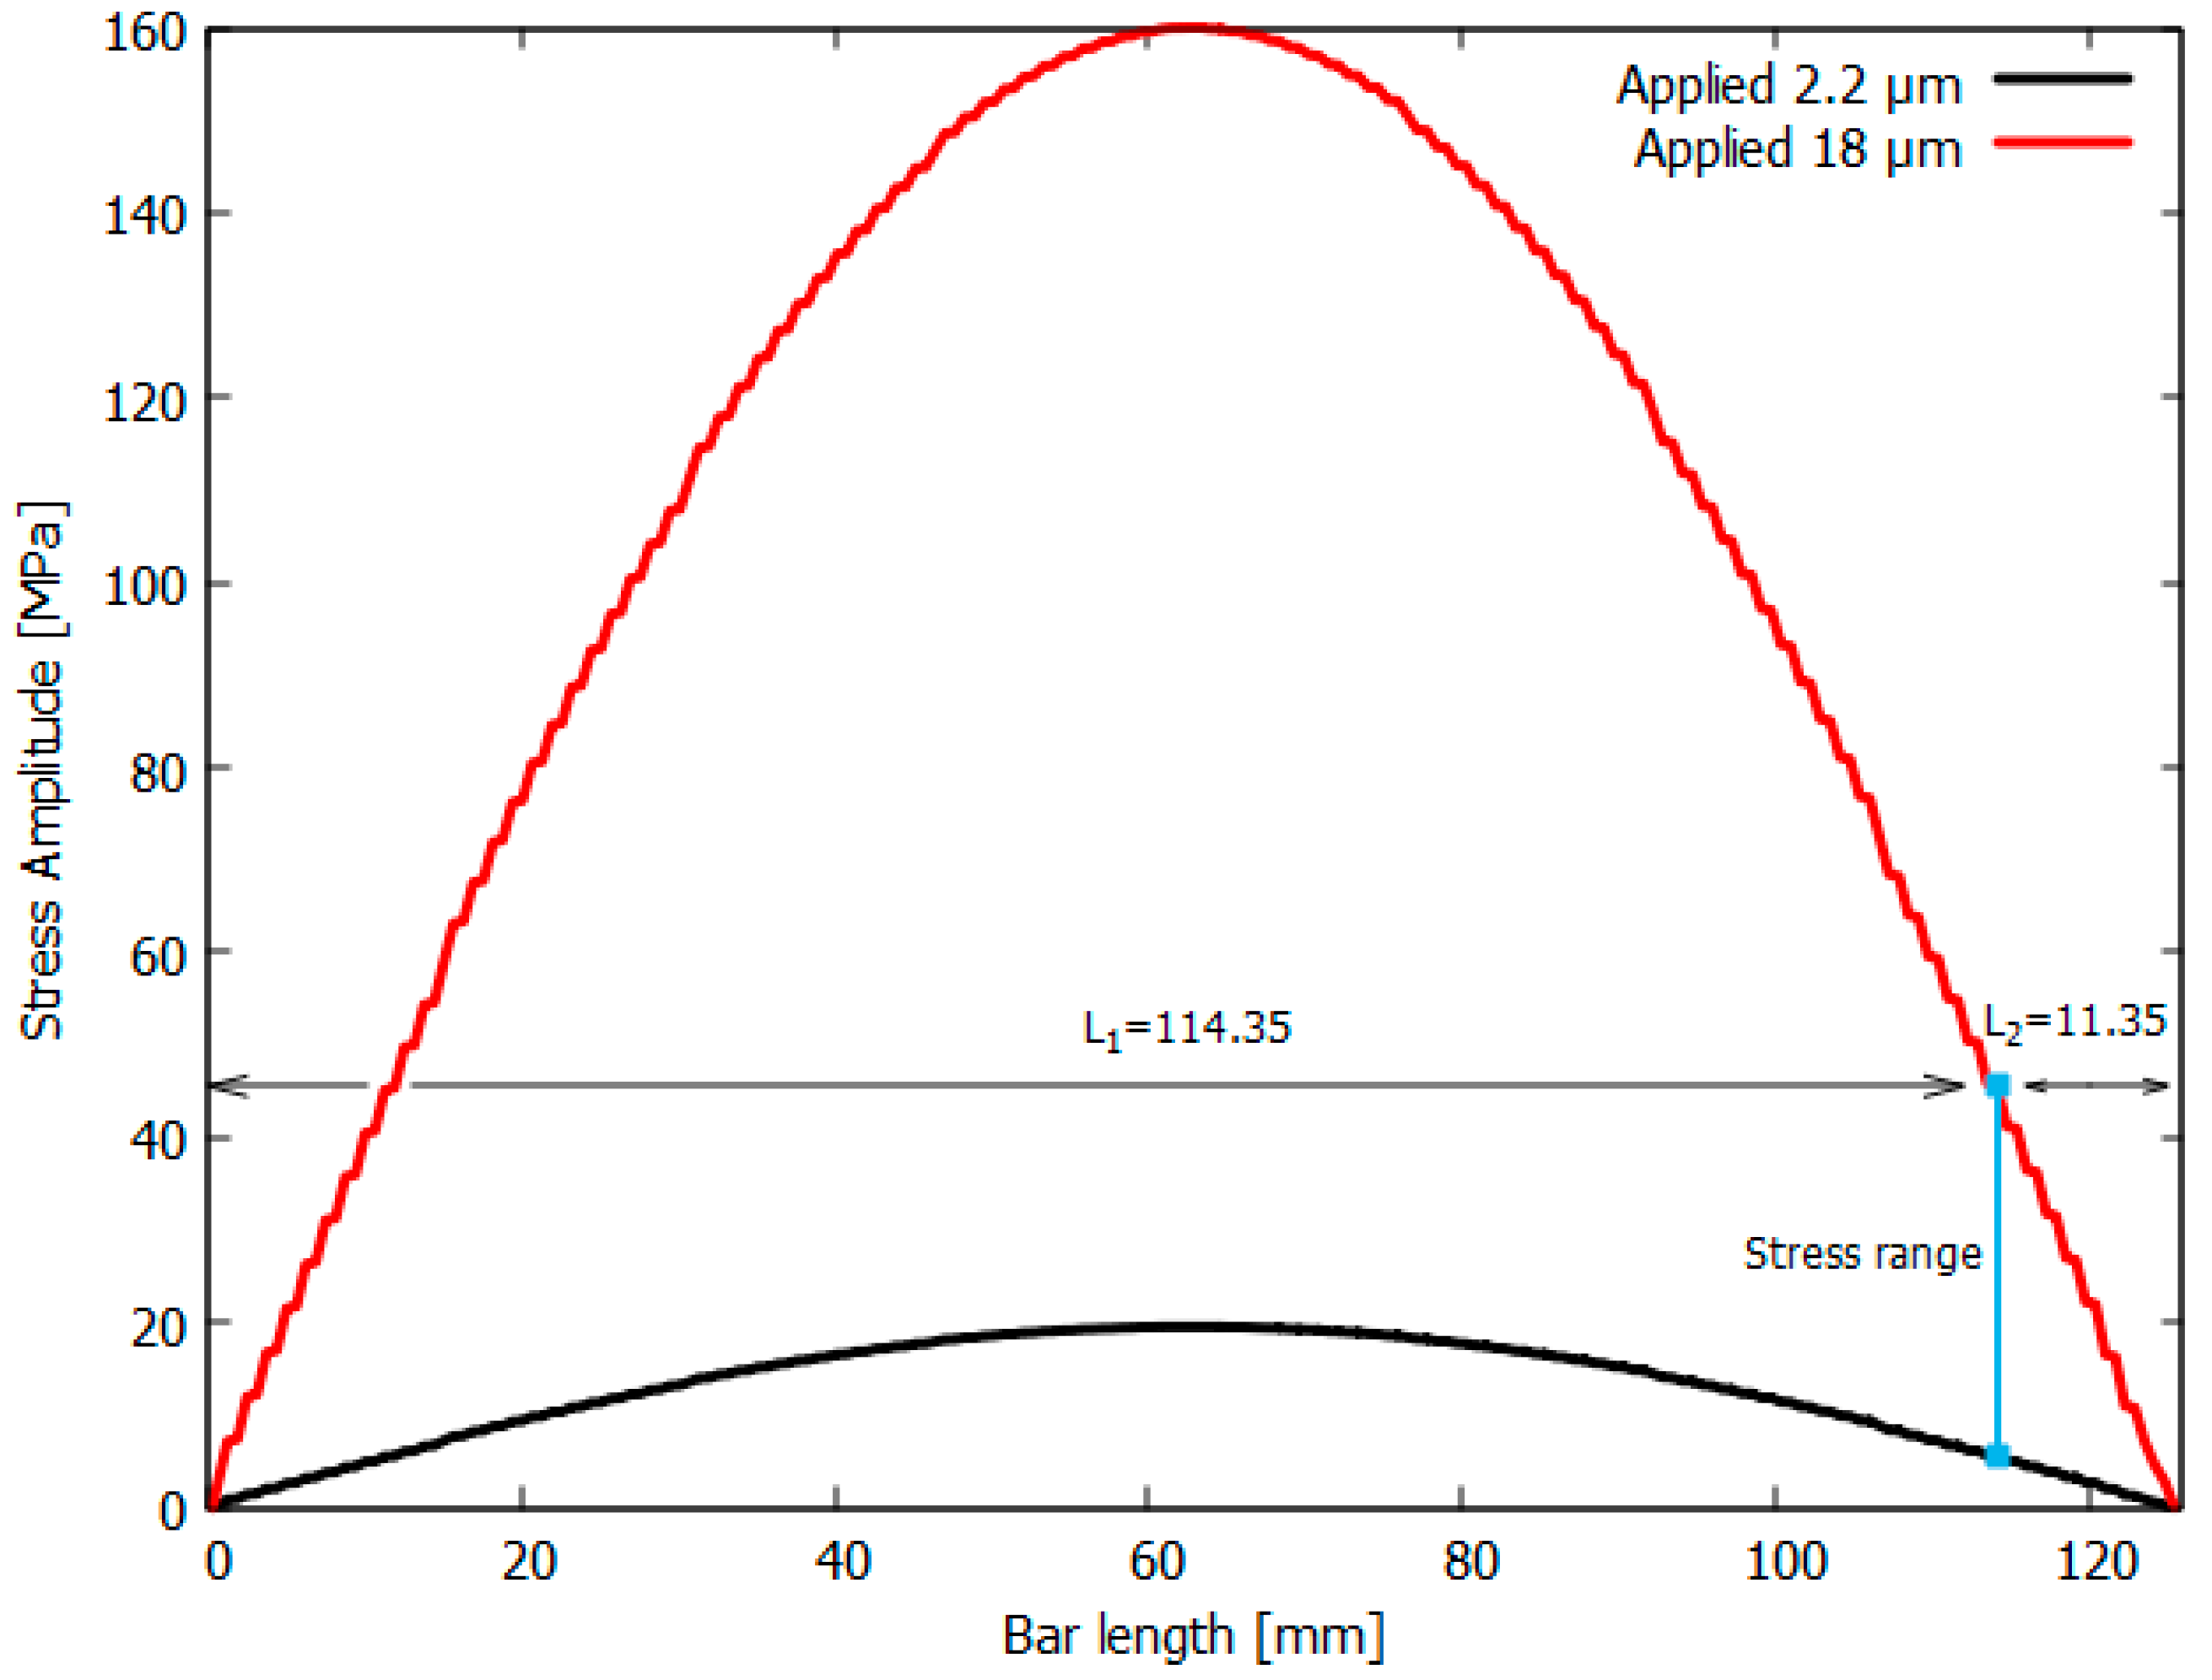
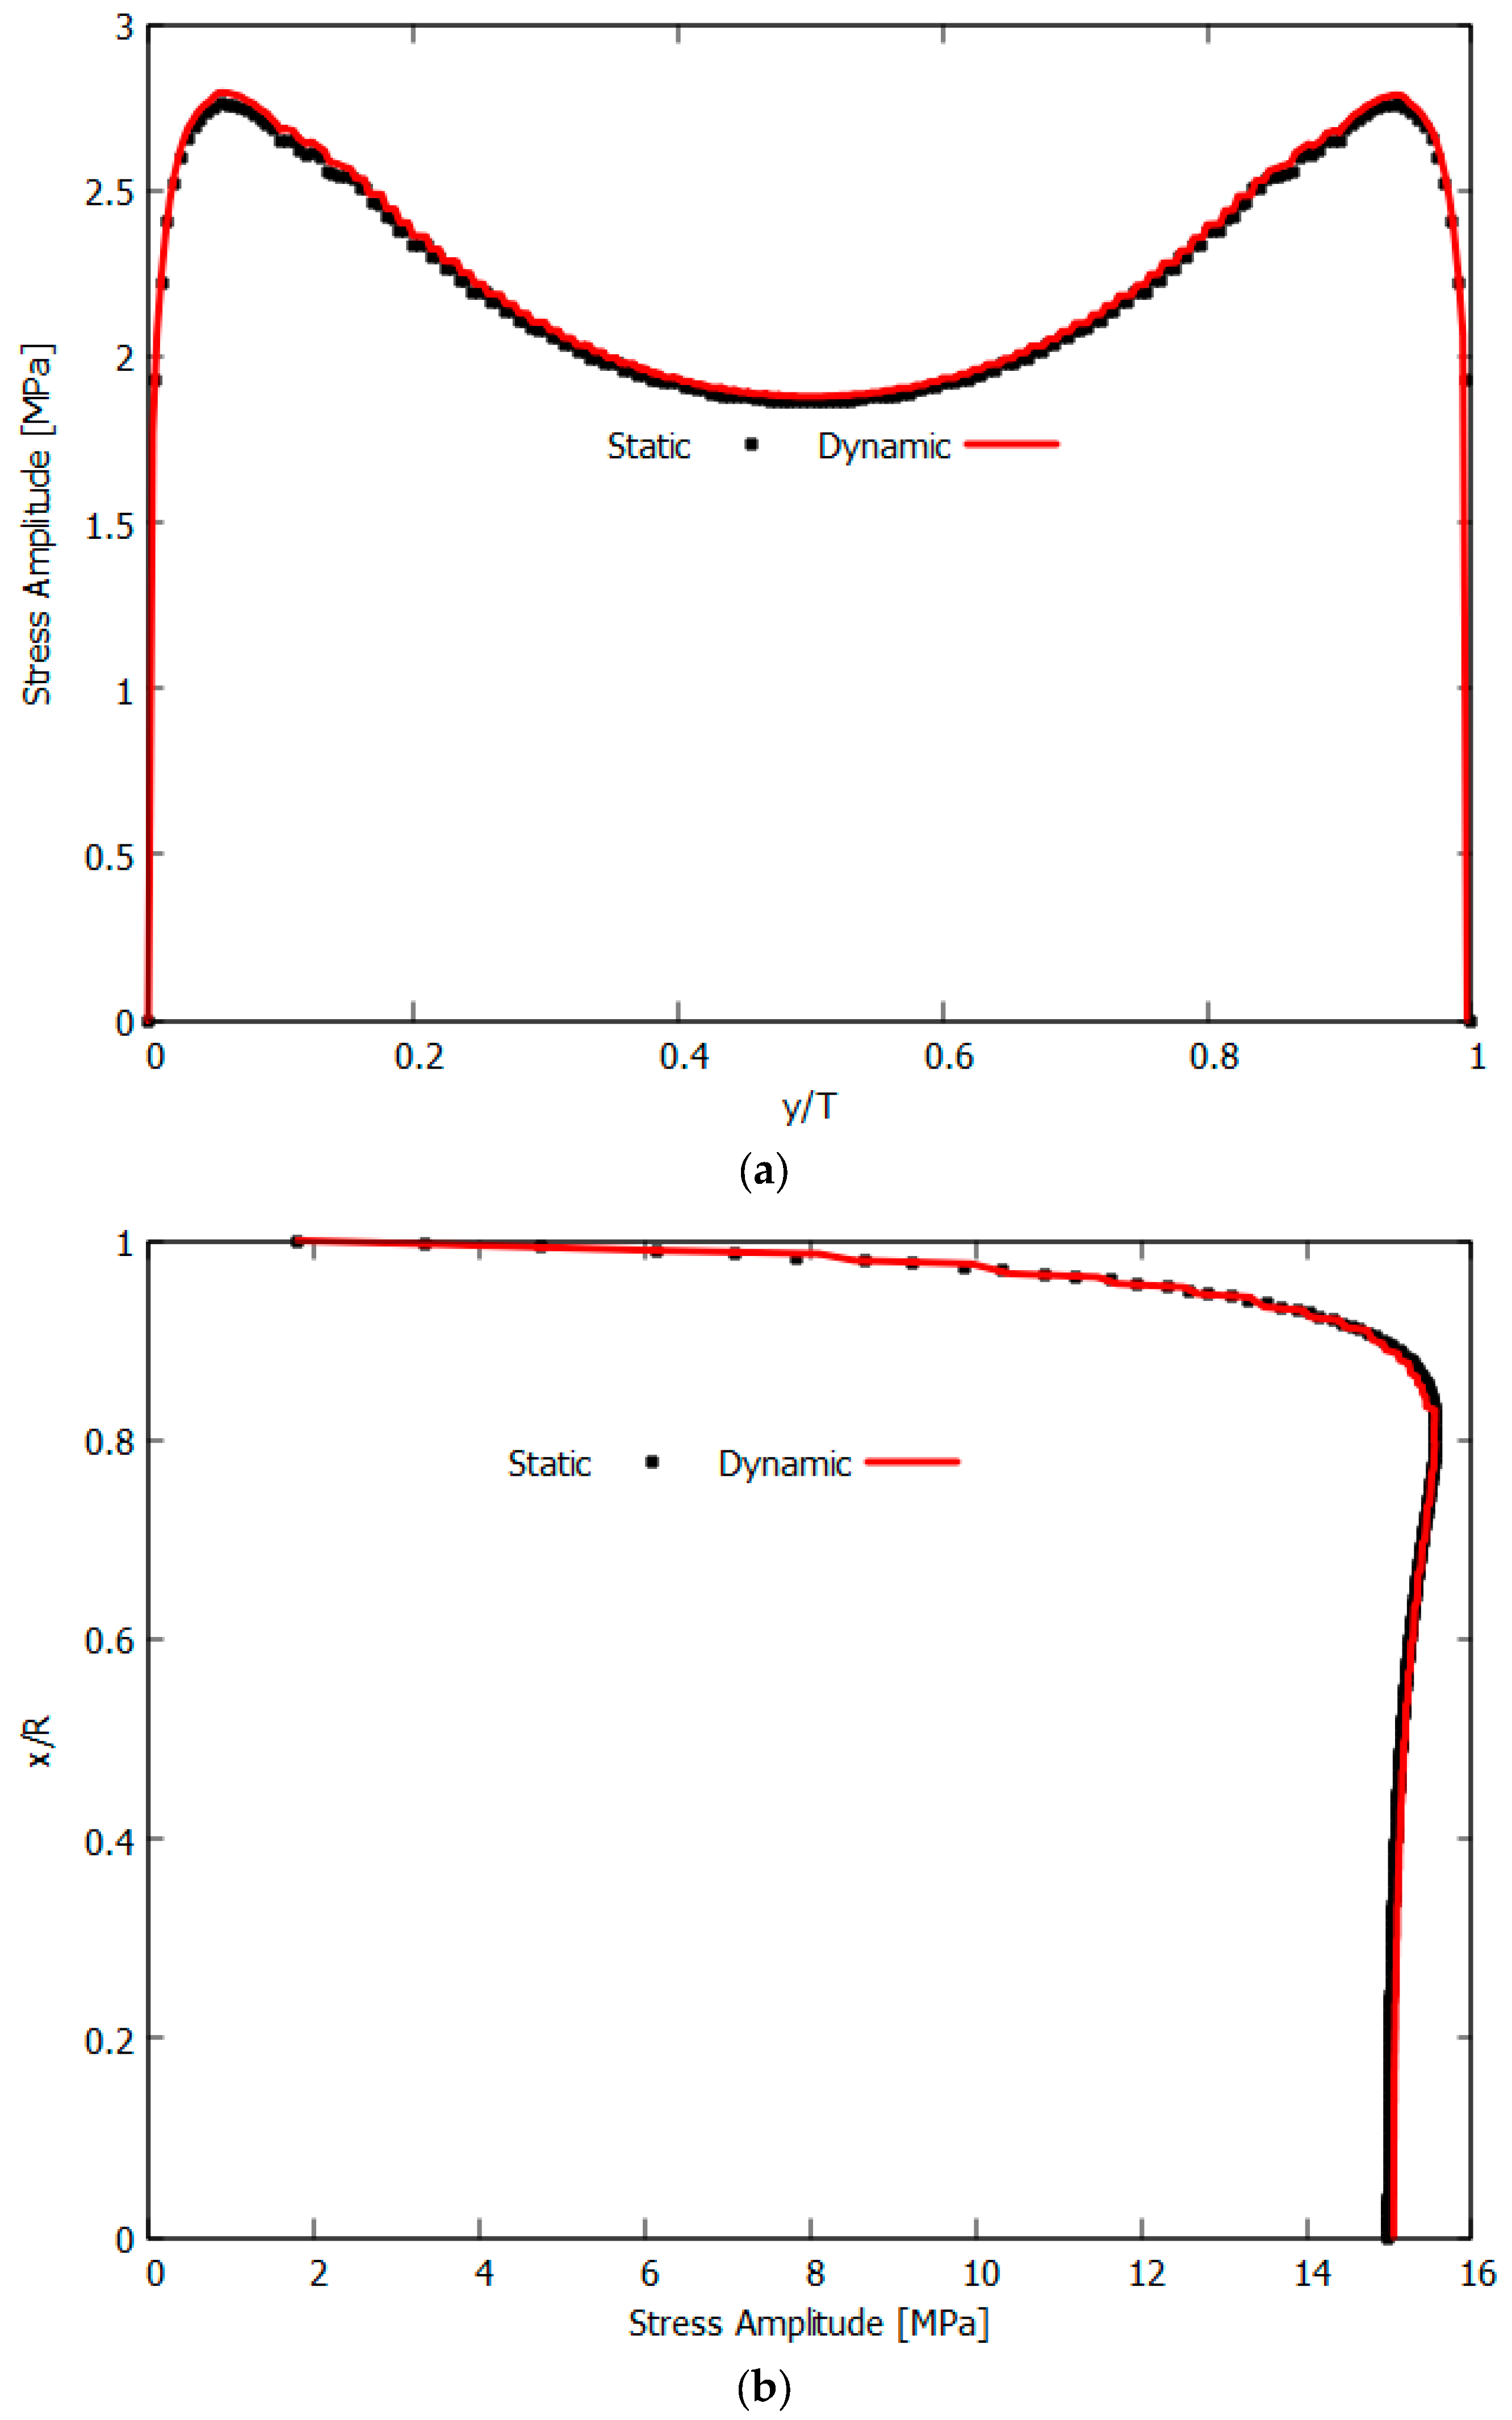
  • A frequency response analysis (FRA) is run at f n = 20,195 Hz, where the current numerical model is composed using the L t o t of the titanium horn and the aluminum bar, with a displacement excitation at the horn base in the range of 2.2–18 μ m , which corresponds to the capability of the UFTM. Longitudinal stress distributions are collected along the aluminium specimen axis and are depicted in Figure 5. This assessment was useful and necessary to explore the stress magnitudes applied to the whole specimen.
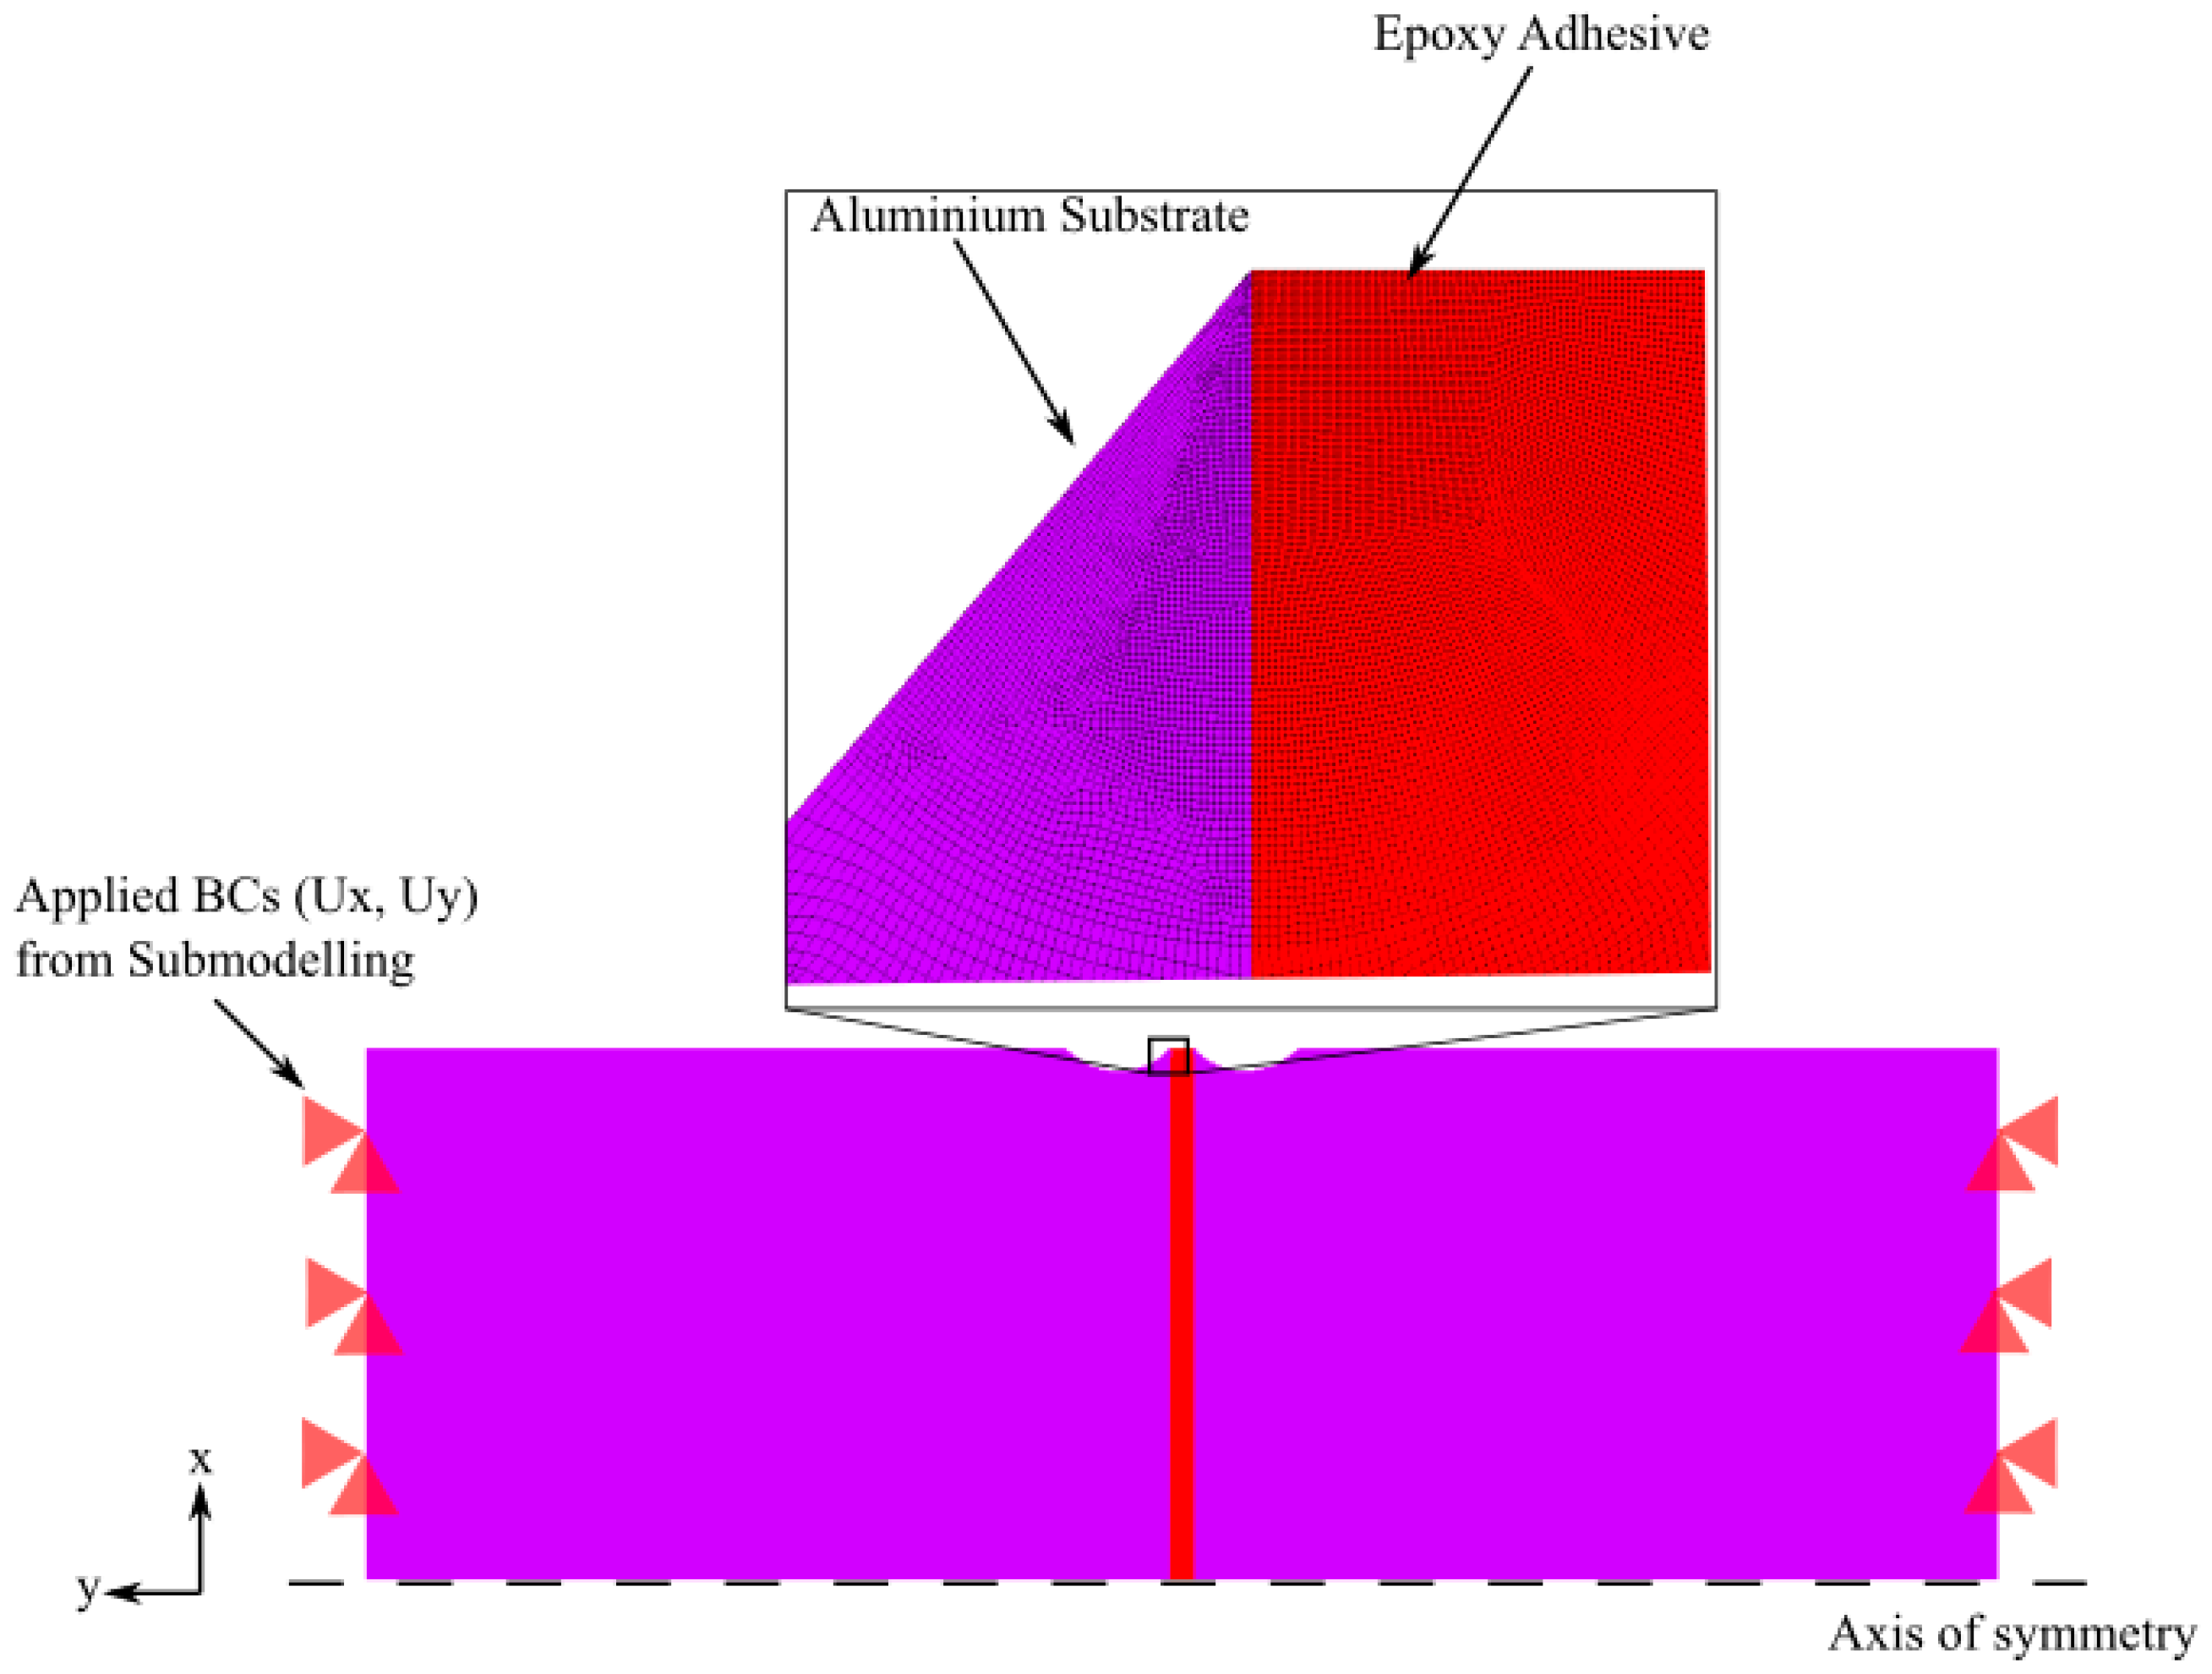
  • A 0.3 mm thick adhesive layer is inserted into the mechanical system, thus dividing the aluminium bar in two separated components, now adhesively joined. The adhesive is placed at a suitable distance in order to impose the desired stress magnitude on the adhesive layer. In this work, the stress range from 5.5–46 MPa was selected. In this way, the L t o t is divided into L 1 = 114.15 mm and L 2 = 11.35 mm, as shown in Figure 5.
  • A final numerical re-assessment is performed through an FRA.
Once the VHCF global model was prepared and the operative adhesive stress interval was defined, the local description was prepared by including the suitable geometrical modification for removing the stress singularity. This modification is based on the procedure elaborated in Section 2.2.1. Indeed, as presented in Table 2 and Figure 3, many configurations can avoid singularities and, in general, all of them are good candidates for testing specimens. As mentioned in Section 2.2.1, the selected adherend–adhesive configuration is 43.5° and 90°. For the sake of completeness, the 43.5°–90° configuration is the limit condition to accomplish a non-singular joint; nonetheless, as illustrated in [43], a safety angular margin should be considered to avoid possible mismatching between the numerical and physical models during the joint production, which could restore the singularity condition. Thus, a safer configuration that accounts for a non-singular geometry, with a reasonable safety margin, is 35° and 90°. Such a geometrical modification was directly inserted into the FE description without redesigning the specimen.
The local model development required the identification of a suitable model size with a proper distance from the region of interest (i.e., the non-singular apex) for the application of boundary conditions. In this circumstance, the boundary conditions arose from displacements transmitted from the global model to the local model (i.e., FRA displacements at the interface). In general, the sub-modelling process ends when the stresses from both the global and local models are reasonably similar and the error is small enough to be considered negligible. Numerically, suitable Ansys procedures based on spline functions provided interpolation schemes for passing from global to local boundary conditions [57,59] thus completing the local model.
The local model discretization exploits structured and free meshes, leading to approximately 350,000 elements, where the minimum element size is on the order of 10 5 mm. Structured meshed are employed to approach the adherend–adhesive zone, whereas free meshes were necessary to discretize the curved regions in proximity of the material interface. Moreover, a stress error-based mesh convergence assessment was adopted for finalizing the mesh refinement. In Figure 6, the final local model is presented.
Regarding the numerical model adopted for the low-frequency fatigue tests, the FE model was simply prepared by joining two non-singular aluminum bars ( L 1 = 114.15 mm) with a thin layer of adhesive. The local model presented in Figure 6 remained valid, as the unique difference was constituted by different boundary conditions. Indeed, since the current testing frequencies (i.e., 5, 25, 50 Hz) are thousands of orders of magnitude lower than the first natural frequency of the specimen, it is reasonable to assume that a static analysis could be representative of testing conditions. In such a case, the numerical assessment assumes the application of pressure to directly impose a specific fixed value of load without other sources of complexity.
In Figure 7a,b and Figure 8a,b, the extracted numerical outcomes for the ultrasonic/low-frequency fatigue test campaign are presented.
In the following sections, for simplicity and brevity, we will refer to (i) the “dynamic case” for those outcomes that explore the ultrasonic testing conditions at 20 kHz and (ii) the “static case” for those results that investigate the low-frequency testing conditions.
The longitudinal stress patterns are presented in Figure 7a,b for the dynamic and static cases, respectively. The reported numerical results aimed at producing 15 MPa in correspondence in the adhesive axis. This stress level was arbitrarily chosen to describe the specimen response within the testing interval from 10–19 MPa.
There is a clearly visible difference between both load cases due to a different boundary condition. Indeed, the VHCF local model stress is respectful of the parabolic trend already obtained in Figure 5, which extinguishes on the left and right sides of the specimen, whereas the static model provides a uniform stress distribution along the model axis. In both cases, grey regions are model zones where stresses are higher than the specific stress threshold (i.e., 20 MPa) that is adopted for a better map visualization. The maximum stress, apart from the left side in the VHCF model, is achieved in correspondence with the curved throats near the adherend–adhesive interface. Moreover, the upper adhesive part presents significant stress reductions in both specimen cases.
The numerical outcomes present smooth enough stress distributions to consider the results to be representative of the current specimen behaviors. Indeed, this is especially true in correspondence with regions with high stress variation and due to specific mesh refinements near the adhesive–adherend apex. Some localized and limited stress distortions are nevertheless present due to the applied mesh transitions from far model regions to zones near the material interface.
An in-depth observation was also performed in terms of model stresses within the adhesive layer. These were specifically observed along the external adhesive surface and in correspondence with the adhesive midline. Such trends are, respectively, reported in Figure 8a,b, where lengths are provided in a non-dimensional form with respect to the adhesive thickness (i.e., T = 0.3 mm) and to the specimen radius (i.e., R = 7.3 mm). Stresses recovered on the thickness surface (Figure 8a) present a trend in accordance with the removal of the stress singularity, and intensities correctly approach to a zero-stress value at the adhesive edges. Stresses recovered along the specimen radius present a concentration in the range of 85% of the height. However, this concentration is limited, and its value is below 16 MPa.
For both load conditions, there is no essential difference in terms of longitudinal stress, thus confirming that the adhesive layer experiences an equal excitation during ultrasonic/low-frequency fatigue tests, even though the stress maps in Figure 7a,b could have suggested a different behavior at a first glance. Moreover, damping or resonance effects do not affect the final stress response despite the VHCF working under UFTM resonance conditions. This numerical assessment was particularly helpful for design purposes as well as for defining the operative conditions of the specimen under testing. In particular, this verification ensures that different loading conditions produce comparable testing circumstances.

3. Experimental Results

Fifty-five specimens were tested under the stress range from 10–19 MPa. Fatigue experiments were performed at 20 kHz using the UFTM and at 5, 25, and 50 Hz using the Instron® 8801 servo-hydraulic testing machine. A standard procedure suggested by the adhesive manufacturer was followed to obtain the highest adhesive strength. In particular, abrasive sandpapers were used to prepare the substrate surface to increase the surficial roughness, followed by a cleaning phase with acetone for removing the aluminum powder and impurities. The thin layer of adhesive was thus applied between the substrates and spread to reach a uniform bonding area. Suitable alignment devices were designed to guarantee the substrate co-axiality. The joint curing required one day under a constant load at room temperature and, once the adhesive was fully dried, the surplus was removed from the substrate edges with a cutter. In this way, it was possible to maintain the 0.3 mm adhesive layer without resin concentration effects on the experimental results.
In Figure 9, the testing configurations are reported. Figure 9a depicts the UFTM testing conditions whereas Figure 9b shows the low-frequency testing configuration. Specifically, fatigue tests at conventional frequencies were performed by joining the two long non-singular bars and clamping them in the Instron® grips.
Experimental tests were carried out up to failure or to a run-out threshold equal to 109 cycles in ultrasonic VHCF tests and to 2 × 10⁶ cycles in servo-hydraulic low-frequency tests. This difference is mainly attributable to the testing time required by the hydraulic machine working below 100 Hz, which is unable to test specimens in VHCF within a reasonable timeframe.
Both cohesive and mixed adhesive–cohesive failures were observed at the end of the testing campaign; nonetheless, only fully cohesive failures were accepted as valid failures in the S–N diagram shown in Figure 10. Indeed, adhesive–cohesive failures in both the VHCF and HCF ranges were associated with a very short fatigue life compared to the fully cohesive failures. In general, a specimen is considered failed when there is a complete separation between the two bars for both ultrasonic and low frequency configurations. However, specifically for VHCF tests, failure is also considered when the longitudinal frequency of the mechanical system falls below 19.5 kHz, which is outside of the UFTM operative range. In this circumstance, the internal crack nucleates and propagates without a complete splitting between adherends, and an extra load (manual or automatic) is applied to separate the elements.
According to Figure 10, the frequency rate effect is clear. Indeed, the fatigue response is significantly different depending on the testing frequency. Specimens obtained through ultrasonic fatigue tests are characterized by significantly longer fatigue lives compared to those of specimens tested at lower frequencies.
Experimental run-outs from (13–15) MPa were found for five samples in ultrasonic VHCF tests, whereas only one, at 10 MPa, was observed for 25 and 50 Hz frequencies. These experiments highlight an important frequency effect for the whole fatigue data distribution and, in general, a high sensitivity to excitation frequency for the SikaPower®-1277 adhesive.
VHCF tests were carried out under temperature-controlled conditions, as mentioned in Section 2. Accordingly, possible self-excited temperature effects were excluded, as well as significant changes in the adhesive joint properties that could have influenced the test outcomes. Indeed, it was numerically demonstrated in [50] that for the investigated stress range the thermal increment within the adhesive layer was limited and remained in an acceptable range for testing adhesive joints.
A further investigation on the frequency effect, especially for low-frequency tests, was carried out by estimating the probability–stress–number of cycles (P–S–N) curves. P–S–N estimation was carried out with the maximum likelihood (ML) principle to account for both failures and run-outs [60,61].
In Equation (5) the compact formulation of the likelihood function that must be maximized is reported.
L θ = i = 1 n f f Y | X = x y i ; x i , θ · j = 1 n r 1 F Y | X = x y i ; x i , θ ,
Here, L · is the likelihood operator, θ is the set of parameters to be estimated, f Y | X = x is the probability density function of the fatigue life, F Y | X = x is the cumulative distribution function, y i and x i are the fatigue life and the logarithm of the applied stress of the i-th specimen, respectively, and n f and n r are the number of failures and run-outs, respectively. According to [19], the random variable Y, i.e., the logarithm of the fatigue life, is assumed to follow a normal distribution, with a constant standard deviation and mean that is linearly dependent on the logarithm of applied stress. In Equation (6) the mathematical relationship describing the mean is reported:
μ Y x = c Y + m Y · x ,
where c Y and m Y are the parameters to be determined as well as the standard deviation within the normal distribution.
The unknown parameters were estimated practically, using a Matlab® R2023a script and an optimization toolbox that exploits the Nelder–Mead simplex algorithm in order to identify the entire θ vector of the unknowns.
The 50% P–S–N curves associated with each tested condition were estimated. The resulting curves are shown in Figure 11, where the selected probability level aims at representing the averaged behaviours of the tested specimens. The P–S–N curves confirm the frequency rate effect, with a recursive increase in the joint life as the applied frequency increases. This effect can be observed at every investigated test level, namely, between the ultrasonic and low frequencies and among the three selected low-frequency levels.
The impact of the data scattering was analysed through the analysis of standard deviations (SD), whose values are reported in Table 3. Indeed, low frequencies tend to produce a slightly lower variability in failure distribution, whereas this quantity tends to increase as the applied frequency passes into the ultrasonic range. For the sake of completeness, even though this effect is present, it is limited without a relevant impact on the experimental outcomes.
Finally, as shown in Figure 12, fatigue strengths at N = 2 × 10⁶ cycles were collected for three probability levels, namely, 10%, 50%, and 90%. Data were interpolated through a power law scheme, i.e., σ = A · f b , where σ is the experimental fatigue strength, f is the applied test frequency, and A , b are the model parameters to be determined. The calculation was performed with the least squares method. The R2 factor was higher than 0.995 for all investigated cases. As demonstrated by the interpolation, in a bi-log chart, the data were quite well approximated. This information is particularly useful, and the results demonstrated a power law increase in the frequency effect. Moreover, this experimental evidence can be considered when predicting strength values not covered by the experimentation.

4. Discussion

The combined analytical–numerical approach based on the inverse Bogy formulation and FEA investigations was effectively applied as a design methodology for producing a fatigue test configuration. Indeed, the absence of analytically predicted stress singularities was confirmed by FEA investigations for both test conditions. Notably, the FEA studies demonstrated that even though the overall stress distribution was different for the test-representative experimental conditions (Figure 7a,b), the recovered longitudinal stress levels within the adhesive were equal under fixed applied explorative stress conditions (Figure 8a,b) of 15 MPa. From a design perspective, performing FEA studies was particularly important to carefully approach the test phase, as the joint was thus tested in its physical best condition (i.e., no stress singularity effects) and under the same test levels (i.e., no damping, resonance, or visible frequency-induced effects).
The experimental campaign executed using a commonly adopted fatigue machine and an ultrasonic testing machine highlighted different aspects of fatigue testing, both in general and regarding adhesive joint testing in particular: (i) the use of an ultrasonic testing machine was effectively applied for testing specimens up to the VHCF range. This fatigue range is relatively new for material characterization, and several studies have been performed in recent years; (ii) performing ultrasonic tests confirmed the capability of the investigated adhesive to sustain loads for a higher number of cycles. This evidence is of particular importance and interest as modern structures that are composed by innovative and engineered materials are required to sustain acting loads for much more time than before; (iii) performing commonly executed fatigue tests enabled the investigation of the loading frequency effects, and the experimental outcomes have shown an extreme sensibility to this parameter for the investigated adhesive. For example, at 14 MPa, there is a difference in the range of five orders of magnitude between the ultrasonic and low-frequency fatigue lives. Specifically, joints subjected to ultrasonic fatigue tests failed in the VHCF range, whereas the remaining classes failed in the HCF range. Similarly, the run-out threshold decreases from values close to 15 MPa in the case of ultrasonic testing to 10 MPa when specimens are subjected to commonly adopted frequencies. Indeed, as illustrated by other research (e.g., [14]), loading frequency effects and strain rate effects have a tendency to increase material properties (e.g., the strength or elasticity modulus) and enhance material responses. Information such as that extracted in this work is of fundamental importance in the structural design of equipment, as modern structures should sustain loads over a broad frequency spectrum that is commonly characterized by complex stress/strain histories at different stress ratios; (iv) the use of a statistical tool was particularly useful for both the precise quantification and visualization of frequency effects, as well as to manage data scattering and uncertainties. For the special case of the selected adhesive, the ML technique was employed for extracting the P–S–N curves, while SD studies quantified data scattering. The S–N curves revealed that fatigue responses at 5, 25, and 50 Hz increase as the applied frequencies vary accordingly and that data scattering has a minor impact among the explored frequencies but is nevertheless present (0.3038 at 5 Hz, 0.5763 at 25 Hz, 0.4687 at 50 Hz, and 0.7691 at 20 kHz); (v) to approach loading frequency studies, is quite unfeasible to test specimens at every single excitation frequency. Thus, a regression/interpolation model should be applied for extracting design values from the experimental range. To understand the strength distribution, values at N = 2 × 10⁶ were selected for three probability levels (P = 10, 50, 90%), and fatigue strengths were well-approximated using a power law model.
The analyses carried out in this paper have important implications for components and structures that are commonly subject to a broad frequency spectrum, as in the case of aerospace components during their operative conditions. Neglecting frequency rate effects could lead to earlier failures if components spend a significant number of cycles subjected to low-frequency loads, as demonstrated in this work. At the same time, attention should be paid when extracting material properties from ultrasonic testing. Indeed, in the case of fatigue strength, the extrapolation of such quantities for lower numbers of cycles could be risky, as fatigue strength can be overestimated.
Practically, the design of components should be addressed to carefully incorporate the effects of multiple frequencies within the analysis environment, going beyond material property extraction using a single harmonic approach. In this way, possible earlier failures could be properly anticipated to develop reliable components with extended capabilities for working under a broad spectrum. Additionally, this concept is also important to implement rational maintenance inspections.

5. Conclusions

In this paper, an experimental testing campaign aimed at quantifying frequency effects on the fatigue responses of adhesively bonded cylindrical butt joints was performed. Fatigue tests were executed using the ultrasonic loading frequency (i.e., 20 kHz) and commonly adopted low frequencies (i.e., 5, 25, 50 Hz). A combined analytical and numerical methodology was applied to design and verify the specimens under investigation.
The main findings of this study are:
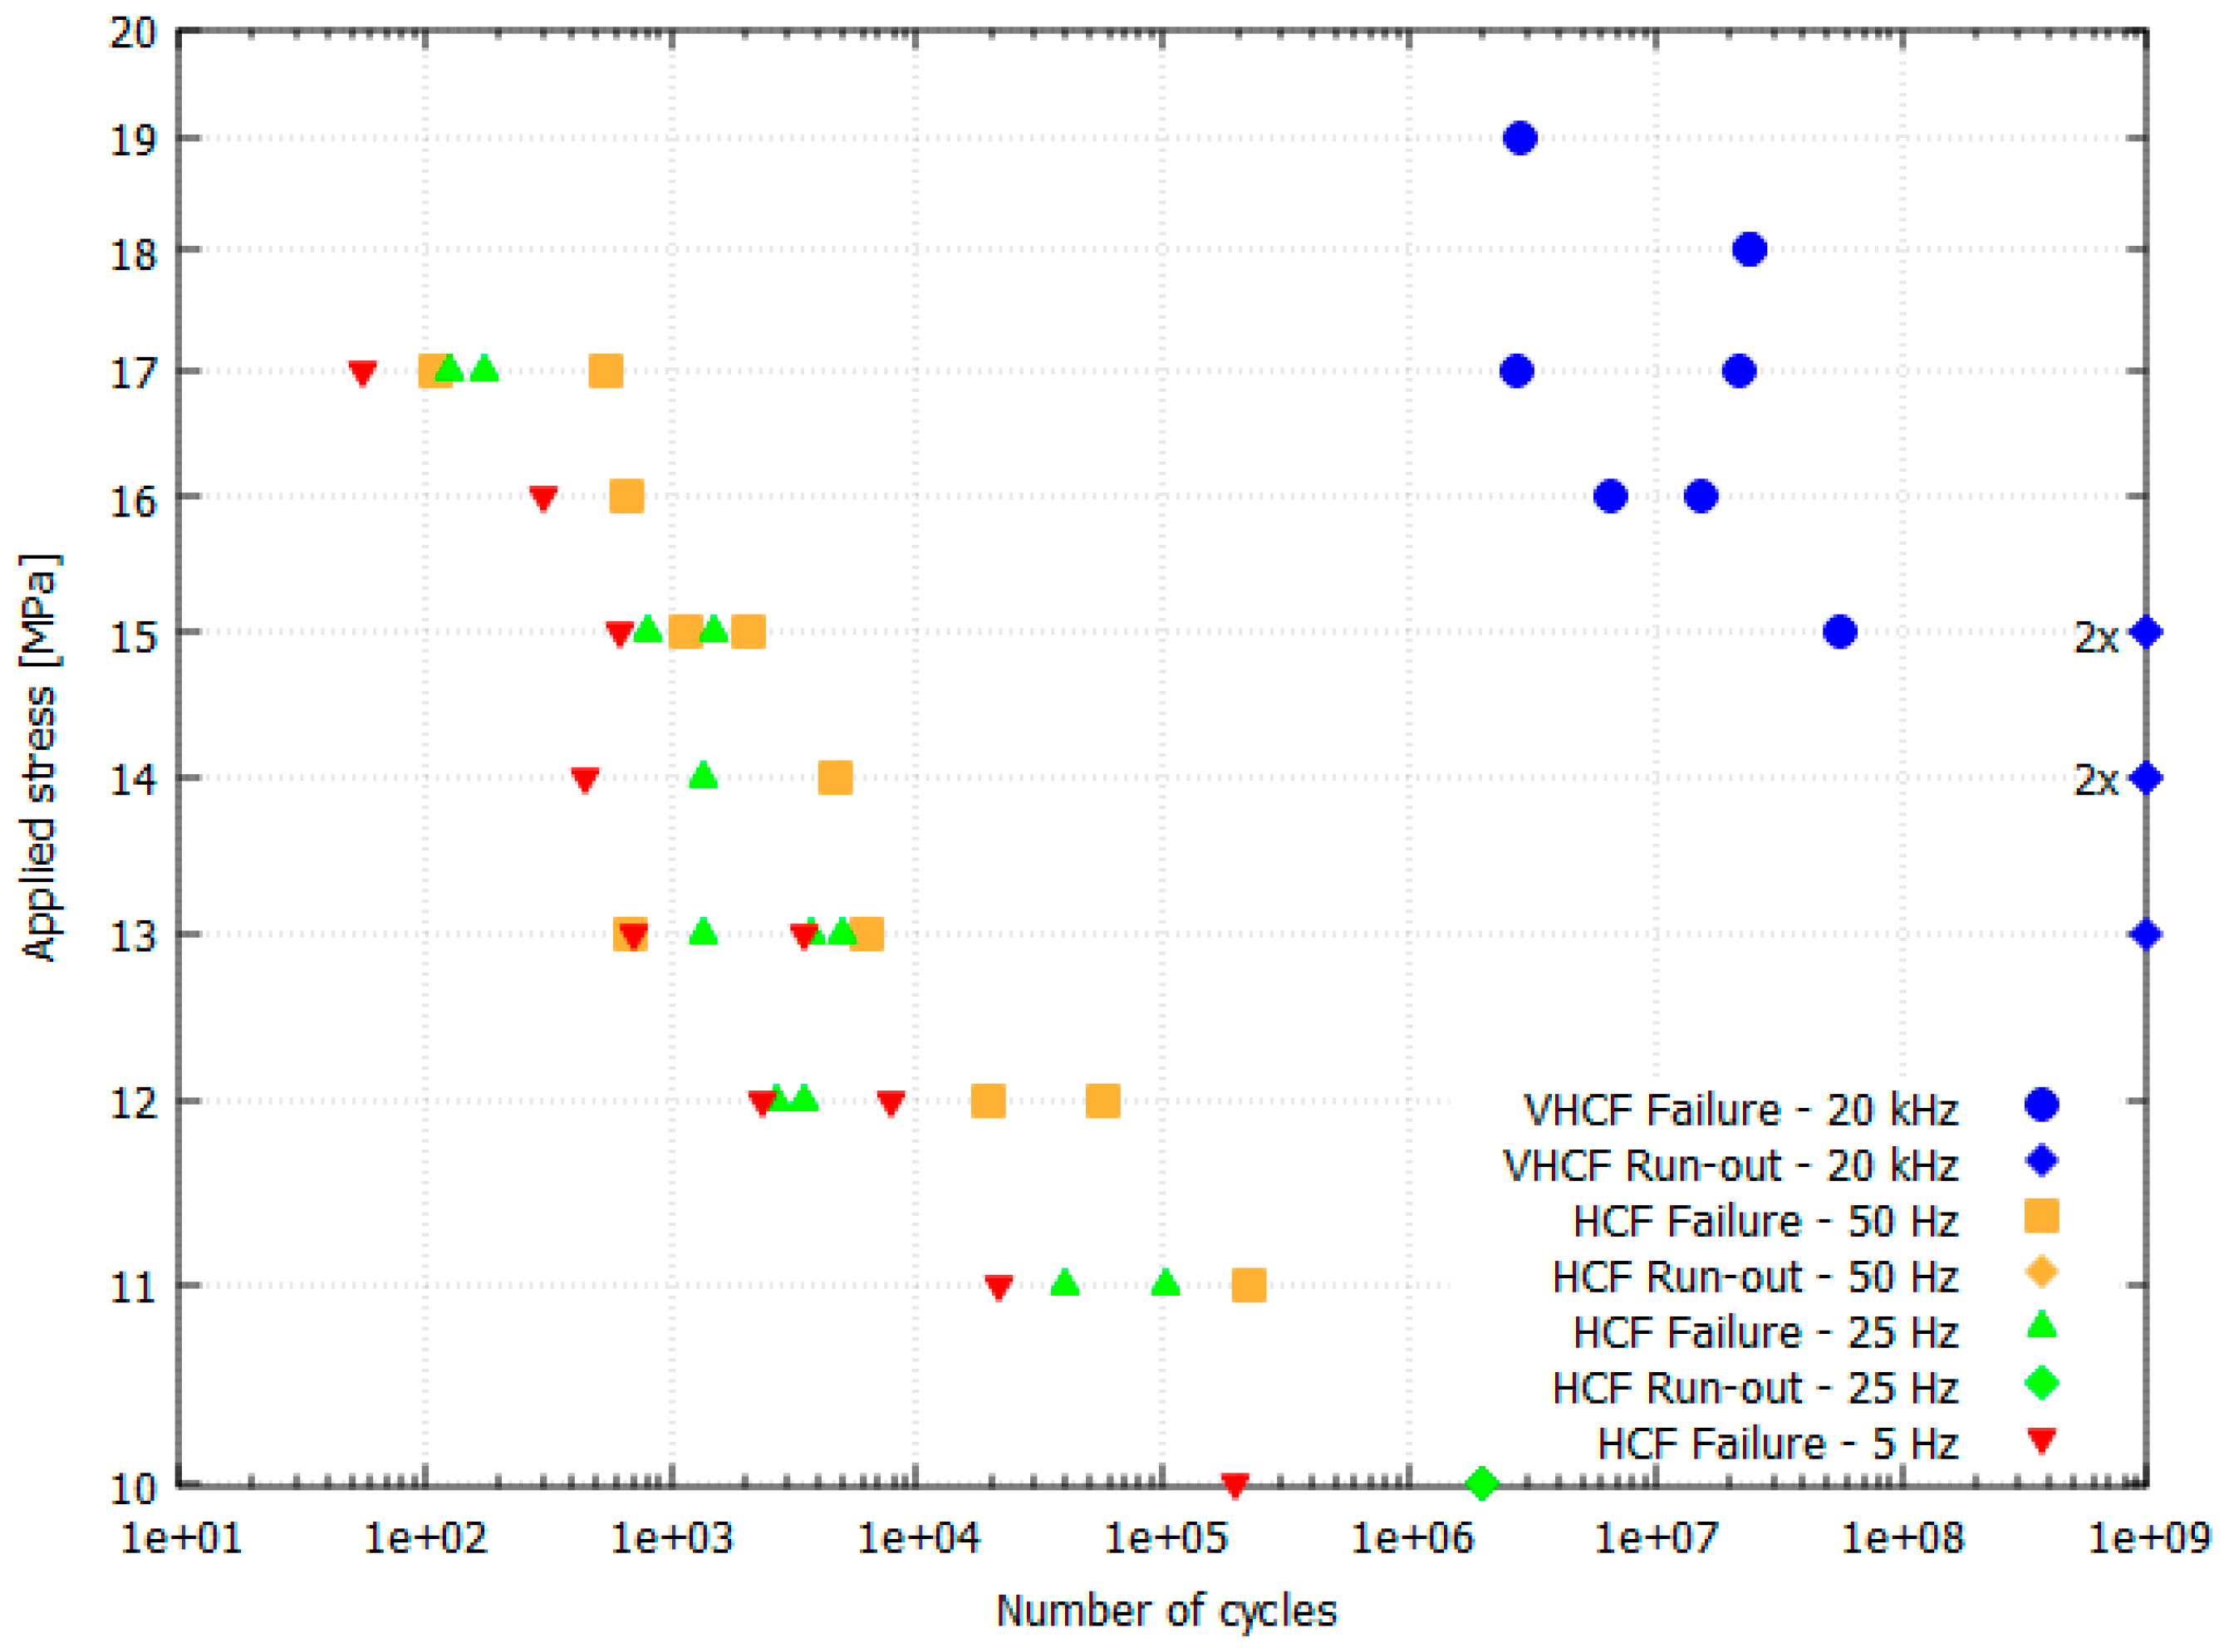
  • At a fixed applied load, specimens tested at an ultrasonic frequency are prone to fail in the very high cycle fatigue range (N > 107), whereas specimens subjected to common frequencies fail in the high cycle fatigue range, thus confirming the presence of a frequency effect.
  • Specimens tested at an ultrasonic frequency express run-out data below 15 MPa compared to 10 MPa in the case of 25 and 50 Hz frequencies. Specimens at 5 Hz do not present run-outs.
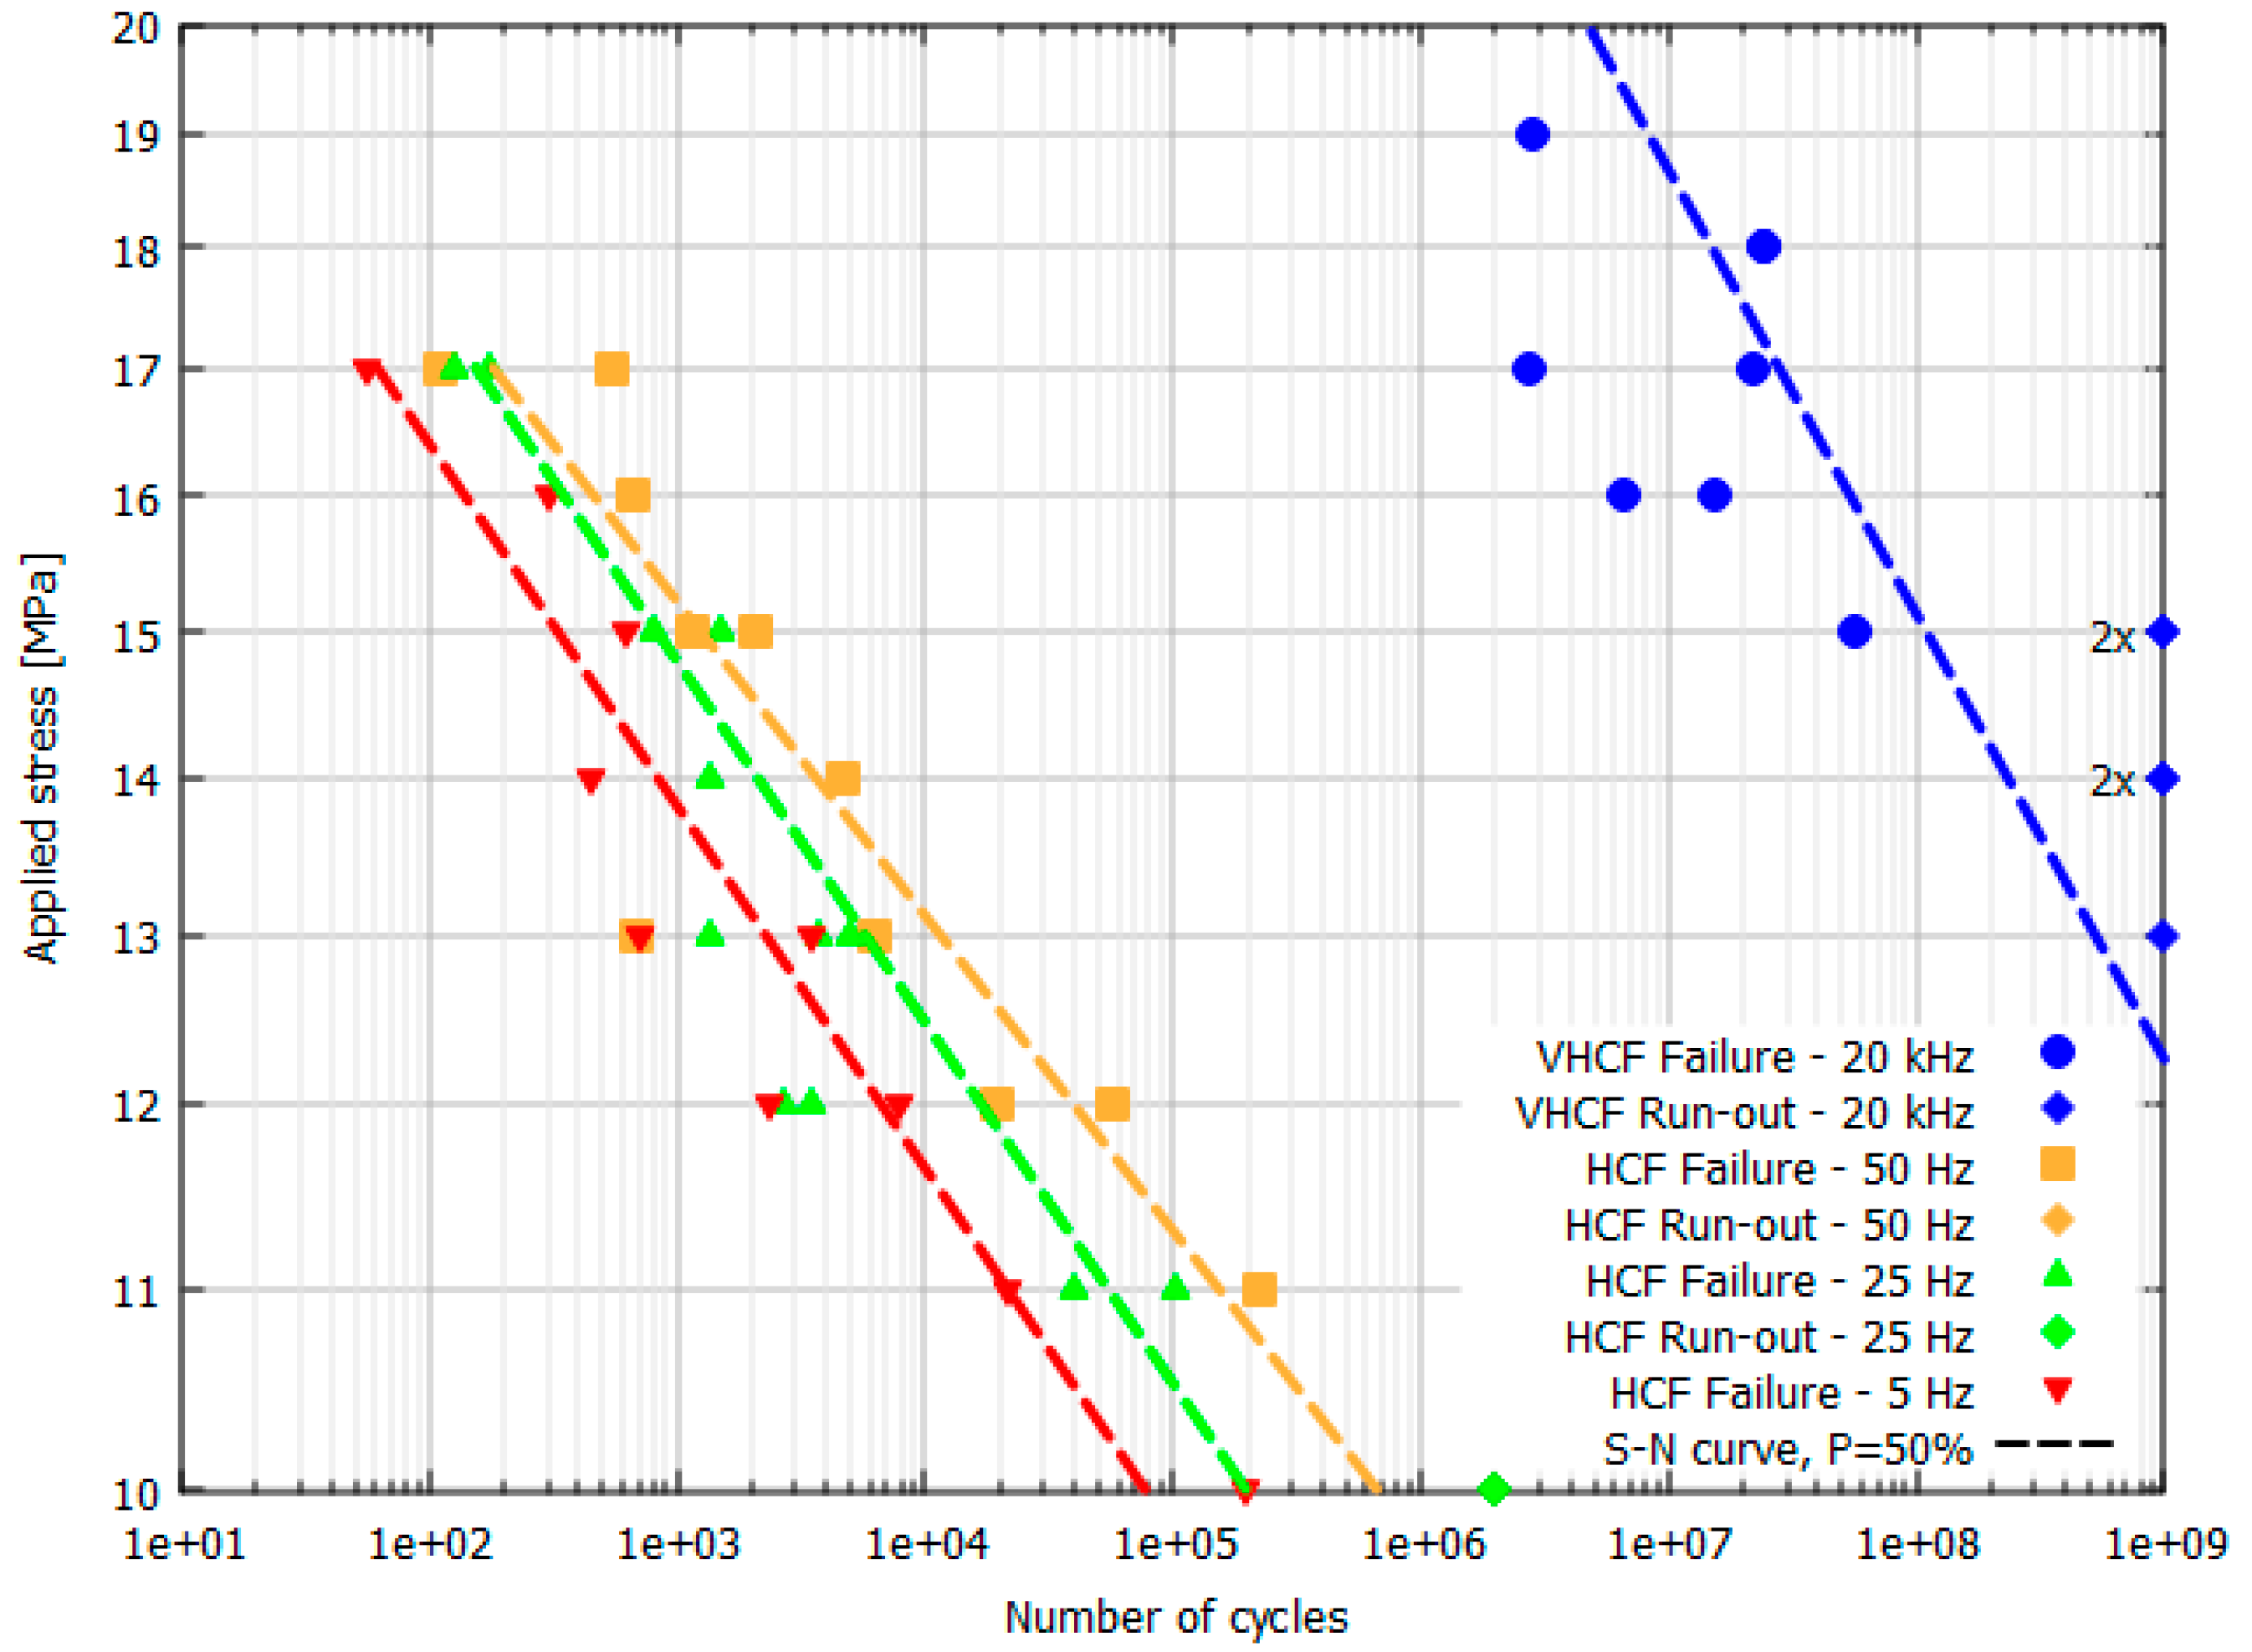
  • There is an increase in fatigue performance among specimens tested in the low-frequency range, and this is visible through the S–N curve at the 50% probability level.
  • Data scattering was investigated through standard deviations, and the experimental results demonstrated a minor impact on fatigue properties (i.e., 0.3038 at 5 Hz, 0.5763 at 25 Hz, 0.4687 at 50 Hz, and 0.7691 at 20 kHz);
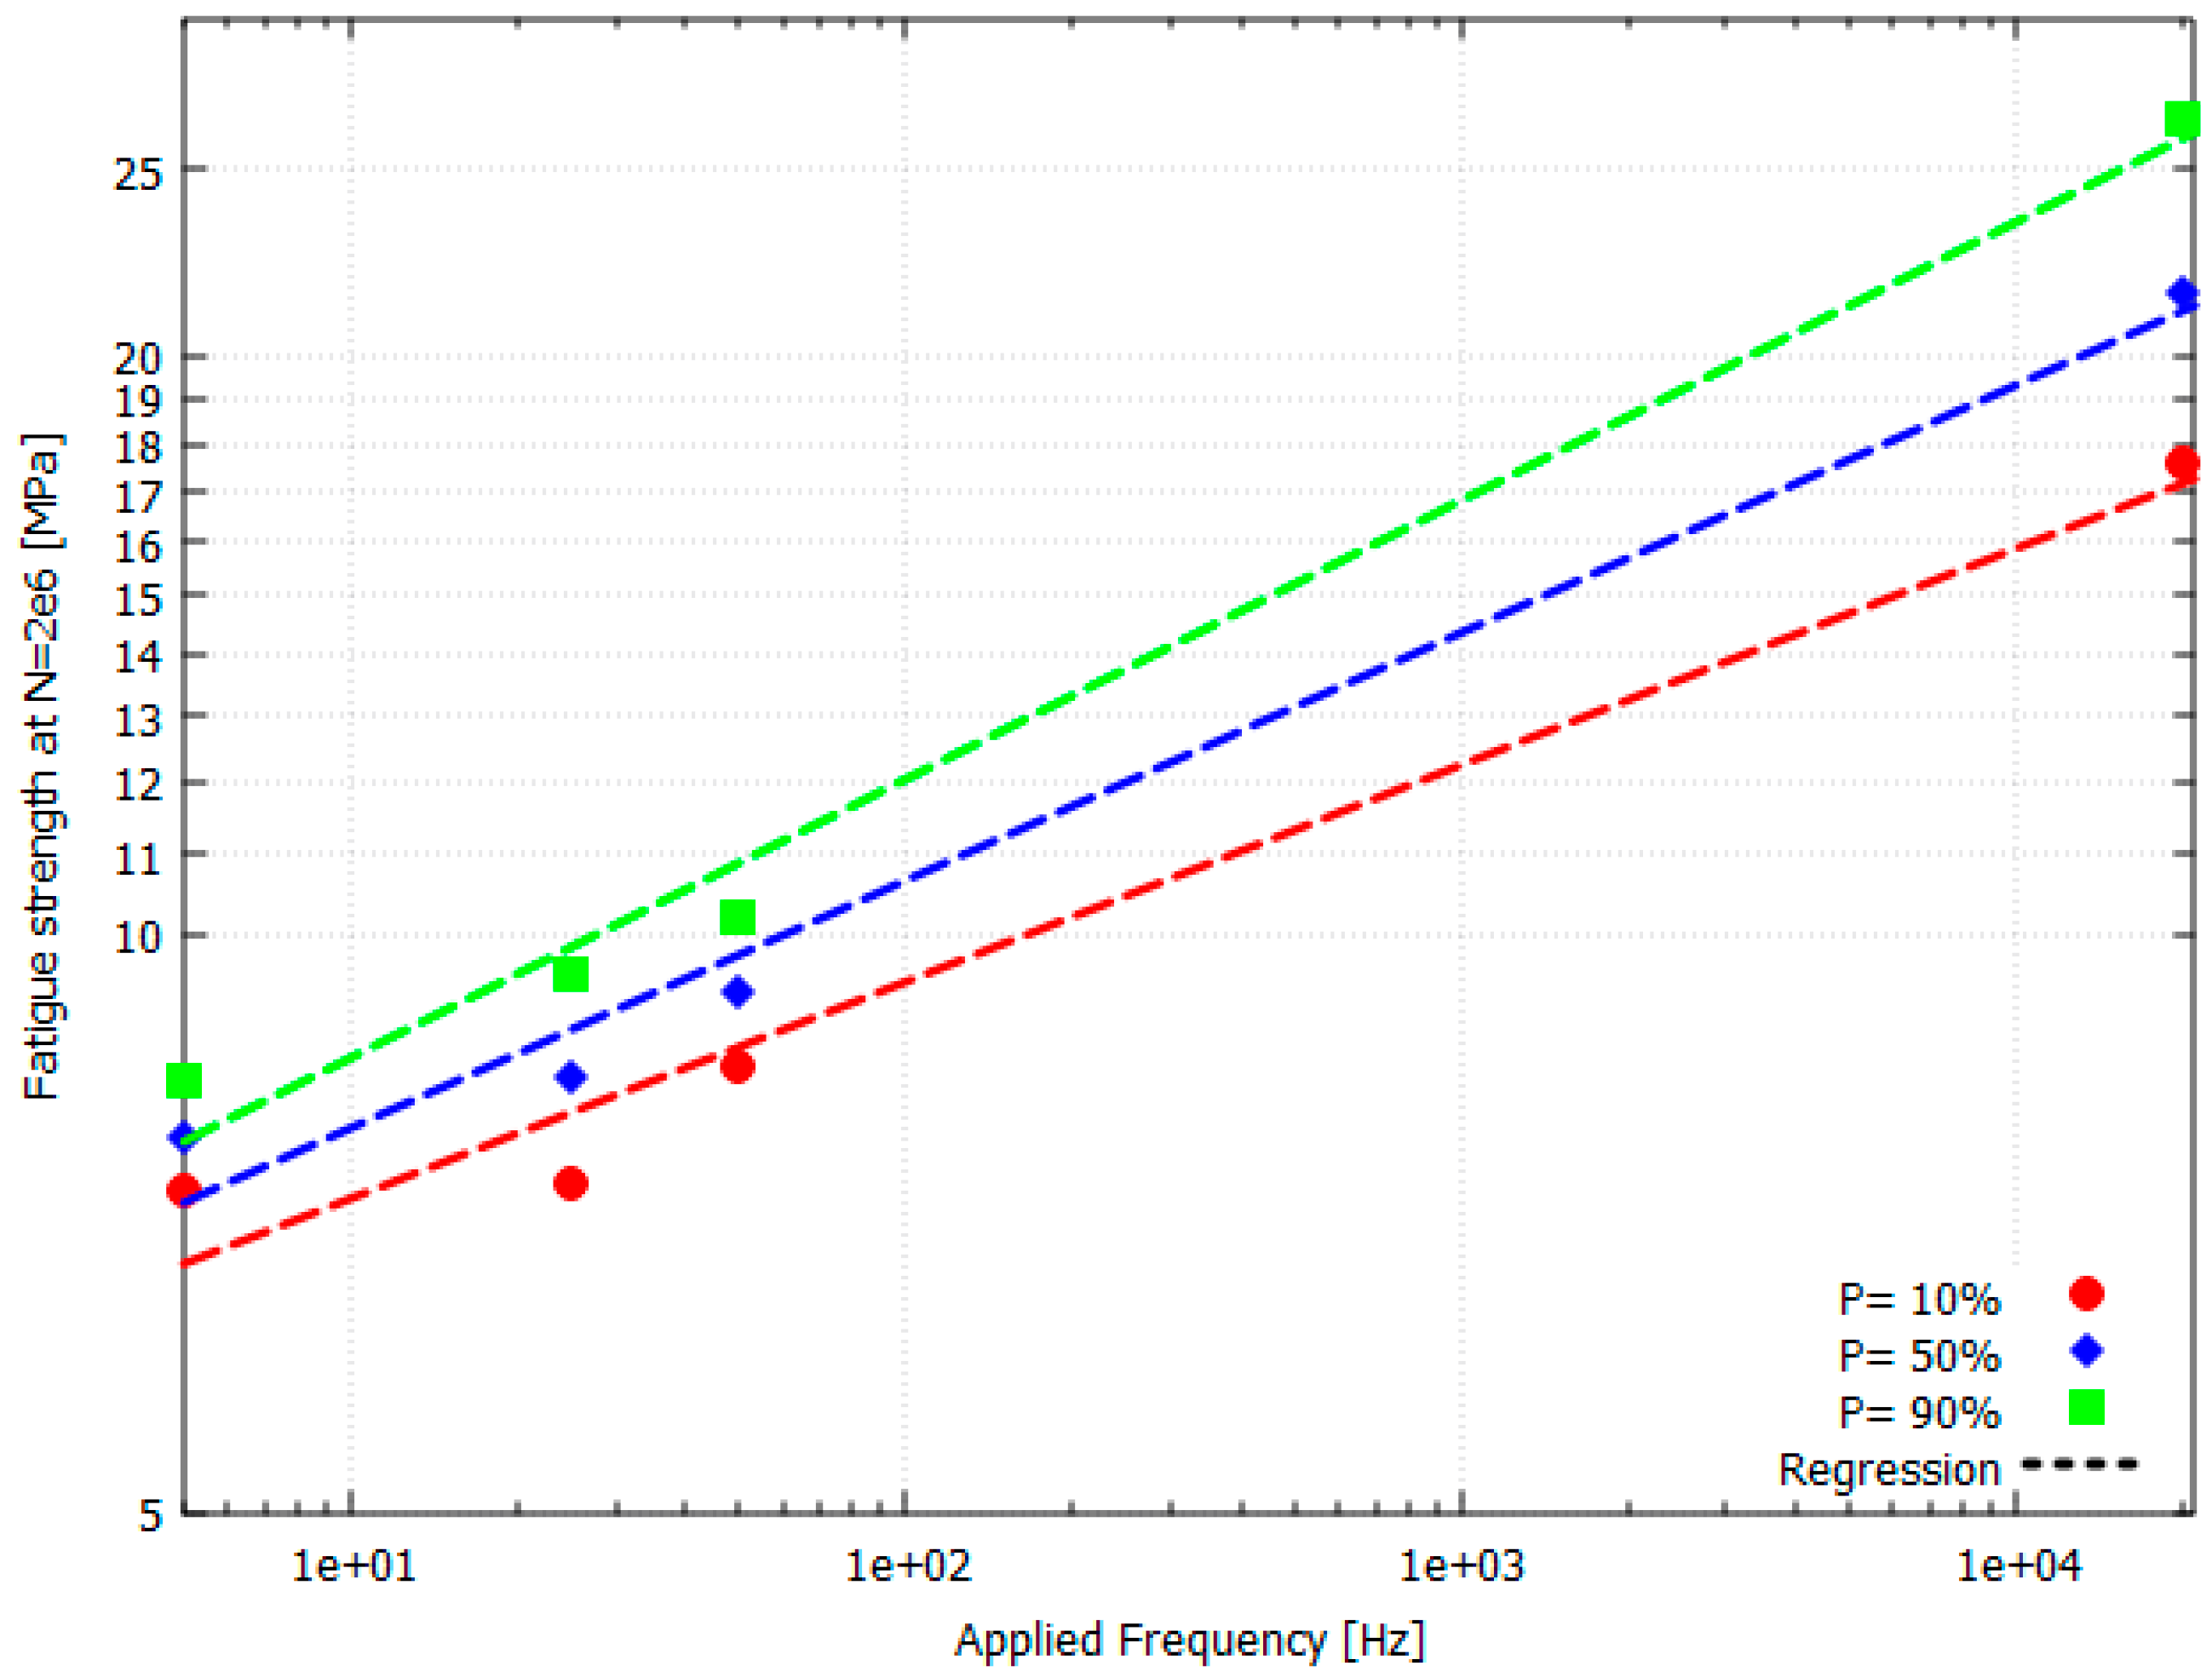
  • Interpolating data at N = 2 × 10⁶ for three probability levels (P = 10, 50, 90%) showed the possibility of strength prediction.

Author Contributions

D.P. (Davide Pederbelli): Conceptualization, Methodology, Formal analysis, Investigation, Software, Writing—Original Draft, Visualization; L.G.: Supervision—Review and Editing, Project administration, Funding acquisition; D.P. (Davide Paolino): Supervision, Writing—Review and Editing, Project administration, Funding acquisition; M.R.: Supervision, Writing—Review and Editing; A.T.: Formal analysis, Writing—Review and Editing. All authors have read and agreed to the published version of the manuscript.

Funding

This research received no external funding.

Institutional Review Board Statement

Not applicable.

Informed Consent Statement

Not applicable.

Data Availability Statement

The data presented in this study are available on request from the corresponding author. The data are not publicly available due to privacy.

Conflicts of Interest

The authors declare no conflict of interest.

Nomenclature

E Modulus of elasticity
f Y Probability density function of the fatigue life
F Y Cumulative distribution function of the fatigue life
F Y | x Conditional distribution of fatigue life
L · Maximum likelihood function
n f Number of failures
n r Number of run-outs
R Tension–compression loading ratio
r Radial coordinate
BCsBoundary conditions
FEFinite element
FRAFrequency response analysis
MLMaximum likelihood
PIDProportional–integrative–derivative
SDStandard deviation
UFTMUltrasonic fatigue testing machine
VViscosity
VHCFVery high cycle fatigue
α ,   β Dundurs parameters
θ Local material angle
μ Shear modulus
μ Y Mean stress distribution
ν Poisson’s ratio
ρ Density
σ Stress vector
σ u t s Ultimate tensile strength

References

  1. Decker, M. Vibration fatigue analysis using response spectra. Int. J. Fatigue 2021, 148, 106192. [Google Scholar] [CrossRef]
  2. Li, F.; Wu, H.; Wu, P. Vibration fatigue dynamic stress simulation under non-stationary state. Mech. Syst. Signal Process. 2021, 146, 107006. [Google Scholar] [CrossRef]
  3. Sui, G.; Zhang, Y. Response spectrum method for fatigue damage assessment of mechanical systems. Int. J. Fatigue 2023, 166, 107278. [Google Scholar] [CrossRef]
  4. ECSS-E-HB-32-26A; Spacecraft Mechanical Loads Analysis Handbook, ECSS Secretariat, Requirements & Standards Division, ESA-ESTEC. ECSS Standard: Noordwijk, The Netherlands, 2013.
  5. ECSS-E-ST-10-03C; Testing, ECSS Secretariat, Requirements & Standards Division, ESA-ESTEC. ECSS Standard: Noordwijk, The Netherlands, 2020.
  6. ECSS-E-ST-32-01C; Fracture Control, ECSS Secretariat, Requirements & Standards Division, ESA-ESTEC. ECSS Standard: Noordwijk, The Netherlands, 2021.
  7. Tahmasbi, K.; Alharthi, F.; Webster, G.; Haghshenas, M. Dynamic frequency-dependent fatigue damage in metals: A state-of-the-art review. Forces Mech. 2023, 10, 100167. [Google Scholar] [CrossRef]
  8. Jia, Z.; Hui, D.; Yuan, G.; Lair, J.; Lau, K.T.; Xu, F. Mechanical properties of an epoxy-based adhesive under high strain rate loadings at low temperature environment. Compos. Part B 2016, 105, 132–137. [Google Scholar] [CrossRef]
  9. Jia, Z.; Yuan, G.; Hui, D.; Feng, X.; Zou, Y. Effect of high strain rate and low temperature on mode II fracture toughness of ductile adhesive. Int. J. Adhes. Adhes. 2018, 86, 105–112. [Google Scholar] [CrossRef]
  10. Maio, L.; Monaco, E.; Ricci, F.; Lecce, L. Simulation of low velocity impact on composite laminates with progressive failure analysis. Compos. Struct. 2013, 103, 75–85. [Google Scholar] [CrossRef]
  11. Al-Zubaidy, H.; Zhao, X.L.; Al-Mahaidi, R. Mechanical characterisation of the dynamic tensile properties of CFRP sheet and adhesive at medium strain rates. Compos. Struct. 2013, 96, 153–164. [Google Scholar] [CrossRef]
  12. Liu, X.; Shao, X.; Li, Q.; Sun, G. Experimental study on residual properties of carbon fibre reinforced plastic (CFRP) and aluminum single-lap adhesive joints at different strain rates after transverse pre-impact. Compos. Part A 2019, 124, 105372. [Google Scholar] [CrossRef]
  13. Taniguchi, N.; Nishiwaki, T.; Kawada, H. Tensile strength of unidirectional CFRP laminate under high strain rate. Adv. Compos. Mater. 2007, 16, 167–180. [Google Scholar] [CrossRef]
  14. Wang, S.; Liang, W.; Duan, L.; Li, G.; Cui, J. Effects of loading rates on mechanical property and failure behavior of single-lap adhesive joints with carbon fiber reinforced plastics and aluminum alloys. Int. J. Adv. Manuf. Technol. 2020, 106, 2569–2581. [Google Scholar] [CrossRef]
  15. Ma, H.; Bai, X.; Ran, Y.R.; Wei, X.; An, Z. Modeling the Effect of Stress Ratio, Loading Frequency and Fiber Orientation on the Fatigue Response of Composite Materials. Polymers 2022, 14, 2772. [Google Scholar] [CrossRef]
  16. Banea, M.D.; Rosioara, M.; Carbas, R.J.C.; da Silva, L.F.M. Multi-material adhesive joints for automotive industry. Compos. Part B 2018, 151, 71–77. [Google Scholar] [CrossRef]
  17. Antelo, J.; Akhavan-Safar, A.; Carbas, R.J.C.; Marques, E.A.S.; Goyal, R.; da Silva, L.F.M. Replacing welding with adhesive bonding: An industrial case study. Int. J. Adhes. Adhes. 2022, 113, 103064. [Google Scholar] [CrossRef]
  18. Pazand, K.; Nobari, A.S. Investigation of damage effect on the effective dynamic mechanical properties of an adhesive in linear and nonlinear response regimes. J. Vib. Control 2017, 23, 2209–2220. [Google Scholar] [CrossRef]
  19. Kemiklioglu, U.; Baba, B.O. Investigation of mechanical properties and failure surfaces of adhesively bonded composites subjected to vibration loads. Mater. Res. Express 2019, 6, 115309. [Google Scholar] [CrossRef]
  20. Du, Y.; Shi, L. Effect of vibration fatigue on modal properties of single lap adhesive joints. Int. J. Adhes. Adhes. 2014, 53, 72–79. [Google Scholar] [CrossRef]
  21. Kemiklioglu, U.; Baba, B.O. Mechanical response of adhesively bonded composite joints subjected to vibration load and axial impact. Compos. Part B 2019, 176, 107317. [Google Scholar] [CrossRef]
  22. Challita, G. Analytical study of the dynamic behavior of a voided adhesively bonded lap joint under axial harmonic load. Int. J. Solids Struct. 2018, 141, 183–194. [Google Scholar] [CrossRef]
  23. Ramalho, L.D.C.; Sanchez-Arce, J.I.; Goncalves, D.C.; Belinha, J.; Campilho, R.D.S.G. Numerical analysis of the dynamic behaviour of adhesive joints: A review. Int. J. Adhes. Adhes. 2022, 118, 103219. [Google Scholar] [CrossRef]
  24. Yuan, W.; Yang, T.; Yang, G.; Liu, S.; Du, Y.; Liu, C. Enhancing mechanical properties of adhesive laminates joints using ultrasonic vibration-assisted preprocessing. Compos. Struct. 2019, 227, 111325. [Google Scholar] [CrossRef]
  25. Barroso, A.; Marin, J.C.; Mantic, V.; Paris, F. Premature failures in standard test specimens with composite materials induced by stress singularities in adhesive joints. Int. J. Adhes. Adhes. 2020, 97, 102478. [Google Scholar] [CrossRef]
  26. Williams, M.L. Stress Singularities Resulting from Various Boundary Conditions in Angular Corners of Plates in Extension. J. App. Mech. 1952, 19, 526–528. [Google Scholar] [CrossRef]
  27. Bogy, D.B. Edge bonded dissimilar orthogonal elastic wedge under normal and shear loading. J. Appl. Mech. 1968, 35, 460–466. [Google Scholar] [CrossRef]
  28. Bogy, D.B.; Wang, K.C. Stress singularities at interface corners in bonded dissimilar isotropic elastic materials. Int. J. Solid Struct. 1971, 7, 993–1005. [Google Scholar] [CrossRef]
  29. Bogy, D.B. Two Edge-Bonded Elastic Wedges of Different Materials and Wedge Angles Under Surface Tractions. J. Appl. Mech. 1971, 38, 377–386. [Google Scholar] [CrossRef]
  30. Groth, H.L. Stress singularities and fracture at interface corners in bonded joints. Int. J. Adhes. Adhes. 1988, 8, 107–113. [Google Scholar] [CrossRef]
  31. Kelly, P.A.; Hills, D.A.; Nowell, D. The Design of Joints Between Elastically Dissimilar Components. J. Strain Anal. 1992, 27, 15–20. [Google Scholar] [CrossRef]
  32. Wang, C.H.; Rose, L.R.F. Compact solutions for the corner singularity in bonded joints. Int. J. Adhes. Adhes. 2000, 20, 145–154. [Google Scholar] [CrossRef]
  33. Lazzarin, P.; Quaresimin, M.; Ferro, P. A two-term stress function approach to evaluate stress distribution in bonded joints of different geometries. J. Strain Anal. Eng. Des. 2002, 37, 385. [Google Scholar] [CrossRef]
  34. Goglio, L.; Rossetto, M. Evaluation of the Singular Stresses in Adhesive Joints. J. Adhes. Sci. Technol. 2009, 23, 1441–1457. [Google Scholar] [CrossRef]
  35. Sinclair, G.B. On ensuring structural integrity for configurations with stress singularities: A review. Fatigue Fract. Eng. Mater. Struct. 2016, 39, 523–535. [Google Scholar] [CrossRef]
  36. Breto, R.; Chiminelli, A.; Lizaranzu, M.; Rodriguez, R. Study of the singular term in mixed adhesive joints. Int. J. Adhes. Adhes. 2017, 76, 11–16. [Google Scholar] [CrossRef]
  37. Galvez, P.; Noda, N.A.; Takaki, R.; Sano, Y.; Abenojar, J.; Martinez, M.A. Intensity of singular stress field variation as a function of the Young’s modulus in single lap adhesive joints. Int. J. Adhes. Adhes. 2019, 95, 102418. [Google Scholar] [CrossRef]
  38. Thouless, M.D.; Goutianos, S. Cohesive-zone models and singularities at corners and cracks in homogeneous materials. J. Mech. Phys. Solids 2023, 171, 105159. [Google Scholar] [CrossRef]
  39. Wu, Z. Design free of stress singularities for bi-material components. Compos. Struct. 2004, 65, 339–345. [Google Scholar] [CrossRef]
  40. Wu, Z. Stress concentration analyses of bi-material bonded joints without in-plane stress singularities. Int. J. Mech. Sci. 2008, 50, 641–648. [Google Scholar] [CrossRef]
  41. Xia, Z.; Chowdhuri, M.A.A.K.K.; Ju, F. A New Test Method for the Measurement of Normal-Shear Bonding Strength at Bi-Material Interface. Mech. Adv. Mater. Struct. 2015, 20, 571–579. [Google Scholar] [CrossRef]
  42. Barroso, A.; Lauke, B.; Mantic, V.; Paris, F. Tensile and shear strength of bimaterial interfaces within composite materials. Compos. Sci. Technol. 2016, 124, 81–88. [Google Scholar] [CrossRef]
  43. Pederbelli, D.; Tridello, A.; Paolino, D.S.; Goglio, L. Effects of singular and non-singular stress fields on Very High Cycle Fatigue life of adhesive joints. Fatigue Fract. Eng. Mater. Struct. 2023, 1–16. [Google Scholar] [CrossRef]
  44. Bathias, C.; Paris, P.C. Gigacycle Fatigue in Mechanical Practice; CRC Dekker: Boca Raton, FL, USA, 2005. [Google Scholar]
  45. Bathias, C. There is no infinite fatigue life in metallic materials. Fatigue Fract. Eng. Mater. Struct. 1999, 22, 559–565. [Google Scholar] [CrossRef]
  46. Lia, X.; Xiang, O.; Pei, H.Y.; Wei, S. High-cycle and very-high-cycle fatigue behaviour of a stainless steel for air-conditioning compressor valve plates. Int. J. Struct. Integr. 2022, 13, 185–195. [Google Scholar]
  47. Tridello, A.; Paolino, D.S.; Chiandussi, G.; Rossetto, M. VHCF response of H13 steels produced with different manufacturing processes. Procedia Eng. 2016, 160, 93–100. [Google Scholar] [CrossRef]
  48. Tridello, A.; Paolino, D.S.; Rossetto, M. Ultrasonic VHCF Tests on Very Large Specimens with Risk-Volume Up to 5000 mm3. App. Sci. 2020, 10, 2210. [Google Scholar] [CrossRef]
  49. Tridello, A.; Ciardiello, R.; Paolino, D.S.; Goglio, L. Fatigue response up to 109 cycles of a structural epoxy adhesive. Fatigue Fract. Eng. Mater. Struct. 2020, 43, 1555–1566. [Google Scholar] [CrossRef]
  50. Tridello, A.; Paolino, D.S.; Chiandussi, G.; Goglio, L. An innovative testing technique for assessing the VHCF response of adhesively bonded joints. Fatigue Fract. Eng. Mater. Struct. 2019, 42, 84–96. [Google Scholar] [CrossRef]
  51. Tridello, A.; Boursier Niutta, C.; Berto, F.; Paolino, D.S. Size-effect in Very High Cycle Fatigue: A review. Int. J. Fatigue 2021, 153, 106462. [Google Scholar] [CrossRef]
  52. Mevada, H.; Patel, D. Experimental determination of structural damping of different materials. Procedia Eng. 2016, 144, 110–115. [Google Scholar] [CrossRef]
  53. ASTM E8-21; Standard Test Methods for Tension Testing of Metallic Materials. American Association State, Highway and Transportation Officials Standard: Washington, DC, USA, 2021.
  54. BS EN ISO 527-2-2012; Plastics—Determination of Tensile Properties, Part 2. CEN. European Committee for Standardization: Brussels, Belgium, 2012.
  55. SikaPower®-1277, Product Data Sheet. Version 04.01 (04-2022). Available online: https://industry.sika.com/content/dam/dms/gb01/7/sikapower_-1277.pdf (accessed on 15 October 2023).
  56. Takaki, R.; Noda, N.A.; Sano, Y.; Takase, Y.; Suzuki, Y.; Chao, C.K. Fractographic identification of fracture origin mainly controlled by the intensity of singular stress field (ISSF) in prismatic butt joint with corner fillet. Int. J. Adhes. Adhes. 2021, 106, 102810. [Google Scholar] [CrossRef]
  57. Ransom, J.B.; Knight, N.F. Global/Local Stress Analysis of Composite Panels. Comp. Struct. 1990, 37, 375–395. [Google Scholar] [CrossRef]
  58. Craig, R.R., Jr.; Kurdila, A.J. Fundamentals of Structural Dynamics; John Wiley & Sons: Hoboken, NJ, USA, 2006. [Google Scholar]
  59. ANSYS Mechanical APDL. Advanced Analysis Guide, Chapter 6; ANSYS Inc.: Canonsburg, PA, USA, 2020. [Google Scholar]
  60. Paolino, D.S.; Chiandussi, G.; Rossetto, M. A unified statistical model for S-N fatigue curves: Probabilistic definition. Fatigue Fract. Eng. Mater. Struct. 2012, 36, 187–201. [Google Scholar] [CrossRef]
  61. Paolino, D.S.; Tridello, A.; Chiandussi, G.; Rossetto, M. Statistical distributions of Transition Fatigue Strength and Transition Fatigue Life in duplex S–N fatigue curves. Theor. Appl. Fract. Mech. 2015, 80, 31–39. [Google Scholar] [CrossRef]
Figure 1. The UFTM equipment [43].
Applsci 13 12967 g001
Figure 2. Local material wedge.
Applsci 13 12967 g002
Figure 3. Adhesive – adherend solution avoiding the stress singularity.
Applsci 13 12967 g003
Figure 4. VHCF specimen—Global model [40].
Applsci 13 12967 g004
Figure 5. Stress distributions resulting from the application of 2.2–18 μm of displacement excitation [43].
Applsci 13 12967 g005
Figure 6. Adopted local model for FE analyses [19].
Applsci 13 12967 g006
Figure 7. Stress maps: (a) VHCF specimen; (b) specimen for low-frequency fatigue tests.
Applsci 13 12967 g007aApplsci 13 12967 g007b
Figure 8. FE stress outcomes: (a) along the adhesive free surface; (b) along the adhesive midline.
Applsci 13 12967 g008
Figure 9. (a) VHCF test configuration [43]; (b) HCF test configuration.
Applsci 13 12967 g009
Figure 10. S–N data from VHCF and HCF experiments.
Applsci 13 12967 g010
Figure 11. S–N curves at P = 50% for VHCF and HCF data.
Applsci 13 12967 g011
Figure 12. Strength distributions for 10%, 50%, and 90% probability levels at N = 2 × 10⁶ cycles.
Applsci 13 12967 g012
Table 1. Adopted material properties.
QuantitySymbolUnitsMaterials
Ti-6Al-4VAl. 7075 T6SikaPower®-1277
Modulus of elasticityEMPa115,00071,955 ± 2242280 ± 533
Poisson’s ratio ν /0.340.30.33
Ultimate tensile strength σ u t s MPa950610 ± 1535.7 ± 1.4
Density ρ g/cc4.3952.81.1
Loss factorLF/2.96 × 10−43.5 × 10−32 × 10−2
ViscosityVPa·s//430 (at 20 °C)
Table 2. Obtained solutions from the inverse problem.
Adhesive   Angle   θ 1 [ ° ] Substrate   Angle   θ 2 [ ° ]
Plane StressPlane Strain
10179.6179.6
20179.3179.2
30178.8178.7
40177.9177.5
50175.5171.8
60121.270.28
7061.3551.09
8051.6845.7
9048.1743.5
10046.9742.64
11047.7842.65
12060.6044.83
Table 3. Standard deviations of data processed with ML and optimization.
Failures at 5 HzFailures at 25 HzFailures at 50 HzFailures at 20 kHz
Standard deviation (SD)0.30380.57630.46870.7691
Disclaimer/Publisher’s Note: The statements, opinions and data contained in all publications are solely those of the individual author(s) and contributor(s) and not of MDPI and/or the editor(s). MDPI and/or the editor(s) disclaim responsibility for any injury to people or property resulting from any ideas, methods, instructions or products referred to in the content.

