
Experimental Study on the Effect of Bonding Area Dimensions on the Mechanical Behavior of Composite Single-Lap Joint with Epoxy and Polyurethane Adhesives


Abstract
:1. Introduction
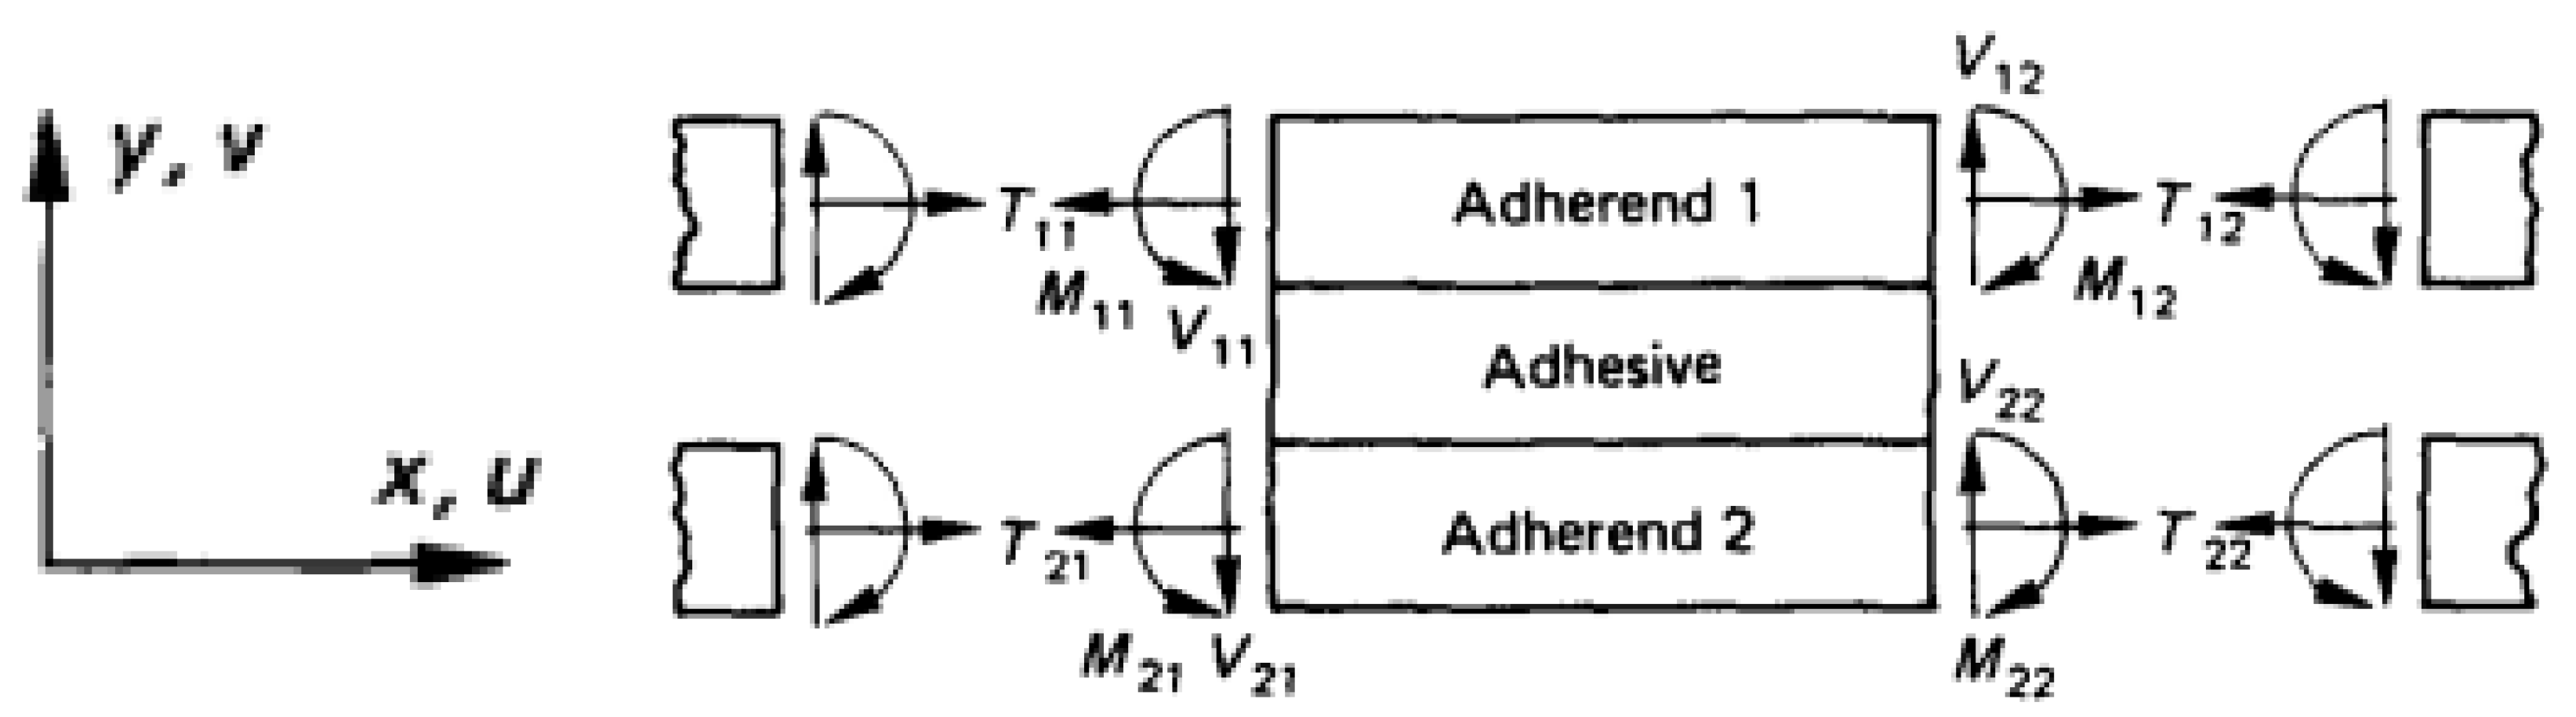
2. Elastic Analysis of the Adhesives
3. Materials and Specimen Manufacturing
3.1. Materials
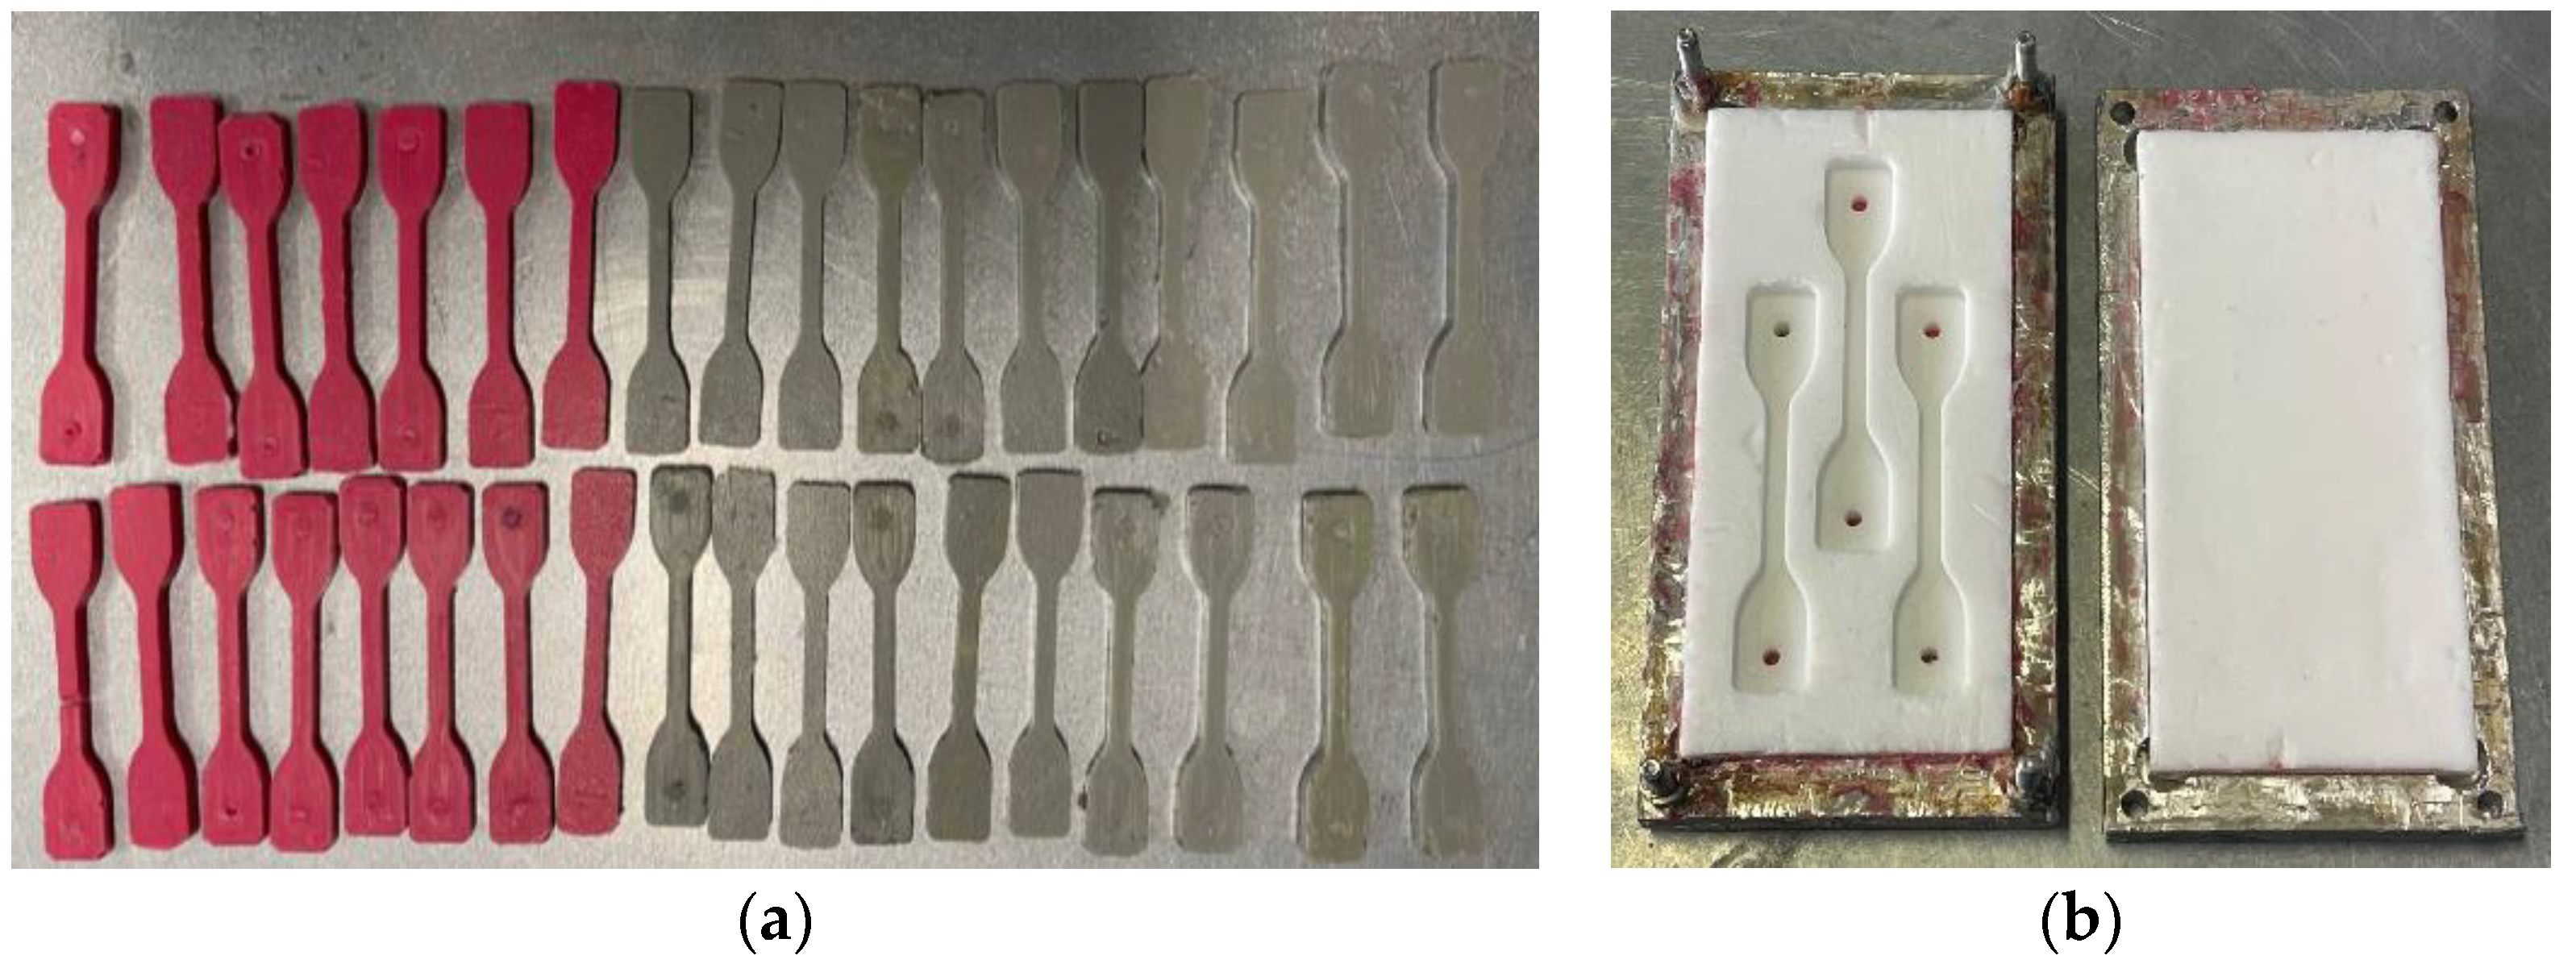
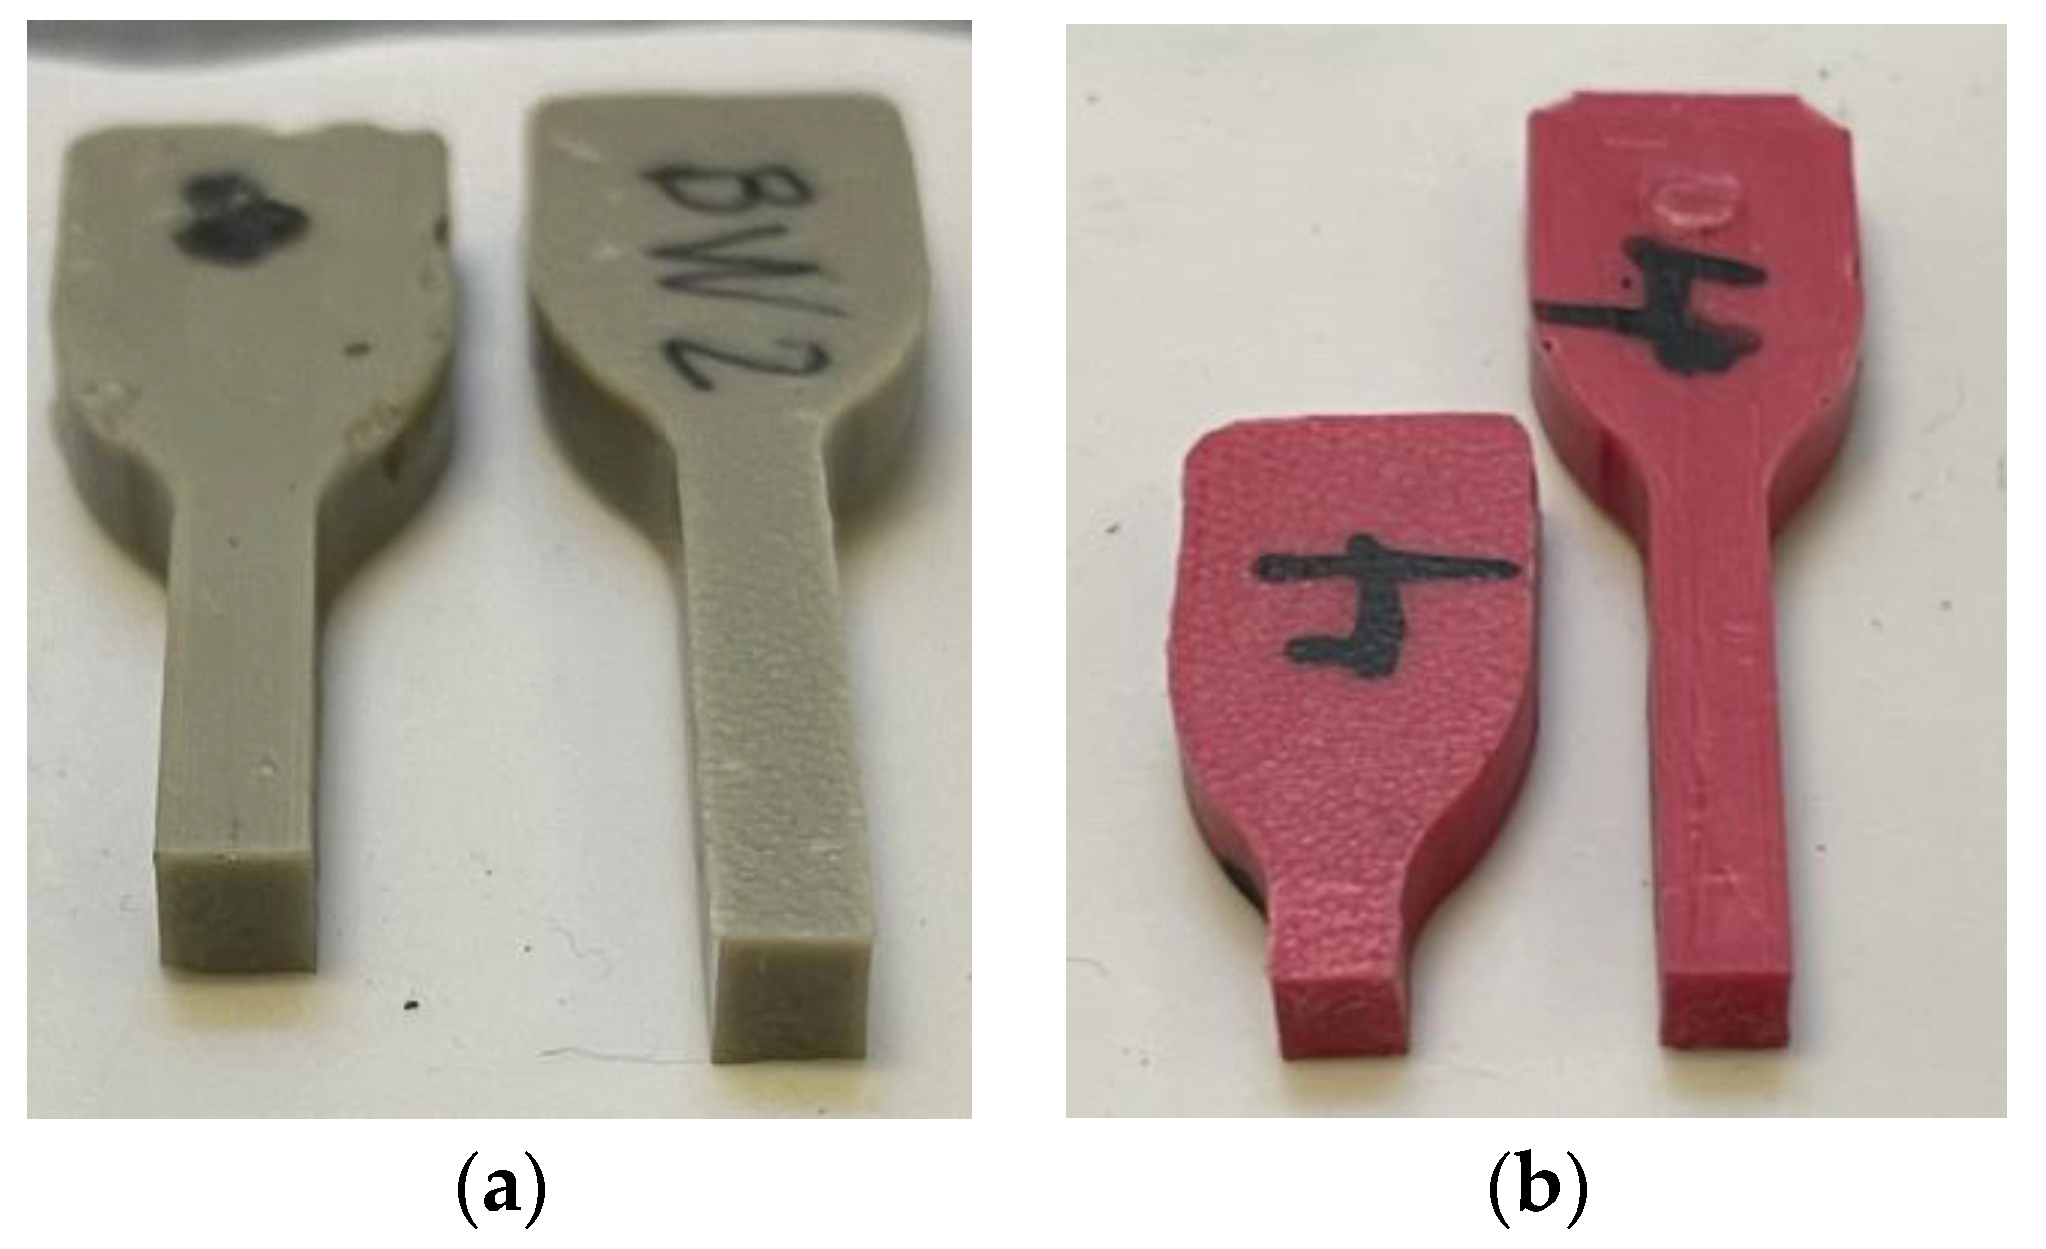
3.1.1. Bulk Adhesive and Tensile Test
3.1.2. Substrates
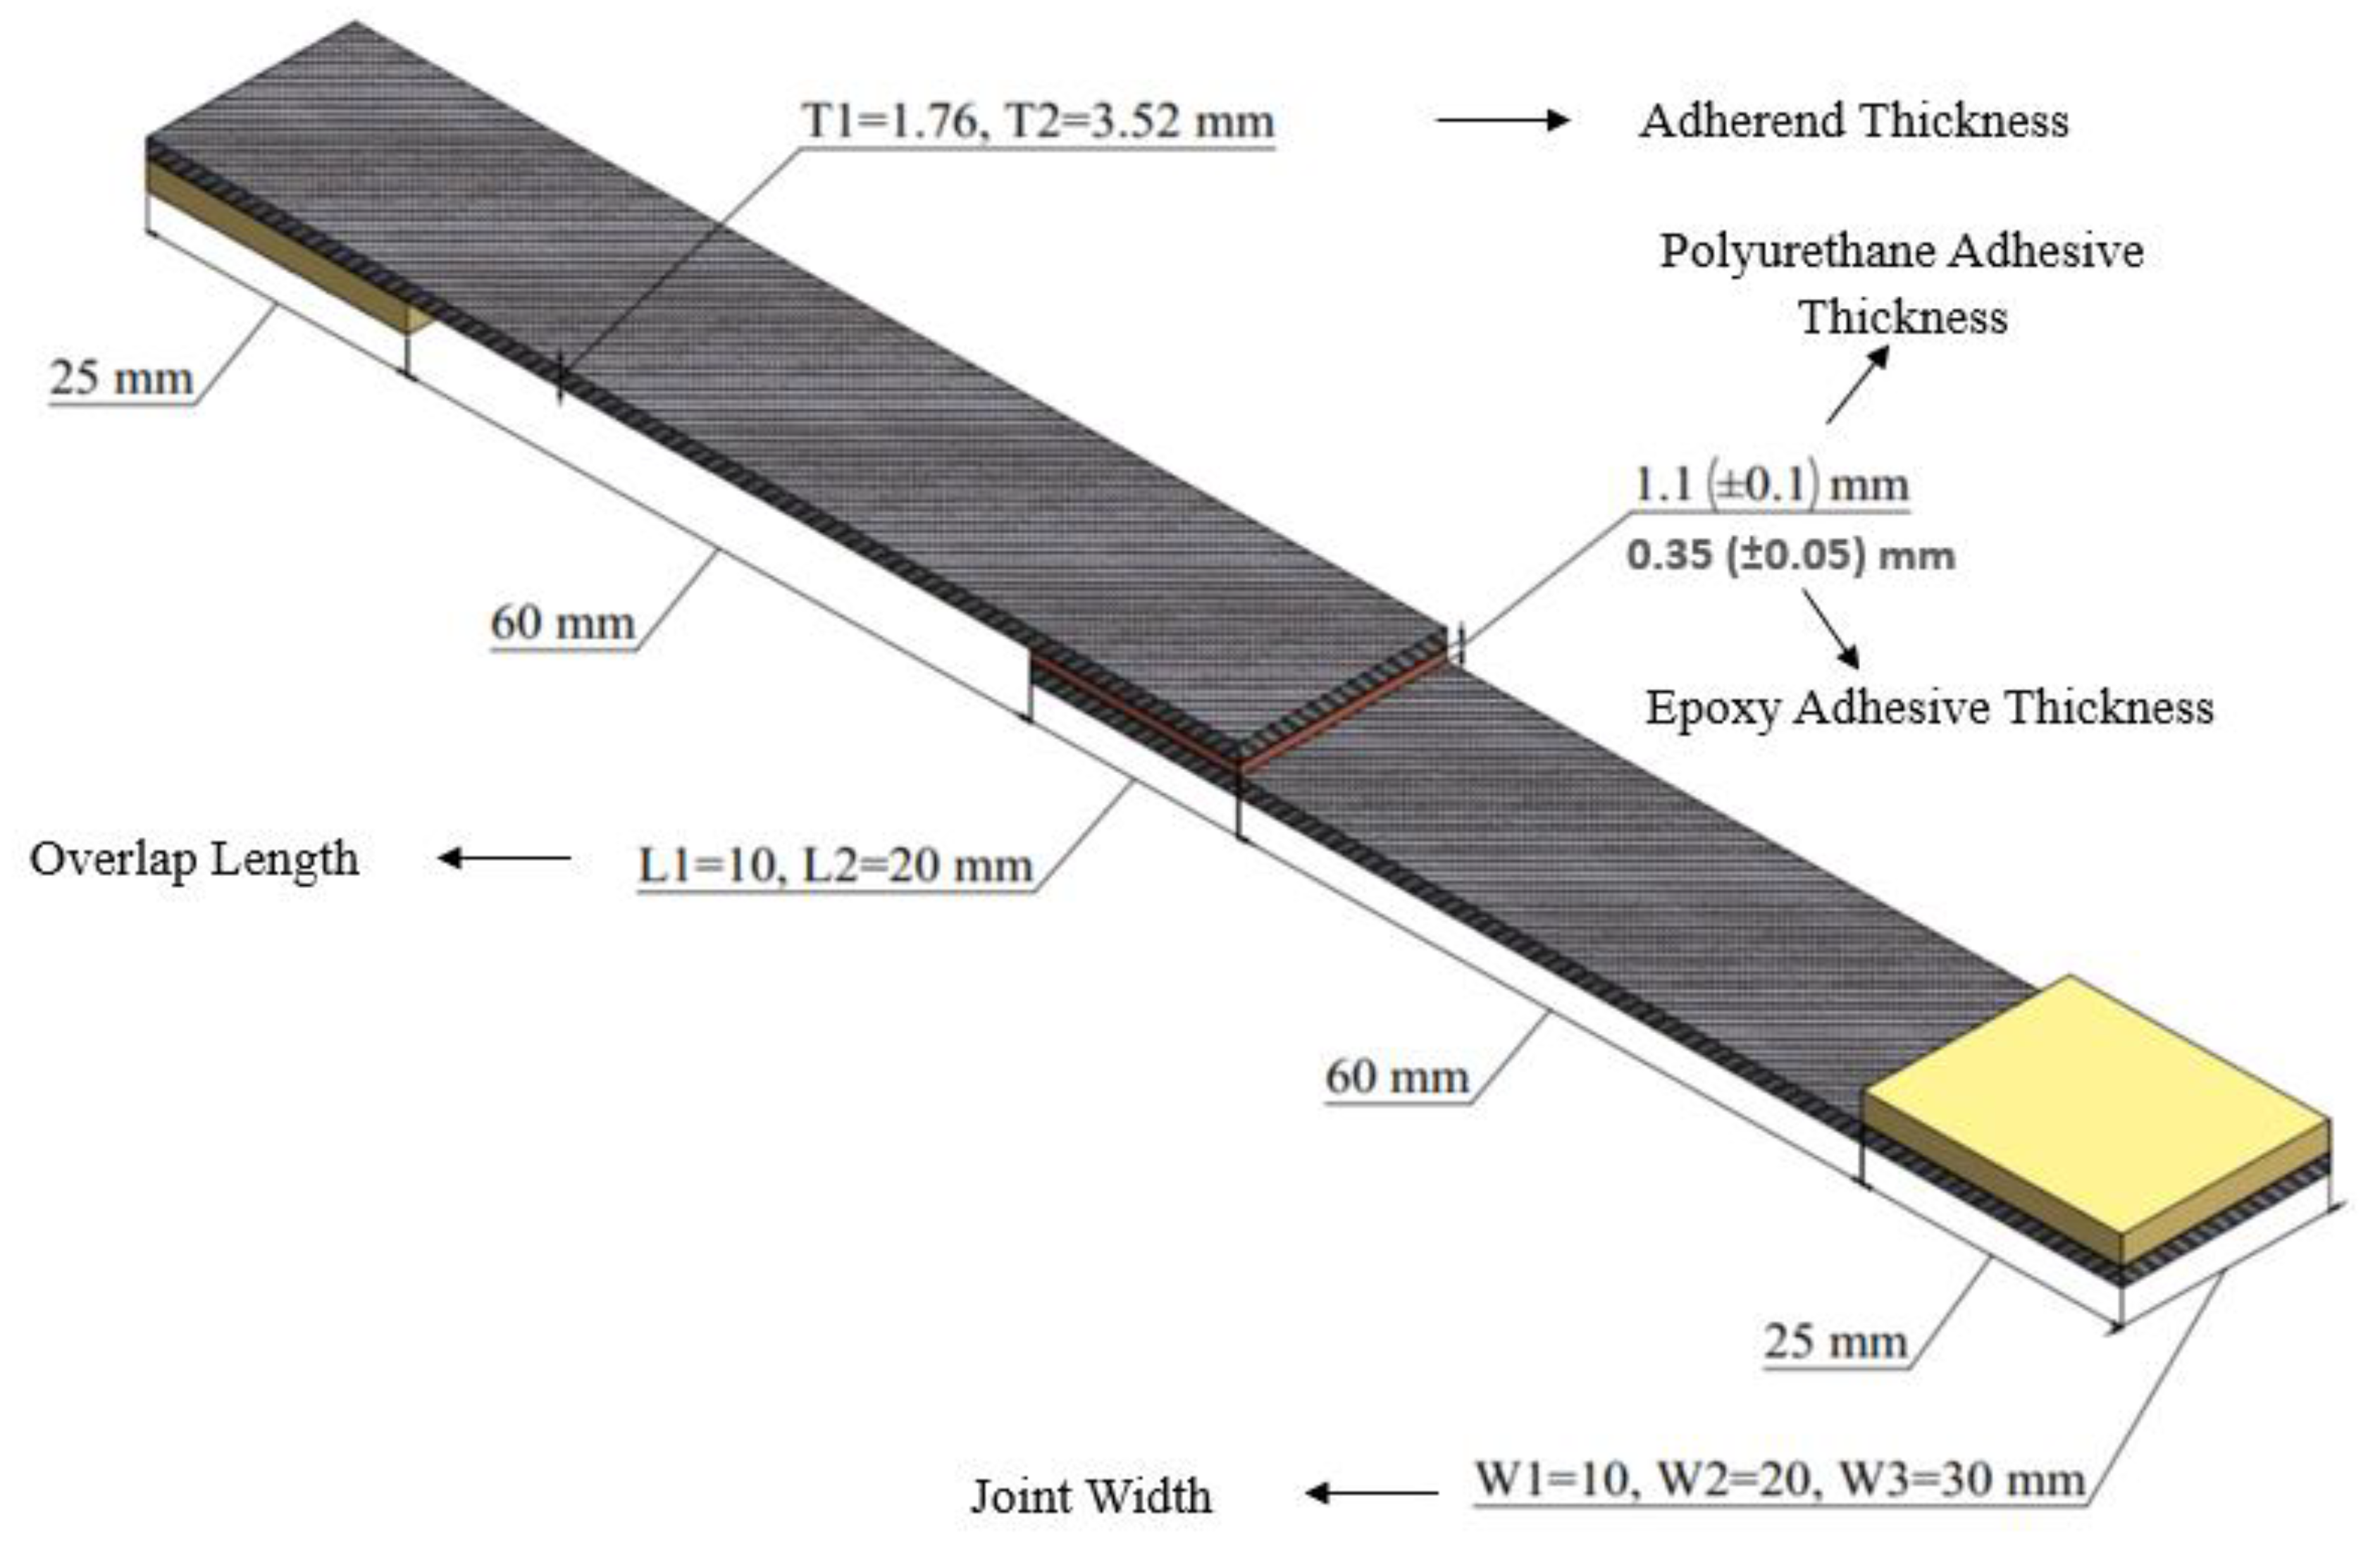
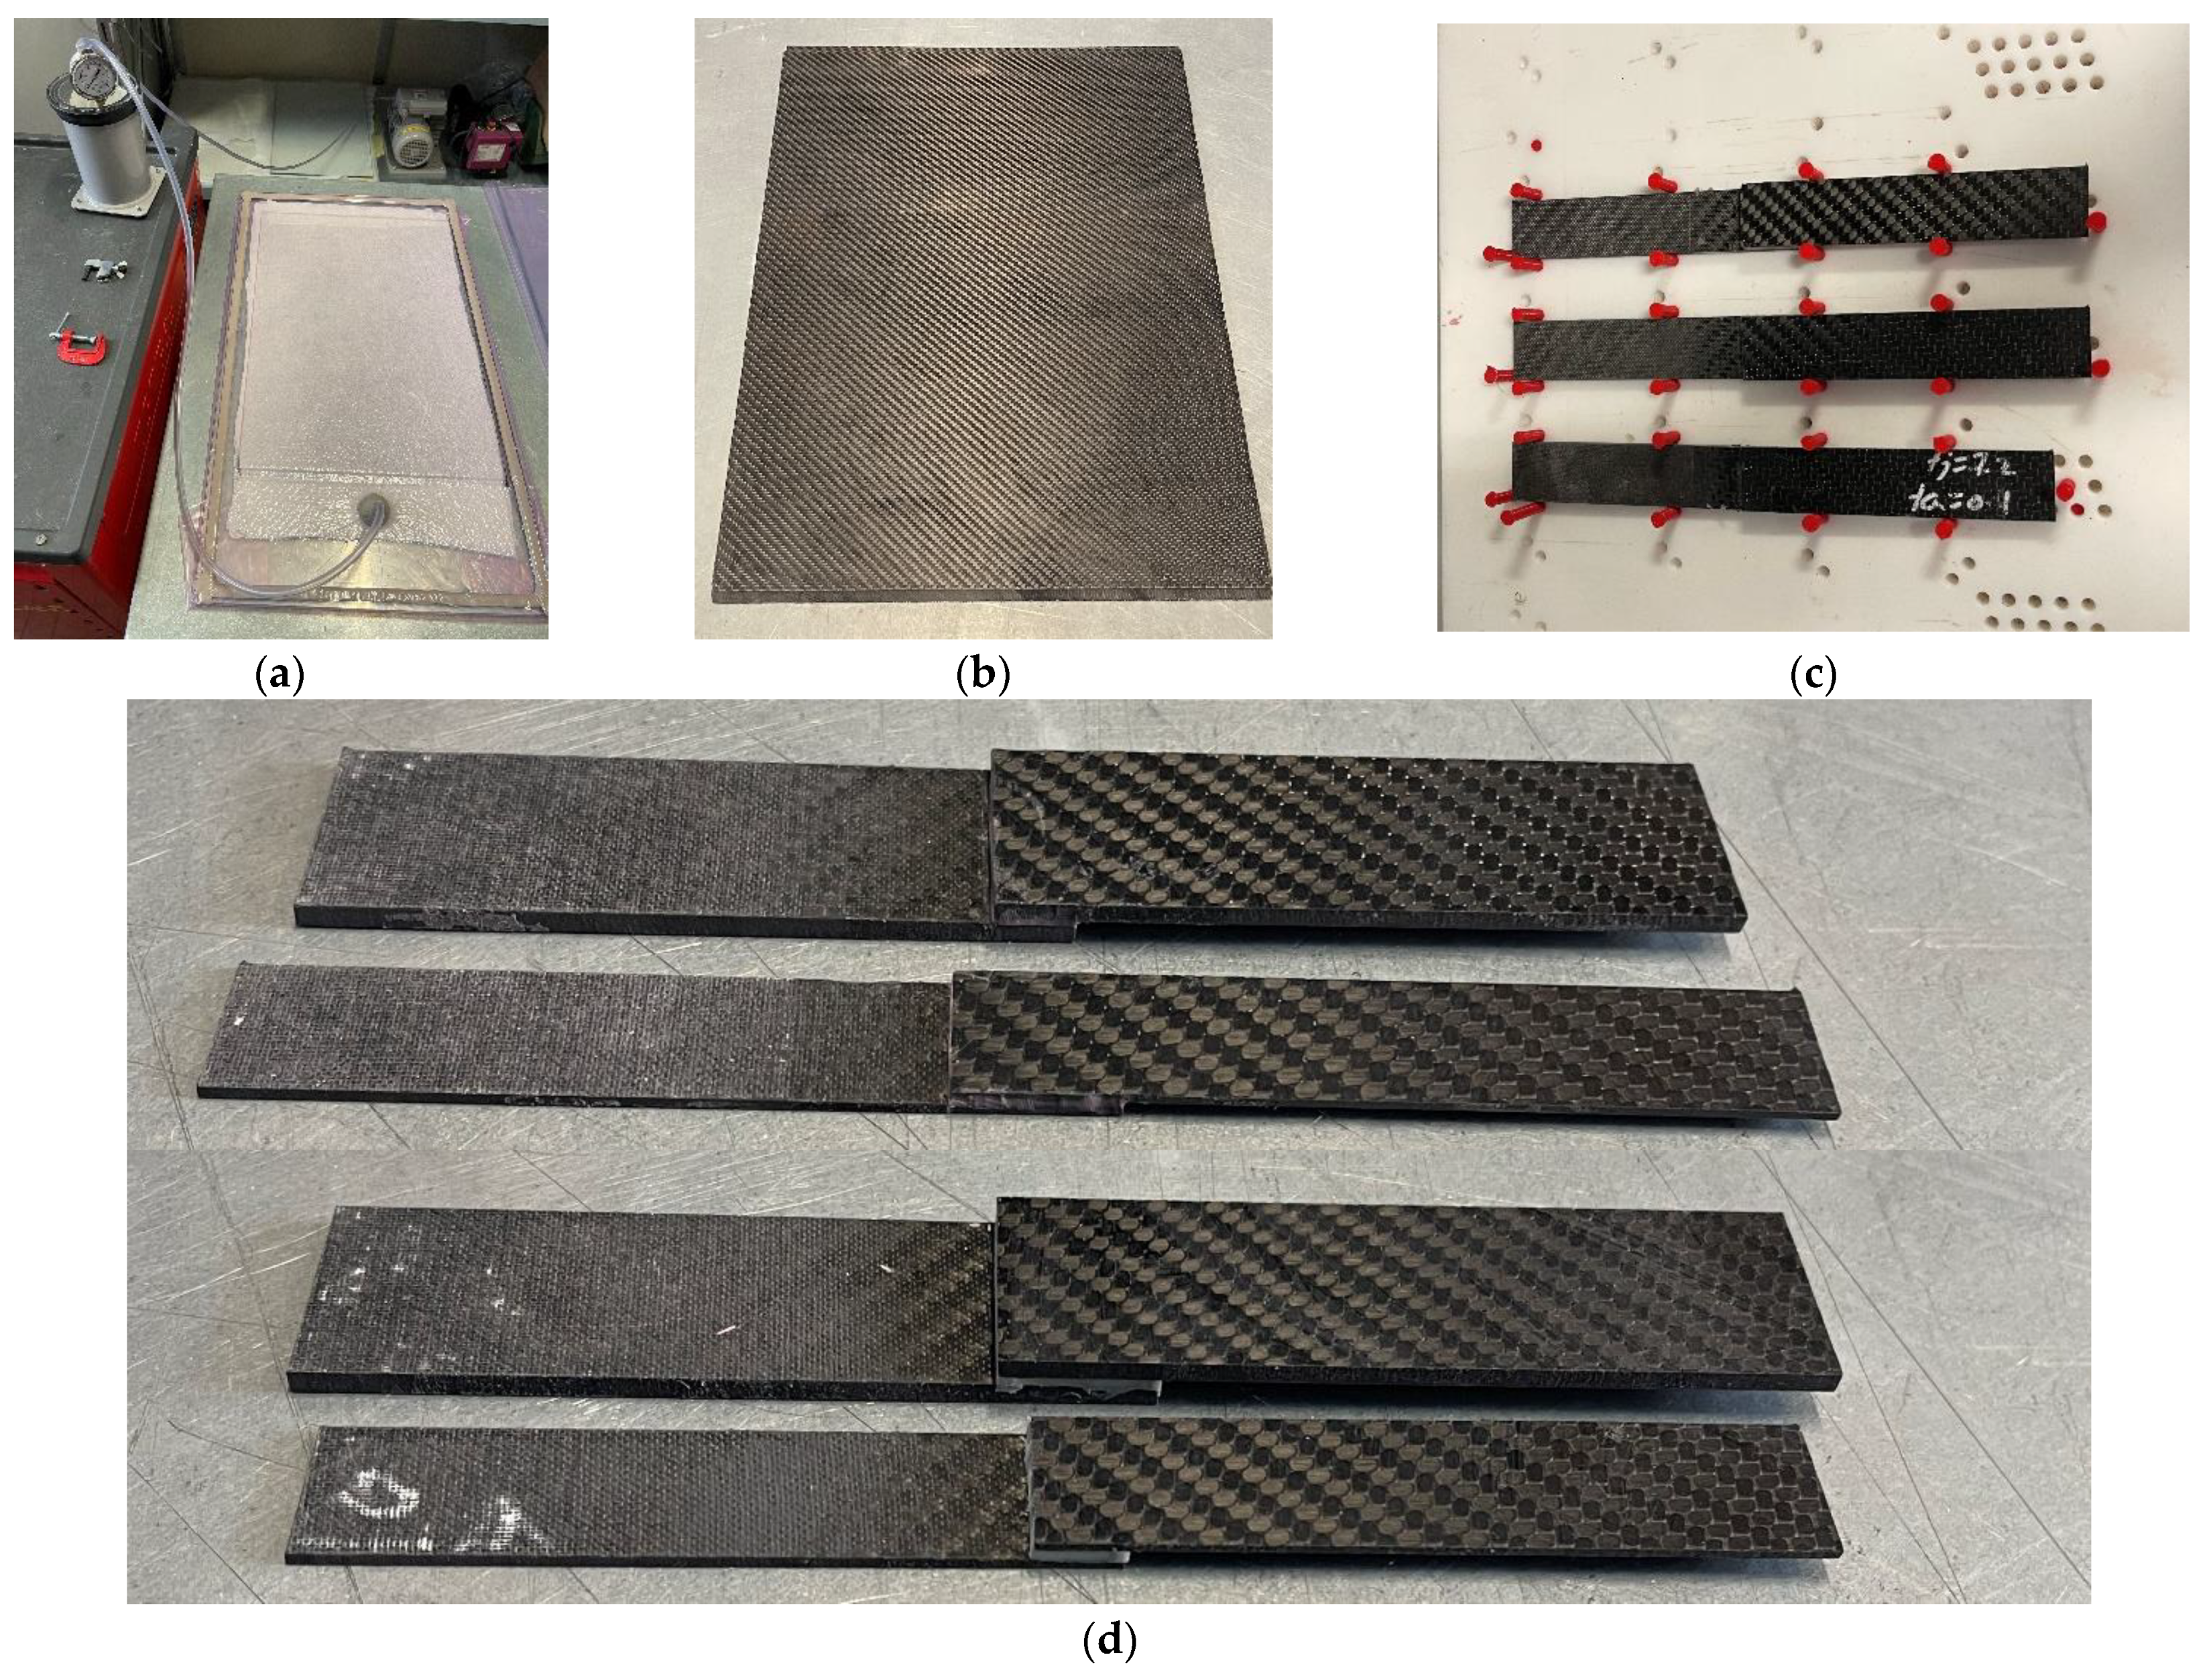
3.2. SLJ Specimen Manufacturing and Testing Activity
4. Result and Discussion
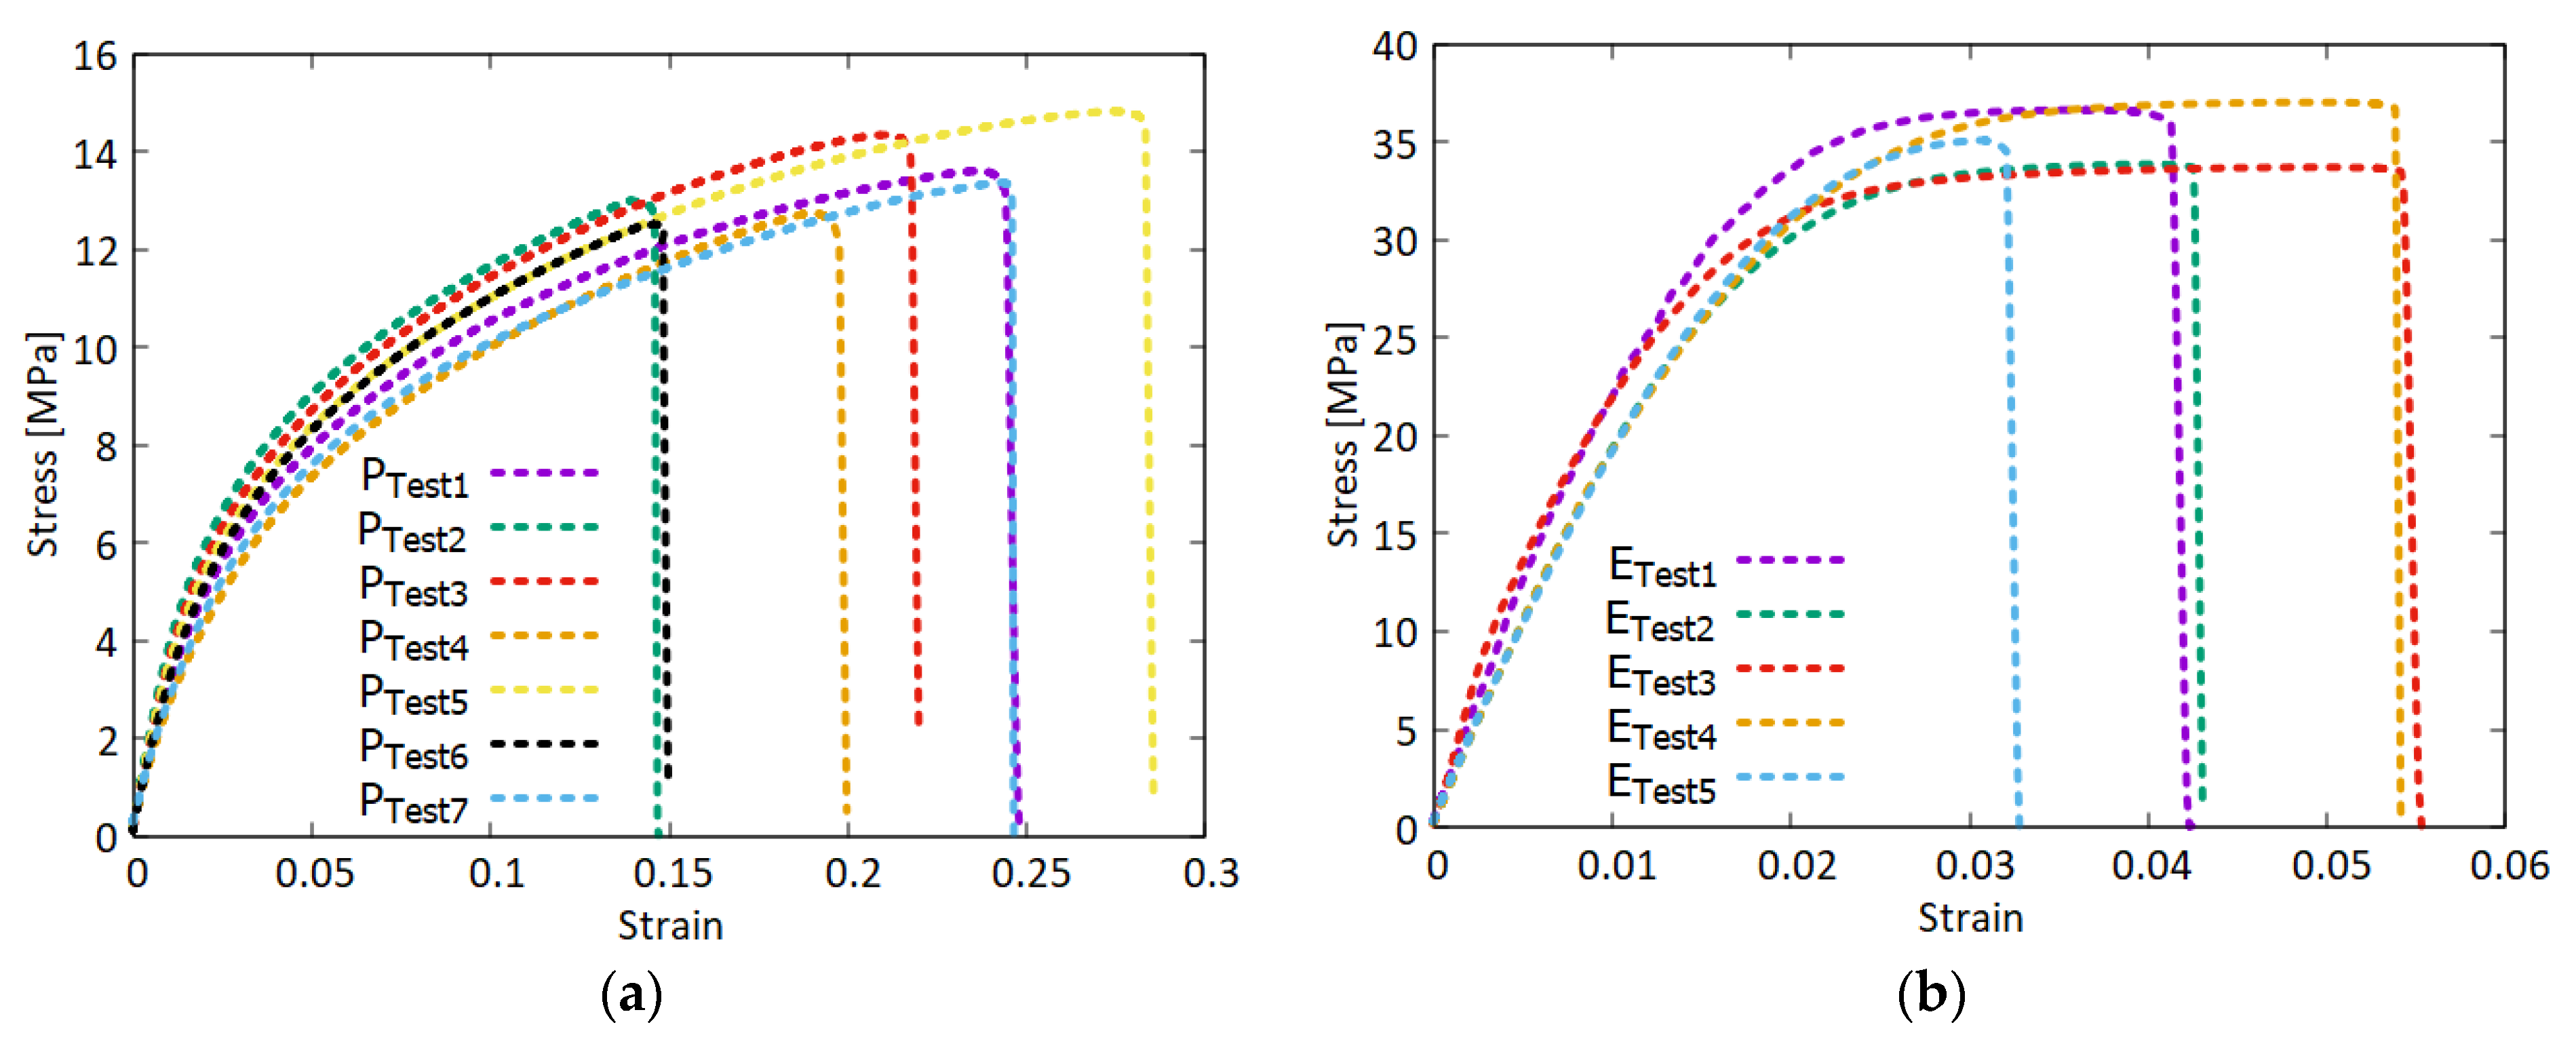
4.1. Tensile Tests on Dogbone Specimens
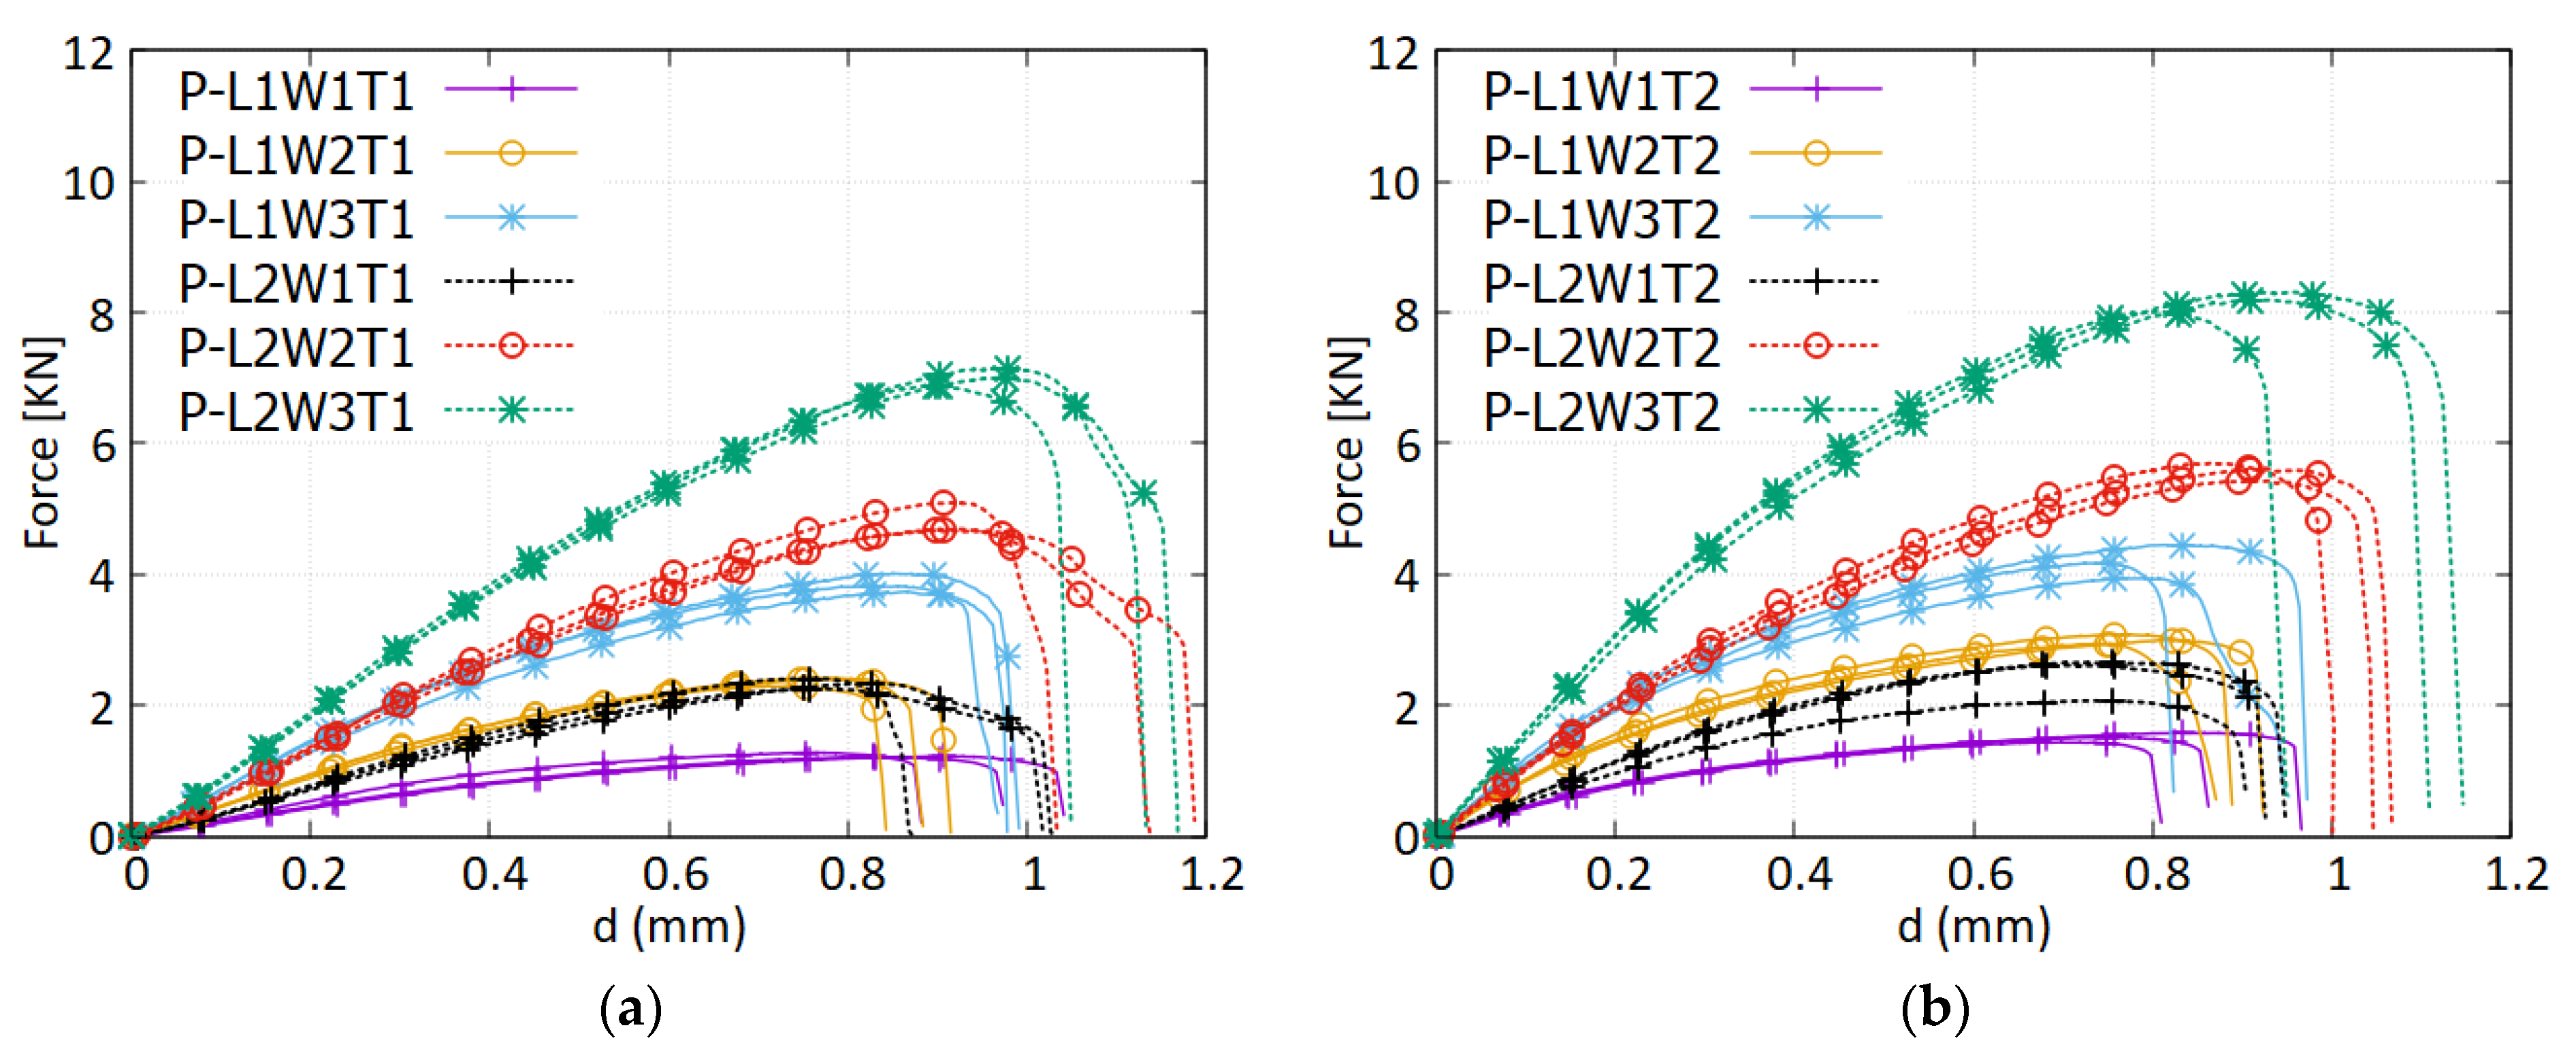
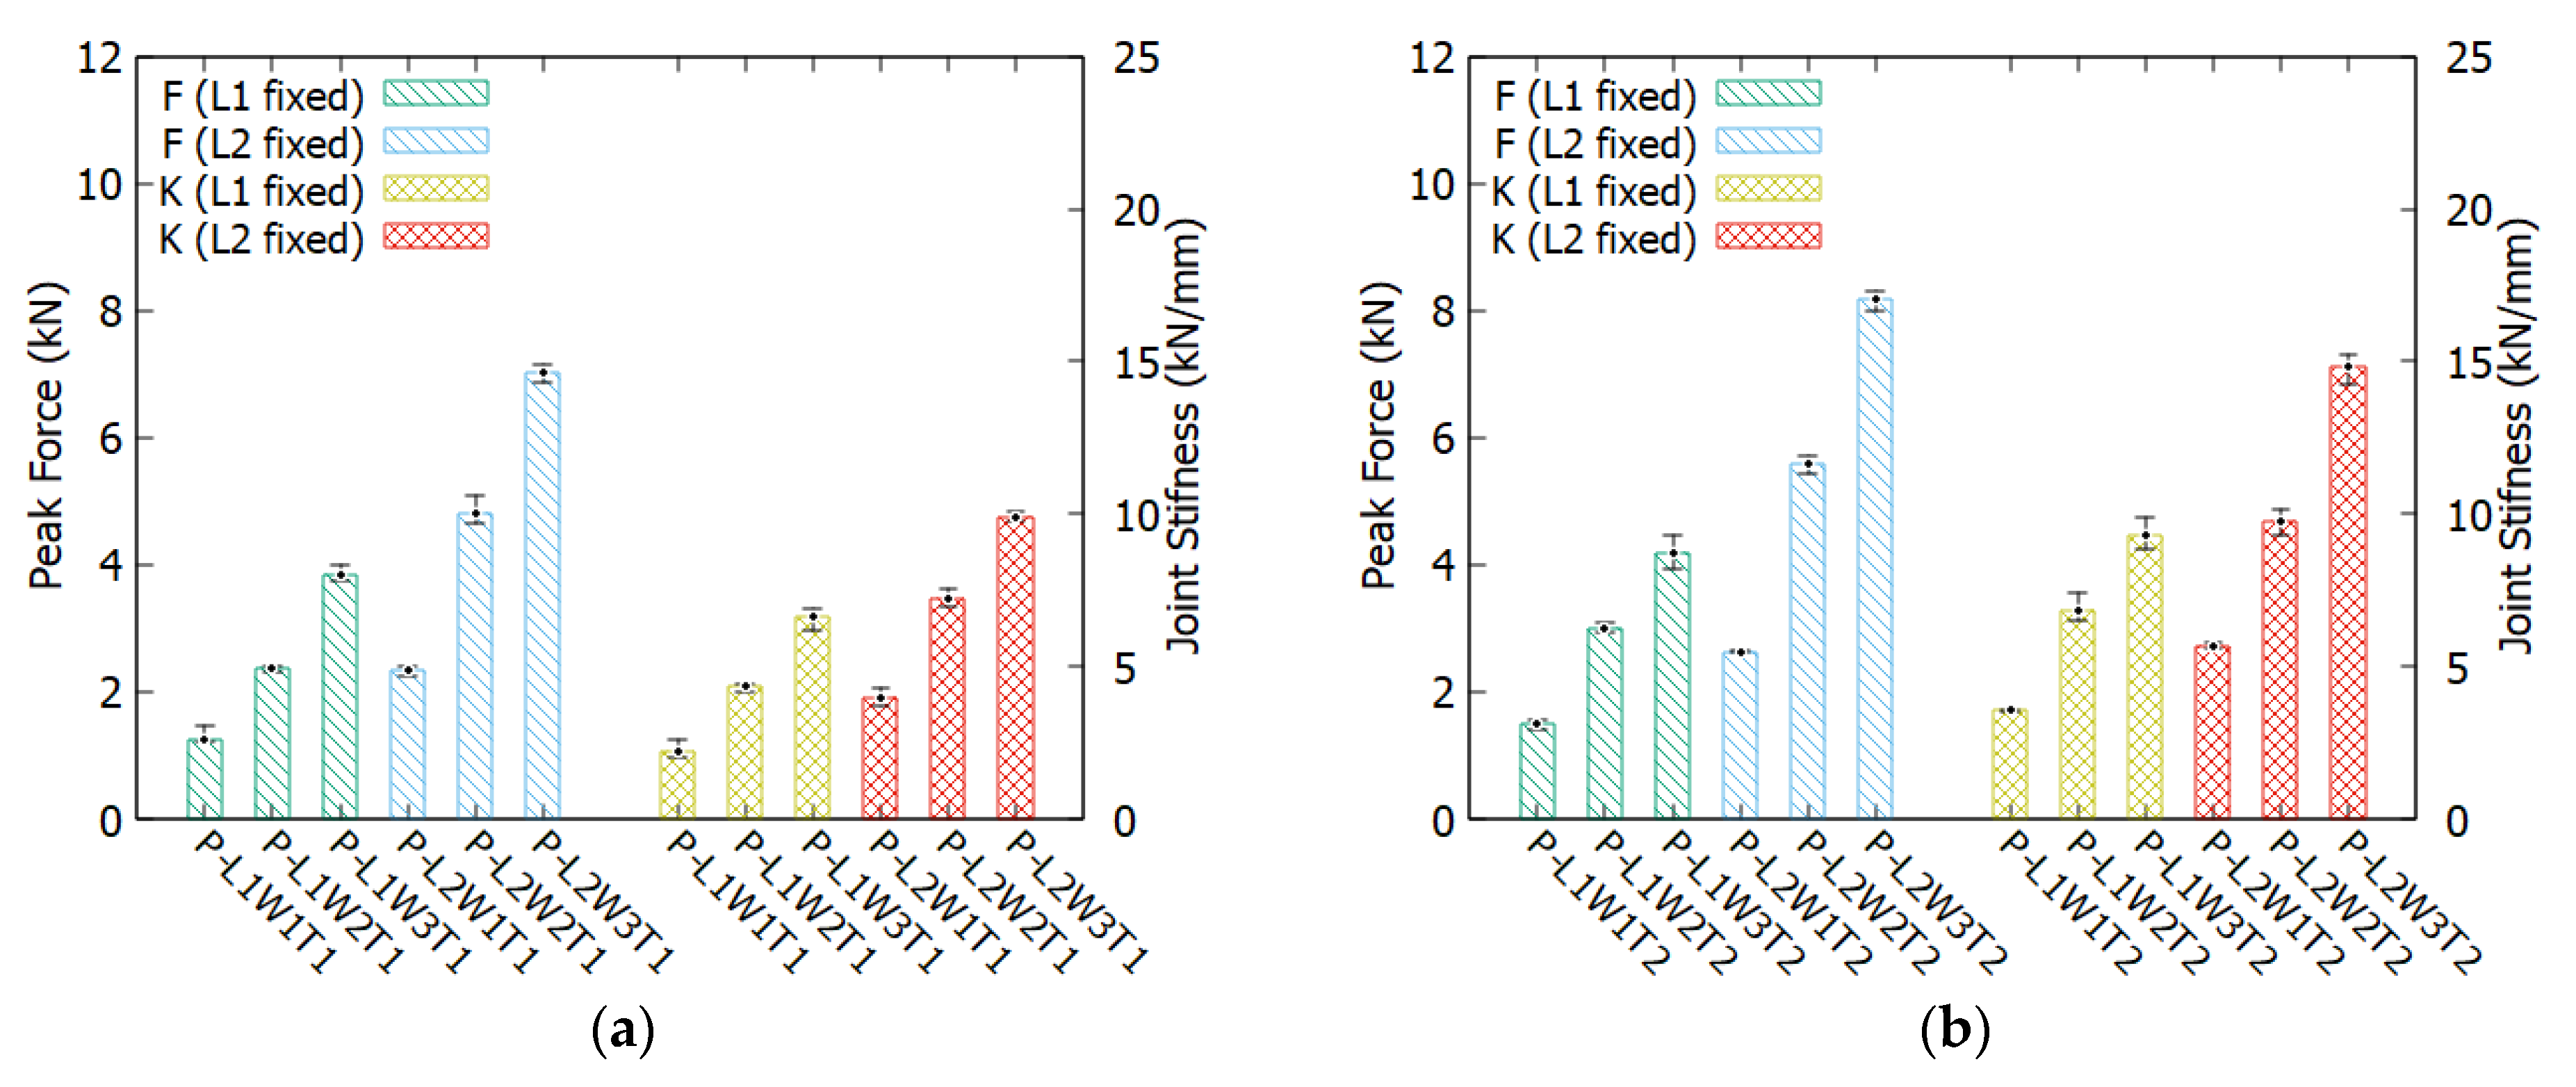
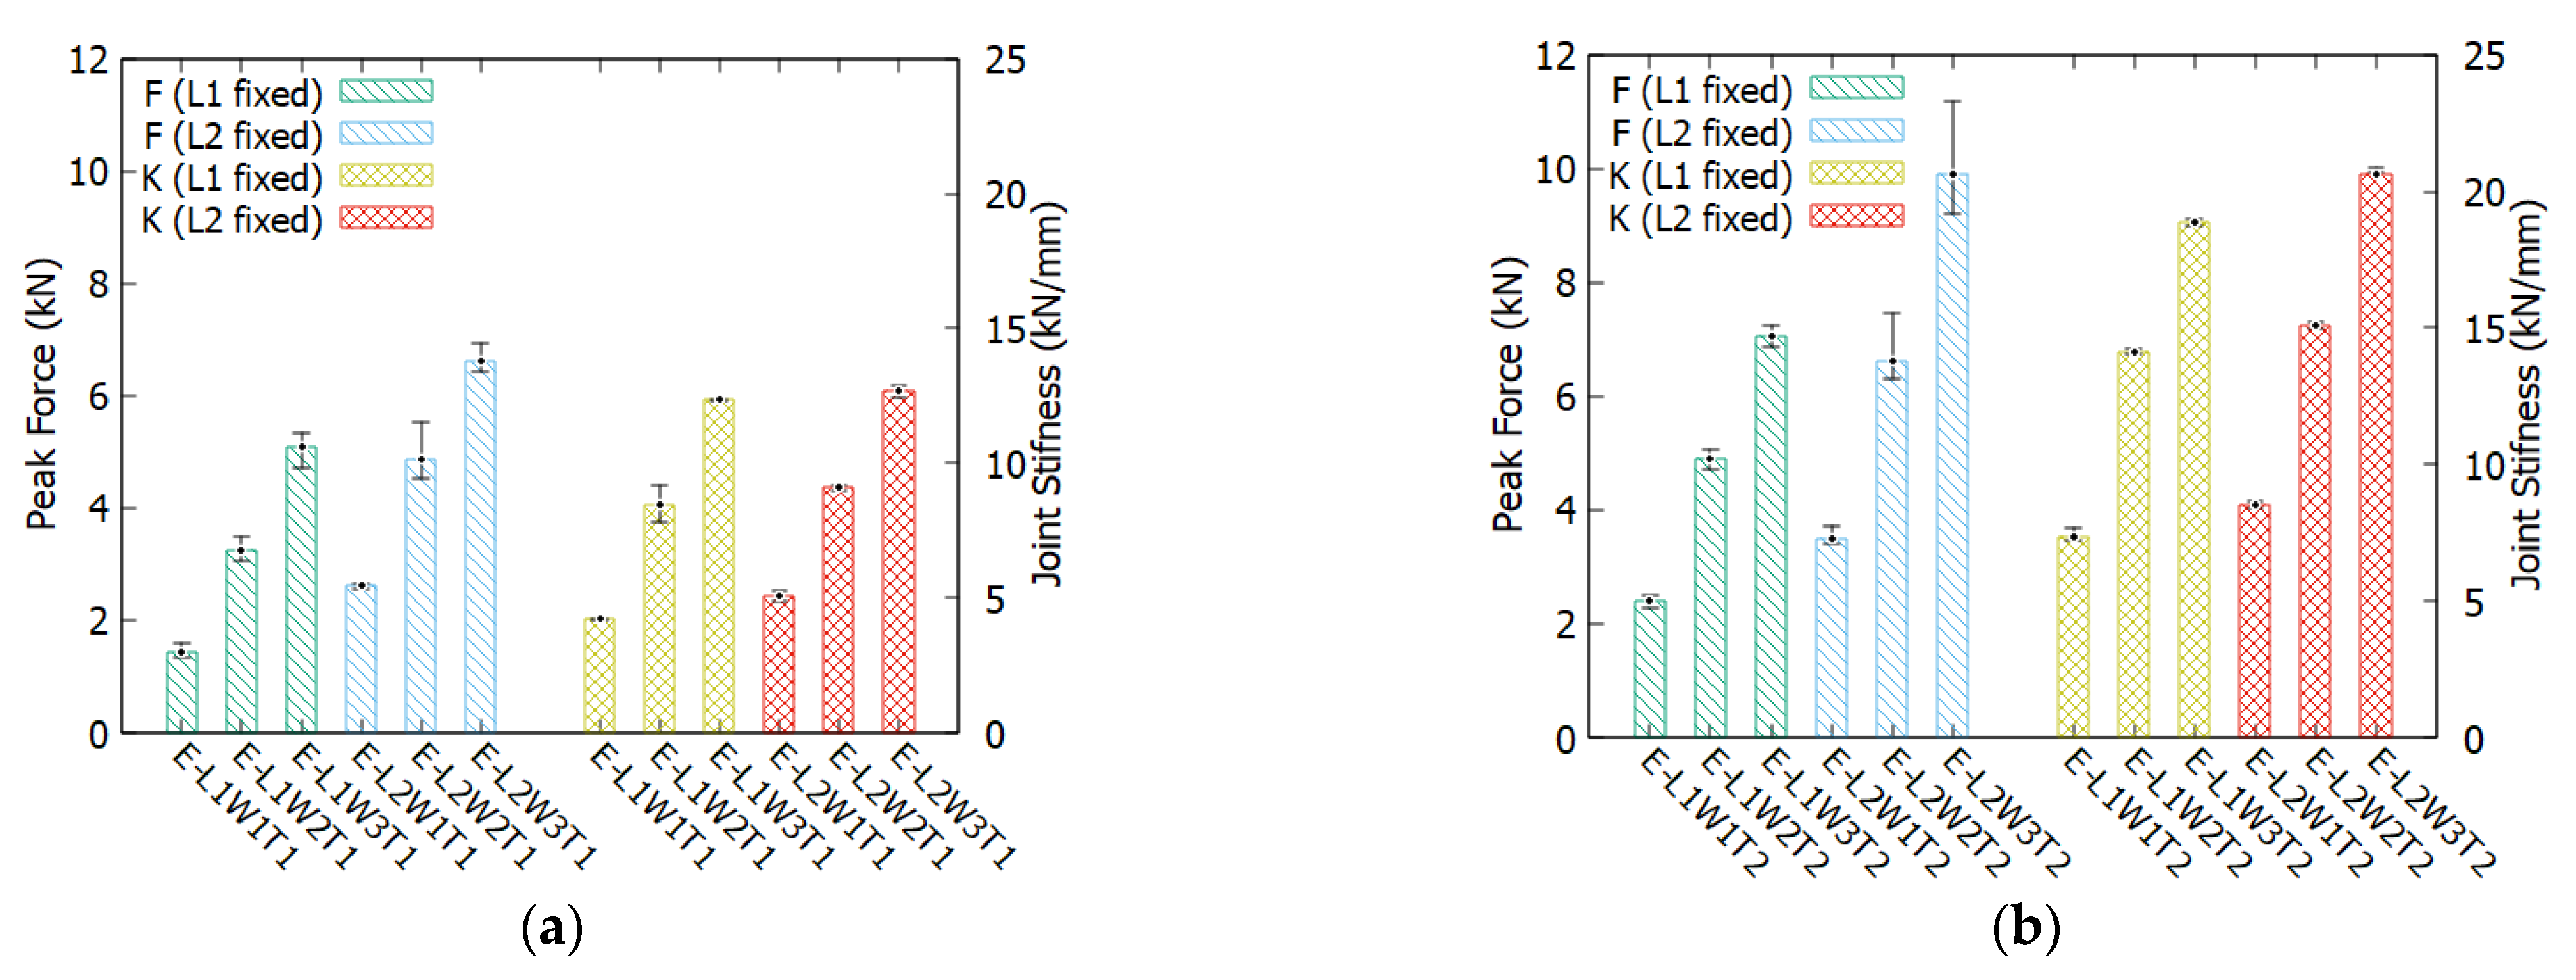
4.2. SLJ Force-Displacement and Joint Stiffness
4.2.1. Polyurethane
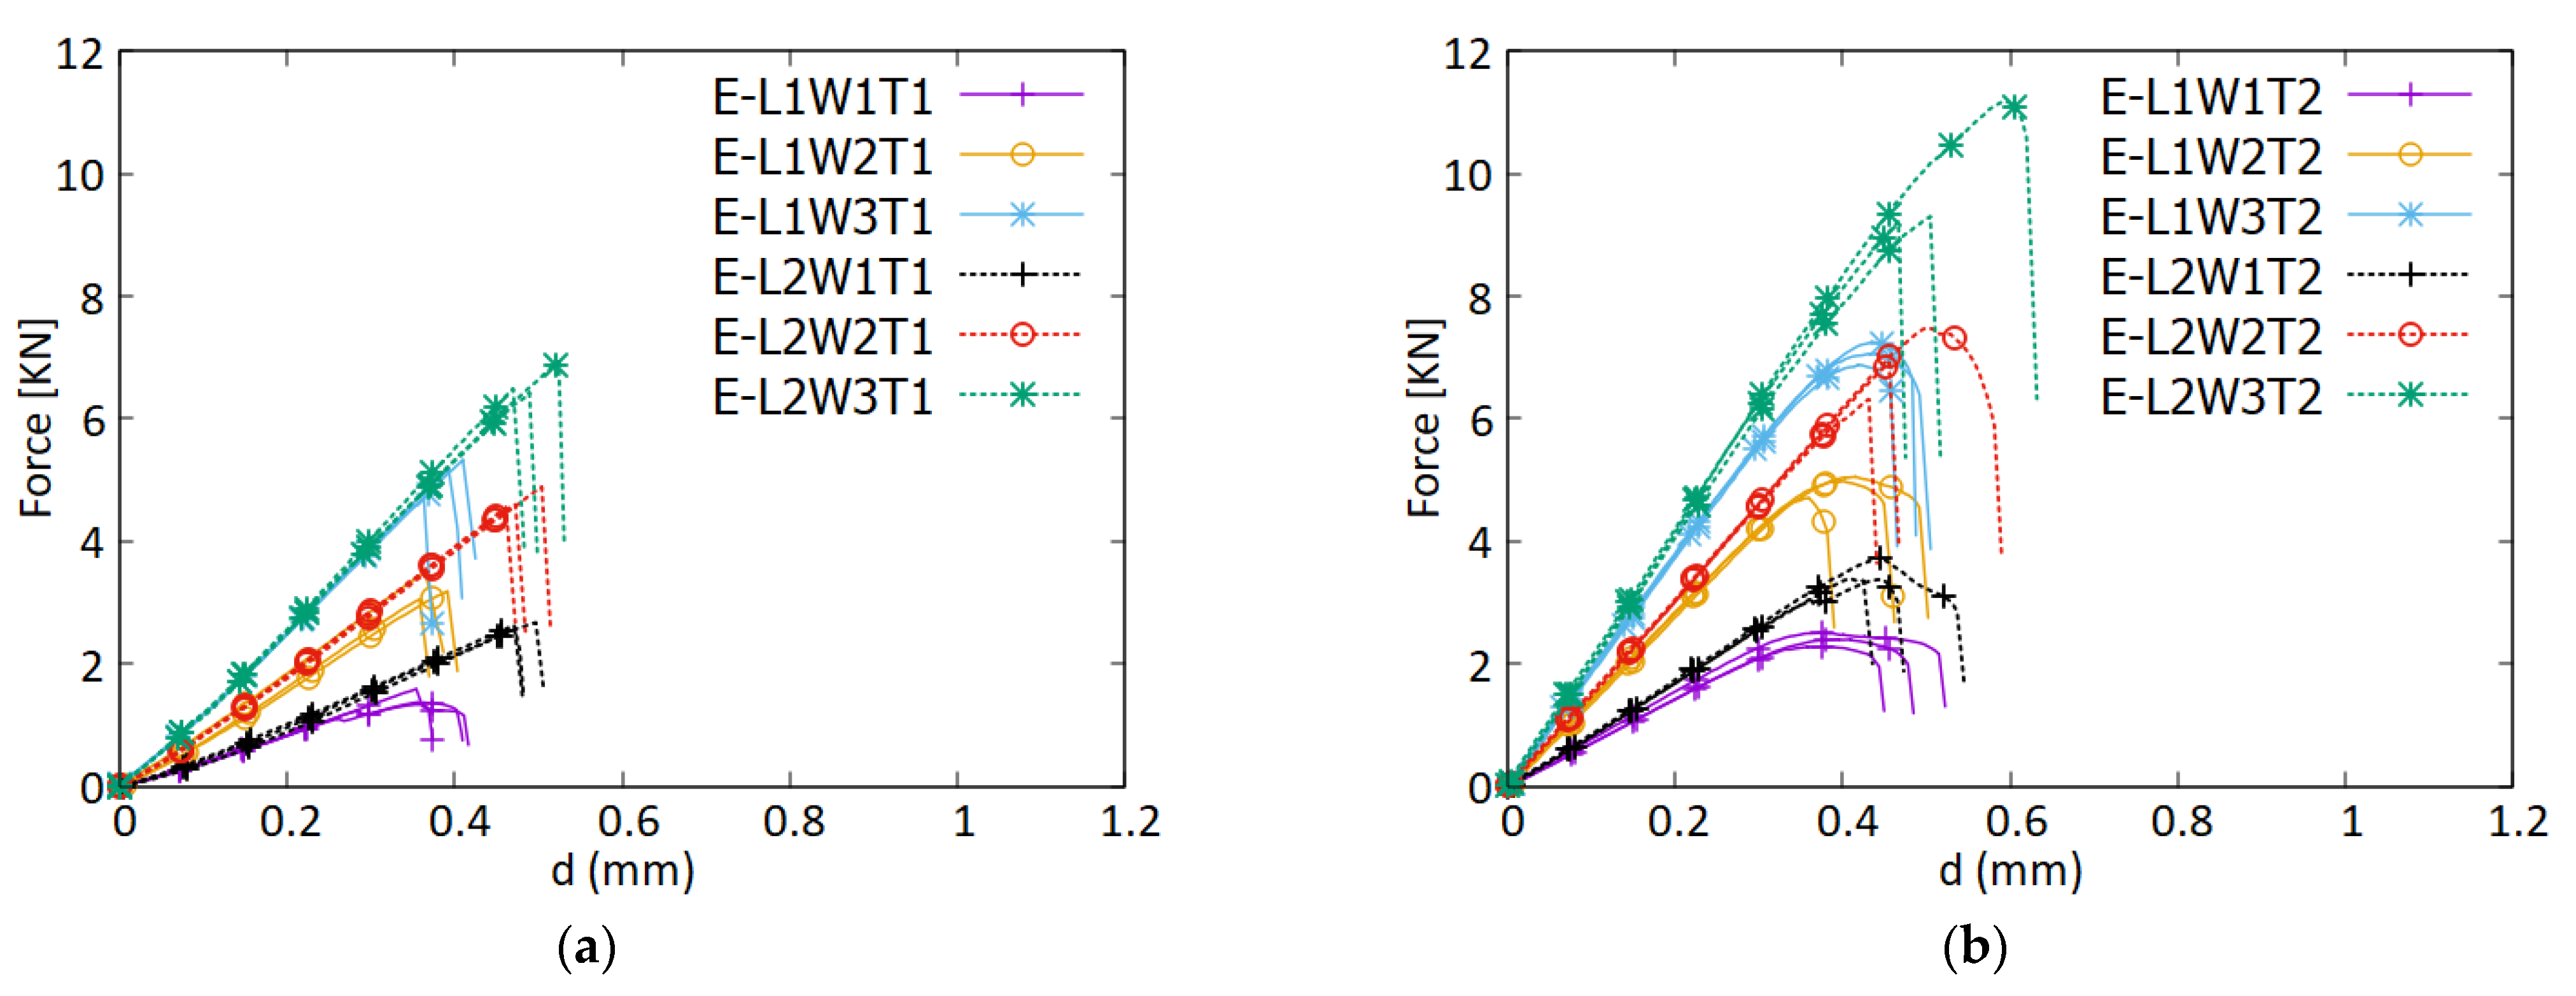
4.2.2. Epoxy
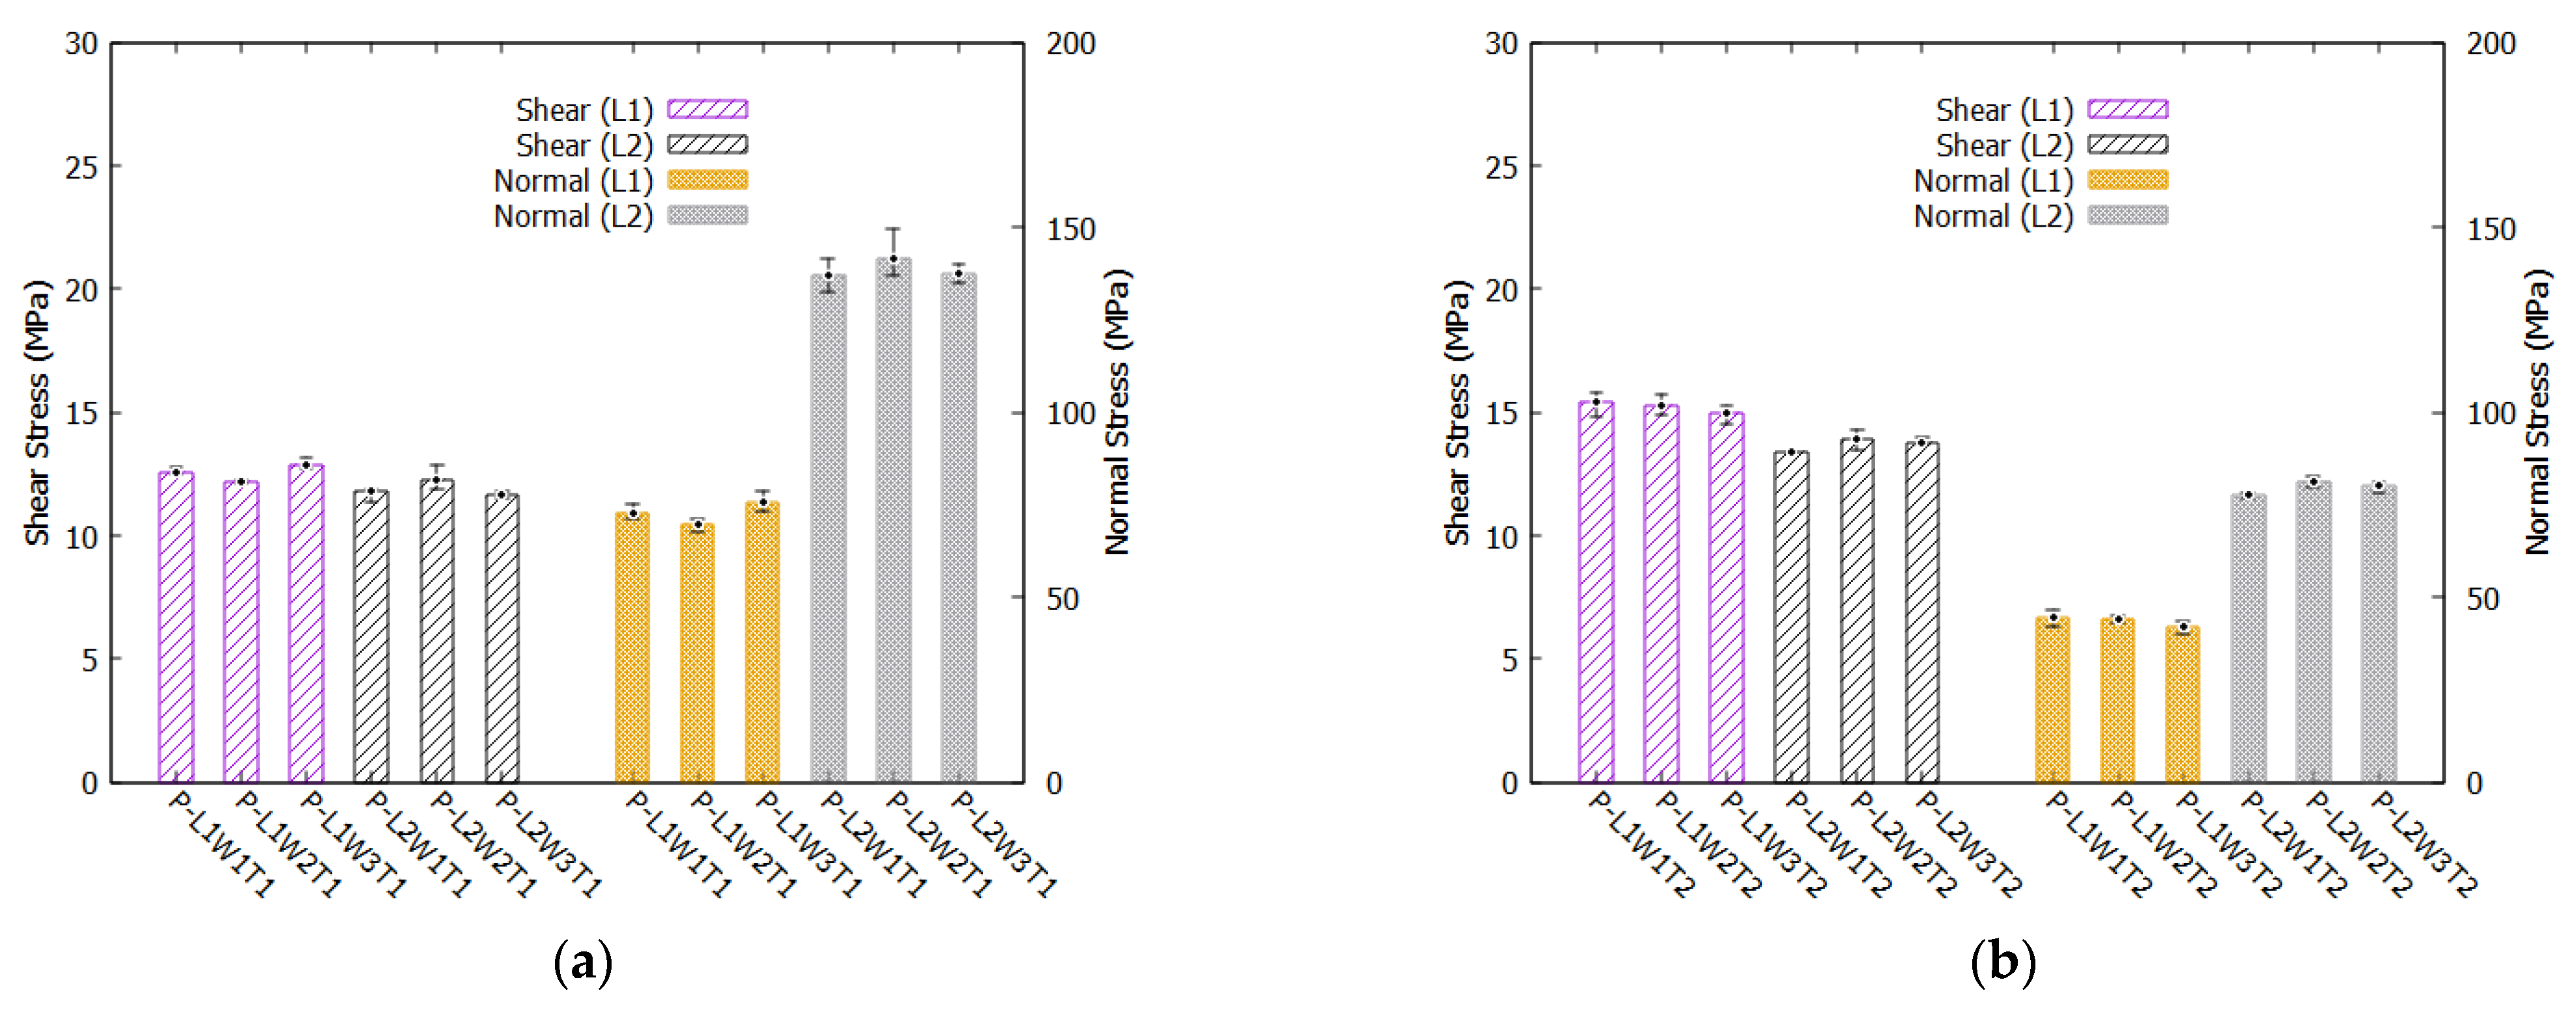
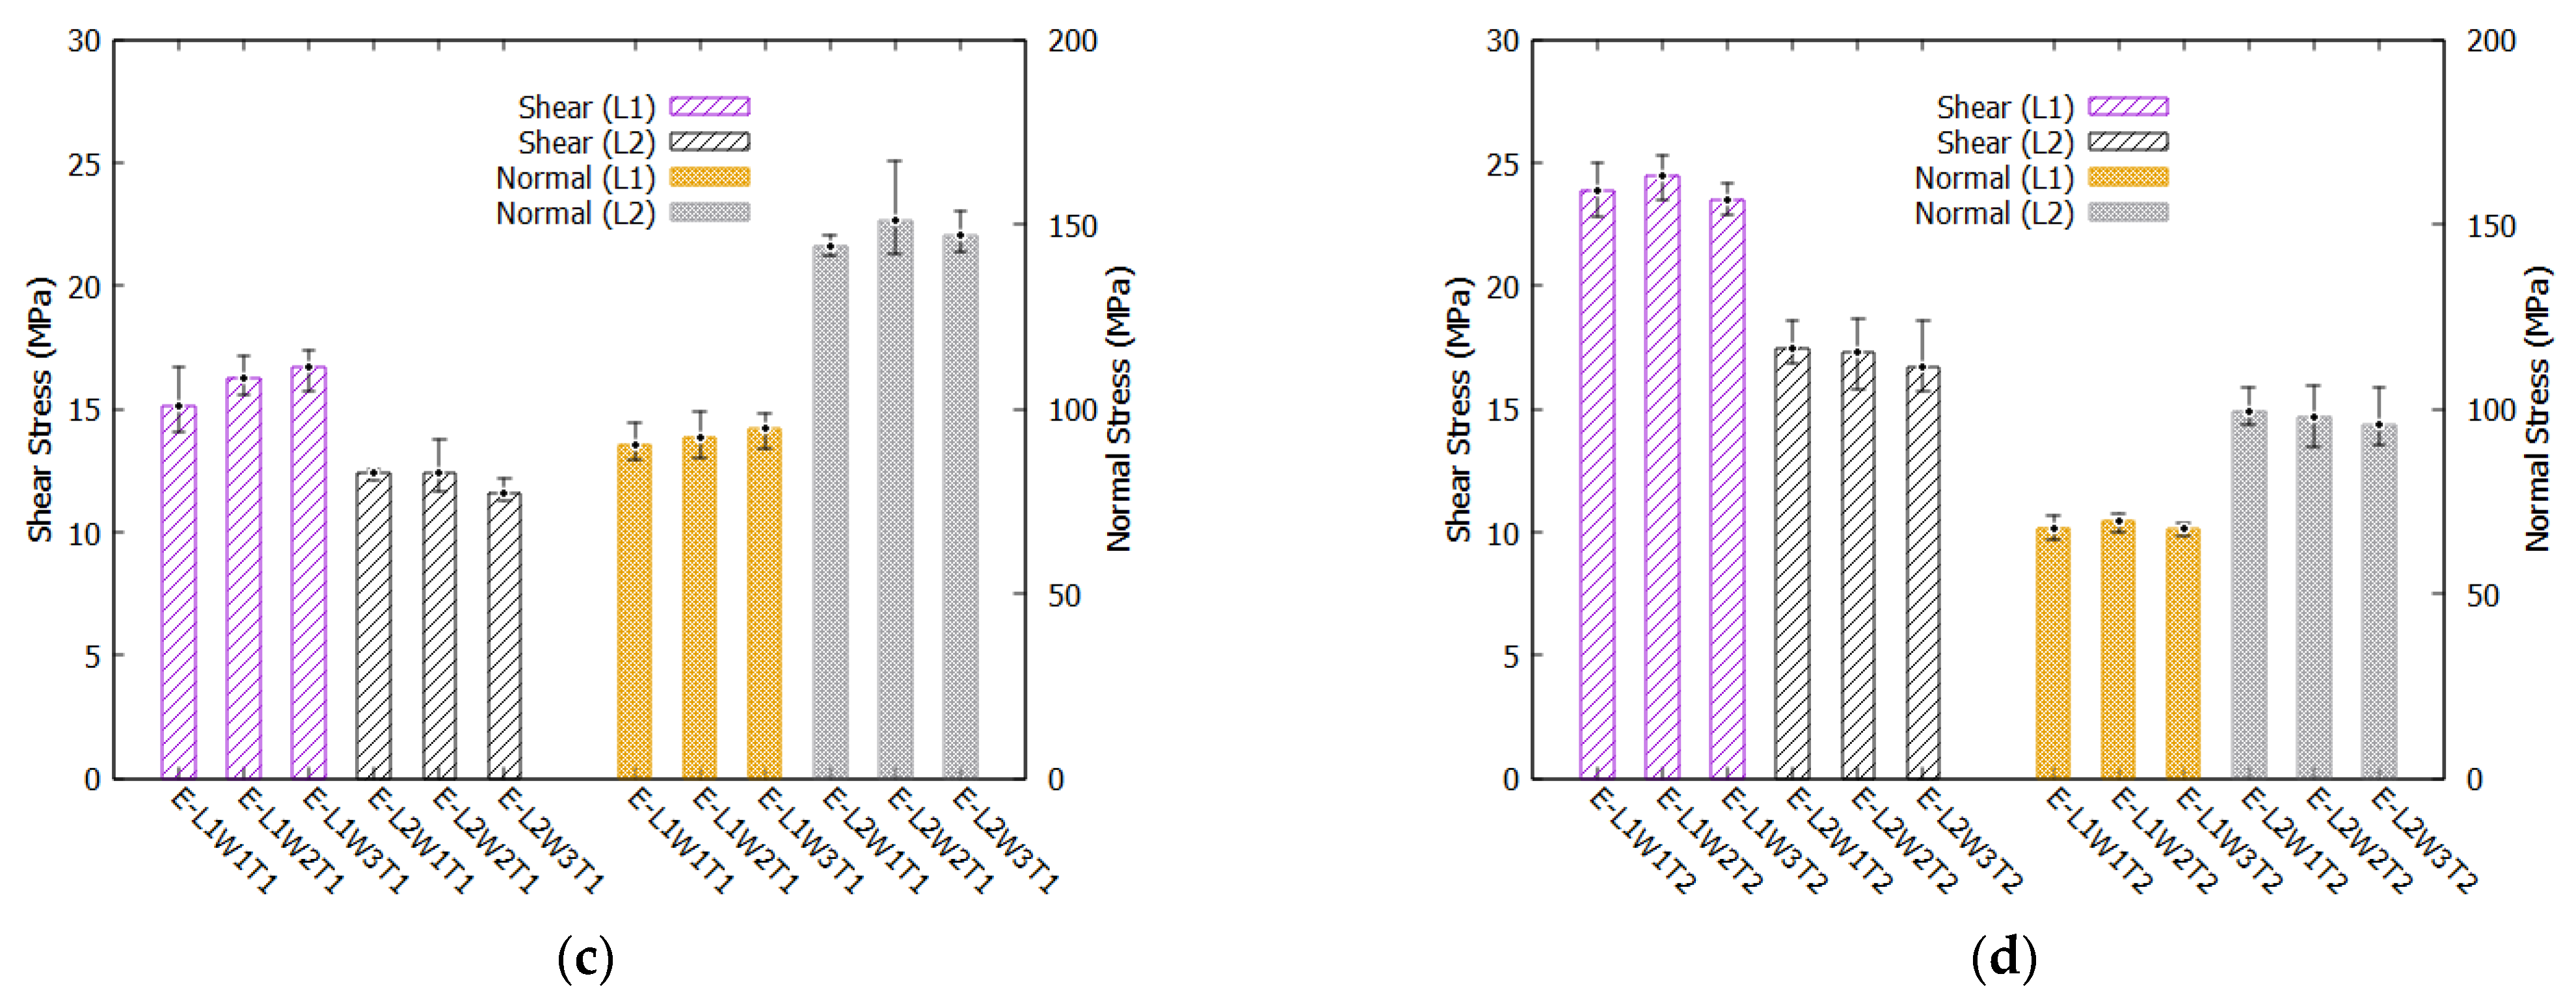
4.3. Adhesive Shear and Substrate Normal Stresses
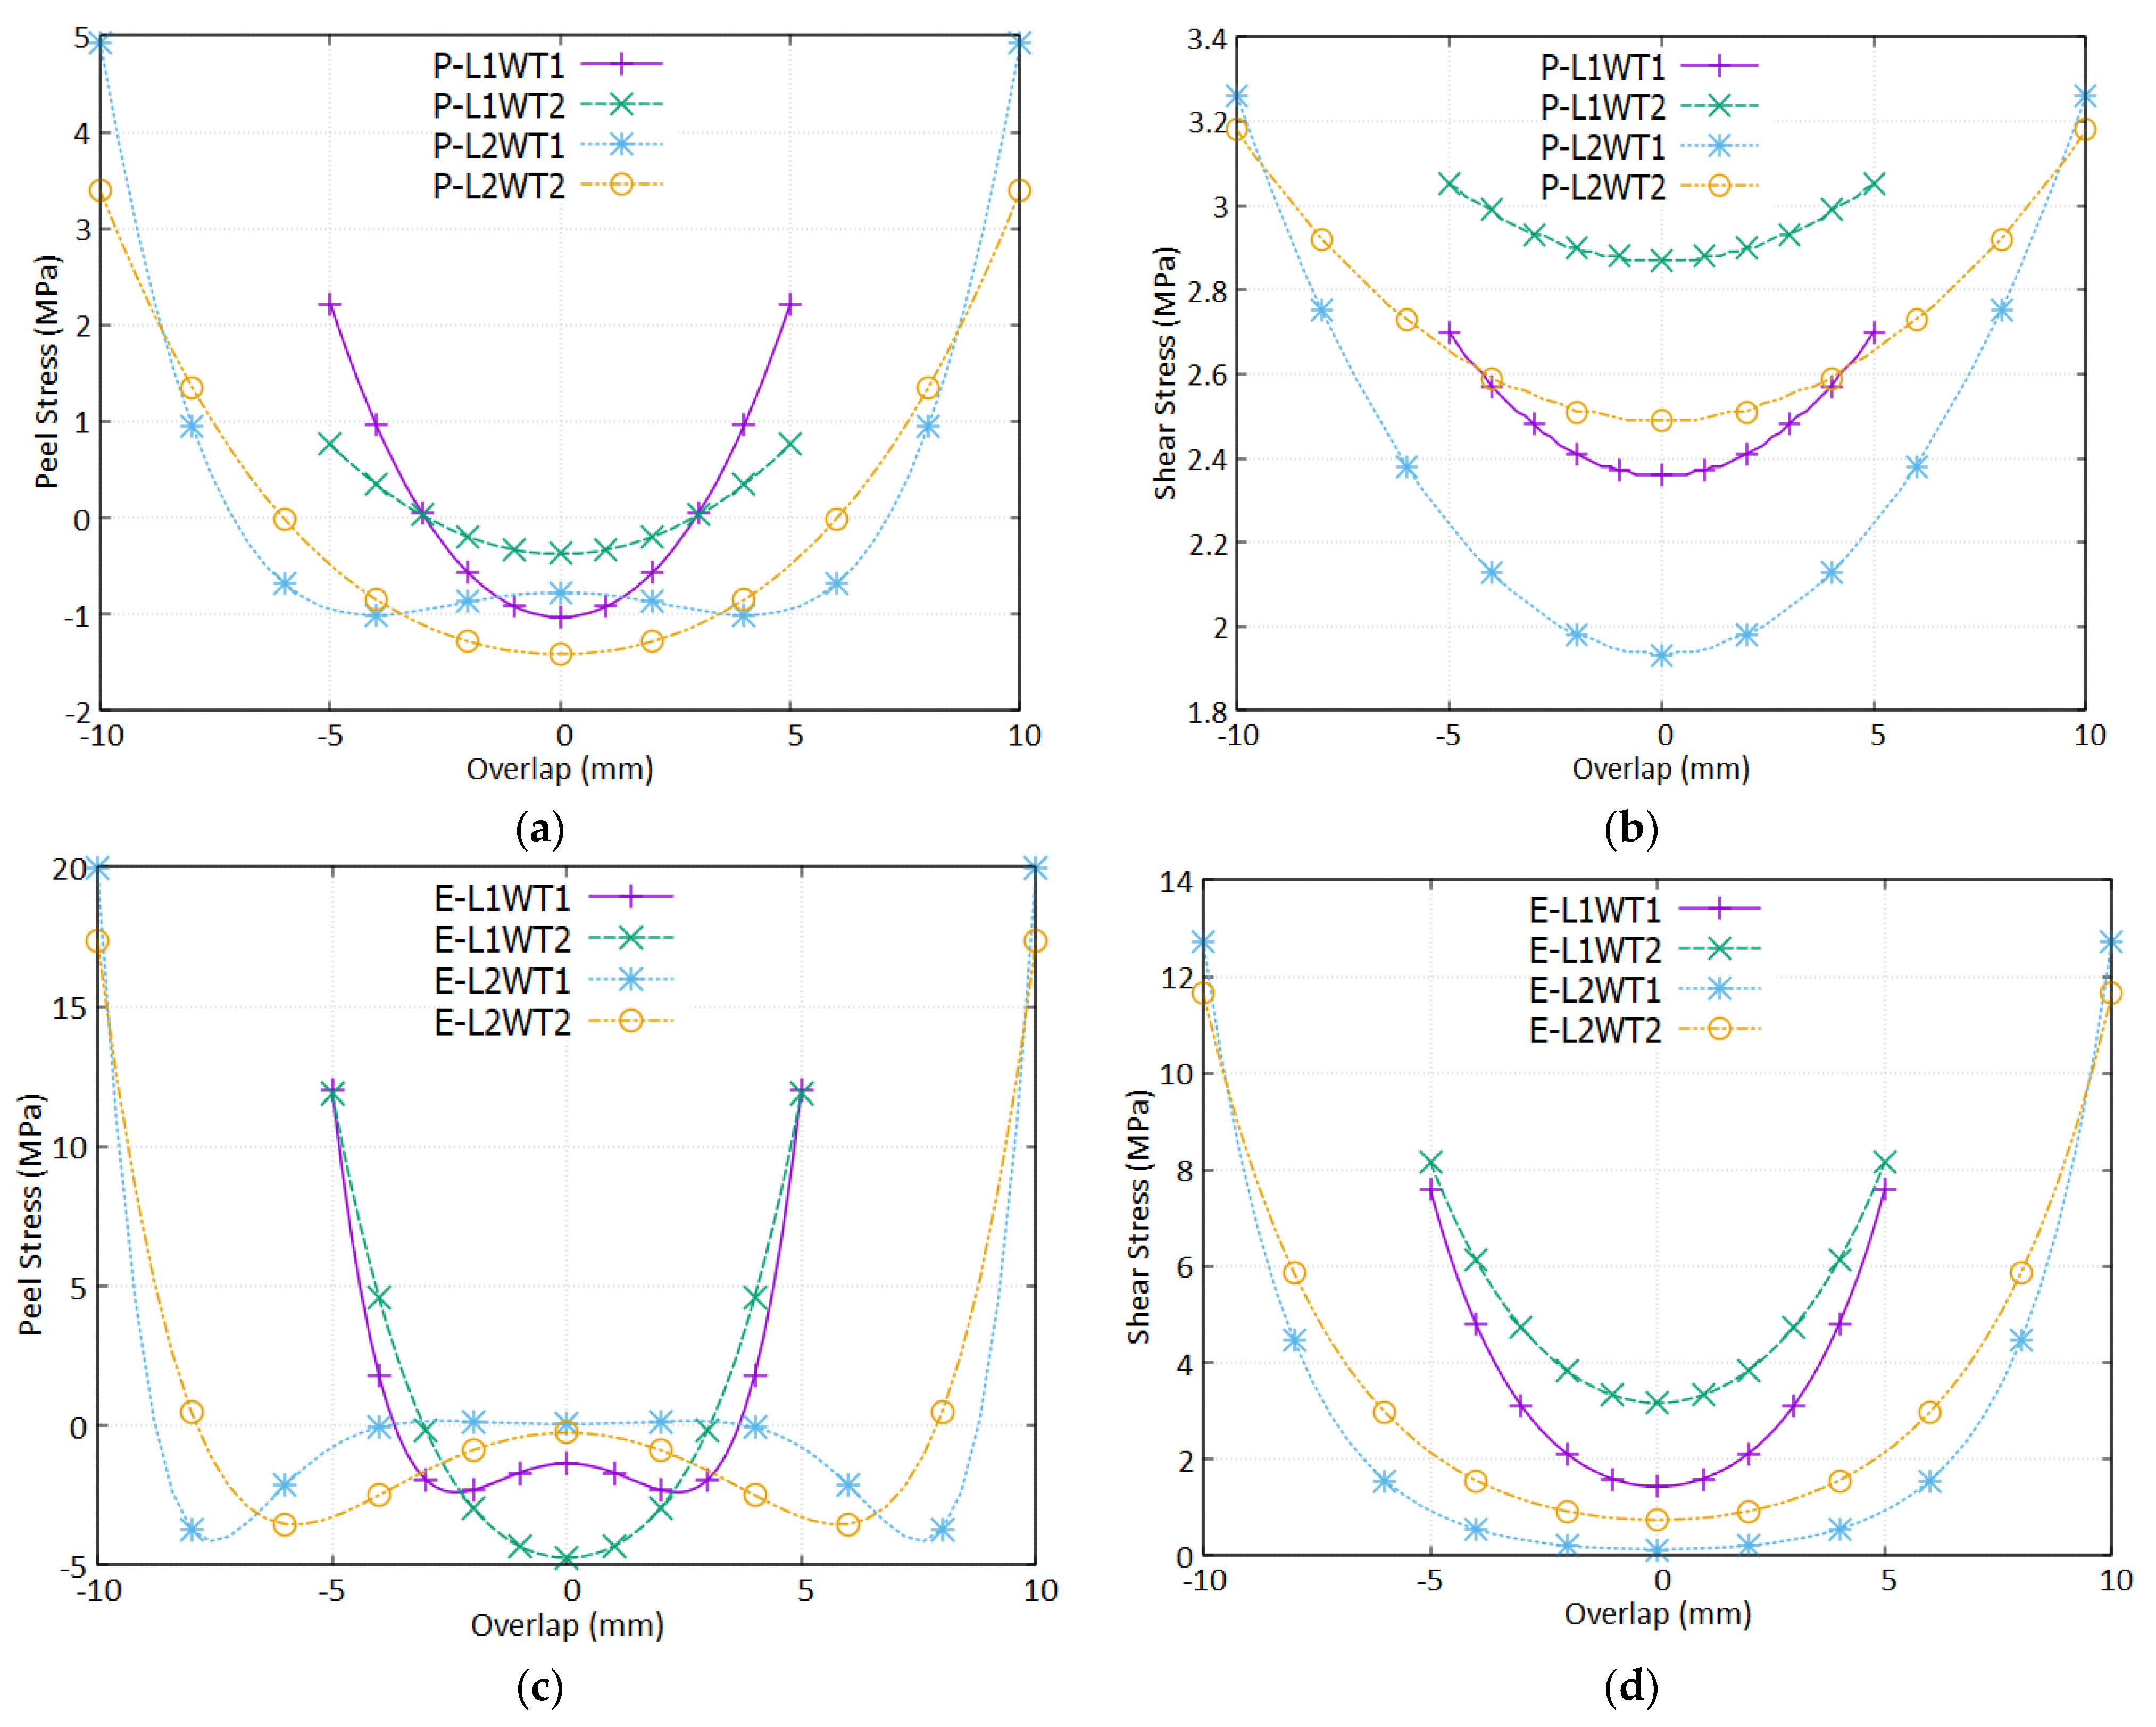
4.4. Internal Adhesive Stress Analysis
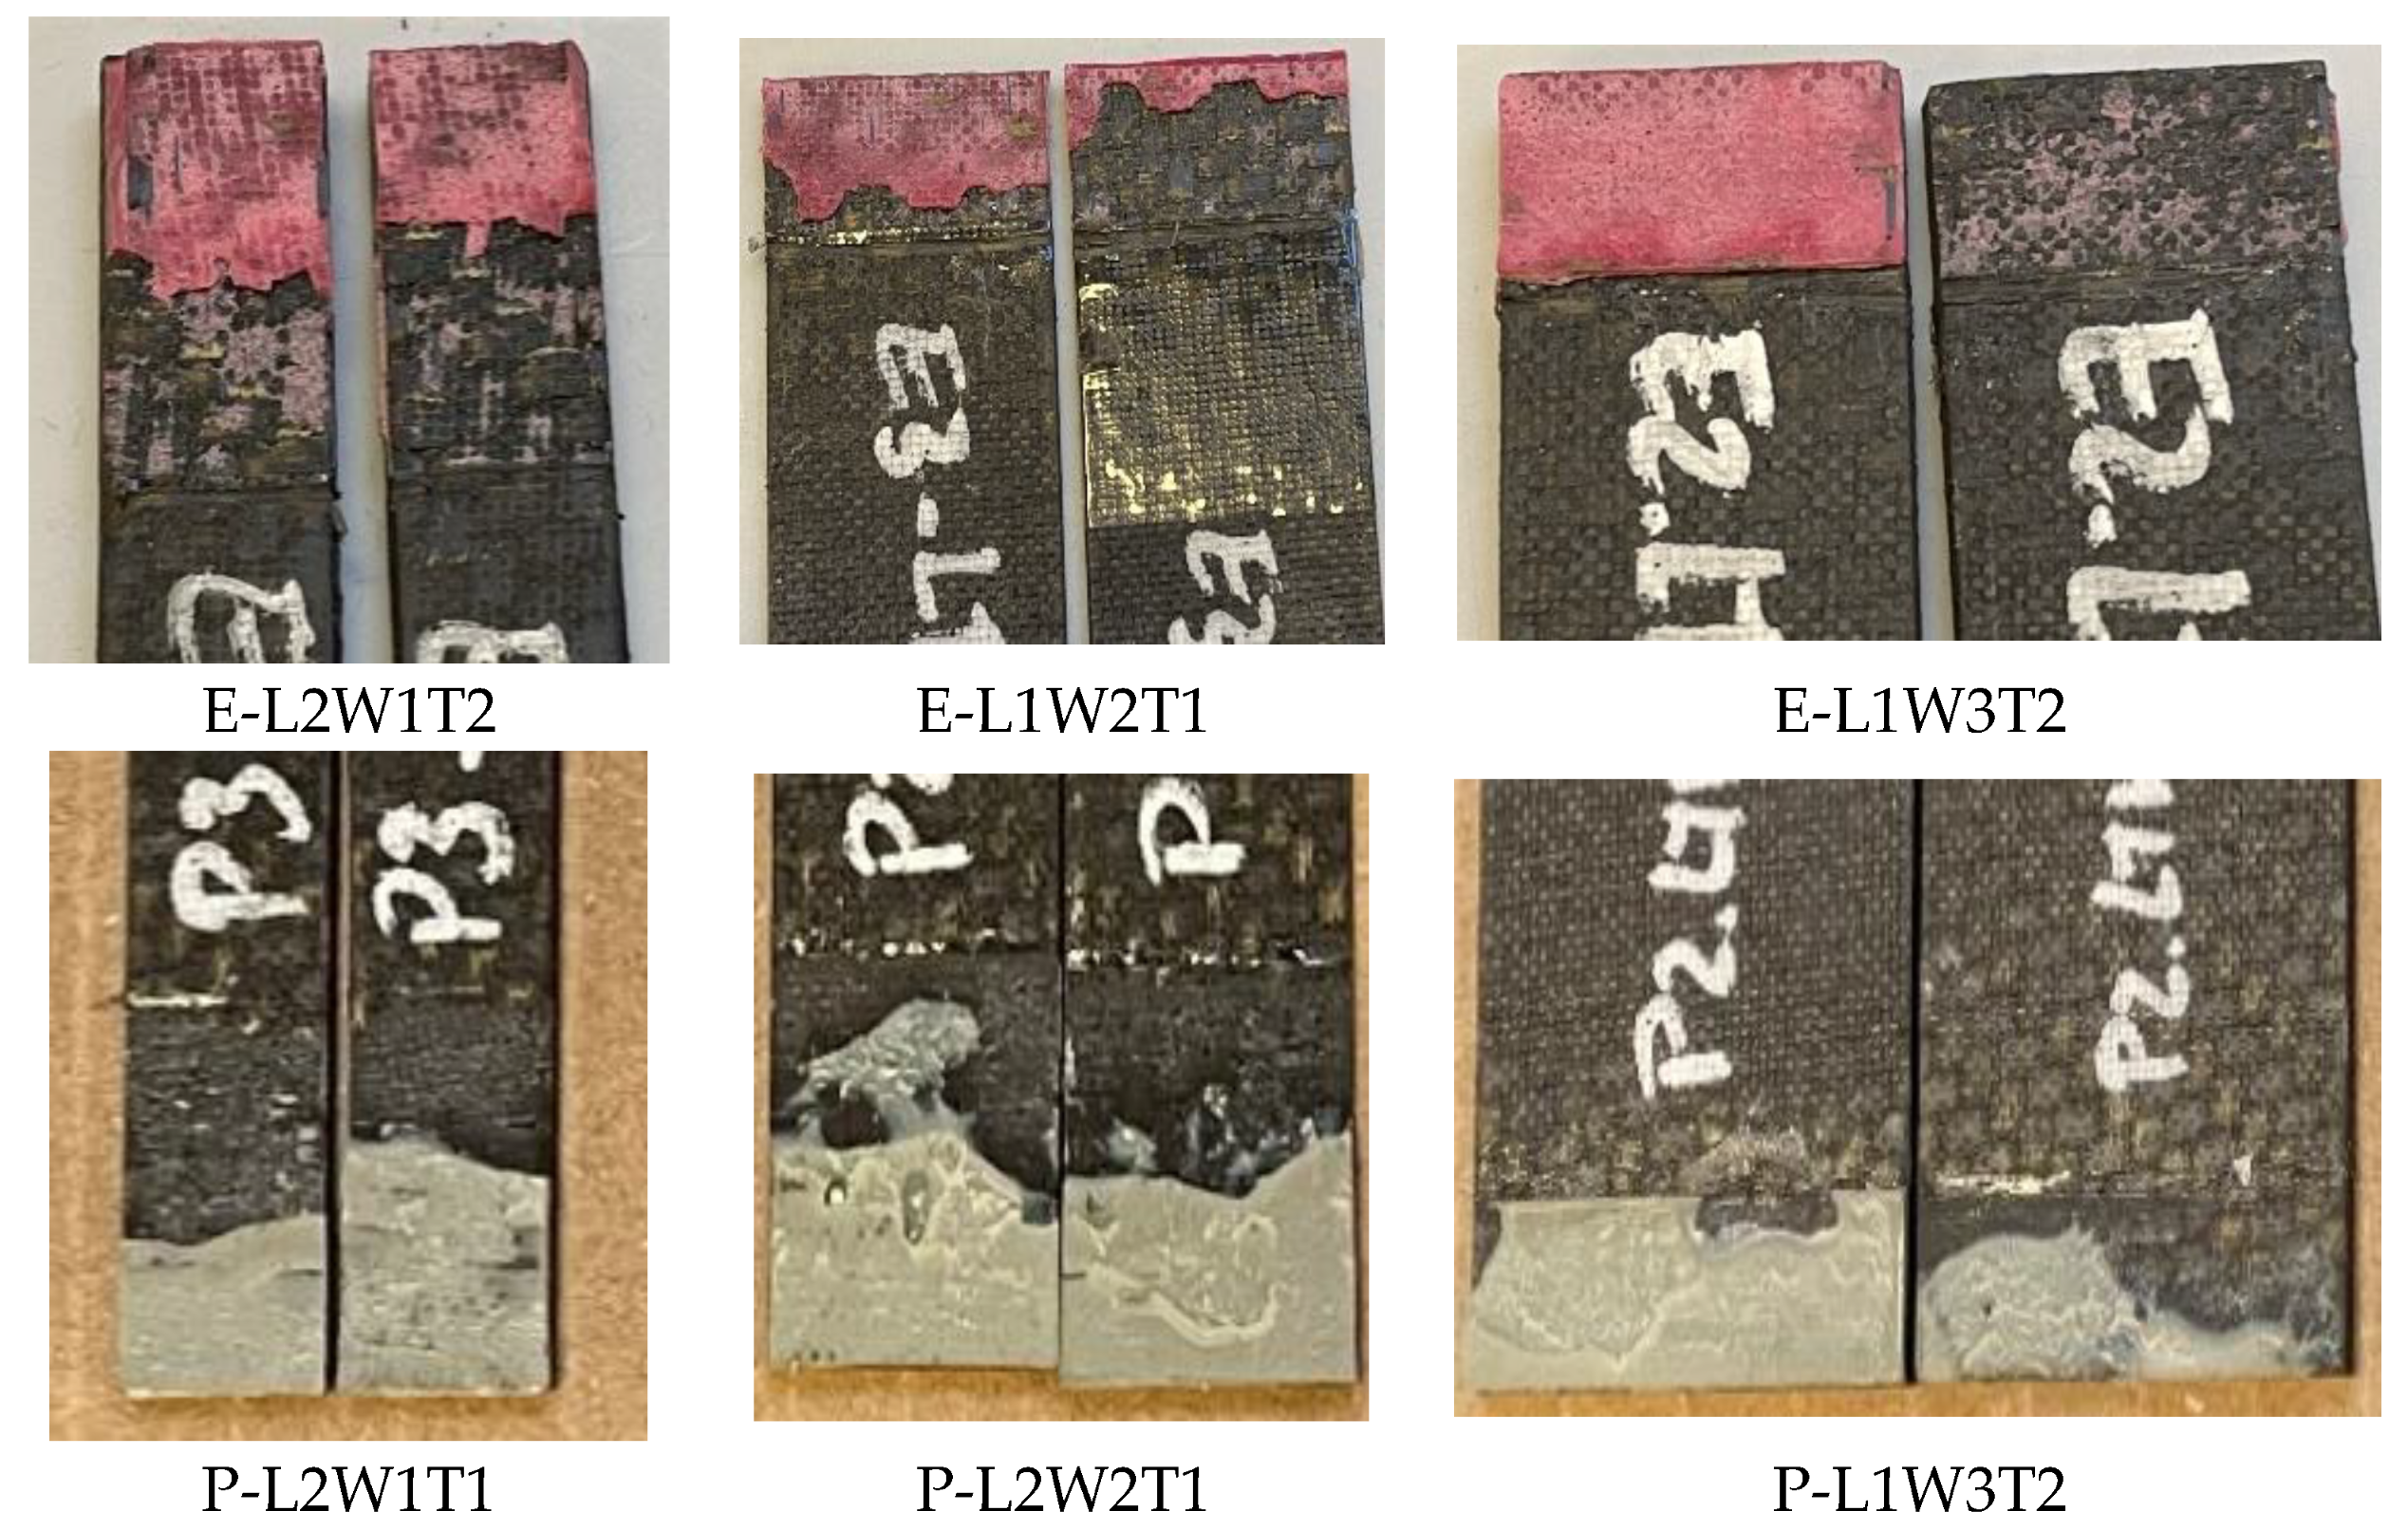
4.5. Failure Surfaces
5. Conclusions
- Polyurethane SLJ demonstrated an elastic-plastic behavior before the rupture, while epoxy SLJs showed an approximately linear elastic behavior up to the point of rupture.
- The peak load and joint stiffness in epoxy SLJs were larger (on average, 18 and 40%, respectively) than in the same joint with polyurethane adhesive. However, the displacement at maximum load in polyurethane SLJs was approximately 100% greater in comparison with the same epoxy SLJs.
- In polyurethane SLJs, an increase in all three geometric parameters (T, W, L) increases both joint stiffness and peak load. The joint width and length showed a more significant impact.
- L, W, and T are more significantly influential on the peak force in epoxy SLJs. W is more influential than L and L is more influential than T on the load capacity of the joints. On the other hand, W and T are of greater importance for joint stiffness. However, the overlap length has a negligible effect on joint stiffness. Moreover, at each substrate thickness, joints with the same W showed approximately equal stiffness.
- According to these results, T is the most effective (positive) parameter, followed by L (which is (negatively) affective), and W has negligible effects on shear stress. The shear stress of epoxy SLJs is more prone to change by changing the joint dimensions in comparison with polyurethane SLJs.
- L is the most influential parameter, T is an influential parameter, and W is not an influential parameter on normal stress in the substrates of a composite SLJ.
- Keeping the thickness of the substrates constant, an increase in overlap length resulted in a reduction in shear stress and an increase in normal stress. In addition, for all the geometrical configurations, increasing the adherend thickness increases the shear stress and decreases the normal stress.
- According to the Bigwood–Crocombe model, based on the average values at 20% peak load, for both adhesives, increasing the overlap length leads to a decrease in shear stress and an increase in peel stress. Furthermore, increasing the substrate thickness results in an increase in shear stress and a decrease in peel stress.
- As the Young’s modulus and ultimate stress of the epoxy adhesive is larger than that of the polyurethane adhesive, the substrates in epoxy joints undergo more bending, and this fact can be easily seen in the peel stress diagrams.
Author Contributions
Funding
Acknowledgments
Conflicts of Interest
References
- Ciardiello, R.; Boursier Niutta, C.; Di Sciullo, F.; Goglio, L. Single-Lap Joints of Similar and Dissimilar Adherends Bonded with a Polyurethane Adhesive Used in the Automotive Industry. IOP Conf. Ser. Mater. Sci. Eng. 2021, 1038, 012031. [Google Scholar] [CrossRef]
- Chang, B.; Shi, Y.; Dong, S. Comparative Studies on Stresses in Weld-Bonded, Spot-Welded and Adhesive-Bonded Joints. J. Mater. Process. Technol. 1999, 87, 230–236. [Google Scholar] [CrossRef]
- Banea, M.D.; da Silva, L.F.M. Adhesively Bonded Joints in Composite Materials: An Overview. Proc. Inst. Mech. Eng. Part L J. Mater. Des. Appl. 2009, 223, 1–18. [Google Scholar] [CrossRef]
- Kim, K.-S.; Yi, Y.-M.; Cho, G.-R.; Kim, C.-G. Failure Prediction and Strength Improvement of Uni-Directional Composite Single Lap Bonded Joints. Compos. Struct. 2008, 82, 513–520. [Google Scholar] [CrossRef]
- Giannopoulos, I.K.; Doroni-Dawes, D.; Kourousis, K.I.; Yasaee, M. Effects of Bolt Torque Tightening on the Strength and Fatigue Life of Airframe FRP Laminate Bolted Joints. Compos. B Eng. 2017, 125, 19–26. [Google Scholar] [CrossRef]
- Yi, J.; Boyce, M.C.; Lee, G.F.; Balizer, E. Large Deformation Rate-Dependent Stress–Strain Behavior of Polyurea and Polyurethanes. Polymer 2006, 47, 319–329. [Google Scholar] [CrossRef]
- Berntsen, J.F.; Morin, D.; Clausen, A.H.; Langseth, M. Experimental Investigation and Numerical Modelling of the Mechanical Response of a Semi-Structural Polyurethane Adhesive. Int. J. Adhes. Adhes. 2019, 95, 102395. [Google Scholar] [CrossRef]
- Banea, M.D.; da Silva, L.F.M.; Campilho, R.D.S.G. The Effect of Adhesive Thickness on the Mechanical Behavior of a Structural Polyurethane Adhesive. J. Adhes. 2015, 91, 331–346. [Google Scholar] [CrossRef]
- Benelli, A.; Ciardiello, R.; Boursier Niutta, C.; Goglio, L. Experimental and Numerical Characterization of Adhesive Joints with Composite Substrates by Means of the Arcan Test. Int. J. Adhes. Adhes. 2023, 122, 103321. [Google Scholar] [CrossRef]
- Baysal, G.; Aydın, H.; Hoşgören, H.; Uzan, S.; Karaer, H. Improvement of Synthesis and Dielectric Properties of Polyurethane/Mt-QASs+ (Novel Synthesis). J. Polym. Environ. 2016, 24, 139–147. [Google Scholar] [CrossRef]
- Kinloch, A.J. Toughening Epoxy Adhesives to Meet Today’s Challenges. MRS Bull. 2003, 28, 445–448. [Google Scholar] [CrossRef]
- Beber, V.C.; Schneider, B.; Brede, M. Influence of Temperature on the Fatigue Behaviour of a Toughened Epoxy Adhesive. J. Adhes. 2016, 92, 778–794. [Google Scholar] [CrossRef]
- Grant, L.D.R.; Adams, R.D.; da Silva, L.F.M. Experimental and Numerical Analysis of Single-Lap Joints for the Automotive Industry. Int. J. Adhes. Adhes. 2009, 29, 405–413. [Google Scholar] [CrossRef]
- Abbasi, M.; Alavi Nia, A. High-Velocity Impact Behavior of Sandwich Structures with AL Faces and Foam Cores—Experimental and Numerical Study. Aerosp. Sci. Technol. 2020, 105, 106039. [Google Scholar] [CrossRef]
- Abbasi, M.; Alavi Nia, A.; Abolfathi, M. Experimental Study on the High-Velocity Impact Behavior of Sandwich Structures with an Emphasis on the Layering Effects of Foam Core. J. Sandw. Struct. Mater. 2021, 23, 3–22. [Google Scholar] [CrossRef]
- Özel, A.; Aydin, M.; Temiż, Ş. The Effects of Overlap Length and Adherend Thickness on the Strength of Adhesively Bonded Joints Subjected to Bending Moment. J. Adhes. Sci. Technol. 2004, 18, 313–325. [Google Scholar] [CrossRef]
- Aydin, M.D.; Özel, A.; Temiz, Ş. The Effect of Adherend Thickness on the Failure of Adhesively-Bonded Single-Lap Joints. J. Adhes. Sci. Technol. 2005, 19, 705–718. [Google Scholar] [CrossRef]
- Gültekin, K.; Akpinar, S.; Özel, A. The Effect of the Adherend Width on the Strength of Adhesively Bonded Single-Lap Joint: Experimental and Numerical Analysis. Compos. B Eng. 2014, 60, 736–745. [Google Scholar] [CrossRef]
- Sahin, R.; Akpinar, S. The Effects of Adherend Thickness on the Fatigue Strength of Adhesively Bonded Single-Lap Joints. Int. J. Adhes. Adhes. 2021, 107, 102845. [Google Scholar] [CrossRef]
- Abdi, E.; Khabaz-Aghdam, A.; Hasan-nezhad, H.; Behjat, B.; Marques, E.; Yang, Y.; da Silva, L. The Effect of Graphene and Graphene Oxide on Defective Single Lap Adhesively Bonded Joints. J. Compos. Mater. 2022, 56, 2665–2675. [Google Scholar] [CrossRef]
- Ghabezi, P.; Farahani, M. Effects of Nanoparticles on Nanocomposites Mode I and II Fracture: A Critical Review. In Progress in Adhesion and Adhesives; John Wiley & Sons, Inc.: Hoboken, NJ, USA, 2018; pp. 391–411. [Google Scholar]
- Ghabezi, P.; Farahani, M. A Cohesive Model with a Multi-Stage Softening Behavior to Predict Fracture in Nano Composite Joints. Eng. Fract. Mech. 2019, 219, 106611. [Google Scholar] [CrossRef]
- ASTM D5868-01(2023); Standard Test Method for Lap Shear Adhesion for Fiber Reinforced Plastic (FRP) Bonding1. ASTM International: West Conshohocken, PA, USA, 2023. [CrossRef]
- Budhe, S.; Banea, M.D.; de Barros, S.; da Silva, L.F.M. An Updated Review of Adhesively Bonded Joints in Composite Materials. Int. J. Adhes. Adhes. 2017, 72, 30–42. [Google Scholar] [CrossRef]
- Reis, P.N.B.; Antunes, F.J.V.; Ferreira, J.A.M. Influence of Superposition Length on Mechanical Resistance of Single-Lap Adhesive Joints. Compos. Struct. 2005, 67, 125–133. [Google Scholar] [CrossRef]
- Fernández-Cañadas, L.M.; Ivañez, I.; Sanchez-Saez, S.; Barbero, E.J. Effect of Adhesive Thickness and Overlap on the Behavior of Composite Single-Lap Joints. Mech. Adv. Mater. Struct. 2021, 28, 1111–1120. [Google Scholar] [CrossRef]
- Baykara, C. Effects of Single-Lap Joint at Different Adhesive Thicknesses on Fatigue Strength of Metals with Different Surface Coatings. Proc. Inst. Mech. Eng. Part C J. Mech. Eng. Sci. 2023, 095440622311529. [Google Scholar] [CrossRef]
- Moya-Sanz, E.M.; Ivañez, I.; Garcia-Castillo, S.K. Effect of the Geometry in the Strength of Single-Lap Adhesive Joints of Composite Laminates under Uniaxial Tensile Load. Int. J. Adhes. Adhes. 2017, 72, 23–29. [Google Scholar] [CrossRef]
- Li, S.; Liu, W.; Sun, W.; Hou, S. Effects of Adherend Notching on the Bonding Performance of Composite Single-Lap Joints. Eng. Fract. Mech. 2023, 281, 109141. [Google Scholar] [CrossRef]
- Djebbar, N.; Boutabout, B.; Boulenouar Rachid, H.; Oudad, W. Effect of Spew Adhesive and Beveling Substrate Geometrical Shape on Stresses in a Bonded Single Lap Joint. Eng. Struct. 2022, 256, 114049. [Google Scholar] [CrossRef]
- Cui, J.; Wang, S.; Wang, S.; Chen, S.; Li, G. Strength and Failure Analysis of Adhesive Single-Lap Joints under Shear Loading: Effects of Surface Morphologies and Overlap Zone Parameters. J. Manuf. Process. 2020, 56, 238–247. [Google Scholar] [CrossRef]
- Ciardiello, R.; D’Angelo, D.; Cagna, L.; Croce, A.; Paolino, D.S. Effects of Plasma Treatments of Polypropylene Adhesive Joints Used in the Automotive Industry. Proc. Inst. Mech. Eng. C J. Mech. Eng. Sci. 2022, 236, 6204–6218. [Google Scholar] [CrossRef]
- Da Silva, L.F.M.; Carbas, R.J.C.; Critchlow, G.W.; Figueiredo, M.A.V.; Brown, K. Effect of Material, Geometry, Surface Treatment and Environment on the Shear Strength of Single Lap Joints. Int. J. Adhes. Adhes. 2009, 29, 621–632. [Google Scholar] [CrossRef]
- Xu, W.; Wei, Y. Strength and Interface Failure Mechanism of Adhesive Joints. Int. J. Adhes. Adhes. 2012, 34, 80–92. [Google Scholar] [CrossRef]
- Kadioglu, F.; Avil, E.; Ercan, M.E.; Aydogan, T. Effects of Different Overlap Lengths and Composite Adherend Thicknesses on the Performance of Adhesively-Bonded Joints under Tensile and Bending Loadings. IOP Conf. Ser. Mater. Sci. Eng. 2018, 369, 012034. [Google Scholar] [CrossRef]
- Adams, R.D.; Peppiatt, N.A. Stress Analysis of Adhesive-Bonded Lap Joints. J. Strain Anal. 1974, 9, 185–196. [Google Scholar] [CrossRef]
- Reis, P.N.B.; Ferreira, J.A.M.; Antunes, F. Effect of Adherend’s Rigidity on the Shear Strength of Single Lap Adhesive Joints. Int. J. Adhes. Adhes. 2011, 31, 193–201. [Google Scholar] [CrossRef]
- Martínez, M.A.; de Armentia, S.L.; Abenojar, J. Influence of Sample Dimensions on Single Lap Joints: Effect of Interactions between Parameters. J. Adhes. 2020, 97, 1358–1369. [Google Scholar] [CrossRef]
- Ciardiello, R.; Boursier Niutta, C.; Goglio, L. Adhesive Thickness and Ageing Effects on the Mechanical Behaviour of Similar and Dissimilar Single Lap Joints Used in the Automotive Industry. Processes 2023, 11, 433. [Google Scholar] [CrossRef]
- Bigwood, D.A.; Crocombe, A.D. Elastic Analysis and Engineering Design Formulae for Bonded Joints. Int. J. Adhes. Adhes. 1989, 9, 229–242. [Google Scholar] [CrossRef]
- Goland, M.; Reissner, E. The Stresses in Cemented Joints. J. Appl. Mech. 1944, 11, A17–A27. [Google Scholar] [CrossRef]
- ISO 527-3:2018; BSI Standards Publication Plastics-Determination of Tensile Properties. British Standard: London, UK, 2018; ISBN 9780580927485.
- Ciampaglia, A.; Fiumarella, D.; Boursier Niutta, C.; Ciardiello, R.; Belingardi, G. Impact Response of an Origami-Shaped Composite Crash Box: Experimental Analysis and Numerical Optimization. Compos. Struct. 2021, 256, 113093. [Google Scholar] [CrossRef]
- Abbasi, M.; Ciardiello, R.; Goglio, L. Effect of Bonding Area Geometry on the Behavior of Composite Single Lap Joints (SLJ) and Estimation of Adhesive Properties Using Finite Element Method. J. Adhes. 2023. submitted. [Google Scholar]
- Kim, J.G.; Choi, I.; Lee, D.G.; Seo, I.S. Flame and Silane Treatments for Improving the Adhesive Bonding Characteristics of Aramid/Epoxy Composites. Compos. Struct. 2011, 93, 2696–2705. [Google Scholar] [CrossRef]


| Parameters | Mean Value | STD |
|---|---|---|
| Density(kg/m3) | 1450 | |
| Poisson’s ratio | 0.12 | |
| Longitudinal modulus (MPa) | 58,000 | 340 |
| Transverse modulus (MPa) | 58,000 | 340 |
| Longitudinal tensile strength (MPa) | 440 | 16 |
| Longitudinal tensile ultimate strain | 0.0072 | |
| Longitudinal compressive strength (MPa) | 453 | 36 |
| Longitudinal compressive ultimate strain | 0.096 | |
| Transverse tensile strength (MPa) | 440 | 16 |
| Transverse compressive strength (MPa) | 453 | 36 |
| In-plane shear modulus (MPa) | 3900 | |
| In-plane shear strength (MPa) | 72 |
| Parameters | T1 (1.76 mm) | T2 (3.52 mm) | |
|---|---|---|---|
| L1 (10 mm) | W1 (10 mm) | E-L1W1T1 P-L1W1T1 | E-L1W1T2 P-L1W1T2 |
| W2 (20 mm) | E-L1W2T1 P-L1W2T1 | E-L1W2T2 P-L1W2T2 | |
| W3 (30 mm) | E-L1W3T1 P-L1W3T1 | E-L1W3T2 P-L1W3T2 | |
| L2 (20 mm) | W1 (10 mm) | E-L2W1T1 P-L2W1T1 | E-L2W1T2 P-L2W1T2 |
| W2 (20 mm) | E-L2W2T1 P-L2W2T1 | E-L2W2T2 P-L2W2T2 | |
| W3 (30 mm) | E-L2W3T1 P-L2W3T1 | E-L2W3T2 P-L2W3T2 | |
| Property | Polyurethane (ADEKIT A 236/H 6236) | Epoxy (SIKAPOWER-1277) |
|---|---|---|
| E (MPa) | 278 | 2500 |
| SIG ultimate (MPa) | 13 | 35 |
| Elongation (%) | 22 | 4.1 |
| Adhesive Type | Studied Parameter | Parameter Increased by (%) | Peak Force (%) | Joint Stiffness (%) | Shear Stress (%) | Normal Stress in Substrates (%) |
|---|---|---|---|---|---|---|
| Polyurethane | L | 100 | 88.4 | 59.4 | −7 | 105.7 |
| W | 100 | 101.5 | 84.3 | ±1.5 | ±3 | |
| T | 100 | 16.9 | 47.2 | 17.5 | 24.8 | |
| Epoxy | L | 100 | 47.7 | 10.4 | −27.4 | 51.2 |
| W | 100 | 100 | 83.7 | ±2 | ±1 | |
| T | 100 | 46 | 65.7 | 43.7 | 29.8 |
Disclaimer/Publisher’s Note: The statements, opinions and data contained in all publications are solely those of the individual author(s) and contributor(s) and not of MDPI and/or the editor(s). MDPI and/or the editor(s) disclaim responsibility for any injury to people or property resulting from any ideas, methods, instructions or products referred to in the content. |
© 2023 by the authors. Licensee MDPI, Basel, Switzerland. This article is an open access article distributed under the terms and conditions of the Creative Commons Attribution (CC BY) license (https://creativecommons.org/licenses/by/4.0/).
Share and Cite
Abbasi, M.; Ciardiello, R.; Goglio, L. Experimental Study on the Effect of Bonding Area Dimensions on the Mechanical Behavior of Composite Single-Lap Joint with Epoxy and Polyurethane Adhesives. Appl. Sci. 2023, 13, 7683. https://doi.org/10.3390/app13137683
Abbasi M, Ciardiello R, Goglio L. Experimental Study on the Effect of Bonding Area Dimensions on the Mechanical Behavior of Composite Single-Lap Joint with Epoxy and Polyurethane Adhesives. Applied Sciences. 2023; 13(13):7683. https://doi.org/10.3390/app13137683
Chicago/Turabian StyleAbbasi, Mohammad, Raffaele Ciardiello, and Luca Goglio. 2023. "Experimental Study on the Effect of Bonding Area Dimensions on the Mechanical Behavior of Composite Single-Lap Joint with Epoxy and Polyurethane Adhesives" Applied Sciences 13, no. 13: 7683. https://doi.org/10.3390/app13137683