1. Introduction
The existence of urban parks is beneficial to the physical and mental health of residents [
1,
2]. They also serve as gathering and social platforms, fostering community awareness and improving the quality of life for urban residents [
3,
4,
5,
6]. Compared to busy streets, parking lots, and city squares, parks provide opportunities for passive activities [
7], allowing people to enjoy landscapes, rest, linger, and contemplate. Therefore, parks cater to various needs. China is currently in the stage of promoting new urbanization and building a moderately prosperous society. The focus of urban development has shifted from extensive construction to high-quality transformation, from incremental development to stock renovation. Urban residents have developed a dual pursuit of materialism and spiritualism, urgently focusing on a people-centered, shared, and sustainable social environment.
In recent years, scholars have primarily focused on research applications related to the layout and optimization of green infrastructure accessibility [
5,
8,
9]. With the ongoing process of urbanization, changes in population structure are also synchronizing, with aging, declining birth rates, and issues of population movement across regions and national boundaries, such as refugee crises, gradually emerging [
10,
11]. Consequently, marginalized groups, including the elderly, children, ethnic minorities, and people of color, have become the focus of research in this field [
12,
13]. The perspective of equity in park space utilization intertwines with the concept of landscape justice [
9,
14].
Furthermore, the impact of the COVID-19 pandemic has raised concerns about park maintenance and mitigation functions. This could have a significant impact on marginalized groups as they not only have special needs but also face higher infection risks [
15]. Comprehensive management measures need to be implemented to maintain social distancing in urban areas and ensure the safety of green spaces [
16,
17]. Inclusive design embodies an egalitarian and forward-thinking philosophy [
18], which brings to mind the concept of landscape justice. It has drawn the attention of researchers as it advocates for environments that provide various spaces and opportunities for people of different abilities to utilize them appropriately [
19].
However, previous research still lacks a comprehensive study on the inclusiveness of urban park utilization. To be more specific, firstly, the features of park inclusiveness are currently not clearly defined. Secondly, there is a lack of research on how urban parks meet the needs of different population groups and promote equitable access. Thirdly, though the importance of inclusive design is recognized, there is a lack of specific evaluation tools to measure and assess the inclusiveness of urban parks, analyze their current status, and identify variables that cause differences in inclusiveness levels.
Therefore, the objective of this study is to construct a Park Inclusiveness Design Index (PIDI) and evaluate urban parks in Hangzhou. Through the analysis of relevant data, this study aims to identify the characteristics and challenges of inclusive design in Hangzhou’s urban parks and emphasize the importance of equality and inclusivity in park spaces. The innovation lies in the establishment of the index through a multi-dimensional approach, including literature collection, focus groups, and hierarchical analysis based on the capability demand model. The primary contribution of this study is to provide a systematic evaluation framework that can assist urban planners and designers to better understand and improve the inclusiveness of parks. Furthermore, the research findings will also serve as a reference for other cities, promoting the sustainable development and social inclusiveness of urban parks.
2. Literature Review
The current research on evaluating the inclusiveness of park design is generally conducted through two methods: The first method involves the development of an evaluation framework based on theoretical constructs, often grounded in relevant design theories such as inclusive design and universal design. Zhang and Feng [
20] identified hierarchy, accessibility, safety, and psychological perception as key components of urban public spaces. In this regard, significant progress has been made by studies that proposed a qualitative assessment model for inclusive public spaces. The model covers six dimensions based on universal design principles, including play activities, amenities and opportunities, pathways and entrances, accessibility, natural features, and adjacency [
21]. The evaluation criteria also include 11 secondary indicators, namely transparency of accessibility information, external accessibility, facility access solutions, restroom services, safety systems, and internal accessibility guidance. Additionally, quantitative analysis studies based on the capability demand model [
22,
23] have identified pilot user groups by evaluating and analyzing users’ abilities and needs [
24]. The results revealed unmet needs among marginalized groups, highlighting the urgency to address safety, accessibility, and regular maintenance as inclusivity requirements [
25].
The second approach involves obtaining research findings through the application of different evaluation methods, including qualitative and quantitative research. For example, a model encompassing 30 factors influencing individuals’ perception of inclusive features in urban parks was constructed through data coding and analysis. This model further clarifies the paths and key factors for inclusive evaluation, providing theoretical references for future landscape justice research and practices [
26]. Furthermore, visual accessibility was determined with an experiential landscape approach, while physical accessibility and activity intensity along pathways were measured using space syntax methods [
27]. In the USJ area of Malaysia, geographic information system (GIS) technology was utilized, applying Moran’s I and Local Indicators of Spatial Association (LISA) to analyze the accessibility of youth-friendly neighborhood parks [
28]. Additionally, studies have assessed the accessibility and usability of public parks and playgrounds in New Zealand using national standards and international guidelines, revealing design, environmental, and safety issues that may hinder the participation of people with disabilities at various stages [
29]. Moreover, drawing methods have also been employed as an intuitive and qualitative evaluation approach. Some researchers have used cross-sectional evaluations to compare the inclusive design of multiple parks [
21,
29]. Apart from park-focused evaluations, the inclusive design of park facilities has also proven to be an effective method for measuring park inclusivity [
30].
However, the literature review mentioned above has identified several research gaps. Firstly, there are concerns regarding the comprehensiveness of the evaluation frameworks. Most of the evaluation frameworks are partial and predominantly consist of qualitative descriptive statements, which present certain difficulties in the evaluation process. Secondly, although some studies have proposed evaluation frameworks and standards, there is a lack of detailed operational guidelines and practical experiences on how to apply these frameworks and standards to actual park design and planning. Additionally, the research samples and sample sizes are limited, with some studies having relatively small sample sizes that may not adequately represent the overall level of parks at the urban dimension. Consequently, the comprehensive level of inclusive design for parks at the urban dimension remains unknown. Finally, while some studies have considered the inclusivity differences of parks across different socioeconomic backgrounds, other potential influencing factors such as policy impacts, cultural differences, and regional factors have not been sufficiently explored.
Therefore, this paper asks the following two questions: (1) What is the current state of inclusive design in Hangzhou’s urban parks? (2) What factors influence the level of inclusive design in urban parks in Hangzhou?
3. Model
This article provides the following definition for “inclusive design”: Inclusive design, initially introduced by Coleman, a professor at the Royal College of Arts in 1994, has been widely acknowledged in the design field as both a method and a process. The primary objective is to enable designers to ensure that their products cater to the needs of a broad range of users, regardless of age or abilities. Inclusive design can be regarded as a philosophical perspective and methodology that emphasizes equality, respects diversity, and maximizes the potential user population through various design approaches [
31].
In contrast, accessibility design, which has gained significant attention in China, focuses on eliminating environmental barriers to enable specific groups, such as the disabled and the elderly, to engage in social activities and exercise their rights. While these solutions are targeted, they may inadvertently exclude other user groups [
32] and carry the risk of stigmatization.
Basnak et al. consider accessibility design as a subset of inclusive design [
33], as the latter “considers all human environmental conditions, especially those that are typically overlooked”. However, many individuals perceive it as a progression beyond accessibility design [
34,
35,
36] and a remedy for the inefficient allocation of public resources. In the theory of inclusive design, disability is no longer attributed solely to the user’s impairment but is seen as the result of the interaction between the user’s abilities and the surrounding context. Furthermore, human capabilities evolve throughout the lifespan [
37]. By emphasizing mutual interaction and dynamic capabilities, the concept of inclusive design effectively moves away from the discrimination and stigmatization associated with disability.
While the composition of inclusive design for urban parks remains ambiguous, it can be inferred from the relationship between accessibility design and inclusive design that the scope of inclusive design for parks is more than accessibility design alone [
35]. Considering this ambiguity, it is valuable to revisit the theory of inclusive design itself. Therefore, our focus is on the integration of the capability demand model and the principles. The Inclusive Design Cube was developed based on the theory of the User Pyramid and introduced the capability demand model for users in 2007, examining the interaction between the two [
38,
39]. When the demands placed on the user by a product exceed their capabilities, design exclusion occurs. However, this model is more focused on applying to the assessment of inclusiveness of individual products and does not address broad environmental inclusiveness. Therefore, the construction logic of the PIDI borrows the match between user capabilities and product demands, and it is applied to the relationship between the requirements of urban park use and the capabilities of users.
In order to determine users’ capabilities, this study first identifies the pilot users of the park users and through documentation, field observation, and mapping constructs a pioneer user persona and summarizes their key differences and points for inclusive design. It is worth noting that the categories of “ethnic minorities” and “people of color” mentioned above, which were summarized based on the international literature, were dissolved based on the basic situation of Hangzhou and the pandemic period in which the research was conducted. In the end, the pilot users of Hangzhou Park were categorized into six major groups: the elderly, children, disabled people, strangers, carriers, and pregnant women. At the same time, these groups were subdivided into subgroups according to certain categorization bases so as to better refine the representative ability characteristics of these groups. Finally, the key points of inclusive design were summarized according to the characteristics, as shown in
Table 1. Identifying pilot users offers insights into the unique characteristics and challenges faced by various marginalized groups, addressing the essential aspects of inclusive design. This approach serves as a potential reference and guide for stakeholder selection and the formulation of relevant indices.
4. Methodology
This study was conducted in the following steps:
Step 1: Development of the PIDI. Firstly, a comprehensive review of inclusive design theories was conducted to establish the evaluation themes of the PIDI. Then, through a review and comparison of laws, regulations, and the literature, the secondary constructs and tertiary indicators were determined. Operational definitions, measurement standards, and rating scales were discussed in a focus group, and weights were assigned to these elements using the analytic hierarchy process (AHP). Lastly, the acceptance and validation of the identified indicators were measured through Likert scale assessment.
Step 2: Sample selection, training, and assessment implementation. Hangzhou was chosen as the research area due to its economic development, urban infrastructure, and green space construction. Training sessions were conducted to familiarize the assessment teams, consisting of junior students in the field of inclusive design, with the usage of the PIDI. These teams carried out on-site evaluations and assessments.
Step 3: Data collection, processing, and interpretation. Descriptive analysis of the data was performed to reflect the performance of inclusive design in Hangzhou, considering the overall, primary constructs, and cross-sectional comparisons. Additionally, potential factors influencing the index scores were speculated.
4.1. Development of the Park Inclusive Design Index
The creation of the index is a complex issue due to the ambiguity and complexity of the semantics of inclusive design. It requires detailed discussions on the content that the index should encompass. The discussion focused on the capability classifications corresponding to the primary constructs of the PIDI. According to the capability demand model, the corresponding constructs can be divided into three parts: the provision level of motor ability, the provision level of sensory ability, and the provision level of cognitive ability. The provision level of motor ability is the most comprehensive in terms of scope and nature, referring to the usage of park visitors in behavioral interactions. The provision level of sensory ability refers to the content that park visitors can perceive, including the range of sensory perception. The provision level of cognitive ability refers to the information provided by the park and the information processing conducted by visitors through sensory perception, cognition, memory, imagination, logic, and other brain activities.
Next, indicators were determined after the refinement of the primary constructs. Each primary construct was refined, the secondary constructs were conceptualized, and the indicators were determined. China’s national standards and local standards emphasize accessibility design but do not encompass the breadth of inclusive design [
41,
42]. For a more comprehensive understanding, comparisons were also drawn with laws, regulations, and standards from other countries. All these codes employed a combination of qualitative expression and quantitative settings, referring to design dimensions, depth, and formulation methods [
43,
44,
45].
Then, in June 2020, this study recruited citizen representatives from Hangzhou to participate in the research. From the initial volunteer recruitment, 30 pilot users and stakeholders from different institutions were selected to discuss the optimization of the PIDI index. The focus group included different types of park users and representatives from academia, management, design agencies, etc.
The first round of focus group discussions lasted 60 min. The representatives were randomly divided into five groups of six. The first part of the discussion was about the park experience. Participants were asked to recall the highlights of their recent visits in preparation for the second stage of the discussion. Then, the facilitator explained the constructs and indicators of the PIDI, and participants were asked to comment on them by relating to their experiences. The third stage involved discussion on how to operationalize the indicators. Likert scales for assessment were used to indicate the participants’ degree of agreement or disagreement on a five-point scale ranging from “completely agree” to “completely disagree”. Numerical indicators used numbers as standards, while descriptive indicators required a unified judgment criterion.
After the discussion, the judgment matrix tables were distributed to each representative, and the AHP was used to determine the weights. Representatives rated the third-level indicators to compare their importance, with a scoring range of 1–9. The same method was used to determine the weights of the secondary constructs and primary constructs. The weight ranking from bottom to top helped representatives better understand the relationships and prioritize the constructs at each level based on their importance. Finally, the feature vectors were normalized to obtain weights.
After statistical analysis and ranking of the weight results, predicted challenges emerged, reflecting the contradictions in the philosophy of inclusive design: for some constructs that leaned toward the interests of all stakeholders, it was difficult to determine the weights, and representatives had different opinions. Therefore, a second round of video conferences for targeted discussions was conducted. Representatives took turns expressing their opinions on conflicting indicators, followed by voting.
Furthermore, a consistency test was conducted to avoid logical errors in the importance assessment. We used the total multiplication algorithm and the first formula below to calculate the maximum eigenvalue (
). Then, we used the second and third formulas to calculate the consistency ratio (
CR) for each behavioral level and indicator. The calculation of the consistency ratio (
RI) can be obtained based on Saaty’s research [
46], see Equation (1). To ensure that the weights of each construct level pass the consistency test, we need to maintain a
CR value not exceeding 0.1; for the results, see
Table 2.
Finally, we obtained a complete PIDI consisting of 3 primary constructs, 14 secondary constructs, and 60 third-level indicators, see
Table 3.
4.2. Assessment Process
The study chose Hangzhou as its sample area considering the city’s level of economic development, the level of urban infrastructure, and the construction of green spaces. In addition, the geographical advantages allowed the team to minimize research costs and human resources. Hangzhou’s goal is to promote the construction of a “park city” and to “make parks a green space shared by the people”, which coincides with this study’s objective of investigating the performance of inclusiveness and identifying gaps in the design and management of urban parks. Therefore, the conclusions of this study will be useful for the relevant authorities to grasp the current situation of the inclusive performance of parks in Hangzhou and to understand the problems faced by parks. Hangzhou is a pioneer in the construction of urban parks in China, and taking Hangzhou as a case study, the results of this study are relevant for other cities in China and even globally.
Between June 2020 and March 2021, two park mapping training sessions were organized. A total of 8 assessment teams, comprising junior students specializing in inclusive design within the Environmental Design Practical courses, received training on utilizing the PIDI. The distribution of a PIDI manual and relevant lectures facilitated objective assessments through observation, measurement, and recording. Subsequently, the research group accompanied the assessment teams to an urban park in Hangzhou, providing on-site explanations and demonstrations of the assessment process. The teams were guided to rehearse the assessment within the same park to address and resolve any encountered challenges.
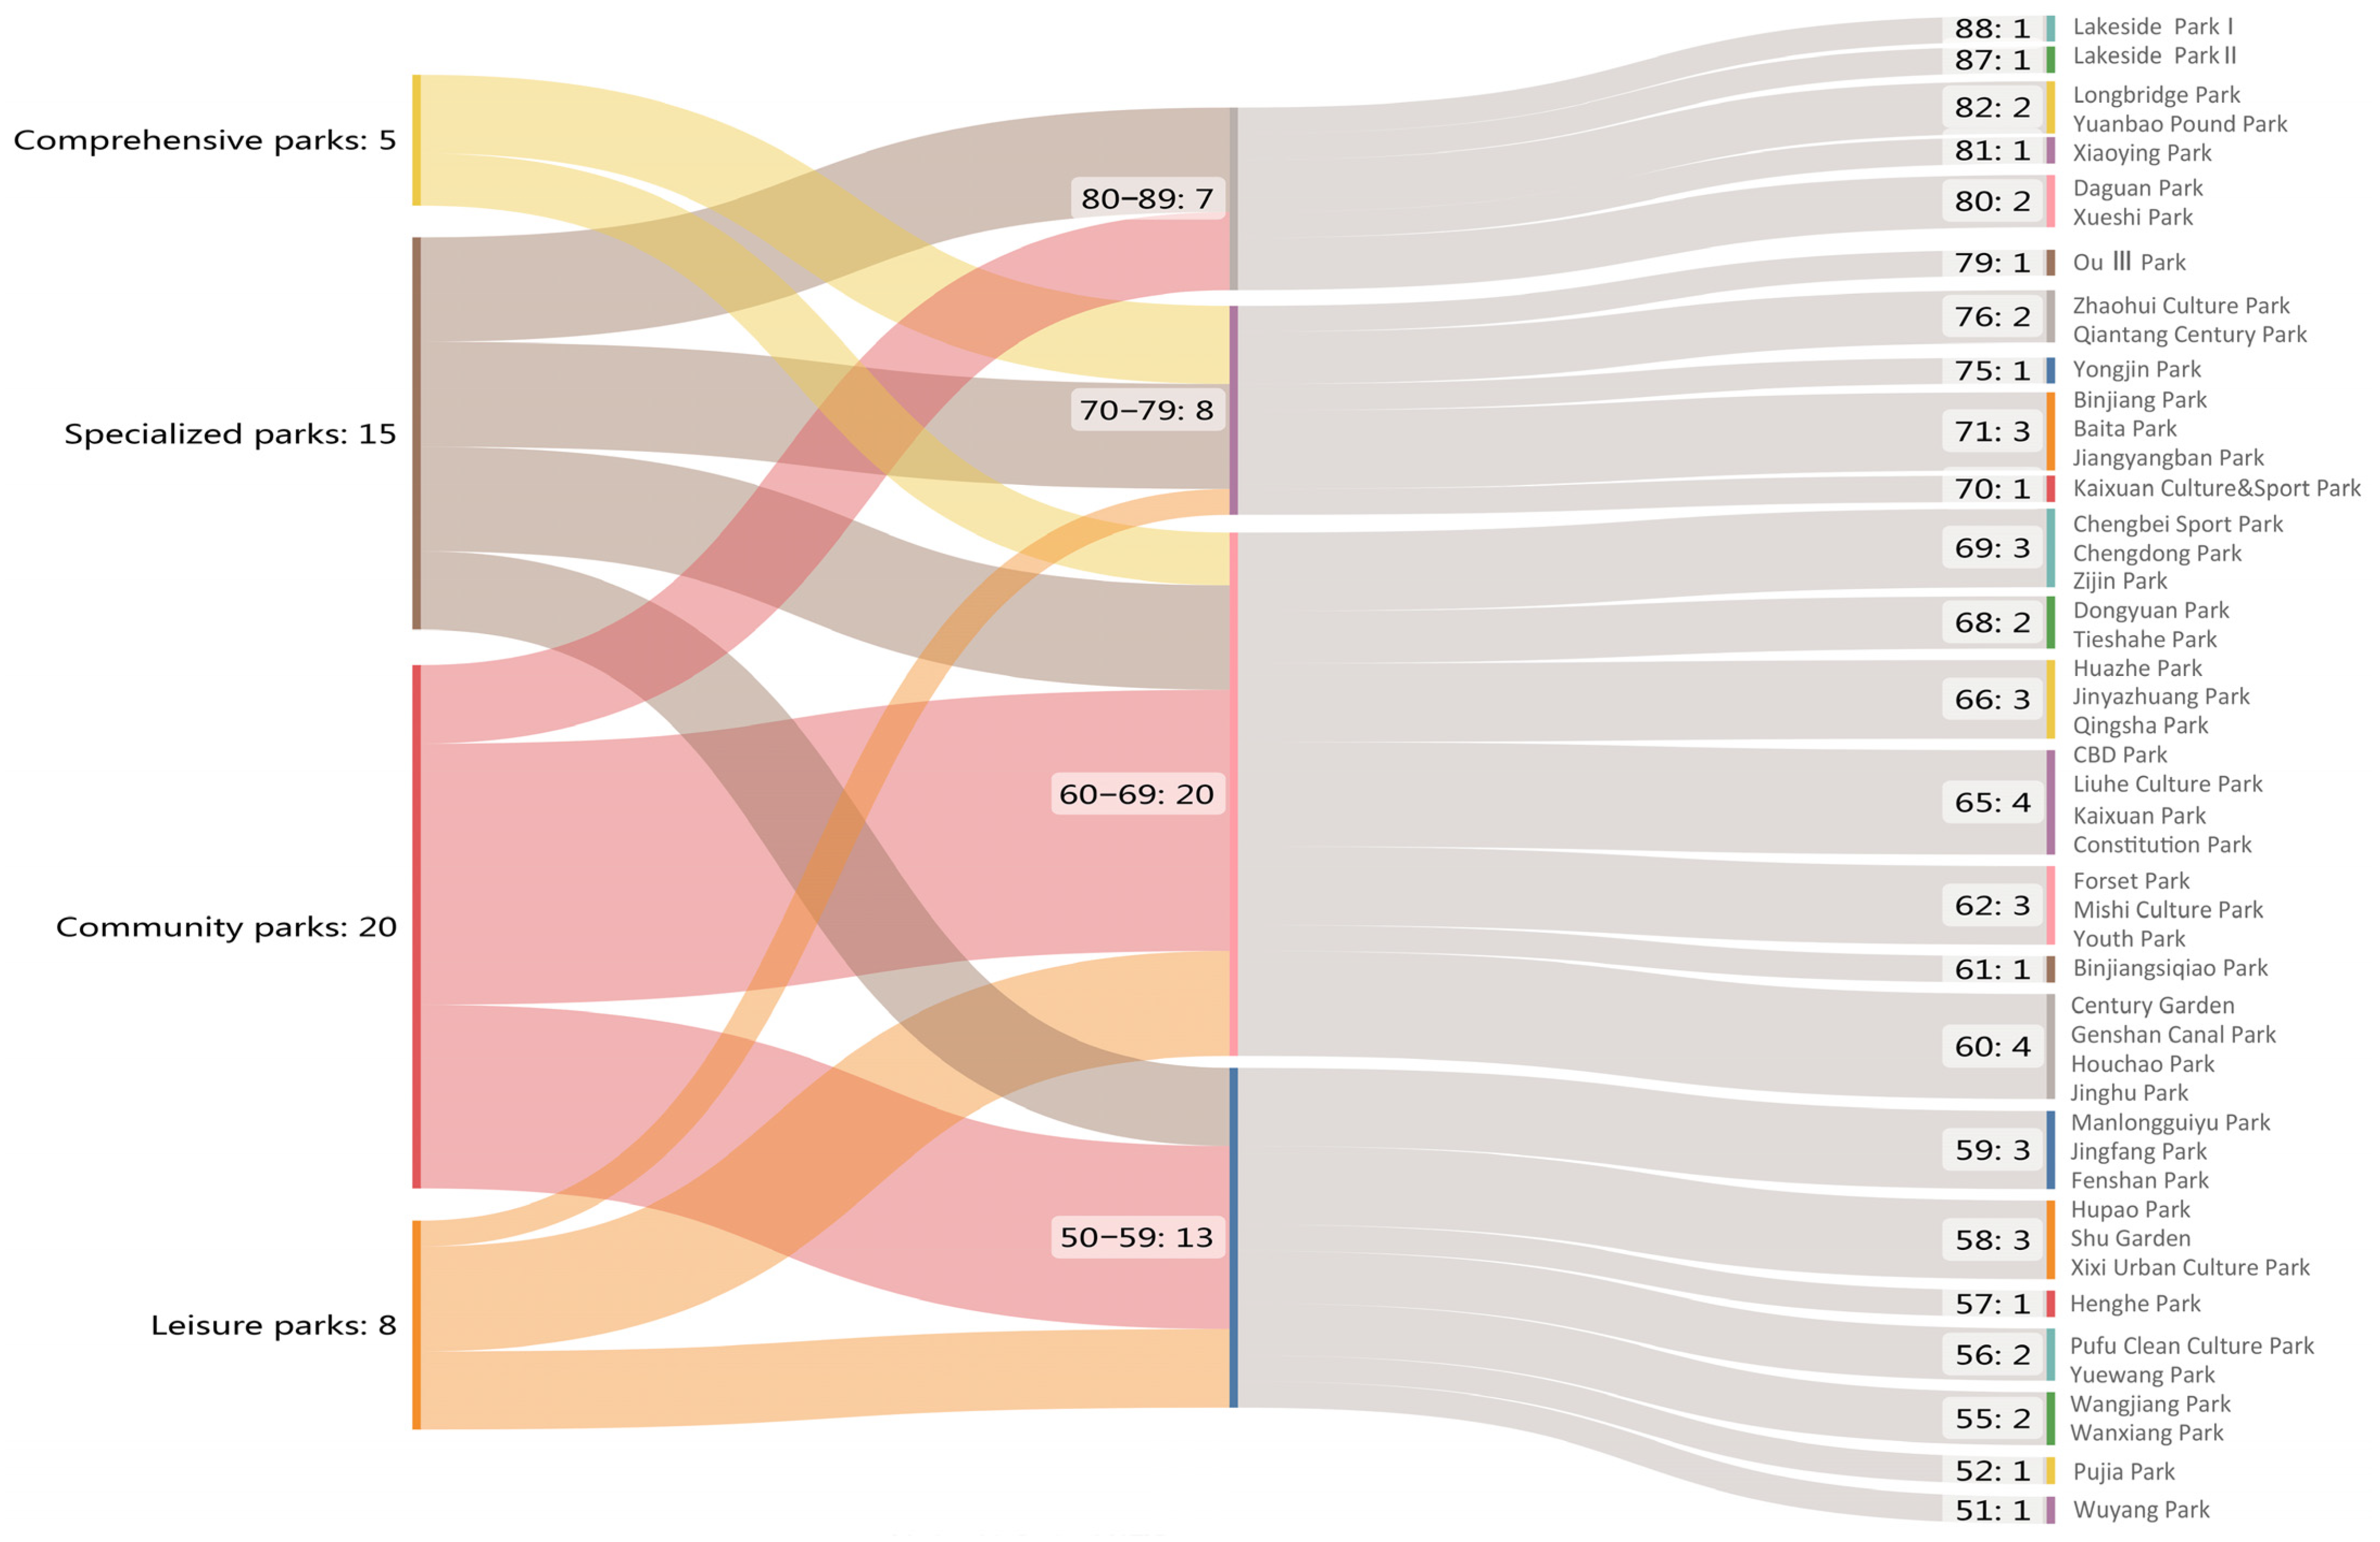
Each assessment team randomly selected 2–3 parks within Hangzhou’s urban area, with 48 urban parks in total. According to the industry standard, parks with an area of more than 10 hectares and the ability to provide various activities are comprehensive parks. Parks with independent land uses and an area greater than 1 hectare are community parks. Parks with a specific theme are specialized parks. Striped and small parks are leisure parks. The selected parks encompassed 5 comprehensive parks, 20 community parks, 15 specialized parks, and 8 leisure parks [
47]. As part of the assessment, the PIDI and mapping methods were employed to observe, measure, evaluate, and document the levels of motor, sensory, and cognitive abilities, while refining visual landscape information.
4.3. Data Processing and Analysis
The evaluation results from the 48 parks, along with corresponding on-site photographs, were meticulously recorded in Excel spreadsheets and organized into archival folders to facilitate the systematic analysis and interpretation of the collected information.
Quantitative analysis was performed on the Excel data, utilizing IBM SPSS Statistics 26 to derive descriptive statistics, including means, standard deviations, and frequency distributions. These statistical measures provided a comprehensive overview of the evaluated parks’ performance in terms of inclusivity and its various dimensions.
Based on data processing, the researchers initially interpreted the degree of inclusiveness of urban parks in Hangzhou through an overall score assessment. Then, a detailed description of the parks’ design inadequacies was given by analyzing individual indicators. Further, potential factors that might influence the inclusivity index scores were speculated upon, employing correlation studies. These factors encompass temporal elements, geographical location, urban planning, and land area utilization, among others. Lastly, this study conducted a macro- and micro-level analysis of the causes generating these variables.
5. Results
5.1. Overall Results
This study’s results obtained the confidence interval for the mean values of urban parks in Hangzhou. Furthermore, through the comparison of different types of parks, significant differences were observed in terms of average scores, dispersion, and distribution patterns, providing valuable insights for assessing park performance and quality.
By converting the 5-point scale scores of the PIDI into a 100-point scale, a comprehensive analysis of its statistical characteristics was conducted. The actual mean score of the PIDI was 66, with a median of 65 and a mode of 68. The highest score of 88 was obtained for Lakeside I Park, while the lowest score of 51 was for Wuyang Park. By calculating confidence intervals for the samples, it can be determined that the mean level of inclusive design in Hangzhou’s parks has a 95% probability of falling between 63 and 69. From an overall evaluation perspective, the average predicted PIDI score will not exceed 70 points, indicating that there is still a lot of room for improvement in the inclusive design of Hangzhou’s parks, see
Table 4 and
Figure 1.
5.2. Classification Results
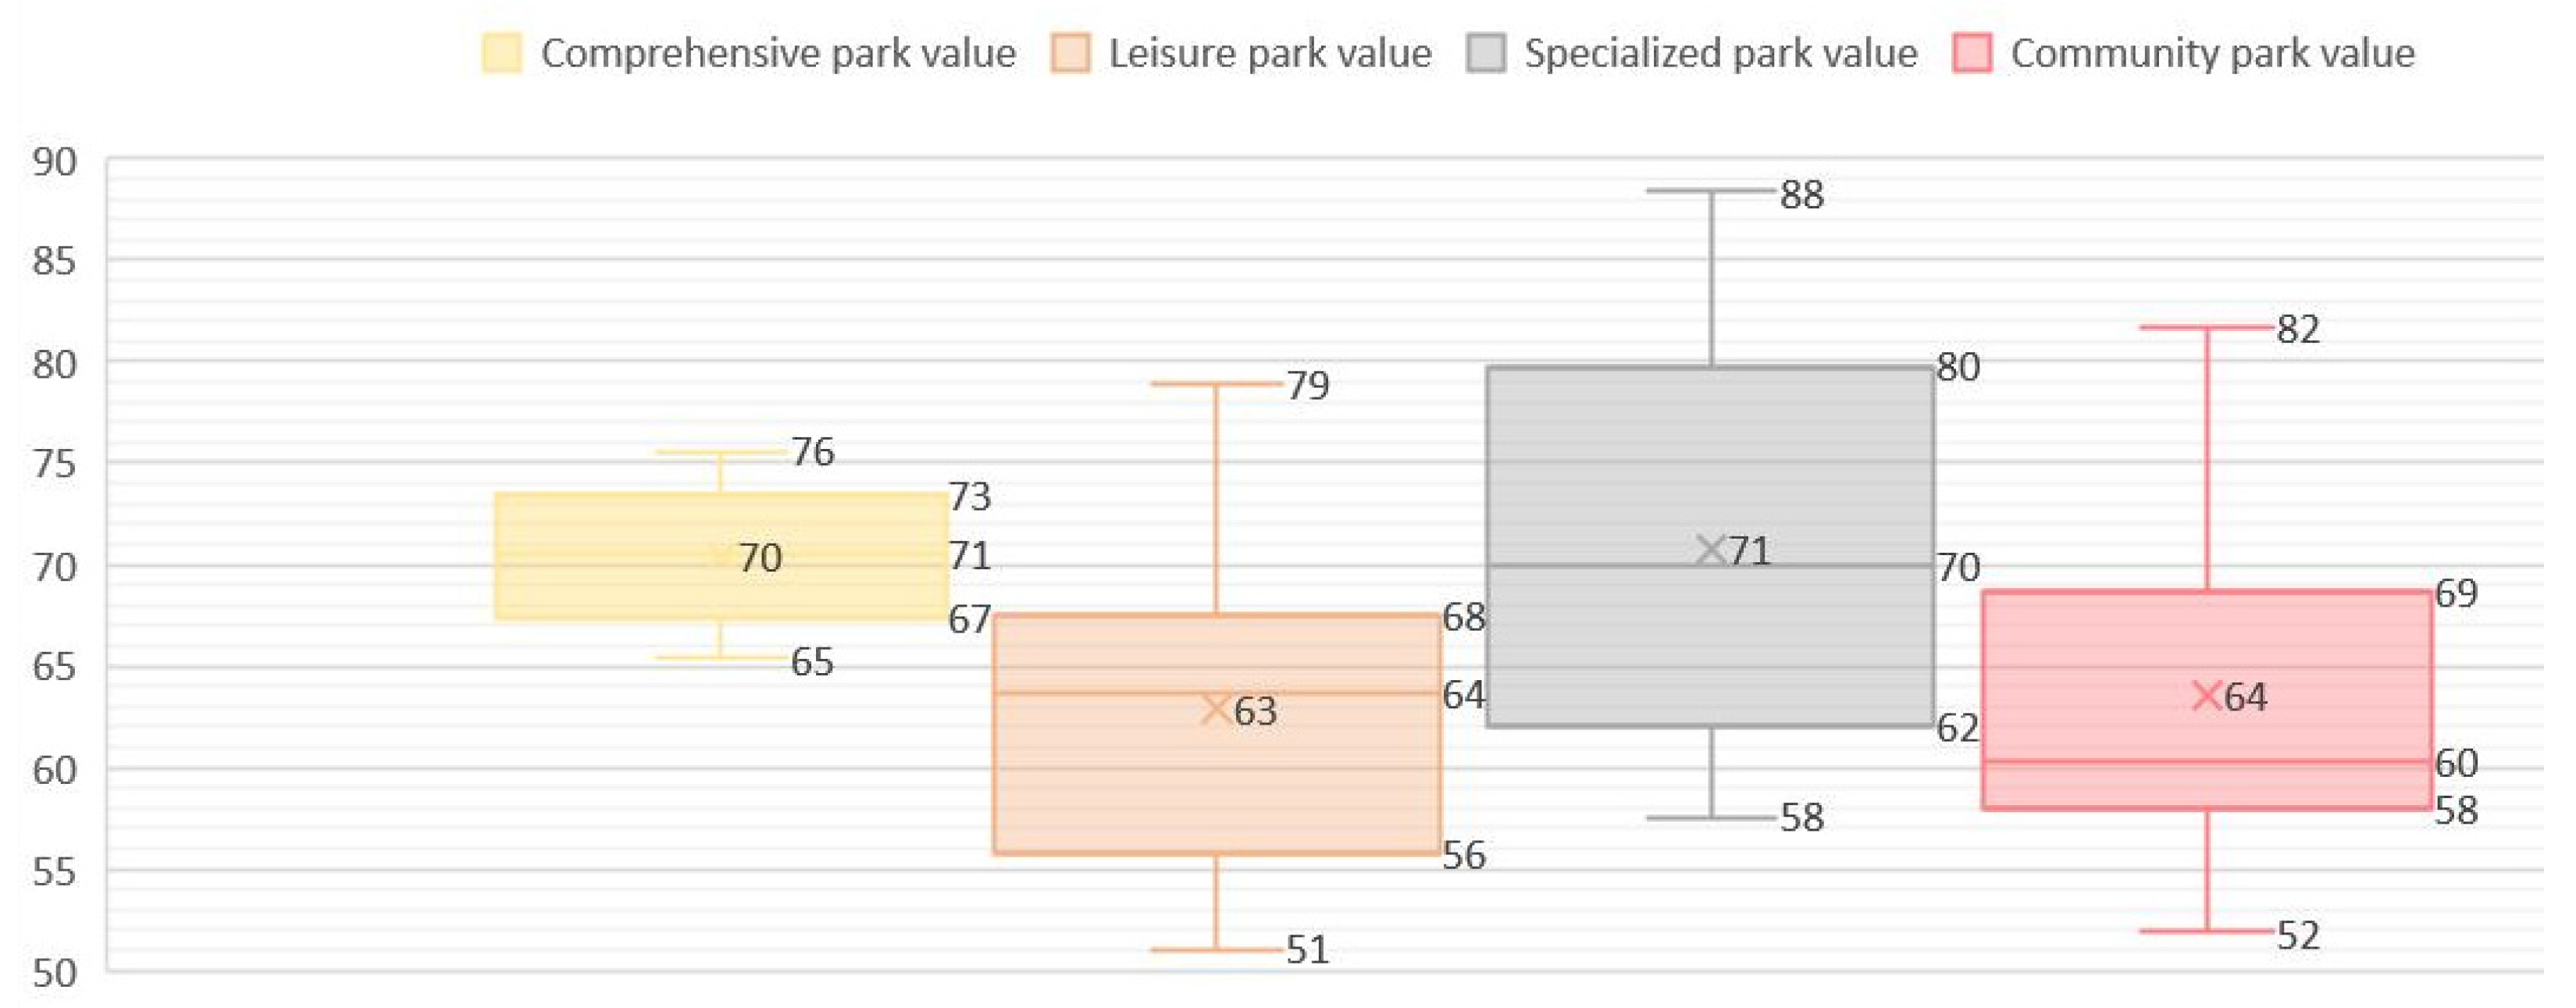
Regarding different types of parks, comprehensive parks had an average score of 70 with low uncertainty, a concentrated score around 71, and a smaller score range (65–76). Leisure parks averaged at 63, showing large score dispersion and significant PIDI score variation, with scores ranging from 51 to 79. Specialized parks scored an average of 71, demonstrating the widest score distribution and high design variation, with scores between 58 and 88. Community parks averaged at 64, with scores mostly around 60, and a wide score range of 52 to 82.
Table 4, and
Figure 2 show more detail of the PIDI scores for the four types of parks. The extreme, median, and mean values are listed separately.
5.3. Detailed Statistics
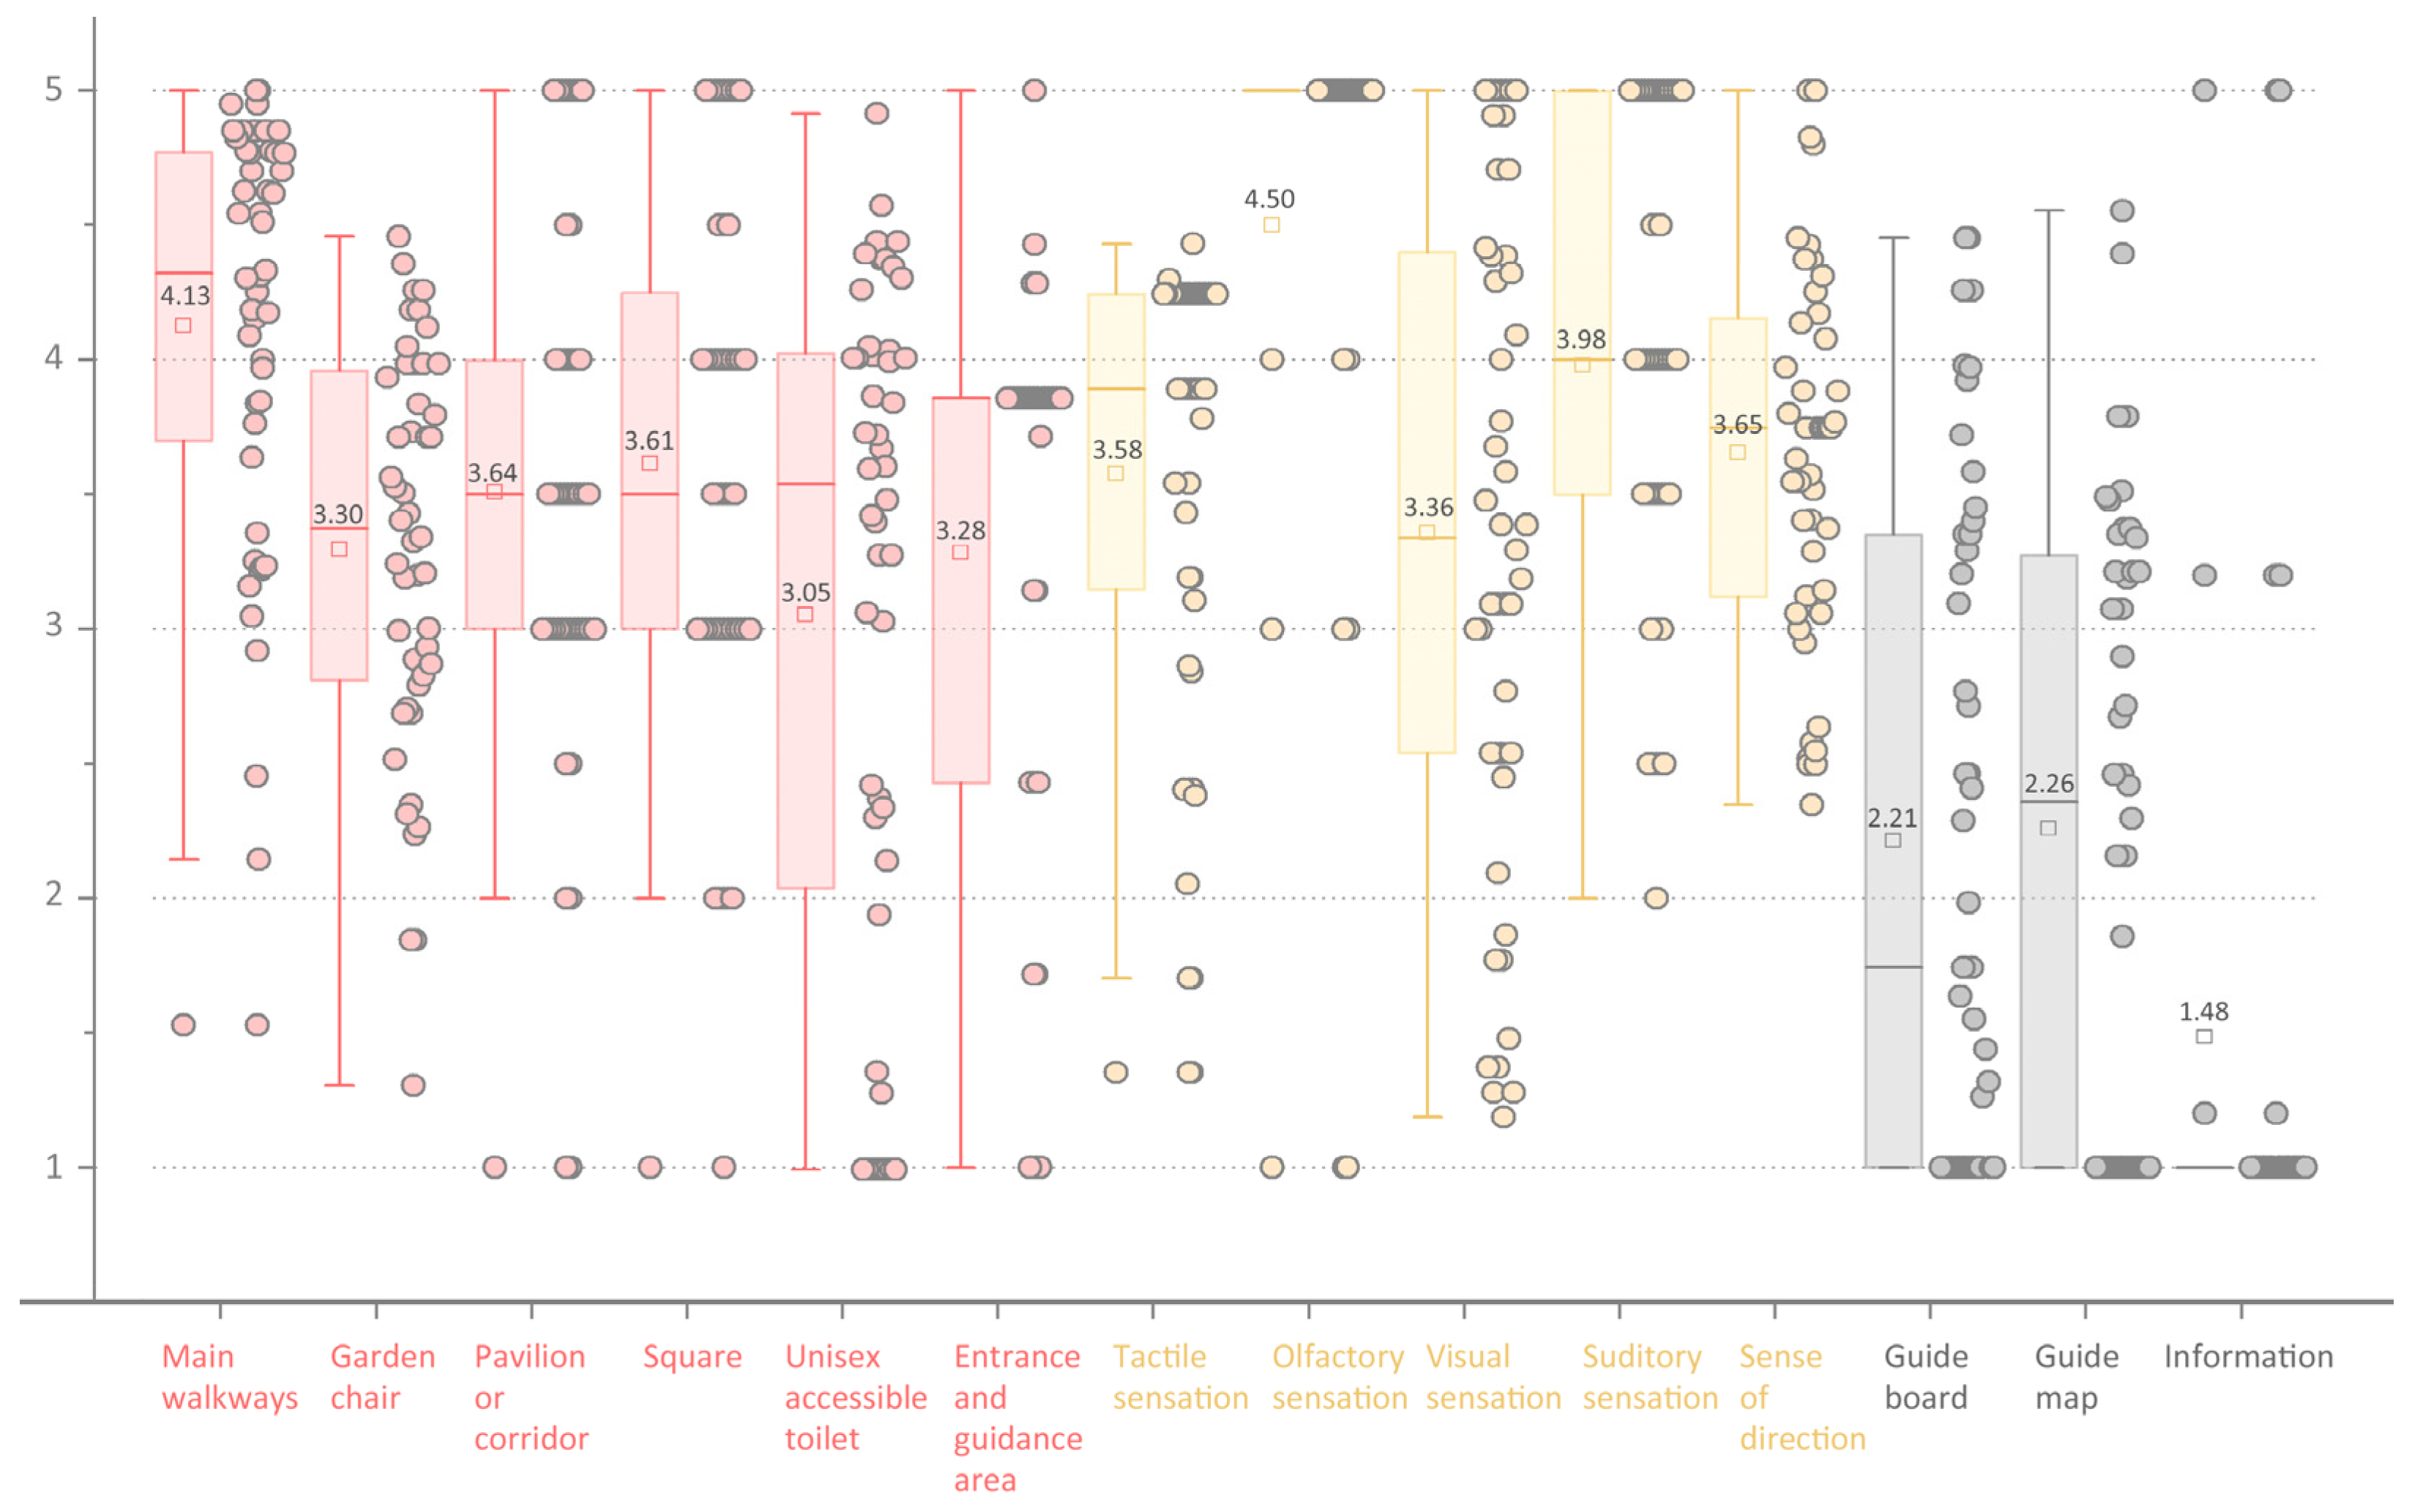
Exhaustive statistics on the scores of the indicators at each level are presented, revealing the levels of implementation of inclusive design. Of the three main dimensions—sensory capacity (3.65 points), mobility (3.45 points), and cognitive ability (2.25 points)—parks provided the best support for sensory capacity. This suggests a user-friendly environment that meets the perceptual needs. However, low support for cognitive abilities, indicative of high user demand, could lead to the exclusion of park use to some certain users.
5.3.1. Support for Motion Ability
The mobility support system of the park consists of six secondary structures, including main walkways, garden chairs, corridors, plazas, gender-neutral bathrooms, and entrances, among others. These facilities establish a harmony between the demand for the environment, facilities, services, and the park’s capabilities. The average score for the walkways was 4.13, indicating that the majority of walkways have accessible paths. Conversely, the lowest score for accessible restrooms was 3.05 with a significant degree of dispersion, indicating that many parks exhibit various levels of design quality in this aspect. Parks with lower scores need to increase and improve the number and facilities of accessible restrooms, as shown in
Figure 3.
Among the 31 tertiary indicators for providing mobility, there are 5 indicators which scored less than 2 points, including information desks, height of garden chairs, services, types of doors, and low urinals in accessible restrooms. All of these need improvements to enhance inclusivity, as shown in
Table 5.
5.3.2. Support for Sensory Ability
Five secondary structures correspond to five sensory systems. Among them, the olfactory system scored the highest average (4.50), and the observed parks showed consistent performances, leading to concentrated scores. The insufficient data volume resulted in the inability to form a boxplot. This structure indicates that the parks have good air quality and a variety of plants with different fragrances. On the other hand, the visual perception scored the lowest (3.36) with the highest dispersion, indicating that some areas lack sufficient lighting, such as restrooms and service centers, as shown in
Figure 3.
Among the fourteen indicators at the perceptual level, the only one which scored below 2 is tactile paving, indicating that parks still need improvement in setting up tactile cues, as shown in
Table 5.
5.3.3. Support for Cognitive Ability
None of the secondary constructs exceeded a score of 3, indicating a lack in the performance of park inclusivity in providing cognitive abilities. Information accessibility scored the lowest among all secondary constructs with a mean of 1.48, suggesting significant room for improvement in all parks. As observed parks performed consistently, scores were concentrated, and the data volume was insufficient to generate quartiles; hence, no boxplot could be created, as shown in
Figure 3.
Among the 15 indicators of cognitive ability, no indicators scored above 4, showing weak performance of the parks in providing cognitive support. Five indicators which scored below 2, such as multi-sensory design, new media communication, and interface design, all reveal design flaws in the park orientation system, such as inadequate text size and insufficient color contrast. These facts affect information transmission, as shown in
Table 5.
6. Discussion
6.1. Overall Analysis
According to the data, the overall performance of inclusive design in parks is in the middle range and varies between parks, which means that the performance of inclusive design is uneven and should be improved. This overall conclusion is consistent with those reached by other researchers in Algeria, India, and New Zealand [
27,
29,
30]. Among them, the inclusive design of comprehensive parks and specialized parks is relatively effective compared to leisure parks and community parks.
From the perspective of sub-indexes, at the level of perception, cognition, and motion support dimensions, there are indicators with average scores of lower than 2 points. This result is similar to the results of New Zealand’s park accessibility usability evaluation [
29], which shows that on these indicators, Hangzhou’s parks perform poorly in terms of inclusiveness, and some do not even meet barrier-free design standards.
6.2. Correlation Analysis
A correlation analysis was conducted between the renovation time, the park area, and the inclusive design performance indicator (PIDI) score. Firstly, a judgment was made on whether the data is normally distributed using Shapiro Wilk (n = 48) test. The results are shown in
Table 6. If the
p-values of all three columns of data are less than 0.05, the assumption of a normal distribution is rejected. All three do not conform to normal distribution, the PIDI score tends towards a normal distribution.
Considering that the data does not conform to a normal distribution, the Spearman correlation coefficient was used to verify the correlation. The results are shown in
Table 7. Among them, the correlation coefficient between the park area and the PIDI score is 0.365, indicating a moderate positive correlation between the two. The significance is 0.011, which is also a statistically significant result, indicating a significant correlation between the park area and the PIDI score. The correlation coefficient between the renovation time and the PIDI score is 0.443, indicating a moderate degree of positive correlation with a significance level of 0.002, which is far below the conventional significance threshold of 0.05. This indicates that this correlation is statistically significant. The results show both practical and considerable confidence in the correlation between the renovation time and the PIDI score.
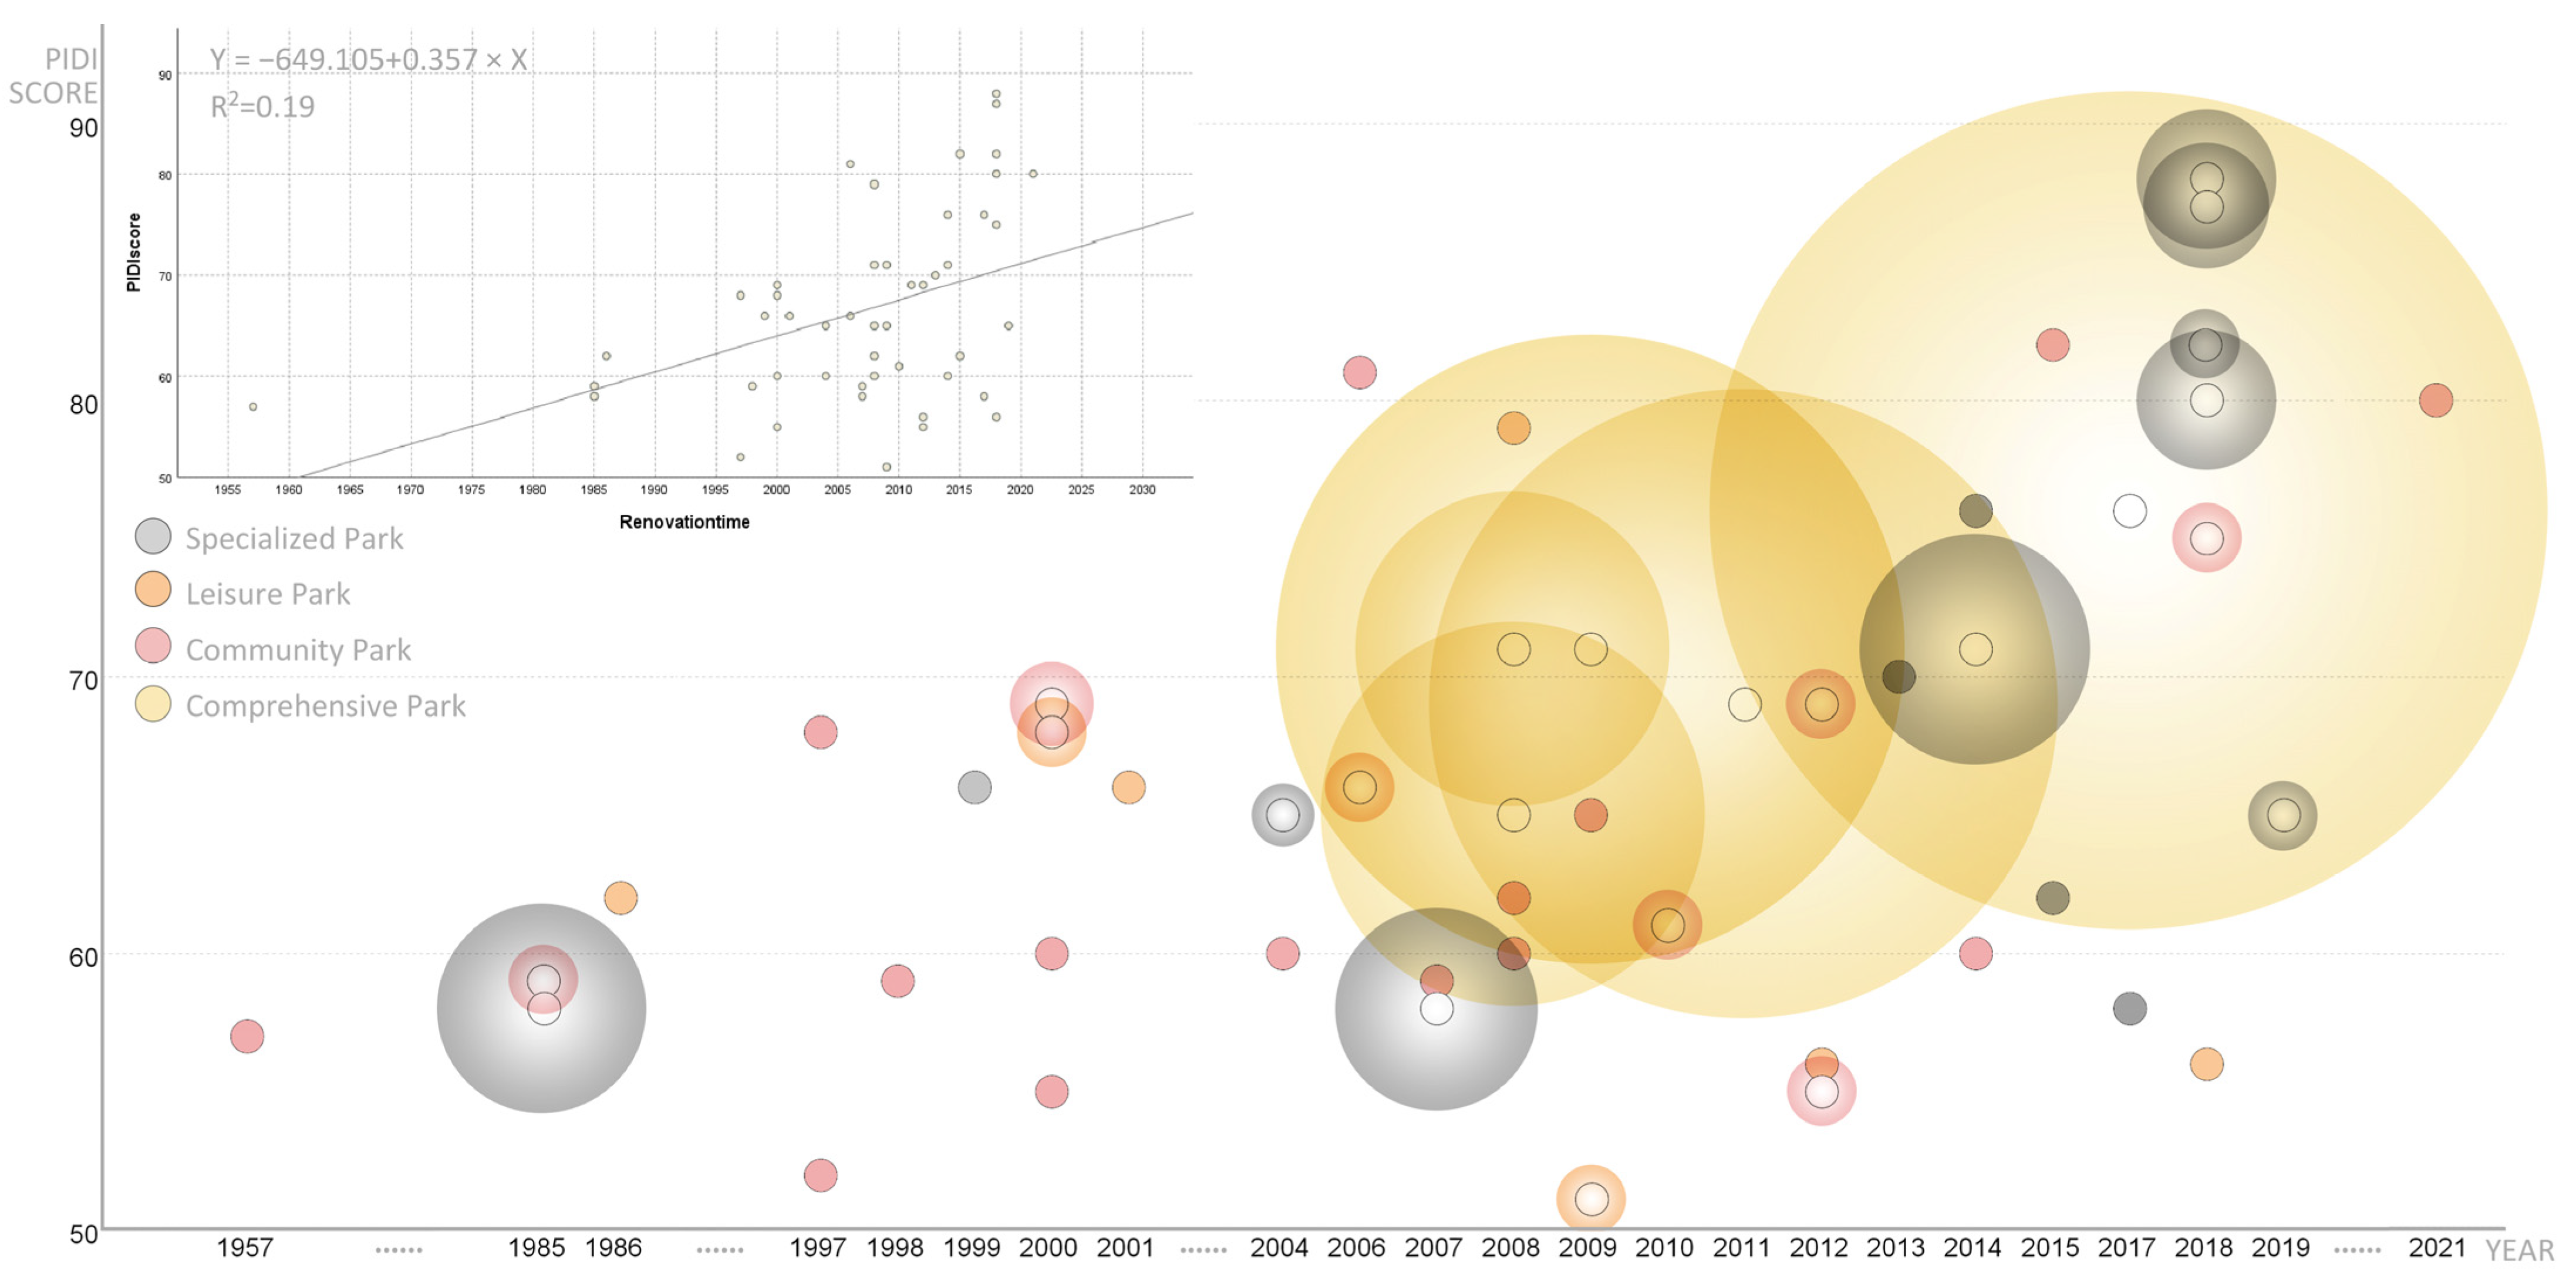
Then the linear regression analysis was performed to investigate the impact of park renovation time and park area on the PIDI scores. The results reveal a weak positive correlation between park renovation time and PIDI scores but no significant influence of park area on PIDI scores, see
Table 8 and
Figure 4.
The R value (correlation coefficient) of 0.44 indicates that there is a moderate degree of correlation between the independent variable (Renovation time) and the dependent variable (PIDI score). The renovation time accounts for 19.0% of PIDI score variance, as indicated by the adjusted R2 of 0.173. The derived regression equation is Y = −649.105 + 0.357 × X, where X is renovation time and Y is the PIDI score. Both the intercept and independent variable’s coefficient are statistically significant, suggesting renovation time significantly influences PIDI scores.
In contrast, the park area does not significantly predict the PIDI score variations, evidenced by corresponding p-value of approximately 0.115, indicating that the model is not statistically significant. The impact of the park area on the dependent variable is not statistically significant.
Comparing the conclusions of Spearman correlation analysis and linear regression analysis, it can be seen that the renovation time has a significant correlation with the PIDI score and presents a certain linear relationship. Park area is correlated with PIDI score, but it may be a nonlinear monotonic relationship, which is captured by Spearman correlation. This result suggests that the inclusiveness of parks in Hangzhou is related to the time of development and renovation. With the introduction and implementation of accessible design guidelines and the improvement in park development and construction, the inclusiveness of parks has increased. At the same time, the area of the park also affects the score of PIDI, as it is related to the classification of the park. The more comprehensive the park is, the higher the construction requirements.
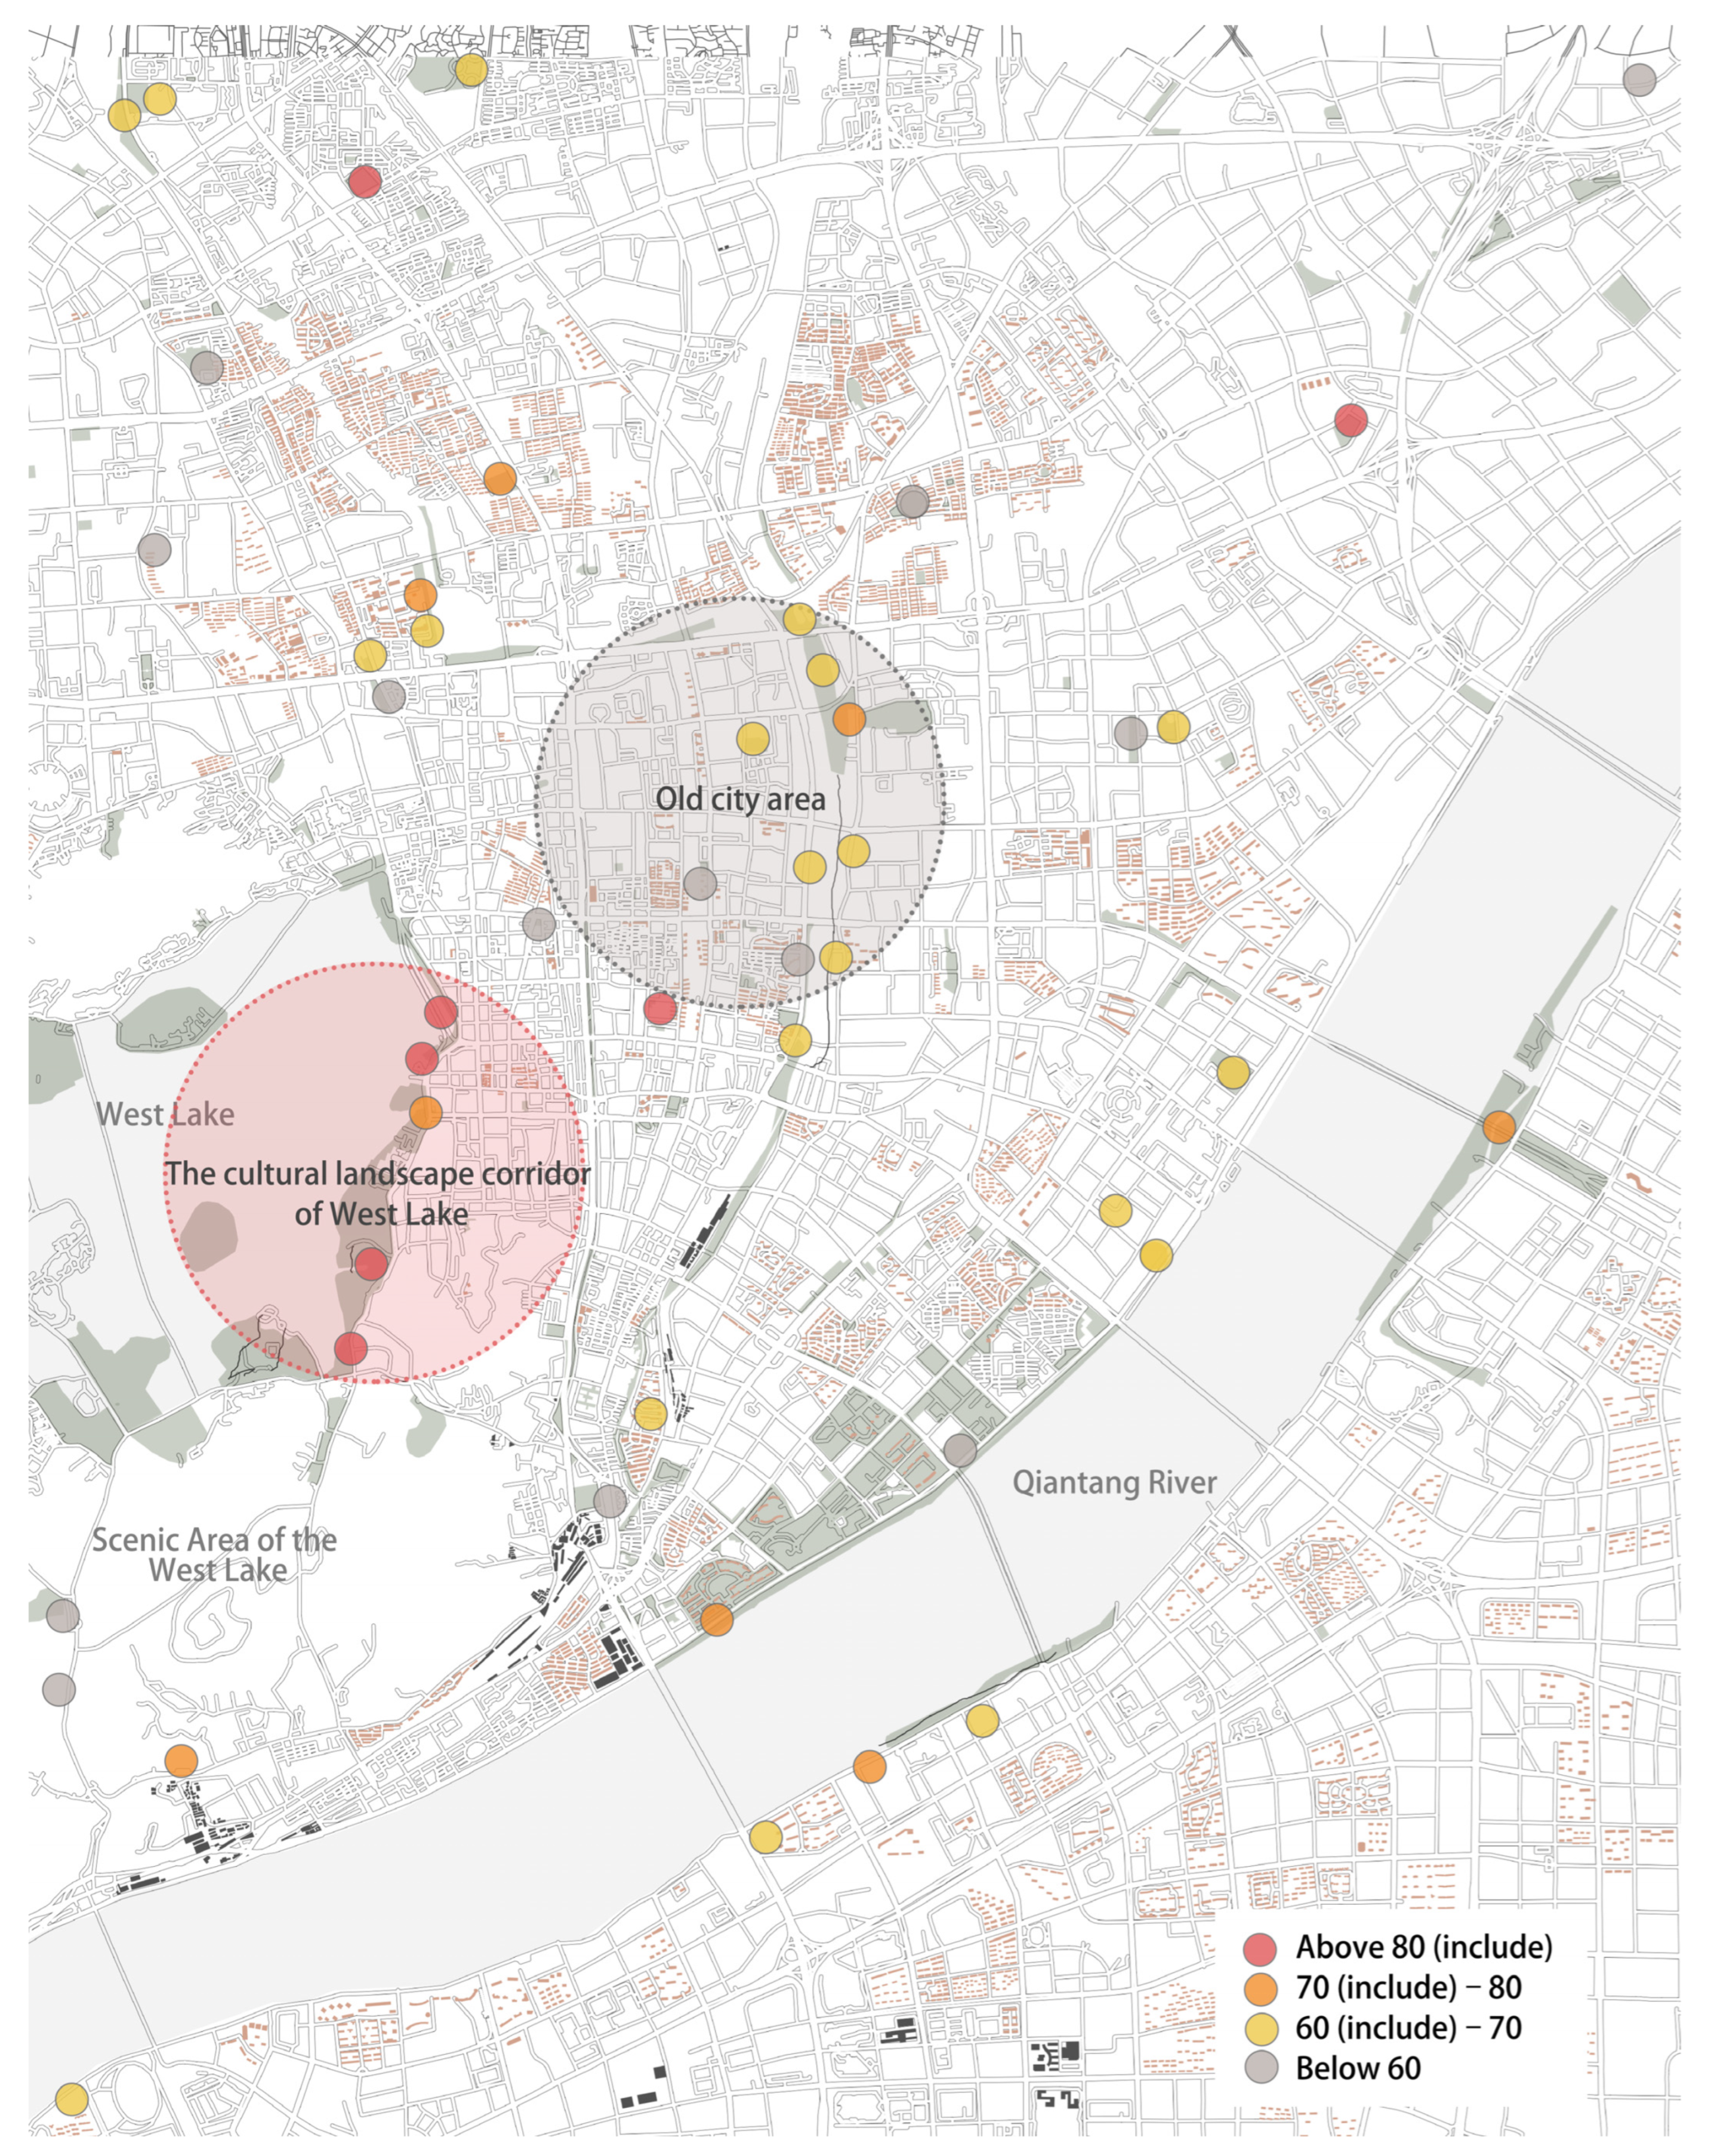
The analysis then proceeded to examine the mapping distribution to identify spatial patterns between the inclusive design of parks and geographical features. It can be observed intuitively that the inclusivity performance of urban parks varies and is unevenly distributed. Parks with better inclusivity design performance are concentrated along the West Lake (
Figure 5), a famous scenic spot in Hangzhou, while the rest are scattered across different sections. West Lake is a national top sightseeing site, and the “Hangzhou West Lake Cultural Landscape” has been officially listed as a World Heritage Site. With the introduction of free opening of the scenic area around the lake in Hangzhou in 2002, West Lake attracted thousands of tourists from home and abroad. Lakeside Park Ⅰ, Lakeside Park Ⅱ, Long Bridge Park, and Xueshi Park are all located in the cultural landscape corridor of West Lake (large red circle in
Figure 5). Due to their geographical location and spatial integration, the government attaches great importance to their inclusive design, which has also been highly praised.
At the same time, attention should be paid to the parks in the old city area where the inclusive design is insufficient (large grey circle in
Figure 5). This area was generally developed earlier and lacks opportunities for transformation. Therefore, there are deficiencies in design concept, park facilities, and maintenance.
In addition, some parks in old urban areas are also developing well. Da Guan Park in the north, Xiao Ying Park and Ou III Park near West Lake, and Kaixuan Culture and Sports Park in the east have been renovated under the government-endorsed “toilet revolution” and “park directory”, and the inclusive design has been greatly improved.
6.3. Multifaceted Factors Influencing Inclusive Design
From a macro-perspective, the year of construction and renovation is a variable that affects the total PIDI score. This is consistent with research conclusions from other countries. As time goes by, the equity of green resources in urban space will be promoted [
6,
8]. With the introduction and update of park design specifications and accessibility regulations, some newly built or renovated parks tend to provide more inclusion to meet the basic needs of disabled people and the elderly. In contrast, some old parks, especially those located in old neighborhoods, face greater challenges. The original design lacked standardization, the construction technology and materials were relatively backward, and there was a lack of consideration for human-centered design. At the same time, these parks lack opportunities for proper maintenance and renovation since age and lack of maintenance of various types of facilities have a negative impact on the performance of inclusive designs in these parks.
Secondly, the size of the park also influences the PIDI score. Overall, comprehensive parks and specialized parks exhibit better inclusive design compared to community and leisure parks. Larger parks, given their higher patronage, more complex functions and facilities, and stringent design standards, tend to be more inclusive. Therefore, the inclusive design of community parks deserves heightened attention. Their service radius typically ranges from 0.5 to 1 km and they have a higher usage rate among the elderly and children. At the end of the epidemic, more residents are changing their strategies to larger parks or neighborhood parks [
15], making the urgency of improving inclusive design even more acute.
Thirdly, location is a crucial factor impacting the inclusivity index. Governments or public organizations, such as construction management departments, vary in their readiness regarding policy, budget, planning effort, construction, maintenance, and operation due to location differences. West Lake and Qiantang River are iconic representations of Hangzhou’s urban landscape. Therefore, all stakeholders pay more attention to these parks, investing more financial and material resources. Some parks located in old urban areas are experiencing a sharp increase in elderly populations, resulting in higher-than-average demand for park use. Consequently, governments have been proactive in undertaking modernization and renovation projects to enhance accessibility. Therefore, it should be alerted to the fact that the unequal residential distribution of social groups may affect the issue of equity in the use of public facilities [
8]. Through the PIDI, the park’s planners and management can find basis and starting points to reduce this unfairness by improving internal humane design.
Microscopically, both subjective and objective perspectives lead to these influencing factors. Subjectively, there is bias and neglect towards inclusive design among designers and construction departments. Inclusive design poses considerable challenges to designers as it requires making trade-offs, increases budgets, labor, and time, and amplifies the complexity of the design process [
19]. These complexities and tortuousness lead to a negative impact on creativity and imagination. Chinese designers face increased difficulty in marrying inclusive design with aesthetics. The practices of traditional Chinese gardens adhere to the principles of “adapting measures to local conditions” and “appearing natural but artificial” contradict inclusive design. They sacrifice accessibility to achieve a lush landscape and a sense of neatness. In addition, the lack of design empathy [
48], lack of on-site experience, and the weak voice of marginalized groups are reasons for this neglect. Park maintainers and managers play an equally important role in the inclusive performance of parks. Most of the top-performing parks in this assessment have undergone renovation and remodeling, which is a necessary step for some historic parks to become more inclusive and visible. A key approach to making city parks more inclusive comes down to attracting a wider variety of user groups [
26]. Raising awareness of inclusive design in sustainable operations will help parks attract more users and promote the spread and integration of green infrastructure in cities.
Objectively, China’s accessibility design standard system also impacts score discrepancies across indicators. For some indicators mandated by accessibility design codes, such as accessible walkways and ramps, most parks can achieve basic design implementation. However, for indicators not specified in the codes, such as street furniture and accessible services and technologies, there is a deficiency in human-centric design thinking, resulting in exclusivity [
29]. Additionally, design specifications lack purposeful, functional, and performance-based explanations, leading to rigid application, lack of independent thought, and deficiency in design creativity and breakthroughs. Consequently, accessibility design has become a form of dogma. Many design outcomes end up with strong exclusivity due to an insufficient understanding of user capabilities and behavior.
7. Conclusions
In the stage of constructing the evaluation index, this research not only fully considered the park design specifications of different countries and regions but also took into account park user groups with different abilities, using focus groups and the analytic hierarchy process to construct the index. In the data analysis stage, in addition to obtaining a comprehensive and intuitive inclusive performance status, we also looked for correlations from different factors such as area, time, and space, which is different from previous single-factor research.
This study found the following: (1) The park’s overall inclusive performance is moderate (the mean has a confidence interval between 66 and 69, Avg PIDI < 70), but its performance in providing cognitive support is insufficient (all cognitive ability indicators < 4). (2) The inclusive performance of comprehensive and specialized parks is better than that of community parks, and leisure parks. (3) There is a moderate positive correlation with the renovation time and PIDI score, as well as between park area and PIDI score. It is also related to the strength of the geographical location (scenic spot parks perform better; the parks in the old city perform worse). There are 10 indicators with average scores < 2 in terms of motion, sensor, and cognitive support. The above evaluation conclusions reveal common problems in the inclusive design of Hangzhou urban parks, namely insufficient attention at the beginning of the design, lack of or outdated standardization, and lack of maintenance and necessary management.
This study highlights the importance of inclusive design for urban parks, responds to principles of landscape justice, and draws the attention of designers and builders, operators, and maintainers to the needs of neglected and marginalized groups. At the research paradigm level, whereas earlier studies have viewed urban parks primarily in terms of accessibility to green infrastructure, this study expands the understanding of inclusive design in urban parks, tapping into potential opportunities for the challenges of landscape justice and green infrastructure development in urban development across China and worldwide. At the practical level, the promotion of inclusiveness in parks is a systematic, cross-temporal project, and this study provides an assessment framework that serves as a decision-support tool for urban planners and designers to better understand the current state of parks and promote inclusiveness in parks. At the same time, this study provides a benchmark for park managers to identify differences through the assessment framework, implement focused enhancement programs based on the results of the assessment, and monitor and maintain them in a sustainable manner.
Author Contributions
Conceptualization, W.S. and W.L.; methodology, W.S.; validation, W.S. and S.S.S.M.; formal analysis, W.S.; data curation, W.S.; original writing—draft preparation, W.S. and S.S.S.M.; writing, review, and editing, W.S. and S.S.S.M.; visualization, W.S.; project administration, S.S.S.M.; funding acquisition, S.S.S.M. All authors have read and agreed to the published version of the manuscript.
Funding
This study was funded by UTM Flagship COE/RG 1.2 (Universiti Teknologi Malaysia, code Q.J130000.5052.09G99, Grant No. PY/2022/04719). This study was also funded by Guangdong Philosophy and Social Science Planning 2023 Youth Project (Guangdong Provincial Philosophy and Social Science Planning Special Group, Grant No. GD23YYS16).
Institutional Review Board Statement
Not applicable.
Informed Consent Statement
Not applicable.
Data Availability Statement
All data generated or analyzed during this study are included in this published article.
Acknowledgments
The authors would like to acknowledge the Inclusive Design Research Group of the Environmental Design Practical courses, Dongfang College, Zhejiang University of Finance and Economics, the Centre for the Study of Built Environment in the Malay World (KALAM) at Universiti Teknologi Malaysia for the international collaboration enriching this study. The authors would also like to thank Hong Qianru, Liu Yihong, Cui Yitong and others at the department for the teaching and research assistance, and the focus group for carrying out the park assessment and their participation.
Conflicts of Interest
The authors declare no potential conflict of interest with respect to the research, authorship, and/or publication of this article.
References
- Groulx, M.; Freeman, S.; Lemieux, C. Accessible nature beyond city limits—A scoping review. J. Outdoor Recreat. Tour. 2022, 37, 100490. [Google Scholar] [CrossRef]
- Macfarlane, G.S.; Boyd, N.; Taylor, J.E.; Watkins, K. Modeling the impacts of park access on health outcomes: A utility-based accessibility approach. Environ. Plan. B Urban Anal. City Sci. 2021, 48, 2289–2306. [Google Scholar] [CrossRef]
- Comber, A.; Brunsdon, C.; Green, E. Using a GIS-based network analysis to determine urban greenspace accessibility for different ethnic and religious groups. Landsc. Urban Plan. 2008, 86, 103–114. [Google Scholar] [CrossRef]
- Wendel, H.E.W.; Zarger, R.K.; Mihelcic, J.R. Accessibility and usability: Green space preferences, perceptions, and barriers in a rapidly urbanizing city in Latin America. Landsc. Urban Plan. 2012, 107, 272–282. [Google Scholar] [CrossRef]
- Wei, F. Greener urbanization? Changing accessibility to parks in China. Landsc. Urban Plan. 2017, 157, 542–552. [Google Scholar] [CrossRef]
- Macedo, J.; Haddad, M.A. Equitable distribution of open space: Using spatial analysis to evaluate urban parks in Curitiba, Brazil. Environ. Plan. B Plan. Des. 2016, 43, 1096–1117. [Google Scholar] [CrossRef]
- Mahdzar, S.S.S. Sociability vs Accessibility Urban Street Life; University of London: London, UK, 2008. [Google Scholar]
- Xiao, Y.; Wang, Z.; Li, Z.; Tang, Z. An assessment of urban park access in Shanghai–Implications for the social equity in urban China. Landsc. Urban Plan. 2017, 157, 383–393. [Google Scholar] [CrossRef]
- Zhang, T.; Yue, Y. A Brief Review of the English Literature on “Landscape Justice” 1998–2018. Chin. Landsc. Arch. 2019, 35, 5–12. [Google Scholar]
- Wang, X.; Chen, T.; Lin, G. Study on the application of natural elements in urban parks’ children’s play spaces in China. Urban Plan. Int. 2021, 36, 40–46. [Google Scholar]
- Bendixen, K.; Benktzon, M. Design for All in Scandinavia—A strong concept. Appl. Ergon. 2015, 46, 248–257. [Google Scholar] [CrossRef]
- Byrne, J.; Wolch, J.; Zhang, J. Planning for environmental justice in an urban national park. J. Environ. Plan. Manag. 2009, 52, 365–392. [Google Scholar] [CrossRef]
- Chen, H.; Lyu, M. Universal Design practices of children’s playscape under the perspective of landscape justice. Zhuangshi 2020, 331, 23–28. [Google Scholar]
- Egoz, S.; De Nardi, A. Defining landscape justice: The role of landscape in supporting wellbeing of migrants, a literature review. Landsc. Res. 2017, 42 (Suppl. S1), S74–S89. [Google Scholar] [CrossRef]
- Dass, S.; O’Brien, D.T.; Ristea, A. Strategies and inequities in balancing recreation and COVID exposure when visiting green spaces. Environ. Plan. B Urban Anal. City Sci. 2023, 50, 1161–1177. [Google Scholar] [CrossRef]
- Wei, Z.; Yang, H.; Fang, C. Recent study and trend of usage condition of urban park analysis based on CiteSpace. Landsc. Archit. Acad. J. 2020, 11, 89–94. [Google Scholar]
- Shoari, N.; Ezzati, M.; Baumgartner, J.; Malacarne, D.; Fecht, D. Accessibility and allocation of public parks and gardens in England and Wales: A COVID-19 social distancing perspective. PLoS ONE 2020, 15, e0241102. [Google Scholar] [CrossRef] [PubMed]
- Li, W.; Yuan, S.; Dong, H. A design model for service co-creation involving children. Design 2020, 33, 82–85. [Google Scholar]
- Heylighen, A.; Van der Linden, V.; Van Steenwinkel, I. Ten questions concerning inclusive design of the built environment. Build. Environ. 2017, 114, 507–517. [Google Scholar] [CrossRef]
- Zhang, W.; Feng, X. The significance of Inclusive Design in public open space design and Building for the aging society. Chin. Landsc. Archit. 2012, 28, 30–35. [Google Scholar]
- Ayataç, H.; Pola, İ. No “obstacles” in playgrounds that are not only accessible but also inclusive. ICONARP Int. J. Archit. Plan. 2016, 4, 1–14. [Google Scholar] [CrossRef]
- Persad, U.; Langdon, P.; Clarkson, J. Characterising user capabilities to support inclusive design evaluation. Univers. Access Inf. Soc. 2007, 6, 119–135. [Google Scholar] [CrossRef]
- Johnson, D.; Clarkson, J.; Huppert, F. Capability measurement for inclusive design. J. Eng. Des. 2010, 21, 275–288. [Google Scholar] [CrossRef]
- Huang, Y.; Napawan, N.C. “Separate but equal?” Understanding gender differences in urban park usage and its implications for gender-inclusive design. Landsc. J. 2021, 40, 1–16. [Google Scholar] [CrossRef]
- Wu, K.C.; Song, L.Y. A case for inclusive design: Analyzing the needs of those who frequent Taiwan’s urban parks. Appl. Ergon. 2017, 58, 254–264. [Google Scholar] [CrossRef] [PubMed]
- Zhou, Z.; Lin, G. Research on the Influencing Factors of Users’ Perception of the Inclusiveness of Urban Parks Based on the Grounded Theory. Landsc. Archit. Front. 2022, 10, 12–37. [Google Scholar]
- Boucherit, S.; Maffei, L.; Masullo, M.; Berkouk, D.; Bouzir, T.A.K. Assessment of Sighted and Visually Impaired Users to the Physical and Perceptual Dimensions of an Oasis Settlement Urban Park. Sustainability 2023, 15, 7014. [Google Scholar] [CrossRef]
- Rosilawati, Z.; Chen, W.; Lincoln, C.W.; Dwi, R.Z.; Syahrul, N. Assessing the accessibility of youth friendly neighborhood parks: A case study in UEP Subang Jaya, Malaysia. J. Archit. Plan. Res. 2017, 34, 216–227. [Google Scholar]
- Perry, M.A.; Devan, H.; Fitzgerald, H.; Han, K.; Liu, L.T.; Rouse, J. Accessibility and usability of parks and playgrounds. Disabil. Health J. 2018, 11, 221–229. [Google Scholar] [CrossRef]
- Lee, Y.B.; Chan, L.D.; Tang, M.X. Park seating furniture design in Hong Kong: A case study of inclusive design and its relation to user interaction. In Proceedings of the Include Asia, Hong Kong, China, 2–3 July 2013. [Google Scholar]
- Clarkson, J.; Coleman, R. History of Inclusive Design in the UK. Appl. Ergon. 2015, 46 Pt B, 235–247. [Google Scholar] [CrossRef]
- Patil, M.V.; Bambawale, A. Evaluation of Usability of Public Parks in Satara City (W.R.T. Inlusive Design), Dist-Satara, Maharashtra. In Proceedings of the Virtual National Conference on Rural Architecture and regional planning, Pravara Rural College of Architecture, Loni, India, 3–4 February 2022. [Google Scholar]
- Basnak, M.; Tauke, B.; Weidemann, S. Universal design in architectural education: Who is doing it? How is it being done? In Proceedings of the ARCC 2015 Proceedings, Chicago, IL, USA, 6–9 April 2015. [Google Scholar]
- Dong, H. Inclusive Design: The Chinese Archive; Tongji University Press: Shanghai, China, 2019. [Google Scholar]
- Mahdzar, S.S.S.; Phua, C.Y.; Chan, W. The impact of spatial accessibility on mobility of wheelchair users at Kuala Lumpur, Malaysia. In Proceedings of the13th Space Syntax Symposium (van Nes A and Tan W), Bergen, Norway, 20–24 June 2022. [Google Scholar]
- Ormerod, M.G.; Newton, R.A. Moving beyond accessibility: The principles of universal (inclusive) design as a dimension in nD modelling of the built environment. Archit. Eng. Des. Manag. 2005, 1, 103–110. [Google Scholar] [CrossRef]
- Waller, S.; Langdon, P.; Clarkson, J. Designing a more inclusive world. J. Integr. Care 2010, 18, 19–25. [Google Scholar] [CrossRef]
- Keates, S.; Clarkson, P.J. Countering design exclusion: Bridging the gap between usability and accessibility. Univers. Access Inf. Soc. 2003, 2, 215–225. [Google Scholar] [CrossRef]
- Benktzon, M. Designing for our future selves: The Swedish experience. Appl. Ergon. 1993, 24, 19–27. [Google Scholar] [CrossRef] [PubMed]
- Wang, T.; Xiao, D.; Dong, Y.; Goossens, R.H.M. A framework of persona based on the structural characteristics of older adults’ social network. Packag. Eng. 2021, 42, 83–89+102. [Google Scholar]
- GB51192-2016; Code for the Design of Public Park. China Architecture & Building Press: Beijing, China, 2016.
- DB11/T746-2010; Specification of Barrier-Free Facilities Setting in the Park. China Architecture & Building Press: Beijing, China, 2016.
- ISO-21902-2021; Tourism and Related Services. International Organization for Standardization: Geneva, Switzerland, 2021.
- DIN 18040-3; Barrierefreies Bauen–Planungsgrundlagen–Teil 3: Öffentlicher Verkehrs–und Freiraum. German National Standards Organization: Berlin, Germany, 2014.
- Approved Document M. Access to and Use of Buildings: Approved Document M; Department for Levelling Up, Housing and Communities and the Ministry of Housing, Communities & Local Government in the United Kingdom: London, UK, 2015. [Google Scholar]
- Saaty, T. Relative measurement and its generalization in decision making why pairwise comparisons are central in mathematics for the measurement of intangible factors the analytic hierarchy/network process. RACSAM-Rev. Real Acad. Cienc. Exactas Fis. Nat. Ser. A Mat. 2008, 102, 251–318. [Google Scholar] [CrossRef]
- CJJ85-2017; Standard for Classification of Urban Green Space. China Architecture & Building Press: Beijing, China, 2017.
- Chang-Arana, Á.M.; Surma-Aho, A.; Hölttä-Otto, K.; Sams, M. Under the umbrella: Components of empathy in psychology and design. Des. Sci. 2022, 8, e20. [Google Scholar] [CrossRef]
| Disclaimer/Publisher’s Note: The statements, opinions and data contained in all publications are solely those of the individual author(s) and contributor(s) and not of MDPI and/or the editor(s). MDPI and/or the editor(s) disclaim responsibility for any injury to people or property resulting from any ideas, methods, instructions or products referred to in the content. |
© 2023 by the authors. Licensee MDPI, Basel, Switzerland. This article is an open access article distributed under the terms and conditions of the Creative Commons Attribution (CC BY) license (https://creativecommons.org/licenses/by/4.0/).


