Article

Characterization of the Fracture Network and Its Spatial Variability in Complex Faulted Zones: Implication in Landslide Susceptibility Analysis

1
Department of Earth Science, University of Torino, 10125 Turin, Italy
2
Institute of Geosciences and Earth Resources, National Research Council (CNR), 10125 Turin, Italy
*
Author to whom correspondence should be addressed.
Appl. Sci. 2023, 13(23), 12789; https://doi.org/10.3390/app132312789
Submission received: 23 October 2023 / Revised: 20 November 2023 / Accepted: 22 November 2023 / Published: 29 November 2023

Abstract

:
In the frame of a regional study that is aimed at defining the landslide susceptibility in the upper Susa Valley (Western Italian Alps), this paper investigated the variation in the fracture network of rock masses in correspondence to faults zones. Fracture networks were characterized at sites located along transects that are oriented normally to fault traces and scattered in their adjacent sectors with the scope to be able to define and estimate the variation in fracture abundance in the bedrock. Fracture collection using a traditional geomechanical survey was combined with topological analysis to estimate the degree of fracturing of rock masses in terms of fracture intensity (P21) and connectivity. Several sites were selected, and the variation in fracturing intensity values and degree of connectivity allowed for the defining of “high fracturing zones” (HFZ) near fault traces moving from the background values of adjacent rock masses. Considering the variation in fracture intensity, a range of 400 m to 150 m HFZ can be defined, with considerable differences between the areas analysed. The values recorded show a high irregular variability in fracture intensity in correspondence to the mapped faults due to the interference and overlay of structures related to the complexity setting of the fault damage zone.

1. Introduction

The characterization of geometrical features and spatial arrangement of any mechanical discontinuity in rock mass, including both primary–secondary foliations and fractures, hereafter referred to as a fracture network, is relevant in different areas of the geosciences (e.g., structural and geomechanical analysis, studies for geoengineering projects, and georesource exploitation). This is because geometrical features of any mechanical discontinuities (e.g., orientation, spacing, length, and shape) and their topological relationships control many of the physical properties of rock masses (e.g., [1,2,3]). Numerous studies describe that during deformation events, the geometric development of fractures and their relative abundance expressed as density (fracture number per unit length or unit area) and intensity (fracture length per unit area or unit volume) can be controlled by lithology and mechanical stratigraphy as well as structural position (e.g., [4,5,6,7,8,9,10,11,12,13,14,15,16]). An increase in fracturing and relative complexity is typically observed within the damage zone of faults due to nucleation, propagation, and offset accommodation of the different brittle structures that are related to the faulting mechanism (e.g., [17,18,19,20,21,22,23,24,25,26]).
Among the different areas of application, the characterization of the fracture network and its variability in the rock masses are relevant in the analysis of landslide phenomena. Characterization of fracture networks is important for landslide susceptibility analysis, because slope stability is influenced by the location and orientation of discontinuity (such as faults, bedding, foliation). The interaction of these surfaces in the rock masses influences the production of disaggregated and loose rock material that is potentially involved in a landslide [27].
In landslide susceptibility analysis aimed at identifying potential landslide areas at the basin scale, fault traces obtained from geological maps and/or lineaments extracted from remote sensing analyses are usually used to characterize the regional discontinuity network in terms of density and intensity data [28]. The degree of fracturing is usually included in the attributes of geological formations and/or considered to be homogeneously distributed along main faults as a regular buffer zone. In the landslide susceptibility studies that our group is carrying out in the Susa Valley (Italian Western Alps), we defined an index of fracture intensity (with five classes of values from weak to intense) for pre-Quaternary bedrock outcrops (identified from aerial photographs), considering mapped faults and lineament traces defined by remote survey (corroborated by traditional scan line surveys) and a strength classification of the bedrock lithologies [29,30]. The interaction of the degree of fracturing with other predisposing factors (bedrock lithology, unconsolidated Quaternary deposits, slope inclination, and hydrographic network) was considered using the Rock Engineering System (RES) [31] methodology to define a debris flow susceptibility index at the basin scale.
As part of our research, given the importance of fracturing as a predisposing factor for landslides, we selected a few areas to characterize how bedrock fracturing at the outcrop scale may vary at major faults compared with their adjacent sectors and attempt a quantitative comparison of the abundance of fractures related to fault damage zones compared with a background value of the rock masses. For this scope, we considered faults reported in geological maps at a 1:50.000 scale [32,33], cross-cutting different bedrock lithologies and running in areas with different areal extents of bedrock outcrops (due to the occurrence of Quaternary deposits). Around the fault traces, in the field, we investigated the fracture networks of bedrock outcrops using traditional geomechanical surveys and a topological approach to estimate the abundance and degree of fracturing in terms of fracture intensity (P21 and I) and connectivity. The variation in fracture intensity allowed us to define “highly fractured zones” (HFZs) near the fault traces based on the background values of adjacent rock masses.

2. Regional Geological Framework

The investigated areas are located in the upper Susa Valley of the Western Alps (Figure 1), which are part of the alpine orogen developed since the Cretaceous as a result of the convergence between the Europe and Adria plates, separated by the Liguria-Piemonte ocean [34]. As reported in the official geological map of Italy at a 1:50.000 scale [32,33], these areas include metamorphic units belonging to the oceanic Liguria-Piemonte and continental margin domains (Brianconnais, including Pre-Piedmont Auct.) of the precollisional Jurassic paleogeographic scenario. The Liguria-Piemonte oceanic units, in their general traits, consist of sequences of Cretaceous carbonate metasediments (calcschists Auct.) with intercalation of black phylladic schist in the upper stratigraphic levels, levels of continental and ophiolitic detritus, and scattered blocks of ophiolites that are locally overlain by radiolarian cherts (Oxfordian-Kimmeridgian) and meta limestones (Late Jurassic–earliest Cretaceous). At the highest structural levels of the Liguria-Piemonte units, the Chenaillet unit is a klippe of oceanic lithosphere with no post-rift sediments. The oceanic units recorded an alpine metamorphic peak under either lawsonite or epidote-blueschist facies conditions [35,36]. Among the continental units, the Ambin Massif Auct. and the Chaberton-Grand Hoche-Grand Argentier unit are of interest in this study. The Ambin Massif comprises two different prealpine tectonic basement units, i.e., the Clarea and Ambin units, resting at the lower and upper structural levels, respectively, and sharing a similar Alpine tectono-metamorphic evolution from blueschist to greenschist facies conditions [37]. The Clarea unit is composed of quartz-bearing micaschist, containing bodies of metabasites and masses of gneiss. The Ambin unit consists of micaschist and gneiss embedding masses of metabasites and is intruded by a Cambrian aplitic gneiss. These rocks are unconformably overlain by a Mesozoic cover consisting of Upper Permian (–Lower Triassic) quartzite, quarzitic microconglomerate and schists, and Lower Triassic massive quartzite passing up through the section to Middle Triassic to Cretaceous dolomitic marble and calcareous schist with a local intercalation of carbonate breccias.
The Chaberton-Grand Hoche-Grand Argentier unit (belongingd to the Pre-Piedmont zone Auct) is composed of a thick Norian dolomitic succession, Rhaetian-Hettangian calcschists, and Jurassic calcareous schist and phyllite with discontinuous levels of breccia [38].
At the regional scale, the framework of post-metamorphic faults is dominated by NE-SW, N-S, and NW-SE trends.

3. Methodology and Background Concepts

With the scope to define and estimate the variation in the fracture abundance in the bedrock moving to major faults, fracture networks were characterized at sites located both along transects that are oriented normally to fault traces and scattered in their adjacent sectors. Sites were selected along the fault zones and in adjacent areas based on the extension and accessibility of bedrock outcrops (both natural or created by road cuts).
At each site, fractures were collected using both linear scanline and areal sampling methods. In addition to the foliations, fractures observed in the field were qualified according to their dominant mode of wall rock movement, distinguishing joints (opening mode), faults (shearing modes), and veins (opening mode fractures with filling) (e.g., [25]).
Fracture collection along linear scanlines (ranging in length from 5 to 10 m on the basis of outcrop extension) was performed according to the International Society for Rock Mechanics and Rock Engineering (ISRM) suggestions (1978), and therefore, key attributes of individual fractures (i.e., type, orientation, persistence, spacing, and aperture) were defined. The orientations of sampled fractures were plotted in rosette diagrams to show the relative frequency of the fracture trends.
Areal sampling method was applied to define spatial arrangement and topological relationships of fractures and to quantify the fracture abundance as fracture intensity P21. In outcrops where scan lines were conducted, a representative portion of the general fracture state of the outcrop was photographed in a circular sampling area with a diameter of 1 m, using a reference cross. Pictures of each site were imported into QGIS software, the sampled fracture networks were digitized as lines (i.e., fracture traces intersecting or not), and then topologically qualified using the NetworkGT toolbox [39] (Figure 2). The network topological analysis is based on the fact that all the fractures, on the planar surface of analysis, represent isolated and/or interacting lines that are either terminating at their tips or cross-cutting or abutting other lines (Figure 2A). Therefore, a fracture (line) can consist of one or more branches bounded by isolated nodes (I-nodes), where the fracture is not geometrically connected to another fracture, and/or by connecting nodes (C-nodes), where the fracture cross-cuts other fractures (X-type nodes) or abuts to another with Y- or T-geometry (Y-type nodes). Then, the fracture network may include I–I (isolated) branches bounded by I end nodes, I–C (partly connected) branches bounded by I and X or Y end nodes, and C–C (doubly connected) branches bounded by Y and/or X end nodes (Figure 2B). The proportion of different node and branch types can be plotted onto triangular diagrams to characterize the fracture network [40]. Networks that are positioned towards the I-I corner of the triangle have a high percentage of isolated branches and, therefore, a low level of connectivity, whereas networks positioned towards the C–C corner of the triangle have a high percentage of interconnected branches. The connectivity can be expressed by the number of connections per branch (Cb), calculated using the following equation (Equation (1)):
Cb = (3Ny + 4Nx)/Nb
where Nx and Ny are the number of the X- and Y-nodes, and Nb is the total number of branches [40]. Cb is dimensionless in the range of 0–2.
Fracture intensity is defined as the number of fractures per unit of sample length (P10), fracture length per unit of surface area (P21), or area of fractures per unit of rock volume (P32). In this study, we defined the areal intensity P21 of the sampled circular window using the following equation [40,41,42] (Equation (2)):
P 21 = N L   L C A   m / m 2
where NL is the number of fractures, and LC is the characteristic length defined as the arithmetic mean of the line lengths LC = SL/NL, with SL being the sum of line lengths. It is important to remember that because the sum of line lengths and the branch lengths are the same in the area of analysis, intensities calculated by fracture traces (P21) and branches (B21) have the same value.
In addition, we used the traced circle to define an unbiased estimate of fracture intensity using the equation for circular scan line sampling [43] (Equation (3)):
I = n/(4r) [m/m2]
where n is number of fracture intersections with the sampling circle (E node in Figure 2A), and r is the circle radius (0.5 m in our study). Rohrbaugh et al., 2002, Ref. [44] suggest that a sampling circle should contain 30 or more E-nodes to produce accurate estimates of fracture intensity.

4. Results

4.1. Claviere-Cesana Torinese Area
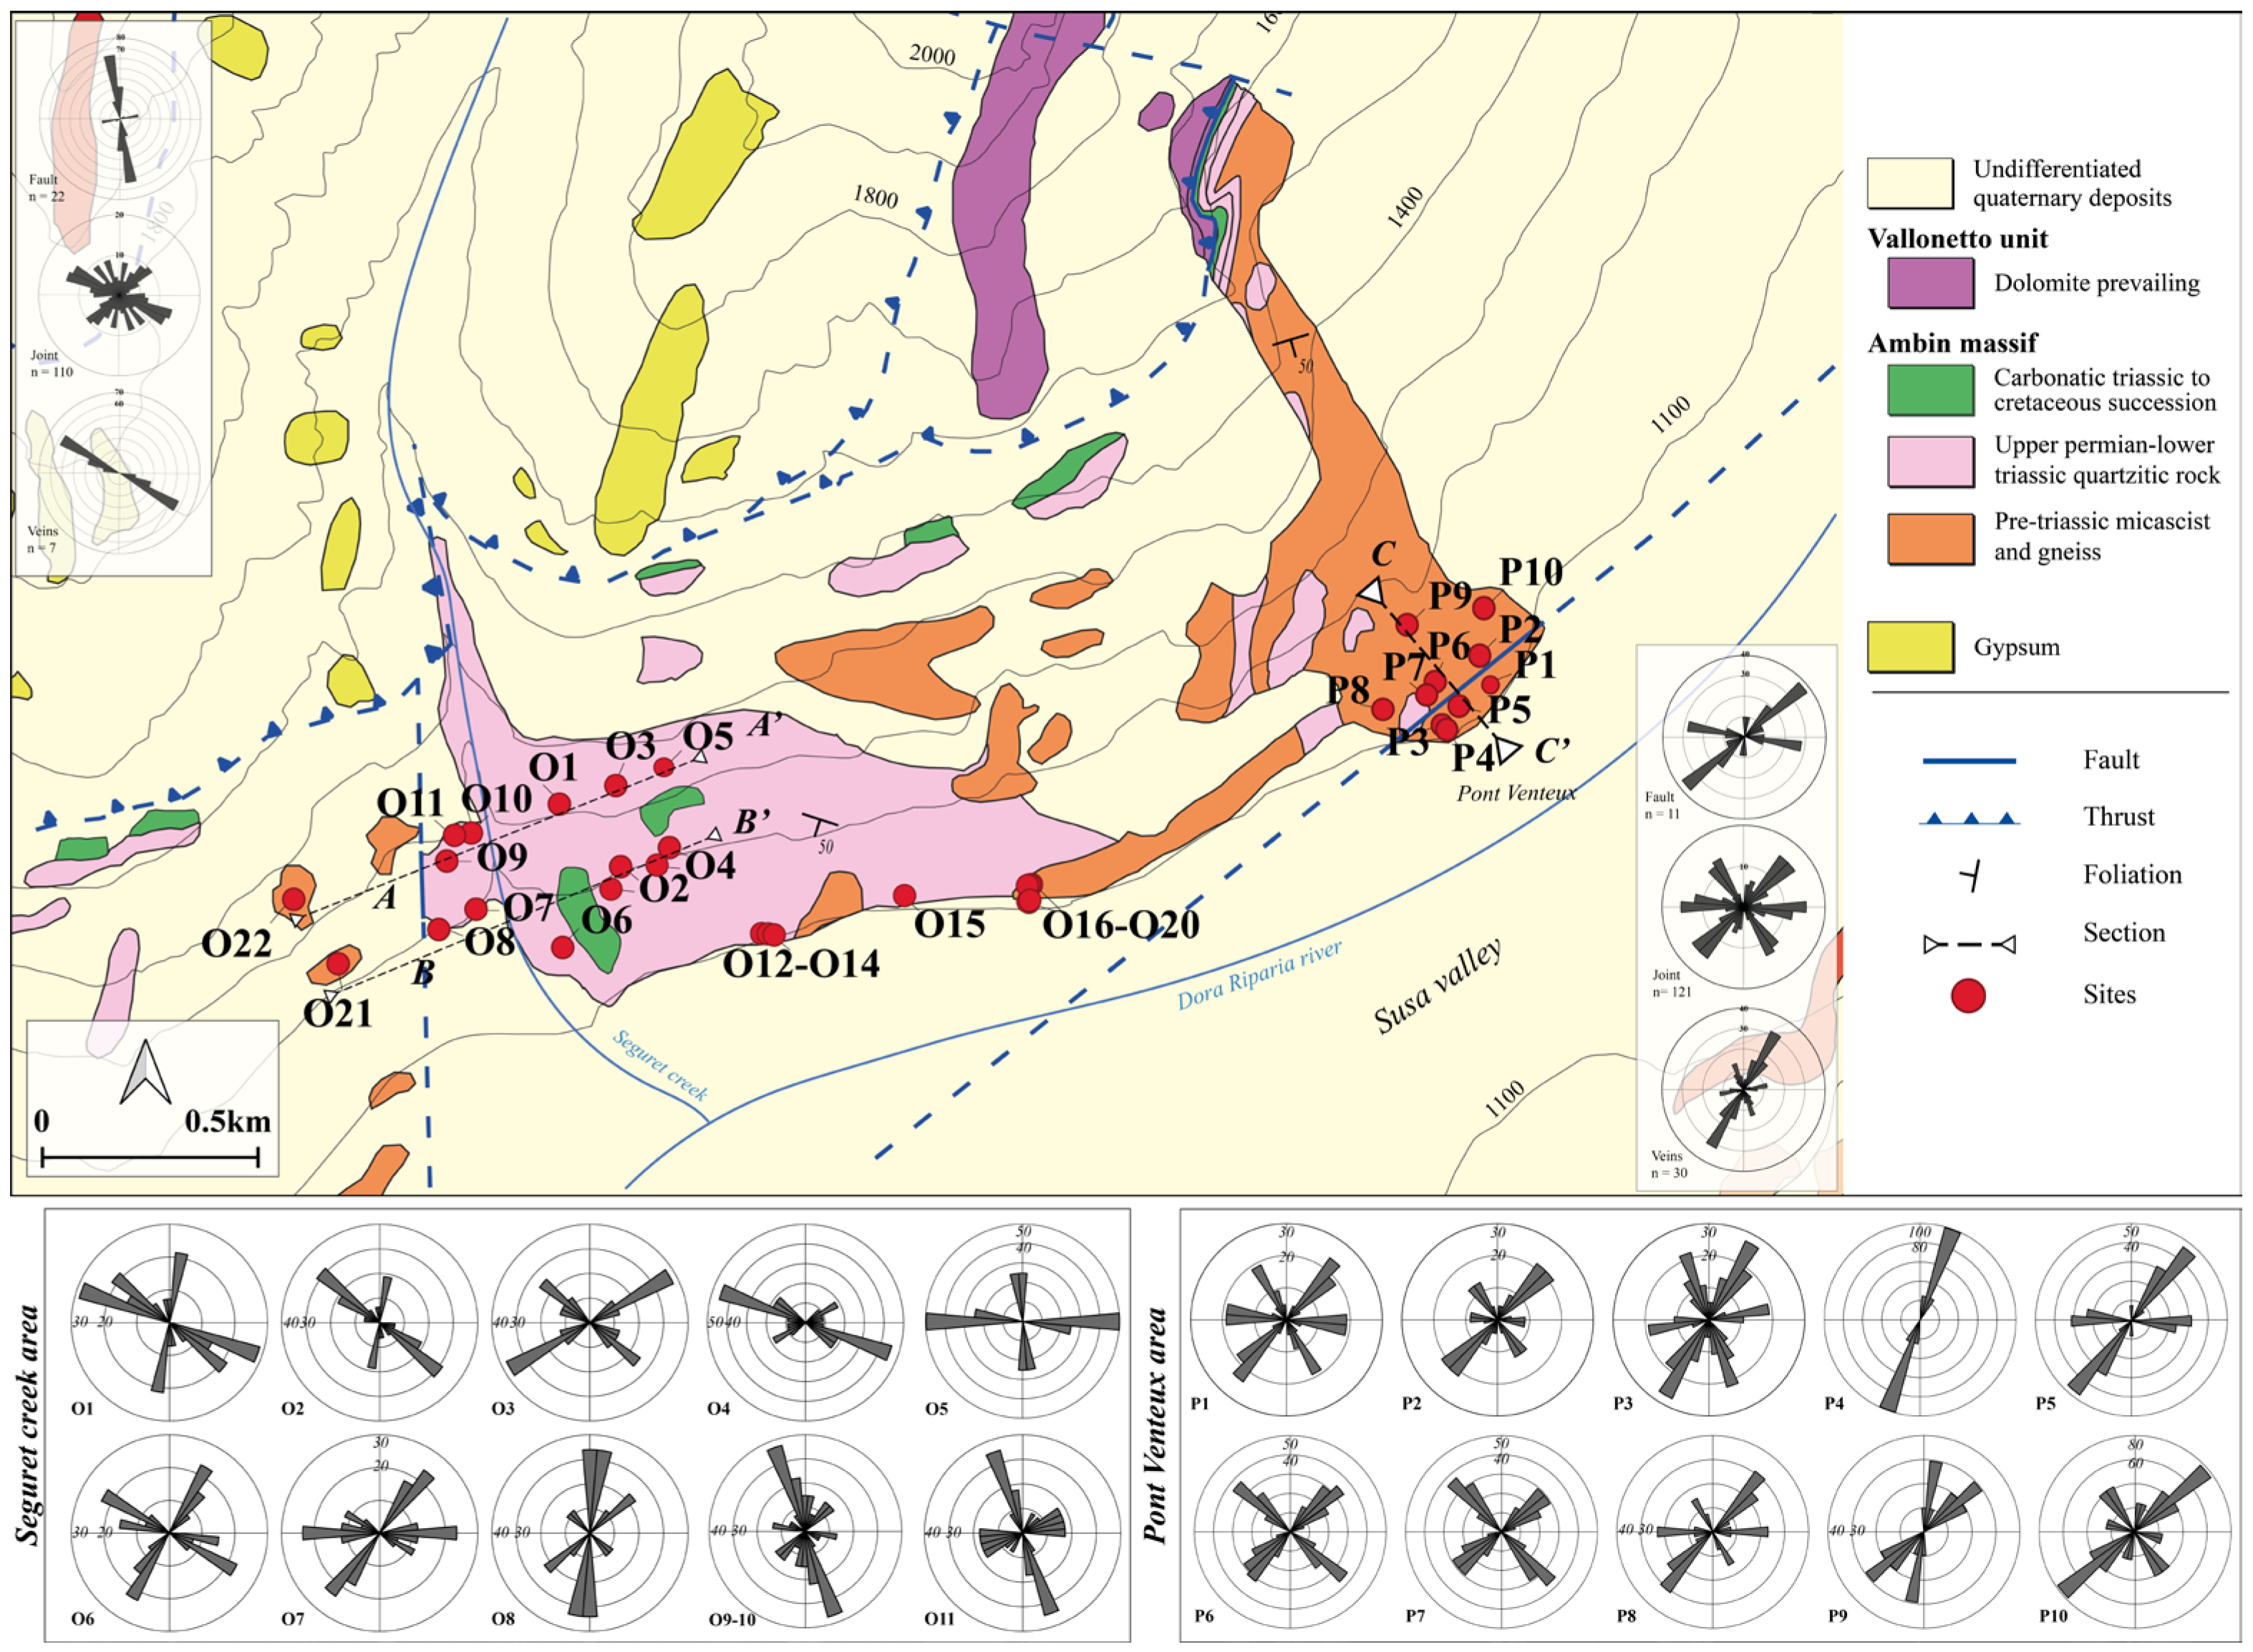
This area is located at the base of the southern slope of Mont Chaberton, between Claviere and Cesana Torinese, where a NE-SW trending fault zone cross-cuts the continental Chaberton-Grand Hoche unit and the adjacent oceanic units (Figure 1 and Figure 3). In detail, in the northern part of this area, the continental Chaberton-Grand Hoche unit overlies the Lago Nero and other oceanic units, while to the south, the Lago Nero unit is under the Chenaillet unit.
Fracture networks were described at 18 sampling sites, conducting two NW-SE-trending transects of analysis across the fault zone (A-A’ and B-B’ in Figure 3). Preliminary data from this area have been reported in Vianello (2023b) [45]. As observed during scanline surveys, the main foliation is pervasive, with a centimetre spacing in the dolomitic rocks, and more pervasive in the calcschists at the fault zone predominantly dips towards the W-NW at a high angle. The most abundant sampled fractures are high-angle joints, mainly E-W-trending. Faults, observed as both discrete surfaces and centimetre- to decimetre-thick zones, are N-S-trending high-angle normal faults and high-angle WNW-ESE- and WSW-ENE-trending faults with prevailing left-lateral displacements. A trend of calcite veins ranges from WNW-ESE to E-W.
The network topological analysis revealed that the sampled circular windows recorded nodes ranging from a few dozen up to 1700–1800. Overall, the largest percentage of nodes is represented by Y-nodes (>60%), with X-nodes usually being more abundant that I-nodes (Figure 4A,D). This led to a high number of C–C branches due to the predominance of doubly connected short fractures, and the Cb values are higher than 1.90 at all sampling sites (only site 3 has a lower value of 1.34; Figure 4B,E).
The calculated P21 values range from~10 m/m2 to 80 m/m2 (Figure 4C,F); most P21 values are about 30 m/m2 and increase up to values in the order of 50 m/m2 around the northern fault and of 80 m/m2 around the southern fault. The P21 spatial distribution highlights the occurrence of two zones of more pervasive fracturing—HFZ—that is roughly centred on the fault traces and slightly asymmetrical. The HFZ along the northern fault is approximately 400 m wide in the western part and 200 m wide in the eastern part. The southern fault is roughly centred on an HFZ.

4.2. Oulx Region

In the Oulx region (study area n.2 in Figure 1 and detail in Figure 5), we investigated fracture networks across N-S (Seguret river area)- and NE-SW (Pont Ventoux area)-trending faults.

4.2.1. Seguret River Area

This area is characterized by a large exposure of upper Permian to Lower Triassic quarzitic rocks that are overlaid by Triassic-Cretaceous marble and calcschists of the Ambin unit. The pervasive foliation is mainly dipping to the WSW-S, deformed by superimposed folds with N-S-trending axes plunging to the south and E-W-trending axes. A N-S-trending fault zone juxtaposes quarzitic rocks and pre-Triassic micaschist and gneiss to the west of the Rio Seguret. A total of 22 sampling sites were selected in this area, and 15 of them are located along two W-E transects of analysis across the fault.
Scanline sampling reveals a fracture pattern that is dominated by pervasive high-angle WNW-ESE and NE-SW joint sets, representing cross-strike and strike joints of the folds. N-S-striking high-angle discrete slip surfaces and cm thick fault zones with normal components and subordinate ENE-WSW faults with a left-hand component were observed in sites located to the west of the gully.
In the sites along the two transects of analysis across the fault trace, the sampled fracture networks have 150 nodes near the fault, decreasing by up to 40–50 nodes at ~100–150 m from the reference fault trace. Overall, the sampled fracture networks are dominated by Y and I nodes (with Y > I near the fault traces), and X nodes are <35–40% (Figure 6A,D), with a prevalence of CC-type branches and Cb values between ~2 and 1.2 (Figure 6B,E).
The micaschist recorded a P21 fracture intensity of about 5 m/m2 near the fault trace; the adjacent quartzites have P21 values reaching a peak of 20 m/m2 in correspondence to the Seguret gully (Figure 6C,F). This variation in fracture intensity depicts a zone of increasing of fracturing of about 150 m related to very pervasive joint overlapping faulting and/or the occurrence of a fault near the gully. The recorded highly fractured zone affects the quarzitic rocks, which is translocated relative to the position of the fault a hundred meters toward the east in correspondence to the Seguret creek, with an asymmetrical variability in fracture intensity when moving away from the fracturing spike.

4.2.2. Pont Ventoux Area

In this area, a segment of the NE-SW-trending Susa Fault system cross-cuts and juxtaposes quartz-micaschist and quartzite of the Ambin unit. In this area, 10 sampling sites were defined. The main foliation dips toward SSW and is intersected by discrete high-angle fault planes toward SE, often with right-lateral movement and meter spacing. A large number of high-angle joints were sampled, with NNW-SSE, E-W, and NNE-SSW preferential trends.
Overall, the sampling sites have several nodes of about 40–70, and locally higher values of up to 150–160 have been counted. Usually, Y nodes are greater than 50%, with the highest values near the main fault trace, while X > I nodes (Figure 6G). The Cb values are always above 1.7, which is the result of a high number of CC branches (Figure 6H).
As in Figure 6I, the P21 fracture intensity increases from background values in the order of 8–10 m/m2 up to 25 m/m2 within a zone of 80 m bordering the fault.

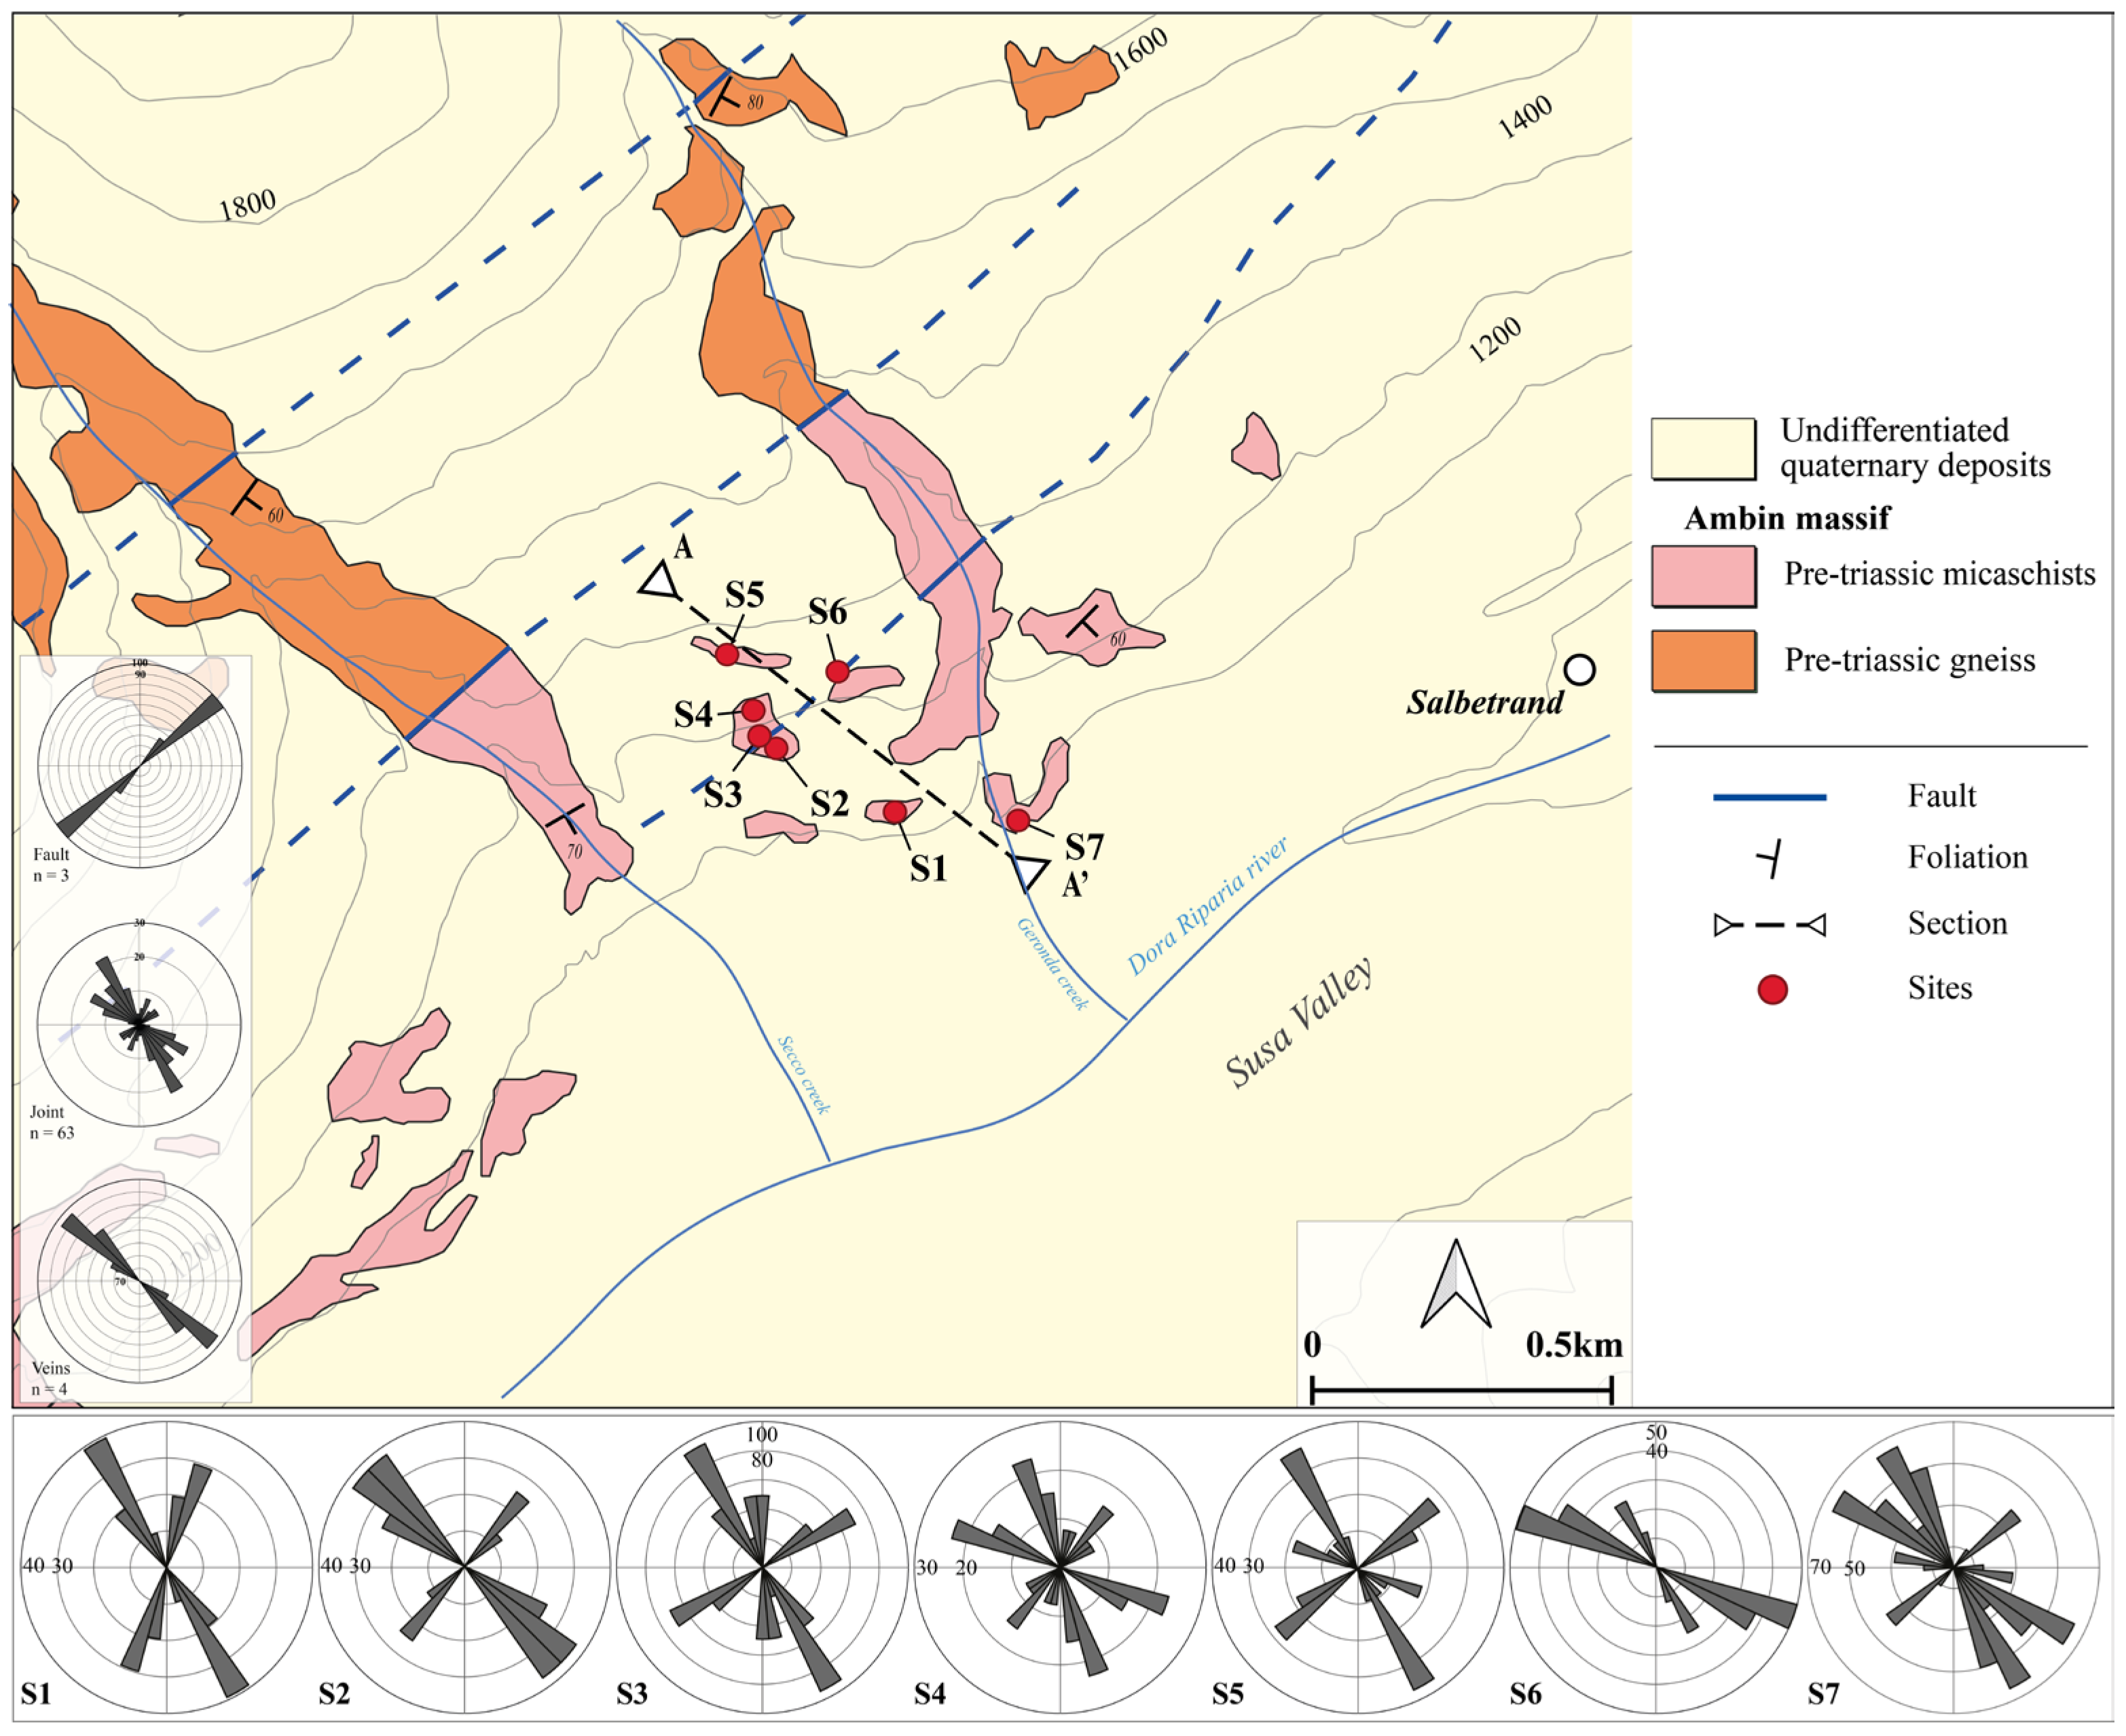
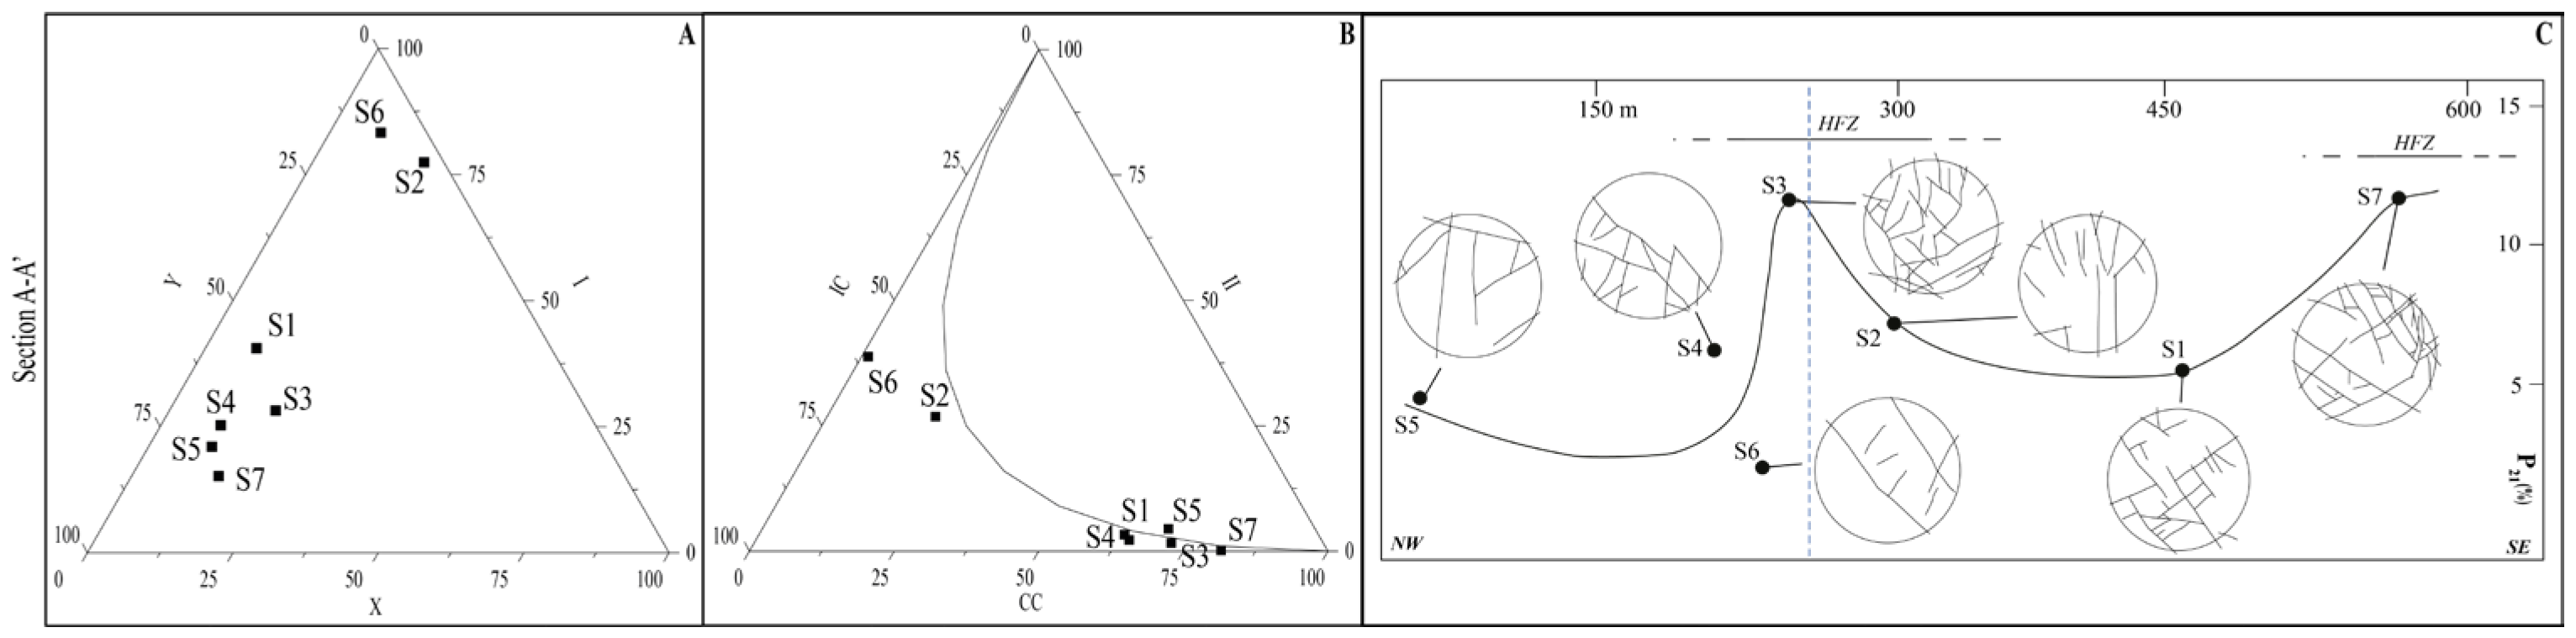
4.2.3. Salbertand Area

In this area, the Ambin and Clarea units are crossed and juxtaposed by NE-SW-trending faults (which are part of the Susa Valley fault zone). Because of the quality and accessibility of the outcrops, seven sampling sites were considered at a fault in the Ambin unit (Figure 7). The outcropping micaschist have a very pervasive foliation, dipping 60° to 80° to S-SE. As observed along the linear scanlines, this pervasive foliation is crossed by high-angle joints trending NNW-SSE and WNW-ESE and by high-angle fault planes dipping to the SE with a normal to left-lateral component of slip.
Sampled fracture networks have nodes that are on average between 10 and 30, and 60 nodes were counted at a few sites near the fault trace and in the southernmost sites. Y-nodes prevail in most of the sampled fracture networks, resulting in I-nodes being frequent at sites 2 and 6, located in correspondence to the fault trace (Figure 8A). This led to a general prevalence of CC branches with an increasing amount of C–I branches near the fault trace (Figure 8B). The Cb values derived is >1.70 in most sites and drops under 1.00.
As shown in Figure 8C, P21 outlines HFZ areas with increasing values up to 15 m/m2, starting from average background values that are lower than 8 m/m2. The HFZ, in correspondence to the fault trace, can be estimated to be 100 m wide, while the width of the southern HFZ (~300 m away from the previous one) could not be constrained due to the absence of useful outcrops.

5. Discussion

This paper has described features of and variations in the fracture network at the outcrop scale in correspondence to major faults zone. Fracture networks were sampled at sites that were considered representative of the general fracture conditions of the rock masses. Fracture collection was performed via traditional geomechanical survey combined with topological analysis to estimate the abundance and degree of fracturing in terms of the fracture intensity and connectivity.
The resulting values of fracture intensity (P21 values) revealed an increase in the “highly fractured zones” (HFZs) around the fault traces, starting from background values of adjacent rock masses that were defined as the frequent P21 values observed in outcrops at a distance from the fault trace. However, the estimated background and peak of P21 values and the widths of their correlated HFZ vary significantly in the different analysed sectors.
Considering the NE-SW-trending fault zone in Claviere-Cesana Torinese area, calcschist record maximum P21 values of about 10 m/m2, while the adjacent dolomitic rocks reach up to 80 m/m2, with average background values of 20–25 m/m2. The distribution of P21 values indicates an amplitude of HFZs between 400 m and 200 m along the northern fault trace, while P21 is significantly higher within a 150 m wide zone along the eastern termination of the southern fault. In the Salbertrand area, NE-SW-trending faults cross micaschist and show P21 background values in the order of 8–10 m/m2 and increasing up to 15 m/m2 within a 150 m wide zone around the fault trace.
For the N-S fault located in the Seguret river sector, quarzitic rocks record an increase in fracture intensity approaching the creek, going from P21 values around 5 m/m2 to maximum values of 20 m/m2 in less than one hundred meters. Considering the variation in the fracture intensity affecting quarzitic rocks, it is possible to determine a fracture zone that is characterized by a width of almost 150 m, in which the intensity trend shows higher values than those found in adjacent outcrops.
Taken together, these results suggest that the increase in P21 observed in the HFZ is approximately centred around the fault traces and is clearly related to the geometric fracture superposition of the fault-localized damage zones over the extended junction (which somehow defines the background values of fracturing). Therefore, in the first analysis, the estimated HFZ in correspondence to the fault can represent the fault damage zone. However, the term “damage zone” (e.g., [21] and references therein) was avoided in this study when describing the highly fractured zone around the fault, because a detailed study of the kinematics and genetic relationships of the fractures with respect to the fault was not carried out, and only geometry and relations of discontinuities were considered.
Then, the P21 values estimated in the rock masses result from the superimposition of several factors: (i) the strength and rheology of the rocks (i.e., mechanical stratigraphy and fabrics), largely controlling the formation of brittle structures (e.g., [46,47,48,49,50,51]), (ii) the complexity of the damage zones, with an evolution through space and time of different types of interacting fractures and possible reactivation of pre-existing fractures (e.g., [52,53,54,55,56,57,58,59]), (iii) and jointing, which is often controlled by the structural setting (e.g., [60,61,62,63,64]).
An implication of this is the resulting high variability in the degree of fracturing of rock masses, which makes it complex to define homogeneous buffer zones in the map view, especially when trying to define the lateral variation along the fault. An attempt to represent the distribution of fracture intensity in a map view is presented in Figure 9, which shows an interpolation of fracture intensity data in the Claviere-Cesana Torinese area. It is important to outline that the realization of the map of P21 distribution has important limitations due to the availability of adjacent bedrock outcrops (often masked by Quaternary deposits in the Alps and/or involved in landslide phenomena) and due to software and hardware limitations, also including manual or automatic digitalization of the sampled networks.
This study investigated the correlation between the fracture intensity P21, obtained by applying the circular scanline method, and the fracture intensity I. Recent research has suggested a linear correlation between P21 and I, with a slope of 1 and intercept ∼0 (e.g., [65,66]). Comparing the obtained values in this study (Claviere-Cesana Torinese, Oulx, and Pont Ventoux areas), the P21/I ratio shows a good correlation with the best-fit line for these data, being close to the 1:1 line for P21 values below 20 m/m2 (Figure 10). For P21 values higher than 20 m/m2, this correlation is no longer valid, and the P21/I ratio increases above 1 to values that are close to 2 when P21 is 80 m/m2. However, at some sites, the I value could be considered inaccurate because the threshold value of 30 node (suggested by [44]) was not reached and an inaccurate estimate of fracture intensity could be obtained. This happened at three sites of the Seguret river area and four sites of the Salbetrand area. Although the I-values at these sites range between 17 and 21 nodes E, the percentage of correct estimates is reduced to between 40% and 60% (for further details, see [44]), which is why the values are not included in the graph in Figure 10.

6. Conclusions

The purpose of this study was to characterize the fracturing of the rock masses at the outcrop scale in the frame of a landslide susceptibility study. The degree of fracturing is important for analysing landslide susceptibility, since the interaction between discontinuities in rock masses influences slope stability and determines the different production rates of disaggregated and loose material that is potentially involved in a landslide. In landslide susceptibility studies, the degree of fracturing is usually included in the attributes of geological formations and/or considered to be homogeneously distributed along main faults as a regular buffer zone. For this reason, sites were selected along transects that are perpendicular to major fault zones, where bedrock outcrops were accessible and observable.
The fracture network of bedrock outcrops was investigated via traditional surveys and a topological approach to estimate the abundance and degree of fracturing in terms of fracture intensity (P21 and I) and connectivity. The fracture intensity values detected at sites that are close to faults were compared with those observed in adjacent outcrops.
The obtained fracture intensity variation shows an irregular distribution in correspondence and around the mapped faults due to the interference and overlay of structures that are related to the fault damage zone with those of other brittle deformation events and to the strength and fabric of deformed rocks. As a consequence, the high variability in estimated values and the lateral spatial distribution of the fracture intensity of rock masses make it difficult to define homogeneous buffer zones along fault traces in map view. Considering buffer zones of fracturing conditions along fault traces as defining the variation in fracturing at a basin scale could lead to underestimating or overestimating the strength of the rock mass in terms of its propensity to failure and in defining block volume and geotechnical parameters.

Author Contributions

Conceptualization, D.V., S.B. and P.M.; methodology D.V., S.B. and P.M.; software, D.V.; validation, D.V., S.B. and P.M.; formal analysis, D.V., S.B. and P.M.; investigation, D.V.; resources, D.V., S.B. and P.M.; data curation, D.V.; writing—original draft preparation, D.V.; writing—review and editing, D.V., S.B. and P.M.; visualization, D.V.; supervision, S.B. and P.M. All authors have read and agreed to the published version of the manuscript.

Funding

This research received no external funding. The study is conducted in the framework of a PhD thesis.

Institutional Review Board Statement

Not applicable.

Informed Consent Statement

Not applicable.

Data Availability Statement

Data are contained within the article.

Conflicts of Interest

The authors declare no conflict of interest.

References

  1. Adler, P.M.; Thovert, J.F. Fractures and Fracture Networks; Springer Science & Business Media: Berlin/Heidelberg, Germany, 1999; Volume 15. [Google Scholar]
  2. Zimmerman, R.; Main, I. Hydromechanical behavior of fractured rocks. Int. Geophys. Ser. 2004, 89, 363–422. [Google Scholar]
  3. Faulkner, D.R.; Jackson, C.A.L.; Lunn, R.J.; Schlische, R.W.; Shipton, Z.K.; Wibberley, C.A.J.; Withjack, M.O. A review of recent developments concerning the structure, mechanics and fluid flow properties of fault zones. J. Struct. Geol. 2010, 32, 1557–1575. [Google Scholar] [CrossRef]
  4. Ortega, O.; Marrett, R. Prediction of macrofracture properties using microfracture information, Mesaverde Group sandstones, San Juan basin, New Mexico. J. Struct. Geol. 2000, 22, 571–588. [Google Scholar] [CrossRef]
  5. Shipton, Z.K.; Cowie, P.A. A conceptual model for the origin of fault damage zone structures in high-porosity sandstone. J. Struct. Geol. 2003, 25, 333–344. [Google Scholar] [CrossRef]
  6. Putz-Perrier, M.W.; Sanderson, D.J. Spatial distribution of brittle strain in layered sequences. J. Struct. Geol. 2008, 30, 50–64. [Google Scholar] [CrossRef]
  7. Mitchell, T.M.; Faulkner, D.R. The nature and origin of off-fault damage surrounding strike-slip fault zones with a wide range of displacements: A field study from the Atacama fault system, northern Chile. J. Struct. Geol. 2009, 31, 802–816. [Google Scholar] [CrossRef]
  8. Savage, H.M.; Brodsky, E.E. Collateral damage: Evolution with displacement of fracture distribution and secondary fault strands in fault damage zones. J. Geophys. Res. Solid Earth 2011, 116, B3. [Google Scholar] [CrossRef]
  9. Schueller, S.; Braathen, A.; Fossen, H.; Tveranger, J. Spatial distribution of deformation bands in damage zones of extensional faults in porous sandstones: Statistical analysis of field data. J. Struct. Geol. 2013, 52, 148–162. [Google Scholar] [CrossRef]
  10. Watkins, H.; Healy, D.; Bond, C.E.; Butler, R.W. Implications of heterogeneous fracture distribution on reservoir quality; an analogue from the Torridon Group sandstone, Moine Thrust Belt, NW Scotland. J. Struct. Geol. 2018, 108, 180–197. [Google Scholar] [CrossRef]
  11. Torabi, A.; Johannessen, M.U.; Ellingsen, T.S.S. Fault core thickness: Insights from siliciclastic and carbonate rocks. Geofluids 2019, 2019, 2918673. [Google Scholar] [CrossRef]
  12. Igbokwe, O.A.; Mueller, M.; Bertotti, G.; Timothy, J.J.; Abah, O.; Immenhauser, A. Morphology and topology of dolostonelithons in the regional Carboneras Fault Zone, Southern Spain. J. Struct. Geol. 2020, 137, 104073. [Google Scholar] [CrossRef]
  13. Andrews, B.J.; Shipton, Z.K.; Lord, R.; McKay, L. The growth of faults and fracture networks in a mechanically evolving, mechanically stratified rock mass: A case study from Spireslack Surface Coal Mine, Scotland. Solid Earth 2020, 11, 2119–2140. [Google Scholar] [CrossRef]
  14. Chang, Z.; Du, Z.; Zhang, F.; Huang, F.; Chen, J.; Li, W.; Guo, Z. Landslide susceptibility prediction based on remote sensing images and GIS: Comparisons of supervised and unsupervised machine learning models. Remote Sens. 2020, 12, 502. [Google Scholar] [CrossRef]
  15. Liu, H.; Li, X.; Yu, Z.; Tan, Y.; Ding, Y.; Chen, D.; Wang, T. Influence of hole diameter on mechanical properties and stability of granite rock surrounding tunnels. Phys. Fluids 2023, 35, 064121. [Google Scholar]
  16. Chen, S.J.; Zhao, Z.H.; Feng, F.; Zhang, M.Z. Stress evolution of deep surrounding rock under characteristics of bi-modulus and strength drop. J. Cent. South Univ. 2022, 29, 680–692. [Google Scholar] [CrossRef]
  17. McGrath, A.G.; Davison, I. Damage zone geometry around fault tips. J. Struct. Geol. 1995, 17, 1011–1024. [Google Scholar] [CrossRef]
  18. Peacock, D.C.P. Propagation, interaction and linkage in normal fault systems. Earth-Sci. Rev. 2002, 58, 121–142. [Google Scholar] [CrossRef]
  19. Crider, J.G.; Peacock, D.C. Initiation of brittle faults in the upper crust: A review of field observations. J. Struct. Geol. 2004, 26, 691–707. [Google Scholar] [CrossRef]
  20. Kim, Y.S.; Peacock, D.C.P.; Sanderson, D.J. Mesoscale strike-slip faults and damage zones at Marsalforn, Gozo Island, Malta. J. Struct. Geol. 2003, 25, 793–812. [Google Scholar] [CrossRef]
  21. Kim, Y.S.; Peacock, D.C.; Sanderson, D.J. Fault damage zones. J. Struct. Geol. 2004, 26, 503–517. [Google Scholar] [CrossRef]
  22. Kim, Y.S.; Sanderson, D.J. Structural similarity and variety at the tips in a wide range of strike–slip faults: A review. Terra Nova 2006, 18, 330–344. [Google Scholar] [CrossRef]
  23. Choi, J.H.; Edwards, P.; Ko, K.; Kim, Y.S. Definition and classification of fault damage zones: A review and a new methodological approach. Earth-Sci. Rev. 2016, 152, 70–87. [Google Scholar] [CrossRef]
  24. Fossen, H.; Rotevatn, A. Fault linkage and relay structures in extensional settings—A review. Earth-Sci. Rev. 2016, 154, 14–28. [Google Scholar] [CrossRef]
  25. Peacock, D.C.P.; Nixon, C.W.; Rotevatn, A.; Sanderson, D.J.; Zuluaga, L.F. Glossary of fault and other fracture networks. J. Struct. Geol. 2016, 92, 12–29. [Google Scholar] [CrossRef]
  26. Peacock, D.C.P.; Dimmen, V.; Rotevatn, A.; Sanderson, D.J. A broader classification of damage zones. J. Struct. Geol. 2017, 102, 179–192. [Google Scholar] [CrossRef]
  27. Umili, G.; Bonetto, S.M.R.; Mosca, P.; Vagnon, F.; Ferrero, A.M. In situ block size distribution aimed at the choice of the design block for rockfall barriers design: A case study along gardesana road. Geosciences 2020, 10, 223. [Google Scholar] [CrossRef]
  28. Ramli, M.F.; Yusof, N.; Yusoff, M.K.; Juahir, H.; Shafri, H.Z.M. Lineament mapping and its application in landslide hazard assessment: A review. Bull. Eng. Geol. Environ. 2010, 69, 215–233. [Google Scholar] [CrossRef]
  29. Bonetto, S.; Mosca, P.; Vagnon, F.; Vianello, D. New application of open source data and Rock Engineering System for debris flow susceptibility analysis. J. Mt. Sci. 2021, 18, 3200–3217. [Google Scholar] [CrossRef]
  30. Vianello, D.; Vagnon, F.; Bonetto, S.; Mosca, P. Debris flow susceptibility mapping using the Rock Engineering System (RES) method: A case study. Landslides 2023, 20, 735–756. [Google Scholar] [CrossRef]
  31. Hudson, J.A. Rock Engineering Systems. Theory and Practice; Ellis Horwood: Chichester, UK, 1992. [Google Scholar]
  32. Servizio Geologico D’Italia. Carta Geologica d’Italia alla Scala 1:50.0000, F. 152-153 Bardonecchia; ISPRA: Roma, Italy, 1998. [Google Scholar]
  33. Servizio Geologico D’Italia. Carta Geologica d’Italia alla Scala 1:50.0000, F. 171 Cesana Torinese; ISPRA: Roma, Italy, 2020. [Google Scholar]
  34. Dal Piaz, G.V.; Bistacchi, A.; Massironi, M. Geological outline of the Alps. Epis. J. Int. Geosci. 2003, 26, 175–180. [Google Scholar]
  35. Agard, P.; Vidal, O.; Goffé, B. Interlayer and Si content of phengite in HP–LT carpholite-bearing metapelites. J. Metamorph. Geol. 2001, 19, 479–495. [Google Scholar] [CrossRef]
  36. Corno, A.; Groppo, C.; Borghi, A.; Mosca, P.; Gattiglio, M. To be or not to be Alpine: New petrological constraints on the metamorphism of the Chenaillet Ophiolite (Western Alps). J. Metamorph. Geol. 2023, 41, 745–765. [Google Scholar] [CrossRef]
  37. Gattiglio, M.; Ghignone, S.; Mosca, P. Geological setting of the Lyon-Turin cross-border section (Italian side). Acc. Sc. Torino Quaderni. 2022, 38, 151–170. [Google Scholar]
  38. Polino, R.; Monticelli, F.; Vaccaro, D. L’unità piemontese Chaberton-GrandHoche (Val Susa-Alpi Occidentali): Evoluzione litostratigrafica, assetto strutturale e rapporti con i complexi circostanti. Mem. Della Soc. Geol. Ital. 1983, 26, 489–498. [Google Scholar]
  39. Nyberg, B.; Nixon, C.W.; Sanderson, D.J. NetworkGT: A GIS tool for geometric and topological analysis of two-dimensional fracture networks. Geosphere 2018, 14, 1618–1634. [Google Scholar] [CrossRef]
  40. Sanderson, D.J.; Nixon, C.W. The use of topology in fracture network characterization. J. Struct. Geol. 2015, 72, 55–66. [Google Scholar] [CrossRef]
  41. Dershowitz, W.S.; Einstein, H.H. Characterizing rock joint geometry with joint system models. Rock Mech. Rock Eng. 1988, 21, 21–51. [Google Scholar] [CrossRef]
  42. Dershowitz, W.S.; Herda, H.H. Interpretation of fracture spacing and intensity. In Proceedings of the ARMA US Rock Mechanics/Geomechanics Symposium, Santa Fe, Mexico, 3–5 June 1992; p. ARMA-92. [Google Scholar]
  43. Mauldon, M.; Dunne, W.M.; Rohrbaugh, M.B., Jr. Circular scanlines and circular windows: New tools for characterizing the geometry of fracture traces. J. Struct. Geol. 2001, 23, 247–258. [Google Scholar] [CrossRef]
  44. Rohrbaugh Jr, M.B.; Dunne, W.M.; Mauldon, M. Estimating fracture trace intensity, density, and mean length using circular scan lines and windows. AAPG Bull. 2002, 86, 2089–2104. [Google Scholar]
  45. Vianello, D. Defining the degree of fracturing in fault zones: Implications in the study of landslide susceptibility. Rend. Online Della Soc. Geol. Ital. 2023, 60, 72–77. [Google Scholar] [CrossRef]
  46. Hugman III, R.H.H.; Friedman, M. Effects of texture and composition on mechanical behavior of experimentally deformed carbonate rocks. Am. Assoc. Pet. Geol. Bull. 1979, 63, 1478–1489. [Google Scholar]
  47. Corbett, K.; Friedman, M.; Spang, J. Fracture development and mechanical stratigraphy of Austin Chalk, Texas. AAPG Bull. 1987, 71, 17–28. [Google Scholar]
  48. Hanks, C.L.; Lorenz, J.; Teufel, L.; Krumhardt, A.P. Lithologic and structural controls on natural fracture distribution and behavior within the Lisburne Group, northeastern Brooks Range and North Slope subsurface, Alaska. AAPG Bull. 1997, 81, 1700–1720. [Google Scholar]
  49. Ferrill, D.A.; Morris, A.P. Fault zone deformation controlled by carbonate mechanical stratigraphy, Balcones fault system, Texas. AAPG Bull. 2008, 92, 359–380. [Google Scholar] [CrossRef]
  50. Barbier, M.; Hamon, Y.; Callot, J.P.; Floquet, M.; Daniel, J.M. Sedimentary and diagenetic controls on the multiscale fracturing pattern of a carbonate reservoir: The Madison Formation (Sheep Mountain, Wyoming, USA). Mar. Pet. Geol. 2012, 29, 50–67. [Google Scholar] [CrossRef]
  51. Ortega, O.J.; Gale, J.F.; Marrett, R. Quantifying diagenetic and stratigraphic controls on fracture intensity in platform carbonates: An example from the Sierra Madre Oriental, northeast Mexico. J. Struct. Geol. 2010, 32, 1943–1959. [Google Scholar] [CrossRef]
  52. Segall, P.; Pollard, D.D. Mechanics of discontinuous faults. J. Geophys. Res. Solid Earth 1980, 85, 4337–4350. [Google Scholar] [CrossRef]
  53. Cowie, P.A.; Shipton, Z.K. Fault tip displacement gradients and process zone dimensions. J. Struct. Geol. 1998, 20, 983–997. [Google Scholar] [CrossRef]
  54. Peacock, D.C.P.; Knipe, R.J.; Sanderson, D.J. Glossary of normal faults. J. Struct. Geol. 2000, 22, 291–305. [Google Scholar] [CrossRef]
  55. Peacock, D.C.P.; Sanderson, D.J.; Rotevatn, A. Relationships between fractures. J. Struct. Geol. 2018, 106, 41–53. [Google Scholar] [CrossRef]
  56. Pachell, M.A.; Evans, J.P. Growth, linkage, and termination processes of a 10-km-long strike-slip fault in jointed granite: The Gemini fault zone, Sierra Nevada, California. J. Struct. Geol. 2002, 24, 1903–1924. [Google Scholar] [CrossRef]
  57. Fossen, H.; Schultz, R.A.; Rundhovde, E.; Rotevatn, A.; Buckley, S.J. Fault linkage and graben stepovers in the Canyonlands (Utah) and the North Sea Viking Graben, with implications for hydrocarbon migration and accumulation. AAPG Bull. 2010, 94, 597–613. [Google Scholar] [CrossRef]
  58. Gudmundsson, A.; Simmenes, T.H.; Larsen, B.; Philipp, S.L. Effects of internal structure and local stresses on fracture propagation, deflection, and arrest in fault zones. J. Struct. Geol. 2010, 32, 1643–1655. [Google Scholar] [CrossRef]
  59. Scholz, C.H. The Mechanics of Earthquakes and Faulting; Cambridge University Press: Cambridge, UK, 2019. [Google Scholar]
  60. Hobbs, D.W. The formation of tension joints in sedimentary rocks: An explanation. Geol. Mag. 1967, 104, 550–556. [Google Scholar] [CrossRef]
  61. McQuillan, H. Small-scale fracture density in Asmari Formation of southwest Iran and its relation to bed thickness and structural setting. AAPG Bull. 1973, 57, 2367–2385. [Google Scholar] [CrossRef]
  62. Jamison, W.R. Quantitative evaluation of fractures on Monkshood anticline, a detachment fold in the foothills of western Canada. AAPG Bull. 1997, 81, 1110–1132. [Google Scholar]
  63. Bergbauer, S.; Pollard, D.D. A new conceptual fold-fracture model including prefolding joints, based on the Emigrant Gap anticline, Wyoming. Geol. Soc. Am. Bull. 2004, 116, 294–307. [Google Scholar] [CrossRef]
  64. Awdal, A.H.; Braathen, A.; Wennberg, O.P.; Sherwani, G.H. The characteristics of fracture networks in the Shiranish formation of the Bina Bawi Anticline; comparison with the TaqTaq field, zagros, Kurdistan, NE Iraq. Pet. Geosci. 2013, 19, 139–155. [Google Scholar] [CrossRef]
  65. Procter, A.; Sanderson, D.J. Spatial and layer-controlled variability in fracture networks. J. Struct. Geol. 2018, 108, 52–65. [Google Scholar] [CrossRef]
  66. Lucca, A.; Storti, F.; Molli, G. Extensional fracture network attribute distribution in faulted thick sandstone strata: Compione Fault, Northern Apennines, Italy. J. Struct. Geol. 2020, 131, 103954. [Google Scholar] [CrossRef]
Figure 1. Regional geological settings of upper Susa valley (modified from Servizio Geologico d’Italia 1998 and 2020). Ellipses indicate investigated areas (1—Claviere-CesanaTorinese area; 2—Oulx sector; 3—Salbetrand area).
Applsci 13 12789 g001
Figure 2. (A) Schematic representation of lines, branches, and nodes and triangular plots for nodes and branch types of proportion (modified after [40]). (B) Methodology used for topological analysis in this study. Circular sampling areas with 1 m of diameter were defined with a cross-reference, the sampled fracture networks were digitalized in QGis, and lines, branches, and nodes were qualified with NetworkGT tool.
Applsci 13 12789 g002
Figure 3. Simplified geological map of Claviere-Cesana T.se area (location n.1 in Figure 1). The rose diagrams in the lower box refer to all fractures sampled at each site.
Applsci 13 12789 g003
Figure 4. Topological data corresponding to the sites in section A-A’ (AC) and section B-B’ (DF) in Figure 3: (A,D) Triangular plot showing nodal topology in terms of relative percentage of I, X, and Y nodes; (B,E) triangular plot showing relative percentage of I–I, I–C, and C–C branches; (C,F) variation in fracture intensity P21 with relative digitized fracture network, estimation of highly fractured zone (HFZ). The positions of mapped faults in the transect are reported with blue dotted lines.
Applsci 13 12789 g004
Figure 5. Simplified geological map of the Oulx study area (location n.2 in Figure 1). The rose diagrams in the lower box refer to fractures sampled at each site. A–A’, B–B’ and C–C’ refer to the transects realised across the fault zones.
Applsci 13 12789 g005
Figure 6. Topological data corresponding to the sites located in Figure 5: Seguret river area: section A-A’ (AC), section B-B’ (DF); Pont Ventoux area: section C-C’ (GI). In detail: (A,D,G) are triangular plots showing nodal topology in terms of relative percentage of I, X, and Y nodes; (B,E,H) are triangular plots showing relative percentage of II, IC, and CC branches; (C,F,I) sections show variation in fracture intensity P21 with relative digitized fracture network and estimation of highly fractured zone (HFZ). The positions of mapped faults are reported in the transect with blue dotted lines.
Applsci 13 12789 g006
Figure 7. Simplified geological map of the Salbetrand study area (location n.3 in Figure 1). The rose diagrams in the lower box refer to all fractures sampled at each site.
Applsci 13 12789 g007
Figure 8. Topological data corresponding to the sites in section A–A’ (AC) in Figure 7: (A) Triangular plot showing nodal topology in terms of relative percentage of I, X, and Y nodes; (B) triangular plot showing relative percentage of II, IC, and CC branches; (C) variation in fracture intensity P21 with relative digitized fracture network, estimation of highly fractured zone (HFZ). The position of mapped faults in the transect are reported with blue dotted lines.
Applsci 13 12789 g008
Figure 9. Example of interpolation of fracture intensity values corresponding to the Claviere-Cesana Torinese sector at transects A–A’ and B–B’. The isolines (red lines in figure) represent the fracture intensity value interpolated from the sites shown in Figure 3.
Applsci 13 12789 g009
Figure 10. Plot of fracture intensity data calculated from P21 and I. The distribution of points shows a best-fit linear distribution function with slope 1 when considering P21 values below 20 m/m2, whereas for higher P21 values, this correlation is no longer valid.
Applsci 13 12789 g010
Disclaimer/Publisher’s Note: The statements, opinions and data contained in all publications are solely those of the individual author(s) and contributor(s) and not of MDPI and/or the editor(s). MDPI and/or the editor(s) disclaim responsibility for any injury to people or property resulting from any ideas, methods, instructions or products referred to in the content.

