1. Introduction
Geomechanical classifications have been used since 1946 to characterize rock masses, mainly oriented to tunnel construction. The two most widely used geomechanical classifications are the Q-index [
1] and rock mass rating (RMR) [
2]. These classifications determine a quality index, estimate rock mass behavior, and provide guidelines to select the rock support measures in tunnels, open pit mines, and/or slopes [
3,
4]. The RMR was conceived for tunnels and adapted for foundations, open pit mining, and rock slopes and is probably the best-known and most commonly used geomechanical classification for the preliminary characterization of rock mass quality. Other classifications modify the RMR for rock slope analysis by adding correction factors such as the slope mass rating, SMR [
5], initially employed for civil construction, and the mining rock mass rating, MRMR [
6], used in open pit and underground mining. Although the Q-index is the leading classification system for underground design, it was not systematically applied to slopes until 2015. The Q-slope classification [
7] modifies some Q-index parameters and enables the application to rock slopes. Q-slope is becoming very popular and has been applied to over 400 individual case studies in many countries and different lithologies [
8]. Nevertheless, SMR remains one of the most used geomechanical classifications for slope analysis [
9,
10]. SMR has been used for over 30 years, providing valuable insight into expected slope behavior. In contrast, the more recent Q-slope is an empirical rock slope engineering method used to quickly assess slope stability with minimal assumptions [
11,
12,
13]. SMR and Q-slope have been successfully applied to geomechanically characterize civil construction rock slopes, global natural slopes, and quarries. However, its application and reliability in the Andean region remain relatively underexplored. The application of SMR and Q-slope in the Andean part of South America can fill a knowledge gap in terms of rock types and stability assessments on high mountain slopes.
Slope movements have become one of the most dangerous natural hazards, causing many human losses and substantial material damage annually [
14]. With instabilities in rocky slopes, different methods can be used for stability evaluation. From a practical point of view, there are three main approaches to the study of rock slope failures: (a) application of geomechanical classifications and empirical analysis; (b) kinematic assessment or application of limit equilibrium methods (for block and circular failures), and (c) application of numerical methods such as finite element, finite difference, and discrete element approach. (b) and (c) present simple applications and require less information to generate reliable models; therefore, they are the most used approaches in the feasibility stages of a project.
In the study of shallow rock slopes—those without stress effects, with relatively homogeneous rock masses and heights under 50 m—limit equilibrium and kinematic are the most used methods, followed by geomechanical classifications. The Q-slope [
7,
8] indices can be applied to heavily fractured rock masses, presenting circular, wedge, toppling, or planar failures due to weak rock masses. Limit equilibrium methods can use slice methods and kinematic analysis. The three approaches are frequently combined in practice to study rocky slopes, with each technique providing complementary information [
14,
15].
Since its development in the 1970s, the Q system has been widely used in multiple projects related to civil engineering and underground mining [
7]. In 2015, the empirical Q-slope method was presented, enabling technicians responsible for ongoing construction works to evaluate the stability of excavations and rock slopes as it progresses, correcting the inclination angles of the rocks in the field and profiled slopes [
16]. The Q-slope index maintains the original RQD and Jn parameters of the Q-index but modifies and proposes adjustments for the Jr, Ja, and Jw factors and SRF:
- i.
On slopes, the relationship of (Jr/Ja) is multiplied by a subfactor “O”, which considers the impact of discontinuity orientation on slope stability;
- ii.
The Jw factor is transformed into a double parameter that analyzes the relationship between the state of the slopes and the environment in which they are located;
- iii.
The SRF factor for slopes is divided into three potential lines of analysis depending on the existing field data: (a) physical condition, (b) stress, and (c) major discontinuity.
With these modifications, Q-slope values are obtained, spanning six orders of magnitude (from 0.001 to 1000) and thus determining the slope’s recommended inclination angle and failure mode [
17,
18,
19].
Whether applied to tunnels, open pit mines, or slopes, the success of geomechanical classifications is based on the applicability to different scenarios that benefit from a continuously updated database of real applications. For example, the SMR classification, initially developed in 2015 for limestones, marls, and siltstones along the Spanish east coast, has been applied to many lithologies and countries. In 2015, there was evidence of SMR in over 50 countries and five continents [
10].
The first publication of the Q-slope index in 2015 reported its application in Panama, Australia, Laos, and the Dominican Republic [
7]. It has been since extended and applied to many other countries such as Papua New Guinea, Turkey, Serbia, Slovenia, and Spain [
8].
A scientific literature review was carried out to verify the applicability of the Q-slope. The search encompassed the WOS and SCOPUS databases and included studies published until January 2022. The results detected applications of Q-slope in Australia, Norway, India, Iran, Netherlands, Turkey, China, the United States, Spain, Italy, Algeria, the Republic of Macedonia, Brazil, Hungary, and Malawi. Besides scientific papers, the analysis included conference proceedings.
However, when focusing on the Andean slopes of Ecuador, the results confirmed a gap regarding high-impact scientific publications. The number of publications associating Ecuador and the Q-slope method is scarce. This emphasizes the relevance and necessity to validate this method in the Andean region, specifically in Ecuador, to assess its reliability. The overarching aim is to provide greater visibility to the Q-slope both in the scientific world and in applied engineering, thus contributing to regional geotectonics.
The primary aim of this study is to evaluate the applicability of the Q-slope classification in Ecuador. To this end, slopes were selected to represent the four most common types of failures: planar, wedge, flexural toppling, and block or direct toppling. The outcomes of a conventional slope kinematic analysis are used to obtain the values of some parameters employed in the equations used by the geomechanical classification [
20,
21,
22]. This study also evaluates the accuracy and reliability of the Q-slope to predict real failures compared to the recommendations given by the authors of the method [
7].
2. Study Sites
The Andes is a mountain range spanning from southern Chile to Colombia, in the heart of the South American continent. It is characterized by young high elevations, high plateaus, and significant slopes with deep valleys, only surpassed by the Himalayas. The roads and railways of rugged countries such as Bolivia, Peru, and Ecuador are often affected by slope failure problems. These risks entail high maintenance costs, long delays and disruptions in services, and hazards and disasters across the network of national road routes.
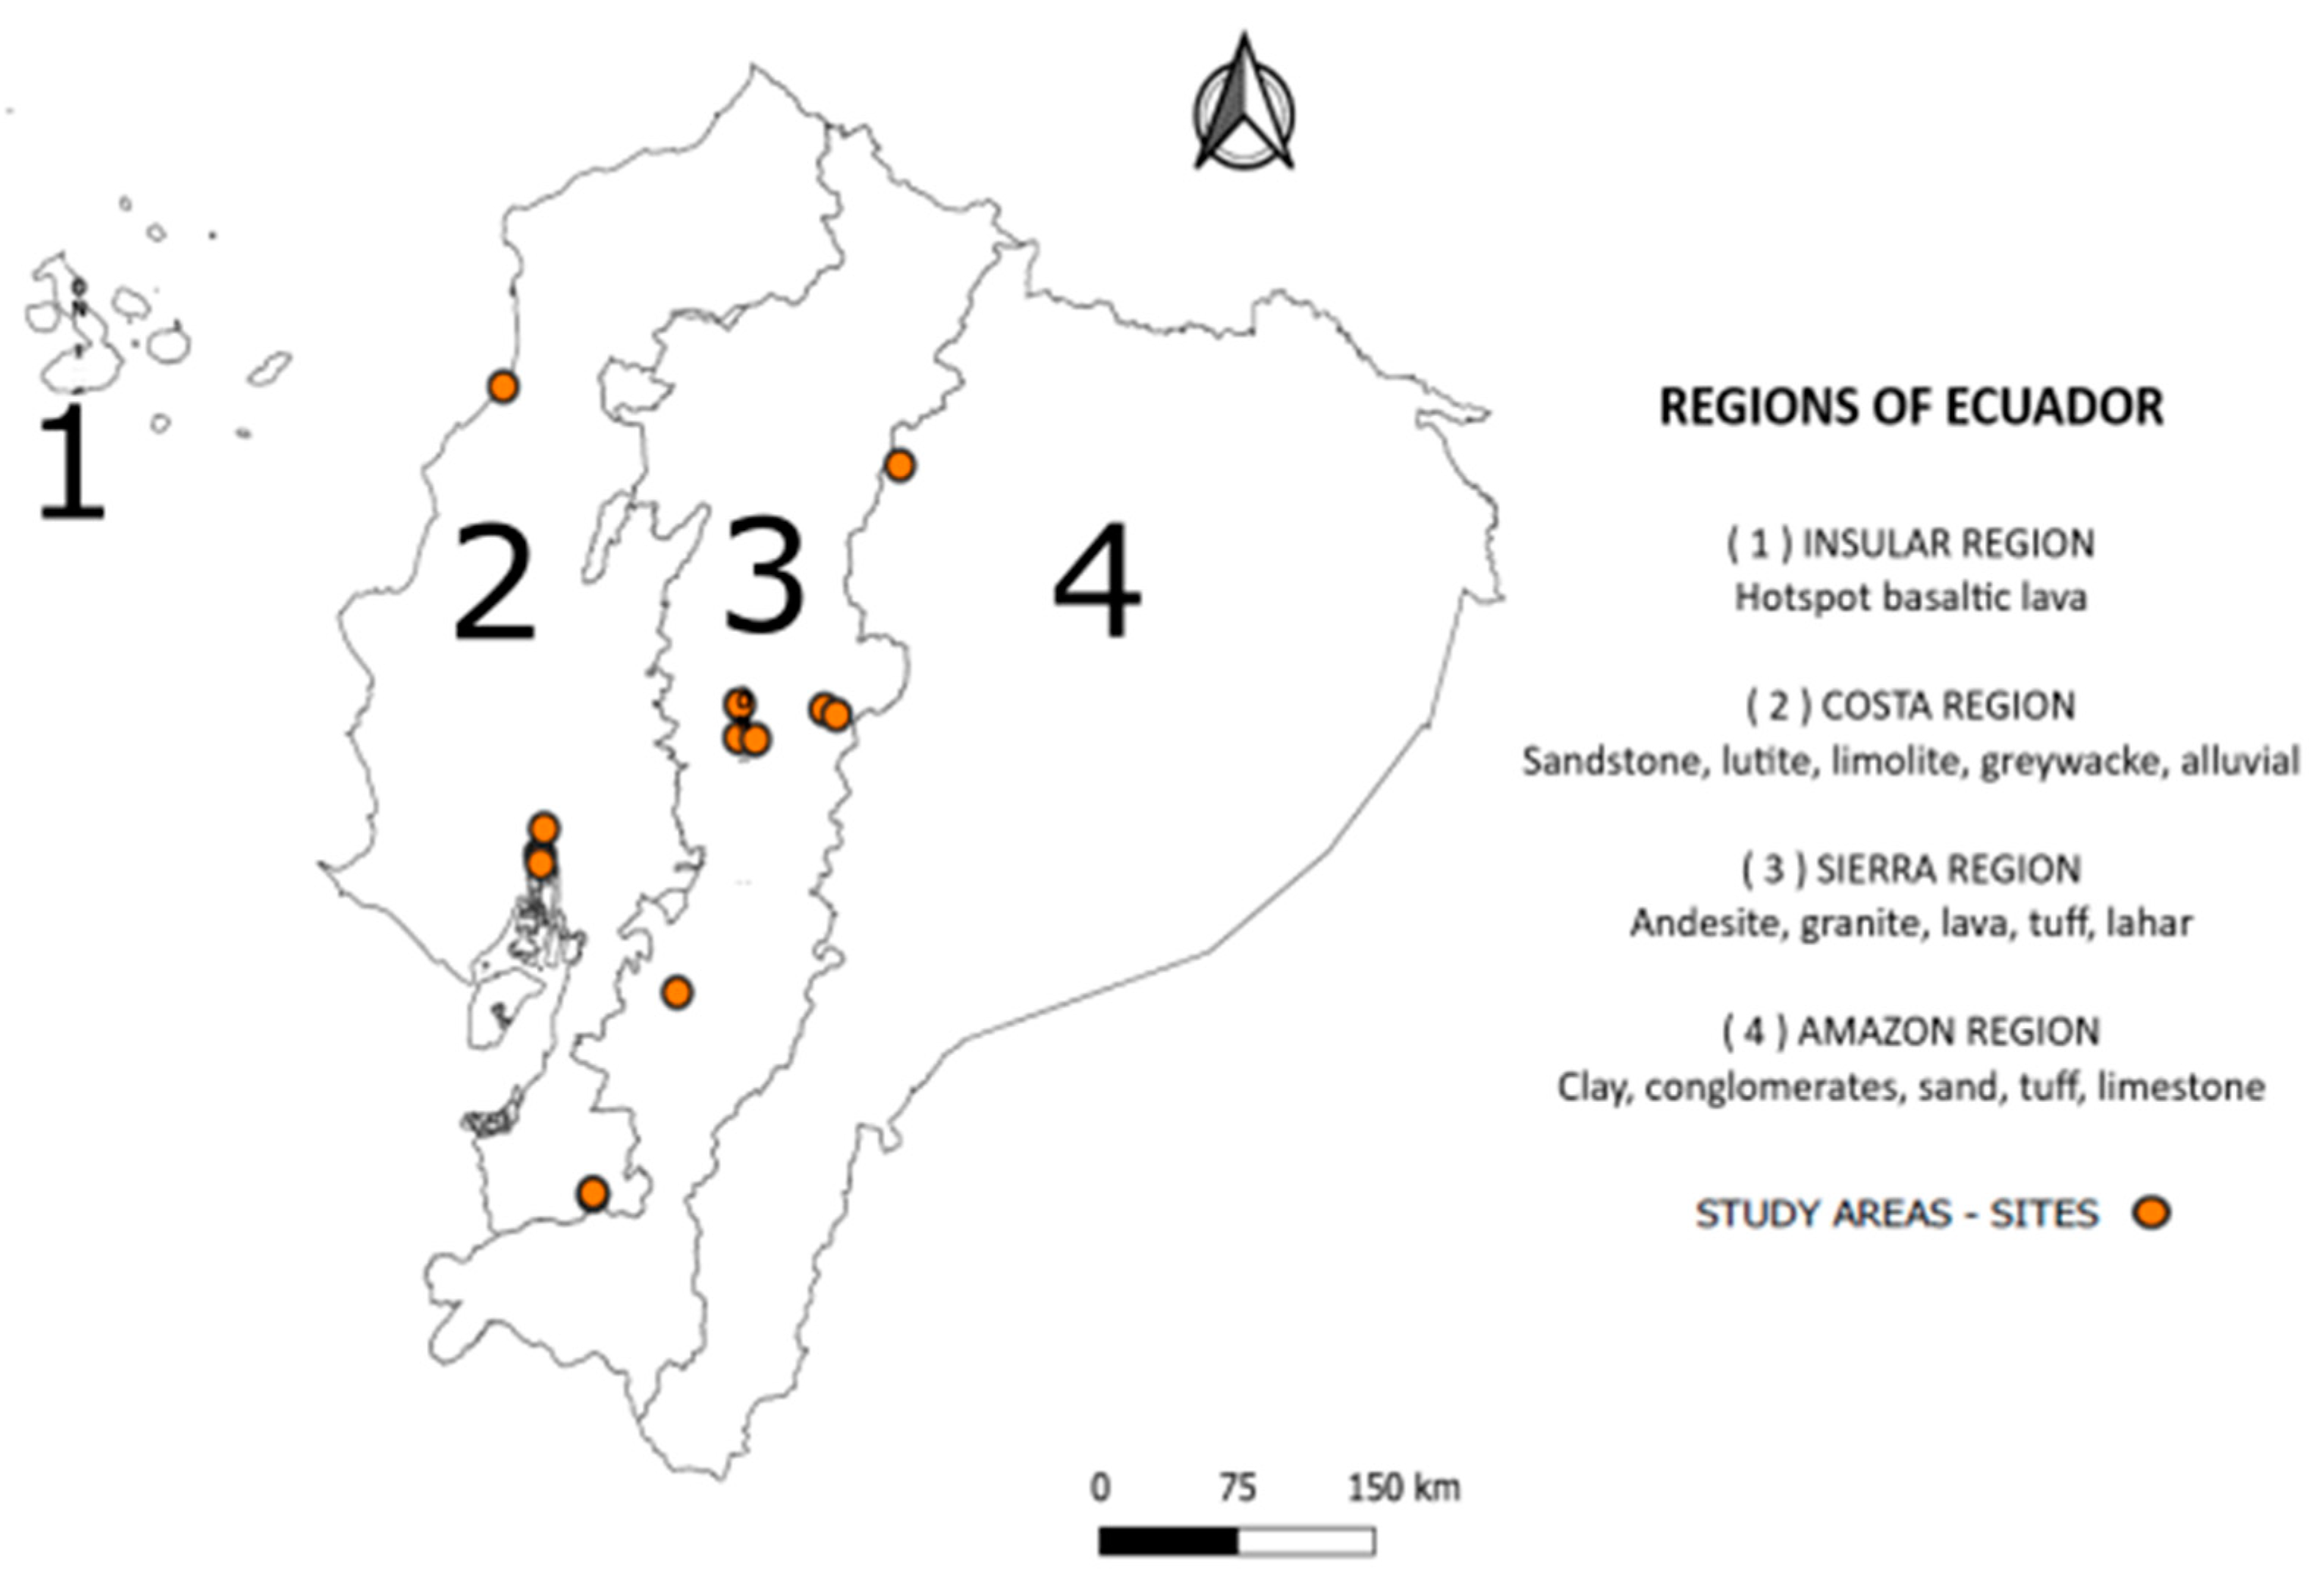
Ecuador is located in the northwestern corner of South America, bordering Colombia to the north, Peru to the south, and the Pacific Ocean to the west (
Figure 1). The insular region of Ecuador is represented by the Galapagos Islands, named by UNESCO as a World Heritage Site, which are part of the Ecuadorian territory and the Biosphere Reserve and Ramsar Sites [
23]. The present study focuses on continental Ecuador, historically marked by strong seismic events that have shaped the regional geology, dividing the country into three geological regions: (i) coast or littoral; (ii) Sierra or Interandina; and (iii) Oriente or Amazonia (
Figure 1).
The coast is subdivided into three sub-regions, south, central, and north, in which mainly sedimentary rocks are found, such as conglomerate, claystone, shale, and limestone. The Sierra is divided into north-central, central-south, and south-southwest. The predominant geology of the Sierra includes volcanic and intrusive rocks of the andesitic lavas, pyroclastic rocks, tuffs, and greywackes. The Amazon, also known as the Ecuadorian East, is divided into north, central, and south (west), with mainly sedimentary rocks such as conglomerate, sandstone, shale, claystone, gypsum, slate, and limestone. Geological materials originate from hot spots in the Galapagos Islands, with basaltic lavas dominating [
24].
This section briefly lists the areas in which the studied slopes are located (
Figure 1). The thirty study sites are located in seven different provinces of the three regions that constitute continental Ecuador: (i) Bellavista neighborhood, vía Las Aguas and Faculty of Natural Sciences of the University of Guayaquil (Guayas province), (ii) Coaque–Santa Teresa highway (Manabí province), (iii) Vías Cahuají–Cotaló, San Juan—Guaranda and Cascada Ojo del fantasma (Chimborazo province), (iv) Papallacta road from Quito to the east (Napo province), (v) El Cajas (Azuay province), (vi) Cantera Mesa, vías Pache–Piñas and Pacha–Ayapamba (El Oro province), and (vii) vía Ambato–Guaranda, zones Cashisagua and Gallo Rumi (Bolívar province).
Guayaquil (Guayas province) is the most important city on the coast of Ecuador. Guayaquil is nestled chiefly on the banks of the Guayas River, on soft sedimentary terrain with little relief. However, to the west of Guayaquil, there is a series of hills with maximum altitudes of 300 m a.s.l., formed by folded sedimentary rocks. In this province, seven slopes (aslope no. 1, 2, 3, 4, 5, 6, and 7) were studied on byways, courts, streets, and quarries. The heights of these slopes range from 4 to 18 m and include wedge, planar, and toppling stability failure types.
The Spondylus route follows the coast of Ecuador. Slope no. 8 is located in the coastal province of Manabí, on a highway called Coaque–Santa Teresa. The 12-m height slope is unstable and presents a wedge-type fault in Andesite Basalts.
The province of Chimborazo is placed in the south-central part of Ecuador and includes the Chimborazo, Tungurahua, and Altar Volcanoes as the most critical topographic features. The geology of Chimborazo is mainly composed of andesites, rhyolites, granites, lavas, volcanic tuffs, and laharitic flows. In this Andean province, five unstable and very steep Quasi-Stable slopes (slope no. 9, 10, 11, 12, and 13) are located in avenues and fairways, with heights ranging from 55 to 70 m and presenting wedge, toppling, and planar failures.
The main highway that connects the capital Quito (Sierra) to the East of Ecuador (jungle) crosses the Papallacta hot springs. This route crosscuts several basaltic lava flows of the Antisana volcano. The study slope (slope no. 14) comprises basaltic columns that project out of the road slope, causing tilting (i.e., toppling of blocks) of some columns towards the road.
The mountain pass known as El Cajas, located just 35 km from Cuenca, was declared a World Heritage Site by UNESCO. The road that connects Guayaquil to Cuenca records a 4000 m altitude difference along 120 km. The study slope (slope no. 15) within the Cajas National Park is structurally controlled and presents a typical instability of block toppling and planar failure depending on the slope area.
Piñas county is part of the El Oro (The Gold) province, named for its significant mineral deposits, actively mined since colonial times. The rocks that describe the geological system are andesitic lavas, granites, rhyolites, and slates. Six sites of interest were studied (slope no. 16, 17, 18, 19, 20, and 21), evidencing wedge failures and toppling.
The province of Bolivar extends from the slopes of the Chimborazo volcano, Arenal sector 4400 m a.s.l., to the town of Balsapamba, located 200 m a.s.l. The study areas are geologically represented by lava flows, pyroclastic rocks, laharitic flows, shales, and greywackes. Land features and accessibility to the sampling sites were the main criteria for choosing the study areas. In this province, nine slopes were surveyed, two on the Ambato–Guaranda road (slope no. 22 and 23), three in the San Juan area (slope no. 24, 25, and 26), three in the Cashisagua area (slope no. 27, 28, and 29) and one in the Gallo Rumi area (slope no. 30). These slopes show three common failure types: planar, toppling, and wedge.
3. Materials and Methods
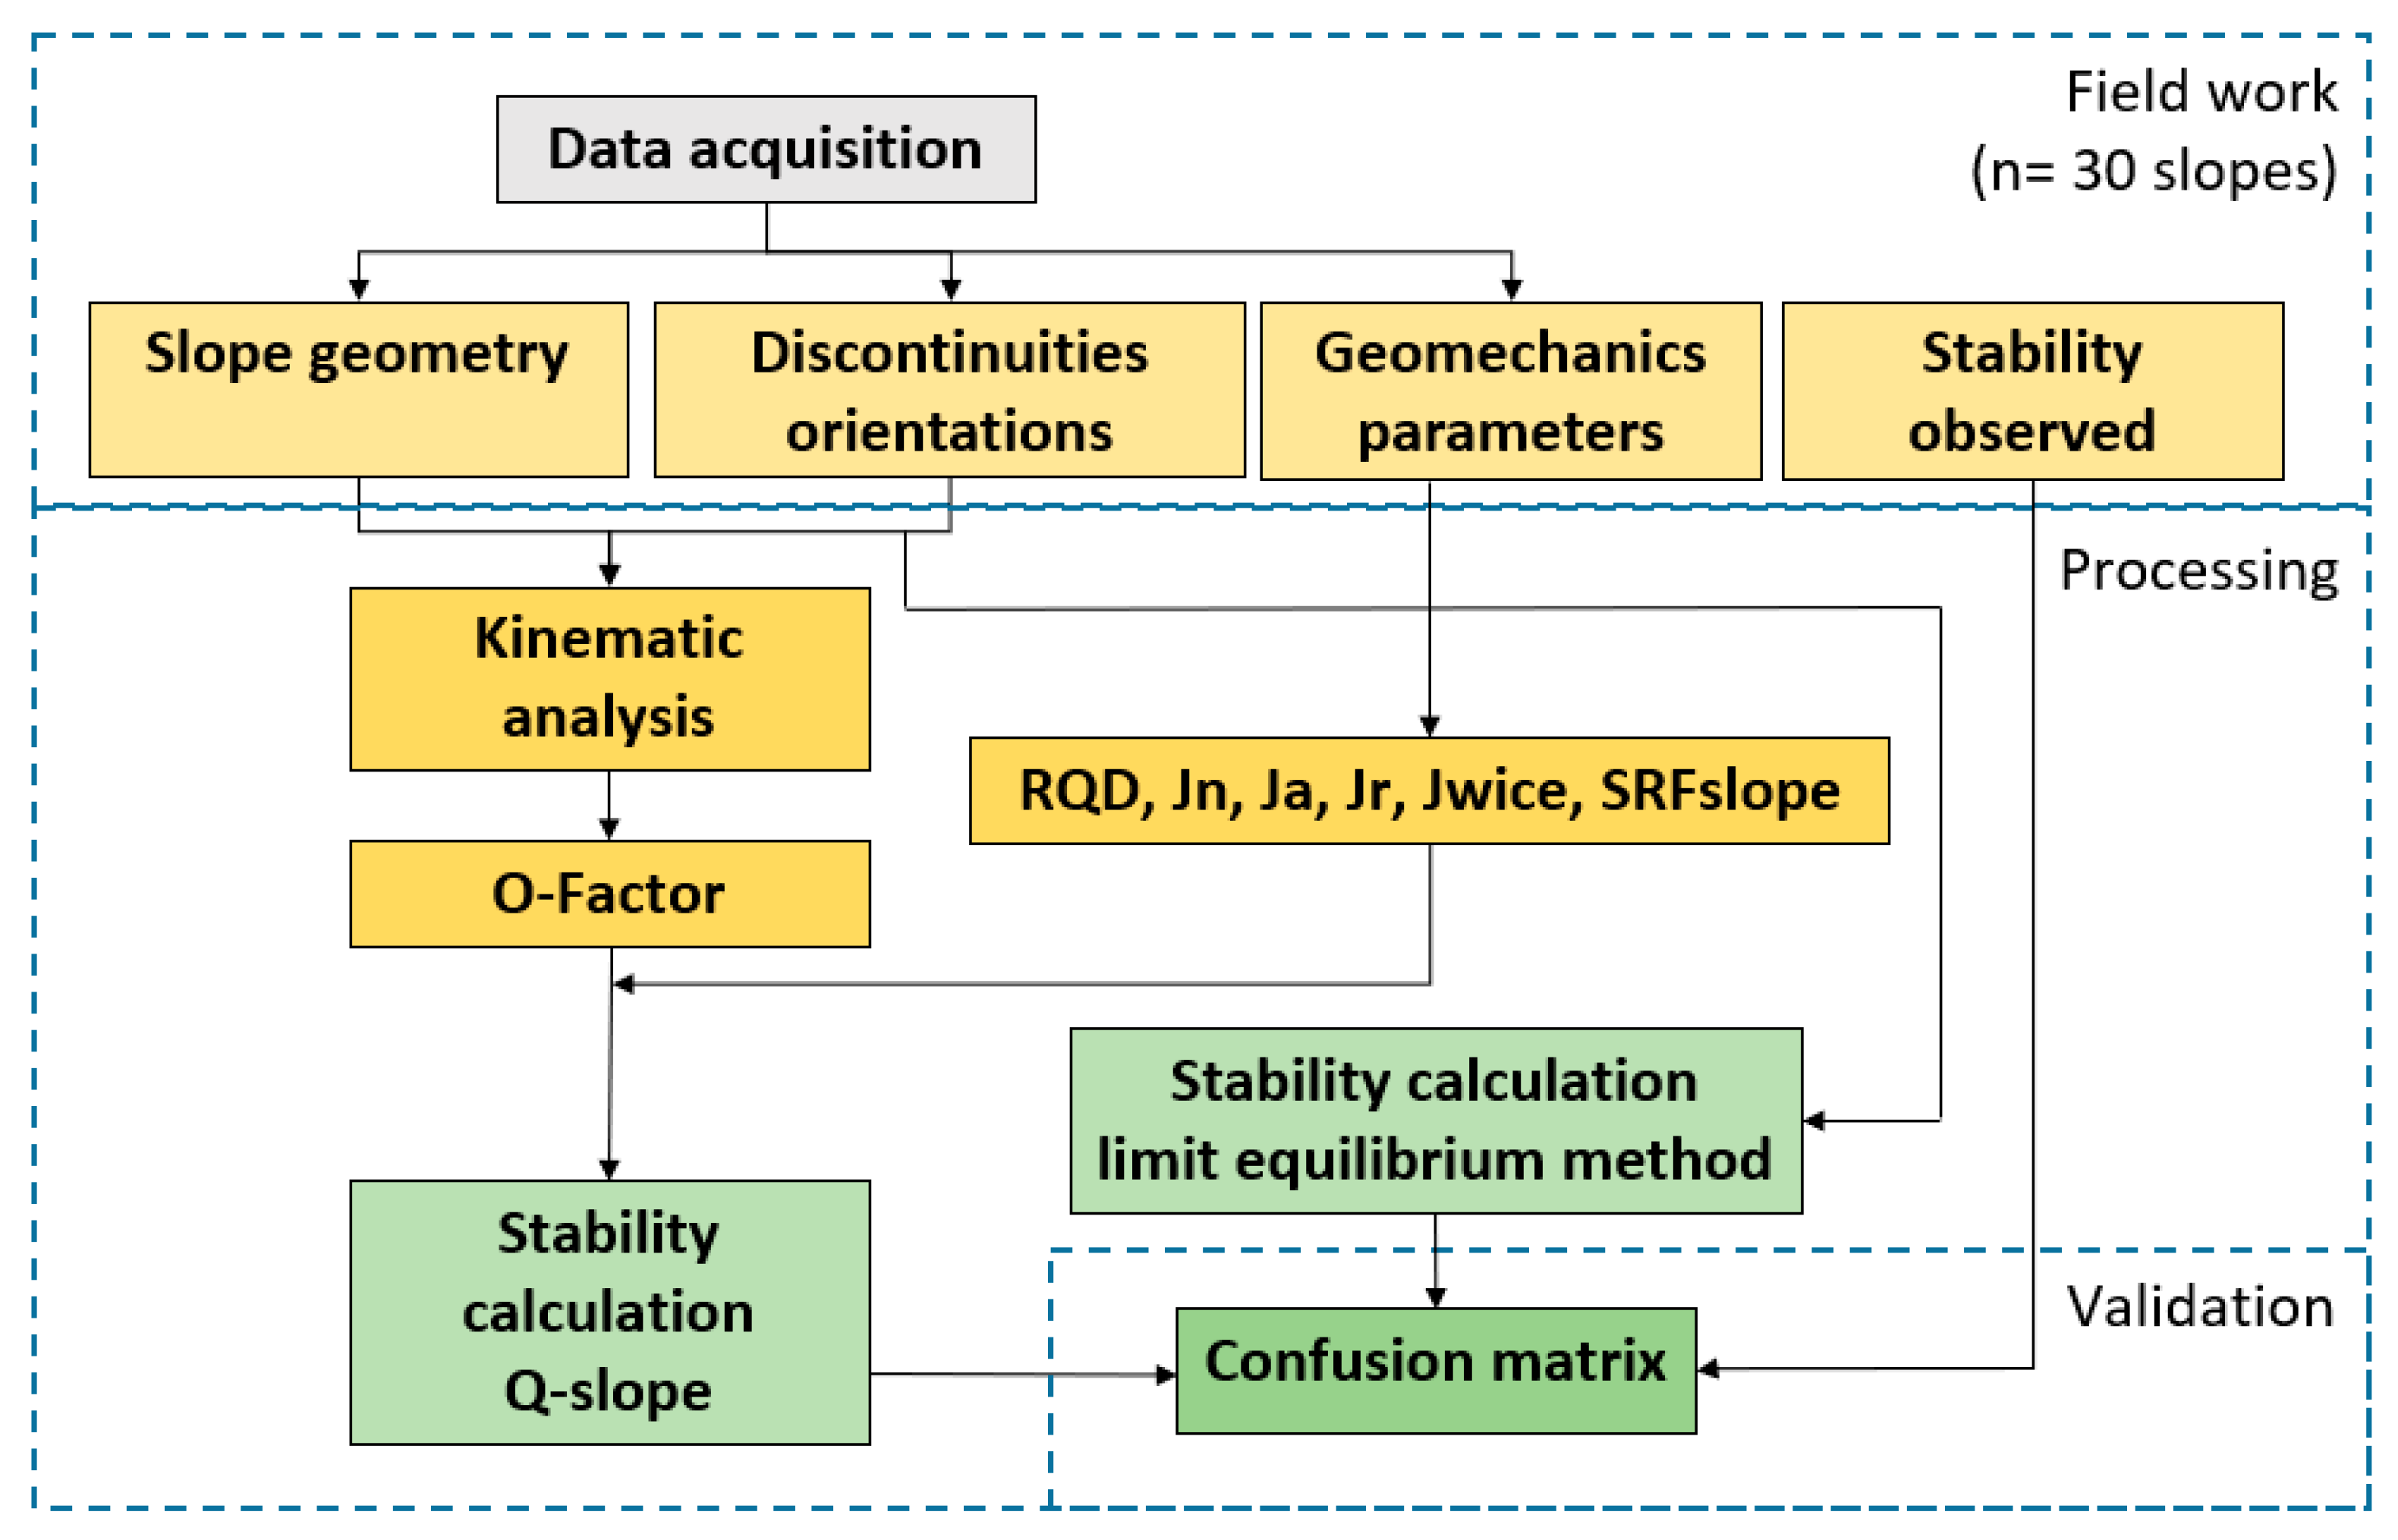
The proposed methodology was developed in three different phases (
Figure 2): (i) fieldwork for data acquisition; (ii) processing of the recorded information; and (iii) validation and reliability analysis employing a confusion matrix analysis.
3.1. Data Acquisition
Fieldwork was carried out from March 2020 to January 2021. Thirty slopes were studied in seven provinces of the three continental Ecuador regions (
Figure 1 and
Figure 3a). At each geotechnical survey (i.e., observation point), geometrical, physical, and structural data were collected regarding the type of rock matrix and behavior of the discontinuities that composed the bedrock (i.e., roughness, openness, persistence, and presence of water). Structural data of joints and discontinuities (dip/dip direction) were also registered, which enabled the identification of the failure for each slope. All the main types of failure were observed (i.e., wedge, toppling, and planar), with wedge failure being the most representative of the study (
Figure 3 and
Figure 4). During fieldwork, slope stability was also estimated in situ as stable, almost stable, or unstable based on the signs of instability observed in the slope. Most slopes were classified as unstable at the end of the survey, while the remainder were classified as almost stable and stable.
3.2. Basic Kinematic Assessment
The analysis of wedge, planar, and block toppling failure is a tridimensional-type problem. The visualization of the interactions between discontinuity planes and slopes is exceptionally complex to analyze using isometric projection but considerably simplified with stereographic projection, in which the planes are represented by points (i.e., poles). Kinematic assessment is based on the analysis of the relative orientation of discontinuity planes or poles regarding the slope, establishing four main types of failure: (a) planar; (b) wedge; (c) flexural toppling; and (d) direct toppling [
25].
Instabilities depend on the relationship between friction, the orientation of the joints, and the angle of the slope. The kinematic representation of data obtained in situ and the direct observation of evidence of instability in the slope enables a preliminary stability assessment. This initial analysis provides a broader perspective of the problem and establishes a standard for the selection of values related to the joint set number (Jn), the favorable or unfavorable orientation of the discontinuities (O-factor), major discontinuity (SRFc), and stable and unstable structure.
In order to assess the kinematic stability of the rock blocks, the shear strength of discontinuities is needed. In this paper, Barton’s (2002) criteria for the “frictional component” of joints is used while considering the cohesion = 0 to be conservative in the design. The “Frictional Component (FC) is given by the following formula [
26]:
3.3. Rock Slope Quality Assessment Using Q-slope
The Q-index for slopes (or Q-slope) was conceived in 2014, mainly for an immediate application to a hydroelectric power dam in the Dominican Republic. However, the first publication on its application occurred in 2015 [
7].
The equation applied to estimate the value of the Q-slope index shares two-thirds of its content with the original Q-index for underground works [
7,
27]. The Q-slope is calculated by Equation (2).
where:
RQD: Rock quality designation;
Jn: Joint set number;
Jr: Joint roughness number;
Ja: Joint alteration number;
O-factor: Orientation factor for the ratio Jr/Ja;
Jwice: Environmental and geological condition number, which replaces the
Joint: water reduction factor (Jw) of the original Q-index;
SRF: Stress reduction factor for the slope. It is the maximum value between SRFa (which addresses physical condition), SRFb (which addresses stress, similarly to the one used in the Q-index); SRFc: (which considers major discontinuity).
One of the novelties of the Q-slope is the discontinuity orientation factor, known as the O-Factor, which provides an adjustment to the orientation/orientations of the joints present in the studied slope [
7]. This parameter is obtained after the joint kinematic analysis establishes the type of failure, considering the orientation of the main joints and the geometry of the slope. The O-Factor is determined from a table in which the only information required is whether the joint (planar failure) or joints (in the case of wedge failure) are very favorably oriented, quite favorable, unfavorable, very unfavorable, or causing failure if unsupported [
8]. The information required to identify the O-Factor is easily obtained from the preliminary kinematic analysis of the study cases and field data.
Another parameter of interest is the strength reduction factor (SRF), which is relevant to consider when the quality of the materials constituting the rocky mass is not high and the heights of the slope increase. These singularities require the appropriate study of the strength state [
8]. The strength reduction factor is estimated from the most unfavorable value recorded for subfactors SRFa, physical condition; SRFb, which analyzes various stress–strength ranges; and SRFc, major discontinuity. These subfactors are calculated from data on the type of excavation, blasting, susceptibility to weathering, the physical state of the blocks that constitute the slope, erosion state, unconfined compressive strength, the physical state of the major discontinuity, RQD, and maximum main strength. Depending on available data on sub-parameters a, b, and c, the authors suggest selecting the most unfavorable value or discarding one of the complementary sub-values and only considering the one with the most reliable information that allows for the selection of the best value for SRF.
For further details about the description and pondering of each factor, the reader is referred to [
7,
28].
The authors of method [
7] also proposed the maximum stable angle of the slope (β), expressed in sexagesimal degrees, for a given Q-slope value (Equation (3)).
The geomechanical Q-slope classification requires information on the impact of the construction method on the slope, the state of the surroundings, and effects on exposed slopes, considering the weather, water effects, ice, and evidence of material transportation by gravitational force. Evidence of constructive methods and environmental state was carefully surveyed and compared with the back-analysis of variables—this procedure minimized significant errors in the final evaluation.
3.4. Calculation of the Factor of Safety
The factor of safety is calculated from kinematic analysis using limit equilibrium methods. RocPlane and RocTopple software from Rocscience are used for the evaluation of the stability of planar and toppling failures, respectively. Similarly, the freeware Orwa is used for the case of wedges [
29,
30]. The factor of safety (FoS) is then calculated for each slope in a deterministic mode, which is representative of the actual state of the study slopes.
3.5. Validation and Reliability of the Results (Confusion Matrix)
A confusion matrix is a tool employed to assess the errors of a classification system [
31,
32].
A statistical methodology of multivariate data was used to validate the study method, which compares the information obtained in situ against data calculated by software and the classification method. In the case study presented herein, data on the estimated or observed stability of slopes were compared with the information calculated by the empirical Q-slope method and factor of safety (FoS) obtained with software through a confusion or error matrix [
33].
The first step in developing a confusion matrix is to classify obtained data as true positives and true negatives or false positives and false negatives. This was accomplished for the sub-classes stable, quasi-stable, and failed. The later calculation of the truth overall and classification overall of each class required the horizontal and vertical sums of the data classified in step one.
The percentage value of user accuracy—recall (UA) and producer accuracy—precision (PA) is the ratio between the true positive values of each analyzed class and the values obtained in step one for truth overall and classification overall, respectively (Equations (4) and (5)).
Finally, the overall accuracy (OA) is calculated from the sum of all true positive values of all variables, divided by the amount (n) of samples analyzed (Equation (6)). The overall error of the method is obtained from the difference between the maximum OA value possible and the value calculated by the confusion matrix for the same parameter.
4. Results
Figure 3 shows the Q-slope dataset (case studies) of the failure modes, stability study regions of the analyzed slopes, and the distribution of slope angles and heights. Based on the slope’s stability and inclination angle, these are considered stable up to 45° (
Figure 3b). Beyond 45°, the slopes can be almost stable or unstable. From 61° to 90°, slopes classified as unstable appear and persist with their maximum peak in the inclination range of 61° to 75° (
Figure 3b). The comparative analysis between slope stability and height determined that slopes under five meters are stable. The “almost stable” definition disappeared in height ranges 41–50 m and 61–70 m. The slope failures started at 5 m and were present in all analyzed ranges, with maximum values in the 11–20 m and 51–60 m intervals (
Figure 3c).
Slopes were analyzed in different climatic conditions, including locations exposed to powerful elements such as water, ice, and gravity. Interestingly, almost all the values proposed by the authors [
7] for Jwice were selected. In the paper, the degree of fracturing of the RQD/Jn rock mass, condition of the discontinuities (Jr/Ja), stability, and geological and environmental factors are analyzed and presented (
Table 1 and
Table 2).
The Q-slope calculations for each slope are summarized in
Table 1 and plotted in
Figure 5, as proposed by Barton and Bar [
8]. The plot shows three areas: zone of stable slopes, zone of unstable slopes, and zone of almost stable slopes (i.e., slopes with uncertain stability or when it is challenging to predict slope behavior). The slope angle and Q-slope values were plotted to locate the studied slopes in the Barton and Bar graph. Four slopes were identified in the stable zone, one in the uncertainty zone, and the remainder in the unstable zone.
A confusion matrix enables a fast and easy visualization of the performance of a classification model. In a confusion matrix, the results obtained are displayed in rows and columns representing, respectively, the number of predictions of each class and the occurrences of the observed class. Three assessment sub-categories were assigned for the observed and predicted classes calculated by the Q-slope method and for the predicted class calculated with software to obtain the factor of safety (FoS): stable slopes = sub-class 1, quasi-stable = sub-class 2, and unstable or failed sloped = sub-class 3 (
Table 3). A comparison of classes yields true positive, false positive, and false negative values required for calculating metrics. In this study, three confusion matrices were employed (or three analyses) to predict how the empirical method can effectively classify 30 rock slopes by comparing calculated and empirical values, data gathered in situ through direct observation, and the values calculated by software Orwa, Rocplane, and Roctopple.
Statistical analysis of data revealed that of the 30 values obtained in the field (observed class), processed by the Q-slope method and processed by software (predicted class) according to the stable, almost stable, and failure sub-classes:
For statistical study cases a and b, 24 values are true positive values, and only 6 were classified as false positives–negatives; for statistical case c, 21 are true positive values, and 9 cases were classified as false positives–negatives.
For case a, a 100% value was obtained in producer accuracy (precision) with the stable and quasi-stable classes–the remaining sub-classes and statistical cases produced 95% and lower values.
Regarding user accuracy (recall), 100% values were obtained for all statistical cases with sub-class stable. Case a with sub-class failed also produced a 100% value. Other sub-classes and statistical cases registered values of 89% and lower.
The overall accuracy parameter, which defines the quality of the result obtained for the classification method (Guan et al., 2020), provided an 80% value for statistical cases a and b and 70% for case c.
Considering that the number of stable, quasi-stable, and unstable slopes is random and that the distribution of sub-class values in the confusion matrix is not homogeneous, the metric F1 score was selected as it summarizes effectively in a single value the precision and recall of the method [
34].
5. Discussion
There is a clear correlation between slopes visualized as stable and those calculated as stable using the Q-slope. Slope no. 2, 3, 6, and 7, classified as “stable”, are also classified as “stable” according to the graph proposed in 2017 for the Q-slope. It should be mentioned that slope no. 2 and 3 have been controlled for seven consecutive years because of their geographical location and access, exhibiting no evidence of instability during the monitoring period. Slope no. 5 was classified in the field as “not very stable” and is in the zone of “Quasi-Stable” slopes in the Q-slope graph [
8].
However, for the remaining 25 slopes, there are slight differences between what is predicted by the Q-slope method and what is observed. Slope no. 13, 15, 19, 20, 21, and 22 were classified in the field as “Quasi-Stable”. However, they were located in the “unstable slope” graph area. The original graph [
8] seems conservative and on the safe side for these slopes (
Figure 6), which is very reasonable for empirical and pre-design analysis.
Considering the data obtained for slopes 13, 15, 19, 20, 21, and 22 in the present work, an extension to the area of “Slope stability uncertain” is proposed, and the door is also left open for new studies to determine the possible projection from the proposed area towards the lower part of the “Unstable slopes–slope stability un-certain” zone. The kinematic analysis does not consider rock mass quality but analyzes the equilibrium of rigid blocks that destabilize through one or more surfaces and slip on each other. In the 30 analyzed cases, failures occurred through discontinuities, and kinematic analysis was the best representation of reality. Although the friction angle and joint directions are not considered in the equation proposed by Barton and Bar (2015) (Equation (1)), these are necessary to validate the faults identified in situ, related to joint orientation and how slope faults are produced. This analysis enables the selection of a suitable O-factor, essential for Q-slope calculation. Based on the kinematic analysis, the amount of joint sets present can be ratified, and therefore, the value of Jn that represents the analyzed slope can be defined.
The main issue encountered when using the Q-slope index is the precise determination of the O-factor in those slopes affected by toppling failures. In addition, this O-factor is highly biased when quantifying slopes affected by toppling ruptures. The authors of the Q-slope method determined that applying the O-factor to toppling cases could consider the same criteria of planar and wedge cases. Still, in flexural and block toppling, the discontinuity and intersections dip inside the bedrock (180° more than direct planar failure). This suggests a revision is required when applying the O-factor to toppling (in Q-slope). With flexural toppling failure, there is just one joint set to be considered (as in planar failure), but the critical factor is slightly different. Direct or block toppling is infrequent because it involves three joint sets, of which two present an intersection dipping inwards between the rock mass and the basal plane. Regarding block toppling failure, the O-factor should consider the intersection pole of the two planes that delimit the corner. This intersection must dip towards the mountain. The O-factor should also consider the basal joint of the block in a similar approach to the kinematic assessment of planar failure. However, obtaining an O-factor value from the corner intersection or basal joint analyses is not recommended.
This research indirectly validates the Jwice and SRFa parameters by providing data collected at different altitudes or extreme topographic zones in very humid tropical and high mountain environments with ice. The results emphasize the need to determine the quality of the rock and the stress to which it is subjected (Jwice and SRFb parameters) when calculating the Q-slope. A relevant contribution presented herein is the statistical reliability assessment based on a confusion matrix to establish Q-slope’s individual and general predictive precision, providing high metrics.
The analysis of the results obtained from the confusion matrix indicates that data confusion can be attributed to the current threshold for quasi-stable slopes in the Q-slope graph proposed by Barton and Bar in 2015. This zone presents conservative (considering safety) values between Q-slope values of 0.02 and 0.4 and slope angles between 35 and 84 on the Q-slope stability graph. This singularity in the Q-slope graph requires further research that enables the zone’s broadening, as proposed by Jorda [
19]. It must be highlighted that the six slopes that were not classified as quasi-stable by the Q-slope method and do not present evident field instability processes are located very close to the area of uncertain stability proposed by the authors of the method in 2015. The potential broadening of the zone of quasi-stable slopes would improve the confusion matrix metrics presented in this study, obtaining future results in favor of the empirical method studied herein.
6. Conclusions
Rock mass classifications have been successfully used worldwide for rock slope characterization for multiple reasons: effectiveness due to their connection with empirical methods and dissemination and communication across scientists, engineers, and the general public. In other words, rock mass classifications “put numbers to geology” [
35]. The Q-slope method was applied herein in three natural regions of Ecuador—coast, mountains, and jungle—where igneous, sedimentary, and metamorphic rocks exhibiting different weathering conditions were found.
The result of the stability analysis using the Q-slope method determined that of the 30 slopes analyzed, 25 are in unstable conditions, 1 is almost stable, and 4 slopes are in stable conditions. The results demonstrated that instability processes occur for slopes starting at 61 degrees of inclination and 6 m high.
One of the main modifications implemented in the Q-method for its application to slopes is the shear strength, which, in our specific case, is obtained by multiplying the Jr/Ja ratio by the new O-factor. Nevertheless, when slopes that present toppling failures are studied, the method does not clearly establish the values to be considered for the O-factor (differently from the cases of planar and wedge failures). Therefore, future investigation is advisable to determine the O-factor values rigorously and accurately, especially for the toppling cases. The parameter could depend on the difference in strikes and dips between slope and joints, following the determination of the F1, F2, and F3 factors of the SMR correction.
Considering the values obtained and the metrics calculated for each class of statistical case a, it can be concluded that as sub-class 1 presents high values for precision and recall, the method can perfectly classify this sub-class. For sub-class 2, a high precision value is obtained with a low recall value; in this case, the method does not classify this class very well—however, when it does, it is highly reliable. For sub-class 3, the model provides a low precision value and a high recall value, which suggests that the method classifies the sub-class well but can also confuse the individuals of other sub-classes. The F1 score values obtained for each sub-class in the different statistical cases analyzed present values that range from 0.62 to 1, indicating that the Q-slope method is a balanced method that can confuse some cases as false but is also capable of correctly classifying all positive true cases, such as those of sub-class 1 of statistical case a. Only sub-class 2 of statistical case a returned an F1 score value of 0.25, which means that the model can confuse values as false for this specific case. Sub-classes 2 for statistical cases b and c present null values because the calculated FoS is a fixed value that only defines if the slope is stable or unstable. In these cases, a direct association could not be made between the quasi-stability obtained in situ and that predicted by the empirical method and FoS.
In general, considering that overall accuracy can be divided into quartiles, classifying quartile C1 as bad, C2 as intermediate, C3 as good, and C4 as very good, the value obtained for OA herein occupies the highest quartile, ranking the method as very good.
The results demonstrated the applicability and reliability of the Q-slope method in Ecuador. This Andean country can be considered a natural laboratory for geosciences because of its diversity in geological, geomorphological, and environmental conditions.

 ,
, 


