1. Introduction
Traffic safety [
1] has always been the focus of the world’s attention and one of the main problems solved by each country. In recent years, research institutes, automobile companies, and other industries have been conducting in-depth research on intelligent driving, which is typically represented by Advanced Driver Assistance Systems (ADAS) [
2,
3], which can monitor the road and traffic environment, as well as the state of the vehicle itself, and then help drivers prevent accidents and improve driving safety through warnings, interventions, or autonomy control. The first task for ADAS is obstacle avoidance, but the prerequisite for obstacle avoidance is the accurate detection of obstacles. At present, although there are many different methods for target detection, there are various shortcomings, such as: missed detection, false detection, lack of real time, and so on. According to the research, it is found that the current environment perception of ADAS systems mainly has the application based on a radar point cloud [
4] and the application based on pure vision [
5]. Although radar technology has a long measuring distance, the difficulties of not being able to obtain visual information, the high cost, and the difficulty in distinguishing between multiple targets have been the difficulties of research in various industries. For visual perception, although limited by the complex environment, a high resolution can provide rich target information and is favored in the car industry due to its low cost and other advantages. The typical representative among them is the 2023 Tesla FSD V12, which is an end-to-end pure visual perception system. The detection of obstacles is one of the key research focuses of the environment perception system, and the obstacle detection methods are mainly divided into traditional visual detection and deep learning-based target detection. With the rapid development of computer vision technology and deep learning algorithms, obstacle detection has become an important technology in assisted driving systems [
6].
Currently, deep learning-based obstacle detection methods have become mainstream, and the commonly used architectures are R-CNN [
7], Fast R-CNN [
8], Faster R-CNN [
9], mask R-CNN [
10], and YOLO [
11]. Among them, the YOLO series of algorithms performs better in terms of speed and accuracy and is one of the most widely used obstacle detection algorithms.
However, in practical applications, pole-shaped obstacles are susceptible to environmental factors such as lighting, weather conditions, and occlusion. These factors can significantly impact the accuracy of detection and the range of pole-shaped obstacles. Moreover, due to the different heights and shapes of pole-shaped obstacles, multi-scale detection is required to better detect pole-shaped obstacles of different sizes and shapes. Dhall et al. [
12] proposed a method for the rapid detection of traffic cones. First, an improved detector is used to detect the traffic cones. Then, a regression network is employed to identify the key features of the traffic cones. Finally, the three-dimensional information of the traffic cones is obtained using the perspective n-point algorithm. Although this method can run on low-power hardware, there is still significant room for improvement in terms of detection speed and accuracy. He et al. [
13] propose a feature fusion method aimed at improving obstacle detection performance under foggy conditions. The main idea is to identify the differences in image features between sunny and foggy days, construct a dataset of foggy images, and then utilize the feature fusion method to enhance obstacle detection performance. Liu et al. [
14] proposed a method of fusing convolutional features and the GCANet network for the problem of the difficult extraction of obstacle feature information under a foggy sky. After processing the obstacle images of the pair under foggy weather, the information on the original obstacles is fully retained, thus realizing the detection of obstacles under the foggy sky. Pan et al. [
15] proposed a method for integrating YOLO and monocular vision techniques for the detection of pedestrian distance in complex environments. To realize the detection of distance between multiple pedestrians in complex environments, Luo et al. [
16] proposed a stereo vision-based method for roadless spatial extraction and obstacle detection for the task of obstacle detection in complex transportation environments. The method was based on a V parallax image and RANSAC algorithm, which enables obstacle detection by extracting the height and width information of obstacles on the road. Guan et al. [
17] proposed a method that fuses YOLOv4 and binocular stereo vision to reduce the cost of autonomous driving environment perception methods, among other issues. Although many researchers have devoted themselves to the study of real-time and accurate target detection, they have not reached a good balance of the detection accuracy and detection rate.
In particular, this problem is more prominent in the research on target ranging and recognition. Therefore, it is of great significance for the development of perception technology in assisted driving systems to quickly and accurately obtain the key features of pole-shaped obstacles in complex and changing environments. The contributions of this study are as follows.
The CIoU loss function is replaced by the SIoU loss function, which is improved to address the issue of overlapping multiple prediction frames and the optimal matching of anchor frames, while also ensuring real-time performance. Meanwhile, the improved loss function is redefined and named Monge–Kantorovich SIoU (MKS).
A multi-scale feature efficient fusion network architecture (MFFNA) is proposed. It extracts feature information from different scales of the feature space through an efficient multi-scale feature extraction module.
A hybrid attention mechanism is introduced. The feature information is passed to the hybrid attention mechanism to improve the extraction of multi-scale information in the feature space, suppress irrelevant and complex environmental background information, and focus on the feature information of road obstacles.
The detected target frame information is fused with the binocular stereo-matching algorithm, enabling the accurate recognition, classification, and ranging of pole-shaped obstacles in complex environments.
The rest of the paper is organized as follows.
Section 2 describes the core algorithms, including the improved target detection algorithm and the target detection algorithm fused with the binocular ranging algorithm.
Section 3 describes the experimental environment, datasets, and evaluation metrics for the model.
Section 4 analyzes the enhanced network model experimentally. Finally, conclusions are drawn in
Section 5.
2. Methods
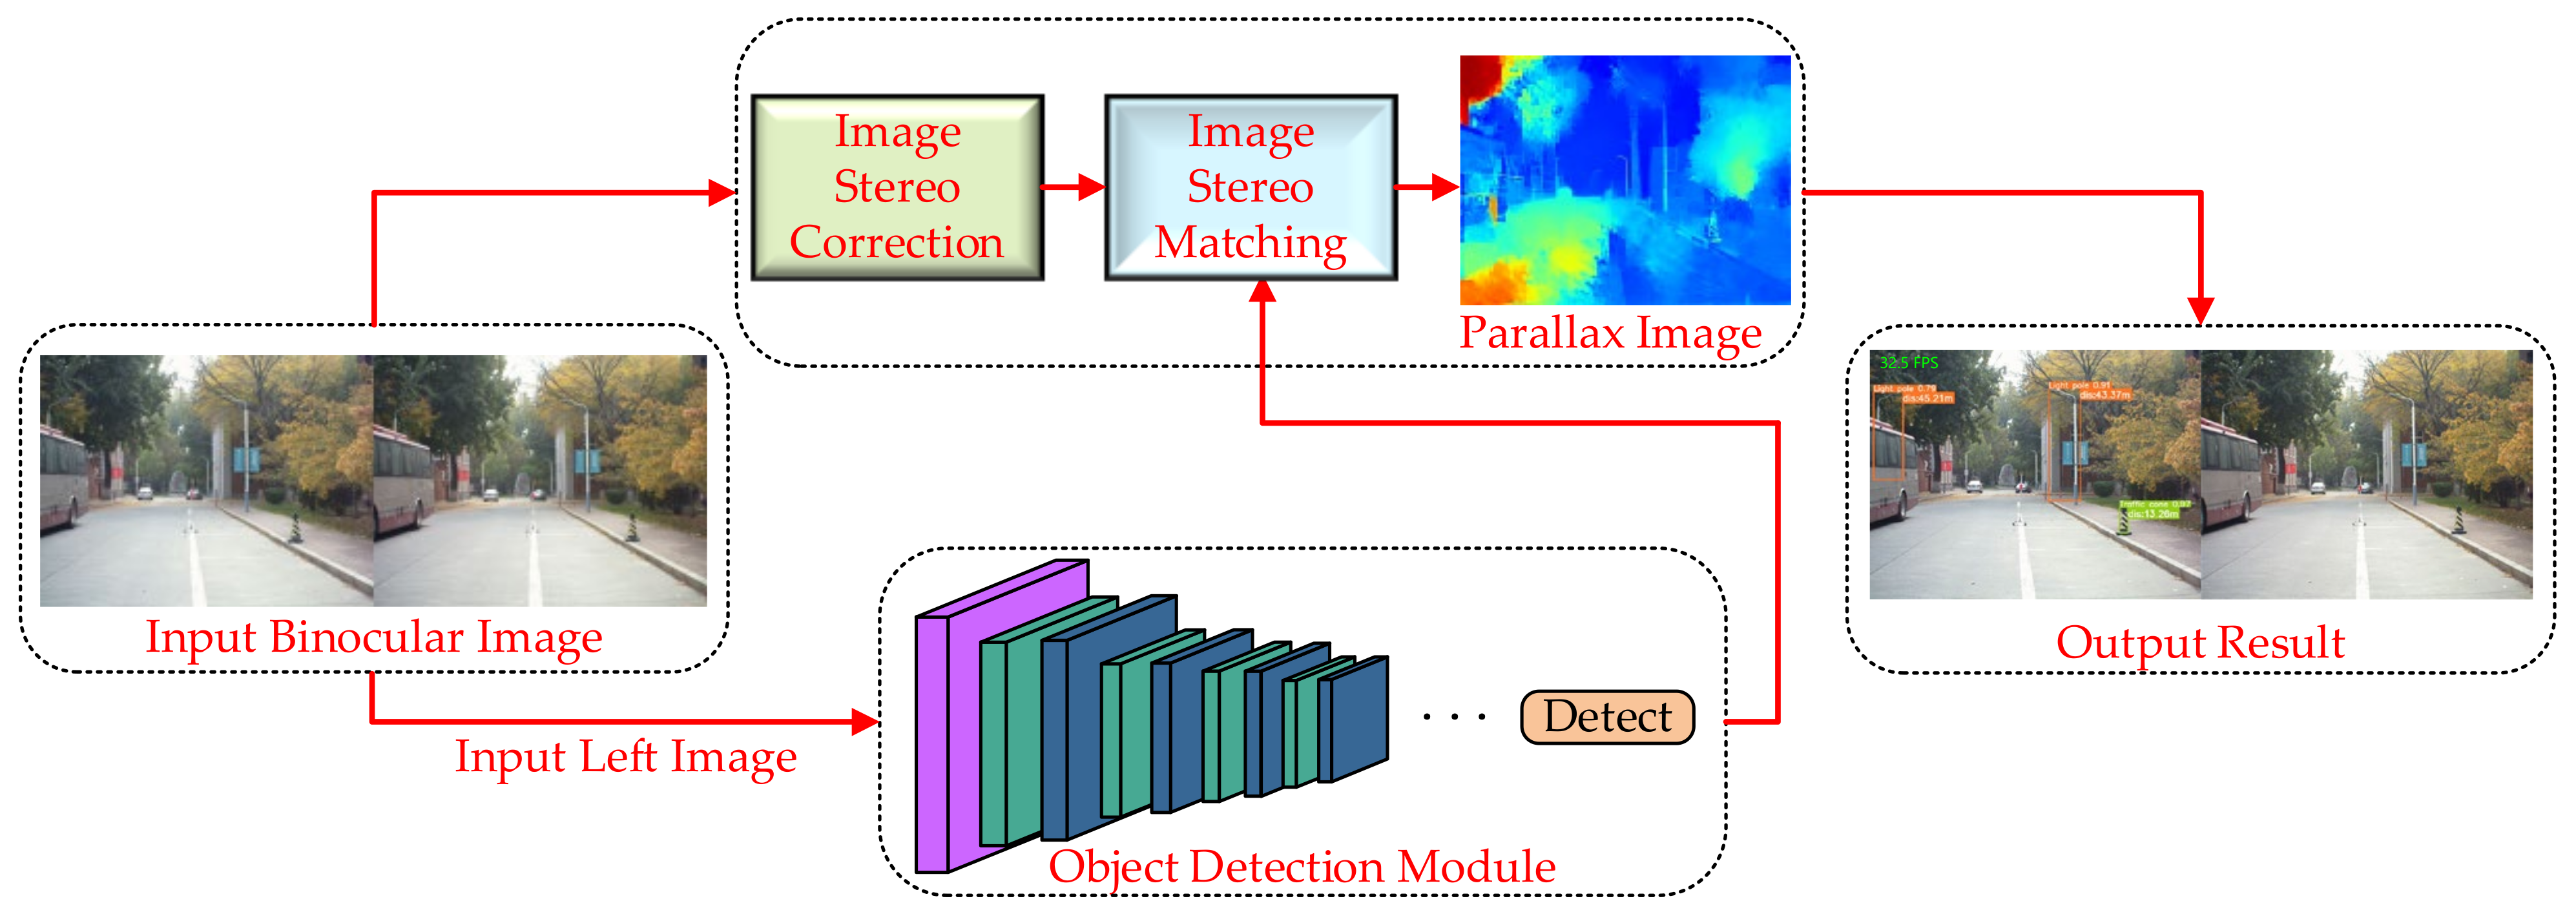
First, the images acquired by the binocular camera in real time are inputted to the ranging module with binocular images and to the detection module with left-eye images, respectively. Then, stereo correction and stereo matching are performed in the ranging module, respectively. At the same time, the target information is accurately obtained in the target detection module. Finally, the target information and stereo-matching are correlated, allowing for more accurate species and distance information to be obtained. The overall process is shown in
Figure 1.
2.1. MKS Loss Function
Object detection and recognition classification are key research areas in computer vision, and the loss function plays an important role in determining detection accuracy. The loss function is used to evaluate the difference between the model’s prediction result and the actual target. The smaller the loss function value, the closer the prediction result is to the actual target. The loss function of YOLOv5 consists of three main components: rectangular box loss (box loss), confidence loss (obj loss), and classification loss (cls loss). Therefore, the total loss function of the YOLOv5 algorithm is defined as follows:
where, A, B, and C are the weight values of the three loss functions and A = 1, B = 0.5, and C = 0.1.
In the current study, YOLOv5 utilizes the CIoU loss function [
18]. However, this loss function only considers the aggregation of the bounding box regression metrics and does not account for the mismatch between the required true and predicted frames. As a result, it leads to slow convergence and low efficiency. Therefore, the SIoU loss function [
19] is used instead of the original loss function. However, there are some problems with the SIoU loss function, such as category imbalance in rod obstacles, the overlapping of multiple prediction frames, and the issue of optimal matching. Therefore, based on the SIoU loss function, the Monge–Kantorovich (MK) [
20] function is introduced to optimize the IoU loss function. Specifically, the MK algorithm considers two sets of points as input values. In other words, the predicted bounding box and the true bounding box are treated as sets of points. Then, the distance matrix between these points is computed, where each entry in the matrix represents the distance between the predicted bounding box and the true bounding box. Finally, the Sinkhorn–Knopp algorithm [
21] is used to find the best match between the predicted and real bounding boxes, minimizing the total negative IoU loss. In addition, the
MK function can regularize the model to prevent overfitting. To better understand the
MK function, it is defined as follows. The mathematical definition of the Monge problem [
22] is: Given two metric spaces
X and
Y and two probability measures μ ∈
P(
X), ν ∈
P(
Y), loss function c:
X ×
Y→
R ∪ {+∞}:
where c (
x, T(
x)) denotes the loss of
x to T(
x), T
#μ=ν denotes the mapping between μ and ν, and T extrapolates the probability measure μ to ν.
Kantorovich generalizes the transmission mapping to the joint probability distribution, which has:
The Kantorovich problem [
23] is mathematically defined as two probability measures μ ∈
P(
X) and ν ∈
P(
Y) and a cost function c:
X ×
Y→
R ∪ {+∞} for two metric spaces
X,
Y:
In Monge’s problem, only one type of mapping can be targeted, either one-to-one or many-to-one. However, the Kantorovich problem can be solved by simplifying the problem in a one-to-many manner.
The SIoU loss function is introduced to redefine the existing loss functions for the current problem, which include angle loss, distance loss, shape loss, and IoU loss. The IoU loss is the most commonly used loss function for target detection. It represents the intersection over the union ratio of the true and predicted frames. However, while the IoU metric is used for computation, negative IoU is used for optimization during training. Negative IoU is defined as follows.
where
P denotes the prediction frame and
G denotes the true frame. Thus, the final expression of the SIoU loss function is as follows.
where
represents the distance cost, while
represents the shape cost. IoU represents the ratio of the union and intersection between the ground truth box and the predicted box.
2.2. Hybrid Attention Mechanisms
The attention mechanism [
24] is a technique used to simulate human attention and has been widely applied in the field of deep learning. Currently, there are two main types of attention mechanisms for processing feature maps: channel attention mechanisms and spatial attention mechanisms [
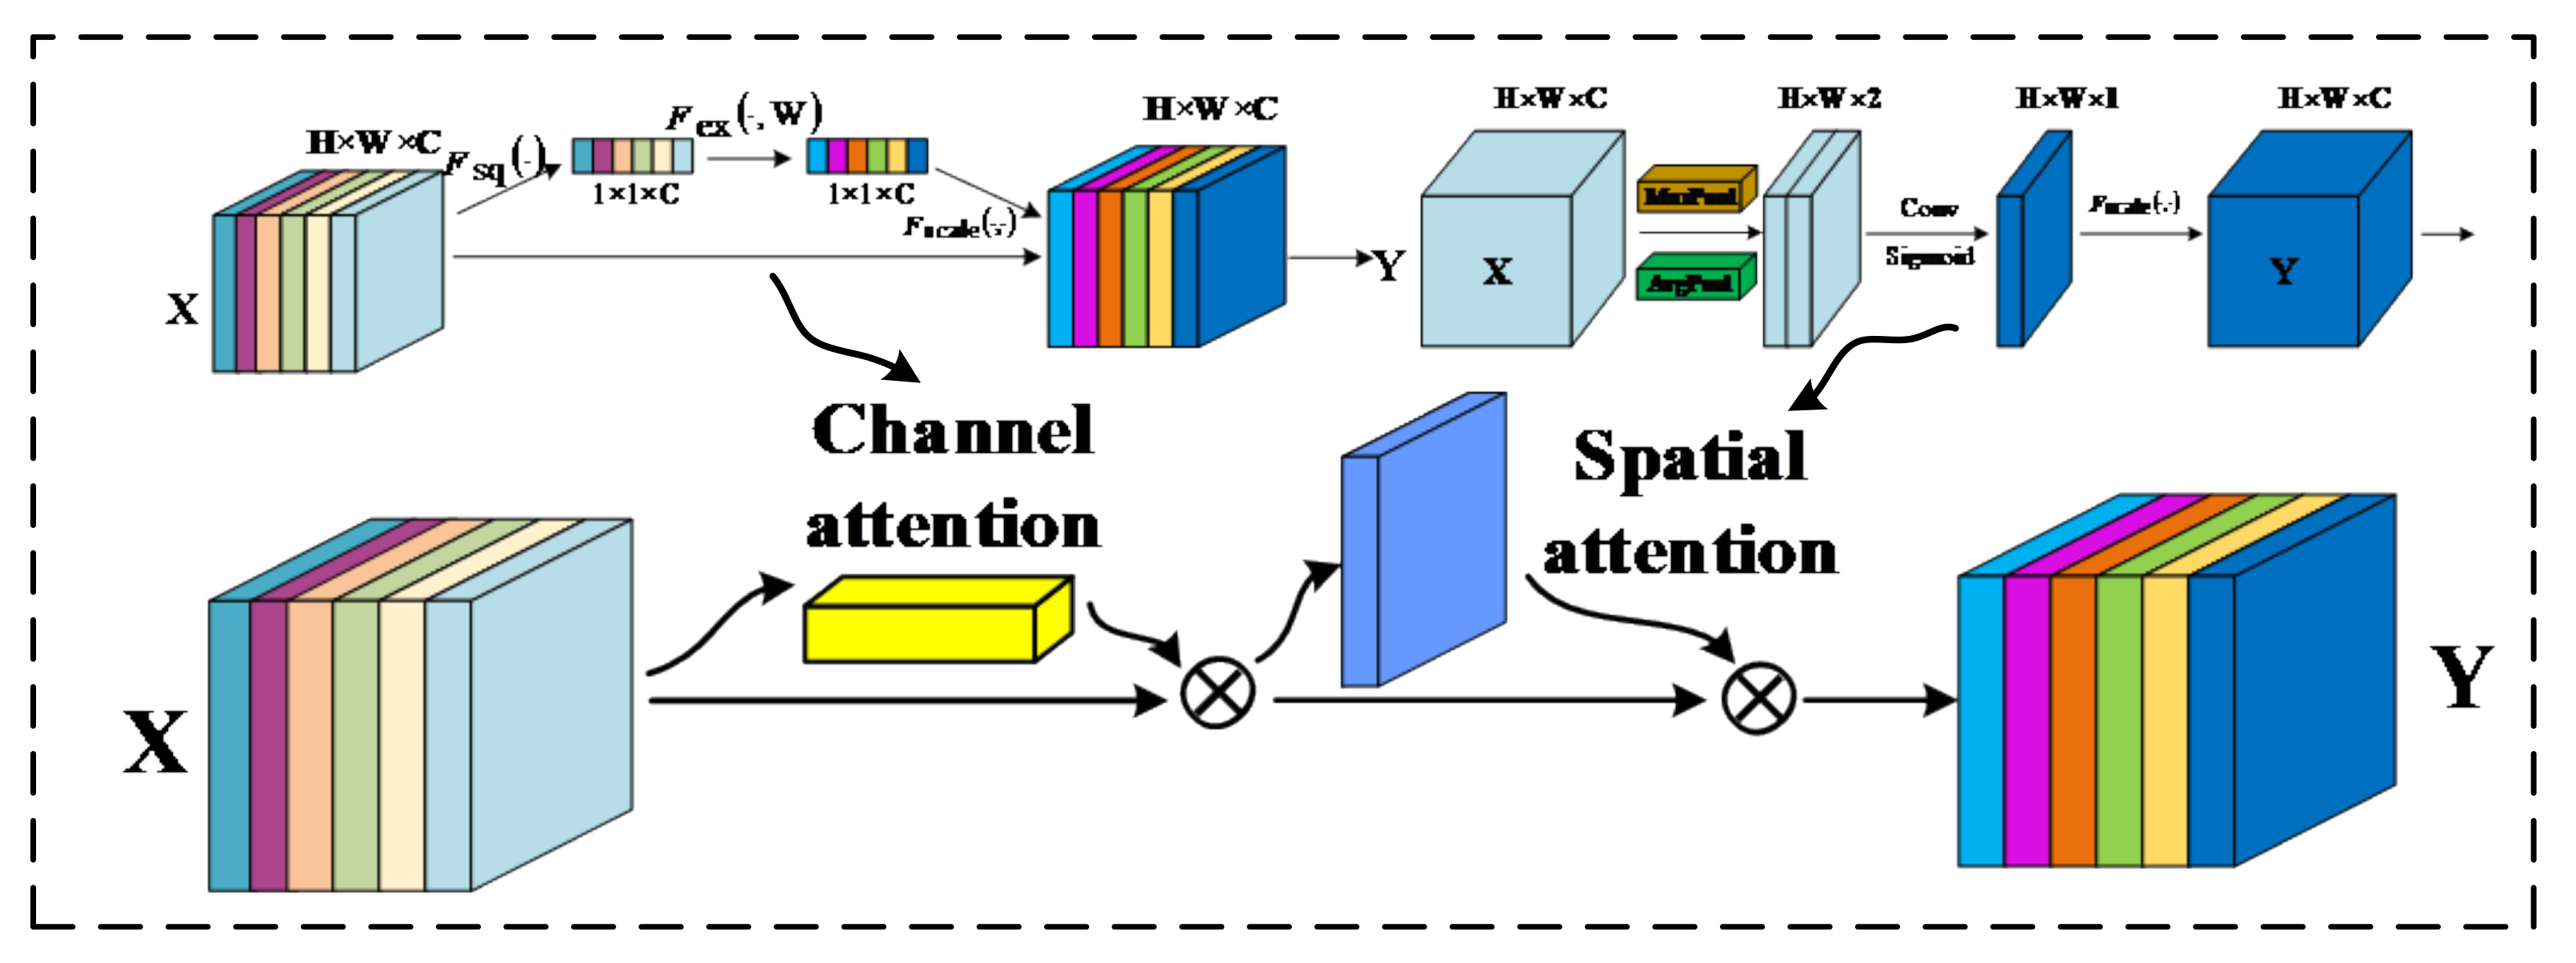
25]. The model in this paper is mainly used in outdoor complex environments to better obtain accurate detection information. It is very necessary to suppress the complex background and pay attention to the important feature information. However, the above two attention mechanisms can be used not only to selectively focus on specific regions or channels in the input data but also to better capture useful feature information. Consequently, integrating these two mechanisms can not only play their respective advantages to improve the model’s performance but can also reduce the computational complexity and enhance the generalization ability.
Currently, there are two main methods for connecting the two attention mechanisms in deep learning: the cascade and parallel methods. The parallel attention mechanism has a relatively simple structure and may not fully exploit the correlation between different feature subspaces, resulting in insufficient feature representation. Therefore, more layers need to be stacked. The cascade attention mechanism, in contrast, can utilize the outputs of multiple attention modules in a cascade. This allows for the better capture of spatial and channel correlations and enhances the feature expression capability. In addition, the cascade structure can also perform attention fusion for feature maps of different scales to better adapt to objects of varying sizes. The cascade structure is illustrated in
Figure 2.
2.3. Multi-Scale Feature Pyramid
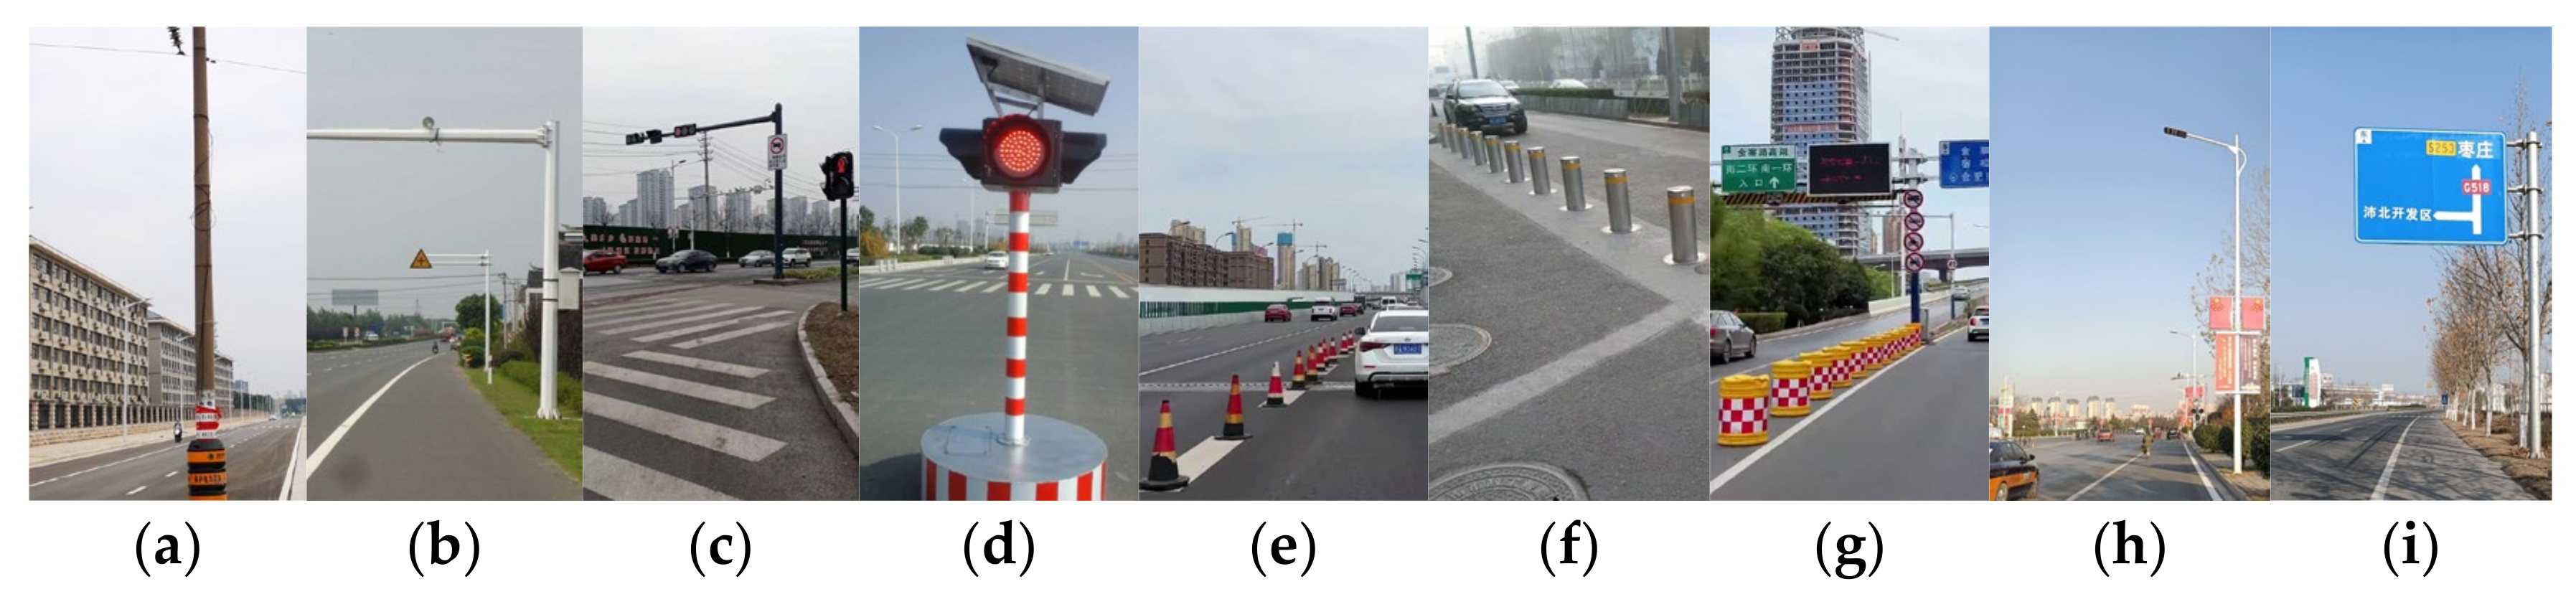
The main types of objects detected in this paper include electric poles, surveillance poles, traffic signal poles, traffic cones, road pile poles, street lamp poles, and traffic sign poles. These pole-shaped obstacles vary in size, ranging from small traffic cones to large surveillance poles. Due to the significant variation in the scales of their features, this paper proposes an optimized multi-scale feature fusion network architecture (MFFNA).
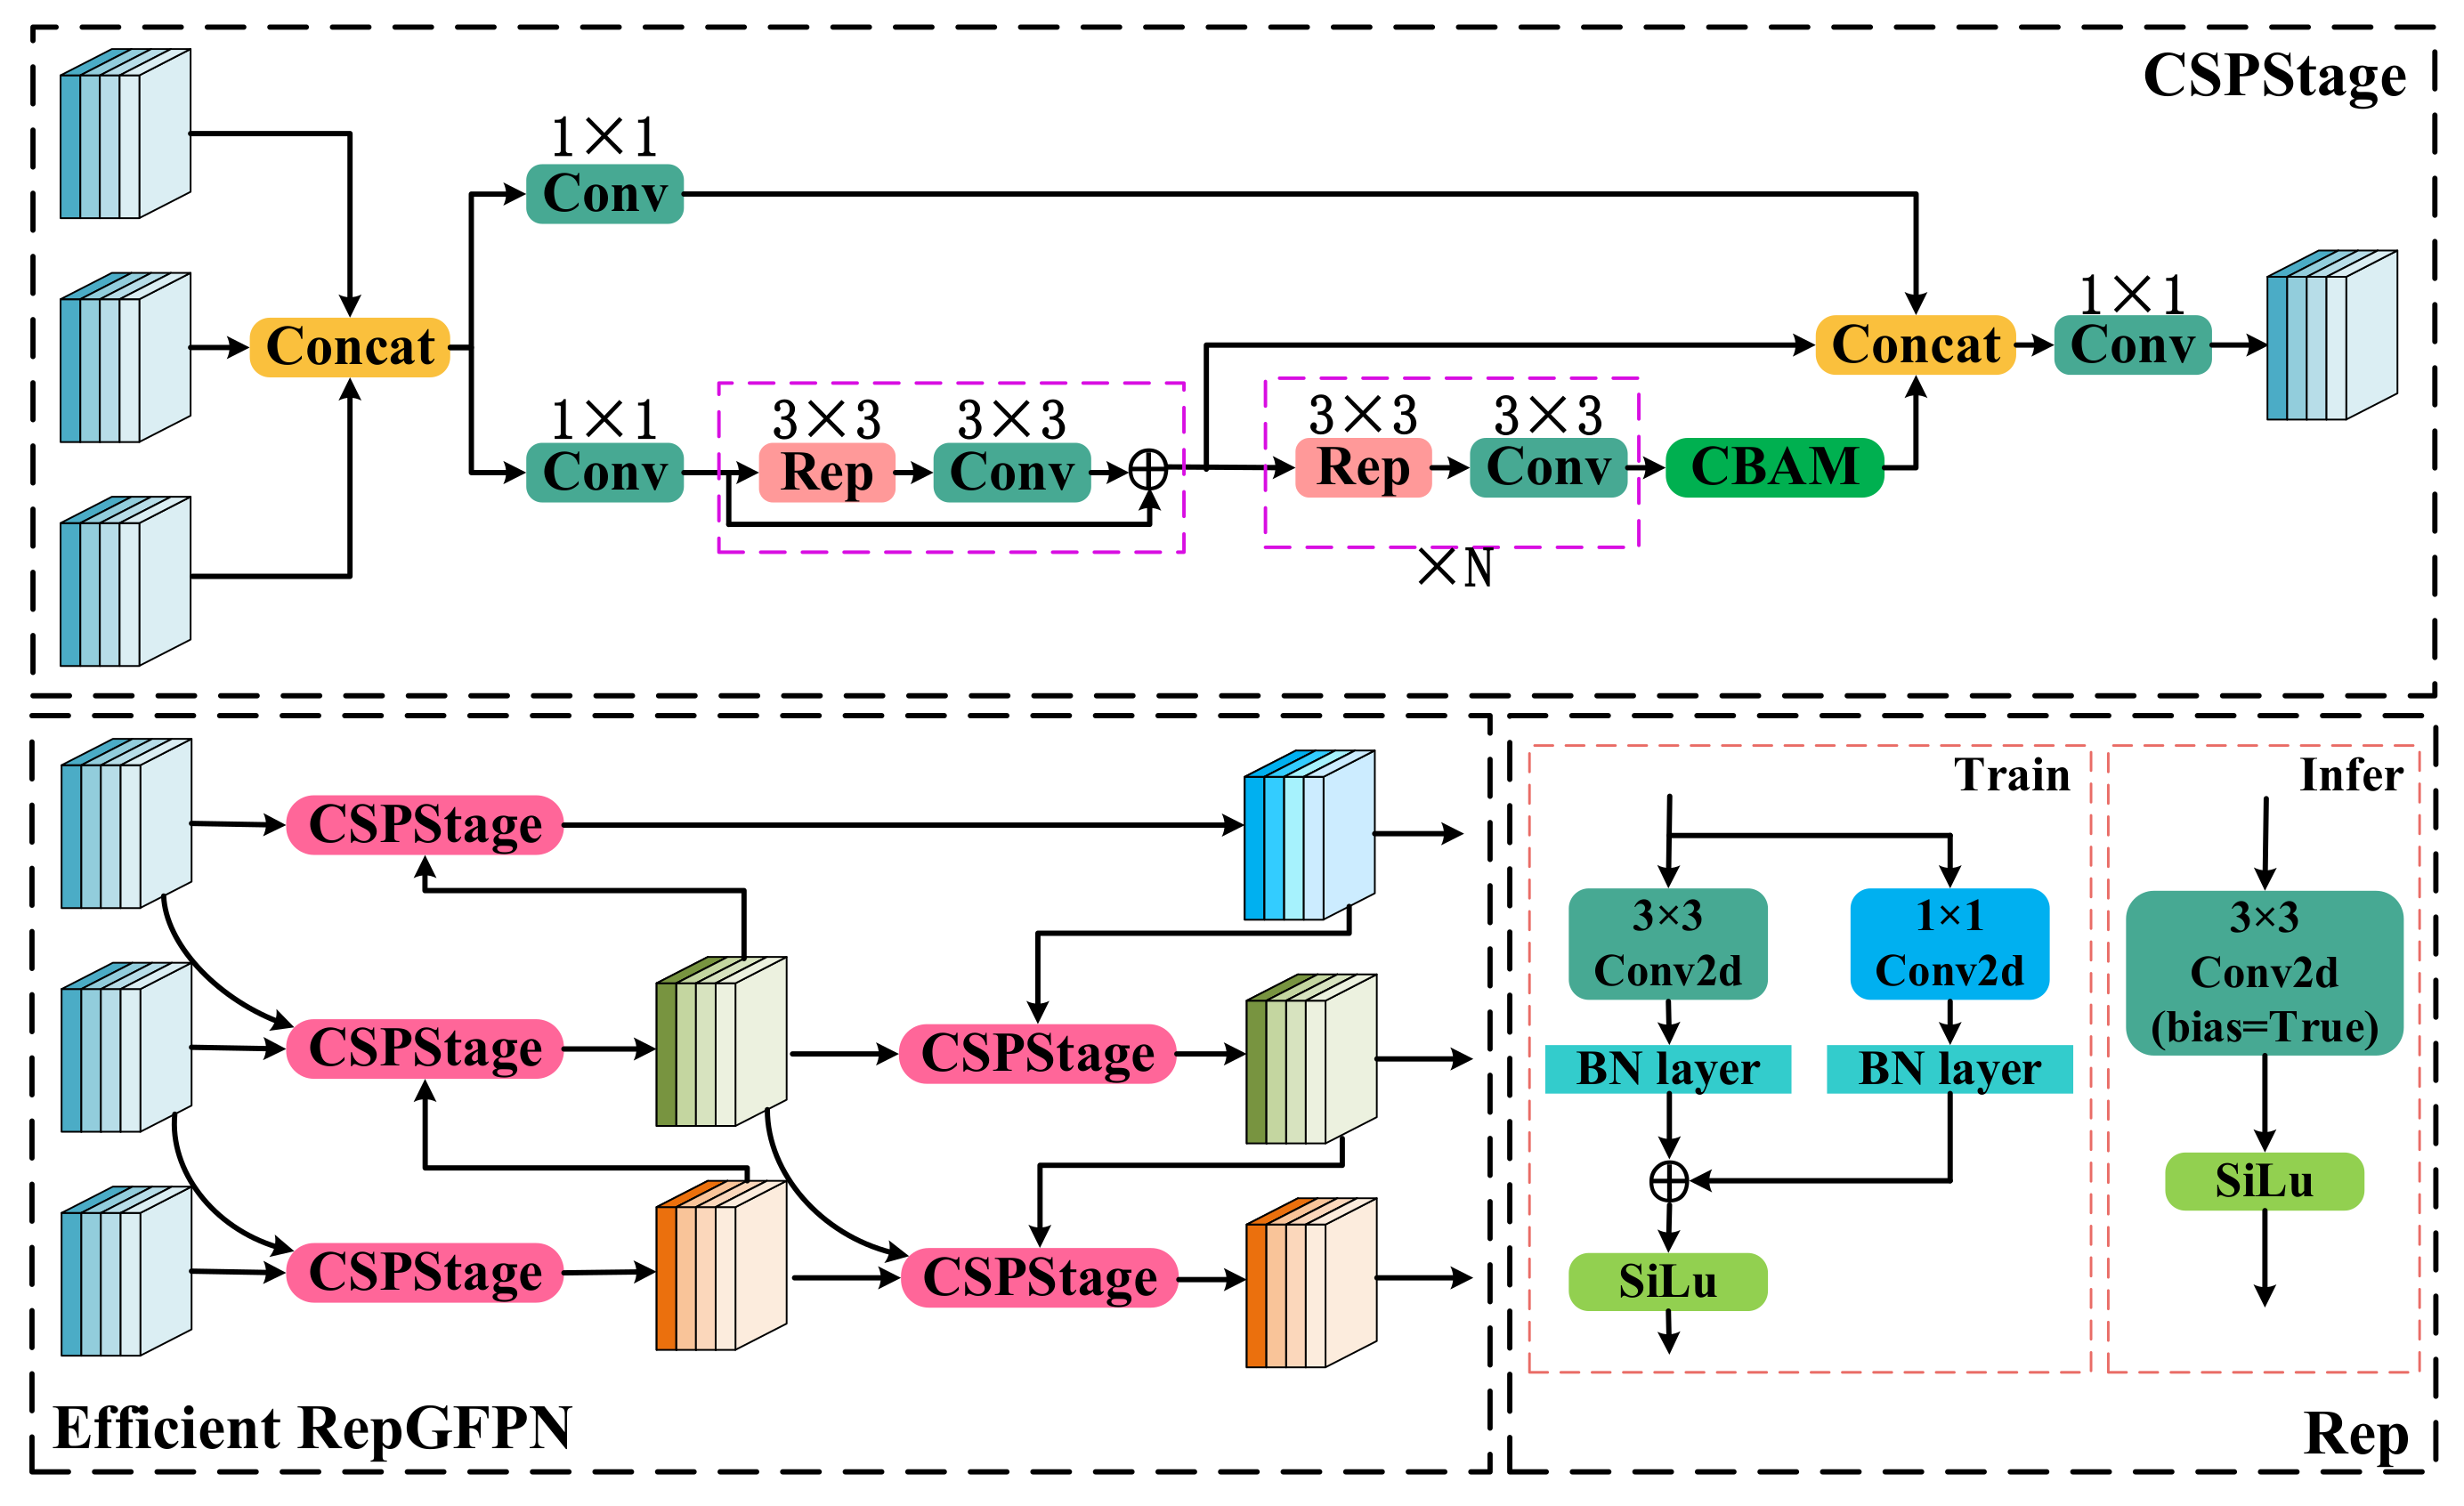
The core idea is to introduce a multi-scale feature pyramid. However, traditional feature pyramid structures, such as FPN and PAN, have issues such as high computational costs and inadequate information propagation. Therefore, an efficient feature pyramid called Reap-GFPN [
26] was introduced in this paper. Although Rep-GFPN addresses the issue of multi-scale features, it still has some limitations in terms of performance, including a high computational cost and large memory consumption.
First, this network model replaces the ConvBNAct and ConvWrapper operators with convolution (Conv) layers and Cross Stage Partial Network (CSPStage) to simplify the model structure, improve the training speed, and reduce the model complexity. Furthermore, the complexity of the model is reduced and the training speed is improved by replacing BepC3 with a lightweight convolution layer called C3. Finally, a hybrid attention mechanism called the Convolutional Block Attention Module (CBAM) [
27] was introduced into the neck network of the Rep-GFPN to enhance attention towards important features and suppress the extraction of unimportant features. This improvement not only improves the accuracy and robustness of the model but also reduces the computational cost and memory consumption, and its network architecture is shown in
Figure 3.
According to the network architecture diagram, it can be seen that in the feature fusion module, this paper first utilizes the improved CSPStage [
28] for convolutional fusion. Then, it proceeds with structural reparameterization—specifically, the fusion of Conv2d and BN. Therefore, the expression of BN in the channel
i of the feature map is as follows.
where μ denotes the mean, σ
2 denotes the variance, γ denotes the weights, β denotes the bias, and
ε is a very small constant used to prevent the denominator in the formula from being zero.
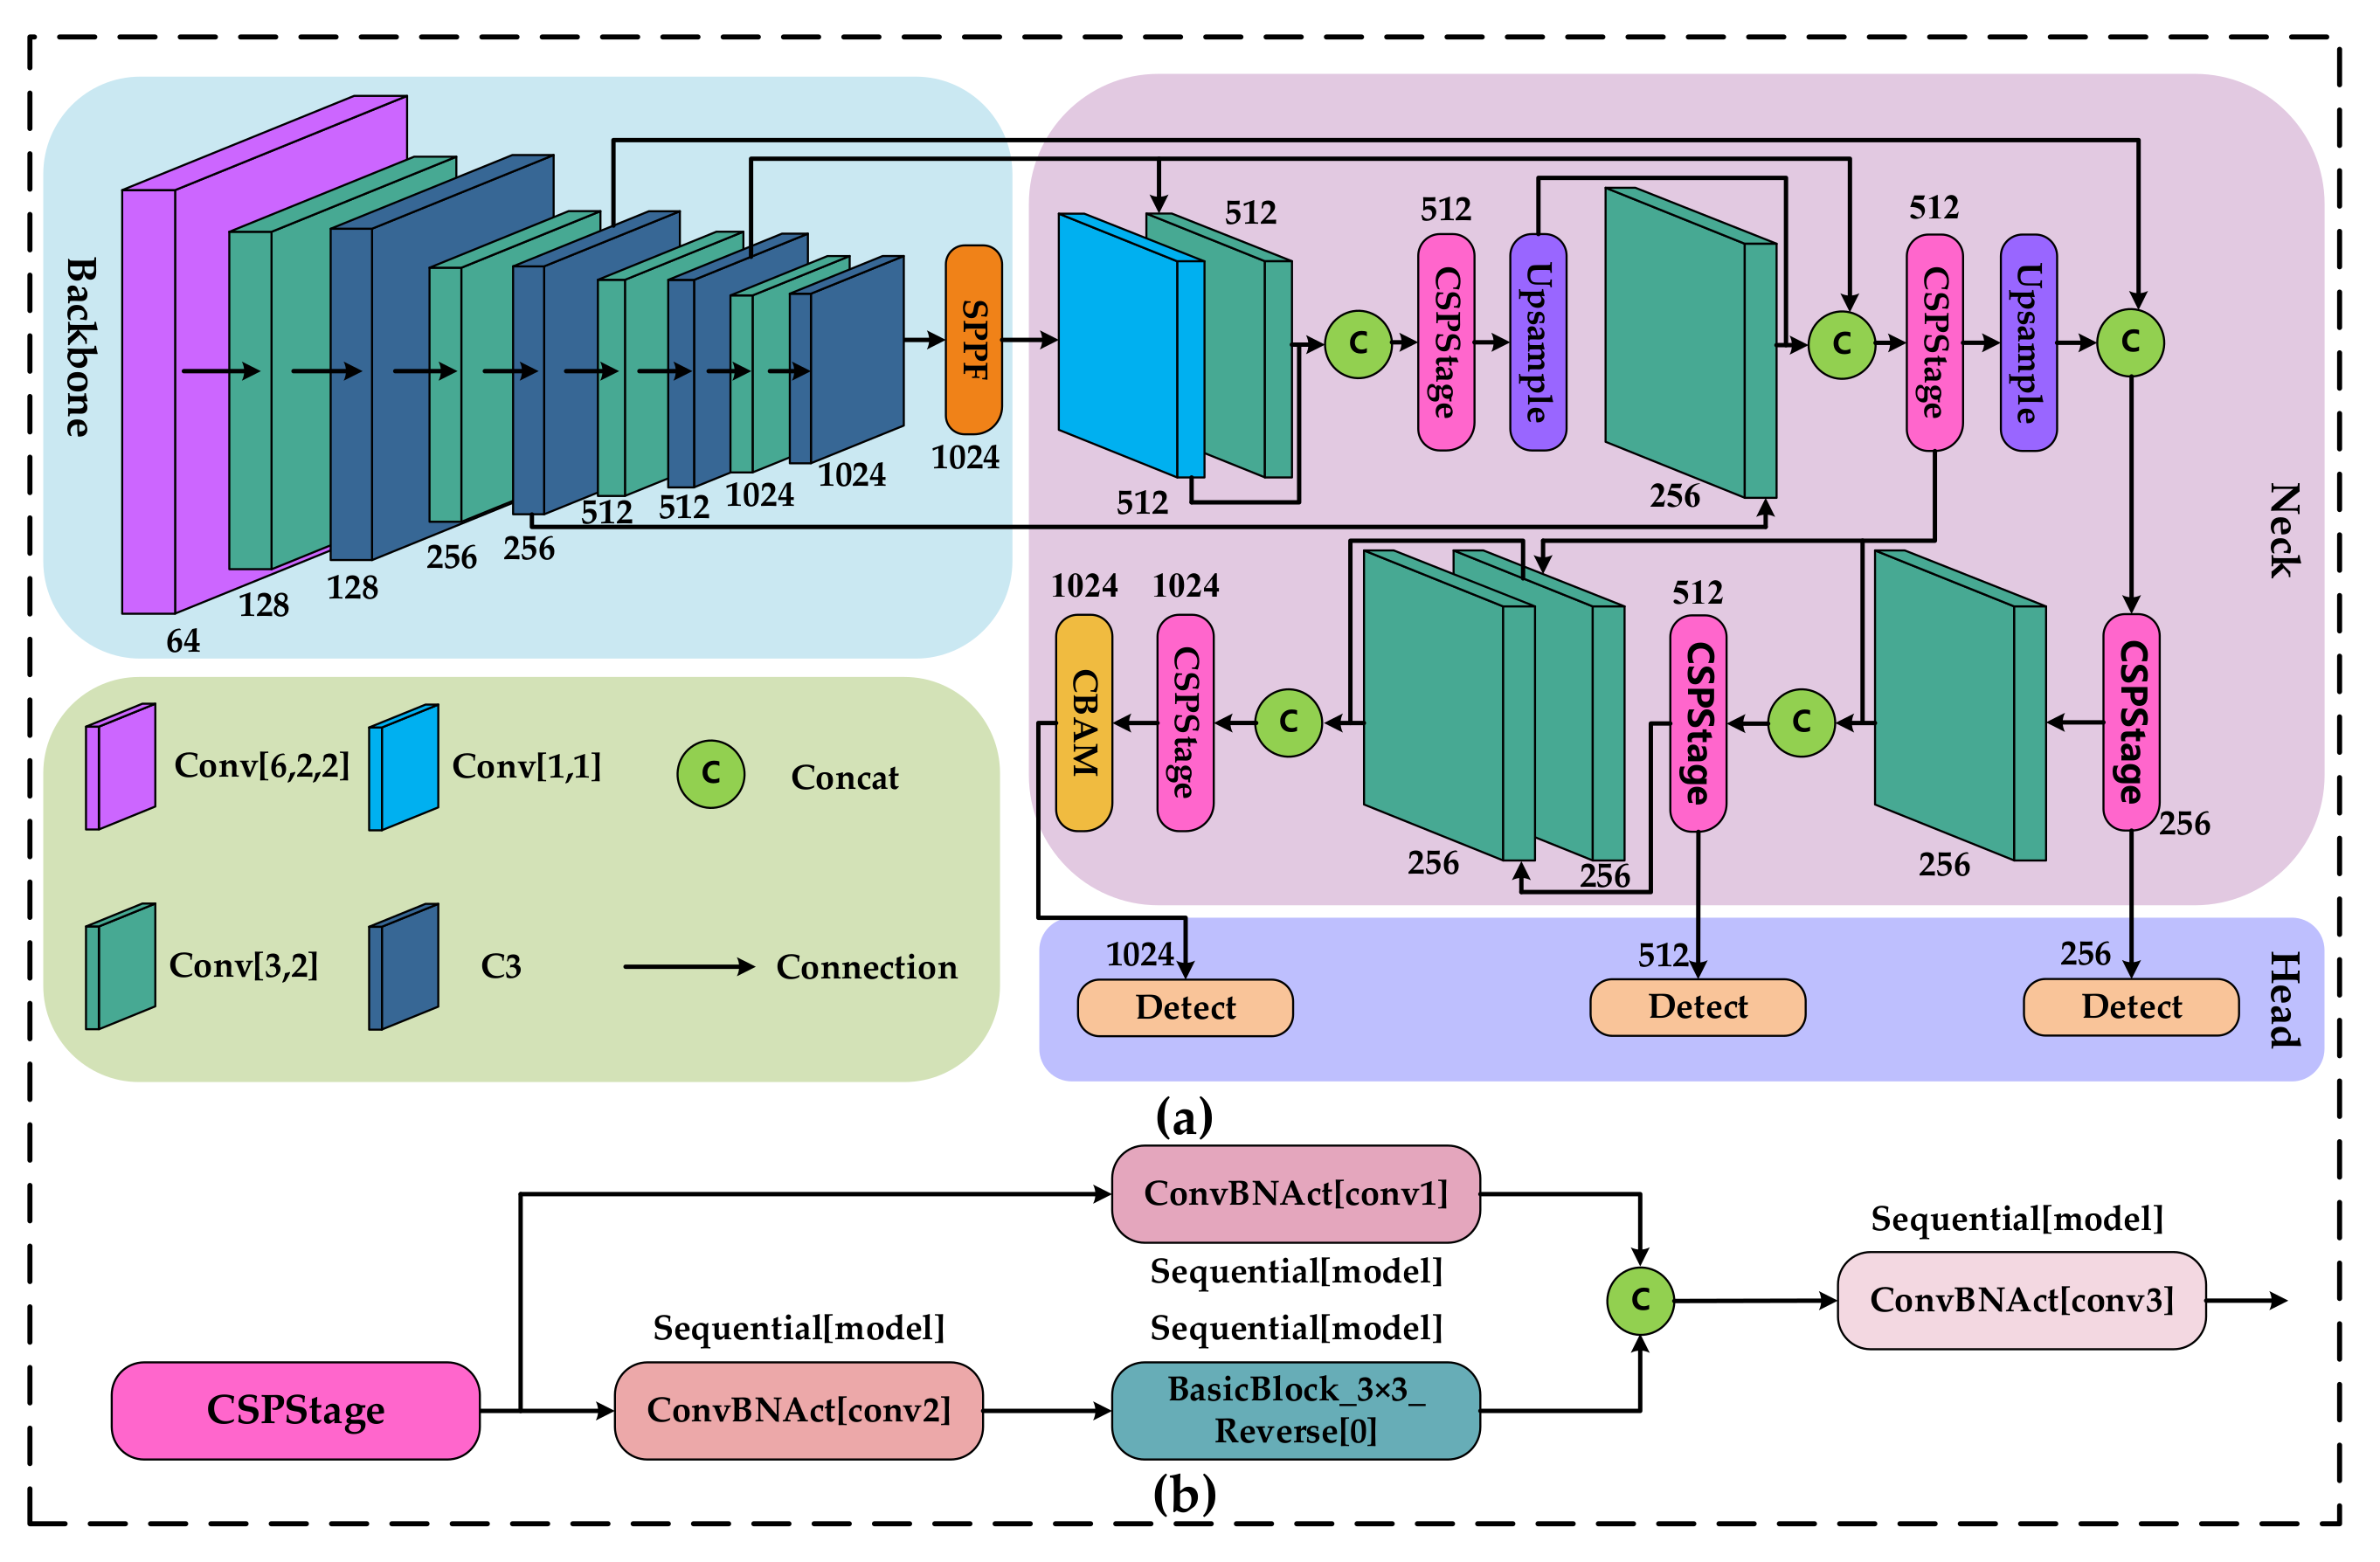
2.4. Target Detection Network
Since pole-shaped obstacle detection systems for assisted driving require a certain level of accuracy and real-time performance, therefore, the improved MFMAM-YOLOv5s algorithm is used to train the model and perform target detection. The network structure of this algorithm is shown in
Figure 4.
2.5. Binocular Camera Calibration
In this paper, the Zhang Zheng You calibration method [
29] was chosen for binocular camera calibration. A total of 27 sets of images were collected, and the MATLAB calibration toolbox was used to extract the internal and external parameters of the camera, as well as the distortion coefficients. These calibration parameters were then utilized to perform stereo calibration on the collected left and right images. The results of the binocular camera calibration are presented in
Table 1.
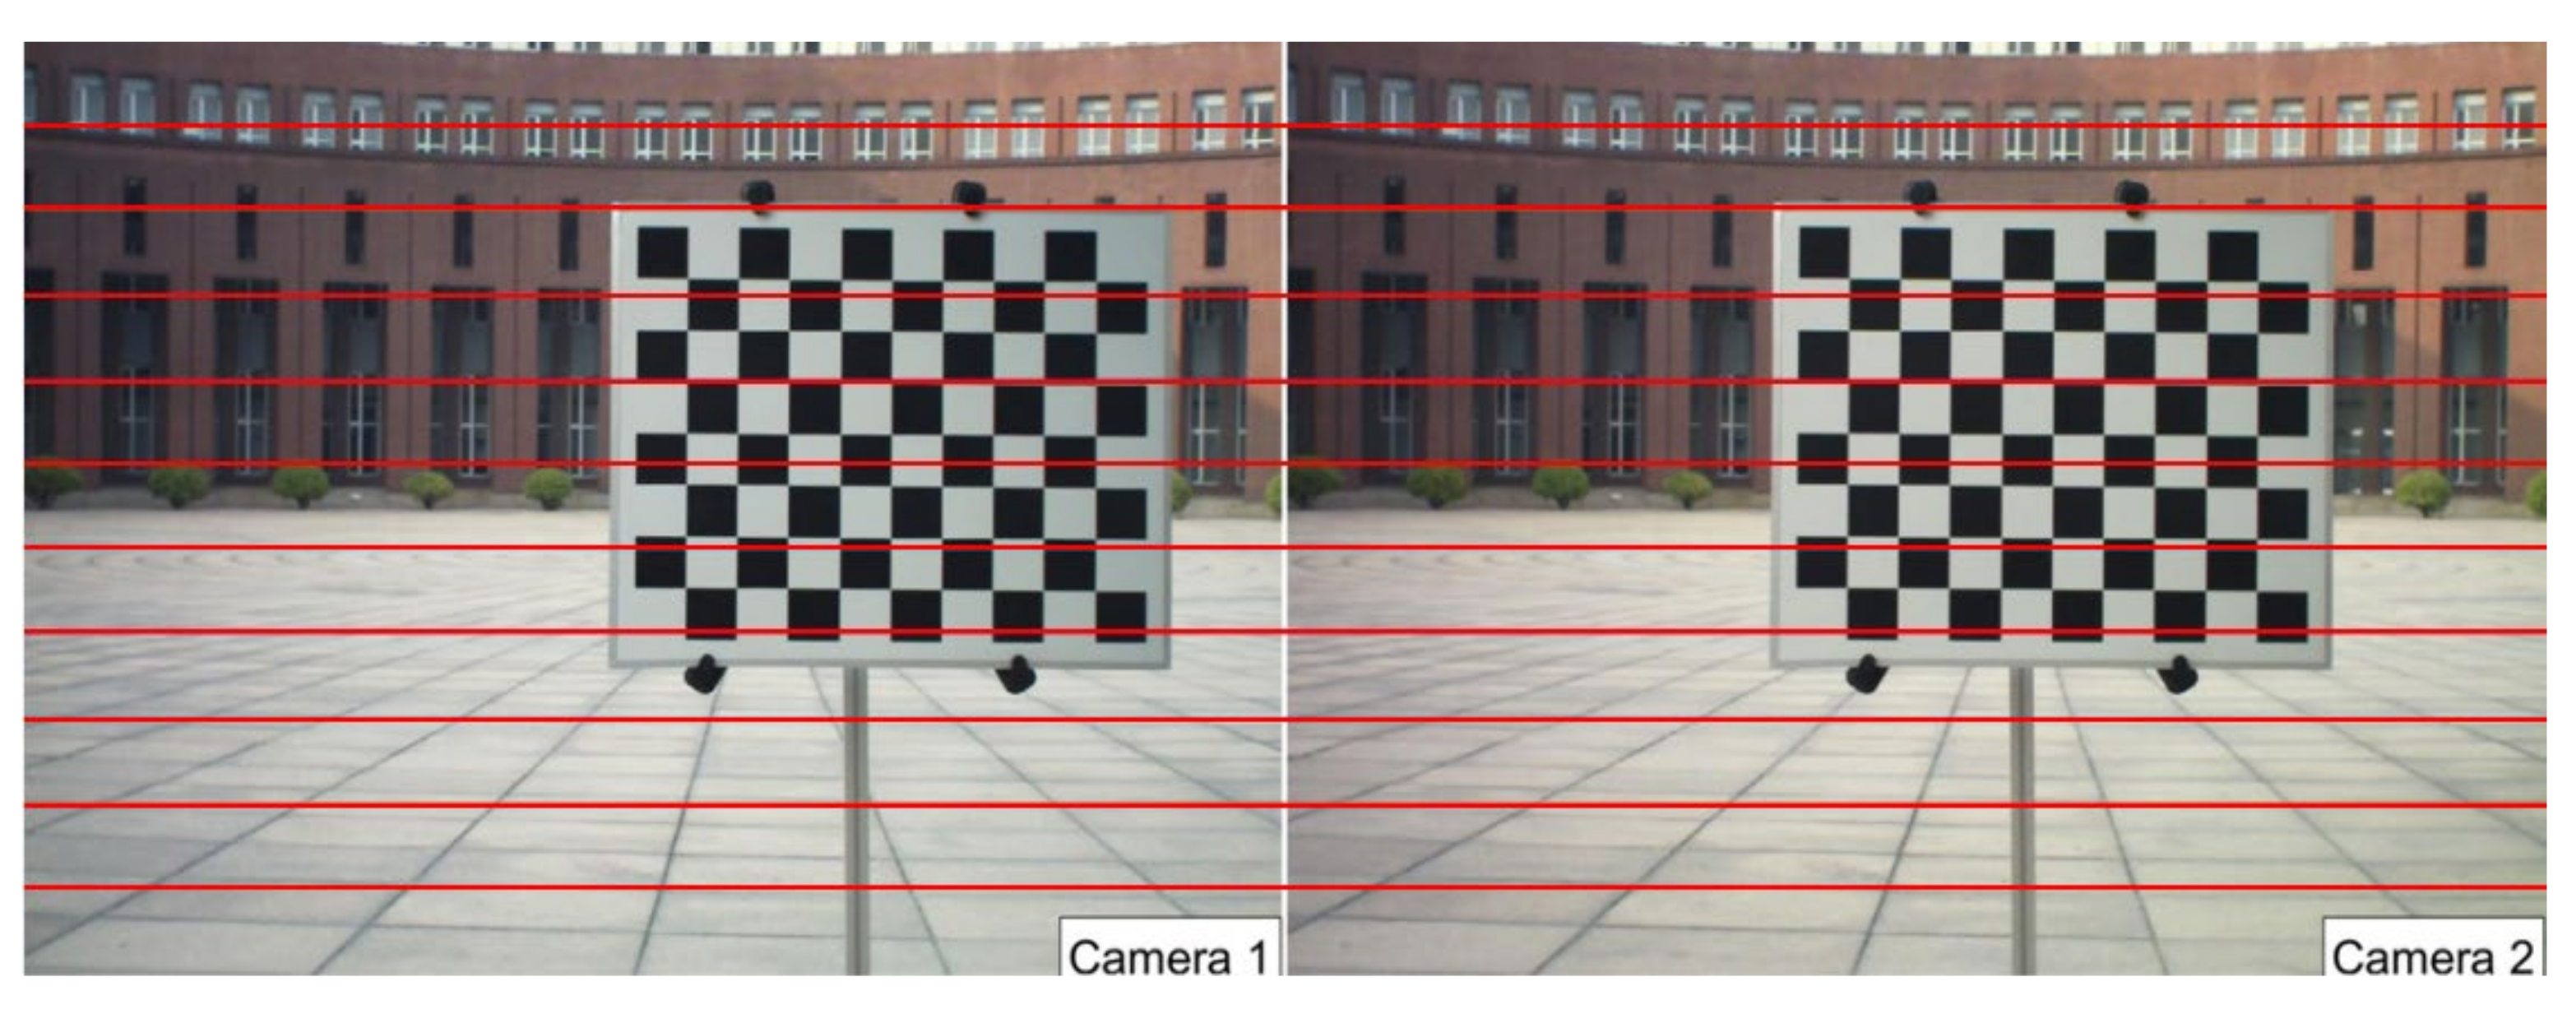
2.6. Stereo Correction
Stereo correction [
30] utilizes the internal and external parameters of binocular calibration, as well as the binocular relative position relationship, to eliminate aberrations and align the lines for the left and right views, respectively. In this paper, the Bouguet correction method [
31] is used to minimize the number of re-projections for each of the left and right images, and the corrected image is shown in
Figure 5.
2.7. Stereo Matching
Stereo-matching technology [
32] is the most critical research topic in binocular ranging systems, and the accuracy of image matching directly affects the accuracy of subsequent binocular ranging. However, the stereo-matching process has some limitations and sources of error, such as disparity range limitation, illumination variation, and mismatching factors. These factors can lead to errors or inaccuracies in binocular stereo matching. To reduce these errors, this study first adopts object detection. Then, it associates the feature information obtained from object detection with binocular stereo matching, enriching the features and coordinate information. This enhances the accuracy of binocular ranging and reduces errors. Nevertheless, there are numerous existing stereo-matching algorithms. To meet the requirements of accurate and fast stereo matching in complex scenes, this study selects the Semi-Global Block Matching algorithm (SGBM) [
33] as the matching algorithm for bar-shaped obstacle features. At the same time, the SGBM stereo matching algorithm not only has high real-time performance and measurement accuracy but also possesses an efficient execution capability.
4. Analysis of Results
4.1. Model Training
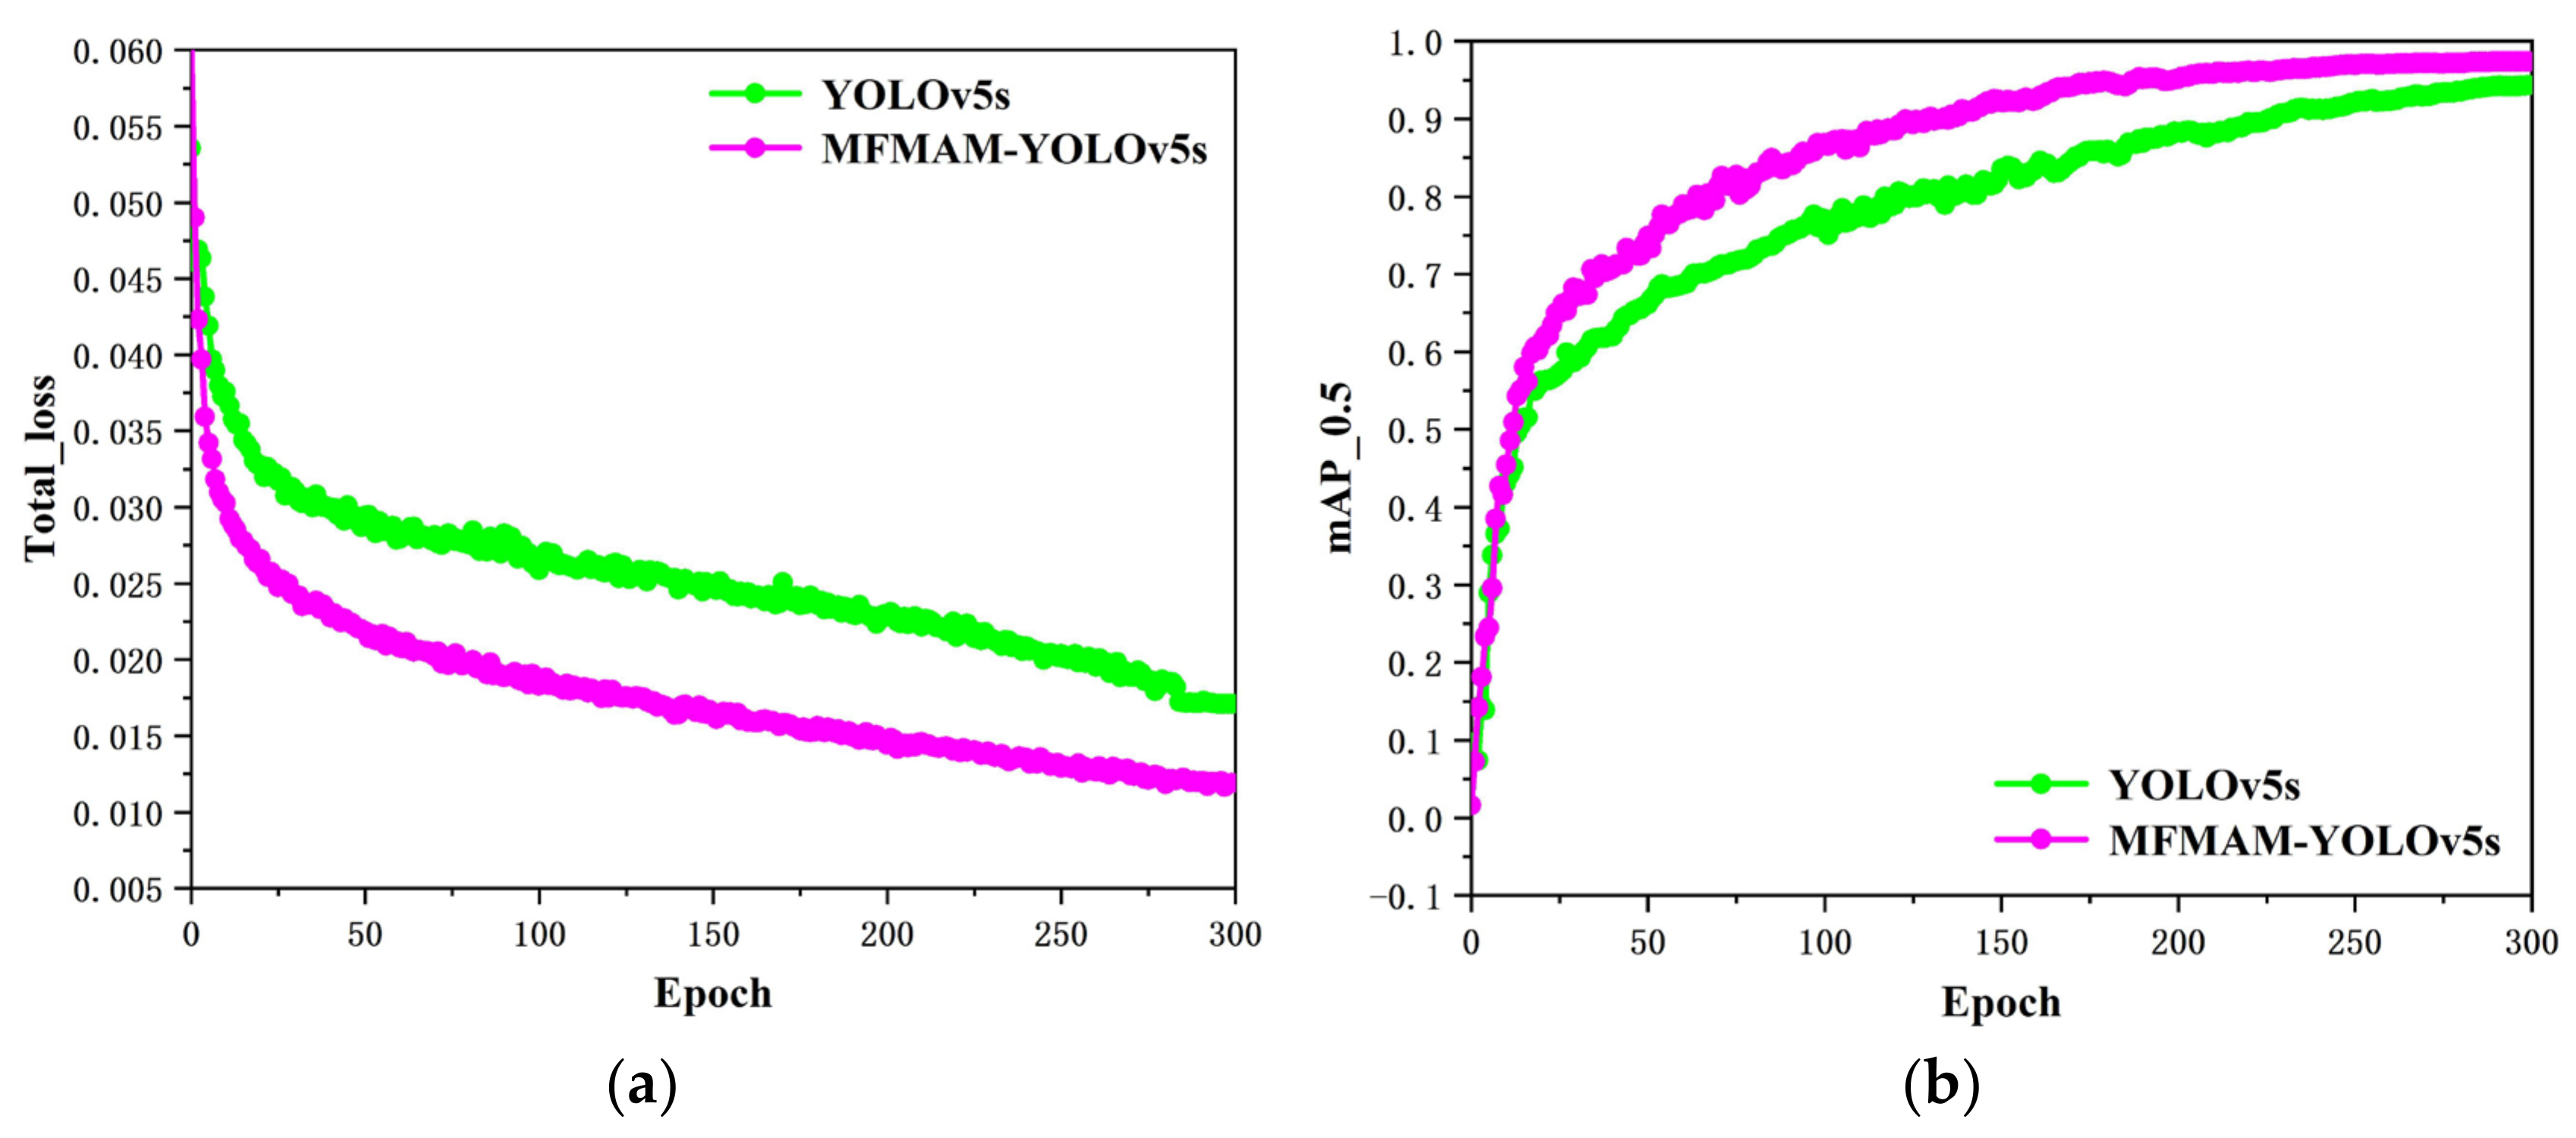
In this paper, the original YOLOv5s algorithm and the MFMAM-YOLOv5s algorithm proposed in this paper are trained on the home-made PSO 2023 dataset, respectively, and the loss convergence curves and mAP curves during the training period are shown in
Figure 8. The loss convergence curves of the two algorithms are compared in
Figure 8a, and the loss convergence curves of the two algorithms are compared at mAP_0.5 in
Figure 8b.
From
Figure 8a, it can be observed that both YOLOv5s and MFMAM-YOLOv5s have the highest convergence rate within 25 epochs. However, the algorithm model proposed in this paper demonstrates a faster rate of descent and convergence of the loss curve compared to the original YOLOv5s network model. Additionally, as shown in
Figure 8b, both algorithm models demonstrate a similar upward trend in the first 20 epochs and stabilize around 290 epochs without any further increase. However, after 20 epochs, the mean average precision curve of the MFMAM-YOLOv5s algorithm model shows a significantly faster increase compared to the YOLOv5s algorithm model. In other words, the MFMAM-YOLOv5s algorithm model has a higher overall mAP value compared to the YOLOv5s algorithm model.
4.2. Comparison of Different Attention Mechanisms
To mitigate the interference caused by complex backgrounds and enhance the ability to focus on important features, this paper presents a hybrid attention mechanism that integrates channel attention and spatial attention. The spatial attention mechanism primarily focuses on the spatial dimension in the input data. It suppresses complex background features and enhances important features by assigning different weights. The channel attention mechanism primarily focuses on the channel dimension in the data. It learns which channels are more important for the task, emphasizes important feature information, and reduces the impact of background noise and redundant features.
To further validate the effect of the channel attention mechanism and spatial attention mechanism on the model, in this paper, experiments are conducted on the self-made PSO 2023 dataset to test the current mainstream Global Attention Module (GAM), Efficient Channel Attention (ECA), Multidimensional Collaborative Attention (MCA), and CBAM attention mechanisms. The experimental results are shown in
Table 5.
From the experimental results in
Table 5, it can be observed that, compared to YOLOv5s without any attention mechanisms, the use of the GAM attention mechanism increased the mAP value by 0.8%. The model parameters and floating-point operations increased by 1.73 M and 1.2 G, respectively, while the model detection rate increased by 113.7 f·s
−1. Similarly, with the introduction of the ECA and MCA mechanisms, the mAP values increased by 0.7% and 1.3%, respectively. The model parameters and floating-point operations also increased, and the model detection rates were improved by 131.8 f·s
−1 and 136.4 f·s
−1, respectively. However, upon introducing the CBAM attention mechanism, the model parameters and floating-point operations only increased by 0.51 M and 0.6 G, while the model detection rate improved to 454.5 f·s
−1, and the mAP value also increased by 1.9%. Hence, the CBAM hybrid attention mechanism demonstrates better performance in detecting pole-shaped obstacles in complex environments.
4.3. Ablation Experiment
To verify the effectiveness of the proposed multiscale feature hybrid attention algorithm, this experiment was conducted on the homemade PSO 2023 dataset for ablation experiments of the MFMAM-YOLOv5s algorithm. The experimental results are shown in
Table 6.
From the above experimental results, it is evident that utilizing the enhanced loss function results in enhancements in both the mAP value and the image detection rate when compared to the original model. Meanwhile, the size of the model has also been reduced. The main reason for this is that the improved loss function incorporates an optimal matching method. This method addresses the issue of the overlapping and mismatching of multiple bounding boxes in the original model. As a result, it significantly accelerates the matching process of predicted boxes and reduces the model size, making it more lightweight.
However, after solving the problem of optimal matching boxes, this paper introduces a hybrid attention mechanism to further improve the detection accuracy. This attention mechanism not only suppresses interference caused by complex environments and enhances the extraction of important features by allocating different weights spatially but also learns which channels are more important for the task. It focuses on important feature information, reduces background noise, and eliminates redundant features in the channel dimension. Through ablation experiments, it has further been proven that the incorporation of a hybrid attention mechanism allows the model to concentrate on significant features in both channels and mitigate the interference from intricate backgrounds in both channels.
To address the issue of multi-scale features, this paper introduces a multi-scale feature pyramid module. However, the original feature pyramid GFPN, due to its complex convolutions, increases the computational complexity and slows down the training and inference speed. Therefore, this paper utilizes an enhanced multi-scale feature pyramid known as Rep-GFPN. To evaluate the performance of the original GFPN and the enhanced Rep-GFPN, we conducted ablation experiments. From
Table 6, it can be observed that the improved feature pyramid outperforms the original GFPN in terms of detection accuracy and speed. In summary, when compared to the YOLOv5s model, the enhanced model demonstrates a 3.1% increase in the mAP value and a 97 f·s
−1 improvement in the detection speed. Although the model size has increased, the algorithm’s overall performance is the best, fully meeting the detection requirements of ADAS systems.
4.4. Comparative Experiments of Different Algorithms
In order to assess the impact of algorithm enhancements, this paper conducted experimental verification on the self-made dataset PSO 2023 using the object detection algorithms YOLOv4, YOLOv4-tiny, Faster-RCNN, YOLOv5, YOLOv7, and YOLOv8. The experimental results are shown in
Table 7.
It is evident from the table that the two-stage object detection algorithm, Faster-RCNN, did not achieve higher accuracy despite using the Resnet50 backbone network. Instead, it resulted in a slower detection frame rate. YOLOv4-tiny and YOLOv5, commonly used lightweight algorithms, may have certain advantages in model deployment. However, they are not sufficiently outstanding in terms of detection accuracy and real-time performance for pole-shaped obstacles in complex environments. As a result, they struggle to meet the requirements of assisted driving perception technology. Although the YOLOv7 and YOLOv8 algorithms have a relatively good detection accuracy, the YOLOv7 model is larger and is not the optimal choice for deploying a perception system. Although the YOLOv8s model has a high detection accuracy, the image detection rate is not high. For an object detection system, it is necessary to ensure both accurate and speedy detection. Therefore, the method proposed in this article improves the mean Average Precision (mAP) to varying degrees in MFMAM-YOLOv5s, MFMAM-YOLOv5m, MFMAM-YOLOv5l, and MFMAM-YOLOv5x. In particular, MFMAM-YOLOv5s has significantly improved frames per second (FPS) and mean average precision (mAP) values compared to YOLOv5s and YOLOv7. Compared to the aforementioned models, the MFMAM-YOLOv5s model has a better balance between speed and accuracy, making it more suitable for deployment in assisted driving systems.
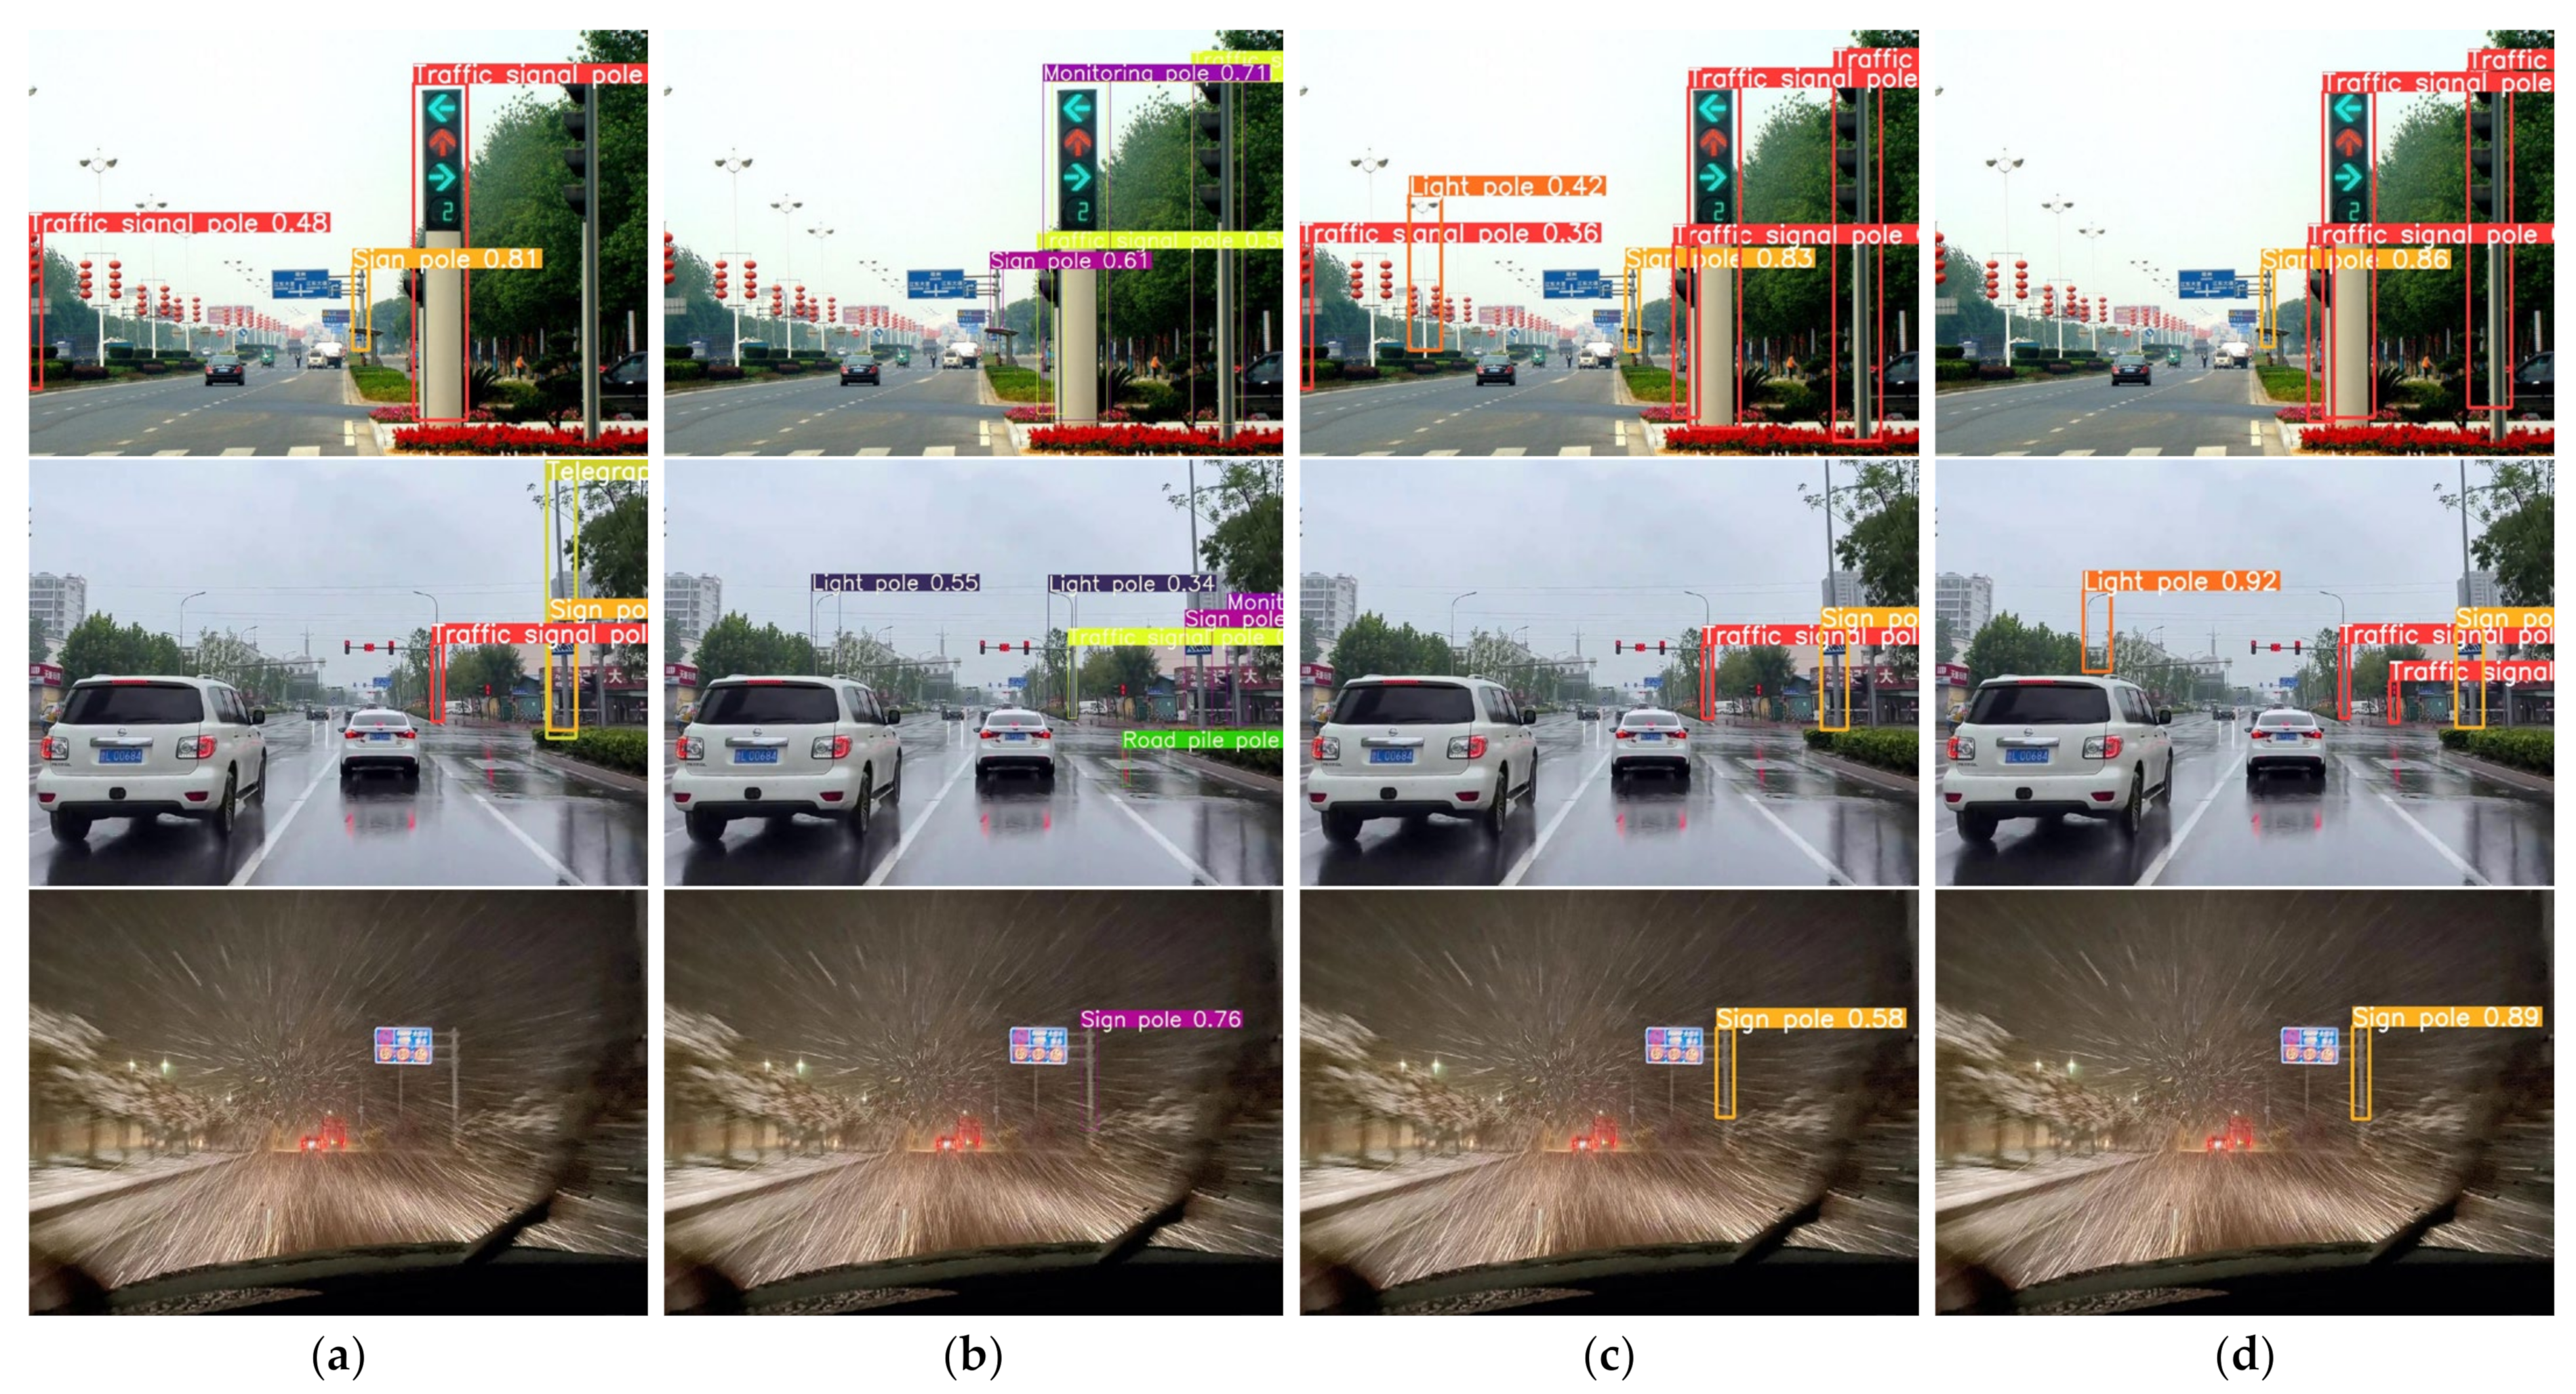
To visually evaluate the performance of the improved algorithm in terms of detection accuracy and robustness, this article selected the test result images of the YOLOv5s, YOLOv7, YOLOv8s, and MFMAM-YOLOv5s algorithms on the test dataset. These images are shown in
Figure 9.
From the comparative effect chart shown in
Figure 9, it can be observed that the YOLOv5s network model exhibits a relatively high false detection rate and missed detection rate in environments with obstructions, rainy and snowy weather, and low visibility, although it is capable of detecting pole-like obstacles. The YOLOv7 and YOLOv8s network models also experience higher false detection and missed detection rates in complex environments with partial feature obstructions, as well as in rainy and snowy weather. However, compared to the aforementioned object detection algorithms, the improved MFMAM-YOLOv5s network model is still capable of accurately detecting pole-like obstacles in complex environments.
4.5. Binocular Camera Target Ranging
The detection of pole-shaped obstacles not only requires more accurate identification and classification but also requires a sufficient ranging accuracy within a certain range. Therefore, this paper first uses the improved network model to obtain the coordinate information of the target; then, the coordinate information of the target and the stereo matching in the binocular ranging algorithm are correlated to obtain a more accurate measurement distance through the calculation of multiple information.
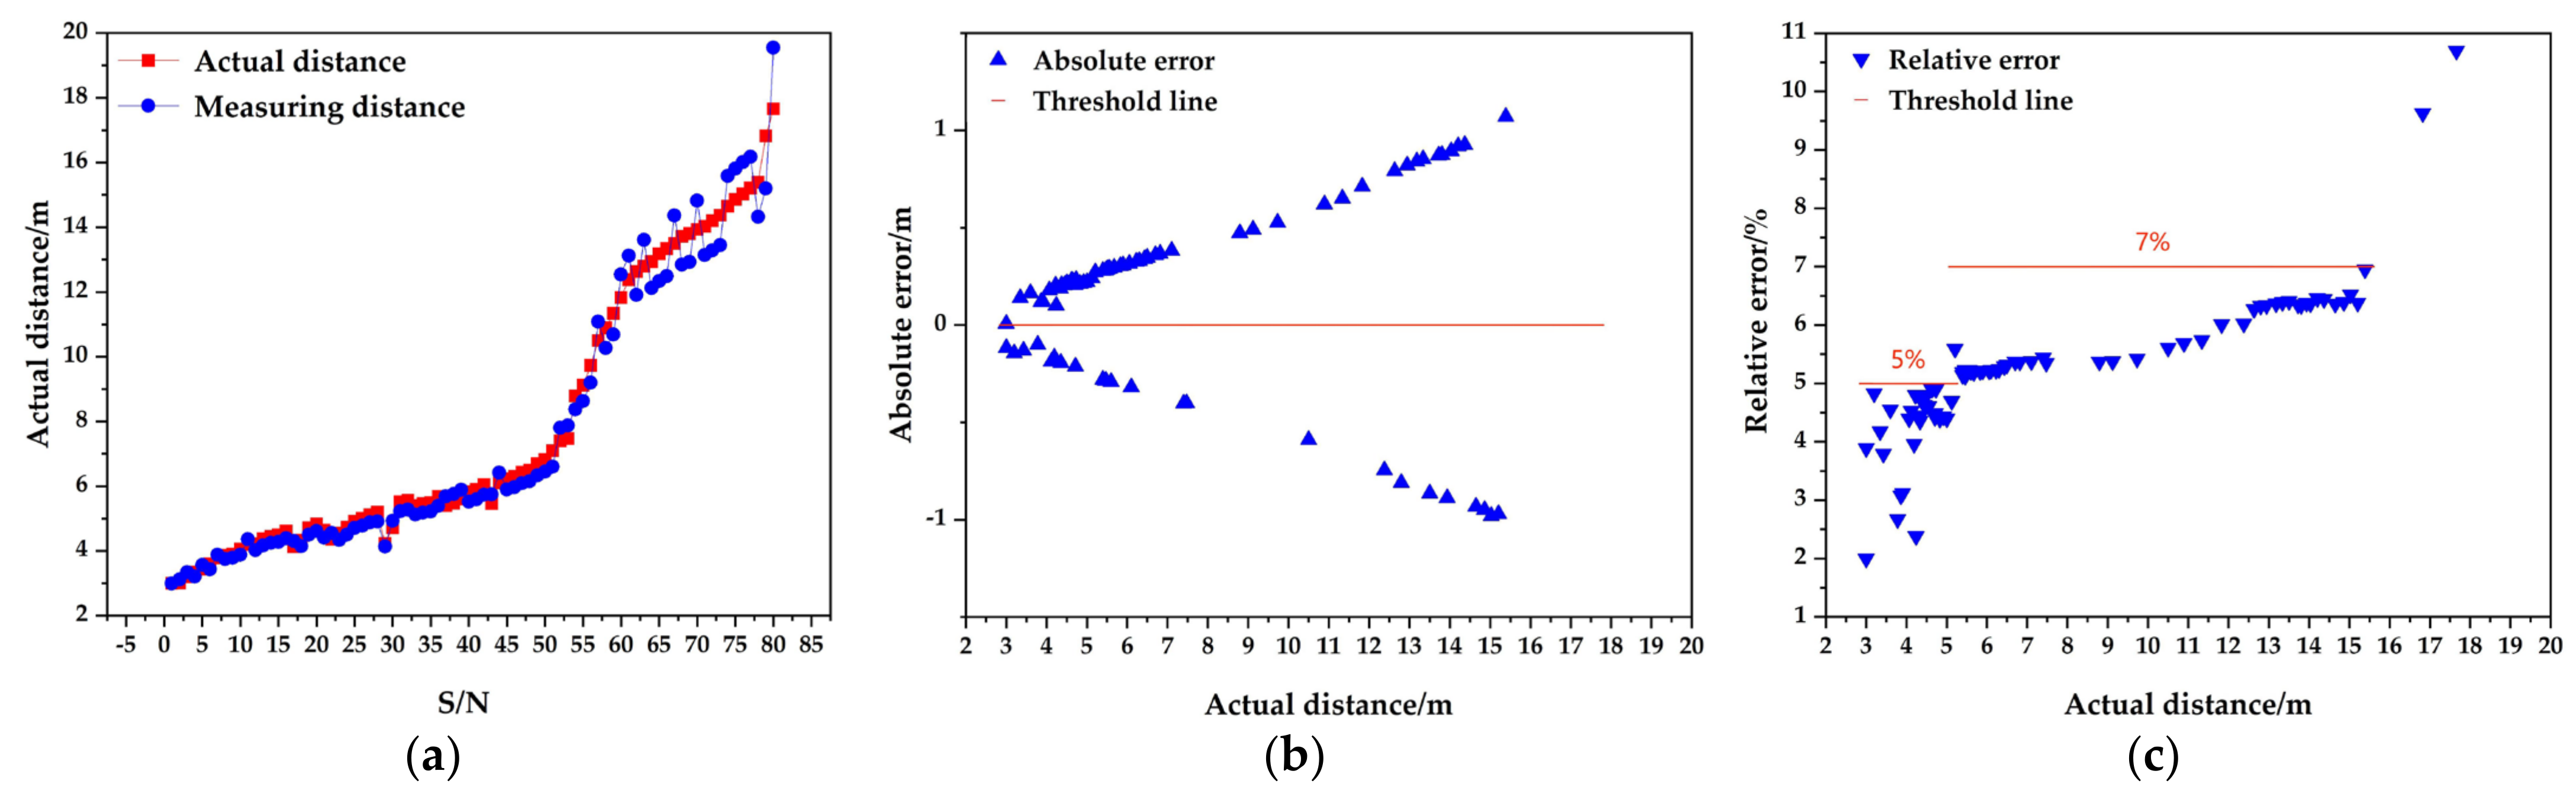
To further validate the accuracy and robustness of this method, real road test experiments were conducted. First, a section of an urban road is arbitrarily selected to detect road cones using the method in a complex environment; then, the center of light of the vehicle-mounted camera is taken as the origin, and a laser rangefinder is used to verify and read the real distance. At the same time, the error of the laser rangefinder is ±1.5 mm, which is in line with the measurement accuracy. Finally, the above experiments were repeated and recorded by constantly changing the distance. At the same time, to better demonstrate the error between the actual distance and the test distance, this paper compares and analyzes the actual distance, the test distance, the absolute error, and the relative error of the 80 groups of experimental results and draws a comparative statistical graph, as shown in
Figure 10.
From
Figure 10a, it can be observed that the output distance of the pole-shaped obstacle detection system fluctuates above and below the true distance. Meanwhile, as the distance increases, the fluctuation also increases. As for
Figure 10b, it shows the absolute error, which clearly increases with distance. In other words, the absolute error value is proportional to the distance. From
Figure 10c, it can be visually seen that the relative error within a range of 6 m is less than 5%. The relative error within a range of 3–15 m is less than 7%, which meets the accuracy requirements for distance measurement. In conclusion, as the distance increases, the measurement accuracy of the pole-shaped obstacles gradually decreases, but the overall detection accuracy fully meets the requirements.
The above experiments were all conducted on static straight roads. However, if the vehicle is traveling in a dynamic scene, it will have a certain impact on the de-detection accuracy and real-time performance. As the vehicle is moving rapidly, the feature information of the pole obstacle is also changing, such as the length, size, angle, etc. The limitation of binocular camera hardware and the vibration of the vehicle body will cause some difficulties in the feature extraction of rod-shaped obstacles. Therefore, to further validate the accuracy and robustness of the improved algorithm in dynamic situations, a section of the curve was directly selected for testing in this experiment. If the algorithm can accurately detect pole-shaped obstacles while the vehicle is making a turn, it would serve as a good validation for road detection in dynamic scenarios. According to the regulations of the Road Traffic Safety Law [
37], the maximum speed for vehicles to make a turn is 30 km/h. Therefore, this study conducted experiments using the maximum turning speed. In this paper, 10 turning tests were conducted with the maximum turning speed of 30 km/h throughout the experiment, and 20 sets of experimental data were obtained, as shown in
Table 8.
From the test experimental results in
Table 8, it can be observed that the detection accuracy of the objects is somewhat affected due to the rapid changes in target features during the turning process. However, as seen from the above test results, although the detection accuracy of pole-shaped obstacles is slightly reduced during turns, the overall detection performance still meets the requirements of object detection. Therefore, the fast-turning experiment further validates the effectiveness of detection on dynamic straight roads.
5. Conclusions
In this paper, the binocular camera is first stereo-calibrated, and the obtained internal and external parameters are stereo-corrected for the real-time acquired images, respectively. Subsequently, the targets in the acquired images are recognized and classified using the improved network model. Then, the coordinate information of the target frame was correlated with the stereo matching to obtain more accurate information about the kind and distance between the camera and the target. Finally, the accuracy and robustness of the target detection algorithm were verified through experiments, respectively. The experimental results show that the mAP_0.5 value of the proposed method is 97.4%, which is 3.1% higher than that of the original algorithm YOLOv5s, the detection rate is 97 f·s−1 higher than that of the original algorithm, and the ranging error of the pole obstacle in a complex environment is also less than 7%. The method not only recognizes the target quickly for classification but also accurately measures the distance between the camera and the target.


