
Lung Cancer Detection Model Using Deep Learning Technique

Department of Archives and Communication, Center of Documents and Administrative Communication, King Faisal University, P.O. Box 400, Hofuf 31982, Al-Ahsa, Saudi Arabia
Appl. Sci. 2023, 13(22), 12510; https://doi.org/10.3390/app132212510
Submission received: 30 October 2023
/
Revised: 16 November 2023
/
Accepted: 18 November 2023
/
Published: 20 November 2023
(This article belongs to the Special Issue Pattern Recognition in Biomedical Informatics)
Abstract
:Globally, lung cancer (LC) is the primary factor for the highest cancer-related mortality rate. Deep learning (DL)-based medical image analysis plays a crucial role in LC detection and diagnosis. It can identify early signs of LC using positron emission tomography (PET) and computed tomography (CT) images. However, the existing DL-based LC detection models demand substantial computational resources. Healthcare centers face challenges in handling the complexities in the model implementation. Therefore, the author aimed to build a DL-based LC detection model using PET/CT images. Effective image preprocessing and augmentation techniques were followed to overcome the noises and artifacts. A convolutional neural network (CNN) model was constructed using the DenseNet-121 model for feature extraction. The author applied deep autoencoders to minimize the feature dimensionality. The MobileNet V3-Small model was used to identify the types of LC using the features. The author applied quantization-aware training and early stopping strategies to improve the proposed LC detection accuracy with less computational power. In addition, the Adam optimization (AO) algorithm was used to fine-tune the hyper-parameters in order to reduce the training time for detecting the LC type. The Lung-PET-CT-Dx dataset was used for performance evaluation. The experimental outcome highlighted that the proposed model obtained an accuracy of 98.6 and a Cohen’s Kappa value of 95.8 with fewer parameters. The proposed model can be implemented in real-time to support radiologists and physicians in detecting LC in the earlier stages. In the future, liquid neural networks and ensemble learning techniques will be used to enhance the performance of the proposed LC detection model.
1. Introduction
LC is a malignancy originating from the lung cells, especially within the epithelial lining of the bronchi, bronchioles, or alveoli [1,2]. It is prevalent and associated with high mortality rates on a global scale. In its earliest stages, LC exhibits no symptoms or presents with moderate manifestations [2]. As a result, it is typically diagnosed in an advanced stage. The delayed identification of a medical condition affects the efficacy of treatment and diminishes the likelihood of achieving long-term survival [3]. The two common types of LC are non-small cell lung cancer (NSCLC) and small cell lung cancer (SCLC) [4]. NSCLC is commonly classified into two subtypes: lung squamous cell carcinoma (LUSC) and lung adenocarcinoma (LUAD) [4]. The fine-grained categorization of LC, including LUSC, LUAD, and SCLC, has a significant role in determining the prognosis of LC compared to benign and malignant classifications. The precise classification of LC at the primary diagnostic stage significantly improves therapy efficacy and subsequently increases patients’ survival rate [5]. PET and CT are extensively employed as non-invasive diagnostic imaging modalities in clinical practice, serving as valuable tools for assessing the specific diagnosis of LC [6].
The early detection and treatment of LC through effective screening methods are vital in enhancing patient outcomes. Based on the National Lung Screening Trial findings, low-dose helical CT screening is more effective in reducing mortality among high-risk populations [7]. Nevertheless, the screening process for LC is susceptible to yielding false positive (FP) results, leading to increased costs due to unwarranted medical interventions and may induce psychological distress in individuals [8]. Computer-aided diagnosis has notable advantages in LC detection, including enhanced scope in early cancer screening and a diminished occurrence of FP results throughout the diagnostic process [9].
In the realm of LC detection, there have been notable developments in the form of novel approaches and technologies for enhancing early diagnosis and treatment efficacy [10]. Liquid biopsies are used to examine blood samples for detecting cancers [11]. These diagnostic tests can identify genetic abnormalities and modifications associated with LC. Consequently, these tests offer a non-invasive approach to diagnosing the disease and monitoring the effectiveness of treatment. Low-dose computed tomography (LDCT) screening has emerged as a widely applied method for the timely identification of LC [12]. LDCT scans employ reduced radiation levels compared to conventional CT scans while delivering high-resolution images of the pulmonary region. Novel bronchoscopic methodologies, including electromagnetic navigation bronchoscopy and robotic-assisted bronchoscopy, facilitate the performance of minimally invasive lung lesion biopsies. These tools promote the prompt and precise identification of medical conditions. Integrating genomes, proteomics, and metabolomics has enabled the development of diverse strategies for identifying LC [13]. These methodologies employ several molecular markers to enhance diagnostic precision and discover possible targets for therapeutic intervention.
DL-based LC screening techniques can reduce mortality by detecting the disease in the primary stage [14]. It can aid in lowering false negatives (FN) by detecting subtle or early indicators of LC that humans may leave unnoticed [15]. Imaging modalities including CT, magnetic resonance imaging (MRI), and PET can be integrated using DL algorithms to understand the disease and assist in diagnosis and therapy planning. Cancer staging is directly related to the extent of disease metastasis [15]. A combination of imaging modalities and biopsies of suspicious tissue identifies cancer types. Cancer staging assists caregivers in selecting chemotherapy, immunotherapy, radiation, and surgical strategies [16]. In particular, the higher cancer stage increases the mortality rate. The effectiveness of medical therapies is based on the cancer stages. Providing more accurate and trustworthy diagnoses can help reduce misdiagnosis and unwarranted care. The process of LC screening produces substantial quantities of medical imaging data. DL models effectively analyze CT scans, chest radiography, and other imaging modalities due to their ability to analyze massive data [16,17,18]. Using DL models, physicians may gain insights into a patient’s state by combining data from several imaging modalities and other clinical data sources.
Due to privacy concerns and the cost of data acquisition, medical image datasets are typically small. Pre-trained models can apply broader image dataset expertise to medical images, enabling model training with minimal medical data [19]. These models can extract hierarchical information from images, including fine-grained details and crucial patterns. Feature extraction supports the medical image classification models to detect significant patterns, abnormalities, and disease indicators [20]. The process of training CNN models from scratch can pose significant computing costs and require a substantial amount of time. The deep transfer learning technique reduces training time and time spent fine-tuning the model for medical image classification [21].
LC diagnosis and classification rely heavily on PET/CT imaging. PET and CT images are combined in PET/CT-based LC detection models to understand lung lesions’ location, size, and metabolic activity. PET/CT scans are employed to monitor the efficacy of cancer treatment. The assessment of therapy success can be facilitated by tracking changes in metabolic activity and tumor growth over a period of time. Differentiating LC types and features with PET/CT imaging allows customized treatment. Bhandary et al. [20] developed a DL framework to detect LC using the CT images. Kanavati et al. [21] proposed a weekly-supervised learning-based model to identify lung carcinoma. Hallitschke et al. [22] built a multimodal LC lesion segmentation technique for annotating the images. They utilized the geodesic distance transformation technique and implemented an ellipsoid-based user simulation scheme. Ardila et al. [23] introduced an end-to-end LC screening model using LDCT images. Marentakis et al. [24] proposed an LC histology classification technique. Similarly, the studies [25,26,27,28,29,30,31,32,33] employed DL models for classifying the medical images to detect LC. Barbouchi et al. [34] introduced a deep neural network for LC classification. They obtained an accuracy of 97% in classifying the PET/CT images. El Hamdi et al. [35] proposed a VGG-16 network-based LC detection model. They generalized their model using the Lung-PET-CT-Dx dataset [36,37], which contains 251,135 PET/CT images. The model obtained an accuracy of 94% and an area under the receiver operating characteristic curve (AU-ROC) of 97%. Goswami and Singh [38] proposed a pulmonary LC classification model using a deep neural network. They applied accuracy, precision, recall, F1-score, and Cohen’s Kappa metrics for the performance evaluation. Liu et al. [39] discussed the role of deep reinforcement learning in finding LC using complex images.
In some healthcare settings, computing resources are inaccessible for training huge and complicated deep learning models for lung cancer diagnosis. To adapt DL-based solutions, healthcare centers demand high computational resources. DL algorithms may face challenges in generating an optimal outcome with limited datasets. The authors’ motivation for employing DL techniques for LC detection emerges from the potential to significantly transform early diagnosis, enhance patient care, contribute to scientific advancements, and generate substantial benefits for public health. Radiologist and physician effort may be reduced by automating LC detection using DL techniques. This automation can improve speed and consistency. Thus, the authors intend to build a cost-effective LC detection model using the DL technique. The study includes the following contributions:
- A DL model for extracting critical features from the PET/CT images;
- An LC detection model for identifying the type of LC with less computational resources;
- Performance evaluation of the proposed LC model using state-of-the-art techniques.
The proposed study is structured as follows: Section 2 offers the proposed methodology for classifying types of LC using PET/CT images. The experimental results are presented in Section 3. Section 4 describes the significance of the proposed LC detection model. The study’s contribution and limitations are presented in Section 5.
2. Materials and Methods
The quality of medical images can affect feature segmentation approaches. The presence of noise, artifacts, or low-resolution images can diminish the quality of feature extraction. Feature segmentation techniques typically depend on pre-established feature sets, which may not include all pertinent data for the identification of lung cancer [33]. Specific feature segmentation algorithms may demand high computational resources when working with large medical image datasets. These algorithms may restrict applications to operate with limited resources [34]. Different patient positions and imaging settings may negatively impact the accuracy of feature segmentation methods.
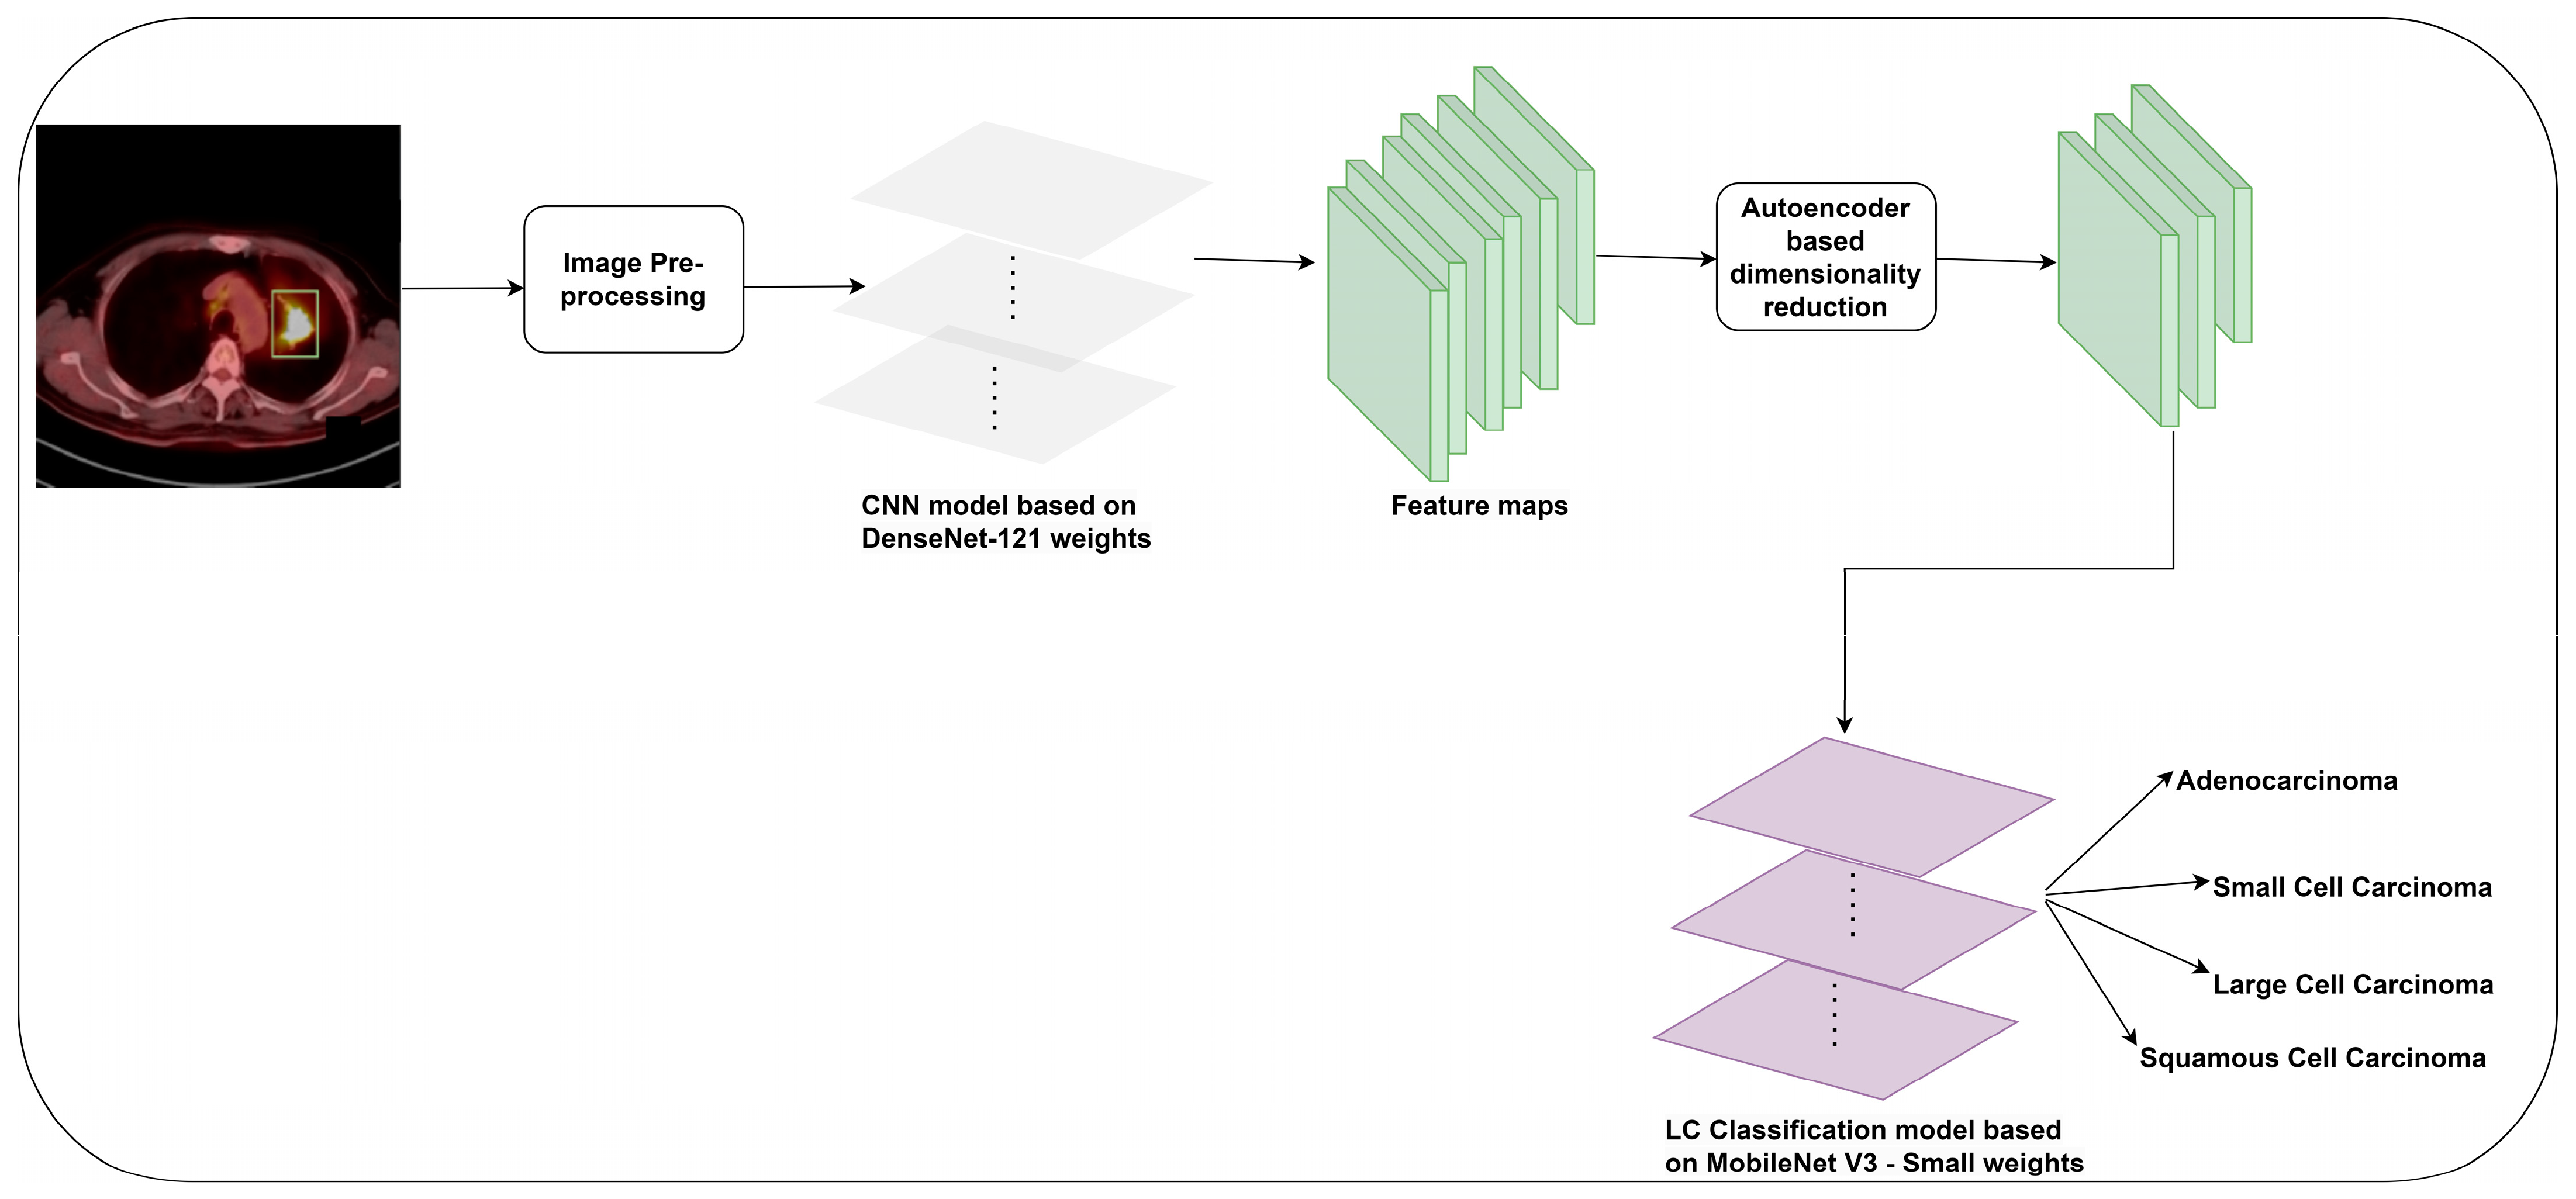
DenseNet-121 possesses a high degree of parameter efficiency. It operates with fewer parameters, leading to an LC detection model with fewer computational resources [40]. It can extract rich and diverse information from PET/CT images. A dense connection improves backpropagation gradient flow. Therefore, the vanishing gradient challenge can be resolved by allowing gradients to autonomously and swiftly relocate throughout the network. This approach facilitates the proper training of deeper networks and ensures the acquisition of characteristics at multiple levels of abstraction. However, multiple connections within the network may result in elevated memory consumption. This could constrain the maximum batch size during the training process. The MobileNet V3-Small design offers exceptional efficiency and suitability for mobile and embedded devices [41]. It can be used in real-time object identification and image classification applications. The model is comparatively compact in relation to numerous deep learning models. It can be deployed on devices that possess restricted storage capacity. However, the MobileNet V3-Small model may not learn more complex characteristics than larger DL models. The presence of complicated patterns in datasets can potentially restrict its performance. The depthwise separable convolution layers of the MobileNet V3-Small model make it difficult to train them from scratch on complex datasets. This motivates the user to implement the proposed LC detection model using the DenseNet-121 model for feature extraction and the MobileNet V3-Small model for the LC image classification. The author presents an LC detection model using the CNN models in this study. Initially, an image preprocessing technique is used to improve the visibility of PET/CT images. Subsequently, the author followed an image augmentation technique to increase the dataset size. The DenseNet-121 model is used for feature extraction. The author employed a dimensionality reduction technique to reduce the number of features. Finally, enhanced MobileNet V3-Small model weights are used for detecting LC. Figure 1 outlines the proposed methodology for detecting LC using PET/CT images.
2.1. Image Acquisition
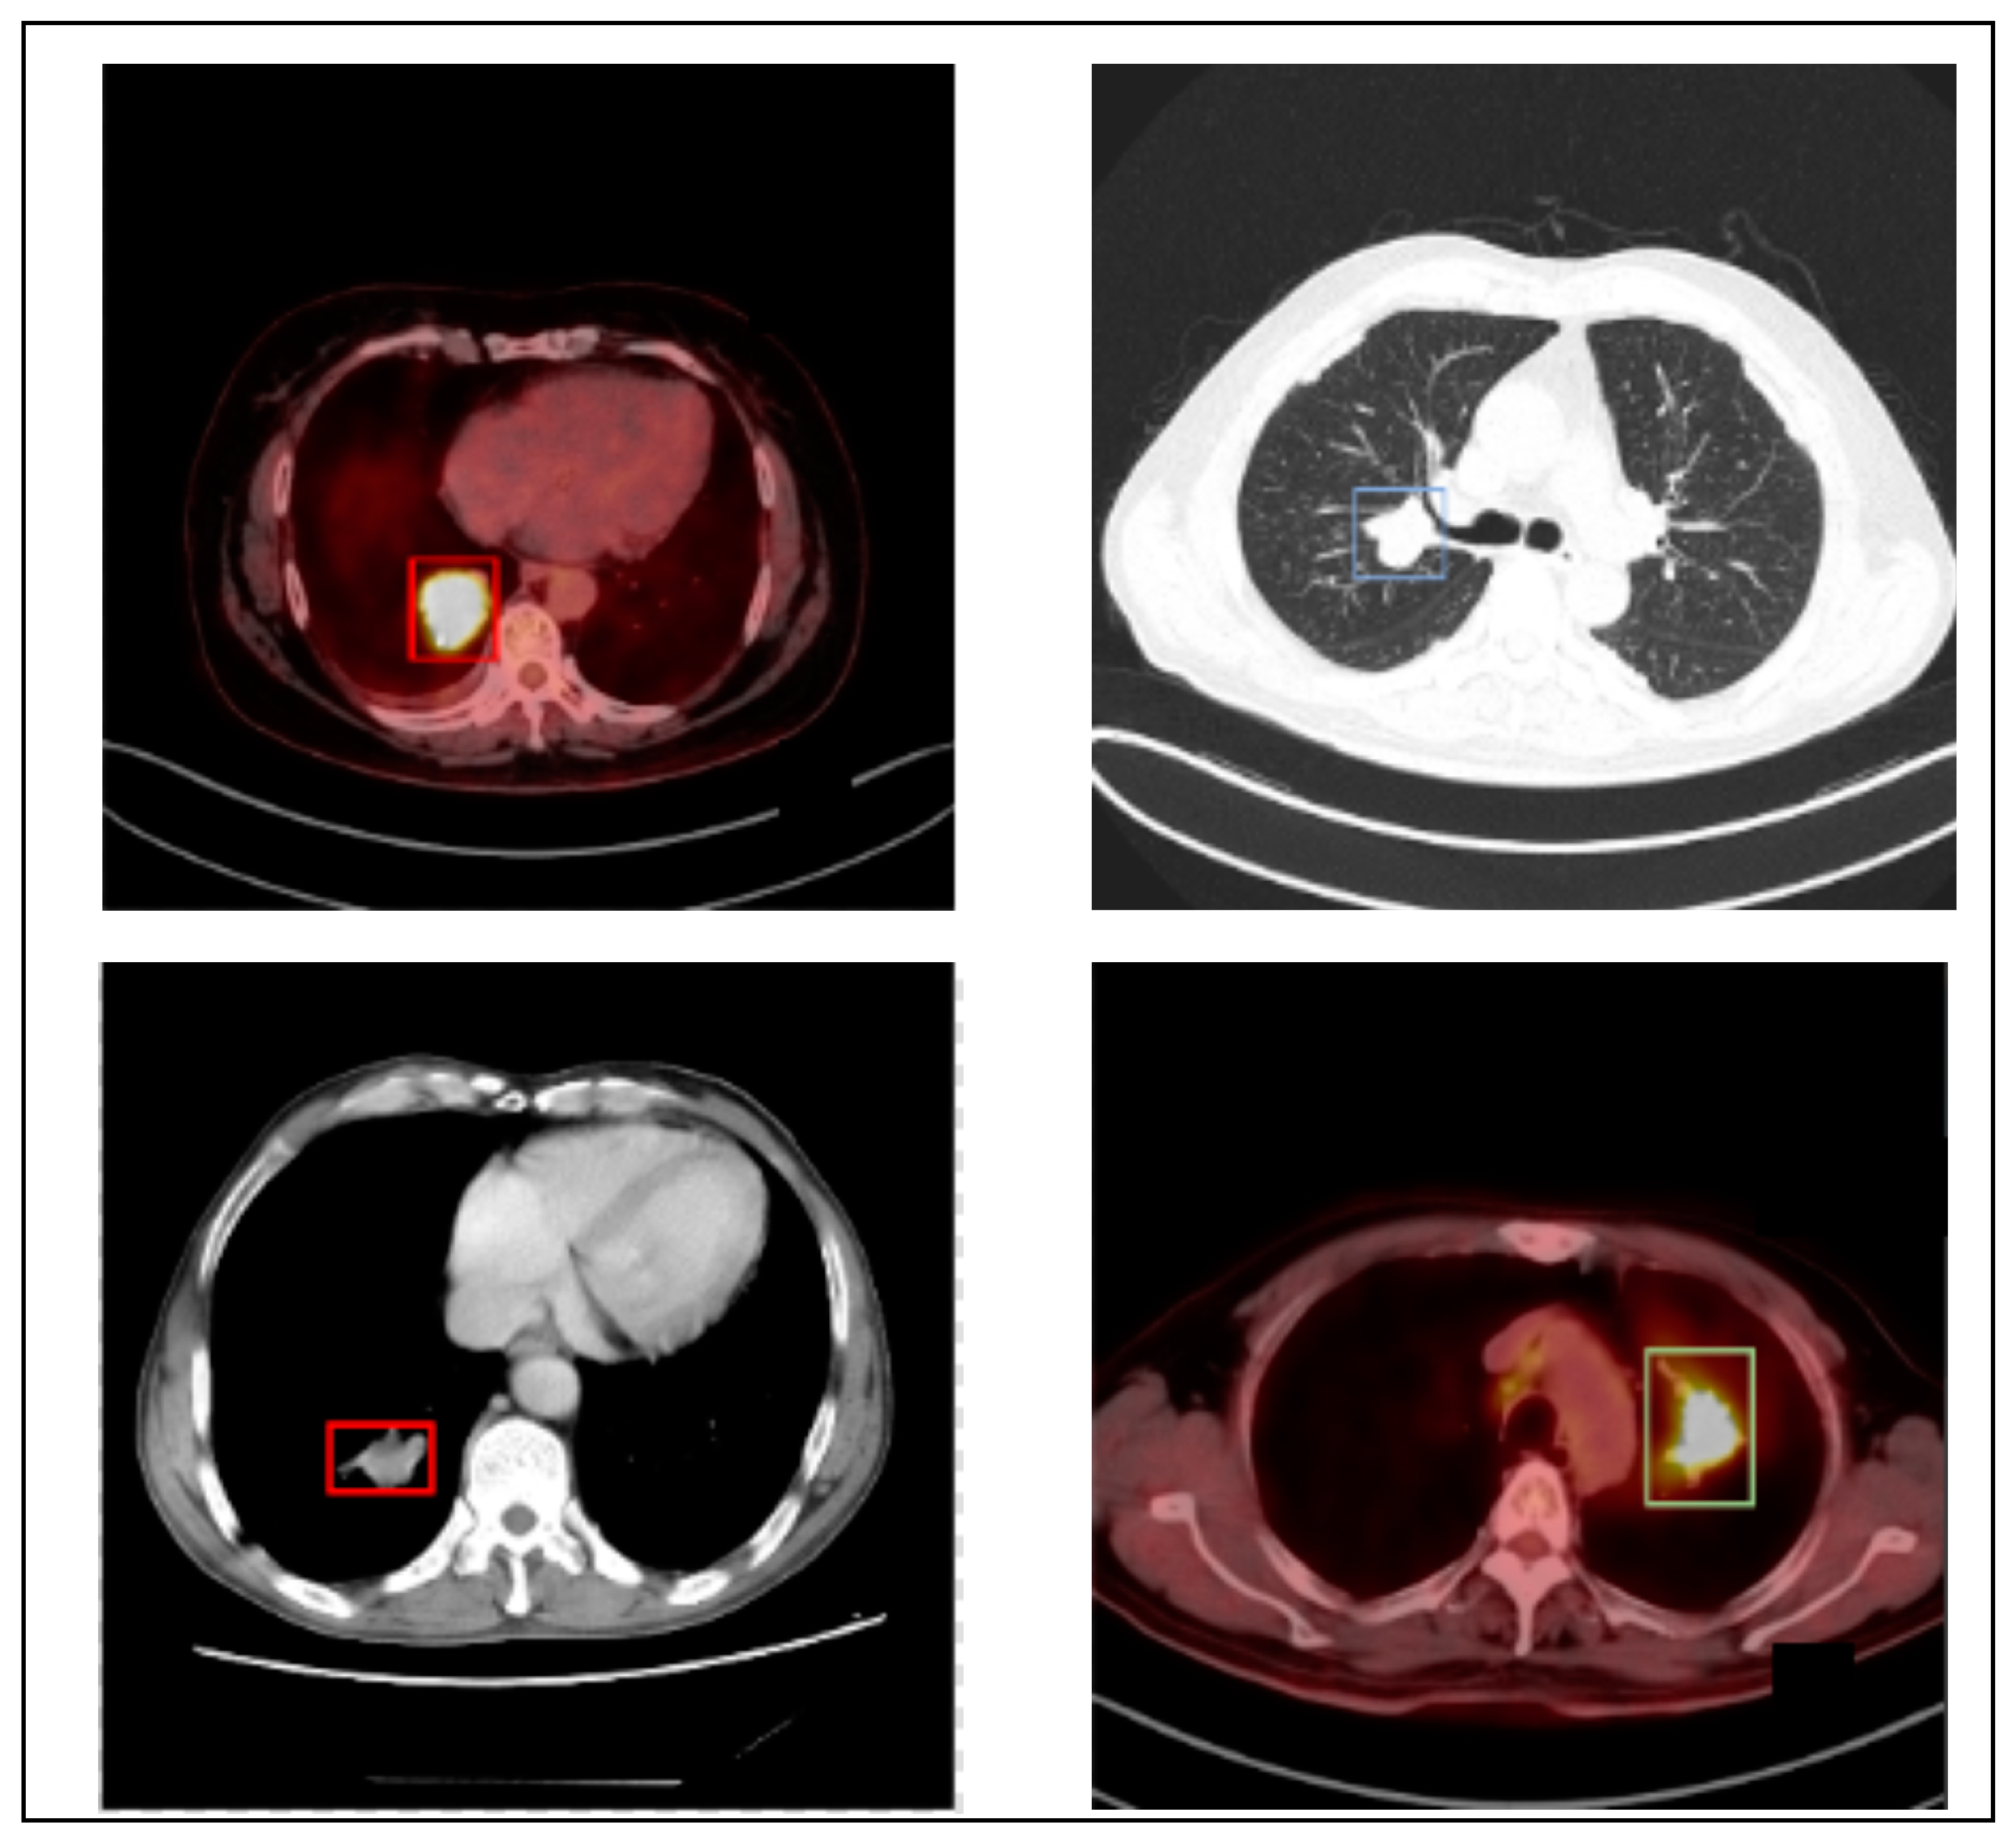
The author utilizes the PET/CT (Lung-PET-CT-Dx) dataset to generalize the proposed LC detection model. Lung-PET-CT-Dx is a recently developed dataset that comprises 31,562 annotated images. It is publicly available in the repository [36,37]. The images were retrospectively collected from multiple healthcare centers across China. The computer center and cancer institute, Harbin Medical University in Harbin, China, supported the dataset owners in obtaining permission to collect the PET/CT images. In addition, the patient’s personal information was not included in the dataset. The dataset contains CT and PET-CT DICOM images of LC patients. It provides XML annotation files to indicate tumor location and bounding boxes. The tissue histopathological diagnosis was used for the patients’ classification. The CT image resolution was 512 512 pixels at 1 mm 1 mm, and the PET image resolution was 200 200 pixels at 4.07 mm 4.07 mm. Five academic thoracic radiologists with expertise in LC detection were employed to annotate the tumor location. The Labellmg 1.4.0 package was used to capture the annotation. The images were broadly classified into adenocarcinoma (A), small cell carcinoma (B), large cell carcinoma (E), and squamous cell carcinoma (G). However, the dataset is highly imbalanced. Table 1 offers the dataset characteristics. Figure 2 highlights the sample LC images.
2.2. Image Preprocessing
PET and CT images are usually obtained as separate scans and may exhibit misalignment due to patient mobility. Various artifacts, including motion artifacts in PET and metal artifacts in CT scans, may influence these images. The image registration is used to guarantee spatial alignment between two images. The symmetric normalization (SyN) function is widely used for non-linear image registration. The author applied the SyN function to handle the deformations and improve the image alignment. The SyN function integrates PET metabolic activity with CT anatomical data. It employs a forward transformation for generating the images. A similarity metric measures the similarity between the source and target image. The SyN function employs cross-correlation computation to generate the normalized image. In addition, it computes velocity to apply smoothness to the images. The forward and inverse transformations are used to improve the alignment accuracy. The images were resized to 512 512 pixels to improve the classification accuracy. Equation (1) shows the computation of the SyN function. The function captures the complex deformation in the PET/CT images by building a Gaussian pyramid. It identifies the spatial transformation for generating the spatially coincident features.
where are diffeomorphism variables used to compute cross-correlation and velocities to normalize the images.
PET and CT images may have unique spatial resolutions and voxel sizes. The author employs the resample image filter function to normalize the spatial resolution of the PET/CT images. The function uses the interpolating pixel values to improve the spatial resolution of the PET/CT images. It minimizes high-frequency objects and restricts the irrelevant patterns during the resampling process. The mathematical form of the image resampling process is presented in Equation (2). The function modifies the dimensions of the image grid to maintain an effective resolution of the images. An interpolation technique is selected to compute the voxel values at non-grid positions depending on the image characteristics. The resample image filter function standardizes the PET/CT image dimensions and supports the proposed model to achieve a meaningful outcome.
where s is the image size, scale is the scaling factor, and NI is the nearest neighbor interpolation.
The attenuation correction function enhances the anatomical and functional information of the PET/CT images. It reconstructs the images by reducing the artifact impressions. The author applies attenuation correction to address the artifacts of the PET images. In addition, the metal artifact correction technique eliminates the artifacts of the CT images. Equation (3) outlines the attenuation correction and metal artifact correction process. The attenuation correction function identifies variations in tissue density by measuring the attenuation of the gamma ray photons. It reduces the impact of scatter artifacts by constructing the primary photon attenuation. The metal attenuation correction function applies an iterative reconstruction technique to reduce the metal artifacts. In addition, it replaces the metal artifact regions with interpolated values of the surrounding tissue regions of the images.
where A and M are the attenuation coefficients for reducing the impression of the artifacts.
To improve the image contrast level, the author employs the Retinex filtering technique to address non-uniform illumination and shading of PET/CT images. Retinex filtering enhances the color and brightness of the PET/CT images. It preserves the overall structure and details of the images. It decomposes the images using the illumination and reflectance components. The logarithmic transformation technique modifies the image by multiplying the illumination and reflectance components into an additive relationship. As a result, the images are reconstructed with improved contrast and visibility. Equation (4) highlights the computational form of the Retinex filtering function. A logarithmic transformation decomposes the images into reflectance and illumination components. The function applies convolution to separate low- and high-frequency components. An exponential function transforms the images into linear space.
where IM is the illumination component and RF is the reflectance component.
2.3. Image Augmentation
In order to increase the dataset size, enhance model generalization, and reduce overfitting, the author applied image augmentation techniques. The geometric transformations are used to generate variations in the image sizes. The images are rotated to 30, 60, 90, and 120 degrees to simulate deviations in the orientation of the patients. The author flipped the images to generate anatomical variations. The elastic deformation is employed to produce changes in tissue shape and position. The superimposition technique is used to include synthetic lesions for pathological condition simulations. It supports the evaluation of the model’s capability in classifying the LC types. Generative adversarial networks (GANs) facilitate the generation of high-quality synthetic images. The system comprises two neural networks, namely a generator and a discriminator, which operate in a mutually competitive manner. In order to address the data imbalance, the author employs multi-channel GANs [42] to generate the synthetic images. The multi-channel GAN model was trained and tested using the lung PET/CT images. The preprocessed images were used for generating the images. The pre-trained GANs allow the author to produce the PET/CT images related to the real PET/CT images without additional training. In addition, the images are generated at multiple points in the latent space for achieving semantic interpolation. Equation (3) shows the mathematical form of generating images using GANs.
2.4. Feature Extraction
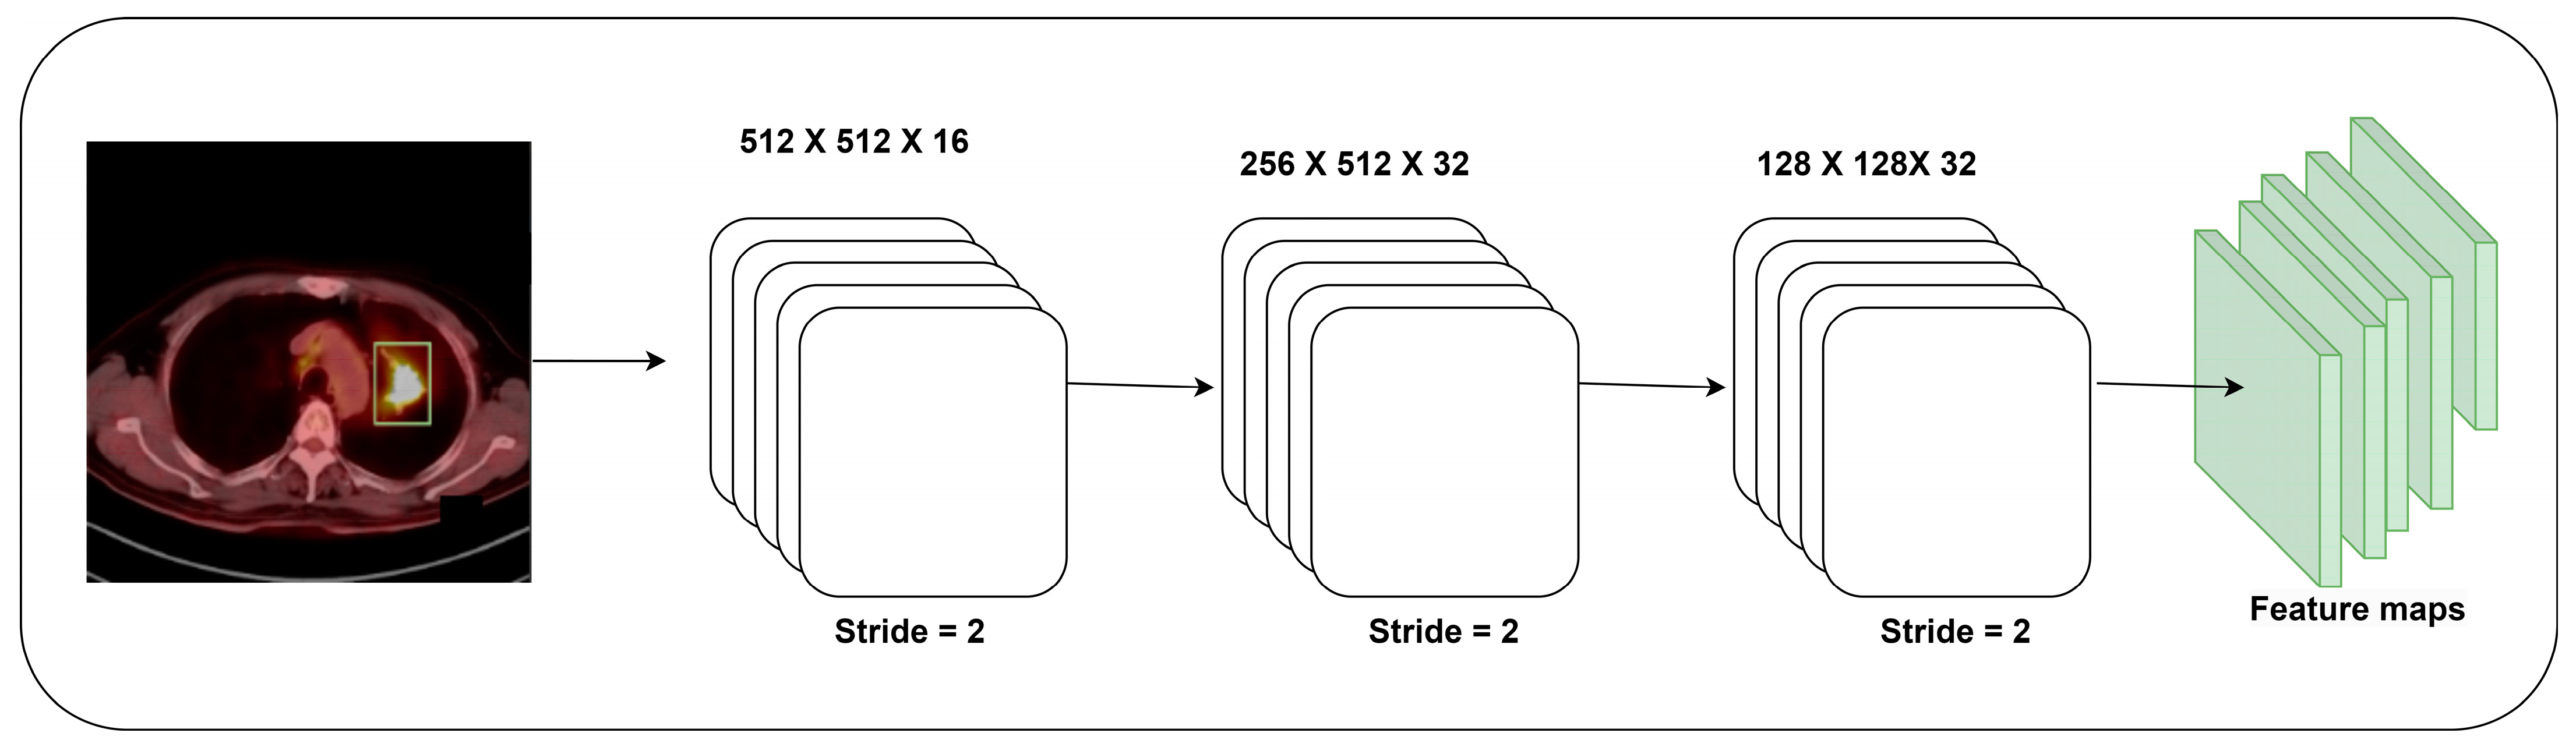
The author builds a feature extraction model using the weights of the pre-trained DenseNet-121 model. A sequence of convolutional layers, batch normalization, and ReLu function is employed for extracting the features. Figure 3 reveals the architecture of the proposed feature extraction model. The final set of layers in the feature extraction model is trained using the DenseNet-121 model’s weight with a learning rate of 1 . The frozen pre-trained DenseNet-121 model requires fewer parameters for the feature extraction. Finally, the global average pooling layer obtains a fixed-size feature vector for each image. The feature extraction process minimizes the computational resources for classifying the PET/CT images. Equations (6) and (7) show the mathematical forms of generating fixed-size features.
2.5. Dimensionality Reduction
Deep autoencoders are used to minimize PET/CT image dimensionality by developing a compact latent space representation [38]. This method employs an encoder–decoder architecture to attempt a reconstruction of the input image from its compressed lower-dimensional representation. The author uses the multilayer encoder network to reduce the feature dimensionality. The encoder’s layers facilitate the conversion of input data into an expression of reduced dimensionality by utilizing learned weights and biases. Lowering dimensions is accomplished by employing several processes like convolutions, pooling, and non-linear activations. The encoder’s final stage compresses the input picture into latent space. Compared to the original image, the dimensionality of this latent space is substantially less. In the autoencoder design, the latent space is the limiting factor. The condensed version of the input image captures its fundamental elements and patterns. Using the low-dimensional representation from the latent space, the decoder network attempts to recreate the original feature. The number of dimensions of the representation expands with decoder layers. The decrease in dimensionality can be attributed to the constriction in the latent space. The encoder network preserves essential characteristics of the features while removing irrelevant or identical data.
2.6. LC Detection Model
The primary objective of MobileNet V3 is to optimize the performance of mobile devices, embedded systems, and Internet of Things devices [41]. MobileNet models are ideal for developing lightweight image classifications. However, its small size may restrict its capacity to capture complex shapes and patterns compared to larger, parameter-heavy models. The efficient MobileNet V3 may not perform complicated feature extraction tasks, including high-resolution images or detailed object recognition [41]. MobileNet V3 models are developed for real-time applications and mobile devices. Certain trade-offs should be considered regarding the model size and its accuracy. A MobileNet V3-Small model may be unsuitable for applications requiring precision and minimal computational resources. It may exhibit limited generalization capabilities in classifying PET/CT models. In order to overcome the challenges, the author develops a classification model with the weights of the MobileNet V3-Small model for classifying the PET/CT images. A total of four convolutional layers are used for the classification. The final layers are trained with MobileNet weights. During the training, the author unfreezes three layers of the MobileNet model. The fully connected layers are integrated into the proposed model with the Softmax function to predict the type of LC. Equation (8) shows the computational form of the Softmax function.
where is the Softmax function, is the image, is the standard exponential factor of the input vector, and is the standard exponential factor of the output vector.
Furthermore, the author employs a learning rate and decay schedule for improving training stability and convergence. The data loading and preprocessing pipeline is optimized to reduce the training time. The author introduces quantization-aware training to maintain the trade-off between model size and inference speed [43]. Quantization-aware training optimizes the proposed model using weight and activation redundancy [43]. It allows the model to be lowered to a quarter of their original size and memory footprint. In addition, the inference rates are increased by a factor of two to four with minimal or no loss of accuracy [43]. The training process enables the proposed model accessible for edge devices and real-time applications. Finally, early stopping is implemented to prevent overfitting and reduce the training time.
2.7. Hyper-Parameter Optimization
In order to fine-tune the parameters, the author employs the Adam optimization (AO) algorithm. The AO algorithm integrates the features of RMSProp and Adagrad algorithms. It adapts the mean of the second moments of the uncentered variance. The exponential moving average of the squared gradients is used to control the decay rates of the proposed LC detection model.
2.8. Evaluation Metrics
In the context of LC detection, true positives (TPs), true negatives (TNs), FPs, and FNs have unique meanings. A TP represents the correctly identified specific LC type, TN indicates the correctly identified image that belongs to a different LC type, FP is an incorrectly identified LC type, and FN represents the incorrectly identified image that belongs to a different LC type.
The author follows the benchmark evaluation metrics for evaluating the proposed model in this study. The accuracy metric assesses the prediction quality of the proposed model. It determines the proportion of accurately predicted instances, which includes TP and TN, in relation to the overall number of instances contained within the dataset. Precision is the percentage of cases in which the model made an optimistic prediction. Recall is the percentage of TP predictions among all positive cases. The F1-score presents the harmonic mean of precision and recall. A higher F1-score signifies a model consistently exhibiting elevated recall and precision levels. In addition, AU-ROC, the precision–recall curve (AU-PRC) and the loss function are computed for the LC detection models. Equations (9)–(12) show the mathematical form for computing the accuracy, precision, recall, and F1 measure.
Cohen’s Kappa measures the model’s consistency in medical image categorization or classification settings [44]. It is a standardized method for measuring the multi-class classification ability of the DL models. It is beneficial for imbalanced datasets where precision may not be reliable for evaluating the model’s effectiveness. In addition, it quantifies inter-rater or inter-classifier agreement in multi-class classification problems based on chance agreement. Equation (13) represents the mathematical form of Cohen’s Kappa.
Standard deviation (SD) and confidence intervals (CI) are used to analyze the data distribution and population parameter estimation. The author used these metrics to identify the variability and uncertainty in the outcome. The mean absolute deviation (MAD) and the root mean square error (RMSE) are employed to evaluate the precision and reliability of predictions. The MAD is used to compare the predicted and actual outcomes. It determines the average of the absolute differences between each anticipated value and its associated real value. The RMSE measures the average squared deviation from the projected value. It is sensitive to outliers compared to the MAD and emphasizes the significant errors.
3. Results
The author conducted the experiment in Python 3.8.3 using the Keras library. The proposed model is implemented in Windows 10, Intel i7, 16 GB RAM, and GeForce GTX 950 GPU. The weights of the DenseNet-121 and MobileNet V3-Small models were extracted from the repository [40,41]. Table 2 presents the hyper-parameters of the proposed LC model.
Adagrad, RMSProp, and AO algorithms are used to fine-tune the parameters of the proposed LC detection model. Table 3 highlights the outcome of the proposed LC detection model. It indicates that the AO-based LC detection model achieved an exceptional performance in classifying the type of LC using the PET/CT images. The computation of bias correction estimates supported AO to outperform RMSProp and Adagrad optimization algorithms.
Table 4 illustrates the computational practices utilized by the LC detection models. The suggested model exhibits a decline in the number of parameters, FLOPs, learning rate, and training duration compared to the existing models.
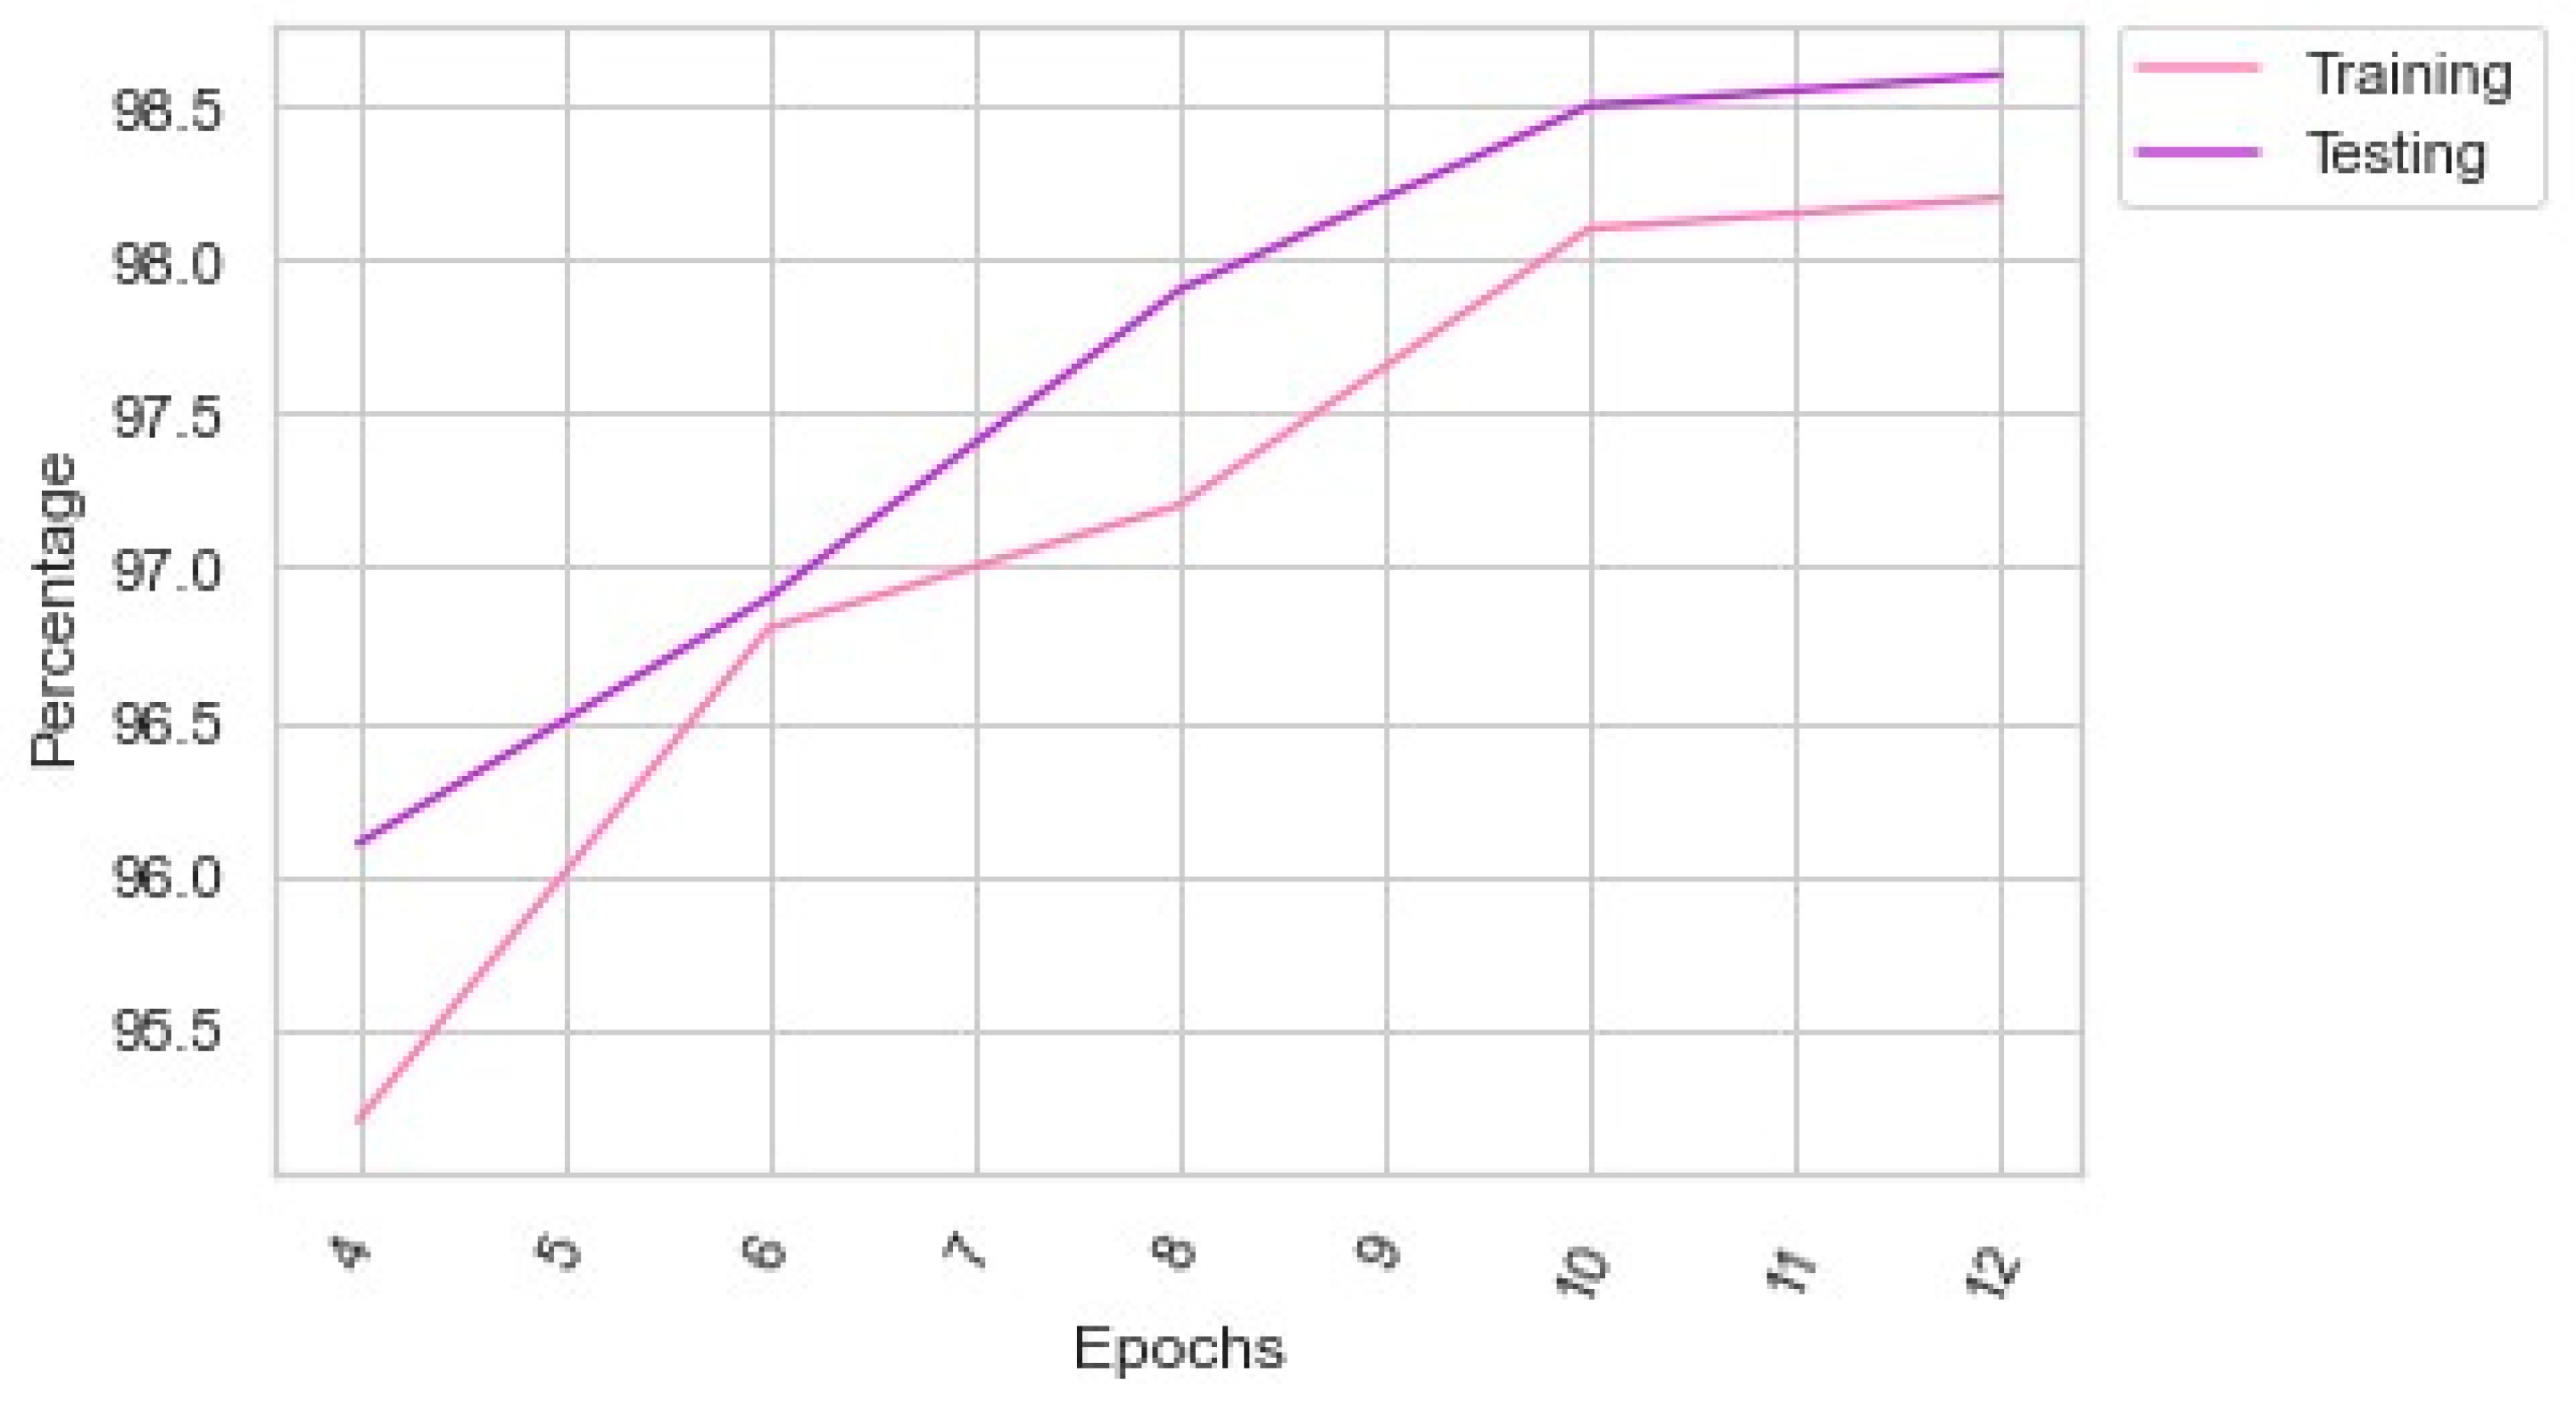
Table 5 shows the performance of the proposed LC detection model with different batch sizes. Figure 4 presents the proposed model’s performance in the multiple epochs. The proposed model showed a significant improvement in the 180th batch. However, the author extended the batch size to 256. The proposed feature extraction supported the proposed LC detection model to produce an exceptional outcome.
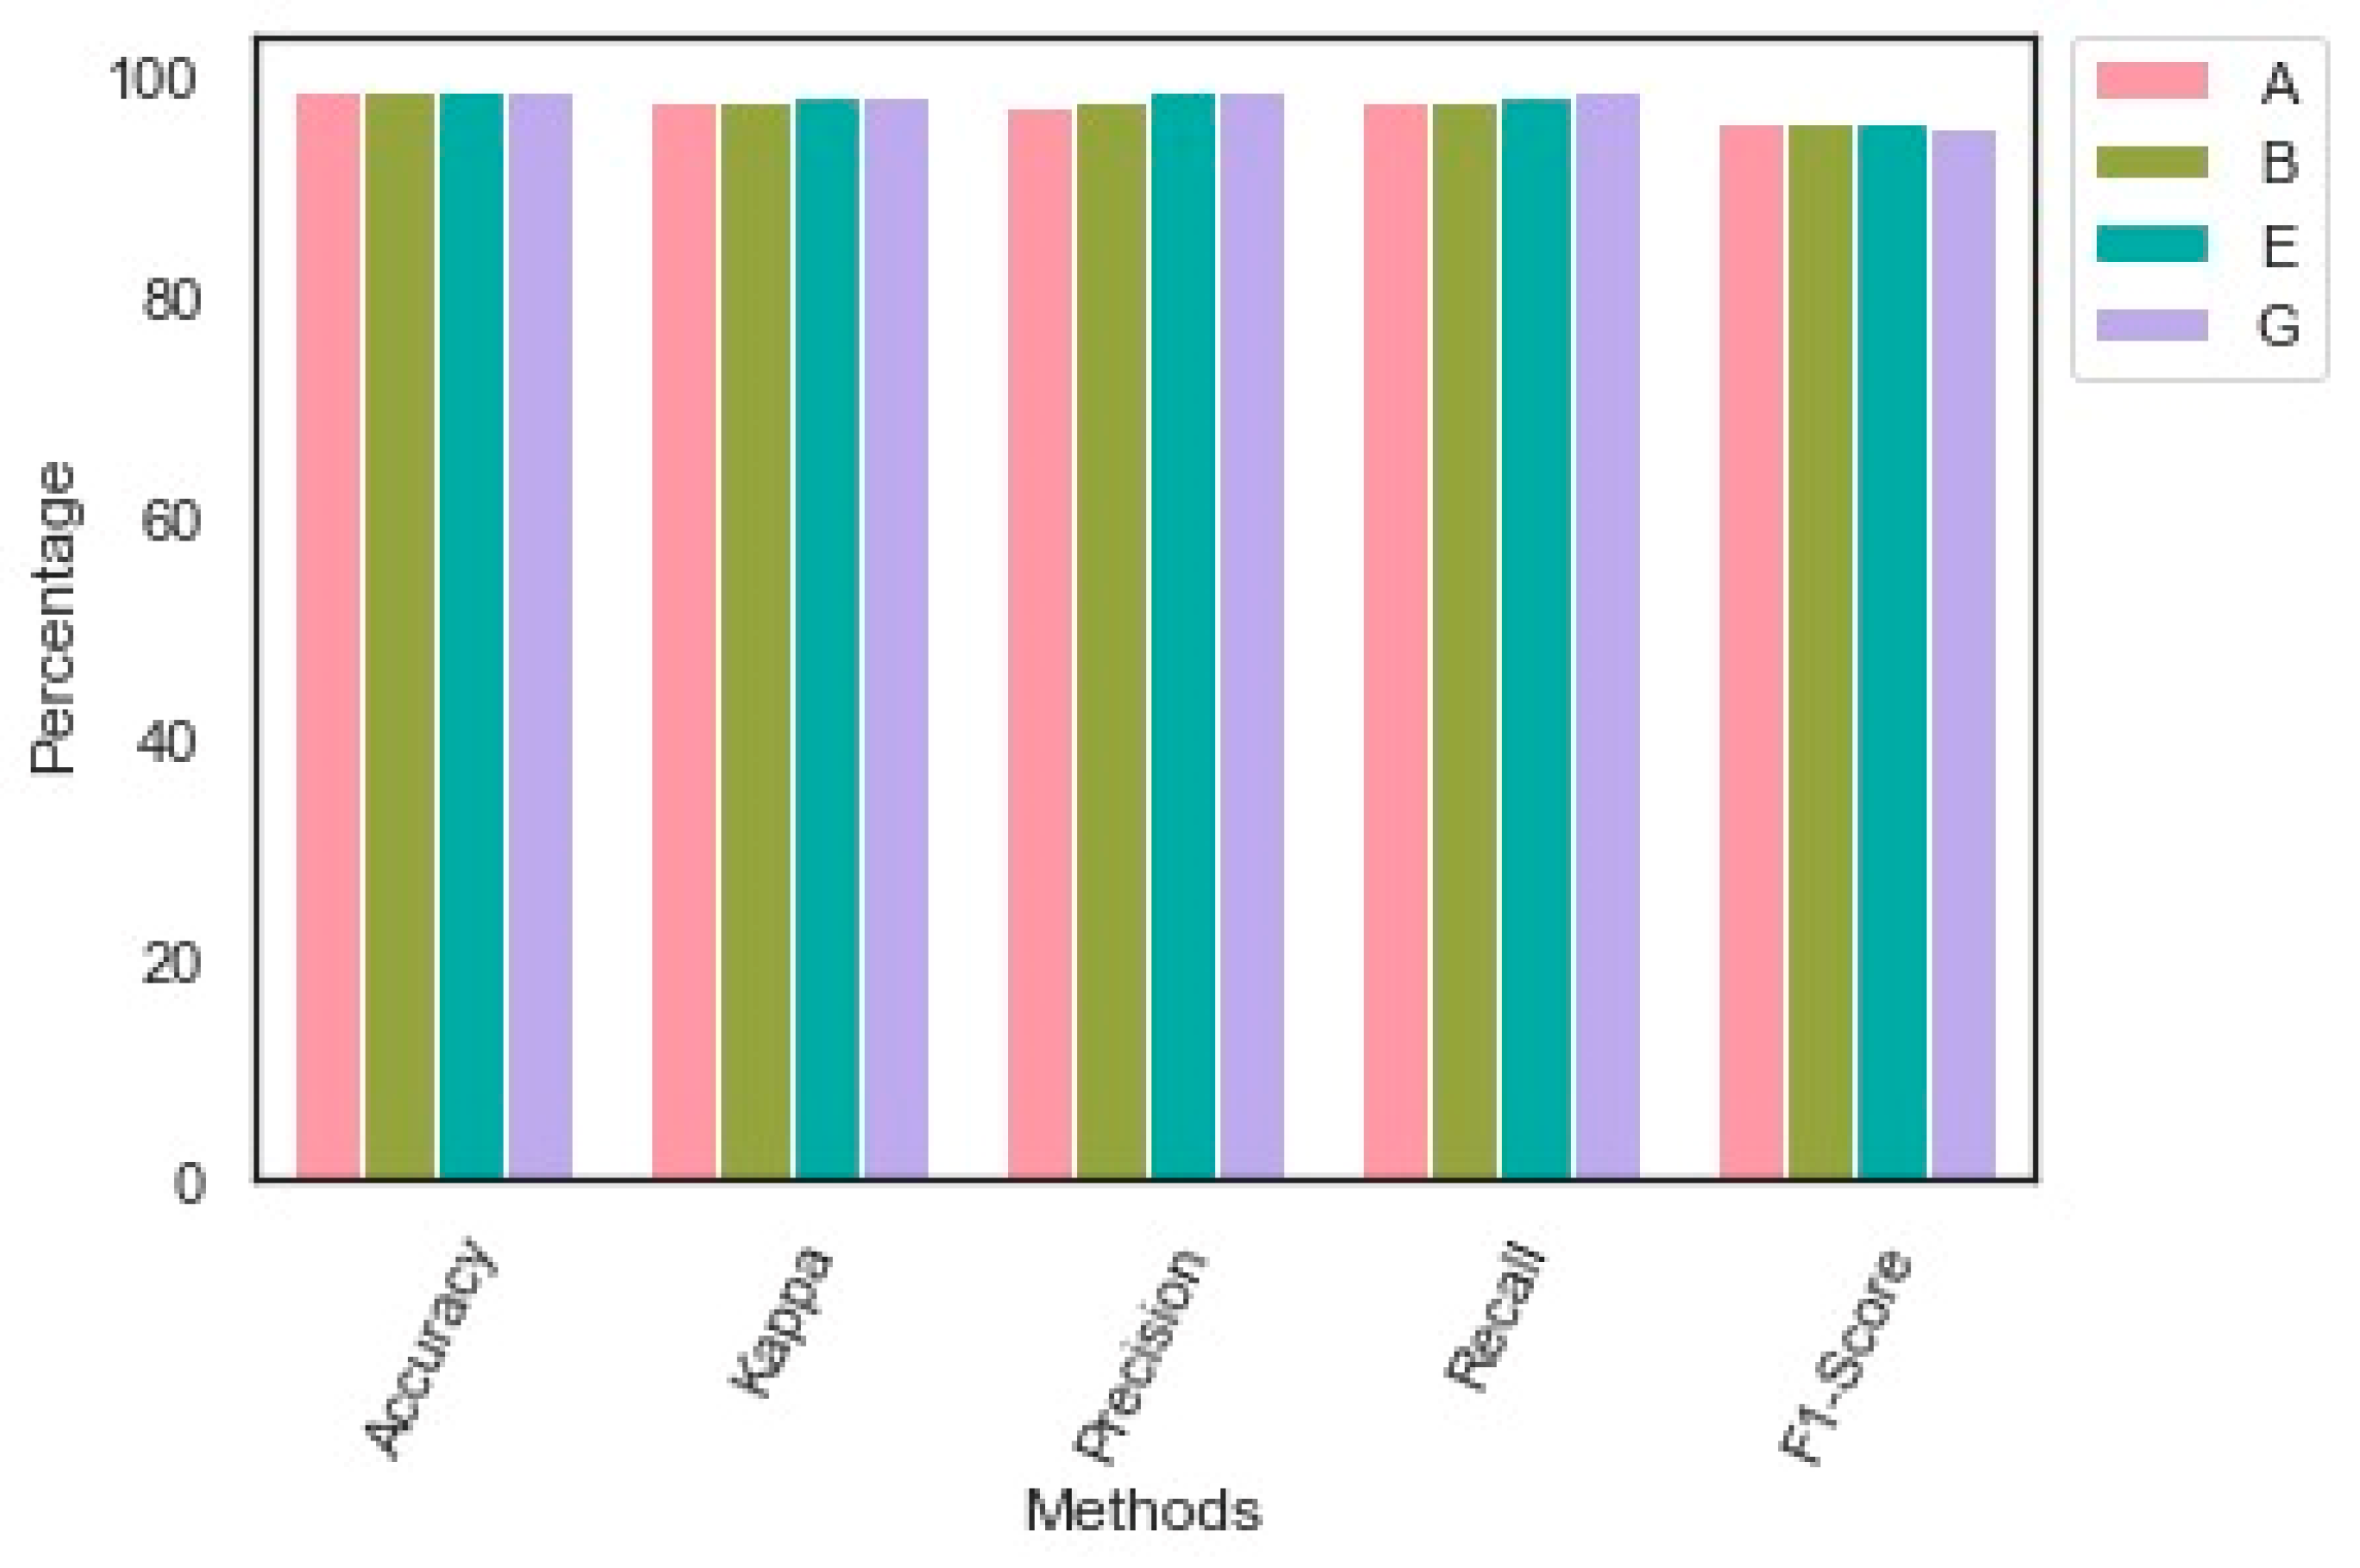
Table 6 reveals the performance of the proposed model. The proposed model obtained an exceptional outcome for each class. The proposed image augmentation technique effectively supported the proposed model in identifying each class’s key patterns. The findings of the performance analysis are presented in Table 6. Figure 5 highlights the outcome of the performance evaluation.
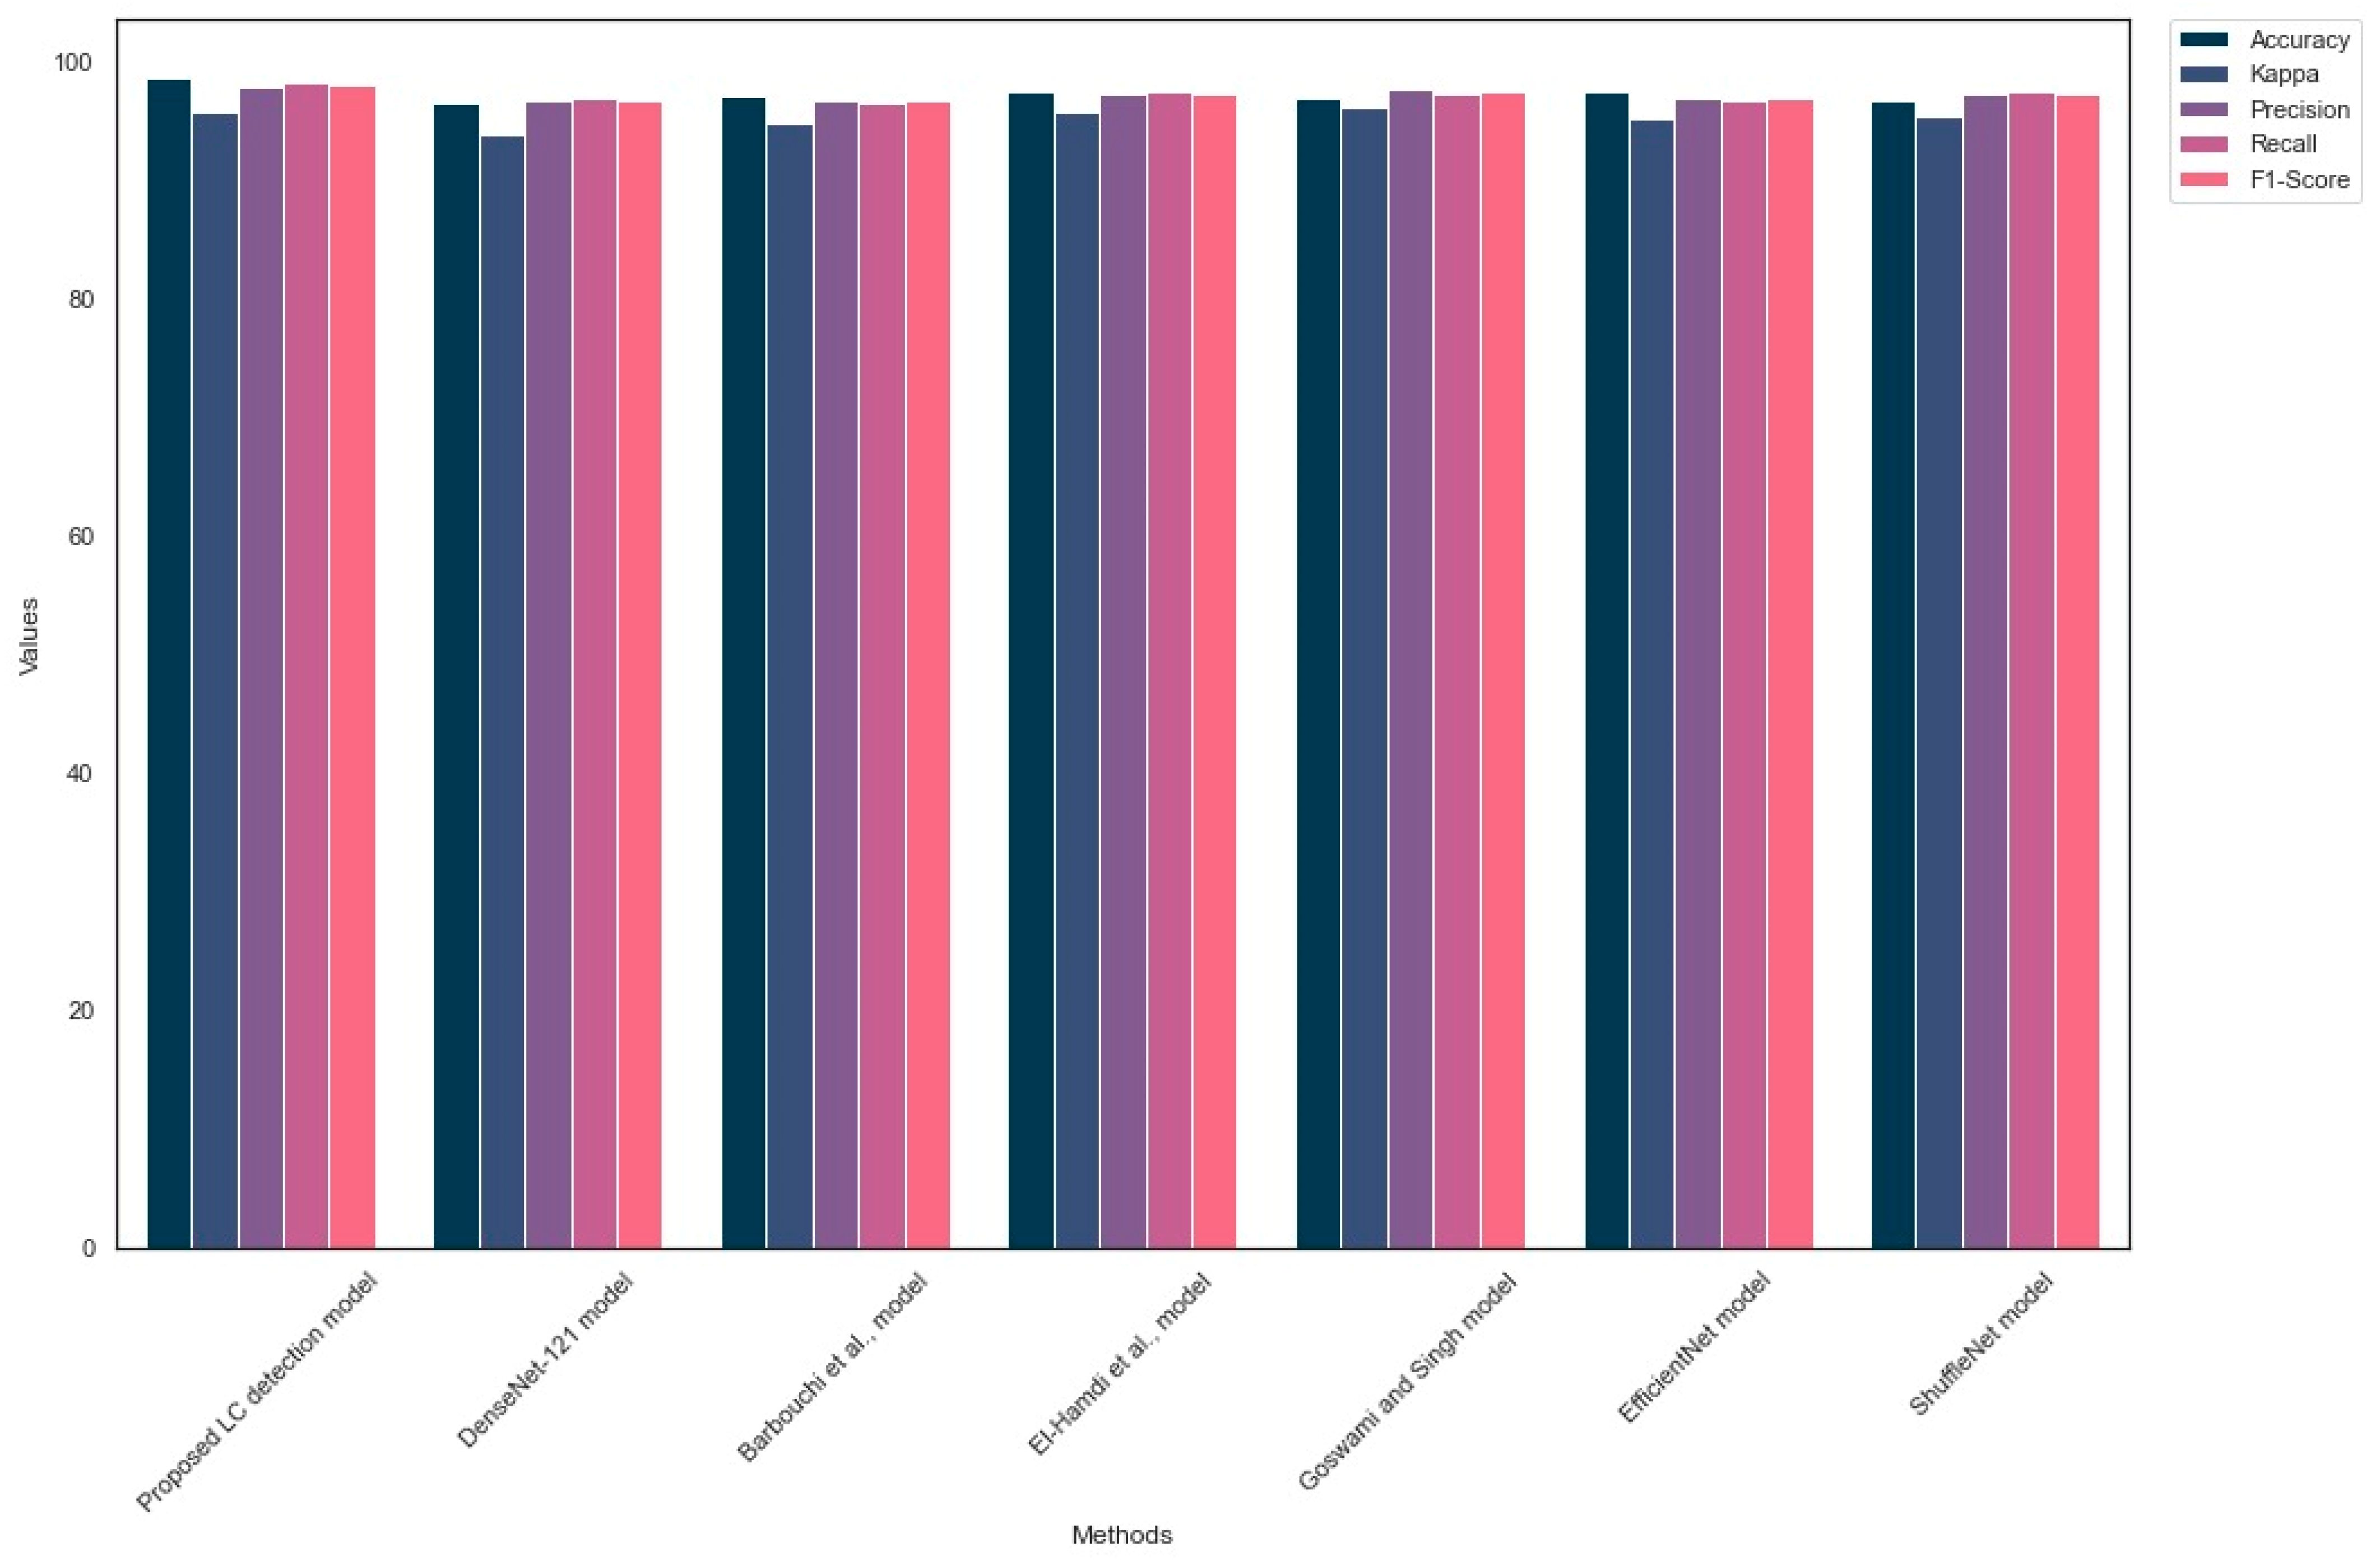
Table 7 outlines the generalization of the LC detection models on the Lung-PET-CT-Dx dataset. The proposed model outperformed the existing LC detection models by achieving an exceptional outcome. The MobileNet V3-Small architecture supported the proposed LC detection model to achieve a better outcome. In addition, the suggested image preprocessing technique assisted the proposed model in detecting the crucial LC patterns in the PET/CT images. Figure 6 shows the outcome of the comparison analysis.
Table 8 highlights the loss, AU-ROC, AU-PRC, SD, and CI of the models. The suggested LC detection model identified the multiple types of LC with minimum loss. AU-ROC and AU-PRC values indicated the significance of the proposed model in detecting FP and FN images. The SD value of 0.0002 indicates that the proposed model’s performance is stable and consistent. Lastly, the CI range of 98.1–98.5 shows that the proposed LC detection model is reliable and can be implemented in healthcare centers.
4. Discussions
The author proposed an LC detection model using this study’s PET/CT images. An extensive image preprocessing technique was developed to overcome the challenges of enhancing the image quality. The SyN function was used to normalize the CT and PET images. Additionally, the author applied resampling, Retinex filtering, and attenuation techniques to improve the image quality. The image augmentation was performed to overcome the data imbalance. A CNN model was developed using the DenseNet-121 model’s weights for the feature extraction. Deep autoencoders reduced the dimensionality of the images. Finally, a CNN model with a MobileNet V3 model weights was employed for classifying the type of LC. The author improved the performance of the proposed model by applying a quantization-aware training approach. In addition, the AO-based hyperparameter optimization supported the proposed LC model to detect the type of LC with a minimum hardware and software requirement. The experimental results revealed the significance of the proposed LC detection model in identifying the LC types.
Table 3 outlined the hyper-parameter optimization’s significance in optimizing the proposed LC detection parameters. AO-based hyper-parameter optimization supported the model to yield an exceptional outcome compared to Adagrad and RMSProp optimizations. Table 4 revealed that the proposed model demands minimum computational power to generate an effective outcome. It required parameters of 2.1 m and FLOPs of 176 m with a training time of 128 s for identifying the types of LC. Table 5 and Figure 4 highlighted the number of epochs of the proposed model to deliver a superior outcome. The proposed LC detection model achieved an accuracy of 98.6 with a batch size of 256. However, it obtained an accuracy of 98.4 in the 180th batch. Table 6 outlined the performance evaluation findings of the suggested LC detection model. The proposed model produced an outstanding result for each class using the PET/CT images. It is evident that the suggested image preprocessing and augmentation techniques assisted the proposed LC detection model in identifying the LC types. Table 7 emphasized the key findings of the comparison analysis. The suggested model surpassed the existing LC detection approaches by reaching an optimal accuracy and F1-score using minimal resource utilization. Finally, Table 8 showed that the proposed model obtained a higher AU-ROC and AU-PRC with a minimum loss of 0.89.
Barbouchi et al. [34] built a transformer-based LC detection model. They developed a histologic subtype classification to detect the tumor location from the PET/CT images. However, the vision transformers demand enormous computational resources compared to the proposed LC detection model. The proposed LC detection model outperformed Barbouchi et al.’s model with minimum hardware resources.
El-Hamdi et al. [35] proposed an LC detection model and generalized their model using the Lung-PET-CT-Dx dataset. They built a multi-class CNN model for classifying the PET/CT images. The VGG-16 network was used to extract the features. Subsequently, a classifier was employed to classify the extracted features. Similarly, the proposed model used the DenseNet-121-based feature extractor. In addition, the author constructed an image classifier using the weights of the MobileNet V3-Small model. The findings highlighted that the proposed LC detection model outperformed the El-Hamdi et al. model.
Goswami and Singh [37] developed an image classification model for detecting LC from PET/CT images. They obtained an optimal outcome using the Lung-PET-CT-Dx dataset. Likewise, the proposed model achieved superior results by employing effective image processing, feature extraction, and image classification models.
The DenseNet-121-based LC detection model achieved an accuracy of 96.4 with parameters of 8.3 and FLOPs of 679. However, the proposed model obtained exceptional accuracy with limited computational resources. The EfficientNet-based LC detection model obtained a higher accuracy and F1-score. However, the model may not perform optimally on the real-time images. It required a considerable computational resource for classifying the PET/CT images. In addition, it demands additional training time to capture the fine details of the images. The ShuffleNet-based LC detection model offered an exceptional outcome. However, the shallower architecture of the ShuffleNet model may limit the LC detection performance. In contrast, the proposed LC detection model presented an outstanding result with limited computational resources. The combination of the DenseNet-121 and MobileNet V3 models yielded better results.
PET/CT imaging offers a complete assessment of lung tissue, effectively highlighting regions exhibiting elevated metabolic activity while offering valuable anatomical context. Healthcare practitioners can choose the surgery, chemotherapy, or radiation therapy for LC by precisely identifying the types of LC. The proposed model was trained to analyze and extract features from complex images. It can be implemented in edge devices to render effective healthcare services to individuals. It can facilitate the detection and classification of various forms of LC. In addition, it can locate tiny lung nodules that human radiologists may ignore due to the early stage of development. The timely identification of medical conditions can significantly enhance patients’ overall prognosis and treatment outcomes. The proposed LC detection model can assist physicians in customizing LC therapies for each patient. It can minimize the number of FPs and FNs associated with cancer detection. This intervention enhances the precision of diagnostic assessments.
Furthermore, the proposed model can substantially accelerate the diagnostic procedure. Radiologists can use the proposed model to select cases and focus on complicated tasks. It can contribute to advancing research and facilitating clinical trials. The proposed LC detection model generates outcomes in a limited time. It enables healthcare centers to identify LC in the earlier stages. Healthcare centers can employ the model to detect LC without professional radiologists. The reduced number of FPs and FNs guaranteed the optimal accuracy of the proposed model. Additionally, the proposed model is cost-effective and can be implemented with low computational resources.
However, the author encountered a few limitations while implementing the proposed model. The PET/CT images contained motion artifacts and metallic artifacts. The low spatial resolution caused challenges in identifying the crucial patterns. Tissue misalignment during the scan reduced the image quality. In addition, PET and CT images were obtained separately. Thus, there was a misalignment due to the functional information of PET and the anatomical information of CT images. In addition, the dataset samples were highly imbalanced. Nonetheless, the author employed compelling image preprocessing techniques, including the SyN function, artifact correction technique, and attenuation approaches, to improve image quality. The proposed image augmentation technique supported the proposed LC detection model to overcome the data imbalance limitation. While implementing the proposed model, the author faced challenges with the graphical processing unit configuration. The quantization-aware training approach has supported the author deploying the model while using low computational resources. The lack of accessible, high-quality labeled data to train DL models is a significant barrier. Generating massive datasets with precise annotations is essential for LC diagnosis. The research requires more diversified, publicly available, and well-annotated datasets. The strong generalization capabilities of DL models can support a physician in treating a wide range of populations. Maintaining model robustness and performance in clinical contexts is challenging. A balance between FP and FN is crucial. PET/CT images contain noises and artifacts. Extensive image preprocessing was required to improve image clarity.
To enhance the proposed LC detection model, it is essential to integrate technology developments with clinical expertise, information availability, and compliance standards. By considering these factors, the proposed model can serve as a significant resource in assisting healthcare professionals in making efficient and prompt decisions concerning the diagnosis and treatment of LC. The liquid neural network (LNN) extends the recurrent neural network’s capabilities by including dynamic hidden states for analyzing video and images [45]. It computes the expected outcome and its shifting hidden state at each prediction step. In the future, LNN-based applications can significantly outperform currently used machine vision approaches. Using the LNN technique, the feature engineering process can be improved. A set of optimal features can optimize the multi-class classification accuracy. The proposed model can be extended using LNN and ensemble learning techniques to reduce the computation time and resources in identifying LC from the multi-modality images.
5. Conclusions
The author built an LC detection model using the DL technique in this study. The proposed LC detection model employed image preprocessing and augmentation techniques to improve the performance of the proposed model. The SyN function and Retinex filters were used to remove noise and artifacts. The GANs technique was used to increase the dataset size. The author developed the DenseNet-121-based feature extraction model for extracting the critical features. A deep autoencoder model was employed to reduce the number of features without losing the essential details. A MobileNet V3-Small model-based image classifier was constructed using quantization-aware training and early stopping strategies. The author generalized the proposed model using the Lung-PET-CT-Dx dataset. The findings highlighted the significant contribution of the proposed model in identifying the LC types. The proposed LC detection model outperformed the existing models. It required limited computational resources for detecting LC from the complex images. Healthcare centers can deploy the proposed model without any implementation complexities. In addition, the lightweight architecture of the proposed model offers an opportunity to integrate it into the edge devices. However, a few limitations were encountered during the development. There is a lack of highly balanced datasets for providing extensive training for the LC detection model. The low-quality images caused challenges in classifying the LC types. As a result, extended training is required to implement the proposed model in the real-time application. The integration of the LNN technique can improve the process of feature extraction. In addition, the ensemble learning approach can accurately classify the medical images. The author will employ the LNN and ensemble learning approaches to extract crucial features and classify low-quality images.
Funding
This work was supported by the Deanship of Scientific Research, Vice Presidency for Graduate Studies and Scientific Research, King Faisal University, Saudi Arabia (Grant No. 4702).
Institutional Review Board Statement
Not applicable.
Informed Consent Statement
Not applicable.
Data Availability Statement
Lung-PET-CT-Dx Dataset. The Cancer Imaging Archive. https://doi.org/10.7937/TCIA.2020.NNC2-0461, accessed on 1 January 2023.
Conflicts of Interest
The author declares no conflict of interest.
References
- Gu, Y.; Chi, J.; Liu, J.; Yang, L.; Zhang, B.; Yu, D.; Zhao, Y.; Lu, X. A survey of computer-aided diagnosis of lung nodules from CT scans using deep learning. Comput. Biol. Med. 2021, 137, 104806. [Google Scholar] [CrossRef]
- Sharif, M.I.; Li, J.P.; Naz, J.; Rashid, I. A comprehensive review on multi-organs tumor detection based on machine learning. Pattern Recognit. Lett. 2020, 131, 30–37. [Google Scholar] [CrossRef]
- Adhikari, T.M.; Liska, H.; Sun, Z.; Wu, Y. A Review of Deep Learning Techniques Applied in Lung Cancer Diagnosis. In Signal and Information Processing, Networking and Computers: Proceedings of the 6th International Conference on Signal and Information Processing, Networking and Computers (ICSINC), Guiyang, China, 13–16 August 2019; Springer: Singapore, 2020; pp. 800–807. [Google Scholar]
- Saba, T. Recent advancement in cancer detection using machine learning: Systematic survey of decades, comparisons and challenges. J. Infect. Public Health 2020, 13, 1274–1289. [Google Scholar] [CrossRef]
- Ozdemir, O.; Russell, R.L.; Berlin, A.A. A 3D probabilistic deep learning system for detection and diagnosis of lung cancer using low-dose CT scans. IEEE Trans. Med. Imaging 2019, 39, 1419–1429. [Google Scholar] [CrossRef]
- Yu, L.; Tao, G.; Zhu, L.; Wang, G.; Li, Z.; Ye, J.; Chen, Q. Prediction of pathologic stage in non-small cell lung cancer using machine learning algorithm based on CT image feature analysis. BMC Cancer 2019, 19, 464. [Google Scholar] [CrossRef]
- Asuntha, A.; Srinivasan, A. Deep learning for lung Cancer detection and classification. Multimed. Tools Appl. 2020, 79, 7731–7762. [Google Scholar] [CrossRef]
- Shakeel, P.M.; Burhanuddin, M.A.; Desa, M.I. Lung cancer detection from CT image using improved profuse clustering and deep learning instantaneously trained neural networks. Measurement 2019, 145, 702–712. [Google Scholar] [CrossRef]
- Xie, Y.; Meng, W.Y.; Li, R.Z.; Wang, Y.W.; Qian, X.; Chan, C.; Yu, Z.F.; Fan, X.X.; Pan, H.D.; Xie, C.; et al. Early lung cancer diagnostic biomarker discovery by machine learning methods. Transl. Oncol. 2021, 14, 100907. [Google Scholar] [CrossRef]
- Sori, W.J.; Feng, J.; Godana, A.W.; Liu, S.; Gelmecha, D.J. DFD-Net: Lung cancer detection from denoised CT scan image using deep learning. Front. Comput. Sci. 2021, 15, 152701. [Google Scholar] [CrossRef]
- Ak, M.F. A comparative analysis of breast cancer detection and diagnosis using data visualization and machine learning applications. Healthcare 2020, 8, 111. [Google Scholar] [CrossRef]
- Pradhan, K.; Chawla, P. Medical Internet of things using machine learning algorithms for lung cancer detection. J. Manag. Anal. 2020, 7, 591–623. [Google Scholar] [CrossRef]
- Heuvelmans, M.A.; van Ooijen, P.M.; Ather, S.; Silva, C.F.; Han, D.; Heussel, C.P.; Hickes, W.; Kauczor, H.U.; Novotny, P.; Peschl, H.; et al. Lung cancer prediction by Deep Learning to identify benign lung nodules. Lung Cancer 2021, 154, 1–4. [Google Scholar] [CrossRef]
- Singh, G.A.P.; Gupta, P.K. Performance analysis of various machine learning-based approaches for detection and classification of lung cancer in humans. Neural Comput. Appl. 2019, 31, 6863–6877. [Google Scholar] [CrossRef]
- Sajja, T.; Devarapalli, R.; Kalluri, H. Lung Cancer Detection Based on CT Scan Images by Using Deep Transfer Learning. Trait. Du Signal 2019, 36, 339–344. [Google Scholar] [CrossRef]
- Coccia, M. Deep learning technology for improving cancer care in society: New directions in cancer imaging driven by artificial intelligence. Technol. Soc. 2020, 60, 101198. [Google Scholar] [CrossRef]
- Bhatia, S.; Sinha, Y.; Goel, L. Lung cancer detection: A deep learning approach. In Soft Computing for Problem Solving: SocProS 2017; Springer: Singapore, 2019; Volume 2, pp. 699–705. [Google Scholar]
- Nasrullah, N.; Sang, J.; Alam, M.S.; Mateen, M.; Cai, B.; Hu, H. Automated lung nodule detection and classification using deep learning combined with multiple strategies. Sensors 2019, 19, 3722. [Google Scholar] [CrossRef]
- Chaunzwa, T.L.; Hosny, A.; Xu, Y.; Shafer, A.; Diao, N.; Lanuti, M.; Christiani, D.C.; Mak, R.H.; Aerts, H.J. Deep learning classification of lung cancer histology using CT images. Sci. Rep. 2021, 11, 5471. [Google Scholar] [CrossRef]
- Bhandary, A.; Prabhu, G.A.; Rajinikanth, V.; Thanaraj, K.P.; Satapathy, S.C.; Robbins, D.E.; Shasky, C.; Zhang, Y.D.; Tavares, J.M.R.; Raja, N.S.M. Deep-learning framework to detect lung abnormality—A study with chest X-Ray and lung CT scan images. Pattern Recognit. Lett. 2020, 129, 271–278. [Google Scholar] [CrossRef]
- Kanavati, F.; Toyokawa, G.; Momosaki, S.; Rambeau, M.; Kozuma, Y.; Shoji, F.; Yamazaki, K.; Takeo, S.; Iizuka, O.; Tsuneki, M. Weakly-supervised learning for lung carcinoma classification using deep learning. Sci. Rep. 2020, 10, 9297. [Google Scholar] [CrossRef]
- Hallitschke, V.J.; Schlumberger, T.; Kataliakos, P.; Marinov, Z.; Kim, M.; Heiliger, L.; Seibold, C.; Kleesiek, J.; Stiefelhagen, R. Multimodal Interactive Lung Lesion Segmentation: A Framework for Annotating PET/CT Images based on Physiological and Anatomical Cues. arXiv 2023, arXiv:2301.09914. [Google Scholar]
- Ardila, D.; Kiraly, A.P.; Bharadwaj, S.; Choi, B.; Reicher, J.J.; Peng, L.; Tse, D.; Etemadi, M.; Ye, W.; Corrado, G.; et al. End-to-end lung cancer screening with three-dimensional deep learning on low-dose chest computed tomography. Nat. Med. 2019, 25, 954–961. [Google Scholar] [CrossRef] [PubMed]
- Marentakis, P.; Karaiskos, P.; Kouloulias, V.; Kelekis, N.; Argentos, S.; Oikonomopoulos, N.; Loukas, C. Lung cancer histology classification from CT images based on radiomics and deep learning models. Med. Biol. Eng. Comput. 2021, 59, 215–226. [Google Scholar] [CrossRef]
- Chabon, J.J.; Hamilton, E.G.; Kurtz, D.M.; Esfahani, M.S.; Moding, E.J.; Stehr, H.; Schroers-Martin, J.; Nabet, B.Y.; Chen, B.; Chaudhuri, A.A.; et al. Integrating genomic features for non-invasive early lung cancer detection. Nature 2020, 580, 245–251. [Google Scholar] [CrossRef]
- Zhang, R.; Cheng, C.; Zhao, X.; Li, X. Multiscale mask R-CNN–based lung tumor detection using PET imaging. Mol. Imaging 2019, 18, 1536012119863531. [Google Scholar] [CrossRef] [PubMed]
- Kriegsmann, M.; Haag, C.; Weis, C.A.; Steinbuss, G.; Warth, A.; Zgorzelski, C.; Muley, T.; Winter, H.; Eichhorn, M.E.; Eichhorn, F.; et al. Deep learning for the classification of small-cell and non-small-cell lung cancer. Cancers 2020, 12, 1604. [Google Scholar] [CrossRef] [PubMed]
- Polat, H.; Danaei Mehr, H. Classification of pulmonary CT images by using hybrid 3D-deep convolutional neural network architecture. Appl. Sci. 2019, 9, 940. [Google Scholar] [CrossRef]
- Patel, D.; Shah, Y.; Thakkar, N.; Shah, K.; Shah, M. Implementation of artificial intelligence techniques for cancer detection. Augment. Hum. Res. 2020, 5, 6. [Google Scholar] [CrossRef]
- Baranwal, N.; Doravari, P.; Kachhoria, R. Classification of histopathology images of lung cancer using convolutional neural network (CNN). In Disruptive Developments in Biomedical Applications; CRC Press: Boca Raton, FL, USA, 2022; pp. 75–89. [Google Scholar]
- Levy-Jurgenson, A.; Tekpli, X.; Kristensen, V.N.; Yakhini, Z. Spatial transcriptomics inferred from pathology whole-slide images links tumor heterogeneity to survival in breast and lung cancer. Sci. Rep. 2020, 10, 18802. [Google Scholar] [CrossRef]
- Mishra, S.; Thakkar, H.K.; Mallick, P.K.; Tiwari, P.; Alamri, A. A sustainable IoHT based computationally intelligent healthcare monitoring system for lung cancer risk detection. Sustain. Cities Soc. 2021, 72, 103079. [Google Scholar] [CrossRef]
- Luna, J.M.; Chao, H.H.; Diffenderfer, E.S.; Valdes, G.; Chinniah, C.; Ma, G.; Cengel, K.A.; Solberg, T.D.; Berman, A.T.; Simone, C.B., II. Predicting radiation pneumonitis in locally advanced stage II–III non-small cell lung cancer using machine learning. Radiother. Oncol. 2019, 133, 106–112. [Google Scholar] [CrossRef]
- Barbouchi, K.; El Hamdi, D.; Elouedi, I.; Aïcha, T.B.; Echi, A.K.; Slim, I. A transformer-based deep neural network for detection and classification of lung cancer via PET/CT images. Int. J. Imaging Syst. Technol. 2023, 33, 1383–1395. [Google Scholar] [CrossRef]
- El Hamdi, D.; Elouedi, I.; Slim, I. Computer-Aided Classification of Cell Lung Cancer Via PET/CT Images Using Convolutional Neural Network. Int. J. Image Graph. 2023, 2450040. [Google Scholar] [CrossRef]
- Li, P.; Wang, S.; Li, T.; Lu, J.; HuangFu, Y.; Wang, D. A Large-Scale CT and PET/CT Dataset for Lung Cancer Diagnosis (Lung-PET-CT-Dx) [Dataset]. Cancer Imaging Arch. 2020. [Google Scholar] [CrossRef]
- Clark, K.; Vendt, B.; Smith, K.; Freymann, J.; Kirby, J.; Koppel, P.; Moore, S.; Phillips, S.; Maffitt, D.; Pringle, M.; et al. The Cancer Imaging Archive (TCIA): Maintaining and Operating a Public Information Repository. J. Digit. Imaging 2013, 26, 1045–1057. [Google Scholar] [CrossRef]
- Goswami, J.; Singh, K.K. Pulmonary Lung Cancer Classification Using Deep Neural Networks. In Machine Vision and Augmented Intelligence: Select Proceedings of MAI 2022; Springer Nature Singapore: Singapore, 2023; pp. 395–407. [Google Scholar]
- Liu, Z.; Yao, C.; Yu, H.; Wu, T. Deep reinforcement learning with its application for lung cancer detection in medical Internet of Things. Future Gener. Comput. Syst. 2019, 97, 1–9. [Google Scholar] [CrossRef]
- DenseNet-121 Model. Available online: https://github.com/flyyufelix/DenseNet-Keras/blob/master/densenet121.py (accessed on 1 January 2023).
- MobileNet-V3 Small Model. Available online: https://github.com/topics/mobilenetv3-small (accessed on 3 January 2023).
- Bi, L.; Kim, J.; Kumar, A.; Feng, D.; Fulham, M. Synthesis of positron emission tomography (PET) images via multi-channel generative adversarial networks (GANs). In Molecular Imaging, Reconstruction and Analysis of Moving Body Organs, and Stroke Imaging and Treatment, Proceedings of the Fifth International Workshop, CMMI 2017, Second International Workshop, RAMBO 2017, and First International Workshop, SWITCH 2017, Held in Conjunction with MICCAI 2017, Québec City, QC, Canada, 14 September 2017; Springer International Publishing: Cham, Switzerland, 2017; pp. 43–51. [Google Scholar]
- Abid, A.; Sinha, P.; Harpale, A.; Gichoya, J.; Purkayastha, S. Optimizing medical image classification models for edge devices. In Distributed Computing and Artificial Intelligence, Volume 1: 18th International Conference; Springer International Publishing: Cham, Switzerland, 2022; pp. 77–87. [Google Scholar]
- Dominik, M.; Soto-Rey, I.; Kramer, F. Towards a guideline for evaluation metrics in medical image segmentation. BMC Res. Notes 2022, 15, 210. [Google Scholar]
- Ramin, H.; Lechner, M.; Amini, A.; Rus, D.; Grosu, R. Liquid time-constant networks. In Proceedings of the 2021 AAAI Conference on Artificial Intelligence, Virtual, 2–9 February 2021; Volume 35, pp. 7657–7666. [Google Scholar]
Figure 1.
The proposed LC detection framework.

Figure 2.
Sample images.

Figure 3.
The proposed feature extraction process.

Figure 4.
Findings of the performance analysis in the multiple epochs.

Figure 5.
Findings of the multi-class classification.


Table 1.
Dataset characteristics.
| Types of LC | Patients | Annotated Images |
|---|---|---|
| A | 266 | 20,894 |
| B | 44 | 3116 |
| E | 5 | 201 |
| G | 62 | 7351 |
Table 2.
Model development settings.
| Parameters | Value |
|---|---|
| Image dimension | 512 × 512 |
| Convolutional layers | 4 |
| Size of strides | 2 |
| Activation function | Softmax |
| Loss function | Cross-Entropy |
| Batch Size | 256 |
| Fully connected layer | 1 |
Table 3.
Findings of hyper-parameter optimization.
| Hyperparameter Optimization | Accuracy | Precision | Recall | F1-Score | Kappa |
|---|---|---|---|---|---|
| AO-based Proposed LC detection model | 98.6 | 97.9 | 98.1 | 98.0 | 95.8 |
| Adagrad-based Proposed LC detection model | 97.1 | 96.1 | 96.3 | 96.2 | 94.2 |
| RMSProp-based Proposed LC detection model | 96.8 | 96.9 | 96.5 | 96.7 | 95.3 |
Table 4.
Computational settings.
| Models | Learning Rate | Parameters (in Millions (m)) | FLOPs (in Millions (m)) | Training Time (in Seconds (s)) |
|---|---|---|---|---|
| Proposed LC detection model | 1 | 2.1 | 176 | 128 |
| DenseNet-121 model | 1 | 8.3 | 679 | 187 |
| Barbouchi et al. model [34] | 1 | 9.2 | 892 | 372 |
| El-Hamdi et al. model [35] | 1 | 18.3 | 912 | 486 |
| Goswami and Singh model [38] | 1 | 16.2 | 872 | 332 |
| EfficientNet model | 1 | 4.8 | 496 | 386 |
| ShuffleNet model | 1 | 3.2 | 276 | 512 |
Table 5.
Findings of the batch-wise performance evaluation.
| Batch Size | Accuracy | Precision | Recall | F1-Score | Kappa |
|---|---|---|---|---|---|
| 60 | 95.3 | 94.8 | 94.3 | 94.5 | 91.2 |
| 130 | 97.1 | 96.2 | 96.4 | 96.3 | 93.4 |
| 180 | 98.4 | 96.8 | 96.7 | 96.7 | 94.6 |
| 256 | 98.6 | 97.9 | 98.1 | 98.0 | 95.8 |
Table 6.
Findings of the performance evaluation.
| Types of LC | Accuracy | Precision | Recall | F1-Score | Kappa |
|---|---|---|---|---|---|
| A | 98.6 | 97.8 | 97.5 | 97.6 | 96.1 |
| B | 98.6 | 97.6 | 97.7 | 97.6 | 95.8 |
| E | 98.8 | 98.1 | 98.5 | 98.3 | 96.1 |
| G | 98.5 | 98.3 | 98.7 | 98.5 | 95.4 |
| Average | 98.6 | 97.9 | 98.1 | 98.0 | 95.8 |
Table 7.
Comparative analysis outcome.
| Models | Accuracy | Precision | Recall | F1-Score | Kappa |
|---|---|---|---|---|---|
| Proposed LC detection model | 98.6 | 97.9 | 98.1 | 98.0 | 95.8 |
| DenseNet-121 model | 96.4 | 96.7 | 96.8 | 96.7 | 93.8 |
| Barbouchi et al. model [34] | 97.0 | 96.7 | 96.5 | 96.6 | 94.7 |
| El-Hamdi et al. model [35] | 97.5 | 97.2 | 97.4 | 97.3 | 95.7 |
| Goswami and Singh model [38] | 96.8 | 97.6 | 97.3 | 97.4 | 96.1 |
| EfficientNet model | 97.5 | 96.9 | 96.7 | 96.8 | 95.1 |
| ShuffleNet model | 96.7 | 97.2 | 97.5 | 97.3 | 95.4 |
Table 8.
Findings of the AU-ROC, AU-PRC, and loss analysis with SD and CI.
| Models | Loss | AU-ROC | AU-PRC | SD | CI |
|---|---|---|---|---|---|
| Proposed LC detection model | 0.89 | 0.98 | 0.98 | 0.0002 | [98.1–98.5] |
| DenseNet-121 model | 1.13 | 0.97 | 0.96 | 0.0003 | [96.7–97.4] |
| Barbouchi et al. model [34] | 1.02 | 0.97 | 0.97 | 0.0004 | [96.7–97.4] |
| El-Hamdi et al. model [35] | 0.95 | 0.97 | 0.96 | 0.0003 | [97.5–98.1] |
| Goswami and Singh model [38] | 1.12 | 0.96 | 0.95 | 0.0004 | [96.4–96.8] |
| EfficientNet model | 0.99 | 0.97 | 0.97 | 0.0005 | [97.1–97.6] |
| ShuffleNet model | 0.89 | 0.97 | 0.96 | 0.0004 | [96.7–97.1] |
Disclaimer/Publisher’s Note: The statements, opinions and data contained in all publications are solely those of the individual author(s) and contributor(s) and not of MDPI and/or the editor(s). MDPI and/or the editor(s) disclaim responsibility for any injury to people or property resulting from any ideas, methods, instructions or products referred to in the content. |
© 2023 by the author. Licensee MDPI, Basel, Switzerland. This article is an open access article distributed under the terms and conditions of the Creative Commons Attribution (CC BY) license (https://creativecommons.org/licenses/by/4.0/).
Share and Cite
MDPI and ACS Style
Wahab Sait, A.R. Lung Cancer Detection Model Using Deep Learning Technique. Appl. Sci. 2023, 13, 12510. https://doi.org/10.3390/app132212510
AMA Style
Wahab Sait AR. Lung Cancer Detection Model Using Deep Learning Technique. Applied Sciences. 2023; 13(22):12510. https://doi.org/10.3390/app132212510
Chicago/Turabian StyleWahab Sait, Abdul Rahaman. 2023. "Lung Cancer Detection Model Using Deep Learning Technique" Applied Sciences 13, no. 22: 12510. https://doi.org/10.3390/app132212510
Note that from the first issue of 2016, this journal uses article numbers instead of page numbers. See further details here.