Review

Event Knowledge Graph: A Review Based on Scientometric Analysis

1
School of Geomatics and Urban Spatial Informatics, Beijing University of Civil Engineering and Architecture, 1 Zhanlanguan Road, Beijing 102616, China
2
Key Laboratory of Urban Spatial Informatics, Ministry of Natural Resources of the People’s Republic of China, 15 Yongyuan Road, Beijing 102616, China
3
School of Information Engineering, China University of Geosciences, No. 29, Xueyuan Road, Haidian District, Beijing 100083, China
4
Department of Civil Engineering, Toronto Metropolitan University, 350 Victoria Street, Toronto, ON M5B 2K3, Canada
*
Author to whom correspondence should be addressed.
Appl. Sci. 2023, 13(22), 12338; https://doi.org/10.3390/app132212338
Submission received: 27 September 2023 / Revised: 31 October 2023 / Accepted: 8 November 2023 / Published: 15 November 2023
(This article belongs to the Special Issue Knowledge Graphs: State-of-the-Art and Applications)

Abstract

:
In the last decade, the event knowledge graph field has received significant attention from both academic and industry communities, leading to the proliferated publication of numerous scientific papers in diverse journals, countries, and disciplines. However, a comprehensive and systematic survey of the recent literature in this area to obtain how the development of event knowledge graph evolves over time is lacking. To address this gap, we performed scientometric analyses utilizing the CiteSpace software of version 6.2.R4 package to extract and analyze data from the Web of Science database, including information about authors, journals, countries, and keywords. We then constructed four networks, including the author co-citation network, journal co-citation network, collaborative country network, and keyword co-occurrence network. Analyzing these networks allowed us to identify core authors, research hotspots, landmark journals, and national collaborations, as well as emerging trends by assessing the central nodes and nodes with strong citation bursts. Our contribution mainly lies in providing a scientometric way to quantitatively capture the research patterns in the last decade in the event knowledge graph field. Our work provides not only a structured view of the state-of-the-art literature but also insights into future trends in the event knowledge graph field, aiding researchers in conducting further research in this area.

1. Introduction

An event or a group of events involves multiple actors at a specific place and time [1], which usually take the indicators to capture meaningful information in the dynamic world. As knowledge graph technology emerges, many researchers from a variety of fields have leveraged knowledge graph for event-related studies to compose different types of event knowledge graphs, focusing on modeling the correlation among events as well as monitoring the event evolution process. An event knowledge graph is a knowledge base constructed through taking events as the basic units and describing event information and various relationships among events. In the event knowledge graph, the nodes represent events and their attributes (e.g., occurring time, place, and participants) and the edges represent the relationships between events, such as time sequence relationship, causality relationship, sub-event relationship, and co-reference relationship. For instance, as shown in Figure 1, a typhoon event knowledge graph involves a number of roles, such as people, atmospheric environment, facilities, and landforms, all of which and their attributes act as nodes. As a building is a type of facility, there exist sub-event relationships (i.e., contains) between facilities and the building. The collapse of a building causes injuries and deaths, indicating that a causality relationship (i.e., causes) exists between the collapse of a building and injuries sustained by people. In addition, the typhoon disaster information in a certain space and time can be retrieved for decision support based on knowledge mining and knowledge reasoning. As such, an event knowledge graph provides a reliable basis for applications such as intelligent question-and-answer systems and decision analysis [2].
In order to provide an insightful overview of the event-knowledge-graph-related studies, some review papers have been published in recent years. Most of them either survey part of the event knowledge graph, such as summarizing the event extraction technologies [3], or focus on the construction technology and application of the event knowledge graph [2]. The most comprehensive one was proposed by Guan et al. [4], which summarized and discussed the event-knowledge-graph-relevant studies from four different views, i.e., a history view, ontology view, instance view, and application view. However, there is a lack of a review paper surveying the event-knowledge-graph-related studies to obtain how this field evolves over time (e.g., influential authors, journals, and institutions).
Scientometrics is concerned with measuring and analyzing the scholarly literature, focusing on the quantitative analysis of the “science of science” [5]. Fortunato et al. [6] explained the “science of science” as exploring the universal patterns as well as the domain-specific patterns (e.g., evolution patterns, system architecture, and performing mechanism) based on a large amount of scientific data. Accordingly, employing a scientometric analysis for a literature survey allows us to quantitatively analyze and map patterns in the scientific literature in order to understand the research topics, emerging trends, and knowledge structure of the surveyed field.
With the aim of filling the aforementioned gap, we collected the relevant publications from the Web of Science (WoS) database, based on which the scientometric analysis was conducted using the CiteSpace software of version 6.2.R4 package. The research networks, including the author co-citation network, journal co-citation network, collaborative country network, and keyword co-occurrence network, were generated and analyzed in order to obtain future trends, development history, and future directions. The findings are beneficial for those who have an intention to capture a full picture of the event knowledge graph field.
The rest of the paper is structured as follows. Section 2 introduces the background knowledge related to event-graph-related technologies. Section 3 briefly describes the methodology for the scientometric analysis adopted in this study. The results are analyzed and discussed in Section 4. Section 5 draws some conclusions.

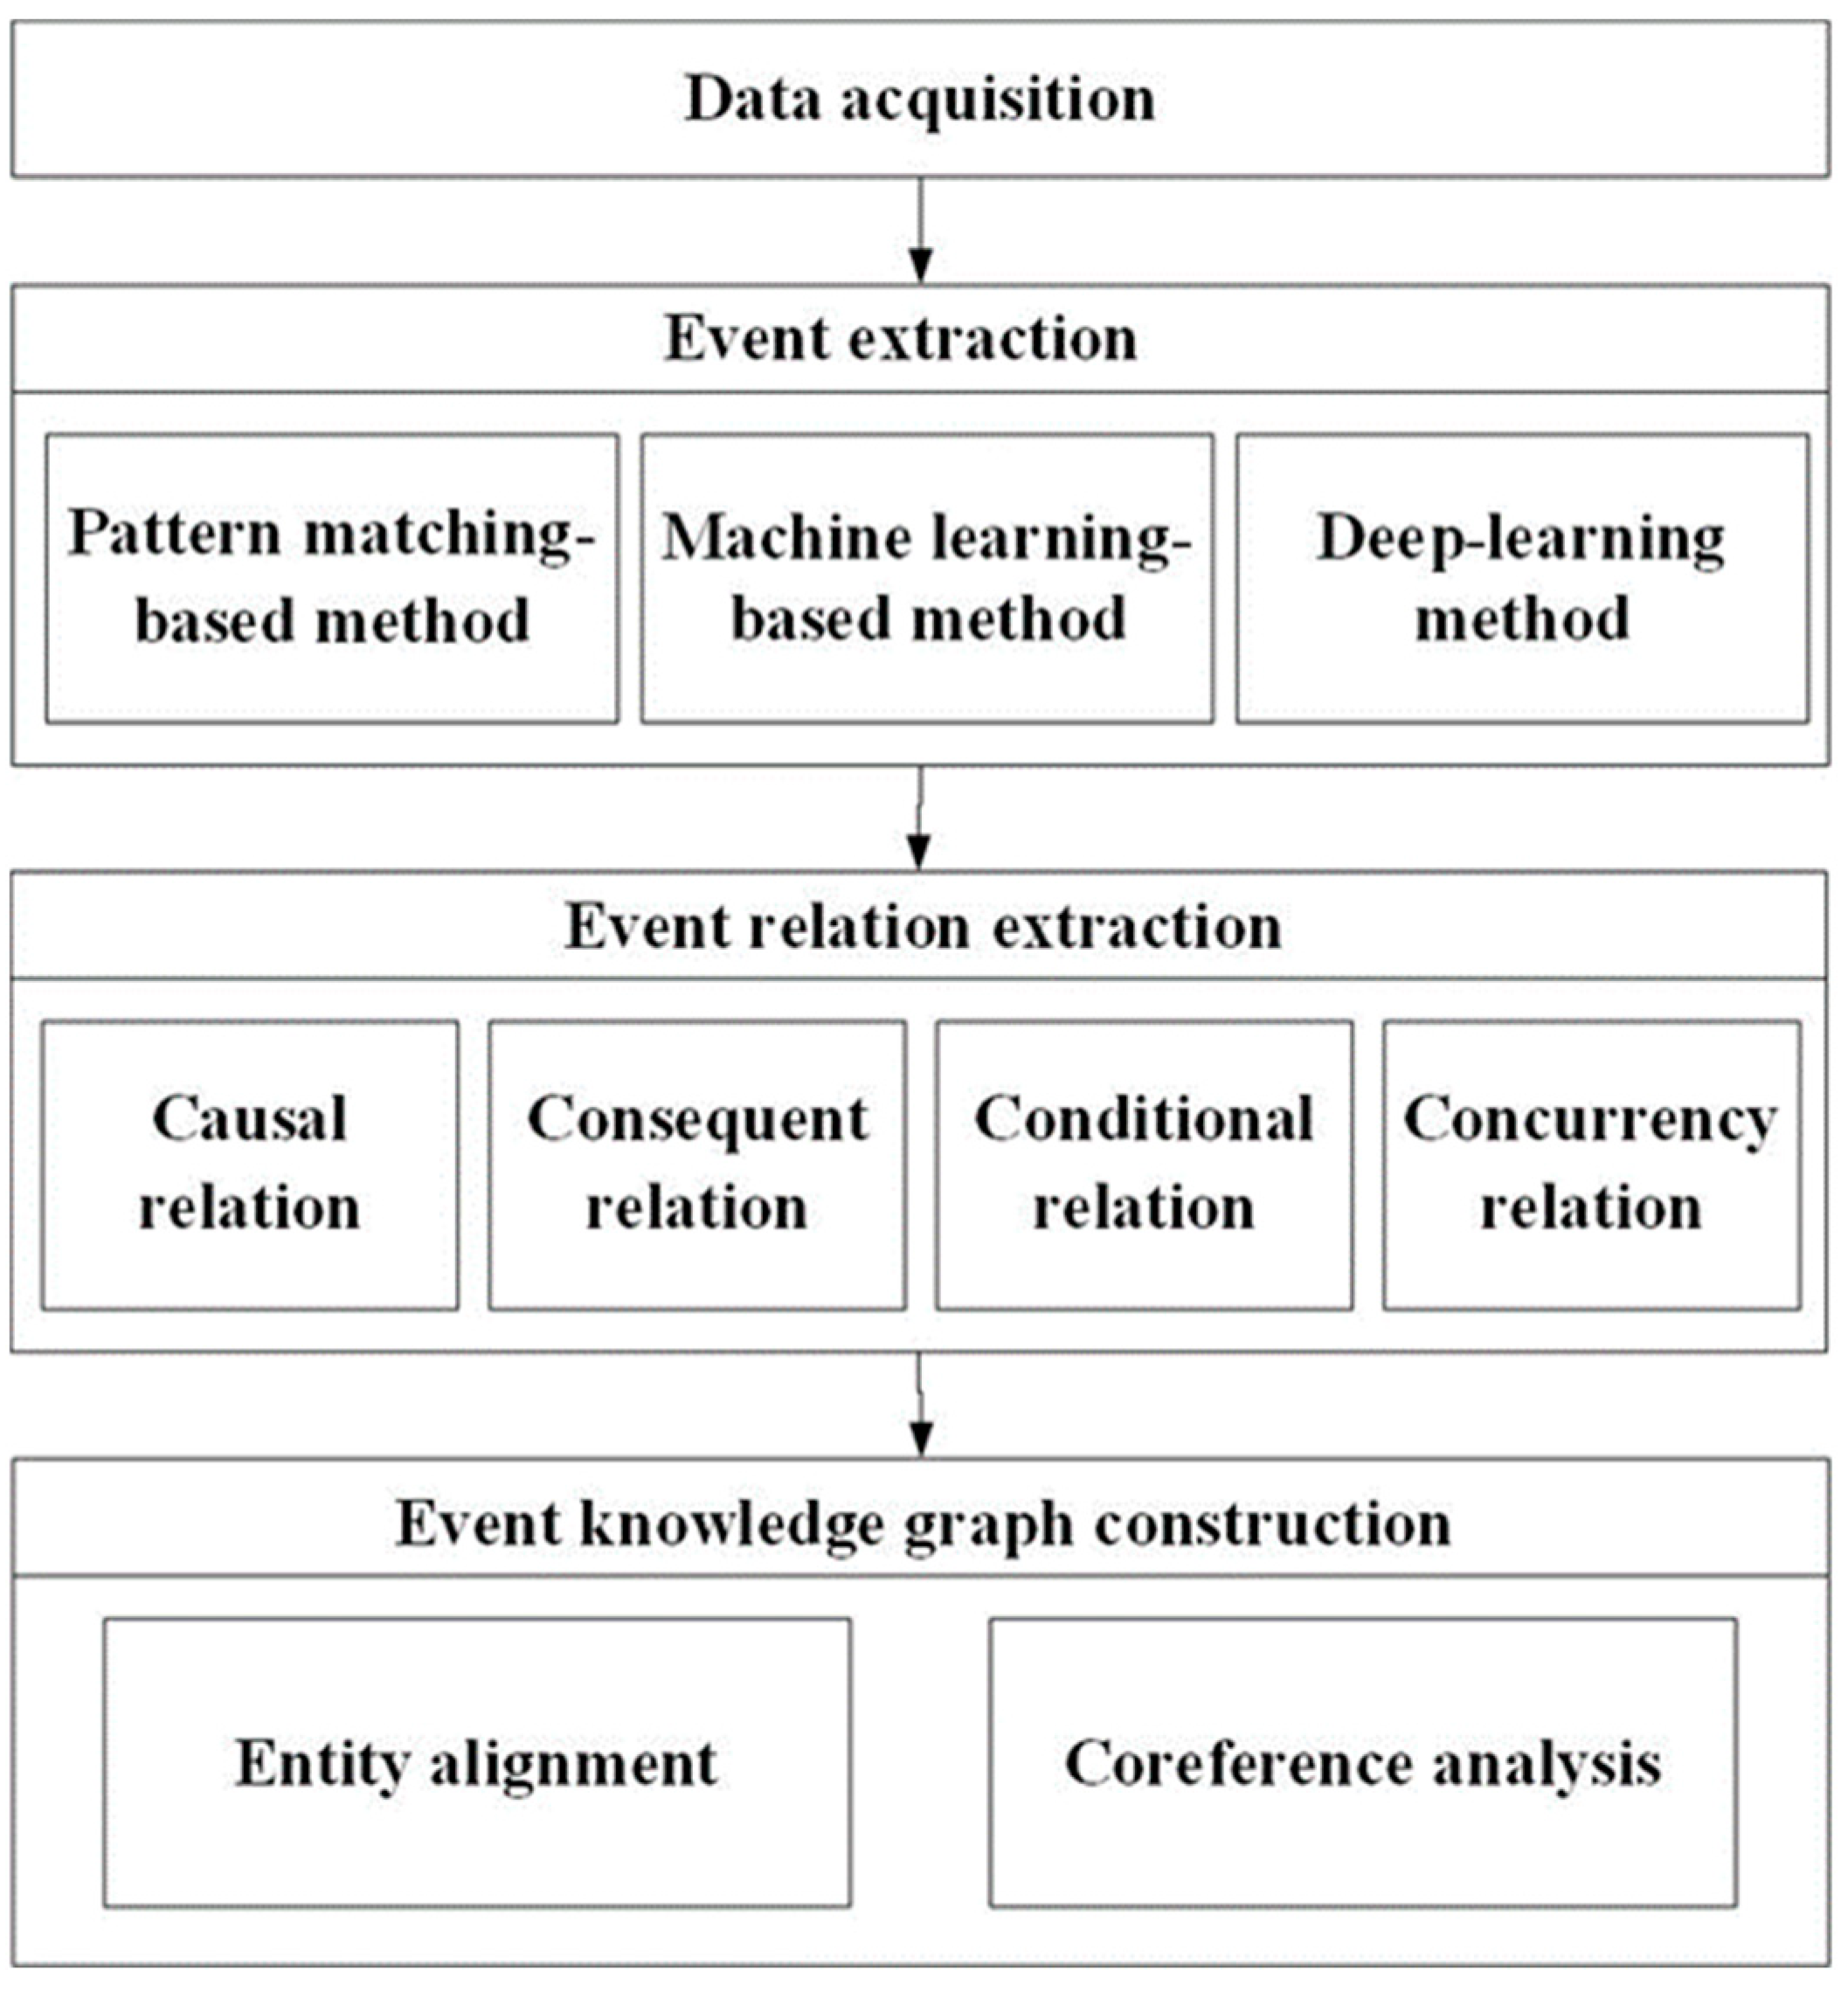
2. Background Knowledge

This section provides insights into the background knowledge of the event knowledge graph. The general workflow of constructing an event knowledge graph is presented in Figure 2. It mainly includes data acquisition, event extraction (i.e., composing the nodes in the graph), and event relation extraction (i.e., composing the edges in the graph). More details regarding each step are introduced in the following sections. Since the textual data extracted from news websites, books, reports, etc., have been mostly used for event knowledge graph construction, we mainly focused on providing the general background knowledge concerning textual data analysis for event knowledge graph research in this section. Other technologies such as image processing technology are not included due to the limited space, but they are involved in multiple types of network analysis in Section 3 and Section 4 to capture the overall research development in the event knowledge graph field.

2.1. Data Acquisition

To effectively extract events and event relationships, multiple data sources have been used in the existing studies. They can be obtained through downloading directly, web crawling, and application programming interfaces (APIs). Table 1 lists 10 public datasets that can be directly downloaded for event knowledge graph construction, including the year when they were first available, the research fields they support, the language they are in, and a brief introduction. The datasets cover a wide range of fields, including disasters, network security, and news forums. The majority of them are textual data, which involve abundant information for entity and relationship extraction to compose event knowledge graphs. Despite that, the event information, such as occurring time, occurring place, and event content, can be extracted from news websites (e.g., BBC News, Sina News, and Sohu News) by leveraging web crawling technologies. As mobile phones and Internet of Things (IoT) devices emerge, people are able to post what they witness and experience on various platforms (e.g., social media platforms like Twitter and Sina Weibo) anytime and anywhere. As such, both real-time and historical event-related information can be collected with certain criteria (e.g., setting spatial extent or keywords) through the provided APIs either for free or at a cost. The collected data lay a solid foundation for event knowledge graph construction, providing abundant spatial, temporal, and semantic sources to extract event entities and relations.

2.2. Event Extraction

Based on the structured, semi-structured, and unstructured data, the events can be extracted using a pattern-matching-based method, machine-learning-based method, and deep-learning method. The extracted events constitute the nodes of an event knowledge graph.
The pattern-matching-based method extracts events based on specifically defined patterns, which can be acquired through text analysis (e.g., lexical analysis and syntactic analysis) with domain knowledge. The target data are then matched with the corresponding patterns to detect and extract a certain type of event. In the very beginning, the supervised learning method was combined with manually labeling corpus to construct a domain-specific model for event extraction [7,8]. To reduce labor costs, some weakly supervised learning methods were proposed to extract events, where only a small number of patterns were required to be manually predefined, and new patterns were incrementally learned from either the original corpus or the external knowledge base (e.g., WordNet) [9,10,11]. The pattern-matching-based method is effective for domain-specific event extraction, but it is difficult for the formulated model to cover all event types.
The machine-learning-based method is based on statistical learning, which transforms the event extraction task into a classification problem and selects appropriate features input into classifiers to complete the extraction task. Chieu et al. [12] first applied the maximum entropy model and defined simple features (e.g., named entities and time expressions) to build a classifier to extract events from lecture announcements. The semantic role features as well as global features were input into the Conditional Random Field (CRF) model for event extraction and achieved good results on the TimeML event dataset [13,14]. Ahn [15] combined two machine learning models, i.e., the K-Nearest Neighbors (KNN) model and the maximum entropy model, to build a classifier for each module, using features such as lexical features, context features, and dependency features to complete each subtask. The machine-learning-based method involves a complex process, including feature engineering and natural language processing, which may result in the accumulation and propagation of errors that negatively affect the extraction results.
Compared with the pattern-matching-based method and the machine-learning-based method, the deep-learning-based method directly transfers data to the constructed network to extract events, which does not require manual feature engineering or domain expert knowledge. The strong portability and high flexibility have prompted more and more researchers to explore event extraction techniques based on deep learning in recent years. Chen et al. [16] described event extraction as a two-stage multi-classification task, including trigger word extraction and event entity extraction, where the Bidirectional Encoder Representations from Transformers (BERT) model, Long Short-Term Memory (LSTM) model, and Bidirectional Long Short-Term Memory (Bi-LSTM) model were adopted [17,18,19,20,21]. In order to leverage syntactic representations for connecting words with their informative contexts, the Graph Convolutional Networks (GCN) [22], Edge-enhanced GCN [23], Graph Transformer Networks [24], and Graph Edge-conditional Attention Networks with Hierarchical Knowledge Graphs [25] were introduced to detect events in sentences and they performed well on some test datasets (e.g., ACE2005). Instead of splitting the event extraction task into the above-mentioned two stages that may result in propagation errors, Nguyen et al. [26] proposed a joint model based on the Recurrent Neural Networks (RNN) to perform trigger word detection and event entity extraction. The joint models had been applied for detecting events in the legal field [27] and financial field [28]. Despite learning the patterns embedded in the sentences for event extraction, Du et al. [29] proposed a multi-grained model based on Bi-LSTM to dynamically fuse paragraph-level representations, where the dependency relationship between these two types of representations at different granularities was captured using the Conditional Random Fields (CRF) model. Huang and Peng [30] further improved the performance of capturing dependency relationships by introducing the Deep Value Network (DVN). Integrating sentence-level information with paragraph-level information to extract events has become one of the research hotspots in recent years, but research on the paragraph level is still immature, leaving a lot of room for exploration.

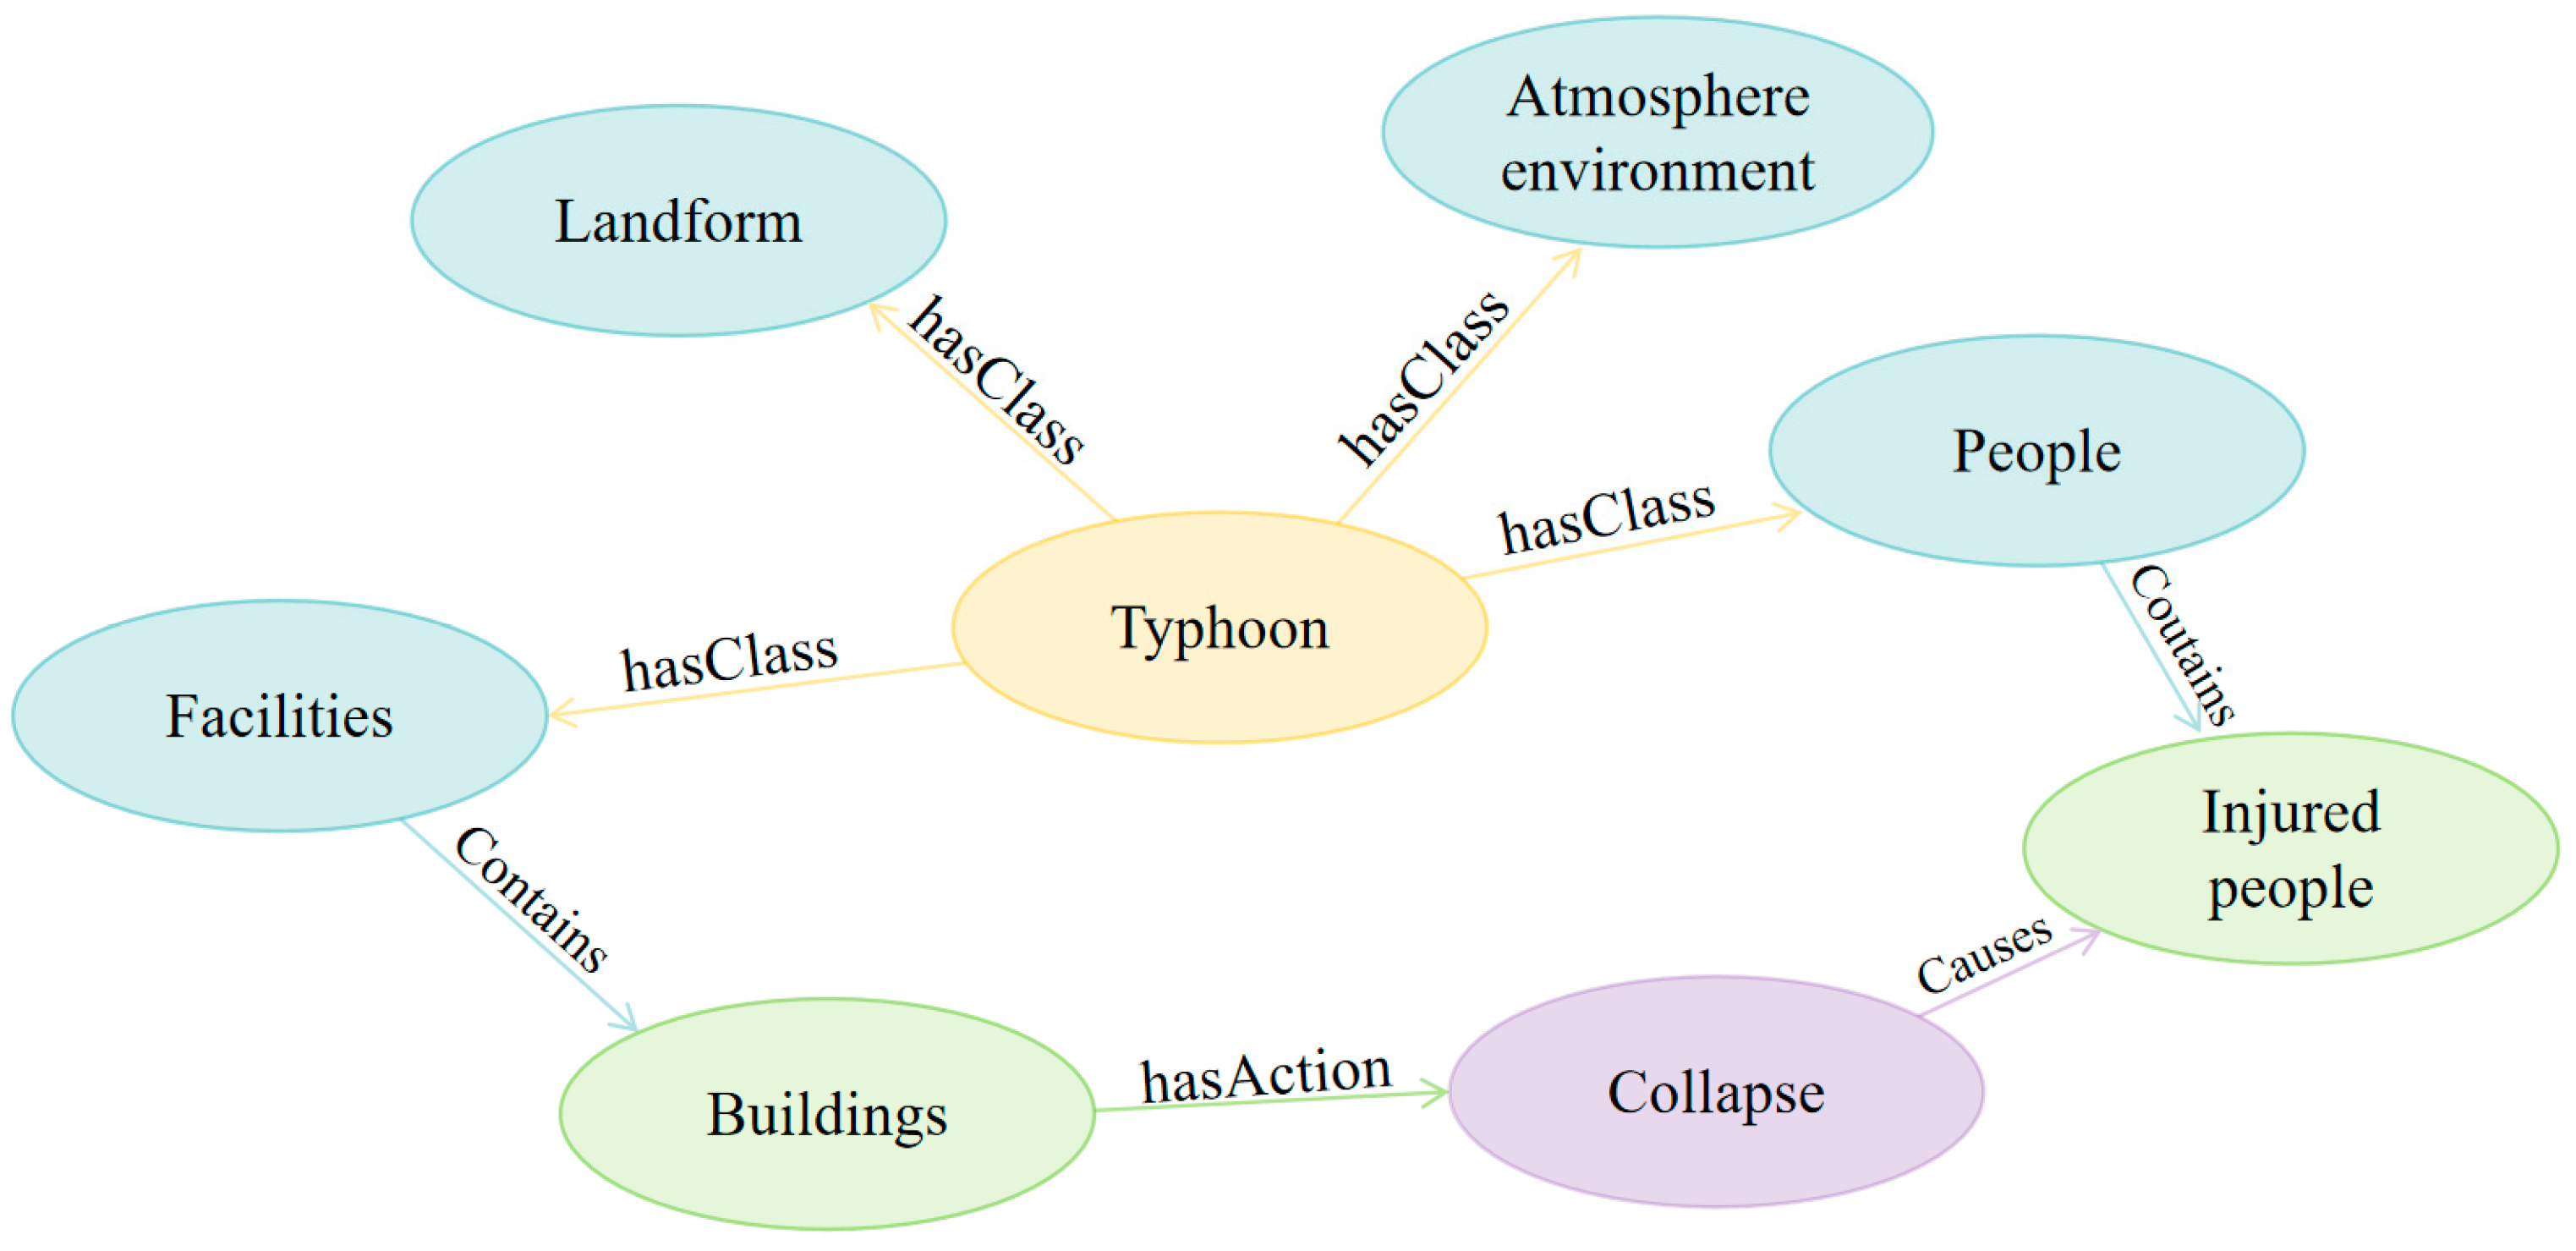
2.3. Event Relation Extraction
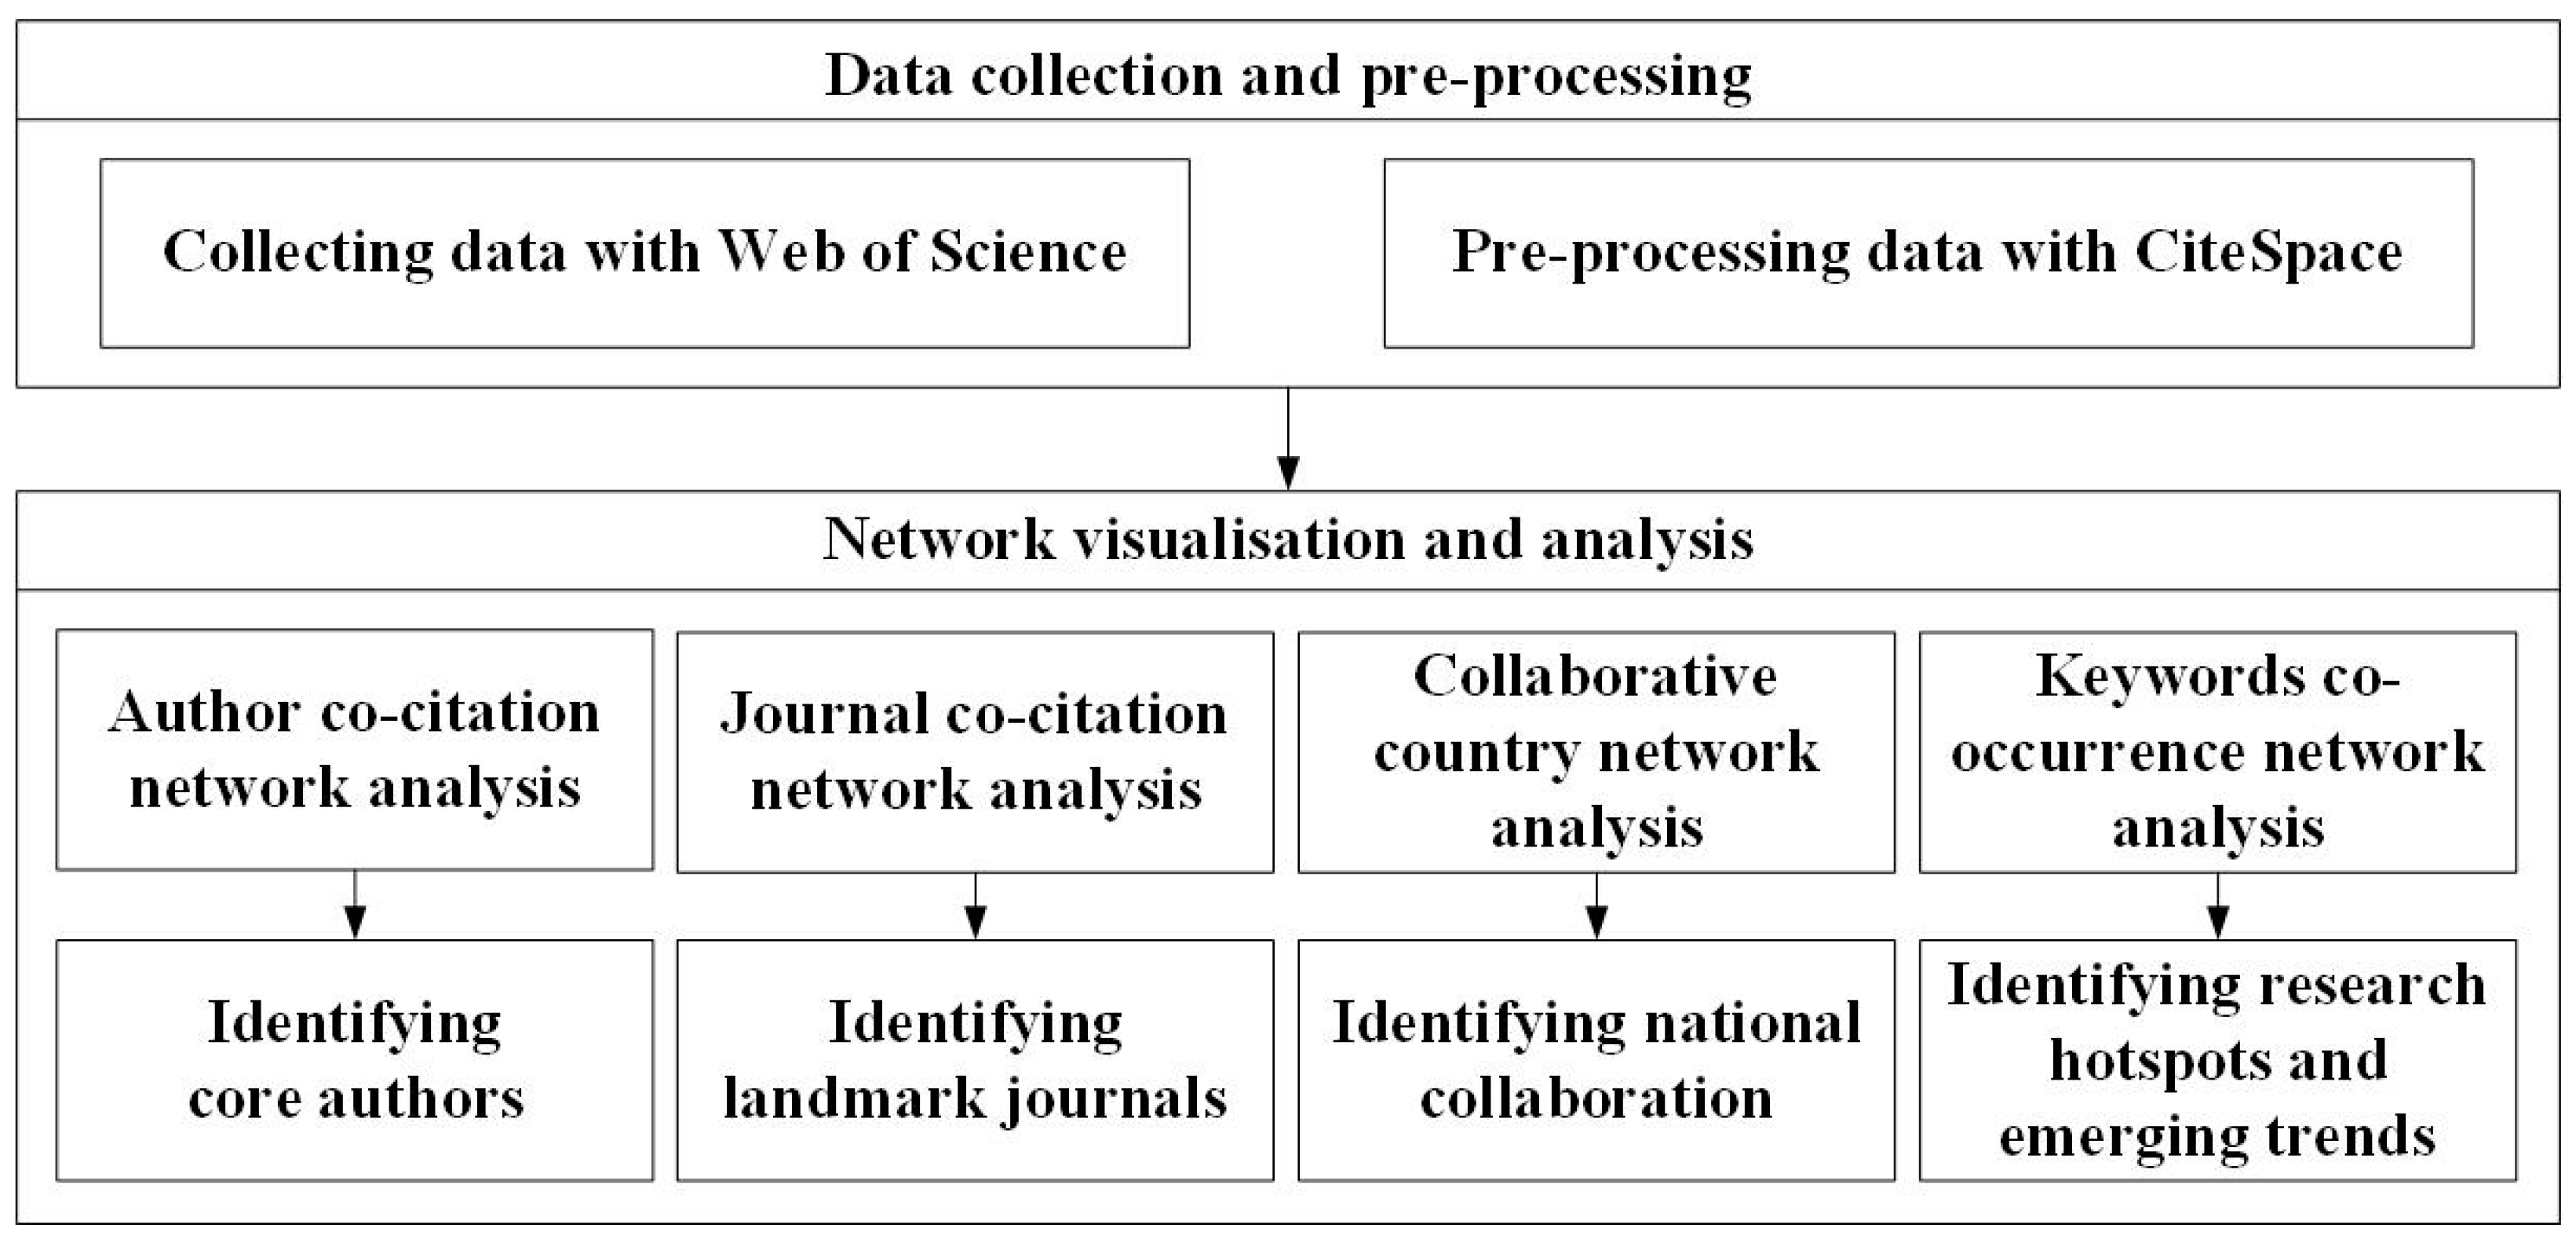
The relations among events are extracted to compose the edges connecting the nodes (i.e., event entities) in event knowledge graphs. Since the relations are various and complex, especially those expressed in natural language, the pattern-matching-based approach has been widely used for such purposes by predefining a set of specific phrases as constraint rules to extract event relations. Table 2 lists some commonly used types of event relations, their meaning, and the phases for extraction, including causal relation, consequent relation, conditional relation, and concurrency relation.
The pattern-matching-based method is easy to use, but it highly depends on human-made rules with less flexibility. As deep learning methods emerge, which show great potential for information mining, a number of deep learning models have been trained to extract and infer event relations in recent years. For instance, Liu et al. [31] incorporated the knowledge from the ConceptNet [32] and increased attention to contextual information, based on which an event mention masking mechanism was designed to uncover causal relationships in the historical text data. Experimental results showed that this method was effective and exhibited strong robustness in cross-subject applications. Cheng et al. [33] took the temporal relation extraction as a classification task that concatenated word vectors, part-of-speech vectors, and dependency relation vectors as features imported into the bidirectional Long Short-Term Memory (LSTM) model. Han et al. [34] proposed a joint-learning model that identified event entities and temporal relations at the same time by sharing event representations to reduce error transmission between the two steps. With the same purpose, an improved framework was constructed to enhance the performance of deep neural networks through the use of probability-based distribution constraints constructed using domain knowledge. This approach also applied the Lagrangian relaxation method to the task of temporal relation extraction, achieving optimal performance [35].
There may exist inconsistency, incompleteness, and redundancy among the extracted event entities and event relations. Measures such as entity alignment and coreference analysis are implemented to event knowledge fusion to finalize the event knowledge graph construction. The event knowledge graph G can be represented as G = (V, R), where V refers to a set of events and R refers to a set of event relations. The fused event knowledge can be organized as triples to be stored, managed, and visualized in a graph database (e.g., Neo4j database).

3. Methodology

Figure 3 illustrates the process of conducting the scientometric analysis of the literature in the field of “event knowledge graph”, which includes data collection, author co-citation network analysis, journal co-citation network analysis, collaborative country network analysis, and keyword co-occurrence network analysis. The documents to be analyzed were collected by setting a combination of fields (e.g., “Topic” = “event” And “Document type” = “review” And “Language” = “English”) as the conditions in searching the WoS database. The returned documents were further imported into CiteSpace to conduct the above-mentioned multiple-network analysis, based on which the representative scholars, core journals, hot research topics, and research trends in the event graph field can be identified. More details can be found in the following sections.

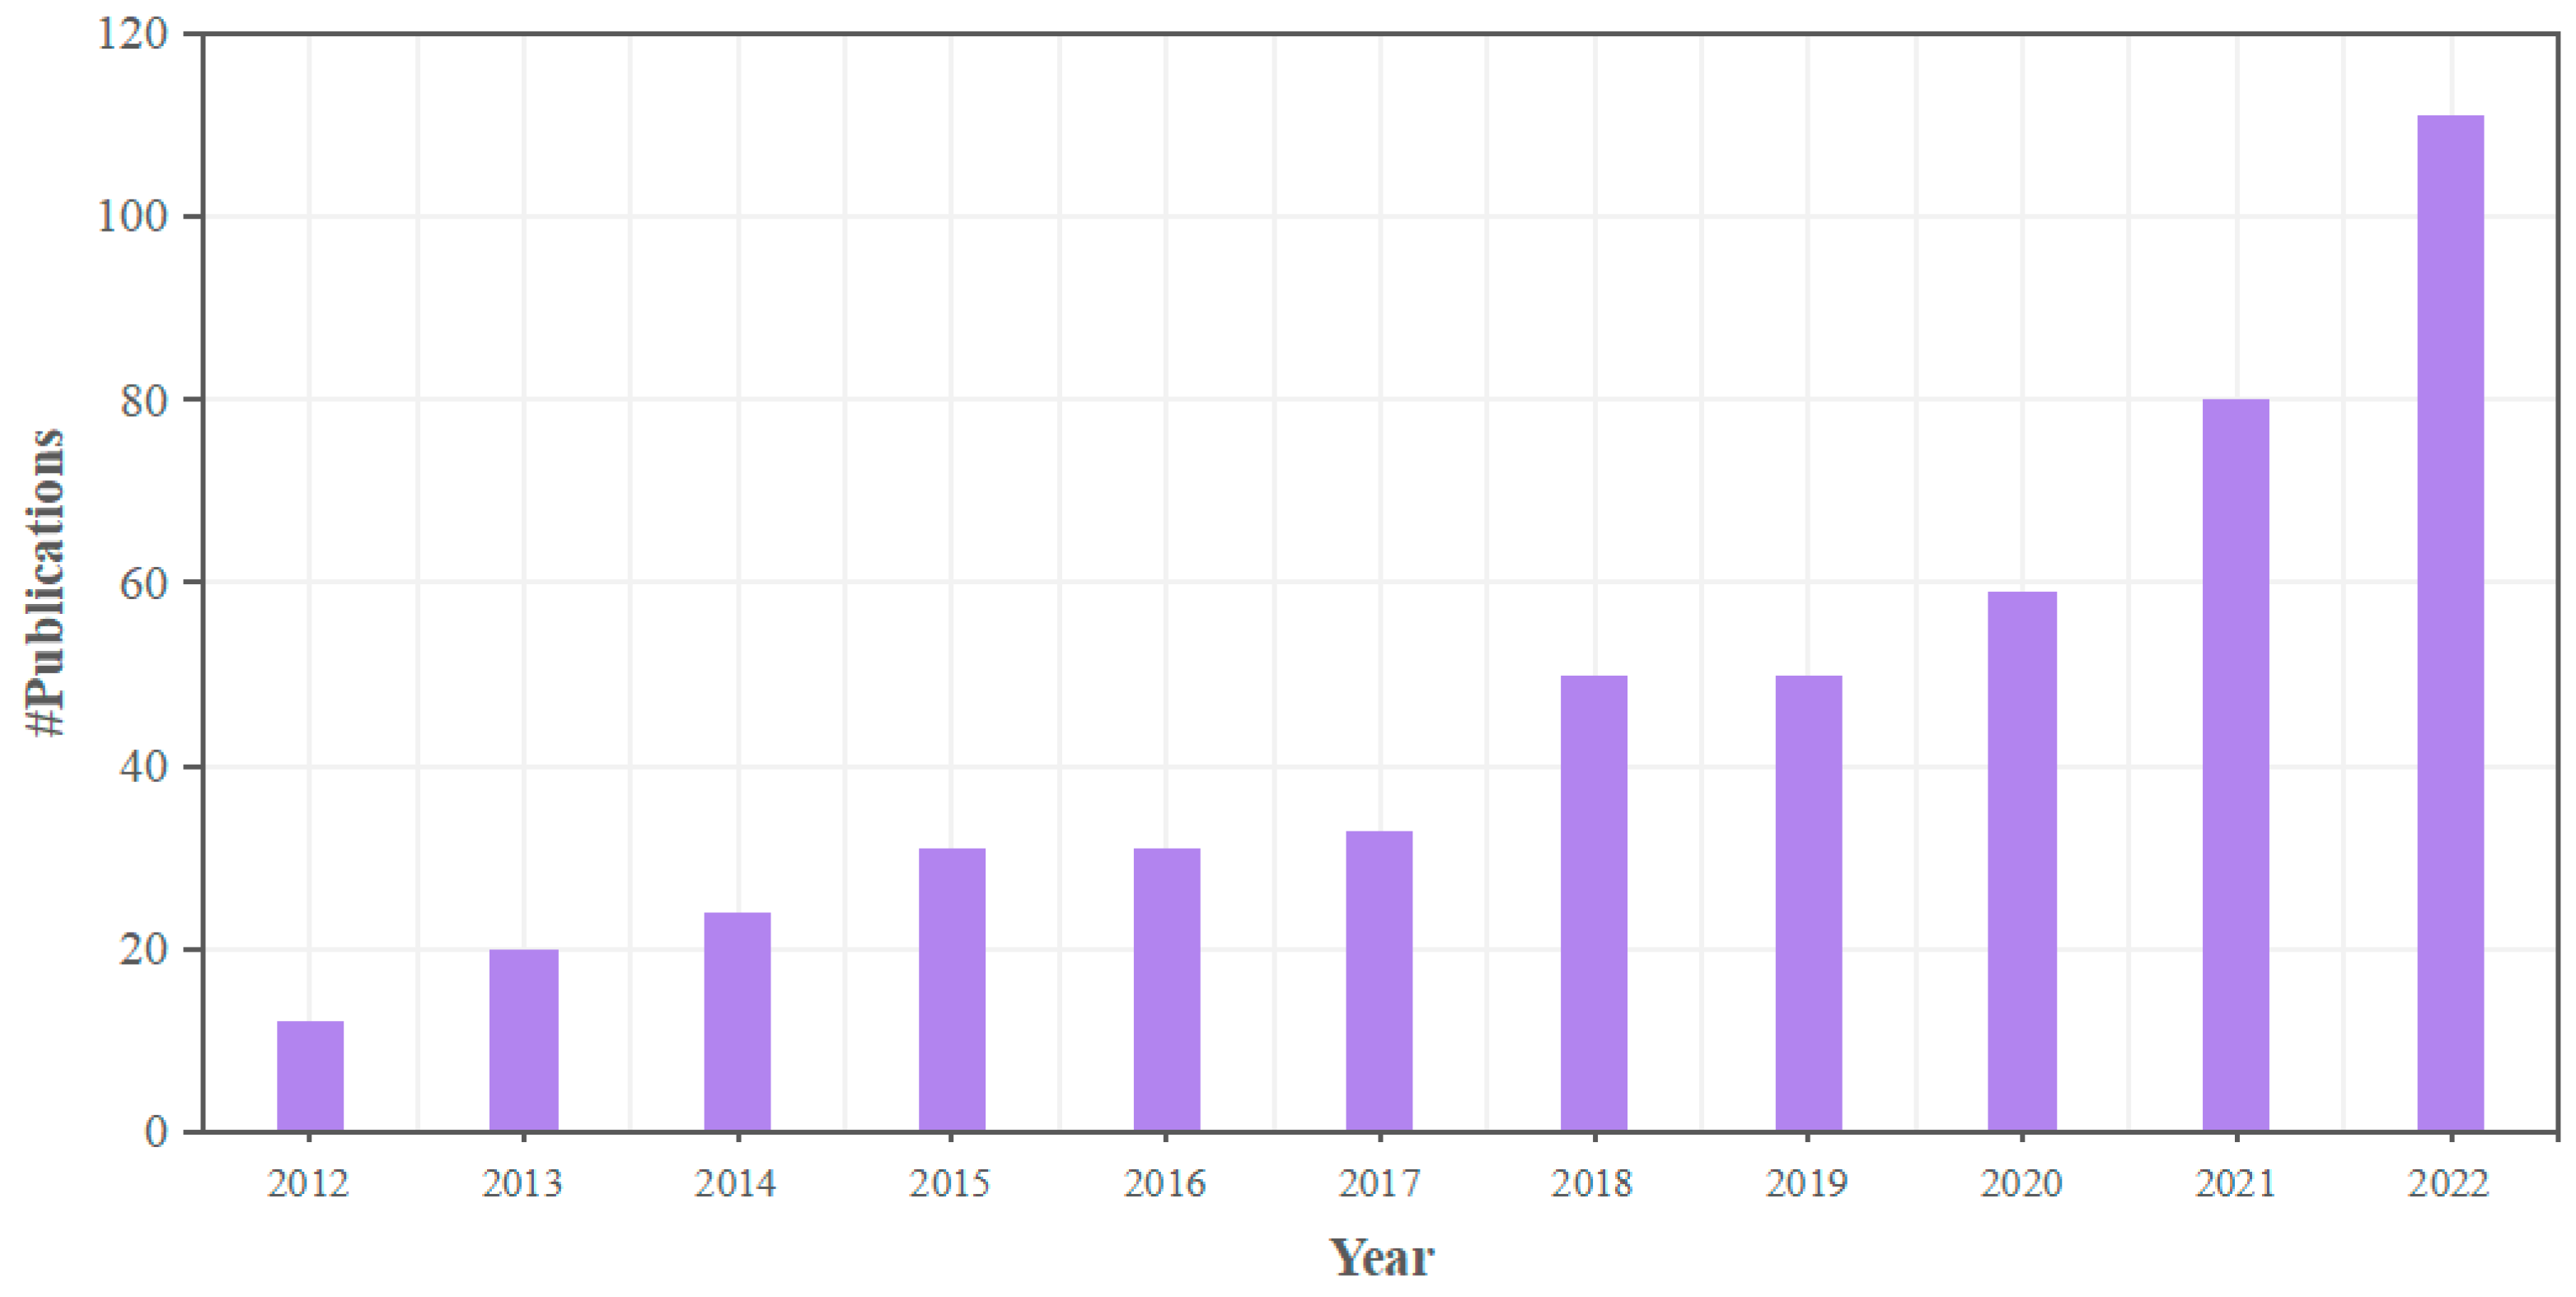
3.1. Data Collection

With the aim of investigating the development history and the future trends of the event knowledge graph in the last decade, we collected the documents on the Web of Science (WoS) that were published between 1 January 2012 and 31 December 2022. To perform a broad search, the filter was set to (Topic = (event graph *) OR (events graph)) for all literature. The language was selected as English and the content was set to full records and citations, with a total of 510 unique documents returned. Among all documents, 49.4% are papers, 45.2% are conference proceedings, 3.1% are online publications, 1.4% are conference abstracts, and 0.9% are book chapters. As conference abstracts and book chapters took a small proportion and were not significant in the following network analysis, we cleaned, de-weighted, and filtered the data and finally obtained 412 valid documents. Furthermore, we counted the number of publications per year to obtain an overview of how the research popularity of the event knowledge graph has changed over the past 10 years. Figure 4 shows a steady increase year by year, reflecting that the event knowledge graph has attracted more and more attention from scholars in recent years.

3.2. CiteSpace Tool for Scientometric Analysis

In this study, we selected the CiteSpace software of version 6.2.R4 to conduct the scientometric analysis of the documents obtained in Section 3.1, since it is an efficient tool developed by Java language that enables research network analysis and visualization [36]. A variety of networks can be built and analyzed ranging from co-occurrence networks to co-citation networks, including author co-citation networks, journal co-citation networks, collaborative country networks, and keyword co-occurrence networks in this work.
The co-citation networks refer to the fact that two documents have a co-citation relationship, i.e., they appear in the bibliography of another document. In this work, we conducted analysis of both the author co-citation network and the journal co-citation network. In these two networks, the nodes are set as cited authors and journals, respectively. The co-citation relationship between them is represented by the links between the nodes. Through constructing and analyzing those networks in CiteSpace, we can identify the representative nodes of great significance in these networks, e.g., core authors and influential journals.
The co-occurrence networks refer to the fact that collaboration exists if different countries or keywords are present in a paper at the same time. Each network consists of nodes and links. In a co-occurrence network generated through CiteSpace, the nodes are set to collaborating countries and keywords, respectively. The node size indicates the frequency with which an author, an institution, or a country publishes a paper. The interaction between them is represented by the link between a pair of nodes. The strength of their collaborative relationship is represented by the thickness of the link. In CiteSpace, the number of co-occurrences is a parameter for calculating the strength of collaborative relationships. Based on the help document of CiteSpace, the strength is computed by the cosine method, i.e.,:
C o s i n e c i j , s i , s j = c i j s i s j
where s i is the frequency of node i, s j is the frequency of j, and c i j is the number of co-occurrences of s i and s j . The cosine value is between 0 and 1, where the higher the cosine value, the higher the strength of a collaborative relationship. In this paper, we study and analyze collaborative country networks and keyword co-occurrence networks.
With regard to the visualization of the co-citation and co-occurrence networks, they are both color-based. The color of a link reflects the time slice when the co-occurrence or co-citation relationship was first created. The earliest years are in grey and purple, the middle ones are in green, and the most recent years are in orange and red.
Among all those aforementioned networks, betweenness centrality, citation frequency, and citation burst are usually used as effective metrics to quantitatively interpret the networks. The betweenness centrality of a node is the proportion of all geodesic lines (shortest paths) between pairs of other vertices including that vertex [37], the score of which falls between 0 and 1. The higher the betweenness centrality score, the greater the importance and influence of that node. To discriminate, we use circles to highlight the nodes with high betweenness centrality. The greater the thickness of the circle, the higher the betweenness centrality score. The citation frequency refers to the times of a node being cited in a certain period of time, based on which we can understand the influence of a node and its popularity in the event knowledge graph field. The greater the citation frequency of the node citations, the larger the node size, indicating that the node (e.g., author and journal) has received significant attention in a given time period. The citation in a particular time slice is represented by a single-color ring. Thus, the temporal citation patterns of a node are indicated by the concentric rings around it. The citation burst is defined as the burstiness (i.e., sudden increase) of the nodes with regard to its citation frequency over time [38,39]. If the number of citations of a node increases significantly in a certain period of time, it is marked as a “burst” node. In Citespace, the citation burst is detected based on the method proposed by Jon Michael Kleinberg in 2002 [39], which introduces the parameter γ ranging from 0 to 1 for burst detection. As γ is close to 0, it pays more attention to those nodes during short time intervals. While γ is close to 1, it considers all nodes more balanced, including those with longer time intervals. In this work, the γ was set as 1 in order to take all nodes into account for citation burst detection. The citation burstiness can help researchers grasp the research development trends.
In addition, we conducted cluster analysis for the author co-citation network and journal co-citation network to clarify the domain scope as well as the research hotspots and trends. In CiteSpace, the clustering analysis mainly adopts the spectral clustering method, which divides clusters into a number of groups based on co-occurrence relationships. Specifically, an affinity matrix describing the similarity of pairs of data points based on a given sample dataset is first defined, following which the eigenvectors of the matrix are calculated, and then different data points are clustered based on the eigenvectors. In this study, the generated clusters were labeled with a set of representative terms for interpretation, which were extracted from the noun phrases (e.g., titles, abstracts, and keywords) in the documents based on the log-likelihood ratio (LLR) algorithm that is provided by CiteSpace. With regard to cluster C j , the feature vector V i j is composed of the word w i frequency (α), concentration (β), and dispersion (γ). The label of the cluster is generated by calculating the LLR of each word based on the following equation.
L L R = l o g p ( C j \ V i j ) p ( C ¯ j \ V i j ) ,
where p C j \ V i j and p ( C ¯ j \ V i j ) are the density function of V i j in the cluster C j and C ¯ j , respectively. Those words with high LLR are the selected labels of the cluster.
The modularity (i.e., Q value) and silhouette (i.e., S value) are used as key indicators to help us understand the structural properties of the academic networks in the event knowledge graph field. The modularity of a network measures the extent to which a network can be decomposed into multiple components or modules. This metric provides a reference for the overall clarity of a given decomposition of the network [38]. A high Q value indicates that the nodes in the network are tightly connected within clusters and are sparsely connected with other clusters, namely the network has a pronounced grouping structure. The silhouette of a cluster measures the quality of a clustering configuration, and the S value ranges from −1 to 1 [38]. The higher the S value, the higher the homogeneity of the nodes within the cluster. A Q value over 0.3 and an S value over 0.7 are often desirable for network cluster analysis, meaning that the community structure of the network is significant and the clustering results have high confidence [40].

4. Results and Discussion

In this section, the results regarding the aforementioned four types of networks are analyzed, visualized, and discussed, including author co-citation network, journal co-citation network, collaborative country network, and keyword co-occurrence network.

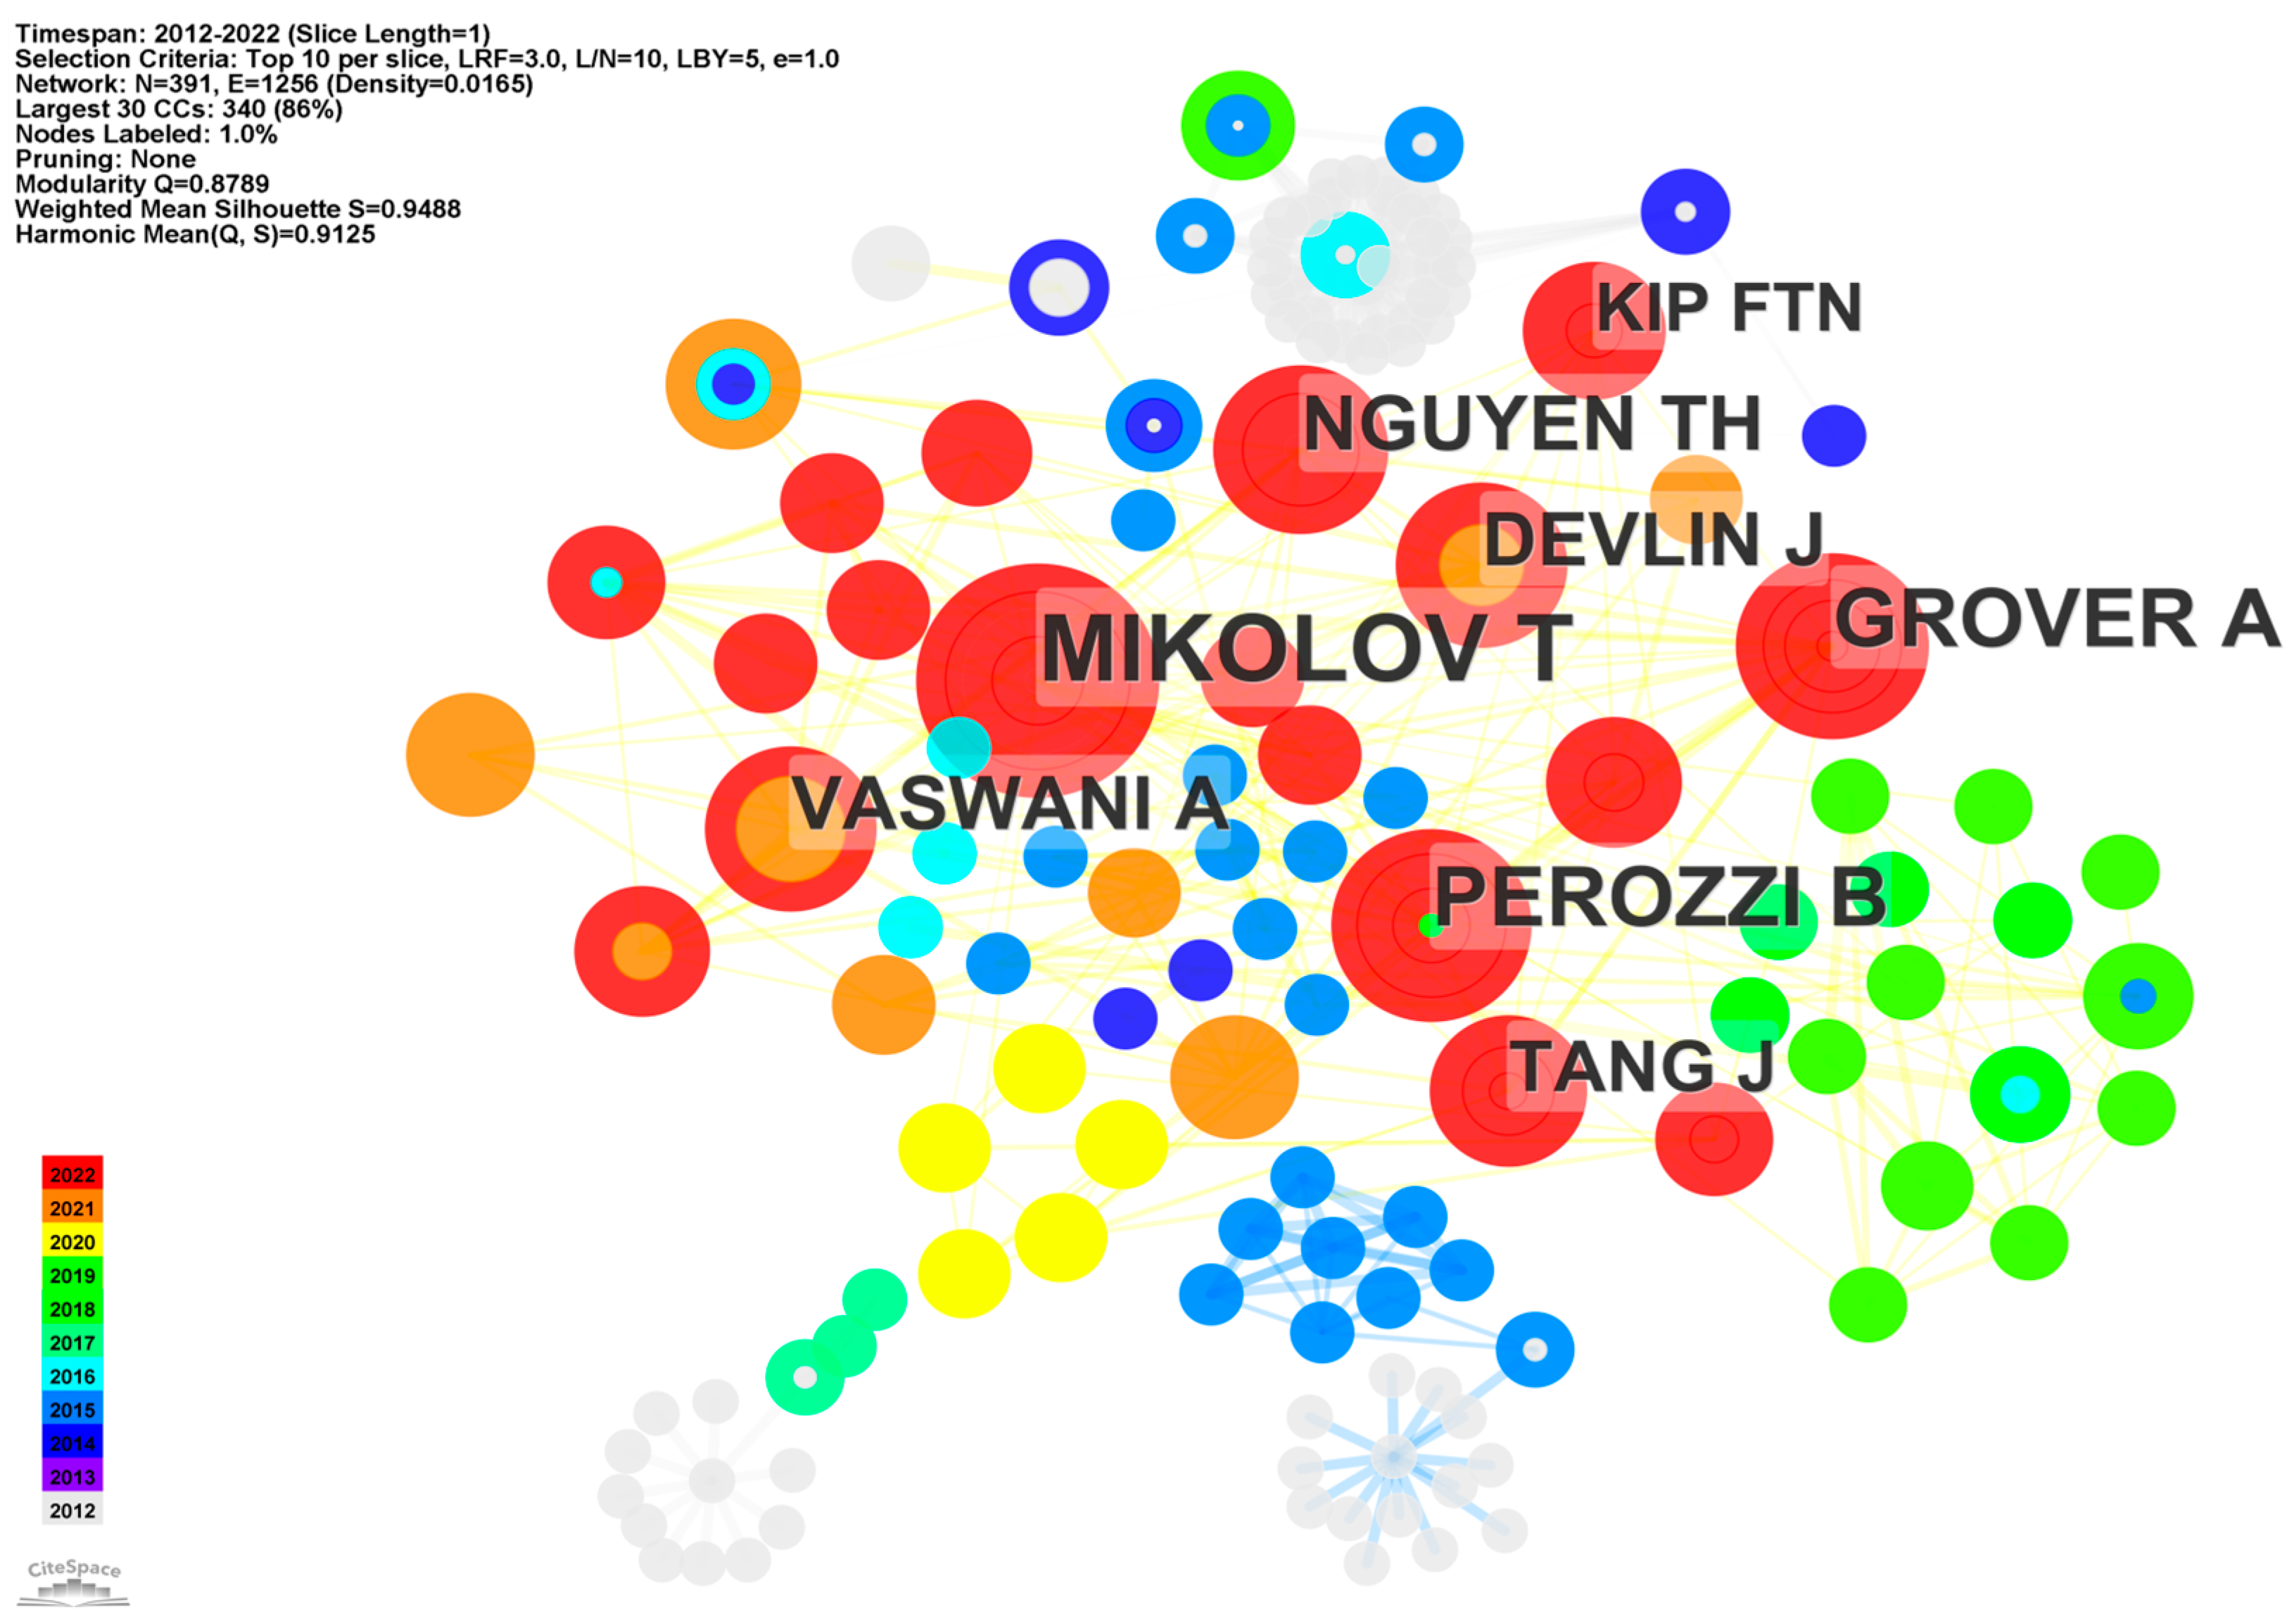
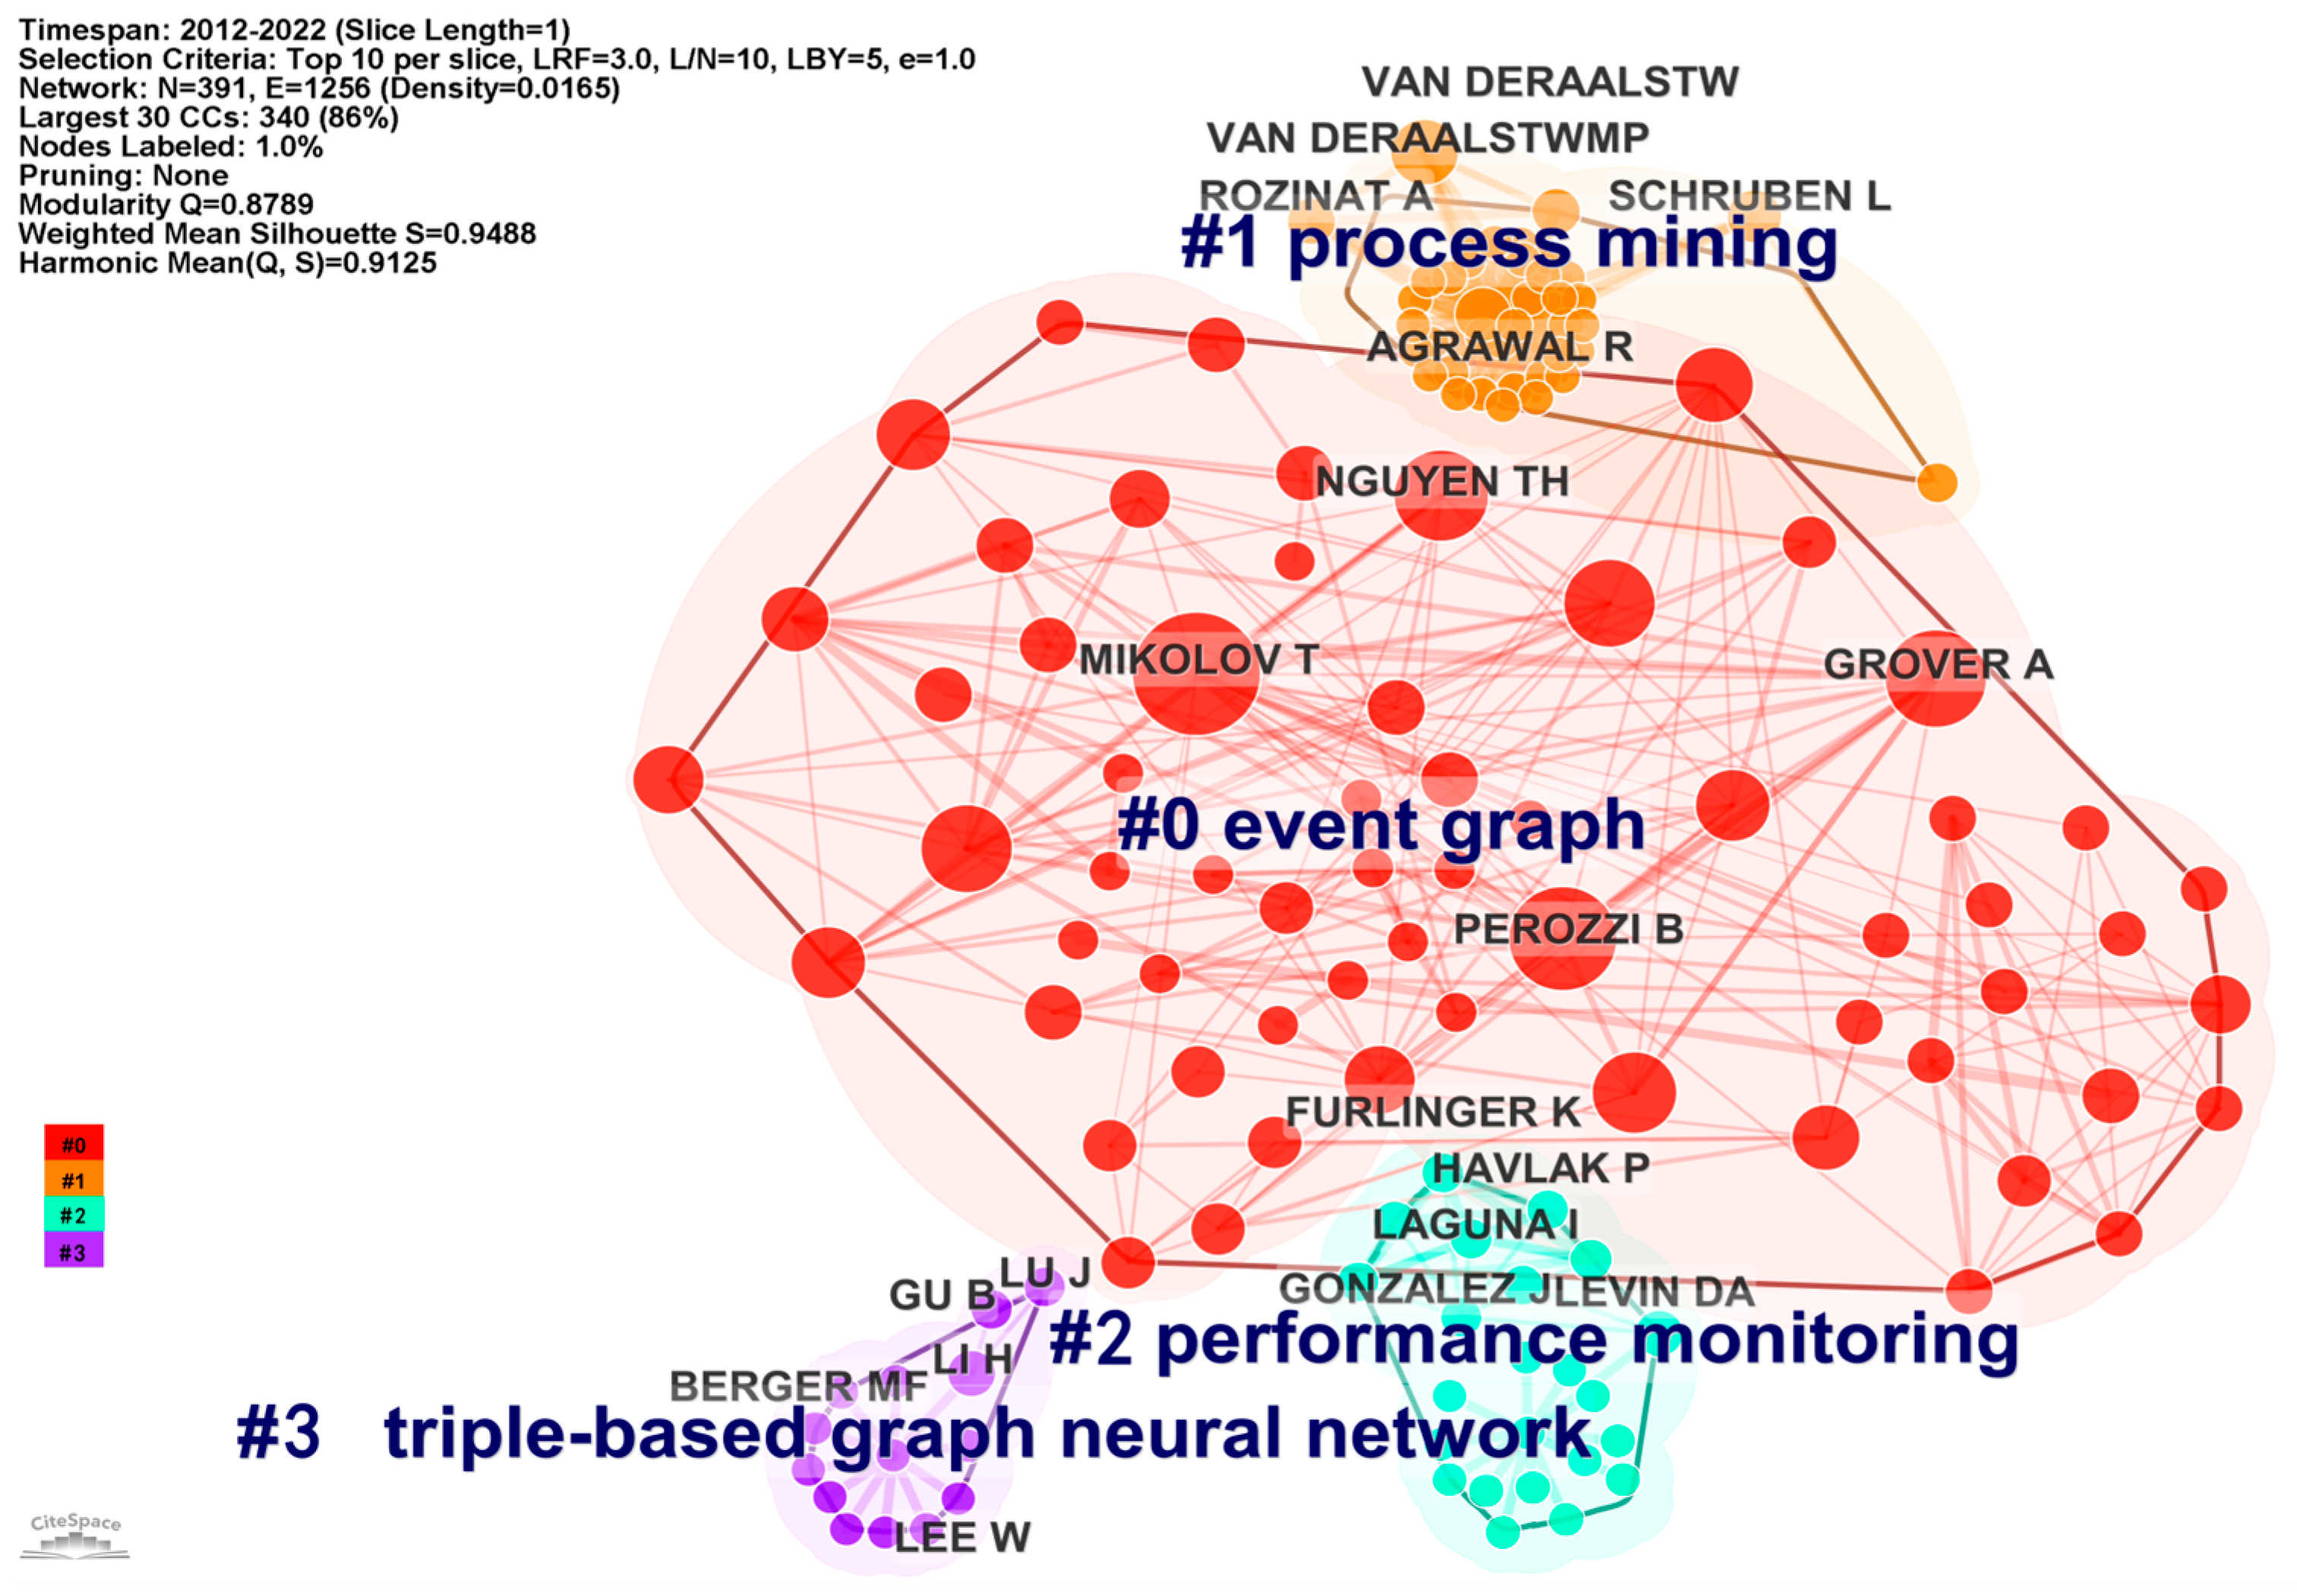
4.1. Author Co-Citation Network Analysis

This section identifies the core researchers who have made critical contributions in the field of event knowledge graphs through conducting the author co-citation network analysis in CiteSpace. The analysis covers the timespan from 2012 to 2022, focusing on the top 10 authors per one-year slice, which is usually the number selected for network construction by most studies. Due to the fact that the WoS contains incomplete, unrecognized characters or missing author information and privacy protection terms, some author information is not provided. In this study, the anonymous authors were excluded from the analysis. As shown in Figure 5, the author co-citation network includes 391 nodes and 1256 links. The nodes represent the independent authors. When two authors are cited in the same document, a link is formed to connect them, indicating there exists a co-citation relationship between the two authors. Each color represents a time slice (i.e., one year). The concentric rings with different colors reflect the author’s co-citation patterns over time.
In Figure 5, the larger the node size is, the more frequently cited the author is. Those who have a high citation frequency can be regarded as the core authors in the event knowledge graph field. It reveals that Mikolov Tomas has the highest citation frequency of 30 during each time slice, whose node holds the largest radius in the whole network, followed by Perozzi Bryan and Grover Aditya with 20 citations and 18 citations, respectively. It illustrates that their publications related to event knowledge graphs are more popular and acknowledged by other scholars in the relevant fields. It is worth mentioning that those authors are all interested in artificial intelligence, computer science, and neural networks through exploring their research interests published on the Google Scholar website.
Table 3 lists the top five authors in the event knowledge graph field regarding the betweenness centrality scores. It shows that Schruben Lee has the highest centrality of 0.1, a faculty from the University of California, Berkeley. His current research focuses on discrete-event simulation, risk analysis, and sampling methods. He acts as the intermediary to build the shortest path between two authors and has played a critical role in connecting all authors to compose the research network since the year of 2012. In the most recent years, Mikolov Tomas from the Czech Institute for Information Robotics and Networking has become well recognized, whose work has been widely cited and acknowledged by academics. Overall, those who own high betweenness centrality can be regarded as the promoters of co-operative and interdisciplinary research concerning the event knowledge graph.
The authors with strong citation bursts are rendered by the thick red rings enclosing the nodes in Figure 5, indicating the duration of the citation bursts. The thicker the red ring, the higher the citation burst score of the author. Table 4 summarizes the top five authors by ranking their citation burst scores. All the strong citation bursts have occurred in the past five years. The highest score was obtained by Mikolov Tomas, with a citation burst of 9.51, which is much higher than other authors. It reveals that his research related to event knowledge graphs has been increasingly gaining attention from scholars and frequently cited since 2018. The other four authors Perozzi Bryan, Grover Aditya, Nguyen Thien Huu, and Tang Jian hold similar citation burst patterns over time, illustrating that the event knowledge graph has become a hot research direction and more and more scholars have placed focus on this direction recently.
We further conducted a cluster analysis to identify author groups with similar co-citation patterns in the event knowledge graph field. The authors with similar academic influence and co-operative relationships are grouped in the same cluster. As shown in Figure 6, there are four significant clusters retrieved from the networks. The modularity indicated by the Q value, which equals 0.8789 and is over 0.3, reflects that the modularization of the author co-citation network is significant. The members are homogeneous within the same cluster and can be distinguished from other clusters since the weighted average S value equals 0.9488, which is larger than 0.7, proving the clustering results are reasonable and desirable.
Table 5 shows the details of these clusters in descending order according to the cluster size, i.e., the number of authors included in the cluster. The S value, the mean year, and the labels generated by the LLR method of each cluster are also presented to interpret the clustering results. All of the S values are larger than 0.7, showing that the results make sense for grouping the authors who conducted similar research into one cluster. For instance, cluster #0 appearing around 2017 serves as the main study area in the field and contains 62 authors, representing 15.857% of the total number of nodes in the network. The S value of this cluster equals 0.978, indicating that the authors within this cluster are highly homogeneous. The topic of this cluster concerns the flow graph analysis based on the streaming data in order to model and monitor the event evolution process. The other three clusters occur in earlier years, reflecting the research hotspots, including domain-specific event modeling and simulation, automatic loop detection, and causality-associated graph neural network technologies, applied in the event knowledge graph domain.

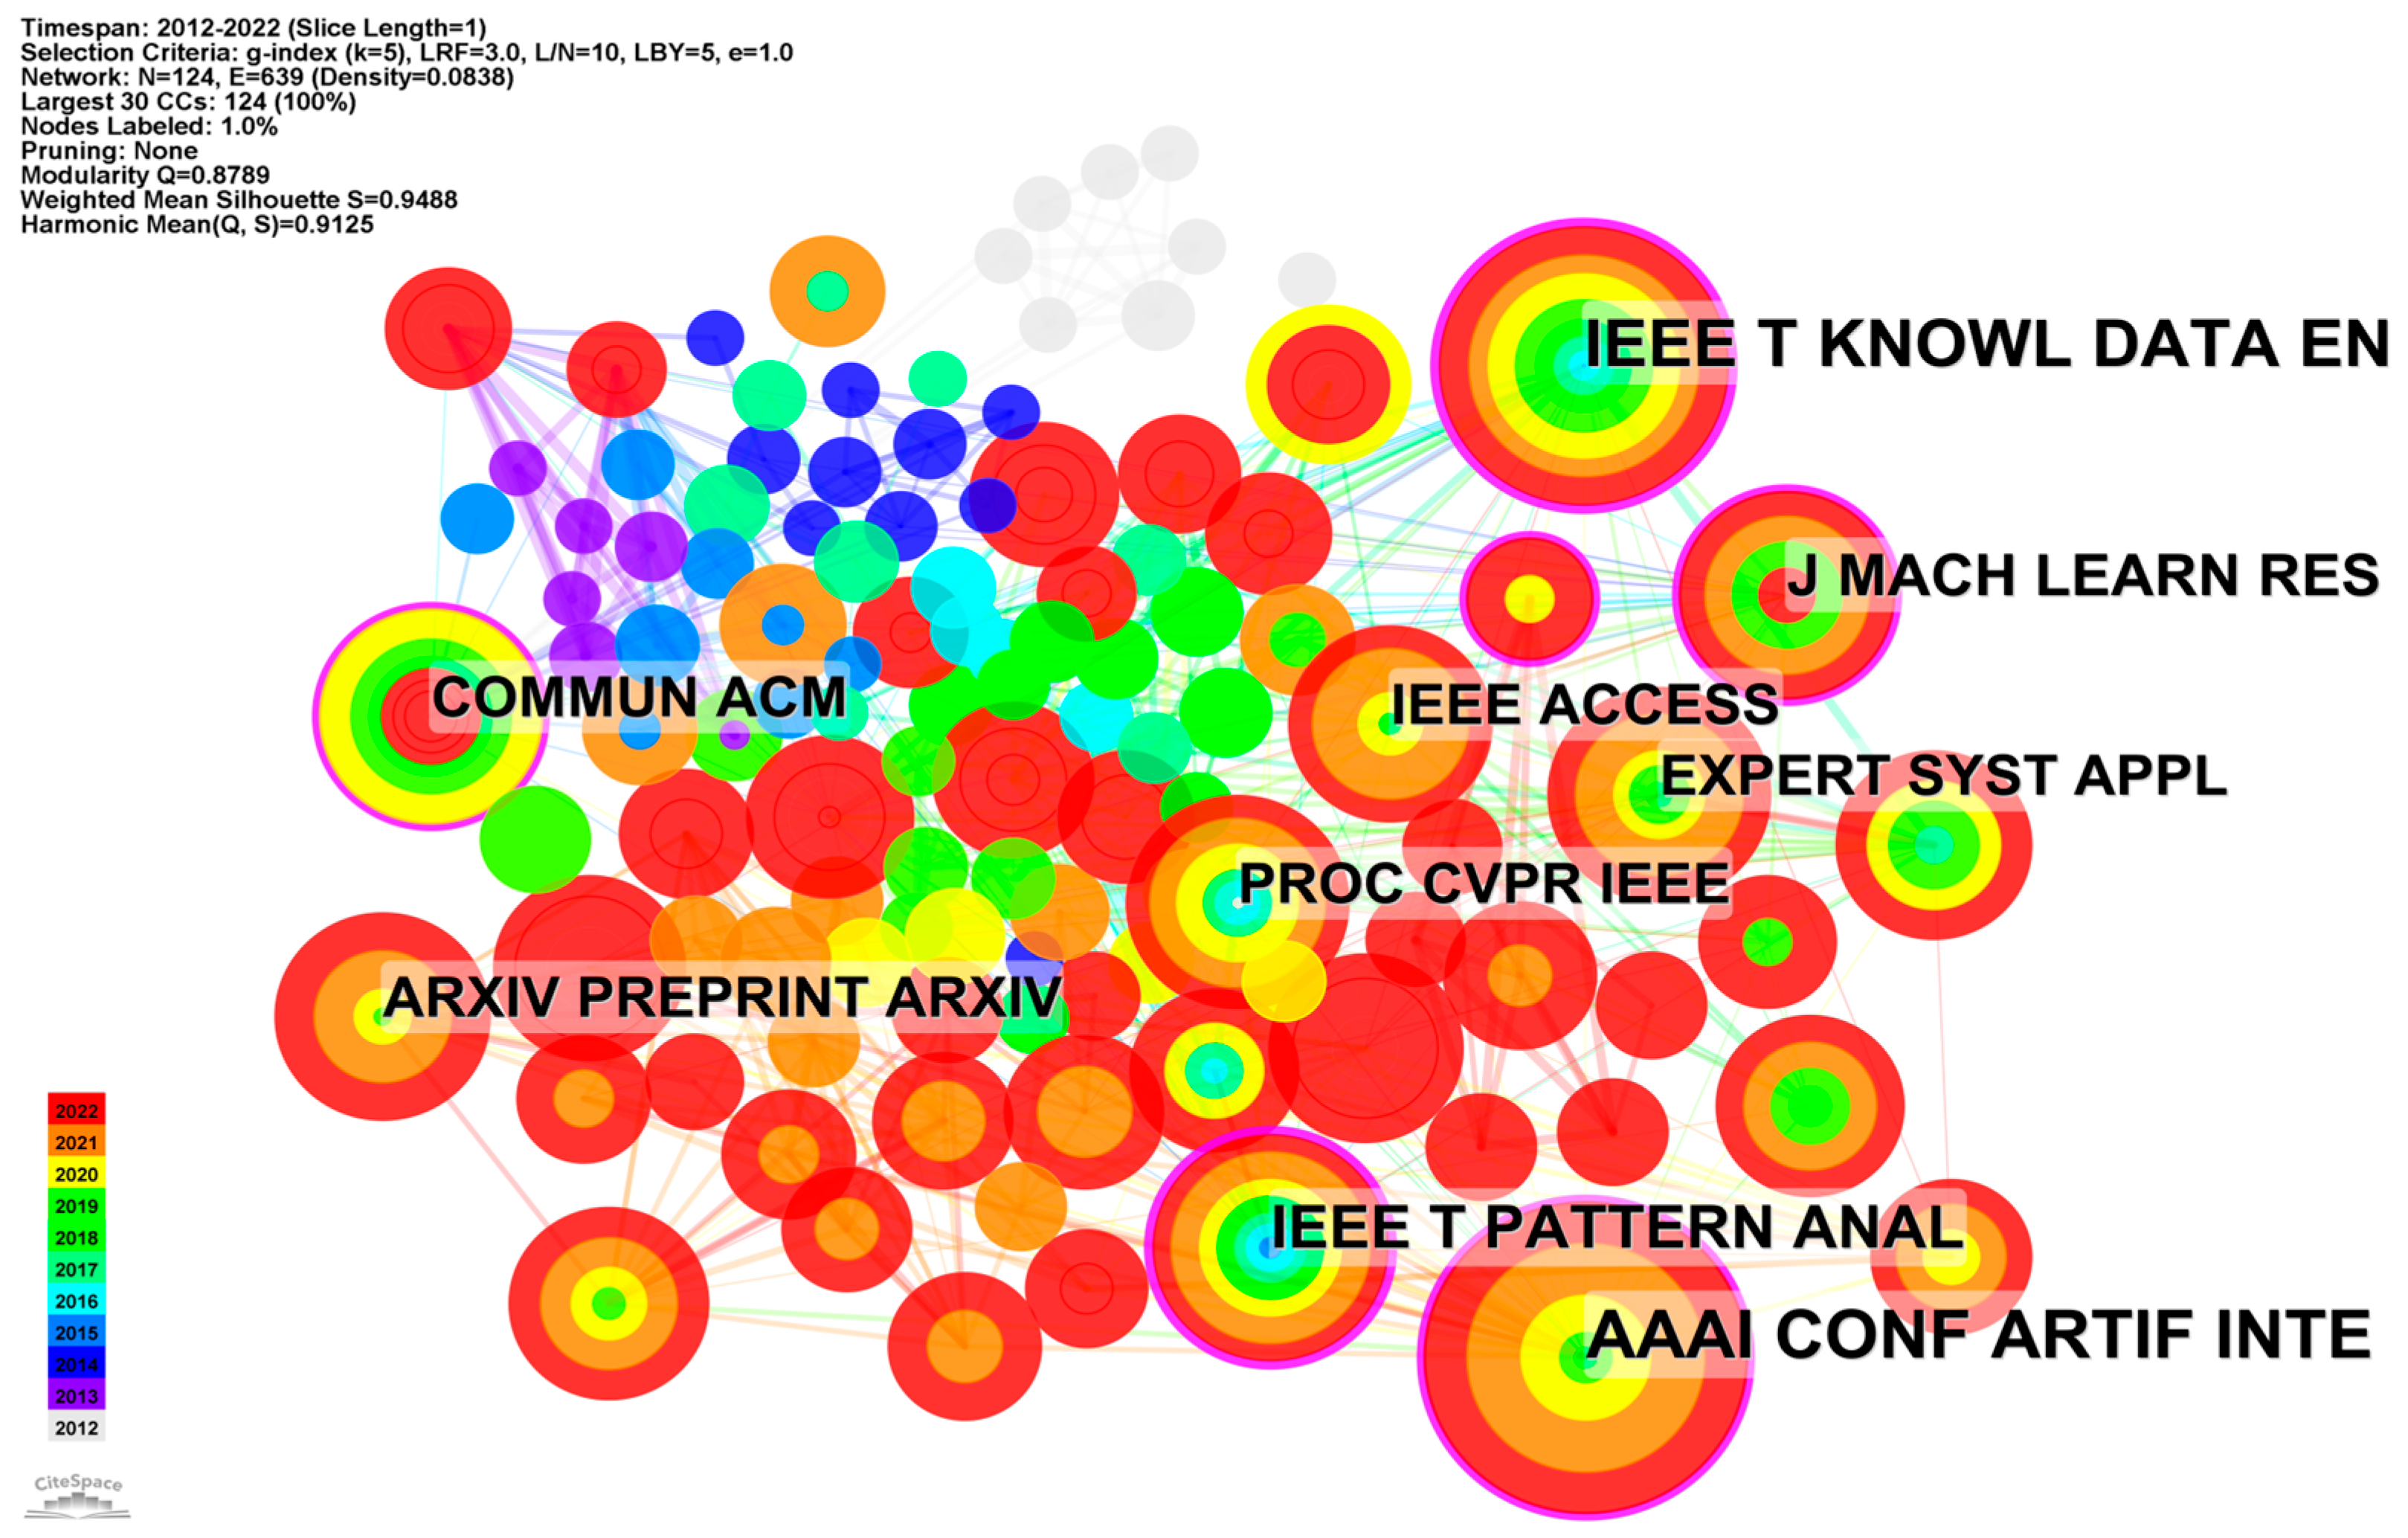
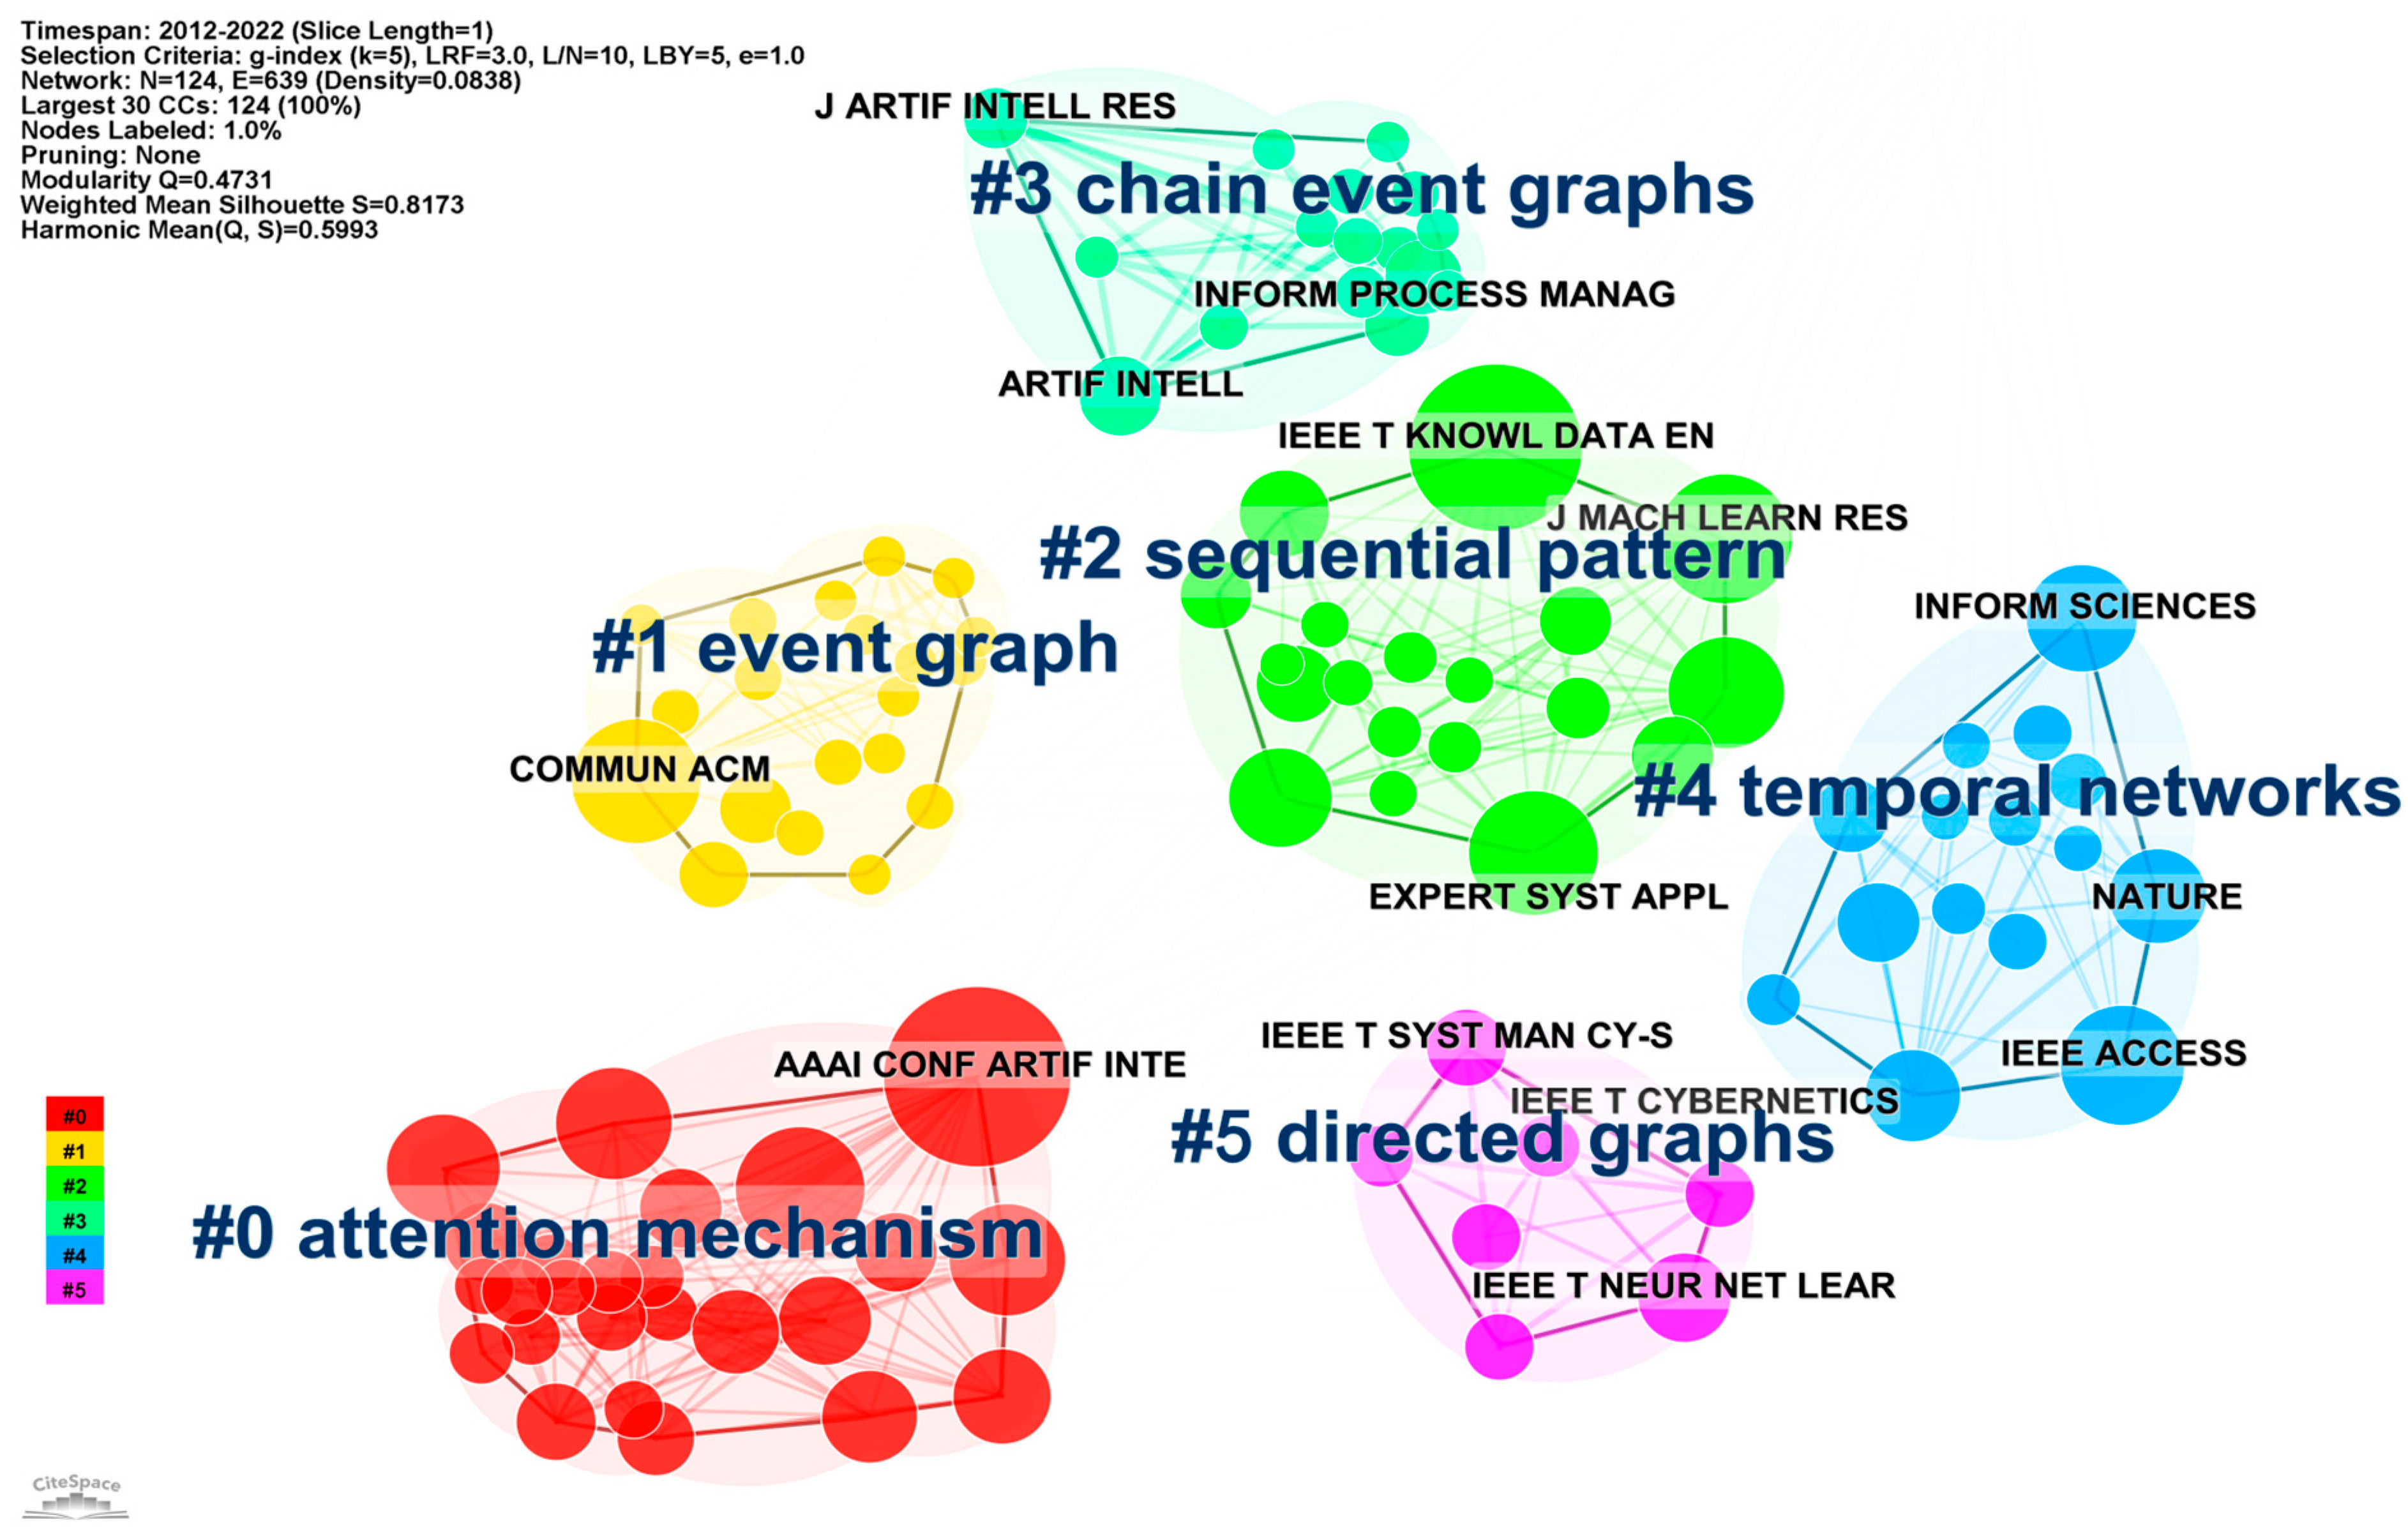
4.2. Journal Co-Citation Network Analysis

The journal co-citation network is a network structure used to analyze and visualize citation exchanges and relevance between journals. In this network, each journal is represented as a node and the citation relationship between journals is represented as links connecting nodes. As shown in Figure 7, the journal co-citation network contains 124 nodes and 639 links. The larger the node size, the higher the number of event-knowledge-graph-related publications contributed by this journal. Table 6 lists the information of the top five journals with regard to the frequency of publications, including journal name, its newest impact factor, frequency of publications, and average year. It can be seen that the node of “AAAI CONF ARTIF INTE” (AAAI Conference on Artificial Intelligence) with the largest radius has the highest publication frequency of 61 and the average year of those publications is 2018. In the previous years, the event-knowledge-graph-related documents were published in journals such as “IEEE Transactions on Knowledge and Data Engineering” and “IEEE Transactions on Pattern Analysis and Machine Intelligence”, which are all highly impacted and fall in the categories of computer science, knowledge engineering, and data mining.
As shown in Figure 7, the outermost purple ring around the node indicates the betweenness centrality of the journal. The thicker the purple ring, the higher the betweenness centrality of the journal. Such a purple ring appears only when the betweenness centrality is larger than 0.1. The information of the top five journals with higher betweenness centrality in the journal co-citation network is presented in Table 7, including journal abbreviation, full name, impact factor, betweenness centrality score, and the average year of publications. The betweenness centrality scores of the journals including “Communications of the ACM”, “IEEE Transactions on Knowledge and Data Engineering”, and “IEEE Transactions on Pattern Analysis and Machine Intelligence” are all around 0.20, and they play important intermediary roles connecting different journals that have a co-citation relationship in the event knowledge graph field before 2015. In the most recent years, the journal “IEEE Transactions on Systems, Man, and Cybernetics: Systems”, with a betweenness centrality of 0.14, stands out as the core journal related to event knowledge graphs, promoting interdisciplinary collaboration and knowledge exchange.
As the number of citations of a journal increases rapidly in a certain period of time, the journal is identified as owning a strong citation burst. As shown in Table 8, the journal titled “PLOS ONE” has the strongest citation burst, with a score of 5.38, which lasted two years from 2018 to 2020. There were also some strong citation bursts in the most well-known and highly impacted journals, including “Science” and “Nature” during 2015 and 2019, proving that the top-level research regarding event knowledge graphs had been widely acknowledged and increasingly cited by the academic community during those periods. The journal “Artificial Intelligence” constitutes the longest citation burst lasting four years (from 2013 to 2017), during which the event-knowledge-graph-related publications in “Artificial Intelligence” were cited more frequently than expected by peers.
In order to identify the distinguished groups of journals with high homogeneity, we further conducted a cluster analysis of the journal co-citation network. As shown in Figure 8, the network was grouped into six clusters, and they are rendered in different colors. The modularity indicated by the Q value equals 0.4731 and the weighted mean Silhouette S value equals 0.8173, both of which fall in the desirable ranges. As such, the cluster analysis results prove to be reliable and meet our expectations, supporting scholars to better understand the academic structure of the event-knowledge-graph-related research.
The details concerning the six clusters are presented in Table 9, including the number of journals included, S value, mean year, and the cluster labels generated by the LLR method. Cluster #0 with the largest size took place in 2020 and was labelled as “attention mechanism”, “semantics”, “feature extraction”, “knowledge engineering”, and “event extraction”. It reveals that documents published in the journals included in this cluster placed focus on the attention mechanism engaged for selecting effective features, aiding event extraction in recent years. Cluster #1, cluster #2, and cluster #3 have similar sizes and appeared around 2015, which concentrate on the logical process of event graph, the sequential patterns of event graph, and chain event graphs, respectively. Cluster #4 with an S value of 0.818 occurred in 2017 and involved temporal network analysis for the event knowledge graph. Cluster #6 consists of a smaller number of members but has the highest S value of 0.996, meaning that the journals within this cluster are the most homogeneous. The labels illustrate that the cluster is concerned with directed graph and graph topology.

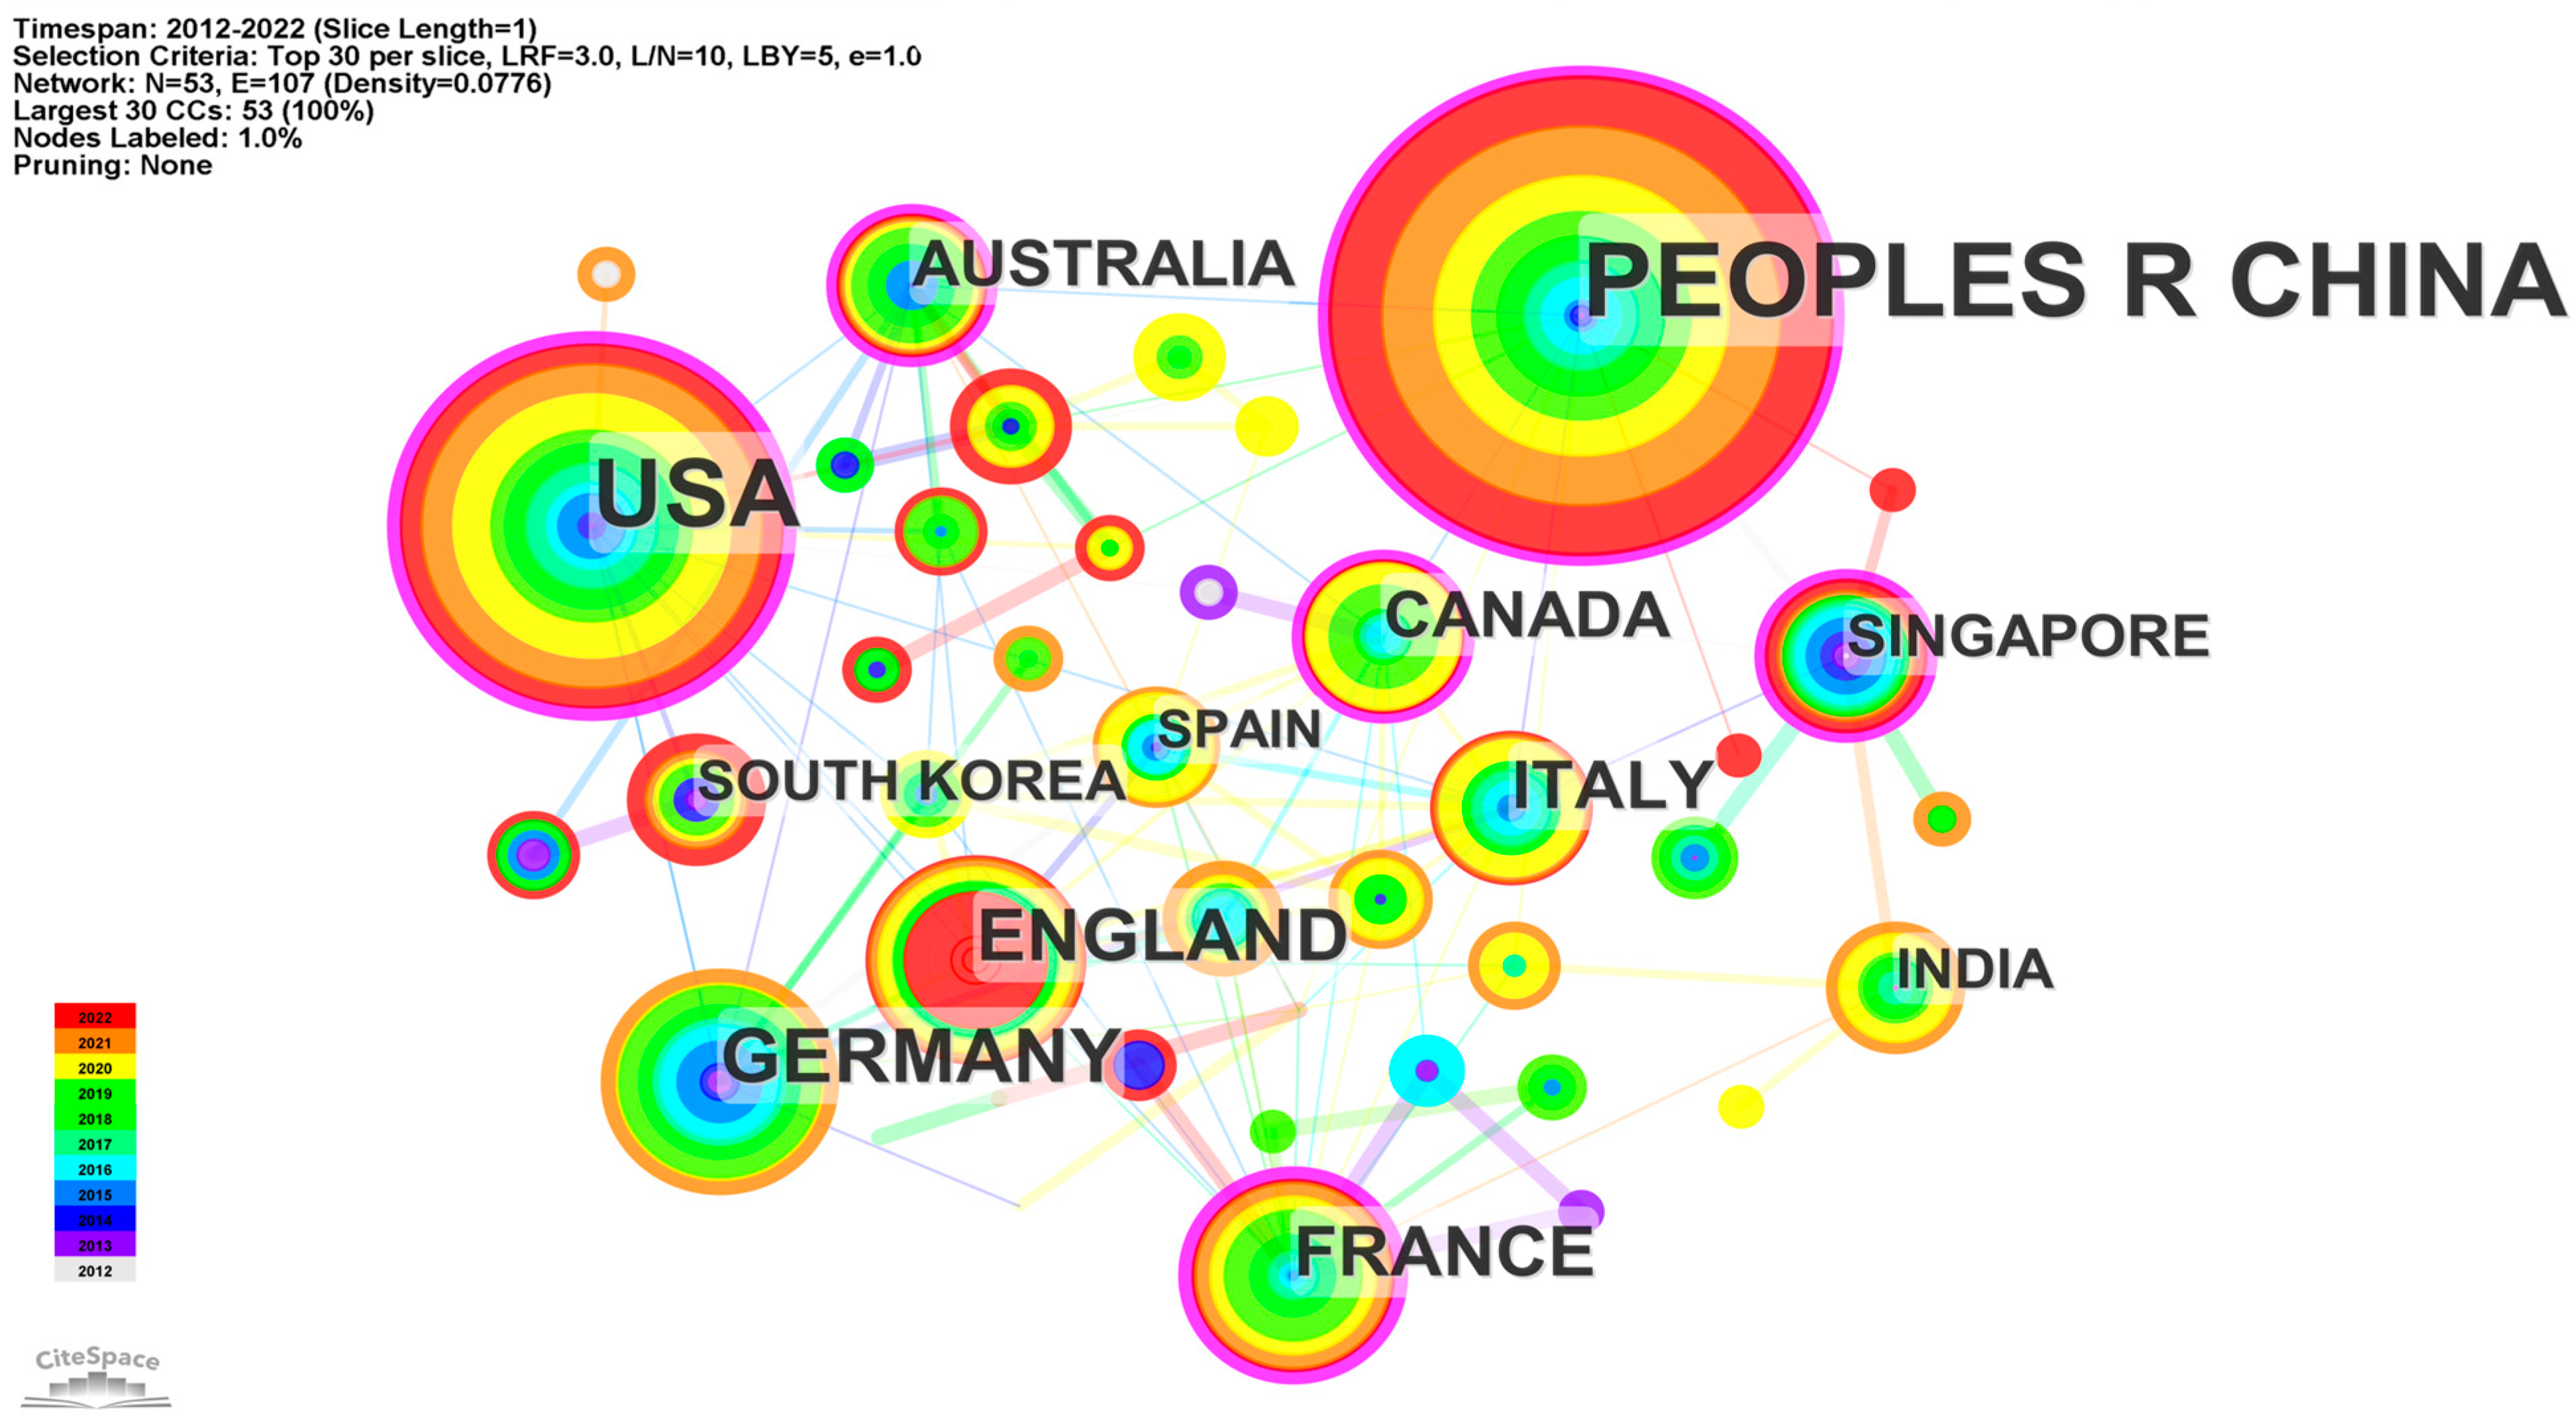
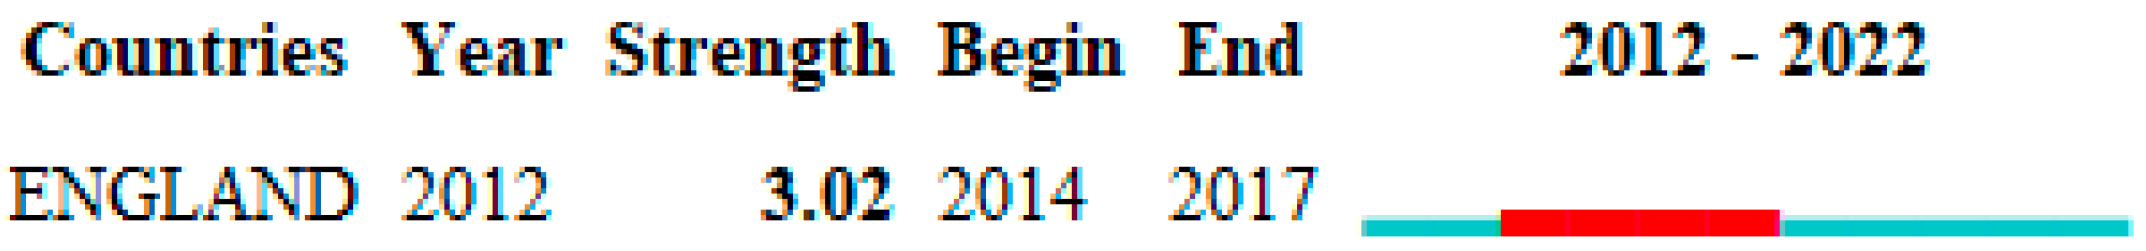
4.3. Collaborative Country Network Analysis

In this section, we analyzed and visualized the collaboration patterns of countries worldwide by constructing the collaborative country network. The country information was retrieved from the authors’ affiliation. Consequently, we obtained a network comprising 53 nodes and 107 links, where the nodes represent the countries and the links represent the co-operative relationship between countries. The size of the node indicates the frequency of the event-knowledge-graph-related publications of this country. As shown in Figure 9, the node of the Peoples’ Republic of China owns the largest radius, of which the publication frequency is 143, representing 26.384% of all publications (see Table 10). China’s prominent position in the national collaboration network indicates that it is the source of many articles in the event knowledge graph field. Another big source, including 82 publications, is the Unites States of America (USA). Similar sizes were obtained for Germany, England, and France with a publication frequency of 36, 28, and 24, respectively. The achievements made by those countries significantly contribute to promoting event knowledge graph research.
The concentric rings of different colors around the nodes indicate the temporal patterns of the documents published by a country. The color of the link aligns with the color of the year when the collaboration between countries first appears. The thickness of the outmost purple ring indicates the importance of this country for retaining the interlaced relationship in the collaborative country network. Those countries with thicker purple rings have higher betweenness centrality scores and play a more intermediary role in connecting all countries engaged in event knowledge graph research. The top five countries in terms of betweenness centrality are detailed in Table 11. It reveals that France has the highest betweenness centrality score of 0.35 since 2013, which is the most important node bridging the two countries within the collaborative country network with the shortest path. The countries with a higher number of event-knowledge-graph-relevant articles, i.e., USA and China, followed behind with a betweenness centrality score of 0.20 and 0.18, respectively. Together with Australia and the Netherlands, these five countries contributed most to international co-operation and interaction in the event knowledge graph field.
With regard to exploring the development trends of event-knowledge-graph-related research in the past 10 years, we further conducted citation burst analysis in terms of countries. As shown in Figure 10, the country with the strongest citation burst is England, which meets the requirement of taking all nodes in the collaborative country network for burst analysis. It includes the strength score as well as the begin and end years. The burstiness (i.e., a sudden increase in the number of citations) lasted a period of three years from 2014 to 2017 and reached a score of 3.02. It reveals that the event-knowledge-graph-related research conducted by England received a lot of attention from researchers during those years.

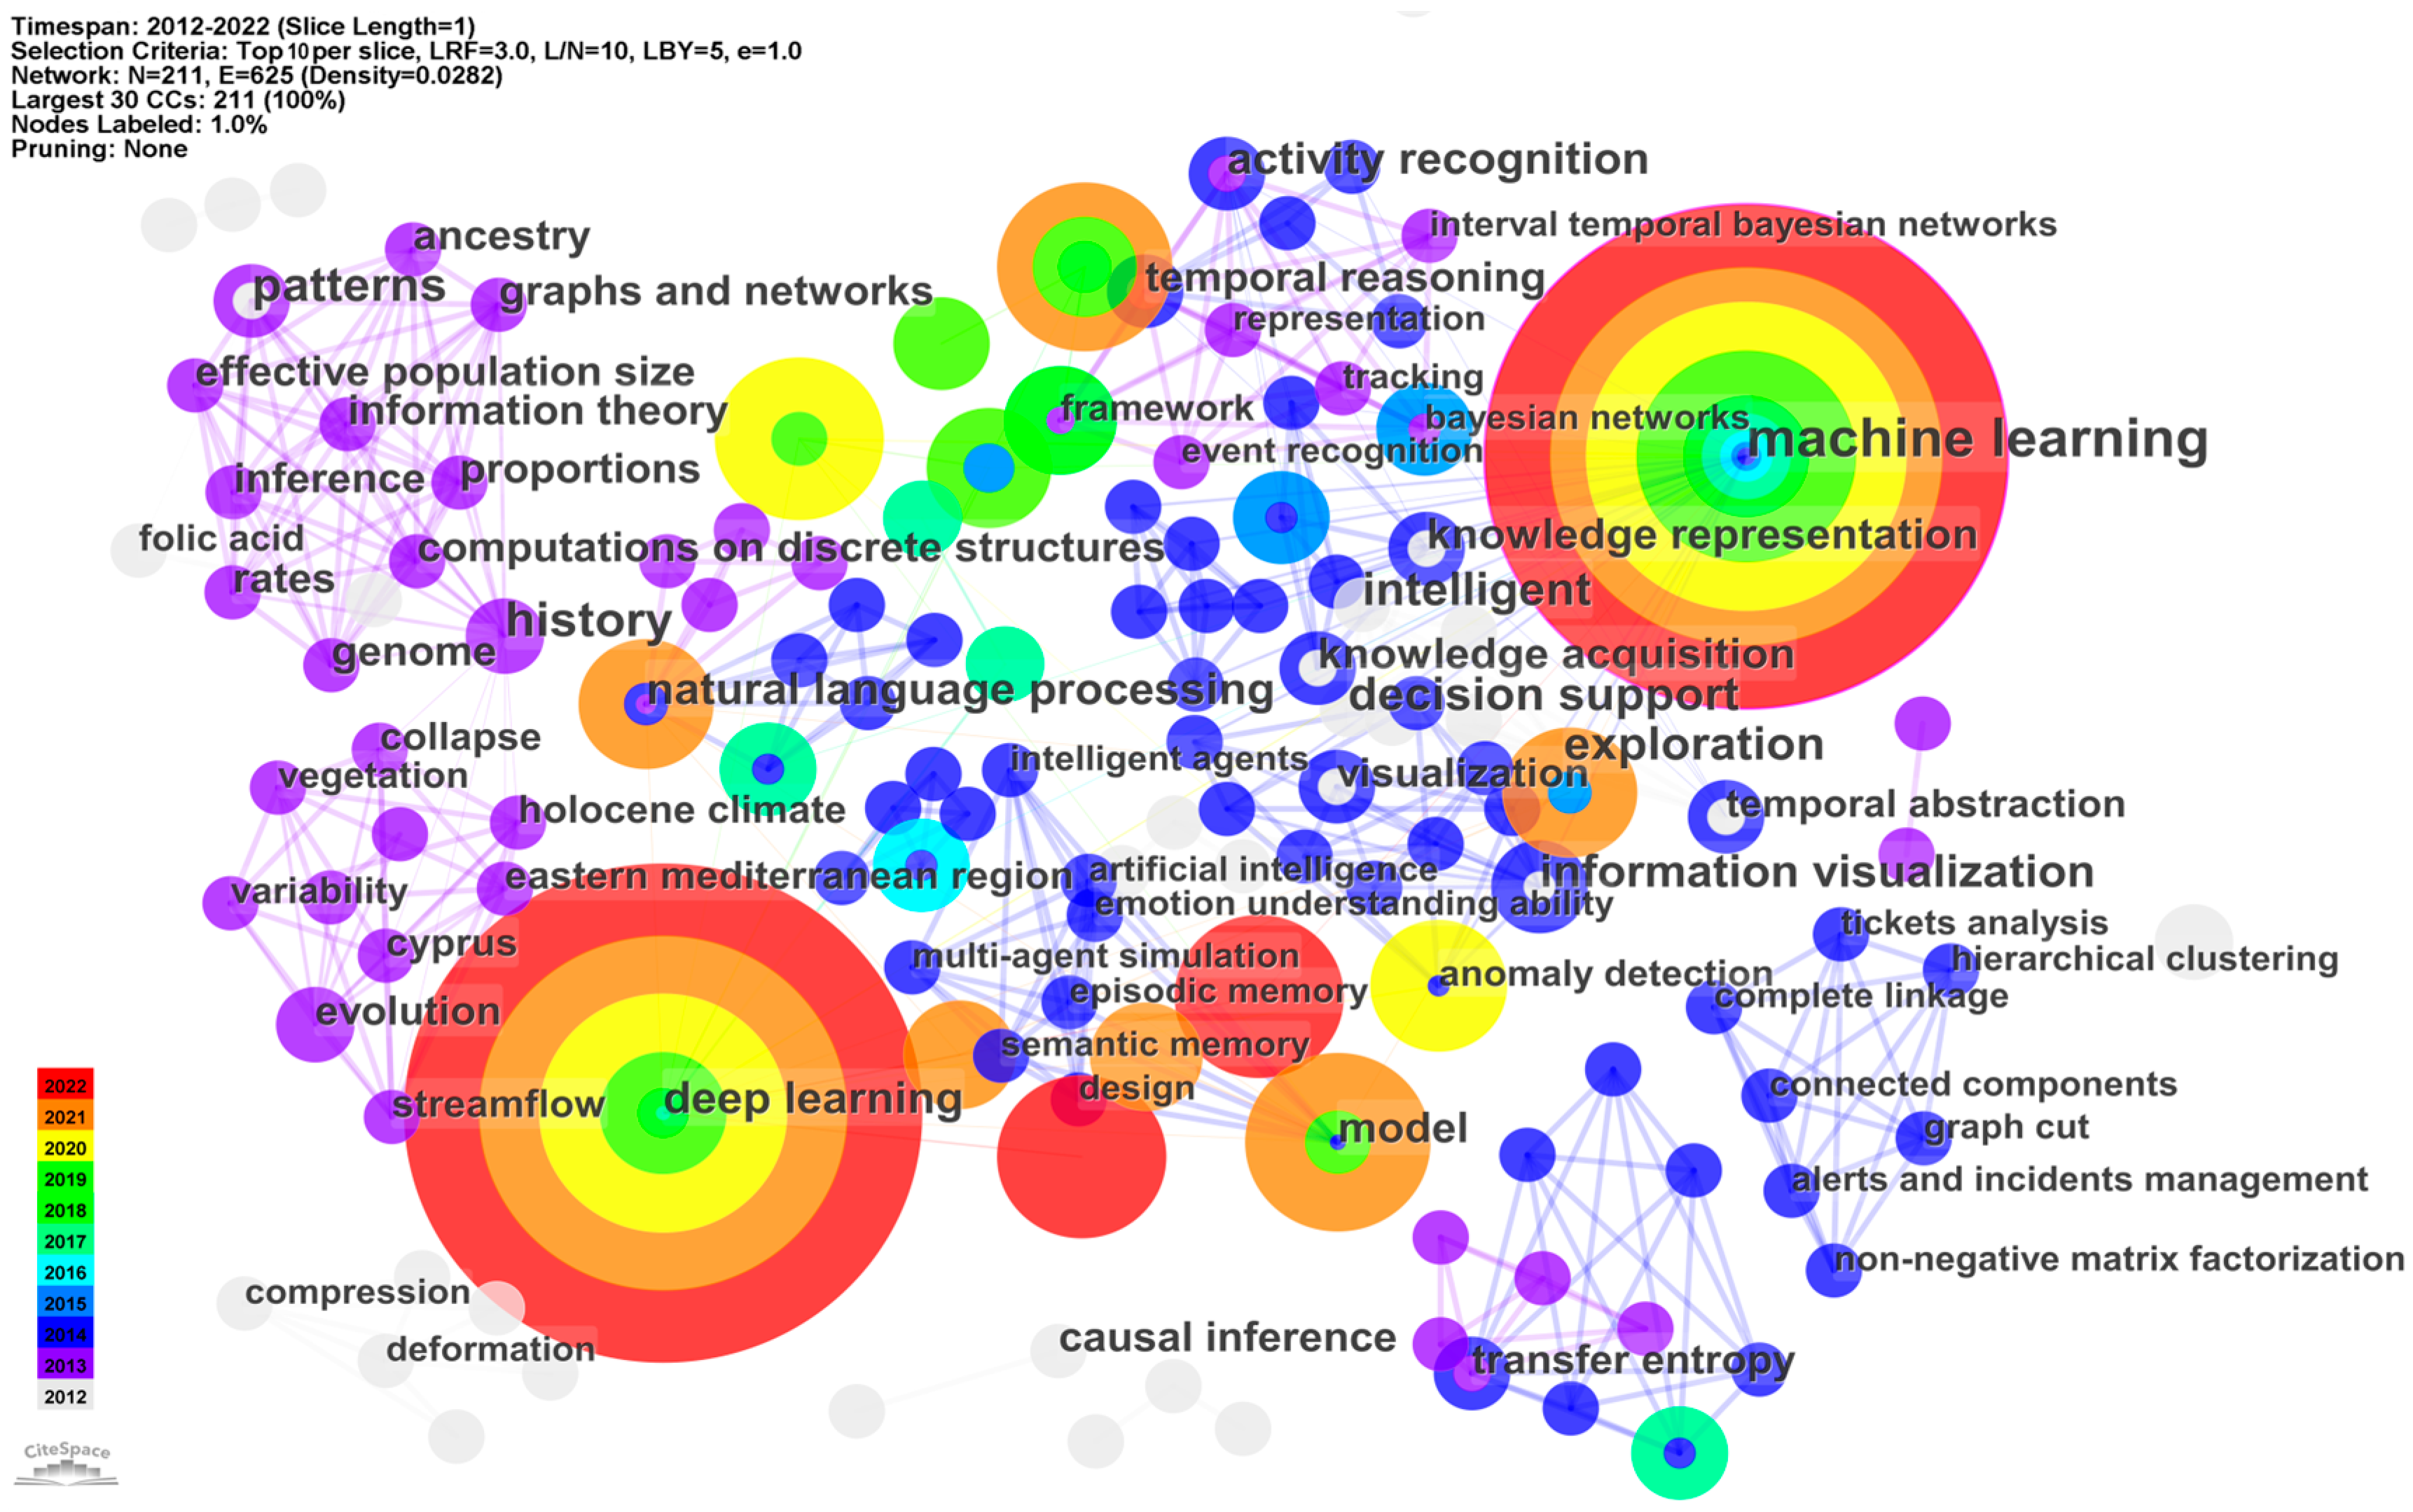
4.4. Keyword Co-Occurrence Network Analysis

Keywords are an effective way to summarize the topics of a document. We conducted keyword co-occurrence network analysis to observe the connections and development of research topics in the event knowledge graph field. We selected the top 10 keywords per year from 2012 to 2022 for analysis. As shown in Figure 11, the network consists of 211 nodes and 625 links. The nodes represent the distinct keywords. If the two keywords appear in one document at the same time, a link is built between the two keywords to illustrate their co-occurrence relationship. The color of the link refers to the year when the co-occurrence relationship first appears. The size of the node illustrates how often the keyword has been used in the surveyed documents. It can be seen in Figure 11 that the nodes of “machine learning” and “deep learning” hold the largest sizes in the network, which aligns with the elaboration in Section 2 that those two types of methods have been widely used for event extraction and event relation extraction in the existing studies. The nodes representing “natural language processing”, “knowledge acquisition”, “knowledge representation”, and “graphs and networks” have similar sizes, indicating that those terms concerning the key steps in the graph construction process are also hot research topics in the event knowledge graph domain.
Table 12 displays the top five keywords with the highest betweenness centrality scores, which almost aligns with those keywords identified by the frequency of publications. The high betweenness centrality score means the corresponding keyword plays an intermediary role in connecting all co-occurring keywords to compose the keyword co-occurrence network. It reveals that those keywords are not only frequently used but also commonly acknowledged in the event-knowledge-graph-related studies. In addition, those nodes with significant influence appearing in different years reveal the evolution process of research hotspots in the event knowledge graph field. For instance, the betweenness centrality score of the node representing “machine learning” is significantly higher than other nodes, and such a pattern appeared in 2013 when machine learning was intensively investigated in multiple disciplines including event knowledge graph.
The top four keywords with the strongest citation bursts are presented in Table 13. The higher the strength score, the stronger the citation burst. The term “deep learning” holds the strongest citation burst with the highest score of 20.81 from 2018 to 2022. Another keyword with the same time span of citation burst as “deep learning” is “knowledge graph”, indicating that deep learning and knowledge-graph-related technologies have been increasingly used for event knowledge graph research since 2018. The keyword “machine learning” had been cited with significant burstiness from 2016 to 2020, illustrating that machine learning methods had drawn significant attention from peers and had been a hotspot research topic in the event knowledge graph field during those years. Despite that, the topics about “neural networks” had achieved strong citation bursts from 2019 to 2020, which was logical after the burstiness of “deep learning” since neural networks emerged as a representative among varieties of deep learning methods. The citation burst analysis of the keywords helps capture research trends as well as uncover hot research interests in the event knowledge graph field during a specific time period.

5. Conclusions

In this study, we utilized the CiteSpace software of version 6.2.R4 to conduct a scientometric analysis of research on the event knowledge graph. Our aim was to investigate research productivity and emerging trends in this field by collecting documents published between 2012 and 2022 from the Web of Science database. In order to conduct our analysis, we generated and visualized four types of networks based on the collected documents, i.e., the author co-citation network, journal co-citation network, collaborative country network, and keyword co-occurrence network. Such network analysis yielded several noteworthy results. The landmark authors and journals came from various disciplines, such as computer science, knowledge engineering, and data mining, suggesting that event knowledge graph research has obvious interdisciplinary characteristics that promote co-operation and communication among countries worldwide. The keywords, which were found either frequently co-occurring or with high betweenness centrality, reveal hot research topics (e.g., machine learning and deep learning), which almost aligns with the elaboration in Section 2 that those two types of methods have been widely used for event extraction and event relation extraction in existing studies. The research trends and directions indicated by the keywords with strong citation burst show that machine learning, deep learning, and neural networks have been sequentially engaged in event knowledge graph research since 2016.
Although our work produced notable results, there is still room for improvement in future studies. As we only reviewed articles in English and collected solely from the Web of Science database, some relevant research may have been excluded from this review. To address this limitation, future studies could include articles written in other languages (e.g., Chinese) or recorded in other databases (e.g., Scopus) for further comparison and analysis. Moreover, while citation analysis is a useful tool, it does not account for the quality or relevance of citations. Some works may be cited frequently but not necessarily because they are influential or accurate. Such a phenomenon can be potentially addressed by inviting experts to review and screen those works that have been retrieved by the citation analysis to determine whether they are cited necessarily and accurately. Furthermore, it is possible to propose a new journal metric based on our work, which can be transformed into an active literature tool as a plug-in in the existing software and would change the tone towards a more engineering approach.

Author Contributions

S.X.: writing—review and editing, project administration, funding acquisition, supervision, resources. S.L. (Sirui Liu): conceptualization, methodology, software, data curation, writing—original draft. C.J.: investigation, writing—review and editing. S.L. (Songnian Li): writing—review and editing. All authors have read and agreed to the published version of the manuscript.

Funding

This work was funded by the Beijing Association for Science and Technology Young Elite Scientist Sponsorship Program (BYESS2023008), the Key Laboratory of Urban Spatial Informatics, Ministry of Natural Resources of the People’s Republic of China (2023ZD002), China Scholarship Council (03998521001), China Scholarship Council High-level Talent Training Program (Grant #20221007), and the Natural Sciences and Engineering Research Council of Canada (RGPIN-2017-05950).

Data Availability Statement

Data availability is not applicable to this article as no new data were created or analyzed in this study.

Conflicts of Interest

The authors declare no conflict of interest.

References

  1. Zhao, J.; Liu, K.; He, S.; Chen, Y. Knowledge Graph; Higher Education Press: Beijing, China, 2018. [Google Scholar]
  2. Xiang, W. Reviews on Event Knowledge Graph Construction Techniques and Application. Comput. Mod. 2020, 10, 10–16. [Google Scholar] [CrossRef]
  3. Xiao, L.; Yue, S. Event extraction technology review and application. Softw. Guide 2023, 22, 7. [Google Scholar]
  4. Guan, S.; Cheng, X.; Bai, L.; Zhang, F.; Li, Z.; Zeng, Y.; Jin, X.; Guo, J. What is Event Knowledge Graph: A Survey. IEEE Trans. Knowl. Data Eng. 2022, 35, 7569–7589. [Google Scholar] [CrossRef]
  5. Schauer, M. Narrative Exposure Therapy. In International Encyclopedia of Social & Behavioral Sciences; Elsevier: Amsterdam, The Netherlands, 2015; Volume 16. [Google Scholar] [CrossRef]
  6. Fortunato, S.; Bergstrom, C.T.; Börner, K.; Evans, J.A.; Helbing, D.; Milojevic, S.; Petersen, A.M.; Radicchi, F.; Sinatra, R.; Uzzi, B.; et al. The Science of Science. Nature 2018, 138, 237. [Google Scholar] [CrossRef]
  7. Kim, J.-T.; Moldovan, D.I. Acquisition of Linguistic Patterns for Knowledge-Based Information Extraction. IEEE Trans. Knowl. Data Eng. 1995, 7, 713–724. [Google Scholar] [CrossRef]
  8. Riloff, E. Automatically constructing a dictionary for information extraction tasks. In Proceedings of the National Conference on Artificial Intelligence, Washington, DC, USA, 11–15 July 1993; pp. 811–816. Available online: https://api.semanticscholar.org/CorpusID:2257053 (accessed on 1 November 2023).
  9. Jiang, J. Event IE pattern acquisition method. Jisuanji Gongcheng/Comput. Eng. 2005, 31, 96–98. Available online: https://api.semanticscholar.org/CorpusID:62948118 (accessed on 1 November 2023).
  10. Yangarber, R. Scenario Customization for Information Extraction. 2001. Available online: https://api.semanticscholar.org/CorpusID:61015755 (accessed on 1 November 2023).
  11. Riloff, E.; Shoen, J. Automatically aquiring conceptual patterns without an annotated corpus. In Proceedings of the Third Workshop on Very Large Corpora, Cambridge, MA, USA, 30 June 1995; Available online: https://api.semanticscholar.org/CorpusID:10779824 (accessed on 1 November 2023).
  12. Chieu, H.L.; Ng, H.T. A maximum entropy approach to information extraction from semi-structured and free text. In Proceedings of the National Conference on Artificial Intelligence, Edmont, AB, Canada, 28 July–1 August 2002; pp. 786–791. [Google Scholar]
  13. Li, Q.; Ji, H.; Huang, L. Joint Event Extraction via Structured Prediction with Global Features. In Proceedings of the Annual Meeting of the Association for Computational Linguistics, Sofia, Bulgaria, 4–9 August 2013; Available online: https://api.semanticscholar.org/CorpusID:2114517 (accessed on 1 November 2023).
  14. Llorens, H.; Saquete, E.; Navarro-Colorado, B. TimeML events recognition and classification: Learning CRF models with semantic roles. In Proceedings of the Coling 2010—23rd International Conference on Computational Linguistics, Beijing, China, 23–27 August 2010; Volume 2, pp. 725–733. Available online: https://api.semanticscholar.org/CorpusID:14170243 (accessed on 1 November 2023).
  15. Ahn, D. The stages of event extraction. In Proceedings of the Workshop on Annotating and Reasoning about Time and Events, Sydney, NSW, Australia, 23 July 2006; pp. 1–8. [Google Scholar]
  16. Chen, Y.; Xu, L.; Liu, K.; Zeng, D.; Zhao, J. Event extraction via dynamic multi-pooling convolutional neural networks. In Proceedings of the ACL-IJCNLP 2015—53rd Annual Meeting of the Association for Computational Linguistics and the 7th International Joint Conference on Natural Language Processing of the Asian Federation of Natural Language Processing, Beijing, China, 26–31 July 2015; Volume 1, pp. 167–176. [Google Scholar] [CrossRef]
  17. Ding, N.; Li, Z.; Liu, Z.; Zheng, H.T.; Lin, Z. Event detection with trigger-aware lattice neural network. In Proceedings of the EMNLP-IJCNLP 2019—2019 Conference on Empirical Methods in Natural Language Processing and 9th International Joint Conference on Natural Language Processing, Hong Kong, China, 3–7 November 2019; pp. 347–356. [Google Scholar] [CrossRef]
  18. Satyapanich, T.; Ferraro, F.; Finin, T. Casie: Extracting cybersecurity event information from text. In Proceedings of the AAAI 2020—34th AAAI Conference on Artificial Intelligence, New York, NY, USA, 7–12 February 2020; pp. 8749–8757. [Google Scholar] [CrossRef]
  19. Yang, S.; Feng, D.; Qiao, L.; Kan, Z.; Li, D. Exploring pre-trained language models for event extraction and generation. In Proceedings of the ACL 2019—57th Annual Meeting of the Association for Computational Linguistics, Florence, Italy, 28 July–2 August 2020; pp. 5284–5294. [Google Scholar] [CrossRef]
  20. Zeng, Y.; Yang, H.; Feng, Y.; Wang, Z.; Zhao, D. A convolution BiLSTM neural network model for chinese event extraction. In Natural Language Understanding and Intelligent Applications; Lecture Notes in Computer Science (Including Subseries Lecture Notes in Artificial Intelligence and Lecture Notes in Bioinformatics); Springer: Cham, Switzerland, 2016; Volume 10102, pp. 275–287. [Google Scholar] [CrossRef]
  21. Zheng, G.; Mukherjee, S.; Dong, X.L.; Li, F. OpenTag: Open aribute value extraction from product profiles. In Proceedings of the ACM SIGKDD International Conference on Knowledge Discovery and Data Mining, London, UK, 19–23 August 2018; pp. 1049–1058. [Google Scholar] [CrossRef]
  22. Nguyen, T.H.; Grishman, R. Graph convolutional networks with argument-aware pooling for event detection. In Proceedings of the 32nd AAAI Conference on Artificial Intelligence—AAAI 2018, New Orleans, LA, USA, 2–7 February 2018; pp. 5900–5907. [Google Scholar] [CrossRef]
  23. Cui, S.; Yu, B.; Liu, T.; Zhang, Z.; Wang, X.; Shi, J. Edge-enhanced graph convolution networks for event detection with syntactic relation. In Findings of the Association for Computational Linguistics: EMNLP 2020; Association for Computational Linguistics: Stroudsburg, PA, USA, 2020; pp. 2329–2339. [Google Scholar] [CrossRef]
  24. Ben Veyseh, A.P.; Nguyen, T.N.; Nguyen, T.H. Graph transformer networks with syntactic and semantic structures for event argument extraction. In Findings of the Association for Computational Linguistics: EMNLP 2020; abs/2010.1; Association for Computational Linguistics: Stroudsburg, PA, USA, 2020; pp. 3651–3661. [Google Scholar] [CrossRef]
  25. Huang, K.H.; Yang, M.; Peng, N. Biomedical event extraction with hierarchical knowledge graphs. In Findings of the Association for Computational Linguistics Findings of ACL: EMNLP 2020; Association for Computational Linguistics: Stroudsburg, PA, USA, 2020; pp. 1277–1285. [Google Scholar] [CrossRef]
  26. Nguyen, T.H.; Cho, K.; Grishman, R. Joint event extraction via recurrent neural networks. In Proceedings of the 2016 Conference of the North American Chapter of the Association for Computational Linguistics: Human Language Technologies—NAACL HLT 2016, San Diego, CA, USA, 12–17 June 2016; pp. 300–309. [Google Scholar] [CrossRef]
  27. Shen, S.; Qi, G.; Li, Z.; Bi, S.; Wang, L. Hierarchical Chinese Legal event extraction via Pedal Attention Mechanism. In Proceedings of the COLING 2020—28th International Conference on Computational Linguistics, Barcelona, Spain, 8–13 December 2020; pp. 100–113. [Google Scholar] [CrossRef]
  28. Sheng, J.; Guo, S.; Yu, B.; Li, Q.; Hei, Y.; Wang, L.; Liu, T.; Xu, H. CasEE: A Joint Learning Framework with Cascade Decoding for Overlapping Event Extraction. In Findings of the Association for Computational Linguistics: ACL-IJCNLP 2021; Association for Computational Linguistics: Stroudsburg, PA, USA, 2021; pp. 164–174. [Google Scholar] [CrossRef]
  29. Du, X.; Cardie, C. Document-level event role filler extraction using multi-granularity contextualized encoding. In Proceedings of the Annual Meeting of the Association for Computational Linguistics, Florence, Italy, 28 July–2 August 2020; pp. 8010–8020. [Google Scholar] [CrossRef]
  30. Huang, K.-H.; Peng, N. Document-level Event Extraction with Efficient End-to-end Learning of Cross-event Dependencies. In Proceedings of the Third Workshop on Narrative Understanding, Virtual, 11 June 2021; pp. 36–47. [Google Scholar] [CrossRef]
  31. Liu, J.; Chen, Y.; Zhao, J. Knowledge enhanced event causality identification with mention masking generalizations. In Proceedings of the IJCAI International Joint Conference on Artificial Intelligence, Yokohama, Japan, 7–15 January 2021; pp. 3608–3614. [Google Scholar] [CrossRef]
  32. Liu, H.; Singh, P. ConceptNet—A Practical Commonsense Reasoning Tool-Kit. BT Technol. J. 2004, 22, 211–226. [Google Scholar] [CrossRef]
  33. Cheng, F.; Miyao, Y. Classifying temporal relations by bidirectional LSTM over dependency paths. In Proceedings of the ACL 2017—55th Annual Meeting of the Association for Computational Linguistics, Vancouver, BC, Canada, 30 July–4 August 2017; Volume 2, pp. 1–6. [Google Scholar] [CrossRef]
  34. Han, R.; Ning, Q.; Peng, N. Joint event and temporal relation extraction with shared representations and structured prediction. In Proceedings of the EMNLP-IJCNLP 2019—2019 Conference on Empirical Methods in Natural Language Processing and 9th International Joint Conference on Natural Language Processing, Hong Kong, China, 3–7 November 2019; pp. 434–444. [Google Scholar] [CrossRef]
  35. Han, R.; Zhou, Y.; Peng, N. Domain knowledge empowered structured neural net for end-to-end event temporal relation extraction. In Proceedings of the EMNLP 2020—2020 Conference on Empirical Methods in Natural Language Processing, Online, 16–20 November 2020; pp. 5717–5729. [Google Scholar] [CrossRef]
  36. Chen, C. CiteSpace II: Detecting visualizing emerging trends transient patterns in scientific literature. J. Assoc. Inf. Sci. Technol. 2006, 57, 359–377. [Google Scholar] [CrossRef]
  37. De Nooy, W.; Mrvar, A.; Batagelj, V. Exploratory Social Network Analysis with Pajek; Cambridge University Press: Cambridge, UK, 2011. [Google Scholar] [CrossRef]
  38. Chen, C. The CiteSpace Manual. Scientometrics 2015, 103, 1003–1022. [Google Scholar]
  39. Kleinberg, J.M. Bursty and Hierarchical Structure in Streams. Data Min. Knowl. Discov. 2002, 7, 373–397. [Google Scholar] [CrossRef]
  40. Li, J.; Chen, C. CiteSpace: Text Mining and Visualization in Scientific Literature; Capital University of Economics and Business Press: Beijing, China, 2016. (In Chinese) [Google Scholar]
Figure 1. A typhoon event knowledge graph.
Applsci 13 12338 g001
Figure 2. An overall workflow of constructing an event knowledge graph.
Applsci 13 12338 g002
Figure 3. An overall framework for conducting scientometric survey in the event knowledge graph field.
Applsci 13 12338 g003
Figure 4. Statistics on the number of papers published each year.
Applsci 13 12338 g004
Figure 5. The visualization of the merged network of author co-citation network analysis for years 2012 to 2022.
Applsci 13 12338 g005
Figure 6. The cluster analysis results of author co-citation network for the years 2012 to 2022.
Applsci 13 12338 g006
Figure 7. The visualization of journal co-citation network for the years 2012–2022.
Applsci 13 12338 g007
Figure 8. The clusters of the journal co-citation network for the years 2012 to 2022.
Applsci 13 12338 g008
Figure 9. The visualization of the collaborative country network for the years 2012–2022.
Applsci 13 12338 g009
Figure 10. The citation burst history of a country in the timespan of 2012 to 2022.
Applsci 13 12338 g010
Figure 11. The visualization of keyword co-occurrence network for years 2012 to 2022.
Applsci 13 12338 g011
Table 1. Some public datasets used for event knowledge graph construction.
DatasetYearFieldLanguageDescription
MUC-4
https://www-nlpir.nist.gov/related_projects/muc/muc_data/muc_data_index.html (accessed on 1 November 2023)
1996GeneralEnglishIt contains 1700 documents.
ACE 2005
https://catalog.ldc.upenn.edu/byproject (accessed on 1 November 2023)
2005GeneralEnglish, Chinese, and ArabicIt contains 8 categories and 33 sub-categories of events.
CEC
https://github.com/shijiebei2009/CEC-Corpus (accessed on 1 November 2023)
2009DisasterChineseIt contains 322 documents covering earthquakes, fires, traffic accidents, terrorist attacks, and food poisoning emergencies.
TAC KBP 2017
https://tac.nist.gov/2017/KBP/Event/index.html (accessed on 1 November 2023)
2017GeneralEnglish, Chinese, and SpanishIt contains 202 documents collected from news and forums.
WIKIEVENTS
https://github.com/231sm/Low_Resource_KBP (accessed on 1 November 2023)
2020GeneralEnglishIt contains 246 documents, 6132 sentences, and 3951 events obtained from Wikipedia.
CySecED
https://aclanthology.org/2020.emnlp-main.433.pdf (accessed on 1 November 2023)
2020Network securityEnglishIt contains 292 documents covering 30 types of network security incidents.
MAVEN
https://github.com/THU-KEG/MAVEN-dataset (accessed on 1 November 2023)
2020GeneralEnglishIt contains 4480 documents collected from Wikipedia covering 118,732 events that can be categorized into 168 types.
FewEvent
https://github.com/231sm/Low_Resource_KBP (accessed on 1 November 2023)
2020GeneralEnglishIt expanded ACE2005 and TACKBP 2017 by importing new events from FreeBase and Wikipedia, including music, movies, sports, education, etc.
Table 2. The commonly used event relations.
RelationMeaningExtraction Templates
Causal relationOne event (cause) causes another event (effect) to occur.because, due to, because of, therefore, thus, result in, lead to, thereby, lie in, since, thanks to, due to the fact that
Consequent relationPartial order relation in which two events occur one after another in time.then, before, after, earlier, later, accordingly, subsequently, in consequence, consequently
Conditional relationOne event is the condition for another event.unless, “if … then…”, otherwise, “provided/given/assuming/supposing/in the event/on the condition that…”, as long as
Concurrency relationThe two events happen side by side.“not only … but also”, at the same time, simultaneously, “either … or”, alongside, together with
Table 3. The top five authors based on betweenness centrality for the years 2012 to 2022.
AuthorFull NameBetweenness
Centrality
Average Year
Schruben LSchruben Lee0.102012
Liu YLiu Yu0.082014
Mikolov TMikolov Tomas0.052018
Levin DALevin David Asher0.052012
Li HLi Huaqing0.042012
Table 4. The top five authors sorted by the citation burst for the years 2012 to 2022.
AuthorFull NameCitation BurstBegin (Year)
Mikolov TMikolov Tomas9.512018
Perozzi BPerozzi Bryan6.422020
Grover AGrover Aditya5.62018
Nguyen THNguyen Thien Huu5.422019
Tang JTang Jian4.922018
Table 5. The summary of the clusters of author co-citation network.
Cluster IDSizeSilhouetteMean
(Year)
Label (LLR)
0620.9782017flow graph analysis; data flow; online analysis
1390.9792012dependency; domain-specific modeling; business process simulation
6230.9932013automatic loop detection; application structure detection; performance monitoring
10140.9942012causality-associated graph neural network; bio-event extraction; news event
Table 6. The top five journals sorted by the frequency of publications for the years 2012 to 2022.
AbbreviationFull NameImpact FactorFrequency of
Publications
Average Year
AAAI CONF ARTIF INTEAAAI Conference on Artificial IntelligenceConference journal612018
IEEE T KNOWL DATA ENIEEE Transactions on Knowledge and Data Engineering8.9522015
IEEE T PATTERN ANALIEEE Transactions on Pattern Analysis and Machine Intelligence23.6352013
J MACH LEARN RESJournal of Machine Learning Research6.0312014
COMMUN ACMCommunications of the ACM22.7292012
Table 7. The top five journals based on betweenness centrality for the years 2012 to 2022.
AbbreviationFull NameImpact FactorBetweenness CentralityAverage Year
COMMUN ACMCommunications of the ACM22.70.232012
IEEE T KNOWL DATA EN IEEE Transactions on Knowledge and Data Engineering 8.90.222015
IEEE T PATTERN ANAL IEEE Transactions on Pattern Analysis and Machine Intelligence 23.60.192013
IEEE T SYST MAN CY-SIEEE Transactions on Systems, Man, and Cybernetics: Systems8.70.142020
J MACH LEARN RESJournal of Machine Learning Research6.00.132014
Table 8. The top five journals sorted by citation burst for the years 2012 to 2022.
AbbreviationFull NameImpact FactorBurstBegin (Year)End (Year)
PLOS ONEPlos One3.75.3820182020
SCIENCE Science 56.95.2420182019
ARTIF INTELLArtificial Intelligence14.45.2220132017
PROC VLDB ENDOWProceedings of the VLDB Endowment2.55.1620162019
NATURENature64.84.3420152018
Table 9. The largest six clusters in the journal co-citation network.
Cluster IDSizeSilhouetteMean
(Year)
Label (LLR)
0290.8182020attention mechanism; semantics; feature extraction; knowledge engineering; event extraction
1250.9232013event graph; process mining; logical process; model transformation; directed graphs
2240.7942016sequential pattern; event sequence; bridge event; big data; cognition graph
3240.8572014chain event graphs; Bayesian model selection; chain event graph; causality; event summarization
4190.8182017temporal networks; graph entropy; random walk with restart; spike-based; targeted event detection
670.9962021directed graphs; topology; multi-agent systems; eigenvalues and eigenfunctions; protocols
Table 10. The top five countries based on the publication frequency for the years 2012 to 2022.
CountryPublication FrequencyPercentageAverage Year
CHINA14326.384%2012
USA8215.129%2012
GERMANY366.642%2012
ENGLAND285.166%2013
FRANCE244.428%2013
Table 11. The top five countries based on betweenness centrality for the years 2012–2022.
CountryBetweenness CentralityDegree
Centrality
Average
Year
FRANCE0.35182013
USA0.20132012
CHINA0.18122012
AUSTRALIA0.16122013
NETHERLANDS0.1592016
Table 12. The top five keywords based on betweenness centrality for the years 2012 to 2022.
KeywordsBetweenness CentralityAverage Year
Machine learning0.22013
Model0.062014
Deep learning0.052016
Information visualization0.052012
Activity recognition0.052013
Table 13. The top four keywords sorted by the citation burst for the years 2012 to 2022.
KeywordsBurstBegin (Year)End (Year)
Deep learning20.8120182022
Machine learning9.420162020
Neural networks4.6220192020
Knowledge graph3.5420182022
Disclaimer/Publisher’s Note: The statements, opinions and data contained in all publications are solely those of the individual author(s) and contributor(s) and not of MDPI and/or the editor(s). MDPI and/or the editor(s) disclaim responsibility for any injury to people or property resulting from any ideas, methods, instructions or products referred to in the content.

