Article

Stability Analysis of Trench Wall for Diaphragm Wall in Ultra-Deep Circular Foundation Pit: A Comprehensive Investigation

1
Key Laboratory of Road and Traffic Engineering of Ministry of Education, Tongji University, Shanghai 201804, China
2
School of Traffic and Transportation, Beijing Jiaotong University, Beijing 100081, China
*
Author to whom correspondence should be addressed.
Appl. Sci. 2023, 13(21), 12037; https://doi.org/10.3390/app132112037
Submission received: 9 September 2023 / Revised: 25 October 2023 / Accepted: 30 October 2023 / Published: 4 November 2023
(This article belongs to the Topic Complex Rock Mechanics Problems and Solutions)

Abstract

:
Circular diaphragm walls are increasingly being used in ultra-deep foundation pits due to their arch-shaped bearing system, which provides reasonable structural support. The trench walls that form the circular ground connection wall are typically double-angled in shape, and their stability analysis remains a challenge. In this paper, an instability model for double-angled trench walls based on 3D sliding body analysis is proposed. The objective of this paper is to determine the minimum amount of slurry needed to maintain the integrity of the trench wall. The results show that the center of symmetry on the inside of the wall is the most vulnerable to damage, followed by the inside corner, and then the center and corner on the outside. The consideration of sliding bodies in overall and local stability calculations for double-angled trench wall shapes can provide a reasonable stability assessment.

1. Introduction

In recent years, urban development has increasingly utilized ultra-deep pits, which present significant challenges to construction safety due to their unstable nature and high risk [1,2]. Among the various types of foundation-pit-enclosing structures, underground diaphragm walls have become extensively utilized due to their benefits of high rigidity and robust integrity [3,4]. Circular diaphragm walls, in particular, have been found to be more suitable for ultra-deep foundation pits. The force characteristics of circular diaphragm walls exhibit an arch shape, whereby the ring direction is mainly subjected to axial forces, allowing for the full utilization of the enclosure structure’s strength. Nevertheless, it is worth noting that trench walls composing a diaphragm wall often suffer from collapse during construction, particularly when the structure is constructed in a soft and/or unstable soil layer with a sandy interlayer, as reported in prior research [5,6].
The conventional method of determining trench wall stability involves assuming the shape of the failure surface and developing an instability model based on the limit equilibrium theory [7,8]. Previous research has employed this approach to analyze various types of trenches. For example, Tsai [9,10,11] proposed a 3D analytical method based on the limit equilibrium theory, arching theory, and full-scale field tests for slurry-supported trenches in cohesionless soils. Fox utilized the Coulomb-type force balance method to derive analytical solutions for the safety factor and critical failure surface angle of slurry-supported trenches under drained effective stress and undrained total stress [12]. Han conducted 2D and 3D analyses of the local and overall stability of a slurry trench for cohesive soil using the limit equilibrium theory [13]. Zhang [14] proposed a limit equilibrium solution for the stability of slurry-supported trenches and combined the rotational 3D failure mechanism to analyze the stability of narrow trenches. Wang [15] adopted a 3D kinematic approach of limit analysis to analyze the trench stability and deformation law in non-uniform and undrained clay. However, these methods mainly evaluate rectangular trench sections, while circular underground diaphragm walls feature a double-angled design that increases their force characteristics and makes their stability evaluation even more complicated.
The application of numerical simulation in investigating the destruction mode of underground diaphragm walls has gained attention due to the development of computer technology. Researchers have delved into various aspects of this field, such as the impact of trench wall construction on surrounding environments, the soil response during the construction process, and factors affecting trench wall stability. Several studies have been conducted by scholars to address these issues. Oblozinsky [16] proposed a design suggestion for the stability of the slurry trench using the elastoplastic finite element method analysis and compared it with a centrifugal test. Grandas-Tavera [17] analyzed the failure laws of sliding bodies caused by the insufficient slurry support of a corner trench in normally consolidated clay. Li [18] used numerical finite element analysis to reveal the stability of 2D and 3D homogeneous and inhomogeneous undrained diaphragm wall trenches. Qin [19] investigated the stability of slurry-supported trenches by means of a discretization-based kinematic technique and upper-bound analysis. Wang [20] carried out a stability analysis of slurry-supported trenches in horizontally layered cohesive frictional soils using the kinematical approach of limit analysis. Moreover, scholars have analyzed various approaches to address the stability problem of trench walls. For instance, Xiao [21] studied the global and local stability methods and failure modes of a slurry trench wall through numerical simulation, centrifugal model tests, and theoretical analysis. These studies have contributed to the understanding of trench wall stability and the development of strategies to mitigate any risks. Lei [22] conducted a large number of literature surveys and case studies on the stability of slurry wall trenches during the construction of diaphragm wall panel trenches and summarized and analyzed key issues related to the destructive modes of slurry wall trench destabilization, theoretical analytical models and methods of stability, the formation of the slurry and its protection mechanism, and the influence of related factors on the stability of slurry wall trenches.
With the rapid development of urban construction, the demand for underground construction projects has been increasing year by year. Among them, diaphragm walls, as an important form of underground engineering, play a critical role in ensuring the safety and stability of underground structures. However, most current research on diaphragm walls is focused on rectangular trenches, while the newly emerging circular diaphragm walls composed of double-angled trench walls present unique challenges to their stability due to the presence of exterior angles. Thus, it is imperative to further investigate the factors that contribute to the stability of these walls. This study selected an ultra-deep foundation pit with a depth of 77.3 m as our research object and systematically analyzed the instability mechanism of the double-angled trench wall of the circular diaphragm wall. To this end, a theoretical analysis model for the instability of the trench wall was proposed to determine the minimum slurry weight required to maintain its stability. The findings provide valuable insights into the stability of a double-angled trench wall in circular diaphragm walls and offer practical guidance for the design and construction of underground engineering projects.

2. Analysis of Trench Wall Stability

2.1. Types of Trench Wall Instability

2.1.1. Overall Instability

Overall instabilities in soils typically occur near the surface or in shallow soils with depths ranging from approximately 5 to 15 m, and they may extend to the surface and distribute along the entire trench section. These instabilities are typically oval or rectangular in shape [22,23], as depicted in Figure 1. Shallow formations are more susceptible to instability when the ground is overloaded.

2.1.2. Local Instability

Local instability of the foundation soil is typically caused by weak interlayers, as illustrated in Figure 2. This instability can result in over-excavation, which increases the filling coefficient of the poured concrete and raises construction costs and difficulties [22]. The local stability of the trench wall with retaining slurry is also influenced by the infiltration of slurry into the soil surrounding the trench wall. The seepage force generated by the slurry infiltration into the fresh excavation surface can maintain the local stability of the soil on the trench wall before the formation of the slurry skin.

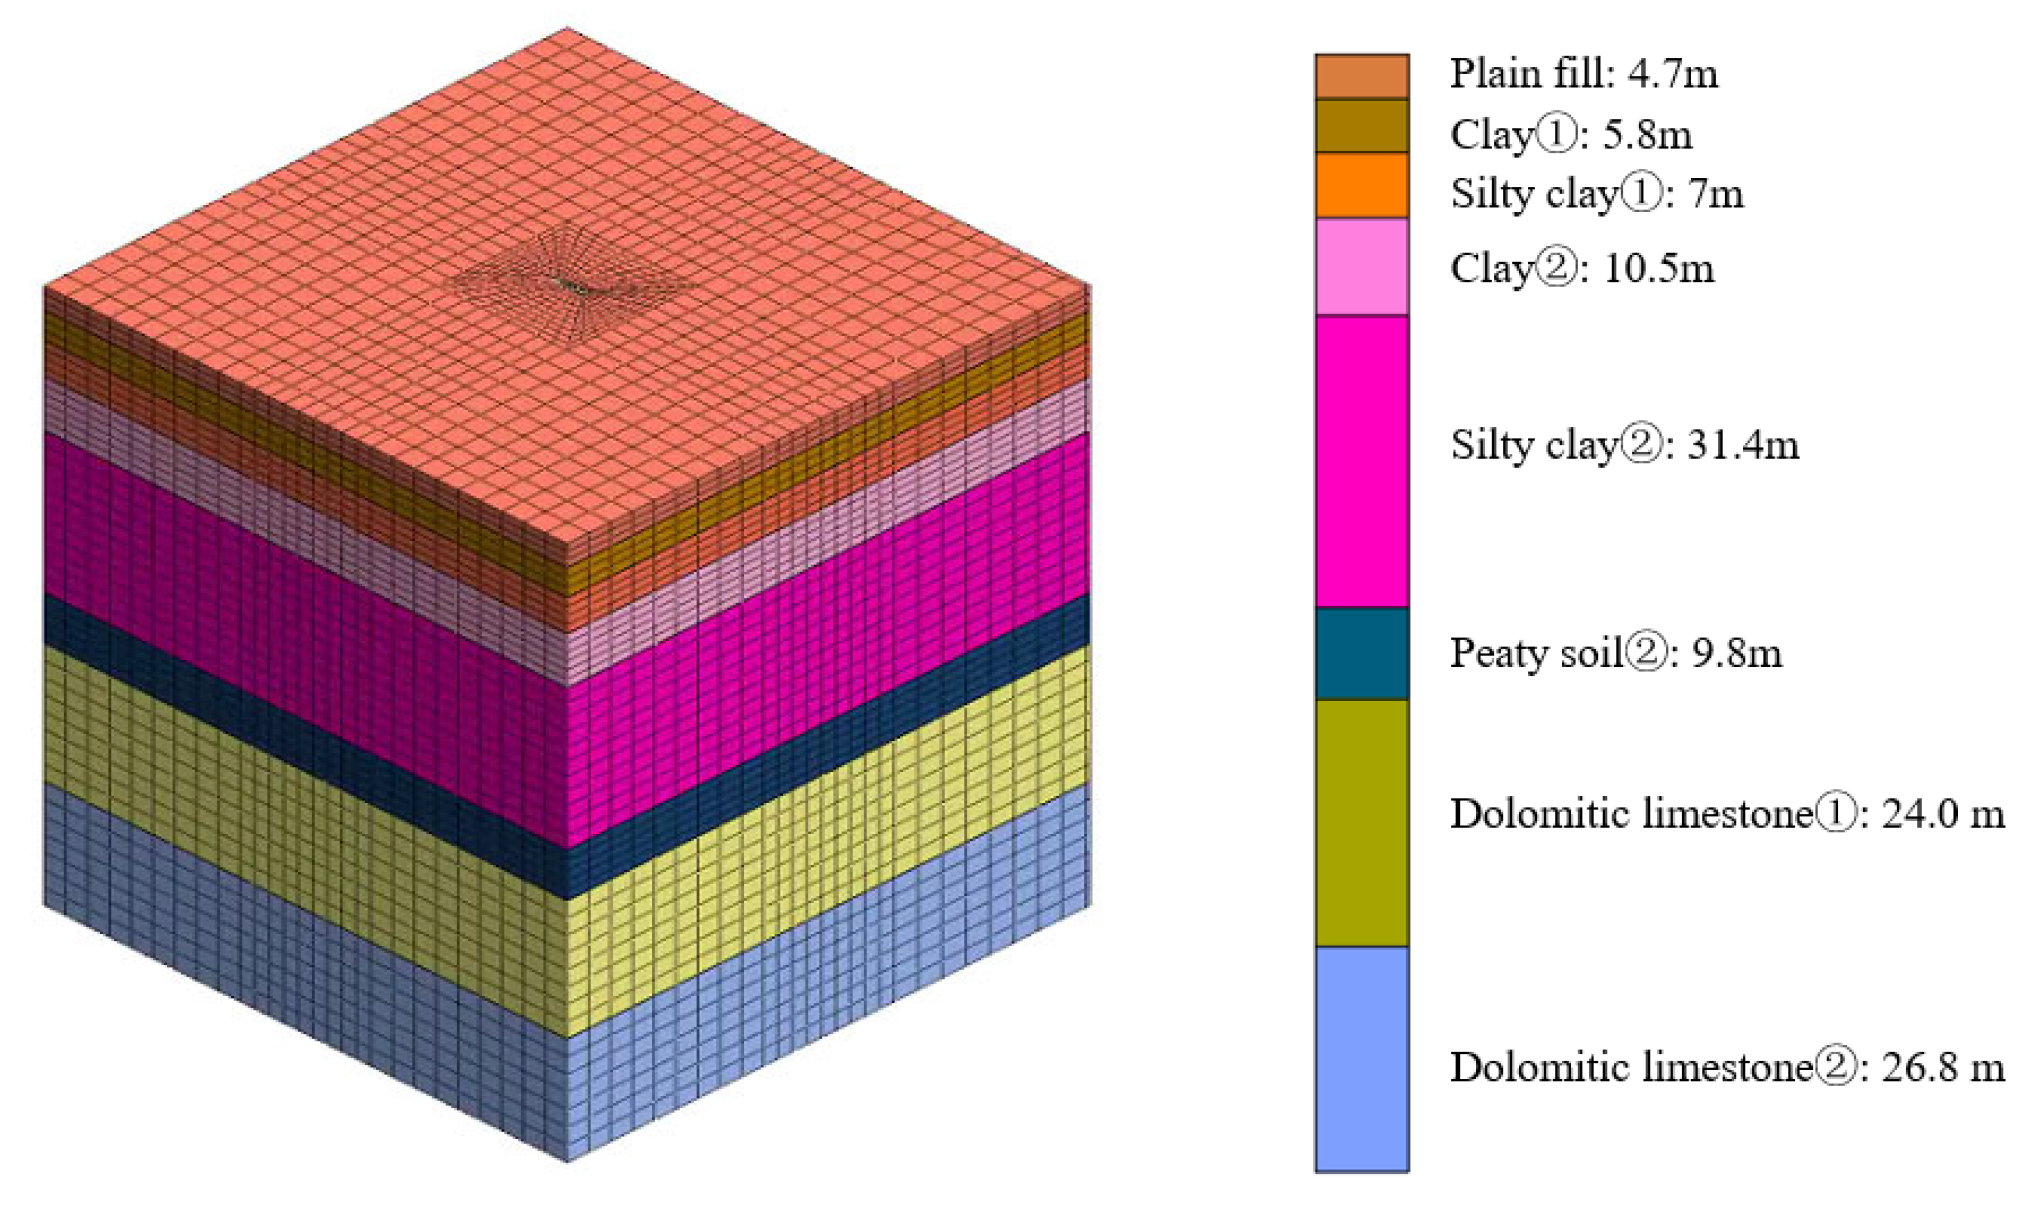
2.2. Project Overview

The Central Yunnan Water Diversion Project spans a total of 663.9 km and passes through six cities, namely Lijiang, Dali, Chuxiong, Kunming, Yuxi, and Honghe in Yunnan Province. The Kunming segment of the water transmission trunk canal, which covers a distance of 116.758 km, comprises six tunnels, four inverted siphons, an aqueduct, and a hidden culvert. The most significant inverted siphon within the Kunming section is the Longquan inverted siphon, which is situated primarily in the Panlong District of Kunming City and measures 5.07 km in length. It includes two working wells and a shield tunnel, with the originating well spanning 59 m and the receiving well comprising a circular structure with a radius of 10 m. The length of the diversion tunnel is approximately 5 km. As illustrated in Figure 3, the shield receiving well is situated within the green belt on the west side of the intersection between Kunqu Expressway and Fengyuan Road.
Illustrated in Figure 4, the enclosure structure is characterized by a circular underground diaphragm wall that is 1.5 m in thickness, complemented by an inner lining wall that is 1 m in thickness. The excavation depth of the foundation pit is recorded at 79.5 m. The main structure of the enclosure was erected using the open-cut and reverse construction approach.
The receiving well enclosure, depicted in Figure 5, consisted of a circular structure with a radius of 10 m, a 1.5 m thickness, and a 96.6 m depth, comprising 14 underground diaphragm walls. Specifically, there were seven first open-shaped wall sections and seven closed sections. Phase I and II each had seven slot sections, with the P1, P2, and P3 sections representing phase I wall sections, and S sections indicating the phase II wall section. The two phases were staggered using milled joints.
The underground continuous walls were constructed in strata primarily consisting of soft soil, which included silty clay and peat soil. The soft soil was characterized by high natural water content, low permeability, and low shear strength. It was classified as a highly sensitive soil layer, which tended to exhibit significantly reduced strength when disturbed. Therefore, treatment of the base soft soil and weak soil layers was required. The silty soil layer was susceptible to flow and sand flow, and the stability of the soil layer after excavation was weak. Table 1 presents the physical and mechanical properties of the geotechnical parameters involved.

3. 3D Sliding Force Balance Analysis

3.1. Overall Instability

To analyze the overall stability of the 3D trench wall, a wedge-shaped sliding face was assumed as the failure surface and the trench wall instability was then calculated. However, this method is only suitable for linear trench segments. As depicted in Figure 6, underground diaphragm walls are more susceptible to damage and instability due to the presence of corner angles, also known as positive angles, between the trench walls.

3.1.1. Model Building

In the absence of a retaining wall to protect the natural foundation, soil equilibrium can be disrupted by factors such as the presence of slurry, leading to the collapse of the trench wall. To analyze this instability, a wedge-shaped failure section with inclined sliding was assumed to exist, consisting of an upper triangular prism and a lower triangular pyramid (Figure 6). The limit equilibrium theory was applied, with assumptions made for various parameters, including the angle between the bottom sliding face and the horizontal plane ( α = 45 ° + φ / 2 ), the height of the failure body (H), the depth of the slurry liquid surface ( H s ), the depth of the groundwater level from the surface ( H w ), the height of the lower part of the wedge ( H c ), the length of a single excavation in the trench formation process (L), and the included angle (positive angle) of the adjacent trench segments ( β ), as illustrated in Figure 6.
Figure 6. Schematic diagram of sliding wedge.
Applsci 13 12037 g006
The destruction body is divided into two parts, including the upper triangular prism (abcdef) and the lower triangular prism (defg). The directions of each force are shown in Figure 7.

3.1.2. Destructive Force Analysis

The study utilized the soil weight below the groundwater as the floating weight in order to determine the volume of the destroying body. Specifically, we assumed that the groundwater level was within the range of the upper triangular prism (abcdef), allowing us to divide the volume of the destruction section into three distinct parts. The first part, denoted as V1, represents the volume of the triangular prism above the water level, while the second part, V2, corresponds to the triangular prism below the water level. Finally, the third part, V3, is the volume of the triangular pyramid.
The destruction volume V 1 above the groundwater level is
V 1 = H w L 2 sin β 2
The damage volume and the value below the groundwater level V 2 and V 3 are
V 2 = L 2 sin β ( H H c H w ) 2
and
V 3 = H c L 2 s i n β 6
The weight of the destroying body W can be obtained as
W = γ V 1 + γ ( V 2 + V 3 )
where γ is the heaviness of the soil, while γ is the effective heaviness. The slurry pressure can be divided into two parts, the slurry pressure acting on the triangular prism (abcdef) and the slurry pressure acting on the triangular pyramid (dgf). Taking the side face (abed) as an example, the slurry pressure F 1 acting on the face aged above the side of the wedge is
F 1 = L γ s ( H H c H s ) 2 2
where γ s is heaviness of the slurry. The slurry pressure F 2 acting on the face (deg) below the side of the wedge is
F 2 = H c L γ s ( H 2 H c 3 H s ) 2
Then, the projected resultant force F s of the slurry pressure on the vertical plane is
F s = 2 ( F 1 + F 2 ) cos ( 90 ° β 2 )
The water pressure F w 1 acting on the face (acfd) above the side of the wedge is
F w 1 = L γ w sin β 2 ( H H c H w ) 2
The water pressure F w 2 acting on the face (dfg) below the side of the wedge is
F w 2 = H c L γ w sin β 2 ( H 2 H c 3 H w )
The ground overload Q on the plane (abc) of the destruction face is
Q = L 2 q sin β 2
The normal reaction force N2 on the side (adfc) can be obtained by the earth pressure Pa and Fw1. The earth pressure can be calculated using the Rankine active pressure method. According to the Mohr–Coulomb strength theory, the tangential reaction force T2 on the sliding face at the limit equilibrium state can be obtained, and each force is calculated as
P a = K a q + γ H H c 2 2 c K a × 2 L sin β 2 H H c
N 2 = F w 1 + P a
T 2 = N 2 tan φ + 2 c L sin β 2 H H c
where K a is the active earth pressure coefficient. According to the force balance of the wedge-shaped body on the central axis face, the normal reaction force N1 on the bottom sliding face (dgf) is
N 1 = ( W + Q T 2 ) cos α + ( F s N 2 ) sin α F w 2
The tangential reaction force T1 on the bottom sliding face (dgf) in the limit equilibrium state is
T 1 = N 1 tan φ + c H c L sin β 2 sin α
The force balance equation can be obtained by projecting the above forces on the tangent direction of the upper and lower sliding faces on the axial face:
T 1 + ( F s N 2 ) cos α = ( W + Q T 2 ) sin α
The anti-sliding force and sliding force in the above formula are shifted and sorted separately, and then the safety factor is defined as follows:
K = F a s l i d e F s l i d e = T 1 + F s cos α + T 2 sin α ( Q + W ) sin α + N 2 cos α
When K = 1 , the critical slurry weight can be obtained.

3.2. Calculation of Local Instability of Double-Angled Trench

3.2.1. Model Building

We assume a partial sliding body with a single-sided trench wall, as shown in Figure 8, which exhibits circular sliding. The sliding body is simplified into a semi-circular cylinder with radius a, where the cylinder length is L, i.e., the single trench length, and the depth of the sliding body is H.

3.2.2. Destructive Force Analysis

To simplify the analysis process, the space problem is transformed into a plane strain problem by assuming that L >> a in the sliding body [22]. This simplification is shown in Figure 9, where the stress on the sliding body is depicted. In order to determine the moment of T, which is the tangential shear resistance on the sliding face, we have to solve for Ps, Pw, W, N, and T. While it is easy to calculate the moments of Ps, Pw, and W, the moment of T is more challenging to determine. To address this issue, we have utilized a section method that separates the upper soil strip and the lower part. The soil strips are subjected to micro-unit force balance, and the moment of T can be solved for by analyzing the stresses in the micro-strip element, shown in Figure 9. By ignoring the longitudinal interaction force between the soil strips, the stress of each soil strip can be obtained.
For upper soil strip i (Figure 9), the water pressure Pwi on the soil strip i is calculated as
P w i = a γ w ( H H w a cos θ i ) n
where n is the number of upper soil strips, and the thickness of each soil strip is a/n. The slurry pressure Psi on the soil strip is
P s i = a γ s ( H H s a cos θ i ) n
According to the Mohr–Coulomb strength criterion, the relationship between shear resistance and support force   N i is
T i = N i tan φ + c S i
where φ is the friction angle in soil, c is the soil cohesion, and S i = a / ( n × sin θ i ) is the contact area.
According to the mechanical balance of the horizontal direction of the soil strip, the following formula can be obtained:
N i sin θ i + T i cos θ i + P w i = P s i
Thus, the calculation formula of shear resistance Ti can be obtained according to Formulas (20) and (21) as follows:
T i = a c n tan φ a γ s ( H s H + a cos θ i ) n + a γ w ( H w H + a cos θ i ) n cos θ i + sin θ i tan φ
Similarly, for below soil strip j (Figure 9), the stress of each soil strip can be obtained if the longitudinal interaction force between the soil strips is ignored.
The water pressure Pwj on the soil strip is calculated as
P w j = a γ w ( H H w + a cos θ j ) n
The slurry pressure Psj on the soil strip is
P s j = a γ s ( H H s a cos θ j ) n
The relationship between shear resistance Tj and support force Nj is
T j = N j tan φ + c S j
According to the mechanical balance of the horizontal direction of the soil strip, the following formula can be obtained:
N j cos θ j + P w j = P s j + T j sin θ j
Then, the calculation formula of shear resistance can be obtained as follows:
T j = a γ s ( H H s + a cos θ j ) n + a γ w ( H H w + a cos θ j ) n a c cos θ j n sin θ j tan φ sin θ j cos θ j tan φ
For the overall force, the bending moment of the whole sliding body is calculated at point O, as shown in the following equations.
The calculation of the bending moment M1 due to its own weight is
M 1 = 1 2 π a 2 × γ × 4 3 π a = 2 3 γ a 3
The calculation of sliding bending moment M2 caused by water pressure is
M 2 = 1 2 × 2 γ w × a 2 = γ w a 2
The calculation of anti-sliding bending moment M3 caused by slurry pressure is
M 3 = 1 2 × 2 γ s × a 2 = γ s a 2
The calculation of anti-sliding bending moment M4 caused by shear resistance is
M 4 = i = 1 n T i a + i = 1 n T j a
Thus, the sliding body maintains mechanical equilibrium conditions as follows:
M 1 + M 2 = M 3 + M 4
The safety factor K is defined as follows:
K = M R M T = M 3 + M 4 M 1 + M 2
When, K = 1 and n the critical slurry weight γ s can be obtained.

3.3. Calculation Results of Overall and Local Instability

The determination of both the overall stability and local stability of the double-angled trench section of the circular ground connection wall is presented in Figure 10. It can be observed from the figure that with the increase in the depth, the slurry weight necessary to maintain the stability of the diaphragm wall exhibits an initial rise followed by stabilization. This entire process can be divided into three stages.
In the initial stage (stage I), the required slurry weight to maintain the stability of the diaphragm wall gradually increases with depth. At shallower depths of less than 30 m, overall instability is found to be more likely to occur compared to local instability. This is due to the influence of external factors, such as site overloading, which may result in small-scale overall instability near the surface. Within the depth range of 10 to 30 m, the slurry weight required to ensure the stability of the diaphragm wall exhibits a linear increase. To prevent the diaphragm wall from becoming unstable due to suboptimal slurry quality, it is recommended to reinforce the wall to a depth of at least 30 m.
As the depth increases, the stability of the diaphragm wall becomes a critical concern, particularly in stage II. Here, we observe that the slurry weight required to maintain the stability of the diaphragm wall remains nearly constant, except for a sharp shift at 60 m depth, where a layer of peat soil exists at the junction of rock and soil. This layer is susceptible to stress concentration, rendering it prone to instability. The physical and mechanical properties of peaty soil, such as low natural density, high water content, a large pore ratio, high compressibility, poor uniformity, and a low bearing capacity, can significantly affect the overall stability of the diaphragm wall. As a result, the diaphragm wall is vulnerable to destabilization in the presence of peaty soil.
In the stage Ⅲ, which corresponds to the deeper regions beyond 60 m, the slurry weight required to ensure the stability of the diaphragm wall remains practically constant. The critical slurry weight is noticeably lower in comparison to stage Ⅱ. This is primarily attributed to the fact that, upon entering the rock strata, the physical and mechanical properties of the surrounding geological material greatly improve, resulting in a higher stability threshold for the diaphragm wall. The superior properties of the rock strata, including their higher values of strength, stiffness, and cohesion, enable the diaphragm wall to better resist the destabilizing forces and thus maintain the overall stability.
In stage III, the critical slurry weight required to maintain the overall stability of the double-angled trench wall remains essentially constant and is significantly lower than in stage II. This is due to the better physical and mechanical properties of the underlying rock layer, resulting in a higher value and improved stability of the diaphragm wall. Therefore, the critical weight required to maintain the overall stability of the double-angled trench wall is determined to be 10.58 N/m3, while the critical gravity needed to maintain the local stability of the trench wall is 11.14 kN/m3.
Based on the explanation above, the slurry must have a specific density and consistency in order to provide wall protection. Many research studies have shown that when the density of the slurry increases, the hydrostatic pressure increases and the slurry wall trench becomes very stable [22]. In reality, the slurry density must be more than 10.3 kN/m3. A slurry with a high density also has high shear strength, which increases the gelling action and improves the groove hole stability [24].

4. 3D Numerical Analysis

4.1. Determination of Calculation and Parameters

The diaphragm wall analyzed has a specific geometric configuration with a width of 1.5 m, a length of 6 m, and a depth of 96.6 m, and it features a double-angled trench section as depicted in Figure 11. The simulation was conducted using solid components to represent the soil body, while the Mohr–Coulomb constitutive model was employed to characterize the soil material. The computational model used had dimensions of 120 m in height and 100 m in length, as presented in Figure 12. The displacement boundary conditions were specified on the bottom and sides of the model, while the top was left as a free surface. Moreover, typical horizontal displacement limitations were imposed to ensure the accuracy of the simulation results.
In the model, the trench wall was designed with a depth of 96 m and featured a multi-step configuration with five steps, each approximately 20 m in length. To ensure its stability, the excavation surface was subjected to slurry pressure after each excavation stage. Subsequently, the slurry pressure was gradually reduced as the excavation progressed towards the base of the trough section until the trench wall reached a critical limit and underwent destabilization, ultimately leading to its collapse. The height of the slurry liquid was set to 1 m below the ground, and the slurry pressure σ = γ s h i = γ s z 1 , where hi represents different depths (Figure 13).

4.2. Numerical Solution of Critical Slurry Weight

The monitoring point selection process was critical to assessing the displacement behavior of the extraction trench wall. To achieve this, the depth of Z = −62 m in the peaty soil layer was strategically chosen while setting the slurry weight at γ s = 13.2   k N / m 3 . The results, as presented in Figure 14, showed that significant displacement was mainly concentrated at the center and the angle of the trench section. Based on this observation, a series of monitoring points were carefully selected, as illustrated in Figure 15. The displacement curves of the selected monitoring points, plotted against the depth, are presented in Figure 16, with positive values indicating displacement towards the inside of the trench and negative values indicating displacement towards the outside of the trench wall.
Each point near the surface position (Figure 16), within the 0~5 m depth range, experiences displacement towards the inner direction of the trench, owing to an insufficient increase in shallow mud pressure to counteract the surface overload, ultimately resulting in overall destabilization and collapse damage. In contrast, displacement in the out-of-trench direction occurs at each point beyond 10~20 m and 70 m into the rock. The mud pressure exhibits a linear increase for depths between 10 and 20 m, whereas the soil and water pressure increases at a slower pace. For depths less than or equal to 70 m, the surrounding rock exhibits a significant soil arch effect, and the soil and water pressure is minimal. Thus, the mud pressure exceeds the soil and water pressure, causing the displacement of each measurement point towards the outside of the trench.
As the depth increased, the displacement of each measurement point towards the trench also increased, and it reached the maximum value at a depth range of 60~70 m, leading to a local instability collapse. This phenomenon can be attributed to two factors. Firstly, the meeting point of the soil and rock layers at this depth was prone to stress concentration, exacerbating the displacement towards the trench. Secondly, the physical and mechanical properties of the peat soil were inadequate, which resulted in the decreased stability of the diaphragm wall. The small natural density, high water content, large pore ratio, high compressibility, poor uniformity, and low bearing capacity of the peat soil all contributed to this instability.
According to the data presented in Figure 17, the displacement values of each point follow a consistent pattern, with the middle of the inner side of A-A being the most vulnerable area to damage in the circular ground connection wall with a double-angle trench. Whether it is the general instability failure in the shallow part or the local instability failure at depths of 60~70 m, the order of displacement values is A-A > C-C > B-B > D-D > E-E > F-F > G-G. Therefore, the corresponding measuring points on the A-A, B-B, C-C, and D-D measurement lines at Z = −62 m were selected for the further analysis of the local instability and damage points at depths of 60–70 m. As the slurry pressure decreases, the displacement change curve and change rate are as presented in Figure 17.
The findings presented in Figure 18 reveal a noteworthy trend in the horizontal displacement of each measurement point as the slurry weight decreases. Notably, the increase in displacement can be classified into two distinctive stages, a linear stage I and an exponential stage II. During stage I, when the slurry weight is above 9.5 kN/m3, each location displacement displays a linear growth trend in response to a decrease in slurry weight. Conversely, when the slurry weight falls below 9.5 kN/m3 in stage II, the displacement at each location shows an exponential growth trend. Interestingly, Figure 18 shows a sudden change in the rate of displacement as the slurry weight drops to approximately 9.5 kN/m3, indicating a shift from stage I to stage II. Collectively, these results demonstrate that the critical slurry weight for the diaphragm wall is approximately 9.5 kN/m3, as determined by the numerical simulation.
The geographical situation is one of the most important variables influencing the stability of the groove hole [22]. Aside from the shear strength (as demonstrated in experiments, if the soil’s cohesion and internal friction angle are low, the slurry wall trench can easily collapse), the soil density, grain size composition, and particle size all influence the stability of the groove hole. If the soil has high density and an excellent grain size composition, the slurry will not be readily lost, and a solid mud cake will build quickly on the slurry wall trench to maintain its stability. A mud cake, on the other hand, cannot be easily created if the soil has low density and a poor grain size composition and the slurry wall trench has high water permeability.

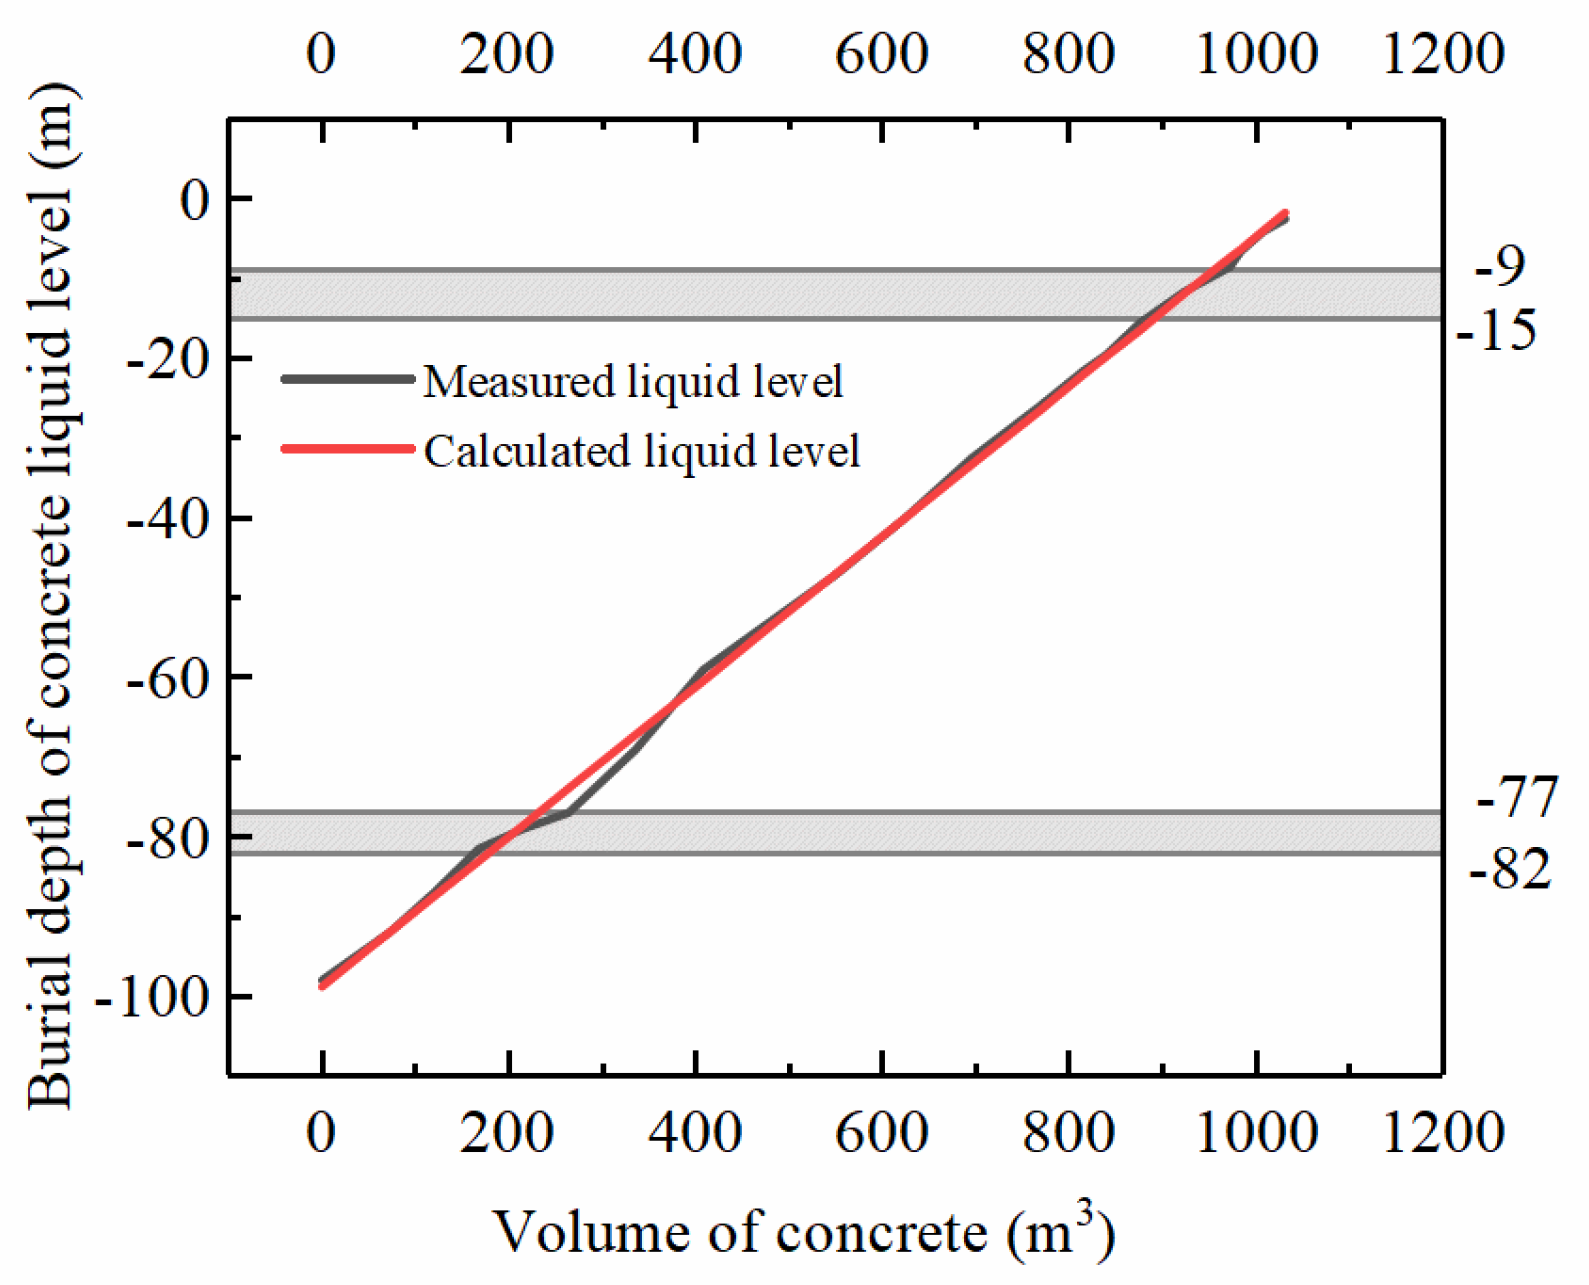
5. Engineering Verification

5.1. Comparison Results of Different Methods

In conclusion, this study calculates the critical gravity of the slurry using a variety of methods and compares the results with those found in the literature without taking the positive angle method into account, in order to determine the stability of the trench wall of the double-angle trench section. The results calculated with the 2D model are also given. The summary results are shown in Table 2.
Table 2 reveals the slurry weight obtained from the 3D calculation. After considering all the calculation methods presented above, it is recommended that, for this project, the slurry weight should be maintained at a level higher than 11.1 kN/m3, which is equivalent to a slurry specific gravity of no less than 1.14 g/cm3. During the actual construction process, the weight of the newly made slurry should be strictly controlled to not fall below 1.1 g/cm3, and the slurry weight in the wall should be maintained at approximately 1.2 g/cm3 by adjusting the slurry circulation. Such an approach will ensure that the diaphragm wall has adequate stability and is less susceptible to failure, which can be further improved by implementing real-time monitoring of the slurry weight during construction. The integration of these recommendations into the construction process is vital to minimize the risk of potential instability and ensure the safety and integrity of the project.

5.2. Stability Inspection

Prior to the commencement of concrete pouring during the construction process, ultrasonic inspections were conducted to assess the trench wall’s verticality. The results of the inspection for the I-1 trench segment are presented in Figure 18. The visual representation illustrates that the overall verticality of the ground connection wall is deemed satisfactory and meets the criterion of 1/650 for verticality. Additionally, no indications of instability were detected along the trench wall. These observations serve as evidence that the chosen slurry weight was effective in ensuring the stability of the trench wall.
The location of the collapsed hole in the trench wall can also be judged with the help of the rate of liquid level rise during concrete pouring. The construction records are analyzed using section Ⅰ-11 of this project as an example. The I-11 underground diaphragm wall is 98.2 m deep and the width type is double-angled, referring to Figure 15. The rate of concrete level rise during pouring is shown in Figure 19.
Figure 19 compares the calculated rising height of concrete with the actual rising height of concrete, as well as identifying the presence of any collapsed holes in the underground continuous wall. The calculated rising height of concrete represents the theoretical height of the liquid surface that should rise after pouring concrete, whereas the actual rising height of concrete refers to the measured height of the liquid surface on-site. A slow-down in the slope of the actual ascending height line may suggest the presence of a collapsed hole. Our results demonstrate that the slope of the actual ascending height line tends to slow down at the depth of 9~15 m and 77~82 m from the top of the wall, indicating the suspected location of the collapsed hole in the wall. This indicates that a heavier slurry is needed here for containment. This finding was found to be consistent with the results of ultrasonic trenching inspection records depicted in Figure 11, verifying the correctness of the 3D sliding force balance analysis proposed in Section 2.

6. Conclusions

This research investigates the instability mechanism of the double-angle trench section’s continuous wall through a combination of theoretical analysis, numerical simulation, and on-site measurement. A calculation model for trench wall instability is proposed by summarizing the types and calculations of instability. The circular ground connecting wall of the shield receiving well foundation pit in Yunnan Province, China is taken as a case study, and the results of various calculation methods are compared and examined. The study ultimately determines the minimum slurry weight required to ensure the stability of the diaphragm wall. The findings of this study are summarized as follows.
(1)
In this study, we have developed a novel calculation model to assess the overall stability of the double-angled trench. Drawing upon the Mohr–Coulomb strength theory and limit equilibrium conditions, our model accounts for the influence of the positive angle of the sliding body of the double-angled trench section. Specifically, a minimum slurry weight calculation formula to ensure the total stability of the diaphragm wall was derived.
(2)
A theoretical calculation model for the maintenance of the local stability of the diaphragm wall is established by utilizing the strip method and the limit equilibrium condition to analyze the force of the micro-soil unit. This model allows for the consideration of the impact of various factors on local instability. By employing this model, a formula for the calculation of the minimum slurry weight required to ensure the local stability of the diaphragm wall was derived.
(3)
The stability of the double-angled trench section’s wall was analyzed using the finite element method that employed the strength reduction approach. The results showed that the center of the inner side of the trench wall was the most susceptible to damage, followed by the inner corner of the trench wall, and then the middle and outer corner of the outer side of the trench wall.
(4)
The model proposed in this paper is verified to be valid, but more extensive validation is still needed, such as considering different geologic conditions and trenching methods. In addition, the description of the connections between the groove segments and the methods of strengthening the reliability of the connections will be the focus of further research.

Author Contributions

Q.X.: conceptualization, formal analysis, investigation, writing—review and editing, funding acquisition, project administration. J.X.: data curation, formal analysis, methodology, investigation, writing—review and editing. Z.S.: methodology, investigation, formal analysis, validation, writing—original draft, writing—review and editing. L.L.: investigation, data curation, formal analysis. H.Y.: investigation, validation, writing—original draft, writing—review and editing. All authors have read and agreed to the published version of the manuscript.

Funding

This work is supported by the Key R&D Program of Shandong Province (No. 2021CXGC011203).

Institutional Review Board Statement

Not applicable.

Informed Consent Statement

Not applicable.

Data Availability Statement

The data presented in this study are available in the article.

Conflicts of Interest

The authors declare no conflict of interest.

References

  1. Zhang, J.; Li, M.; Ke, L.; Yi, J. Distributions of lateral earth pressure behind rock-socketed circular diaphragm walls considering radial deflection. Comput. Geotech. 2022, 143, 4604. [Google Scholar] [CrossRef]
  2. Liu, K.; Ariaratnam, S.T.; Zhang, P.; Chen, X.; Wang, J.; Ma, B.; Zhang, Y.; Feng, X.; Xu, T. Mechanical response of diaphragm wall supporting deep launch shaft induced by braced excavation and pipe jacking operation. Tunn. Undergr. Space Technol. 2023, 134, 4998. [Google Scholar] [CrossRef]
  3. Li, Y.C.; Pan, Q.; Cleall, P.J.; Chen, Y.M.; Ke, H. Stability analysis of slurry trenches in similar layered soils. J. Geotech. Geoenvironmental Eng. 2013, 139, 2109. [Google Scholar] [CrossRef]
  4. Huang, M.; Ning, J.; Yu, J.; Li, Y. Effect of slurry infiltration on trench stability of diaphragm wall in sand. Chin. J. Rock Mech. Eng. 2023, 42, 1777. [Google Scholar]
  5. Lei, M.F.; Peng, L.M.; Shi, C.H.; Zhang, Y.L.; Li, W.H. A simplified Calculation Method for Spatial Effect in Large-Long-Deep Foundation Pit and Its Analysis. Adv. Mater. Res. 2011, 243, 2762–2770. [Google Scholar] [CrossRef]
  6. Qian, L.; Hu, C.; Wang, X.; Jia, W.; Du, Y. Research status of the instability mode and its stability calculation method of underground diaphragm wall. J. Rail Way Sci. Eng. 2019, 1743, 1750. [Google Scholar]
  7. Han, C.Y.; Chen, J.J.; Wang, J.H.; Xia, X.H. 2D and 3D stability analysis of slurry trench in frictional/cohesive soil. J. Zhejiang Univ. Sci. A 2013, 14, 94–100. [Google Scholar] [CrossRef]
  8. Huang, F.; Wang, Y.; Xu, J.; Pan, Q.; Wang, D. Stability analysis of slurry trench based on nonlinear failure criterion and energy consumption analysis method. J. Rail Way Sci. Eng. 2022, 19, 491–499. [Google Scholar]
  9. Tsai, J.; Jou, L.; Hsieh, H. A full-scale stability experiment on a diaphragm wall trench. Can. Geotech. J. 2000, 37, 379–392. [Google Scholar] [CrossRef]
  10. Tsai, J.; Chang, C.; Jou, L. Lateral extrusion analysis of sandwiched weak soil in slurry trench. J. Geotech. Geoenvironmental Eng. 1998, 124, 1090. [Google Scholar] [CrossRef]
  11. Tsai, J.; Chang, J. Three-dimensional stability analysis for slurry-filled trench wall in cohesionless soil. Can. Geotech. J. 1996, 33, 798–808. [Google Scholar] [CrossRef]
  12. Fox, P.J. Analytical solutions for stability of slurry trench. J. Geotech. Geoenvironmental Eng. 2004, 130, 749–758. [Google Scholar] [CrossRef]
  13. Han, C.Y.; Wang, J.H.; Xia, X.H.; Chen, J.J. Limit analysis for local and overall stability of a slurry trench in cohesive soil. Int. J. Geomech. 2015, 15, 4026. [Google Scholar] [CrossRef]
  14. Zhang, F.; Gao, Y.F.; Leshchinsky, D.; Zhu, D.S.; Lei, G.H. Three-dimensional stability of slurry-supported trenches: End effects. Comput. Geotech. 2016, 74, 174–187. [Google Scholar] [CrossRef]
  15. Wang, H.; Huang, M.; Chian, S.C. Three-dimensional trench stability in non-uniform undrained clay with discretization-based kinematic analysis. Comput. Geotech. 2021, 135, 4166. [Google Scholar] [CrossRef]
  16. Oblozinsky, P.; Ugai, K.; Katagiri, M.; Saitoh, K.; Ishii, T.; Masuda, T.; Kuwabara, K. A design method for slurry trench wall stability in sandy ground based on the elasto-plastic FEM. Comput. Geotech. 2001, 28, 145–159. [Google Scholar] [CrossRef]
  17. Grandas-Tavera, C.E.; Triantafyllidis, T. Simulation of a corner slurry trench failure in clay. Comput. Geotech. 2012, 45, 107–117. [Google Scholar] [CrossRef]
  18. Li, A.J.; Merifield, R.S.; Lin, H.D.; Lyamin, A.V. Trench stability under bentonite pressure in purely cohesive clay. Int. J. Geomech. 2014, 14, 151–157. [Google Scholar] [CrossRef]
  19. Qin, C. Determination of slurry density required for stability of slurry-supported trenches excavated in partially submerged soils. Comput. Geotech. 2019, 116, 3212. [Google Scholar] [CrossRef]
  20. Wang, H.; Huang, M. Upper bound stability analysis of slurry-supported trenches in layered soils. Comput. Geotech. 2020, 122, 3554. [Google Scholar] [CrossRef]
  21. Xiao, H.; Sun, Y. Global and local stability analysis of slurry trenches under surcharge in soft soils. Int. J. Geotech. Eng. 2016, 10, 205–211. [Google Scholar] [CrossRef]
  22. Lei, M.; Liu, L.; Lin, Y.; Shi, C.; Yang, W.; Cao, C.; Liu, Y. Research Progress on Stability of Slurry Wall Trench of Underground Diaphragm Wall and Design Method of Slurry Unit Weight. Adv. Civ. Eng. 2019, 2019, 5374. [Google Scholar] [CrossRef]
  23. Morgenstern, N.; Amir-Tahmasseb, I. The stability of a slurry trench in cohesionless soils. Geotechnique 1965, 15, 387–395. [Google Scholar] [CrossRef]
  24. Wang, Z. Hole wall instability and mechanism of slurry protection about large diameter bilge well. J. Cent. South Univ. Sci. Technol. 2012, 43, 4864. [Google Scholar]
Figure 1. Schematic diagram of overall instability and destruction.
Applsci 13 12037 g001
Figure 2. Schematic diagram of local instability and destruction.
Applsci 13 12037 g002
Figure 3. Satellite map of receiving well location.
Applsci 13 12037 g003
Figure 4. Longitudinal section of receiving well structure (unit: m).
Applsci 13 12037 g004
Figure 5. Enclosure structure of the diaphragm wall.
Applsci 13 12037 g005
Figure 7. Stress balance analysis of trench wall destruction body.
Applsci 13 12037 g007
Figure 8. Local sliding body of the wall trench.
Applsci 13 12037 g008
Figure 9. Stress of failure body analysis model.
Applsci 13 12037 g009
Figure 10. Calculation results of overall stability and local instability.
Applsci 13 12037 g010
Figure 11. Schematic diagram of double-angled trench wall (unit: m).
Applsci 13 12037 g011
Figure 12. Calculation model diagram.
Applsci 13 12037 g012
Figure 13. Hydrostatic slurry pressure diagram.
Applsci 13 12037 g013
Figure 14. Horizontal displacement cloud around the trench wall at the depth of Z = −62 m. (a) X-direction; (b) Y-direction.
Applsci 13 12037 g014
Figure 15. Schematic diagram of the location of each measuring line.
Applsci 13 12037 g015
Figure 16. Distribution curve of horizontal displacement of each point on the measuring line.
Applsci 13 12037 g016
Figure 17. Curves of displacement at each measuring point with slurry weight. (a) Displacement; (b) displacement rate.
Applsci 13 12037 g017
Figure 18. Ⅰ-1 trench wall detection analysis (0~45 m).
Applsci 13 12037 g018
Figure 19. Real-time concrete level rise curve.
Applsci 13 12037 g019
Table 1. Geotechnical physical and mechanical parameters.
TypeThickness (m)Gravity
(kN/m3)
Poisson Ratio (−)Cohesion (kPa)Internal Friction Angle (°)Compression Modulus (MPa)Permeability Coefficient (m/s)
Plain fill4.718.70.351286.751.20 × 10−6
Clay ①5.818.90.4317.86.55.00 × 10−6
Silty clay ①719.30.430.89.66.621.60 × 10−7
Clay ②10.518.80.3830.598.845.00 × 10−6
Silty clay ②31.420.10.3531.312.28.521.10 × 10−7
Peaty soil9.813.90.35158.67.241.70 × 10−8
Dolomitic limestone50.821.60.311045265.00 × 10−5
Table 2. The critical gravity of slurry obtained by different calculation methods (unit: kN/m3).
Overall StabilityLocal Stability
Double-Angle Trench WallRectangular Section
10.5810.0611.14
Disclaimer/Publisher’s Note: The statements, opinions and data contained in all publications are solely those of the individual author(s) and contributor(s) and not of MDPI and/or the editor(s). MDPI and/or the editor(s) disclaim responsibility for any injury to people or property resulting from any ideas, methods, instructions or products referred to in the content.

