Article

Artificial Neural Networks for a Semantic Map of Variables in a Music Listening-Based Study

1
Istituti Clinici Scientifici Maugeri IRCCS, 27100 Pavia, Italy
2
Villa Santa Maria Foundation, 22038 Tavernerio, Italy
3
Department of Mathematics and Geosciences, University of Trieste, 34127 Trieste, Italy
*
Author to whom correspondence should be addressed.
Appl. Sci. 2023, 13(21), 11811; https://doi.org/10.3390/app132111811
Submission received: 9 May 2023 / Revised: 16 September 2023 / Accepted: 27 October 2023 / Published: 29 October 2023
(This article belongs to the Special Issue Artificial Intelligence (AI) in Neuroscience)

Abstract

:
Music listening is widely used in therapeutic music-based interventions across various clinical contexts. However, relating the diverse and overlapping musical elements to their potential effects is a complex task. Furthermore, the considerable subjectivity of musical preferences and perceptual components of music, influenced by factors like cultural and musical background, personality structure of the user, and clinical aspects (in the case of diseases), adds to the difficulty. This paper analyzes data derived from a previous randomized controlled study involving a healthy population (n = 320). The study aimed to induce relaxation through music listening experiences using both conventional and algorithmic approaches. The main goal of the current research is to identify potential relationships among the variables investigated during the experiment. To achieve this, we employed the Auto Contractive Map (Auto-CM), a fourth-generation artificial neural network (ANN). This approach allows us to quantify the strength of association between each of the variables with respect to all others in the dataset. The main results highlighted that individuals who achieved a state of relaxation by listening to music composed by Melomics-Health were predominantly over 49 years old, female, and had a high level of education and musical training. Conversely, for conventional (self-selected) music, the relaxing effect was correlated with the male population, aged less than 50 years, with a high level of education and musical training. Future studies conducted in clinical settings could help identify “responder” populations based on different types of music listening approaches.

1. Introduction

In addition to active music therapy interventions (relational or rehabilitative approaches), music listening-based approaches (self-selected or experimenter-selected experiences) are widely used in therapeutic music-based interventions [1,2,3].
These latest interventions have an interesting therapeutic potential in various clinical and preventive settings [3]. Music listening is applied in diverse clinical contexts, including anxiety [4,5], stress [6,7,8], pain [9,10,11,12], and other transient or structural symptoms. Moreover, it is commonly employed to promote well-being and improve the quality of life [13,14,15,16]. However, relating musical elements (which are often numerous and overlapping) to their potential effects is a complex task. An additional difficulty arises from the considerable subjectivity of musical preferences and perceptual components, influenced by multiple factors such as cultural and musical background, the user’s personality structure, clinical aspects (in the case of diseases), and more.
This paper compares conventional self-selected music listening with a specific type of experimenter-selected music: algorithmic music. Algorithmic music, in this case, Melomics-Health music [17,18], is developed to reduce musical complexity and the influence of cultural components. It creates musical pieces (primarily melodic lines) that do not strictly adhere to conventional musical rules. Such melodies can also be modulated, adjusted, and adapted according to therapeutic needs and user responses.
Melomics-Health is an algorithm designed for creating therapeutic music. Its creation aims to establish a connection between musical structures and parameters and their potential therapeutic effects. This algorithm has been tested in various clinical settings [7,19,20,21], mainly for relaxation/deactivation, activation, or distraction purposes.
A recent study [22] has also demonstrated the physiological impact (on the parameters of the cardiovascular autonomic system) of Melomics-Health songs, indicating different and opposing effects depending on whether the musical parameters of the composed songs were deactivating (relaxing) or activating.
In addition to these experiments, several studies have been conducted using machine learning techniques to identify potential predictive indicators of success in achieving a deactivating/relaxing state. These indicators are applicable to both algorithmic and conventional self-selected music listening programs, where subjects select their own songs.
These techniques provide crucial support for therapists, as they guide music choices based on therapeutic goals and help reduce the high level of subjectivity associated with the effects produced by musical stimuli.
The current study aligns with this perspective and aims to identify the variables connected to the main outcome (improvement in relaxation) related to an experiment involving both conventional and algorithmic music listening approaches [23]. We present a general methodology for this type of analysis, utilizing neural networks to generate semantic connectivity maps that illustrate the relationships between various factors related to the music listening experience. Specifically, we analyzed the correlation between the study’s variables and the relaxation condition for both self-selected and algorithmic music listening experiences. The results of this study can contribute to understanding which factors can be used to predict individuals who are more likely to respond or not respond to music listening for relaxation.

2. Materials and Methods

The study analyzed data from a previous research study [23], which aimed to evaluate the short-term effects of listening to conventional self-selected music compared to algorithmic music. In this study, three hundred and twenty healthy participants were recruited and divided into two groups based on musical training or practice, stratified by sex, age, and education. Each final subgroup was then randomized to either conventional or Melomics-Health music listening. Before starting the experiment, the researchers assessed the participants for any health-related problems and excluded individuals with deafness/hyperacusis issues, severe neurological/psychiatric diseases in the last year, and those showing a low level of cooperation or refusal.
To evaluate the participants’ relaxation levels, a Visual Analogue Scale (VAS) was used. The variation in relaxation levels, obtained by comparing VAS scores before and after music listening, was considered the dependent variable, with three possible categories: increase, decrease, or no variation.
After randomization, the participants listened to Melomics-Health or conventional self-selected music (using earphones) in a comfortable setting. Each music listening session lasted about 9 min. In the conventional music listening group, before the experiment, each subject was asked to select a list of 2–3 preferred relaxing pieces of music.
In the Melomics-Health study, participants listened to three musical compositions created via the Melomics-Health algorithm. These melodies were specifically composed using music parameters selected by the researchers, aimed at promoting relaxation and deactivation for therapeutic purposes.
In the present study, bypassing results concerning the relaxation levels obtained by different types of music listening (conventional or algorithmic), the connection between variables related to the listeners was analyzed to determine the characteristics of “responders” to two kinds of music stimuli.
The Melomics-Health group is utilizing algorithmic music generated through Melomics-Health technology. This music is presently being tested to create relaxing therapeutic compositions, particularly beneficial for addressing temporary symptoms commonly encountered in clinical scenarios, such as pre-surgical anxiety, stress, and pain.
The Melomics-Health compositions are constructed as a sequence of fragments, each defined independently by various parameters:
  • Timbre: indicating the instrument’s name;
  • Pitch range: representing the lowest and highest notes achievable within the instrument’s range (spanning from C0 to B7);
  • Time signature: denoting the rhythm with options like 2/4, 3/4, 4/4, 3/8, 6/8, 12/8, and other supported signatures;
  • Key: specified with the tonic’s name, along with the minus or plus symbol to indicate minor or major scales, and the corresponding notes of the scale in scientific pitch notation (A to G, with sharps or flats where applicable). If a note refers to a specific octave, its octave number is also indicated;
  • Tempo: measured in beats per minute (bpm), equivalent to adagio, andante, allegro, etc.;
  • Intervals: indicating the allowable pitch differences between notes (e.g., 2–3, 2–4);
  • Rhythm: representing the density of note durations, expressed as probabilities for each duration;
  • Dynamics: indicated by terms like “piano” (p) or “mezzoforte” (mf);
  • Duration: specifying the overall length of the fragment in seconds.
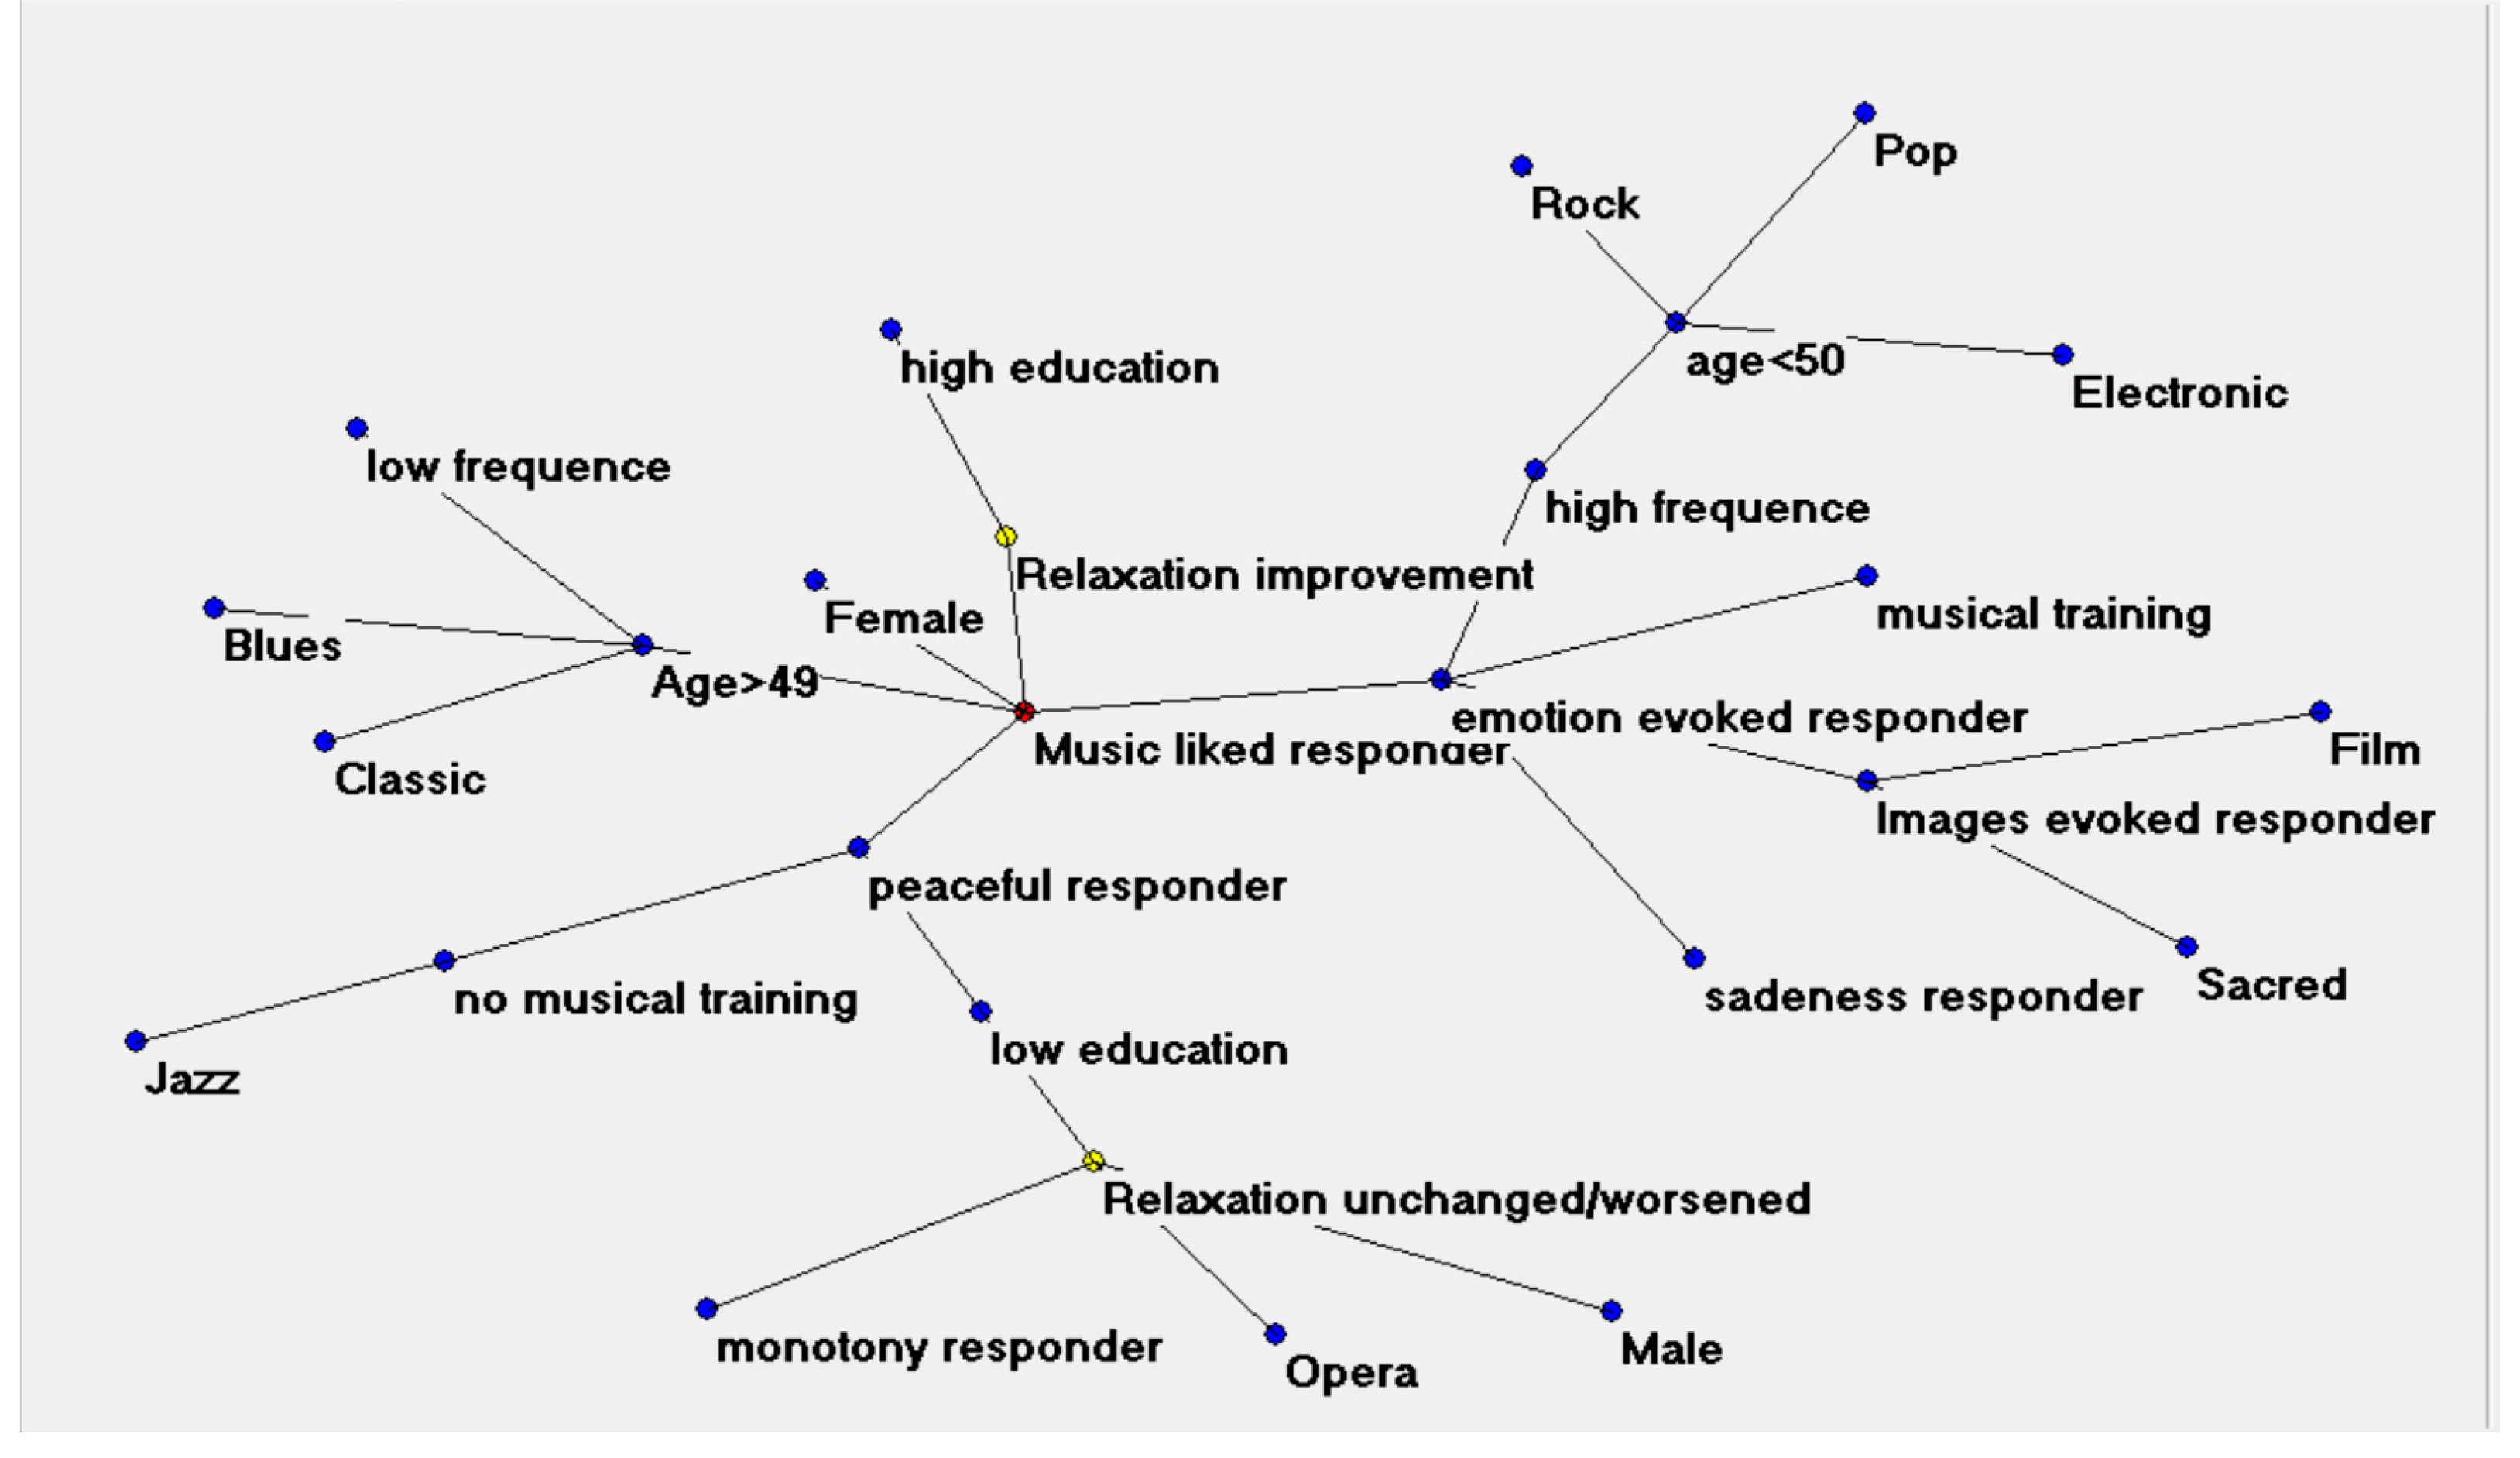
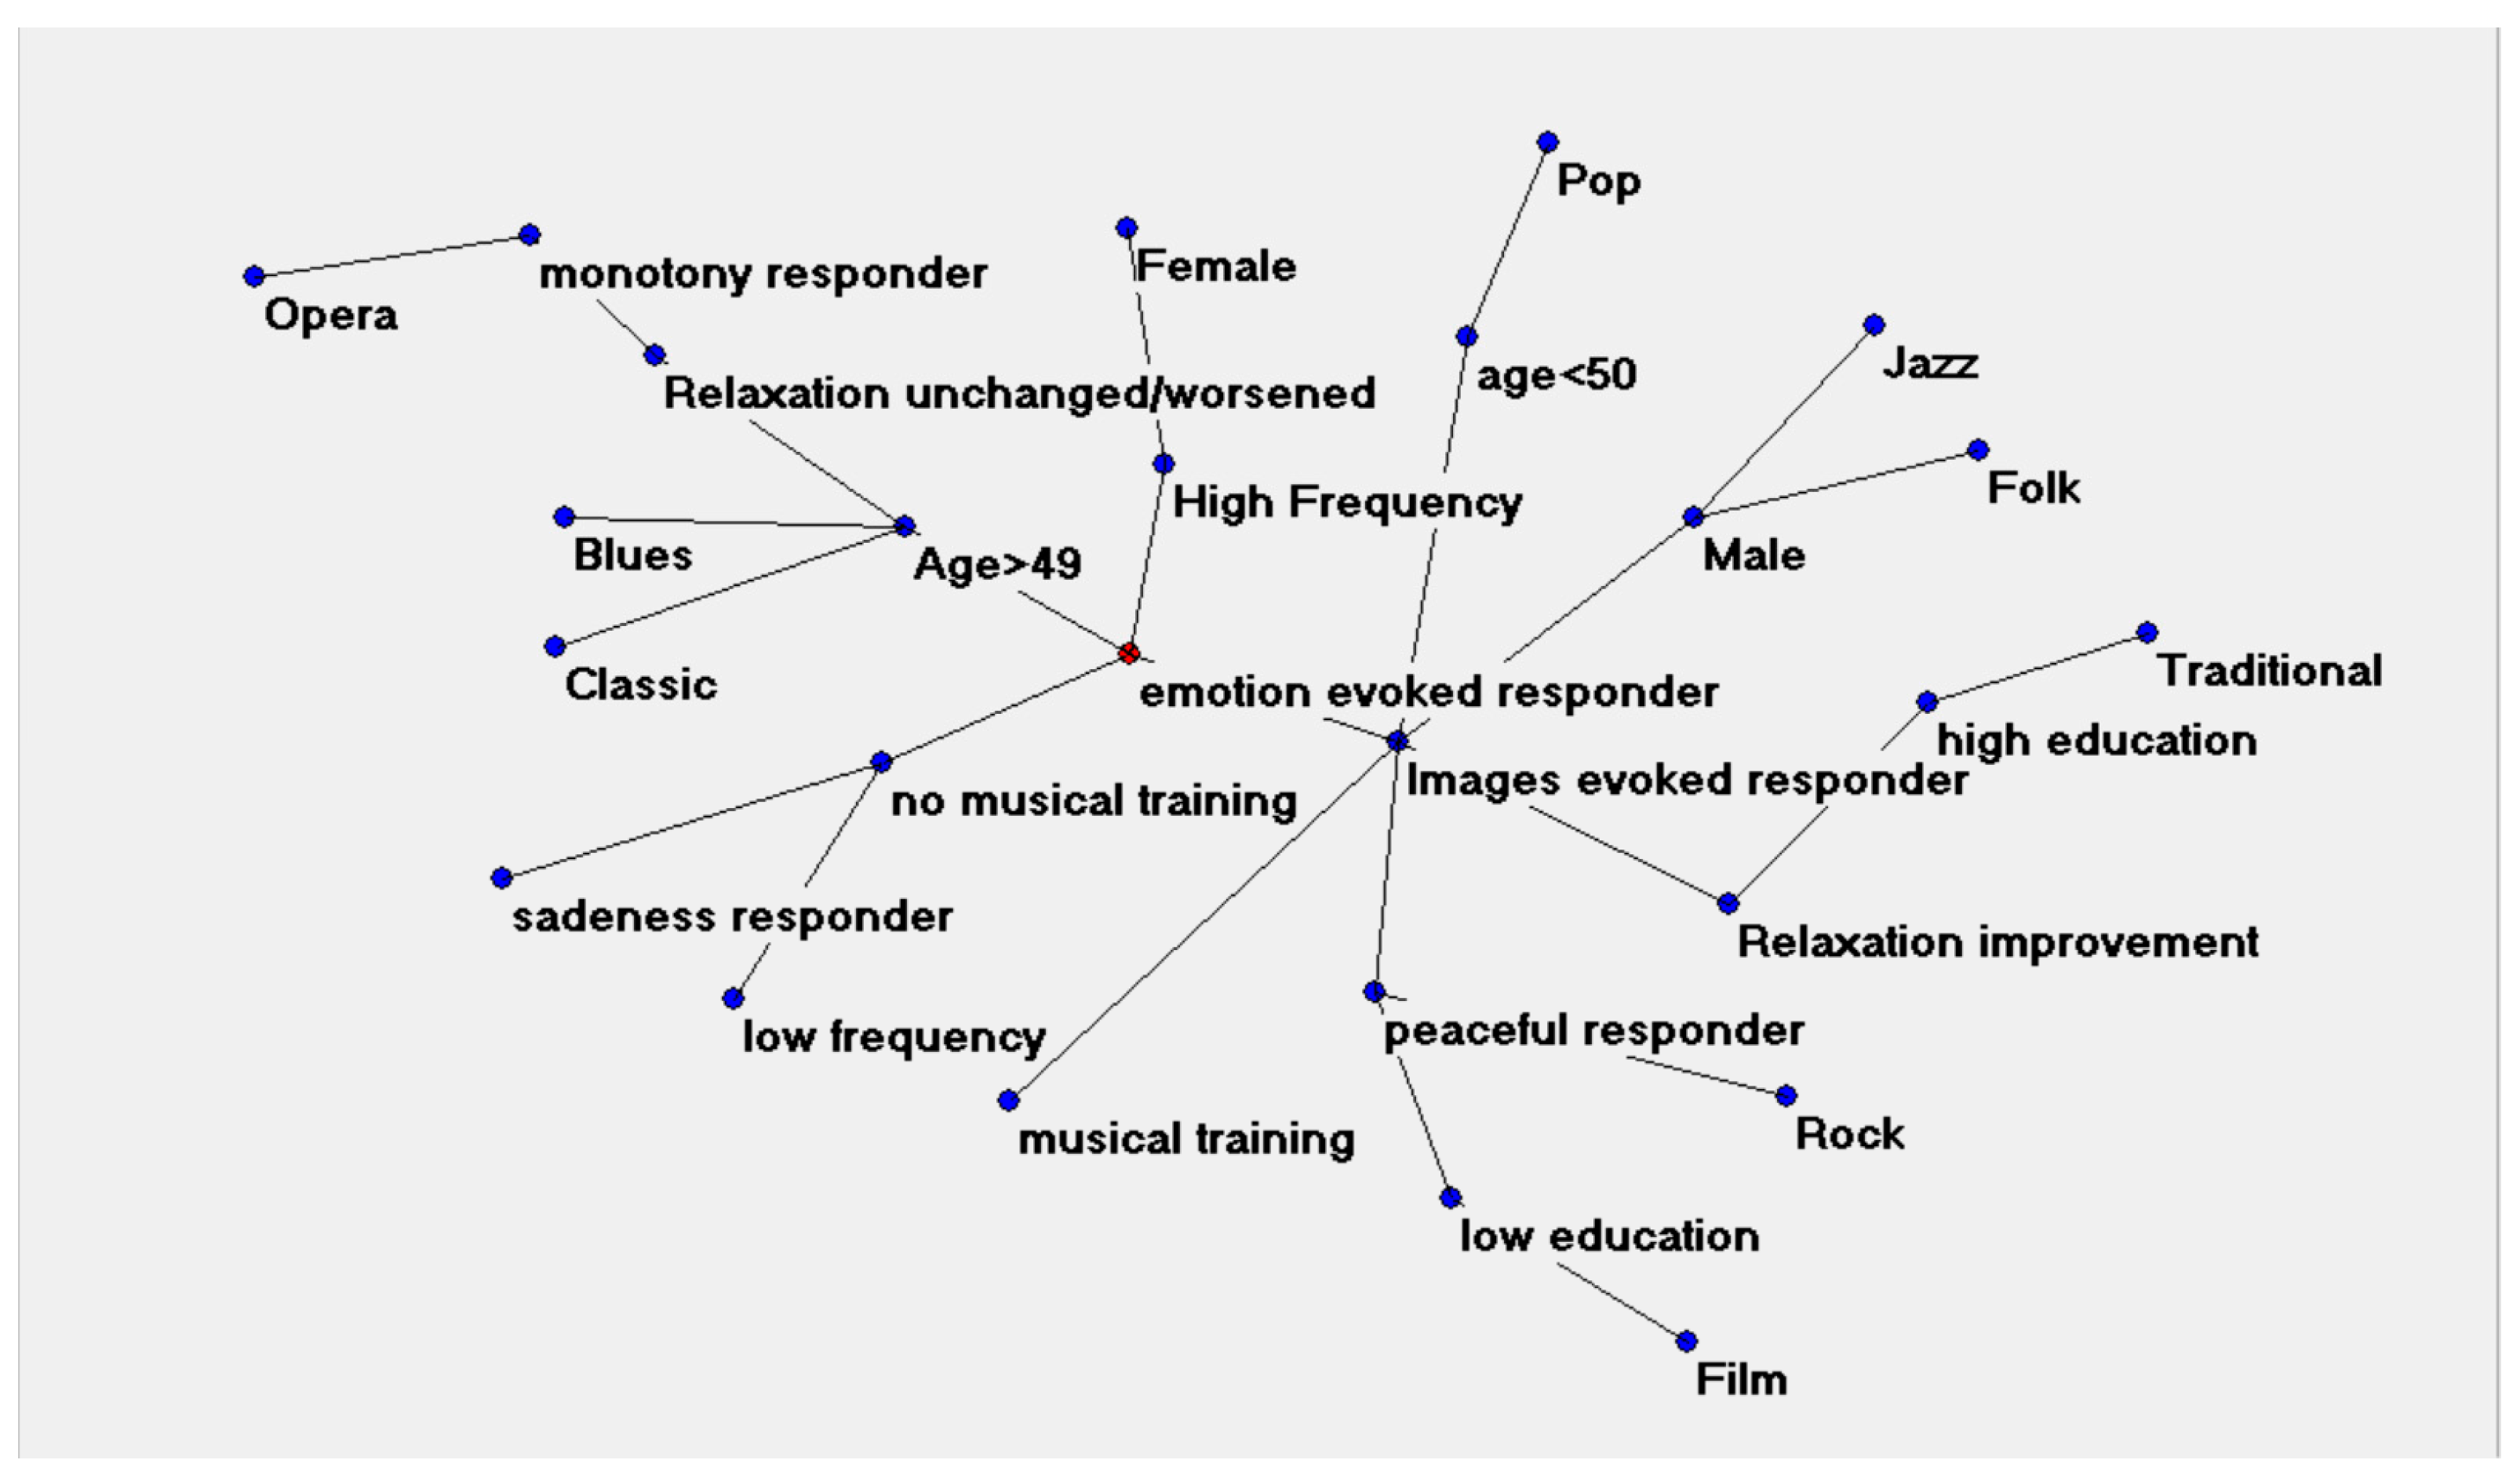
The process of creating each fragment’s musical structure involves dividing its total duration into beats based on the tempo. This resembles allocating a table with all possible note durations (according to the various parameters) present and then selecting concrete notes using a stochastic process [24].
Thus, notes are selected based on their probabilities, which is also part of the parameters. After determining the duration of a note, it is assigned a pitch that is relative to one of the previously selected notes, starting from an average pitch within the pitch range parameter and respecting the constraints on the intervals.
The Lilypond notation is used as one of the ways in which the score is written as output (the others being the MusicXML and midi notations), with each parameter of the fragment represented in this domain-specific language. This allows the score to be printed and synthesized, enabling an assessment of its suitability for the intended therapeutic use and making any necessary corrections.
This algorithmic process does not diminish the value of music; instead, it simplifies music to its core, facilitating better control of its structure and parameters. It enables the creation of music with specific therapeutic characteristics, designed and adapted to meet therapeutic needs. Consequently, the music becomes a therapeutic mediator crafted explicitly for this purpose, detached from cultural references tied to specific musical styles or genres.
The music produced by Melomics-Health is grounded in the use of the Western musical scale but does not rely on usual harmonic and melodic structures or connections. This renders the compositions atemporal and devoid of specific emotional or cognitive references. It is then important to verify in a scientifically sound way the efficacy of this musical material, for which the entire generation process is known and can be controlled and empowered by technology to shape it as desired to suit therapeutic requirements.
In contrast, existing music faces the complexity arising from the presence of both parameters and structures generated with a pre-defined form, making modifications without distorting the music itself challenging.
On the other hand, the Conventional Self-Selected Music Group participated by choosing 2–3 preferred relaxing pieces of music before the experiment.
The analysis was conducted using an artificial neural network known as the Auto Contractive Map (Auto-CM). Auto-CM is a special kind of unsupervised neural network. Unusually, the weights determined by Auto-CM after the training phase admit a direct interpretation. Specifically, they are proportional to the strength of many-to-many associations across all variables. This allows further, useful processing: association strengths may be easily visualized by transforming weights into physical distances. Such a ‘translation’ proceeds in an intuitive way: pairs of variables whose connection weights are higher get relatively closer, and vice versa.
Auto-CM is, thus, a mapping technique that computes the multidimensional strength of association between each variable and all others in the dataset. This method is particularly useful for identifying recurring patterns, regular correlations, hidden trends, and associations between variables. Its capability lies in creating a semantic connectivity map that preserves nonlinear relationships, captures non-linear connection schemes between clusters, and identifies complex similarities between variables.
Now, let us explore the structure of an Auto-CM network.
The architecture of an Auto-CM network is a three-layer one, with an input layer, a hidden layer, and an output layer, all consisting of the same number of neurons (i.e., the input and output sizes are equal). The inputs are directly connected to only one neuron of the hidden layer, different for each input, while all connections are present between the hidden and output layers.
That is, the entire set of parameters of the networks can be described by an N -dimensional vector v and a square N × N matrix w . All the weights of Auto-CM at the initialization moment are set near zero and not at random, as usual with other ANNs.
During the learning phase, the following four steps are performed: (1) the input signal is transferred to the hidden layer; (2) the weights of the connections between the inputs and the output are modified; (3) the signal is transferred from the hidden to the output layer; and (4) the connections between the hidden and output layers are then adapted.
In Auto-CM, all connections have positive values, and at the end of the training, all input vectors belonging to the training set will be mapped to the null vector. The effect is that the matrix w has learned a way to relate the input variables to each other to ‘cancel out’ the inputs and produce the null output vector. Therefore, the matrix w can be used to understand the relationships between the different variables. From w , it is possible to define a new matrix d with d ( i , j ) = N w ( i , j ) that is interpretable as a weighted graph.
As stated before, these weights can be easily conceptualized by converting them into physical distances: variables with stronger connection weights are brought closer to each other, while those with weaker connections remain more distant. The distances reflect the significance of the many-to-many relationships across all variables.
A Minimum Spanning Tree (MST) represents a connected, undirected graph that serves as the shortest possible path connecting all vertices, minimizing the total weighting of its edges. This concept was initially described by the Czech scientist Otakar Boruvka in 1926, with the aim of optimizing electricity connections between cities. Later, Kruskal’s deterministic algorithm provided an efficient algorithm for computing the MST [25].
As an example of application, in biomedical research, MSTs are used in microarray clustering. While MST-based clustering is equivalent (under certain conditions) to dendrograms generated via hierarchical clustering, their immediate visual representation can be vastly different.
Maupertuis’s principle in classical mechanics posits that the path followed by a physical system is the one with the least length, forming a special case of the more general principle of least action. The energy-based least action principle (LAP) has proven successful in the explanation of natural phenomena in both classical and modern physics.
For example, in biological systems, the kinetic paths derived from the LAP quantify the transition processes between normal and pathological states. Consequently, it is assumed that in a model with variables describing both normal and pathological states, their interconnected system would naturally be the one with the least length, which is well represented by the graph generated by MST.
An MST is a (not necessarily the only) spanning tree with a weight less than or equal to the weight of all other spanning trees. That is, an MST provides an optimal way to connect variables in a tree, offering the shortest possible total length of all the edges while preserving the connectivity of the graph.
The key advantage of the MST algorithm is its ability to provide a concise overview of the ensemble of variables when the weight of the edges represents some form of a relation between the variables and lower weights denote closer relations. This facilitates a clear understanding of clustering through links that connect closely related variables. Under this formulation, the importance of variables in the graph is determined by the number of their connections, so, for example, hubs—nodes with the maximum number of connections—represent important variables, and the degree of separation between two variables can be directly linked to their clustering distance.
A single graph can possess numerous different spanning trees. Moreover, each edge can be assigned a weight, representing its degree of unfavorability, allowing us to compute a weight for a spanning tree by summing the weights of its edges.
The Minimum Spanning Tree (MST) exemplifies the shortest combination among all possible methods for connecting variables in a tree, as demonstrated in the example presented in Figure 1.
Figure 1 shows the concept of MST applied to a graph of four vertices. Figure 1A depicts a complete graph (i.e., where all possible connections are present) with the weights of the connections on the edges. Figure 1B illustrates all 16 possible spanning trees, i.e., all the distinct ways to connect the four vertices without forming loops. If the sum of all distances is considered for each graph, there is one spanning tree in which the sum of distances produces the shortest path (sum = 6). This is the Minimum Spanning Tree for this set of points.
Computing the Minimum Spanning Tree results in a representation known as a “semantic connectivity map” [25]. This semantic connectivity map provides a compact and easy-to-understand view of the variables’ ensemble and makes it reasonably easy-to-understand how the variables are clustered by observing the links connecting variables that are very close to each other. This approach enables us to understand, in a visual way, the connection patterns between variables.
Additional mathematical details about the Auto-CM algorithm are described in the papers by Buscema et al. [26,27]. As far as the validation protocol is concerned, the stability of the MST statistical method was verified with a validation protocol described by Licastro et al. [28].
The Auto-CM algorithms used for all the computations presented in this paper are implemented only by Semeion proprietary research software, which is exclusively available for academic purposes (see https://www.semeion.it/site/en/auto-cm/, accessed on 8 May 2023). In the specific study of this paper, the amount of data and the lightweight nature of the algorithm made it possible to run on most existing consumer-grade hardware in seconds to minutes.

3. Results

Figure 2 summarizes the data on listening to algorithmic music, while Figure 3 presents the data on listening to conventional self-selected music. To interpret the map, focus on the nodes labeled “relaxation improvement” and “relaxation unchanged/worsened” in both graphs. The connections represent relationships between the variables. A shorter distance (the weighted sum of the edges along the path between two nodes) indicates a stronger connection, while a longer distance indicates a weaker connection. Therefore, nodes near “relaxation improvement” characterize the factors contributing to relaxation, whereas nodes near “relaxation unchanged/worsened” represent the factors associated with “non-responders,” i.e., those who do not respond positively to music listening.
The map (Figure 2) highlights that individuals who achieved a state of relaxation by listening to music composed by Melomics-Health were predominantly females aged over 49, with a high level of education and musical training. These individuals enjoyed the music, which created a sense of tranquility and evoked emotions. On the other hand, those who did not experience relaxation with the music composed by Melomics-Health were mainly males with a low level of education. These individuals perceived the music as calming but also monotonous. Additionally, non-relaxation was correlated with a preference for opera music in this group.
Regarding conventional self-selected music (Figure 2), the relaxation effect was associated with the male population under 50 years old, with a high level of education and musical training.
“Responder” listeners expressed preferences for ethnic/traditional genres and perceived the music as peaceful and evocative, triggering images and emotions. On the other hand, individuals who did not experience a change in relaxation were those over 49 years of age who perceived the music as evocative of emotions but monotonous. These listeners showed preferences for opera, classical, and blues genres.
It is worth noting that although the two semantic connectivity maps differ, they share a significant part of their structure. As discussed, the “profile” of responders or non-responders is quite similar in both cases. In the Supplementary Materials, additional figures resulting from the application of Auto-CM for the analysis are presented. These include the semantic connectivity maps with link strengths related to Melomics-Health and Self-Selected Music Groups (Figures S1 and S2, respectively), and the semantic connectivity maps with Minimum Spanning Tree and Maximal Regular Graph related to Melomics-Health and Self-Selected Music Groups (Figures S3 and S4, respectively).

4. Discussion

The study focused on identifying the characteristics of the target population that would most likely benefit from listening to music. The motivation for this study arises from the considerable subjectivity underlying different responses to music listening [29] and the introduction of a new music listening approach: algorithmic music. This type of music listening aims to understand the musical factors (music features and structures) that underlie the potential effects of music listening [17,18], in addition to subjective factors (listening pleasure and familiarity/predictability of the song and its reward mechanism) [30]. Therefore, it is crucial to determine which type of listener is most responsive to algorithmic music and whether there is a significant difference compared to self-selected music. The absence of such a difference might suggest the presence of underlying factors that are not influenced by the kind of music used in listening, implying that non-responders remain as such most of the time, regardless of the choice of music (self-selected or algorithmic).
The results of the study regarding the effects of algorithmic music listening show that certain characteristics, mainly related to age, gender, and education, are associated with positive outcomes (relaxation/deactivation effects). The greatest benefit was observed in women over 49 years of age with a high level of education and musical training. For these individuals, algorithmic songs were perceived as relaxing and evocative. Conversely, “non-responders” tended to be male with a low level of education, and they also perceived the music as peaceful but monotonous. Factors such as a high education level and musical training seem to have a greater impact, likely because they facilitate a cognitive predisposition to novelty and innovation. Moreover, factors like age and musical genre may also play a role in this predisposition.
Regarding conventional music, the desired relaxation effect was correlated with individuals under 50 years old, with a high level of education and musical training, and with a preference for ethnic/traditional genres. The evocation of images and emotions also appeared to be a common element among “responders,” while the perception of monotony remained an obstacle to achieving the relaxation/deactivation state. This finding was consistent for both conventional and algorithmic music, suggesting that certain factors are independent of the type of music used in the listening experience.
This approach provides an interesting perspective to support the music therapist in making music choices by identifying a possible “responder” profile.

5. Conclusions

The use of this approach can be considered a valuable tool for music therapists in identifying target populations that can benefit from algorithmic music or self-selected conventional music. However, it is essential to consider these data in conjunction with scientific evidence to uncover aspects that are not directly observable or assessable with traditional therapeutic approaches.
This study has also demonstrated that Auto-CM can be considered a novel and interpretable approach to exploring complex relationships between different variables. It represents an additional step in applying Auto-CM and machine learning techniques in general to the study of the effects of music listening.
Future research conducted in different clinical settings should be carried out to gain a broader understanding of the effects of different types of music listening and the factors that determine them.

Supplementary Materials

The following supporting information can be downloaded at: https://www.mdpi.com/article/10.3390/app132111811/s1, Figure S1: Semantic connectivity map with link strengths in the Melomics-Health Group; Figure S2: Semantic connectivity map with link strengths in the Self-Selected Music Group; Figure S3: Semantic connectivity map with Minimum Spanning Tree and Maximal Regular Graph (Melomics-Health Group). Figure S4: Semantic connectivity map with Minimum Spanning Tree and Maximal Regular Graph (Self-Selected Music Group).

Author Contributions

Conceptualization, A.R. and E.G.; methodology, A.R. and E.G.; software, E.G.; formal analysis, E.G. and L.M.; investigation, A.R.; data curation, E.G. and L.M.; writing—original draft preparation, A.R. and E.G.; writing—review and editing, L.M. All authors have read and agreed to the published version of the manuscript.

Funding

This research received no external funding.

Institutional Review Board Statement

The original study was conducted in accordance with the Declaration of Helsinki and approved by the Ethics Committee of ISTITUTI CLINICI SCIENTIFICI MAUGERI IRCCS, PAVIA, ITALY (2175CE, 11 January 2018).

Informed Consent Statement

Not applicable.

Data Availability Statement

The data presented in this study are available on request from the corresponding author.

Conflicts of Interest

The authors declare no conflict of interest.

References

  1. Raglio, A.; Oasi, O. Music and health: What interventions for what results? Front. Psychol. 2015, 6, 230. [Google Scholar] [CrossRef] [PubMed]
  2. Mc Ferran, K.; Grocke, D. Receptive Music Therapy. Techniques Clinical Applications and New Perspectives, 2nd ed.; Jessica Kingsley Publishers: London, UK, 2022. [Google Scholar]
  3. Raglio, A. Therapeutic music listening as telehealth intervention. Complement. Ther. Clin. Pract. 2020, 41, 101245. [Google Scholar] [CrossRef]
  4. Hole, J.; Hirsch, M.; Ball, E.; Meads, C. Music as an aid for postoperative recovery in adults: A systematic review and meta-analysis. Lancet 2015, 386, 1659–1671. [Google Scholar] [CrossRef] [PubMed]
  5. Guétin, S.; Portet, F.; Picot, M.C.; Pommié, C.; Messaoudi, M.; Djabelkir, L.; Olsen, A.L.; Cano, M.M.; Lecourt, E.; Touchon, J. Effect of music therapy on anxiety and depression in patients with Alzheimer’s type dementia: Randomised, controlled study. Dement. Geriatr. Cogn. Disord. 2009, 28, 36–46. [Google Scholar] [CrossRef]
  6. de Witte, M.; Pinho, A.D.S.; Stams, G.J.; Moonen, X.; Bos, A.E.; van Hooren, S. Music therapy for stress reduction: A systematic review and meta-analysis. Health Psychol. Rev. 2022, 16, 134–159. [Google Scholar] [CrossRef]
  7. Raglio, A.; Bellandi, D.; Gianotti, M.; Zanacchi, E.; Gnesi, M.; Monti, M.C.; Montomoli, C.; Vico, F.; Imbriani, C.; Giorgi, I.; et al. Daily music listening to reduce work-related stress: A randomized controlled pilot trial. J. Public Health 2020, 42, e81–e87. [Google Scholar] [CrossRef] [PubMed]
  8. Linnemann, A.; Ditzen, B.; Strahler, J.; Doerr, J.M.; Nater, U.M. Music listening as a means of stress reduction in daily life. Psychoneuroendocrinology 2015, 60, 82–90. [Google Scholar] [CrossRef]
  9. Colebaugh, C.A.; Wilson, J.M.; Flowers, K.M.; Overstreet, D.; Wang, D.; Edwards, R.R.; Chai, P.R.; Schreiber, K.L. The Impact of Varied Music Applications on Pain Perception and Situational Pain Catastrophizing. J. Pain 2023, 14, 1181–1192. [Google Scholar] [CrossRef]
  10. Chai, P.R.; Gale, J.Y.; Patton, M.E.; Schwartz, E.; Jambaulikar, G.D.; Wade Taylor, S.; Edwards, R.R.; Boyer, E.W.; Schreiber, K.L. The Impact of Music on Nociceptive Processing. Pain Med. 2020, 21, 3047–3054. [Google Scholar] [CrossRef]
  11. Martin-Saavedra, J.S.; Vergara-Mendez, L.D.; Pradilla, I.; Velez-van-Meerbeke, A.; Talero-Gutierrez, C. Standardizing music characteristics for the management of pain: A systematic review and meta-analysis of clinical trials. Complement. Ther. Med. 2018, 41, 81–89. [Google Scholar] [CrossRef]
  12. Lee, J.H. The Effects of Music on Pain: A Meta-Analysis. J. Music Ther. 2016, 3, 430–477, Erratum in J. Music. Ther. 2021, 58, 372. [Google Scholar] [CrossRef]
  13. McCrary, J.M.; Altenmüller, E.; Kretschmer, C.; Scholz, D.S. Association of Music Interventions with Health-Related Quality of Life: A Systematic Review and Meta-analysis. JAMA Netw. Open 2022, 5, e223236. [Google Scholar] [CrossRef] [PubMed]
  14. Nguyen, K.T.; Xiao, J.; Chan, D.N.S.; Zhang, M.; Chan, C.W. Effects of music intervention on anxiety, depression, and quality of life of cancer patients receiving chemotherapy: A systematic review and meta-analysis. Support Care Cancer 2022, 30, 5615–5626. [Google Scholar] [CrossRef]
  15. Schell, A.; Wassmer, F.; Zaubitzer, L.; Kramer, B.; Sadick, H.; Rotter, N.; Häussler, D. The effect of complementary music intervention on the patients’ quality of life after septoplasty and rhinoplasty. BMC Complement. Med. Ther. 2022, 22, 282. [Google Scholar] [CrossRef] [PubMed]
  16. van der Steen, J.T.; van Soest-Poortvliet, M.C.; van der Wouden, J.C.; Bruinsma, M.S.; Scholten, R.J.; Vink, A.C. Music-based therapeutic interventions for people with dementia. Cochrane Database Syst. Rev. 2018, 7, CD003477. [Google Scholar] [CrossRef]
  17. Raglio, A.; Vico, F. Music and Technology: The Curative Algorithm. Front. Psychol. 2017, 8, 2055. [Google Scholar] [CrossRef]
  18. Raglio, A.; Baiardi, P.; Vizzari, G.; Imbriani, M.; Castelli, M.; Manzoni, S.; Vico, F.; Manzoni, L. Algorithmic Music for Therapy: Effectiveness and Perspectives. Appl. Sci. 2021, 11, 8833. [Google Scholar] [CrossRef]
  19. Requena, G.; Sánchez, C.; Corzo-Higueras, J.L.; Reyes-Alvarado, S.; Rivas-Ruiz, F.; Vico, F.; Raglio, A. Melomics music medicine (M3) to lessen pain perception during pediatric prick test procedure. Pediatr. Allergy Immunol. 2014, 25, 721–724. [Google Scholar] [CrossRef]
  20. Raglio, A.; Bettaglio, R.; Manera, M.R.; Aiello, E.N.; Gontero, G.; Imbriani, C.; Brischigiaro, L.; Bonezzi, C.; Demartini, L. Feasibility of therapeutic music listening in fibromyalgia: A randomised controlled pilot study. Neurol. Sci. 2023, 44, 723–727. [Google Scholar] [CrossRef] [PubMed]
  21. Raglio, A.; Oddone, E.; Meaglia, I.; Monti, M.C.; Gnesi, M.; Gontero, G.; Imbriani, C.; Ivaldi, G.B. Conventional and Algorithmic Music Listening before Radiotherapy Treatment: A Randomized Controlled Pilot Study. Brain Sci. 2021, 11, 1618. [Google Scholar] [CrossRef]
  22. Raglio, A.; Maestri, R.; Robbi, E.; Pierobon, A.; La Rovere, M.T.; Pinna, G.D. Effect of Algorithmic Music Listening on Cardiac Autonomic Nervous System Activity: An Exploratory, Randomized Crossover Study. J. Clin. Med. 2022, 11, 5738. [Google Scholar] [CrossRef] [PubMed]
  23. Raglio, A.; Imbriani, M.; Imbriani, C.; Baiardi, P.; Manzoni, S.; Gianotti, M.; Castelli, M.; Vanneschi, L.; Vico, F.; Manzoni, L. Machine learning techniques to predict the effectiveness of music therapy: A randomized controlled trial. Comput. Methods Programs Biomed. 2020, 185, 10516. [Google Scholar] [CrossRef]
  24. Goldberg, D.E. Genetic Algorithms in Search, Optimization, and Machine Learning; Addison-Wesley Longman Publishing Co., Inc.: Boston, MA, USA, 1989. [Google Scholar]
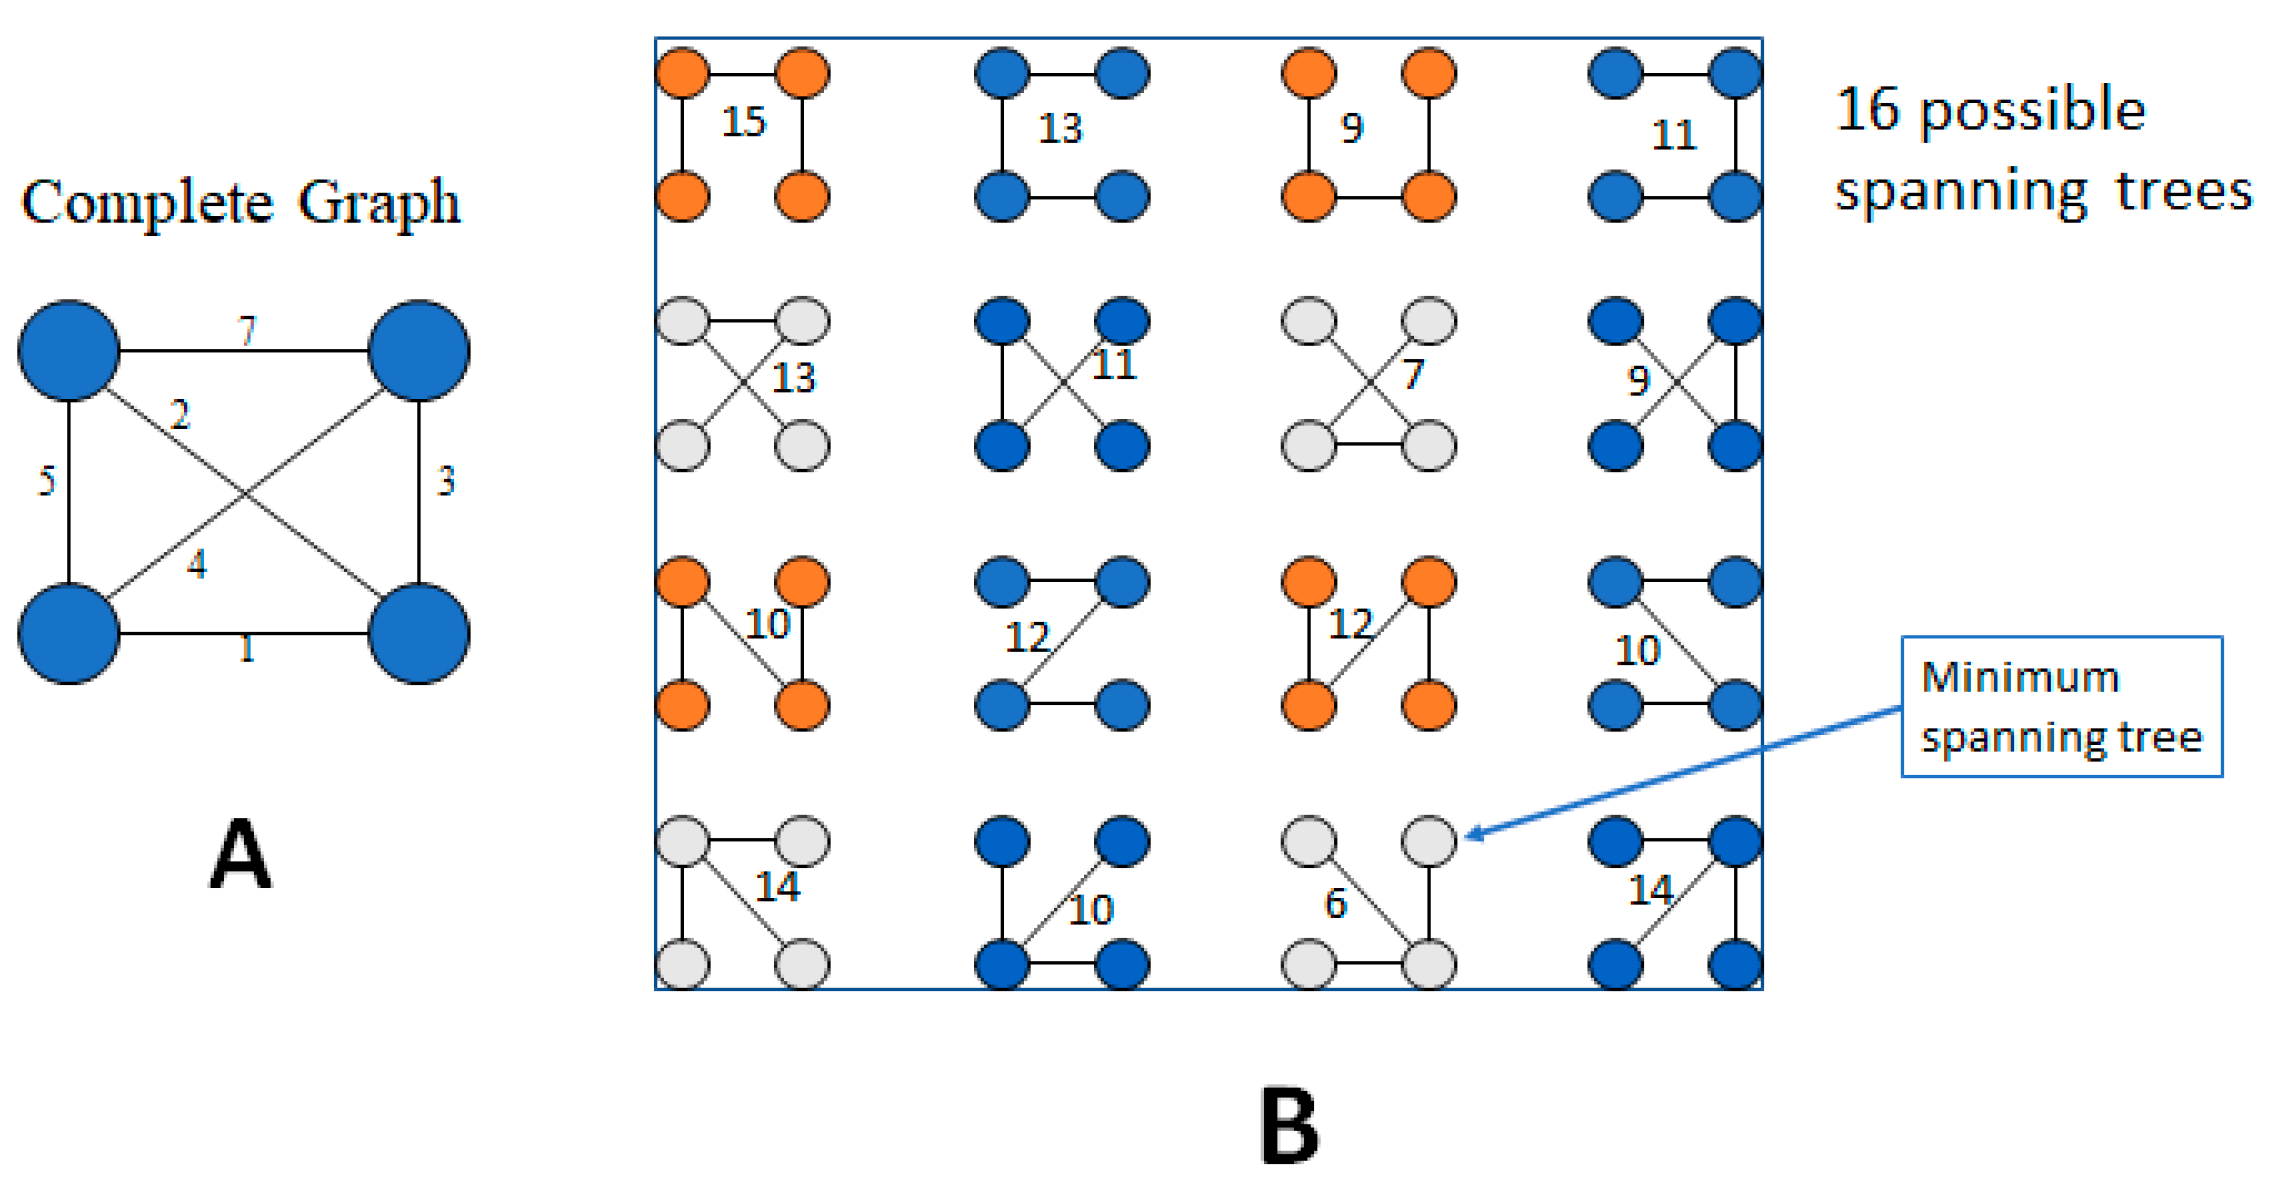
  25. Kruskal, J.B. On the Shortest Spanning Subtree of a Graph and the Traveling Salesman Problem. Proced. Am. Math. Soc. 1956, 7, 3. [Google Scholar] [CrossRef]
  26. Buscema, M.; Grossi, E. The semantic connectivity map: An adapting self-organising knowledge discovery method in data bases. Experience in gastro-oesophageal reflux disease. Int. J. Data Min. Bioinform. 2008, 2, 362–404. [Google Scholar] [CrossRef]
  27. Buscema, M.; Grossi, E.; Snowdon, D.; Antuono, P. Auto-contractive maps: An artificial adaptive system for data mining. An application to Alzheimer Disease. Curr. Alzheimer Res. 2008, 5, 481–498. [Google Scholar] [CrossRef]
  28. Licastro, F.; Porcellini, E.; Chiappelli, M.; Forti, P.; Buscema, M.; Ravaglia, G.; Grossi, E. Multivariable network associated with cognitive decline and dementia. Neurobiol. Aging 2010, 31, 257–269. [Google Scholar] [CrossRef] [PubMed]
  29. Raglio, A. A novel music-based therapeutic approach: The Therapeutic Music Listening. Front. Hum. Neurosci. 2023, 17, 1204593. [Google Scholar] [CrossRef]
  30. Zatorre, R.J. Why do we love music? In Cerebrum: The Dana Forum on Brain Science; Dana Foundation: New York, NY, USA, 2018; Volume 2018, pp. 16–18. [Google Scholar]
Figure 1. Minimum Spanning Tree.
Applsci 13 11811 g001
Figure 2. Semantic connectivity map of listening to algorithmic music.
Applsci 13 11811 g002
Figure 3. Semantic connectivity map of listening to conventional self-selected music.
Applsci 13 11811 g003
Disclaimer/Publisher’s Note: The statements, opinions and data contained in all publications are solely those of the individual author(s) and contributor(s) and not of MDPI and/or the editor(s). MDPI and/or the editor(s) disclaim responsibility for any injury to people or property resulting from any ideas, methods, instructions or products referred to in the content.

