Article

Neural Encoding of Pavement Textures during Exoskeleton Control: A Pilot Study

1
Department of Electromechanical Engineering, University of Beira Interior, 6201-001 Covilhã, Portugal
2
Department of Physics, University of Aveiro, 3810-193 Aveiro, Portugal
3
Institute of Biomedicine (iBiMED), Department of Medical Sciences, University of Aveiro, 3810-193 Aveiro, Portugal
*
Author to whom correspondence should be addressed.
Appl. Sci. 2023, 13(16), 9356; https://doi.org/10.3390/app13169356
Submission received: 21 July 2023 / Revised: 4 August 2023 / Accepted: 14 August 2023 / Published: 17 August 2023
(This article belongs to the Special Issue Artificial Intelligence (AI) in Neuroscience)

Abstract

:
This paper investigates the changes in sensory neural activity during exoskeleton control. Exoskeletons are becoming reliable tools for neurorehabilitation, as recent studies have shown that their use enhances neural plasticity. However, the specific neural correlates associated with exoskeleton control have not yet been described in detail. Therefore, in this pilot study, our aim was to investigate the effects of different pavement textures on the neural signals of participants (n = 5) while controlling a lower limb ExoAtlet®-powered exoskeleton. Subjects were instructed to walk on various types of pavements, including a flat surface, carpet, foam, and rubber circles, both with and without the exoskeleton. This setup resulted in eight different experimental conditions for classification (i.e., Exoskeleton/No Exoskeleton in one of four different pavements). Four-minute Electroencephalography (EEG) signals were recorded in each condition: (i) the power of the signals was compared for electrodes C3 and C4 across different conditions (Exoskeleton/No Exoskeleton on different pavements), and (ii) the signals were classified using four models: the linear support vector machine (L-SVM), the K-nearest neighbor algorithm (KNN), linear discriminant analysis (LDA), and the artificial neural network (ANN). the results of power analysis showed increases and decreases in power within the delta frequency bands in electrodes C3 and C4 across the various conditions. The results of comparison between classifiers revealed that LDA exhibited the highest performance with an accuracy of 85.71%. These findings support the notion that the sensory processing of pavement textures during exoskeleton control is associated with changes in the delta band of the C3 and C4 electrodes. From the results, it is concluded that the use of classifiers, such as LDA, allow for a better offline classification of different textures in EEG signals, with and without exoskeleton control, than the analysis of power in different frequency bands.

1. Introduction

Powered exoskeletons are becoming widely spread and reliable tools in the field of neurorehabilitation for spinal cord injuries, with multiple studies highlighting the beneficial neural plastic effects potentiated through their use. Previous studies have demonstrated that neurorehabilitation protocols combining motor-imagery-based brain–machine interfaces (BMIs) for exoskeleton control have led to significant neurological improvements [1,2,3]. Specifically, the combination of tactile feedback with motor imagery is becoming more common, thereby emphasizing the relevance of tactile processing for neurorehabilitation.
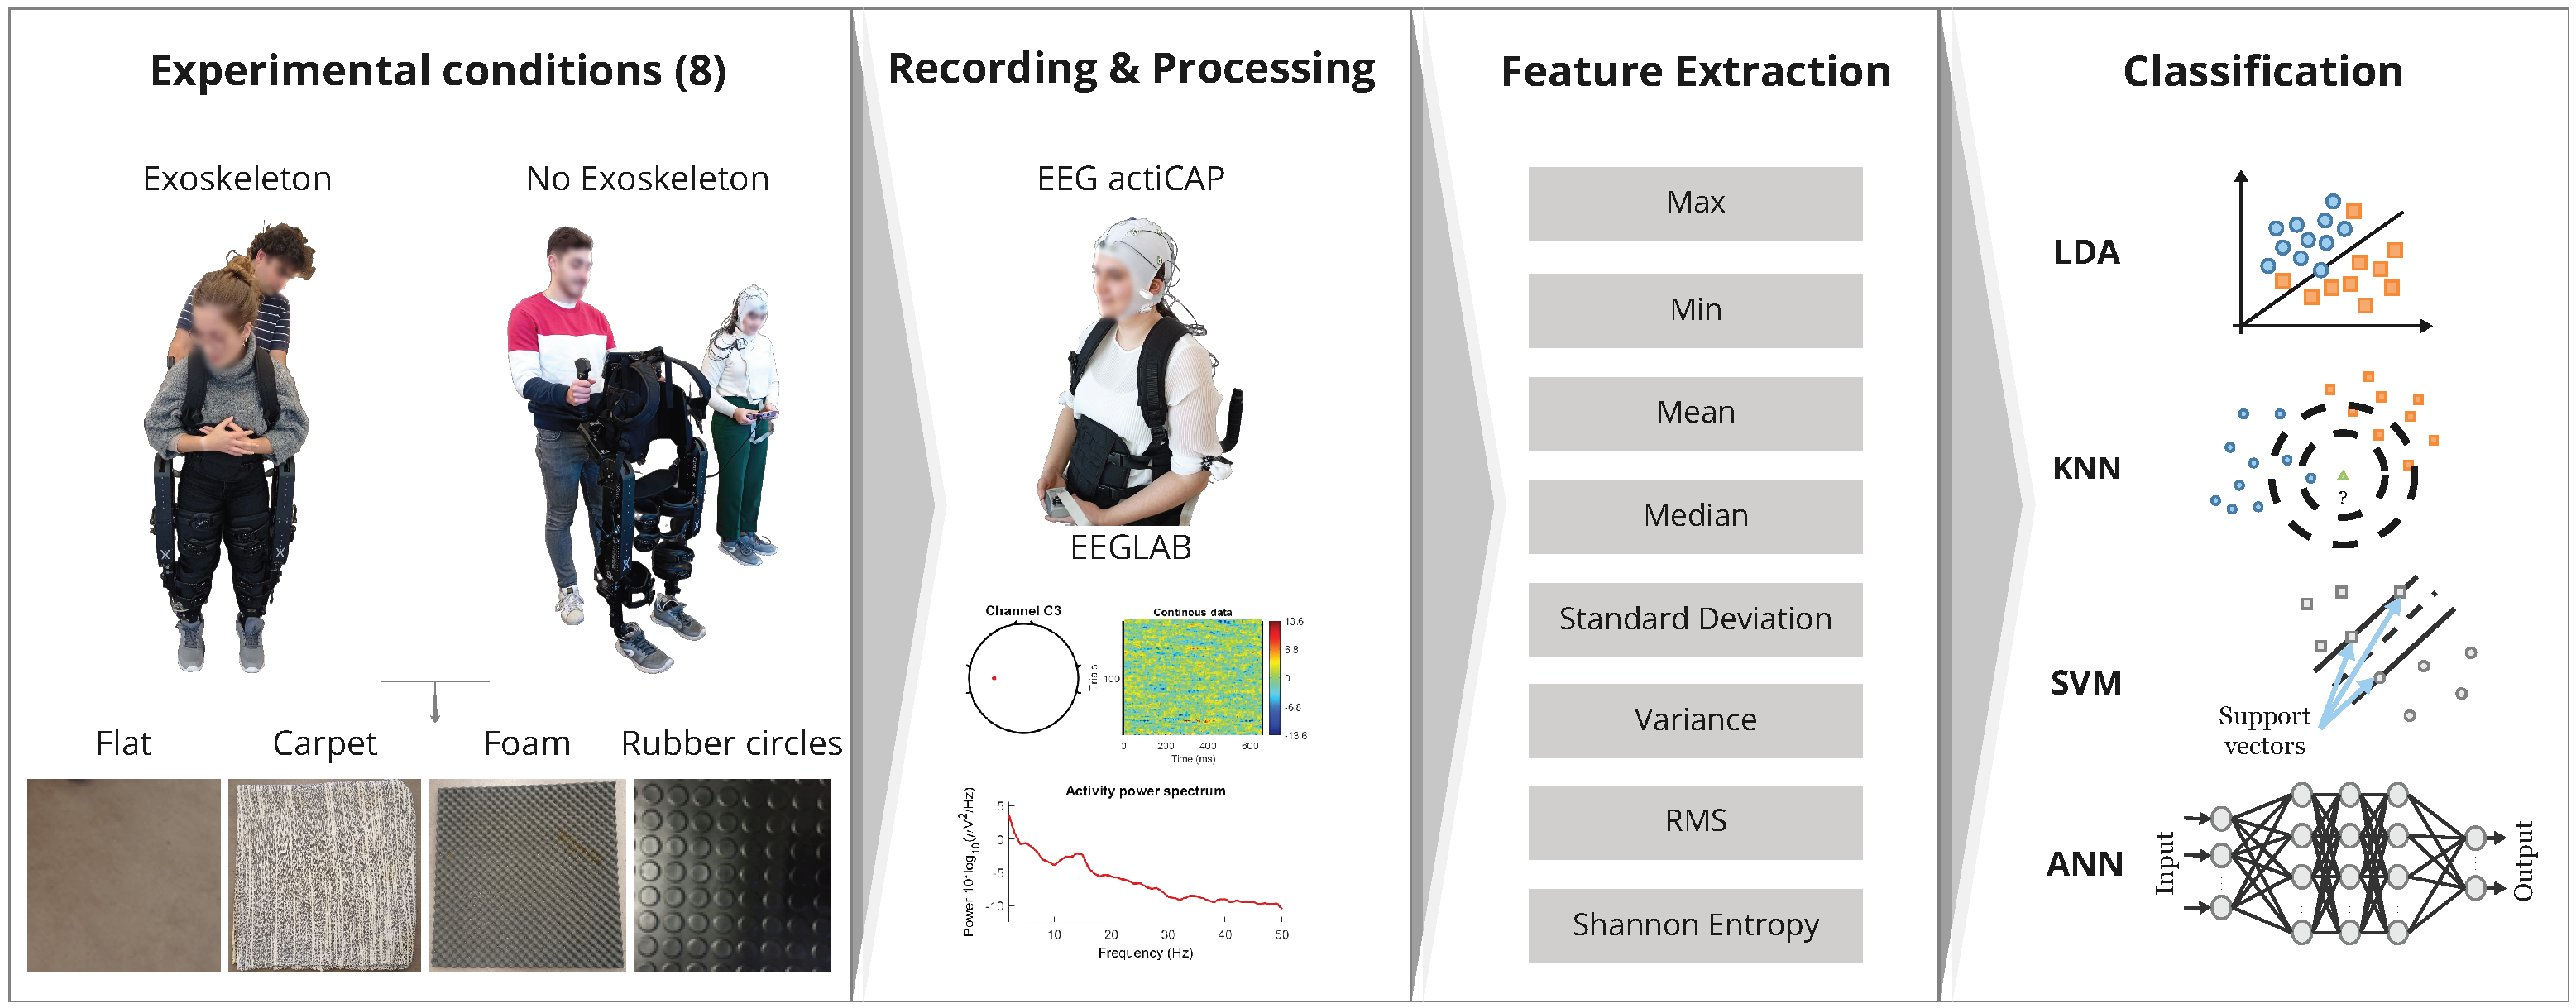
Currently, the utilization of an exoskeleton (refer to Figure 1) is often associated with the use of bulky equipment, which often necessitates close contact between the exoskeleton and the soles of the feet. This contact is achieved through artificial soles that provide support to the lower limbs. However, the presence of an additional component between the foot sole and the ground has the potential to interfere with the processing of the somatosensory information related to textures. Therefore, BMIs that integrate exoskeletons and somatosensory processing can offer numerous advantages, but the use of exoskeletons can have two potential effects: (i) they may reduce the number of somatosensory signals transmitted to the spinal cord, and (ii) they may introduce additional changes to the dynamics of somatosensory processing. Both of these effects have the potential to alter the performance of BMIs. Considering the possibility of diminished differences in somatosensory neural activity due to the aforementioned factors, it is important to evaluate the following: (a) the general patterns of neural activity associated with exoskeleton use and (b) the performance of common classifiers decoding the neural activity of individuals controlling an exoskeleton when encountering different textured pavements.
Neural correlates of tactile sensory processing have been extensively studied using electroencephalography [4,5,6,7], but there has been a growing interest in complementing the study of neural signals with the use of classifiers [8,9,10,11,12,13,14,15]. Some of the most popular classifiers for neural decoding include the linear support vector machine (L-SVM), the K-nearest neighbor algorithm (KNN), linear discriminant analysis (LDA), and the artificial neural network (ANN) [12,13,14].
The SVM creates a separation hyperplane to separate the two different input classes into the appropriate category. The data points nearest to the hyperplane are designated by support vectors, and the classification process is based on the mapping of the new input data point. This model evaluates on which side of the hyperplane the new value is located, which it then attributes to the corresponding class according to nearest support vector. This algorithm possesses lower computational complexity when compared with other supervised algorithms, such as the ANN and KNN [15,16,17].
The KNN is a nonparametric supervised algorithm that classifies different objects based on their K-closest neighbors. Therefore, for a new data point, this model determines the class by calculating the majority of the neighbours class labels. The letter “K” identifies the number of chosen neighbours, and, consequently, the selected value plays an important part in the model’s performance [15,16,17].
LDA is classified as a linear technique that uses, as with the SVM model, a hyperplane to separate the different classes and to classify the input data values. The main goal of this model is to reduce the input value space while maximizing the separation between classes in the data. This classifier has a low computational cost [15,16,17].
ANN models are inspired by the functioning of the human brain, more specifically, by how the neurons communicate between them. The basic unit of the ANN is the artificial neuron, which is also designated as the perceptron (neural network unit). The basic functioning of these units consists of input values that are multiplied by a specific weight. Afterwards, these values are summed, and this weighted sum is then passed to an activation function that controls the output, since it is responsible for concluding if the weighted sum value is smaller or bigger than the threshold value [15,16,17].
Several other types of classifiers based in tensor methods, deep learning, and Riemannian geometry are now gaining importance due to their ability to be used with smaller training data sets, their higher signal-to-noise ratios, and their capability for transfer learning [14,15].
In this study, we conducted a preliminary investigation to address the following questions: (1) whether there were clearly discernible patterns of neural activity recorded from electrodes at the C3 and C4 positions when subjects wore an exoskeleton, (2) whether neural activity exhibited variations when subjects walked on different textured surfaces, and (3) how four commonly used classifiers (SVM, KNN, LDA, and ANN) performed in the classification of exoskeleton use (i.e., Exoskeleton/No Exoskeleton) on four distinct types of pavements (flat surface, carpet, foam, and rubber circles).
We formulated the following hypotheses for this study: Hypothesis (1) proposed that the use of an exoskeleton would lead to changes in the power of specific frequency bands, as it has been demonstrated that exoskeleton control can interfere with other brain functions [18,19]. Hypothesis (2) proposed that stepping on less stable textures, which require greater stability during walking, would result in an increase in the central (C3, C4) alpha and theta frequency bands [20]. These frequency bands are typically associated with tasks involving the vestibular system. Lastly, Hypothesis (3) proposed that all four classifiers would demonstrate the ability to classify the eight-class problem (with/without Exoskeleton for all four pavements) above a chance level based solely on neural activity.
To gather preliminary evidence for these hypotheses, we conducted experiments that involved five subjects. The subjects performed walking tasks with and without an exoskeleton on four different textured pavements: flat (representing regular ground), carpet, foam, and rubber circles (refer to Figure 1). During the experiments, the subjects’ neural activity was recorded using an electroencephalogram (EEG). When the subjects were not using the exoskeleton, a member of the research team (referred to as exoskeleton operator) replicated the subjects’ movements with the exoskeleton. This was done by holding the exoskeleton near the subject, ensuring that the frequency and sounds associated with the exoskeleton’s movements remained similar between the measurements with and without the exoskeleton. (see Figure 1; also see Materials and Methodsbelow).
The developed work provides information on the neurophysiological basis of tactile processing during exoskeleton control. Additionally, this study also offers relevant data for the development of tactile-sensation-based BMI systems that aim to provide sensory feedback to their users.
The document is organized into five different chapters. The current Section 1 intends to describe the significance of this work and its relevance to the scientific community. Section 2 describes the methods used in this work in order to acquire, process, and classify the biosignal. In the following Section 3, the obtained results are accessed and Section 4 and the results are discussed while taking into account the main goal of this work. The Section 5 presents the conclusions that can be drawn from the developed study.

2. Materials and Methods

In this section, a description of the participants’ recruitment process, used materials, and experimental activity is given. Additionally, this section also describes the methods applied in the preprocessing, pilot analysis, wavelet decomposition, feature extraction, and classification steps.

2.1. Experimental Procedure

The initial stage of the experimental protocol involved adjusting the ExoAtlet based on the volunteer’s anatomical measurements by following the method previously described for this specific exoskeleton [19]. Once the device was properly adjusted, the participant donned the exoskeleton and then transitioned from a sitting position to standing up. During this stage of the experiment, the primary focus was to ensure the volunteer’s comfort. To achieve this, simple tests, such as walking in place and taking a few steps, were performed. These tests aimed to identify and address any potential discomfort experienced by the participants, thus allowing for prompt resolution of any issues. Additionally, this approach facilitated the gradual acclimation of participants to the weight and movements of the exoskeleton.
Once the participant expressed confidence with the robotic device, the EEG cap and electrodes were positioned on the subject. Then subjects were tested in eight different conditions (Exoskeleton/No Exoskeleton on four different pavement textures).
A counterbalanced design was employed (see Table A1 in Appendix A.1), thus ensuring that the order of texture presentation was altered for each subject. Three subjects began with the exoskeleton and were tested on the four different pavements, followed by testing without the exoskeleton. The remaining two subjects were initially tested on the four different pavements without the exoskeleton and were subsequently tested with the exoskeleton.

Participants

The present study was approved by the committee of the Catholic University of Portugal in Porto (Committee for Health Sciences of the Universidade Católica Portuguesa—99/2022). All participants included in this study agreed that their image could be used. A total of five subjects (N = 5, all female, Age = 25.6 ± 9.9, Mean ± STD, Min = 19, Max = 43) voluntarily participated in the study. All participants signed an informed consent at least 24 h after the experimental procedure was explained in detail.
The recruited subjects for this study were healthy individuals who did not have any motor impairments. They were capable of wearing and supporting the weight of exoskeleton. Additionally, they met the height and weight specifications provided by the manufacturer, thereby ensuring that they fulfilled all the necessary requirements for participation in this study.
The inclusion and exclusion criteria are detailed in Table 1.

2.2. Signal Acquisition

EEG recordings were made using a 16-electrode setup with signals recorded at 500 Hz (V-Amp, actiCAP; Brain Products GmbH, Gilching, Germany) using the Brain Vision Recorder (version 2.1.0, Brain Products, Gilching, Germany). Signals were later processed using the EEGLab toolbox in MATLAB (Mathworks, 2018b, Natick, MA, USA) [21].

2.2.1. Materials

In order to study the neural correlates of pavement textures, this study used a set of four distinct pavements. The selected surfaces were flat, carpet, foam, and rubber circles, Figure 1.
The neural activity generated from the textured surfaces was recorded by a 16-channel EEG cap (actiCAP by Brain Products). The setup was composed of the recording system (electrodes, cap, V-Amp 16, and ImpBox), the syringe, and the electrolyte gel.
Finally, in order to analyze the four different conditions (i.e., the textured pavements) during the Exo condition—i.e., exoskeleton control—subjects used the ExoAtlet I® exoskeleton (Figure 1). Meanwhile, during the No Exo condition, subjects used shoes similar to the ones used in the exoskeleton condition.

2.2.2. EEG Recordings

The EEG measurements were recorded at a sampling rate of 500 Hz and according to the 10–20 system using 16 electrodes positioned on the subject’s scalp. Prior to the signal recording, each electrode’s impedance value was measured and kept below 50.0 kΩ.
During the recordings of the control experimental condition (i.e., without the exoskeleton), a member of the research team operated the exoskeleton to guide and mimic the subjects’ steps. Before each step, the exoskeleton emitted an auditory stimulus, thereby indicating the initiation of the next step. This enabled the subject (who was not wearing the exoskeleton) to maintain the appropriate stepping frequency while reproducing the sounds that were present when the subject wore the exoskeleton. This procedure ensured that the number of steps taken was comparable to the conditions when subjects were wearing the exoskeleton.

2.3. Preprocessing

A total of 40 EEG datasets were recorded, with 38 datasets being preprocessed and analyzed (2 files were removed due to noise in signal). Two zero-phase Hamming-windowed sinc finite impulse response (FIR) filters were applied to the raw files separately: first, a high-pass FIR filter at 1 Hz (lower edge frequency) was applied, then a low-pass FIR filter at 50 Hz (higher edge frequency) [22,23] was applied. After this, to remove line noise, Thomas F-statistics implemented in the CleanLine EEGLAB plugin (CleanLine, v.1.04) were also applied to the signal to attenuate the 50 Hz electrical interference noise [24,25,26].
Due to flat and noisy data, channels from one experimental subject (S1) were interpolated across all four pavements (control condition—electrode O1; exoskeleton condition—electrodes O1 and O2). Afterwards, data was rereferenced to the average value of all 16 channels. Lastly, in order to reject signal artifacts, EEG data were subjected to an independent component analysis (ICA) to reject eye and muscle movement, heart pulse, line noise, and channel noise. A high-pass filter of 1 Hz was previously applied due to ICA [27].
A pilot analysis of power spectral density (PSD) was conducted for the different conditions while considering various frequency bands (delta—0.5–4 Hz; theta—4–8 Hz; alpha—8–16 Hz; beta—16–32 Hz; and gamma—32–50 Hz). The Welch’s method was employed for this analysis. Our focus was primarily on electrodes C3 and C4, as these are the electrodes most likely to be relevant for the present study [4,28]. Note that only a small number of subjects were studied and, therefore, no statistical tests were performed.

2.4. DWT Decomposition

To extract the features from each EEG data segment, a discrete wavelet transform (DWT) was used [29]. A Daubechies wavelet of order 4 (db4) was selected as the mother wavelet for this study due to its smoothing feature being suitable for the analysis of EEG signals [23,29,30,31,32].
When analyzing Table 2, the decomposition into the subbands corresponds to the D3, D4, D5, D6, and A6 coefficients, which represent, accordingly, gamma, beta, alpha, theta, and delta, respectively.

2.5. Feature Extraction

After signal decomposition, eight features were extracted. These features encompassed seven statistical measures, including maximum and minimum values, mean, median, standard deviation (STD), variance, and root mean square (RMS). Additionally, one nonlinear entropy-based feature was included, specifically, the Shannon entropy (SE) [29,30,31].

2.6. Classification

Machine-learning (ML) models were then used to study neural signals associated with each pavement texture with or without the use of the exoskeleton. Four different ML models were tested: ANN, KNN, SVM, and LDA [23,29,30,31,32].
The selected classifiers were applied to an eight-class classification problem (all experimental conditions). The selected ML algorithms were implemented in MATLAB in addition to the classification learner from the statistics and machine-learning toolbox [33] and the neural net pattern recognition from the deep learning toolbox [34]. For SVM, KNN, and LDA models, the dataset was randomly divided into 70% training and 30% testing, and a 5-fold cross validation was performed [23,35].
In this work, k value of the KNN algorithm was equal to 10. Regarding the ANN model, the original dataset was randomly divided into 75% training, 15% validation, and 15% testing [29]. In terms of architecture, the neural network was a feed-forward network with two hidden layers, and each hidden layer possessed 10 sigmoid hidden neurons and softmax output neurons [29,36] (see Figure 2). To train the network, the conjugate gradient backpropagation algorithm was utilized.
Classifiers were analyzed, and their effectiveness was compared. Each model was tested only once, thus meaning that a single value was obtained for each classifier. Four metrics based on the confusion matrix were employed to evaluate the performance: false positives (FP), false negatives (FN), true negatives (TN), and true positives (TP). These metrics were utilized to calculate accuracy (as per Equation (1)), recall (as per Equation (2)), precision (as per Equation (3)), and F1 score (as per Equation (4)) [37]. TP represents the correct number of positive cases, TN corresponds to the correct number of negative cases, FN signifies the incorrect prediction of a negative case when the true case was positive, and FP indicates the incorrect prediction of a positive case when the true case was negative.
a c c u r a c y = T P + T N T P + T N + F P + F N .
R e c a l l = T P T P + F N .
P r e c i s i o n = T P T P + F P .
F 1 s c o r e = 2 P r e c i s i o n R e c a l l P r e c i s i o n + R e c a l l .

3. Results

The results section is divided in two parts: (i) the pilot analysis of the power in the most common frequency bands (delta, theta, alpha, beta, and gamma) under different experimental conditions and (ii) the analysis of neural signals in different experimental conditions using four different classifiers (LDA, SVM, ANN, and KNN).

3.1. Pilot Analysis

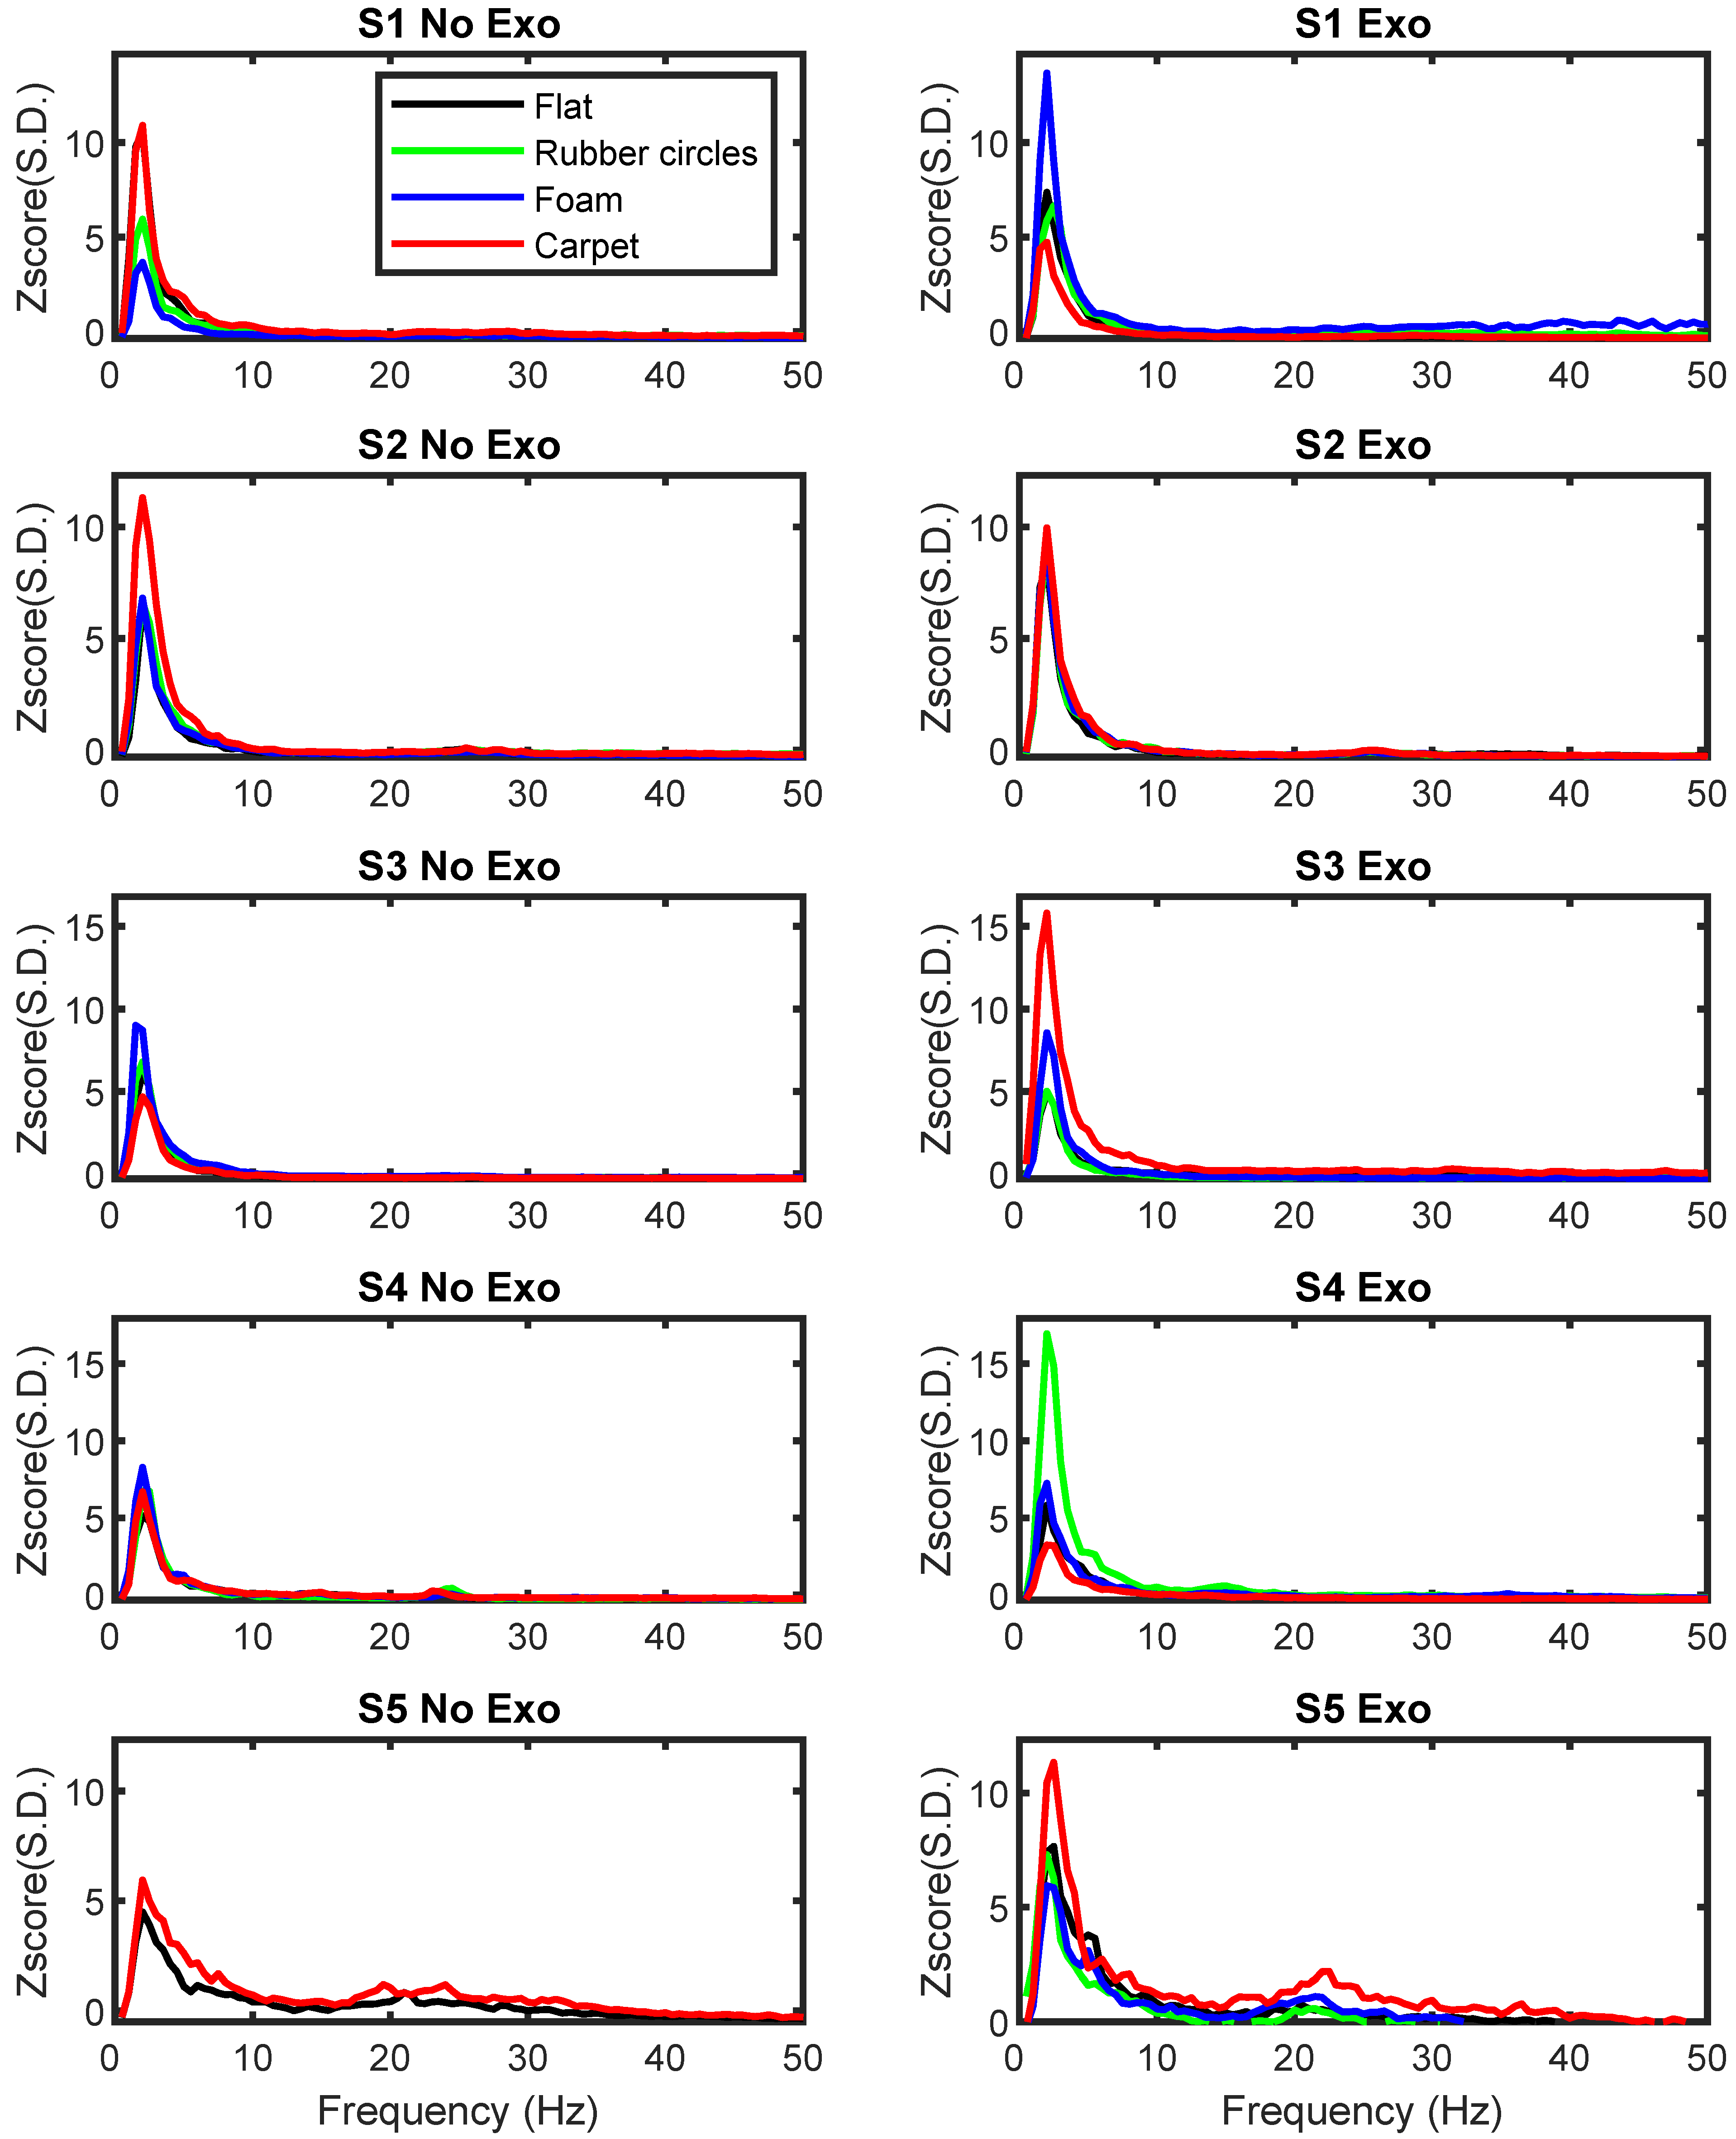
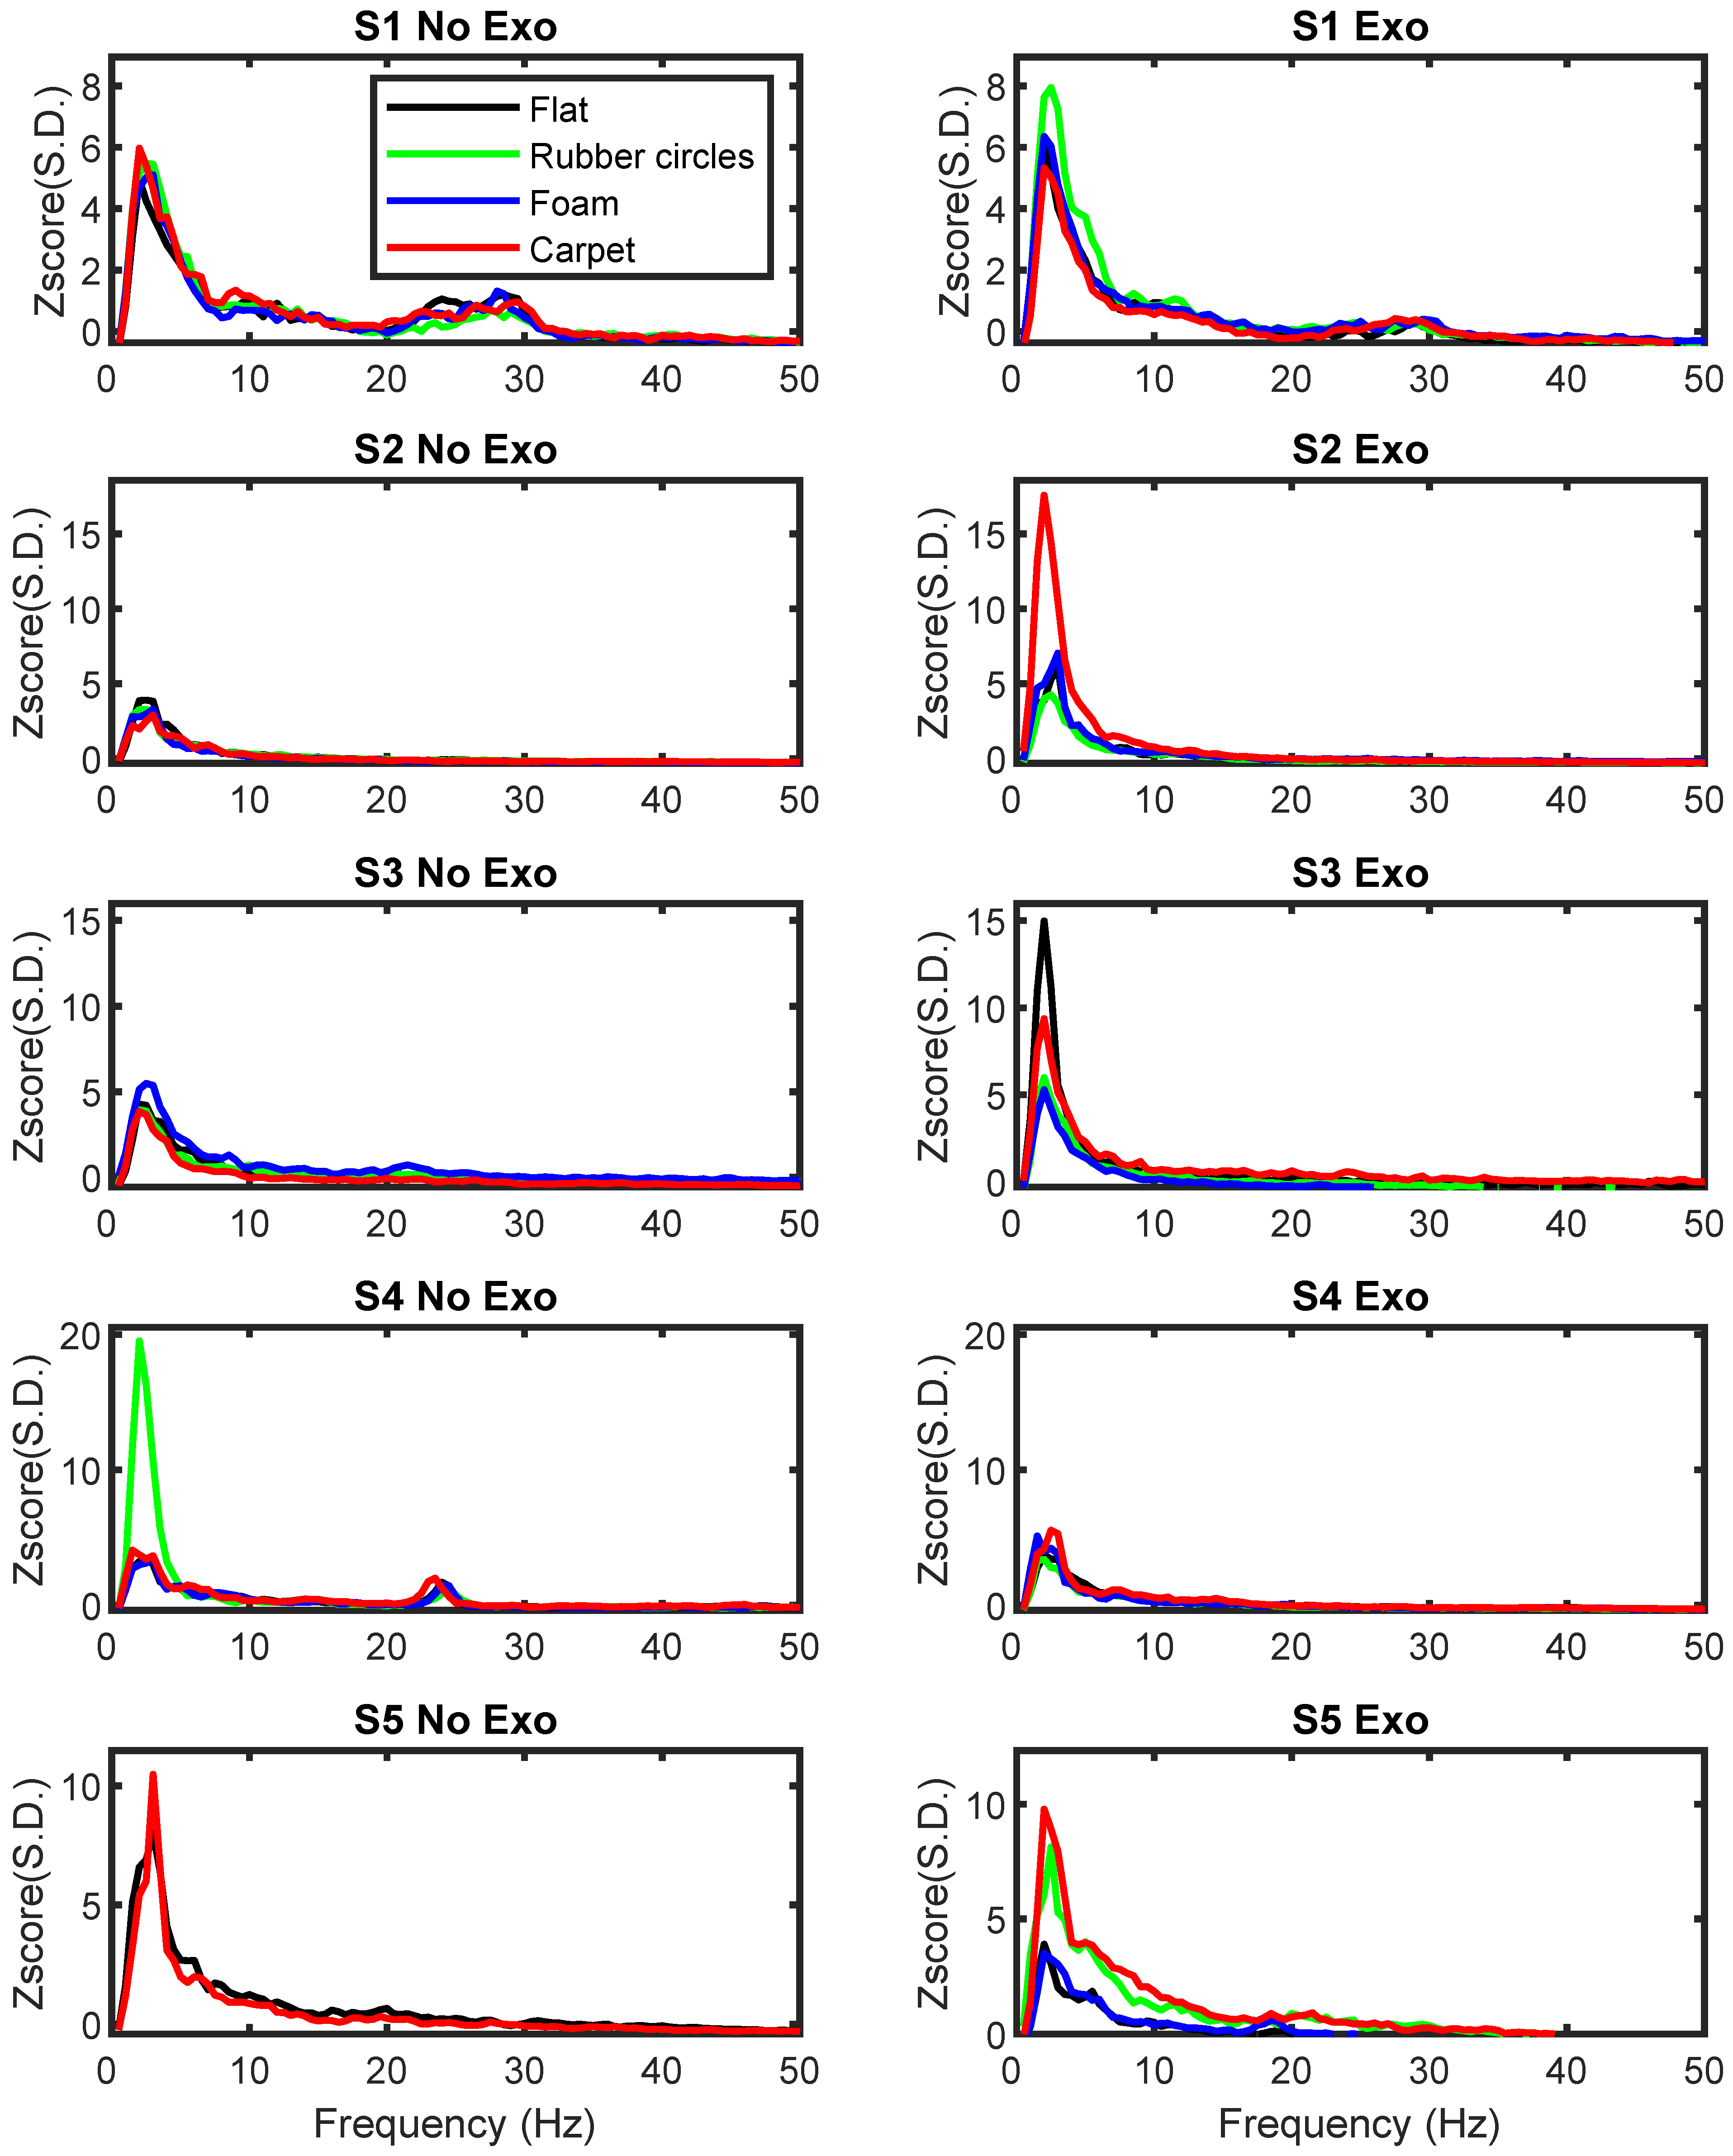
The pilot analysis of the power in different frequency bands at electrodes C3 and C4 was initially performed for the flat pavement to allow for a comparison between the Exo and No Exo conditions. As indicated in the methods section, no statistical tests were performed due to the small number of subjects studied and the large number of conditions. The pilot analysis of the EEG signal power at each frequency band for electrodes C3 and C4 revealed that the Exoskeleton and No Exoskeleton conditions in the flat texture differed mainly in the delta frequency band (see Figure A1 and Figure A2 in Appendix A.2). This difference was particularly noticeable for electrode C3 in subjects S3 (delta—No exo: 2.0097 μ V 2 /Hz; Exo: 4.3148 μ V 2 /Hz) and S5 (delta—No exo: 3.7755 μ V 2 /Hz; Exo: 1.6442 μ V 2 /Hz), and for electrode C4 in subjects S1 (delta—No exo: 2.8825 μ V 2 /Hz; Exo: 2.1630 μ V 2 /Hz) and S2 (delta—No exo: 1.7088 μ V 2 /Hz; Exo: 2.2709 μ V 2 /Hz). No clear difference was found for subject S4 (delta—No exo: 1.7232 μ V 2 /Hz; Exo: 1.9131 μ V 2 /Hz).
These findings demonstrated no clear group pattern, with some subjects presenting an increase in the power of specific frequency bands, while others showed a decrease or no change. Expanding this pilot analysis to the PSD values obtained in different conditions and textures further supported the notion that the major differences between textures occurred in the delta frequency band (see Table 3 and Figure A1 and Figure A2 in Appendix A.2).
Although the differences were visible, no clear pattern could be identified. The analysis of electrode C3 revealed that subjects S2 and S3 presented an increase in power when specific textures were used during the Exoskeleton condition (S1: rubber circles; S2: carpet; S3: flat and carpet), while subject S5 showed a decrease (S5: flat). Similarly, the analysis of electrode C4 revealed increases in the delta frequency bands for all subjects (S1: foam; S2: flat, rubber circles, and foam; S3: carpet; S4: rubber circles; S5: carpet) and decreases for subjects S1 and S2 (S1: carpet; S2: carpet; S4: carpet).
In the remaining conditions, no major differences were found for each of the frequency bands.

3.2. Classifiers’ Performance Outcomes during Exoskeleton Control on Different Pavements

To complement the previous pilot analysis of the results, the neural activity recorded during the various conditions (exoskeleton and control) while walking on different pavements (flat, rubber circles, carpet, and foam) that formed an eight-class problem was examined using four different classifiers: ANN, KNN, SVM, and LDA.
The performance metrics used to assess the models’ classification abilities are presented in the Table 4. Note that only one value is presented for each classifier (i.e., no average or standard deviation was calculated), because a single classification was performed, which included all subjects in all eight different conditions simultaneously.
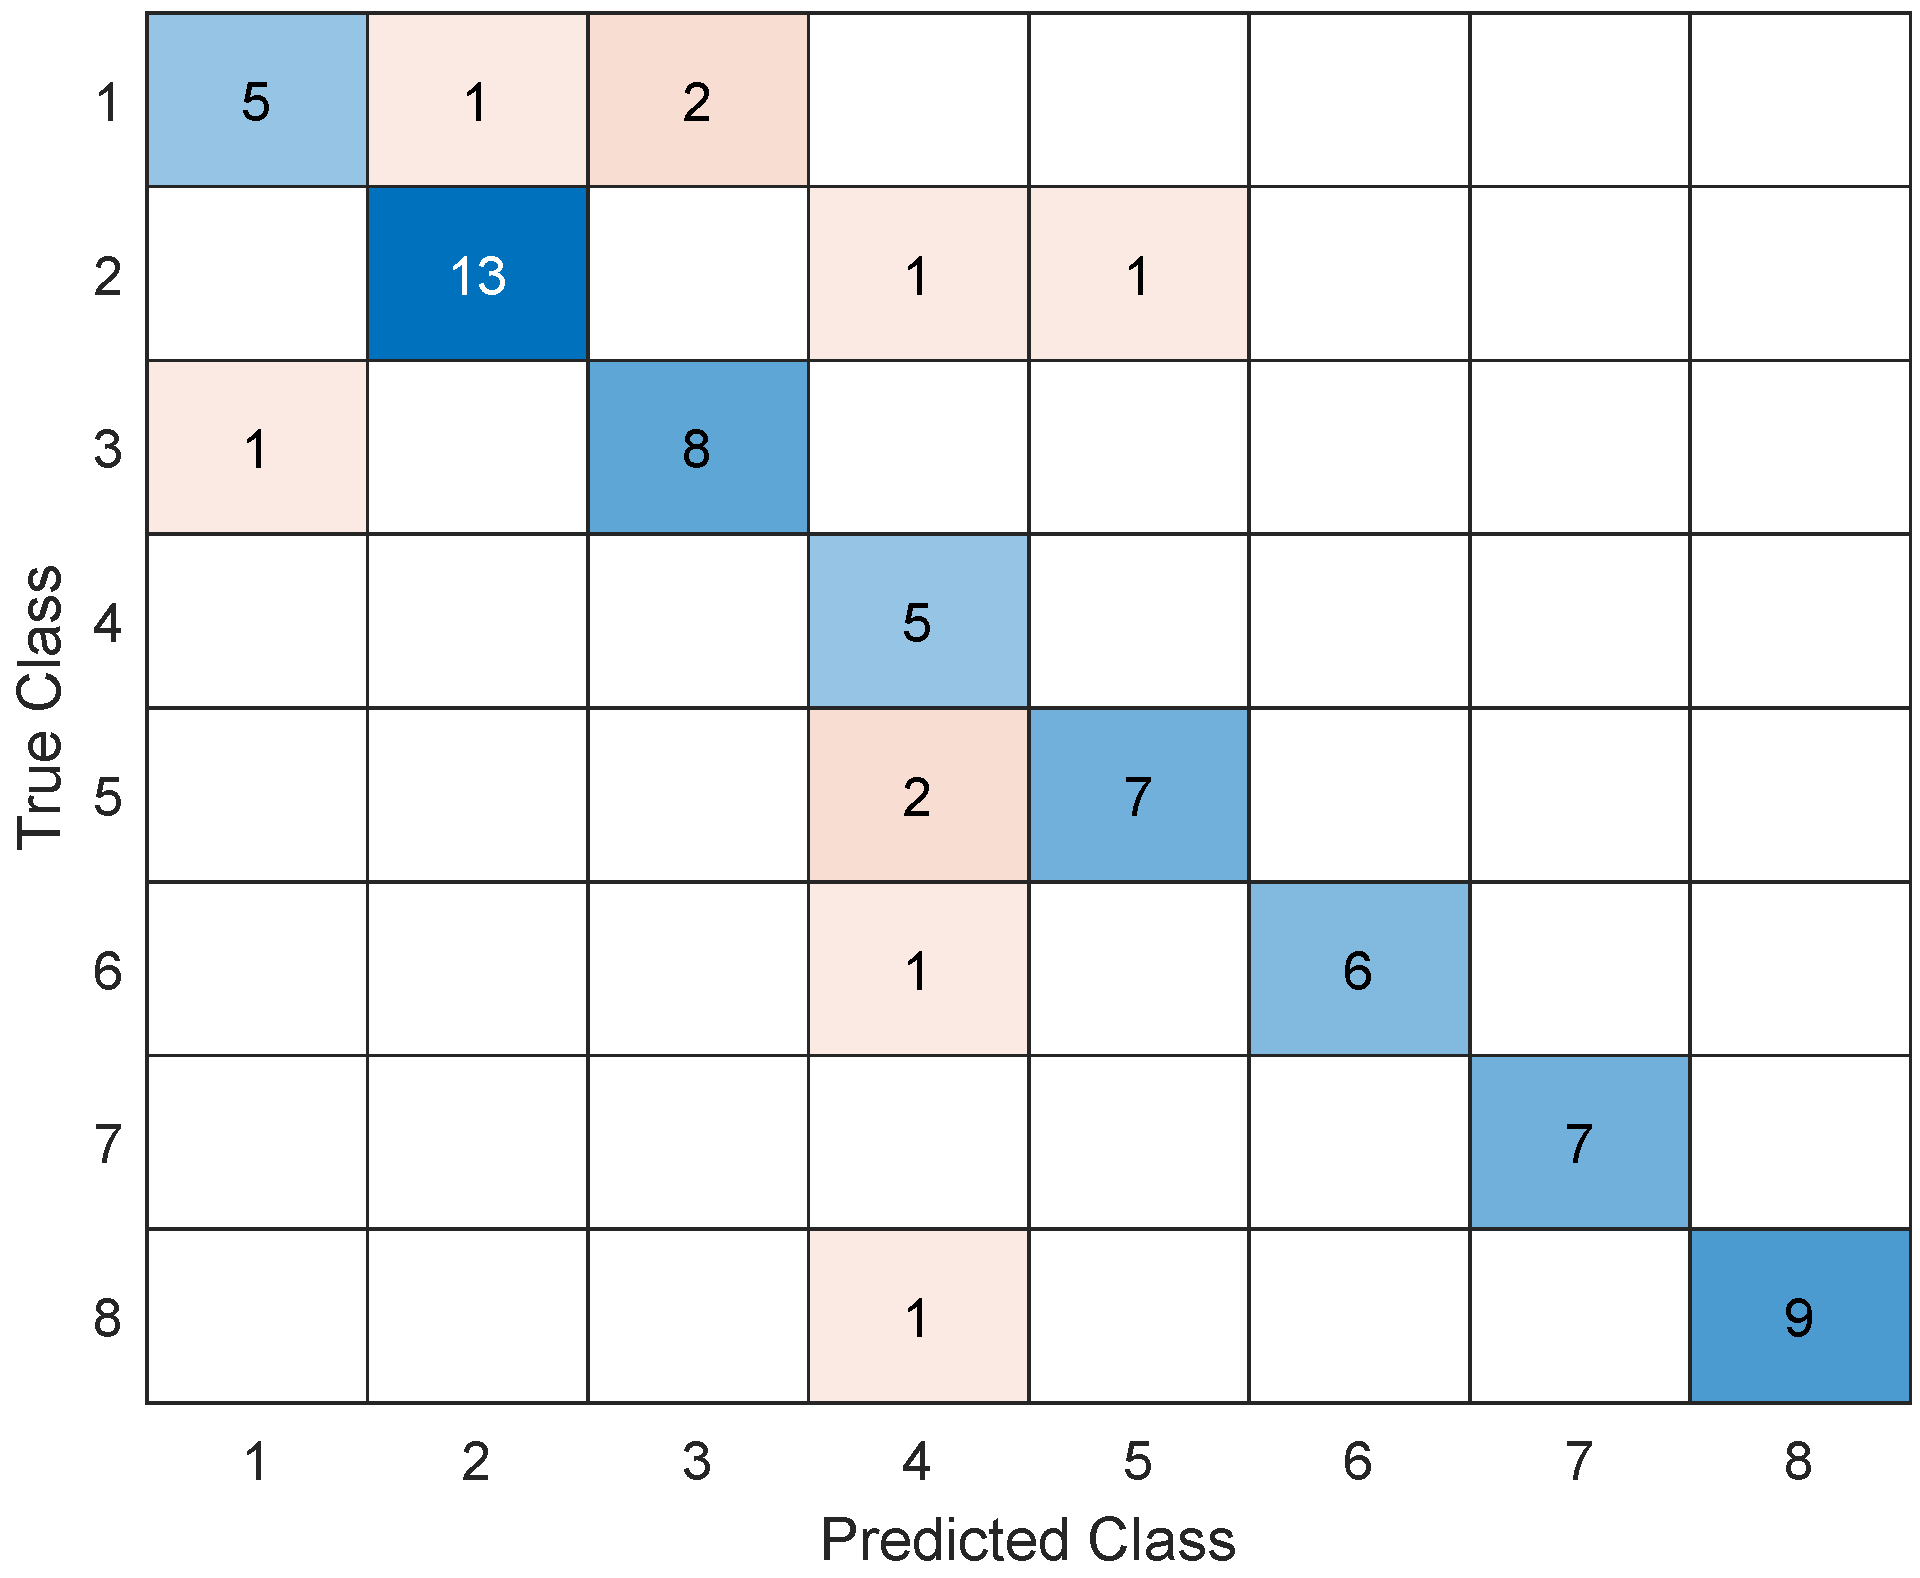
As shown in Table 4 and Figure 3, the LDA model demonstrated the highest performance, wherein it achieved an accuracy of 85.71%, a recall of 86.71%, a precision of 86.44%, and an F1 score of 0.87.

4. Discussion

A small sample of subjects controlling an exoskeleton was tested on different textured pavements while their neural activity was recorded. To the best of our knowledge, this is the first study to investigate the neural activity associated with different pavement textures while subjects controlled an exoskeleton. The analysis of the neural activity associated with tactile processing revealed an overall pattern of increases and decreases in power within the delta frequency bands of the C3 and C4 electrodes when the exoskeleton was used. However, no clear pattern was observed with respect to the different textured pavements. When utilizing four different classifiers, the results showed high levels of decoding accuracy, with the LDA classifier demonstrating the best performance. Collectively, these findings suggest that the use of an exoskeleton is associated with changes in the neural activity in electrodes C3 and C4, as well as that LDA is effective in classifying these differences.
Exoskeleton control was associated with changes in neural activity. The pilot analysis of the power in the C3 and C4 electrodes revealed that the use of the exoskeleton in different pavements was associated with changes occurring mostly in the delta band. This finding from the pilot analysis was further supported by the the classifiers’ performance outcomes. Our results are in line with previous studies highlighting the role of the delta frequency band in upper and lower limb exoskeleton control [38,39,40,41,42]. An alternative explanation for these findings could be the increases in attention, perception, and decision making [43,44,45]. This alternative explanation also fits with self-reports of subjects indicating the need to pay attention to the exoskeleton movements and balance during the task. It will be relevant in future studies to determine if the continuous use of the exoskeleton results in a decrease in the power of the delta frequency band for this electrode.
In summary, based on the presented results, significant changes were observed in the delta frequency bands of the C3 and C4 electrodes within both the Exo and No Exo (control) conditions while walking on the four different pavements. Among the four classifiers used, LDA achieved the best performance. Additionally, it is worth noting that, although the neural patterns could not be inferred during the pilot analysis, all implemented machine-learning models were able to distinguish between all experimental conditions, albeit with varying degrees of performance.

4.1. Neural Correlates of Pavement Textures

No clear differences between pavement textures were present for any participant. Although previous studies have reported changes in the EEG power when different textures and stimuli are presented [4,28,46,47] the present findings did not reveal a clear pattern. It is noteworthy that, in all participants, the power for one or more textures was associated with a large difference from the remaining textures, but such differences could not consistently be associated with self-reports of increased attention, difficulty, preference, tiredness, nor novelty (i.e., being the first or last texture).
Previous studies support the notion that tactile processing is associated with power changes in the alpha and beta frequency bands in C3 and C4 electrodes, such as after tactile stimulation of the index finger [4,28,48]. Meanwhile, increases in the delta frequency bands of the C3 and C4 electrodes when different tactile stimuli were delivered to subjects have recently been reported [46]. Although previous reports have indicated that the most prominent changes occurred in the alpha and beta frequency bands, the aforementioned study has shown the presence of power changes in the delta and low gamma frequency bands, although in a less pronounced form [46]. Therefore, the data gathered here supports H1 (that the use of the exoskeleton is associated with changes in neural activity), but the data does not support H2 (that the alpha and theta frequencies would be associated with less stable texture/pavements).

4.2. Eight-Class Classification Problem

The comparison of four different classifiers generally revealed good performance outcomes (accuracy values no lower than 63.61%), with linear discriminant analysis presenting the best performance outcomes across all parameters studied. LDA has been a popular choice in many brain–machine interface studies [49,50] due to its simplicity and ability to distinguish across different classes. Its performance with respect to binary classification problems makes this model suitable for this type of classification [51,52].
LDA and the SVM are among the most popular classifiers for BMI applications, with some studies reporting improved performance for SVM and others for LDA [14,36,53]. Our present results are in line with these previous studies, as we observed good performance for both algorithms in our study, although LDA exhibited the best performance.
Despite the good performance outcomes, there is still room for improvement. For example, in future studies, it will be relevant to test different k values for the KNN model, as well as different numbers of hidden layers and neurons for the ANN classifier [54,55,56,57].
Altogether, the results from the ML algorithms support H3 (that the neural activity associated with different textured pavements could be identified using common classifiers).

4.3. Active and Passive Tactile Information Processing

The present study did not require subjects to actively process tactile information. Therefore, except for minor adjustments in posture or balance that could have been necessary on different pavements, the subjects performed the act of walking in place, mostly in the same manner, across the different pavements. Active and passive tactile discrimination are known to have a significant impact on EEG signals [5,46]; therefore, it is possible that future studies, namely, those involving brain–computer interfaces that combine the neural control of the exoskeleton with different textured pavements, may reveal other relevant neural correlates of pavement texture during exoskeleton control.

4.4. Relevance of Tactile Processing for Exoskeleton Control

Tactile processing during exoskeleton control is relevant, because exoskeletons (and brain-controlled exoskeletons) can cause severe accidents and lead to injuries [58]. Therefore, incorporating tactile information into these robotic devices, as well as in brain–machine interfaces, can impact exoskeleton control [1,46]. Lastly, tactile processing and feedback during exoskeleton control are crucial for neurorehabilitation processes [1]. The present study supports and extends these previous findings by demonstrating that texture information can be decoded from the C3 and C4 electrodes during exoskeleton control.

4.5. Technical Details and Caveats

A few caveats and technical details should be taken into account. We used a 16-electrode system, which did not allow for the identification of the source of the signals [59]. Therefore, the results can only be discussed based on the recorded electrode locations and not on the specific brain regions underneath them. Additionally, our sample size was small, which consisted of only five female subjects. In future studies, it will be important to increase the number of electrodes and subjects while ensuring a better representation of sex and age.

5. Conclusions

The neural activity in the delta frequency bands recorded from electrodes C3 and C4 of female subjects controlling an exoskeleton showed changes in response to different pavement textures, although no clear pattern could be observed among the participants. The analysis of the neural activity using different machine-learning algorithms in an eight-class problem (i.e., Exo/No Exo on one of four different pavements) revealed that the LDA classifier exhibited the best offline performance.

Author Contributions

Conceptualization, J.R. and M.P.-V.; methodology, J.R. and M.P.-V.; software, J.R.; validation, J.R., M.P.-V. and M.A.; formal analysis, J.R., M.P.-V. and M.A.; investigation, J.R., M.P.-V. and M.A.; resources, M.P.-V.; data curation, J.R.; writing—original draft preparation, J.R., M.P.-V. and M.A.; writing—review and editing, J.R., M.P.-V. and M.A.; visualization, J.R., M.P.-V. and M.A.; supervision, M.P.-V.; project administration, J.R.; funding acquisition, M.P.-V. All authors have read and agreed to the published version of the manuscript.

Funding

This research was funded by the Fundação para a Ciência e a Tecnologia, grant number UIDP/04501/2020.

Institutional Review Board Statement

This study was approved by the Committee for Health Sciences of the Universidade Católica Portuguesa—99/2022.

Informed Consent Statement

Informed consent was obtained from all subjects involved in the study.

Data Availability Statement

All data relevant for this study is provided in the manuscript.

Acknowledgments

This study was financially supported by national funds through the FCT—Fundação para a Ciência e a Tecnologia, I.P.—under the projects UIDP/04501/2020 (MP-V).

Conflicts of Interest

The authors declare no conflict of interest. The funders had no role in the design of the study; in the collection, analyses, or interpretation of data; in the writing of the manuscript; or in the decision to publish the results.

Abbreviations

The following abbreviations are used in this manuscript:
ANNArtificial Neural Network
BMIBrain–Machine Interface
DWTDiscrete Wavelet Transform
EEGElectroencephalography
FIRFinite Impulse Response
FNFalse Negatives
FPFalse Positives
ICAIndependent Component Analysis
KNNK-Nearest Neighbours
LDALinear Discriminant Analysis
MLMachine Learning
PSDPower Spectral Density
RMSRoot Mean Square
STDStandard Deviation
SEShannon Entropy
SVMSupport Vector Machine
TNTrue Negatives
TPTrue Positives

Appendix A

Appendix A.1. Experimental Counterbalanced Design

Table A1. Counterbalanced design.
SubjectsExoskeleton (Exo)Control (No Exo)
Subject 1FlatRubber circles
FoamFoam
CarpetCarpet
Rubber circlesFlat
Subject 2Rubber circlesFlat
FlatCarpet
FoamRubber circles
CarpetFoam
Subject 3CarpetFoam
Rubber circlesRubber circles
FlatFlat
FoamCarpet
Subject 4FoamCarpet
CarpetFlat
FlatFoam
Rubber circlesRubber circles
Subject 5FlatFoam
Rubber circlesCarpet
CarpetFlat
FoamRubber circles

Appendix A.2. PSD Analysis of the Experimental Conditions

Figure A1. PSD analysis of control and exo conditions for channel C3.
Applsci 13 09356 g0a1
Figure A2. PSD analysis of control and exo conditions for channel C4.
Applsci 13 09356 g0a2

References

  1. Donati, A.R.; Shokur, S.; Morya, E.; Campos, D.S.; Moioli, R.C.; Gitti, C.M.; Augusto, P.B.; Tripodi, S.; Pires, C.G.; Pereira, G.A.; et al. Long-Term Training with a Brain-Machine Interface-Based Gait Protocol Induces Partial Neurological Recovery in Paraplegic Patients. Sci. Rep. 2016, 6, 30383. [Google Scholar] [CrossRef] [PubMed]
  2. Wagner, F.B.; Mignardot, J.-B.; Le Goff-Mignardot, C.G.; Demesmaeker, R.; Komi, S.; Capogrosso, M.; Rowald, A.; Seáñez, I.; Caban, M.; Pirondini, E.; et al. Targeted neurotechnology restores walking in humans with spinal cord injury. Nature 2018, 563, 65–71. [Google Scholar] [CrossRef] [PubMed]
  3. Lorach, H.; Galvez, A.; Spagnolo, V.; Martel, F.; Karakas, S.; Intering, N.; Vat, M.; Faivre, O.; Harte, C.; Komi, S.; et al. Walking naturally after spinal cord injury using a brain–spine interface. Nature 2023, 618, 126–133. [Google Scholar] [CrossRef] [PubMed]
  4. Eldeeb, S.; Weber, D.; Ting, J.; Demir, A.; Erdogmus, D.; Akcakaya, M. EEG-based trial-by-trial texture classification during active touch. Sci. Rep. 2020, 10, 20755. [Google Scholar] [CrossRef]
  5. Simões-Franklin, C.; Whitaker, T.A.; Newell, F.N. Active and Passive Touch Differentially Activate Somatosensory Cortex in Texture Perception. Hum. Brain Mapp. 2011, 32, 1067–1080. [Google Scholar] [CrossRef]
  6. Alsuradi, H.; Park, W.; Eid, M. Eeg-based neurohaptics research: A literature review. IEEE Access 2020, 8, 49313–49328. [Google Scholar] [CrossRef]
  7. Li, M.; Chen, J.; He, B.; He, G.; Zhao, C.-G.; Yuan, H.; Xie, J.; Xu, G.; Li, J. Stimulation enhancement effect of the combination of exoskeleton-assisted hand rehabilitation and fingertip haptic stimulation. Front. Neurosci. 2023, 17, 1149265. [Google Scholar] [CrossRef] [PubMed]
  8. Hekmatmanesh, A.; Wu, H.; Li, M.; Nasrabadi, A.M.; Handroos, H. Optimized Mother Wavelet in a Combination of Wavelet Packet with Detrended Fluctuation Analysis for Controlling a Remote Vehicle with Imagery Movement: A Brain Computer Interface Study. In Mechanisms and Machine Science; Springer: Berlin/Heidelberg, Germany, 2018; pp. 186–195. [Google Scholar]
  9. Hekmatmanesh, A.; Mohammadi Asl, R.; Wu, H.; Handroos, H. EEG Control of a Bionic Hand with Imagination Based on Chaotic Approximation of Largest Lyapunov Exponent: A Single Trial BCI Application Study. IEEE Access 2019, 7, 105041–105053. [Google Scholar] [CrossRef]
  10. Hekmatmanesh, A.; Wu, H.; Motie-Nasrabadi, A.; Li, M.; Handroos, H. Combination of Discrete Wavelet Packet Transform with Detrended Fluctuation Analysis Using Customized Mother Wavelet with the Aim of an Imagery-Motor Control Interface for an Exoskeleton. Multimed. Tools Appl. 2019, 78, 30503–30522. [Google Scholar] [CrossRef]
  11. Hekmatmanesh, A.; Nardelli, P.H.; Handroos, H. Review of the State-of-the-Art of Brain-Controlled Vehicles. IEEE Access 2021, 9, 110173–110193. [Google Scholar] [CrossRef]
  12. Hekmatmanesh, A.; Wu, H.; Handroos, H. Largest Lyapunov Exponent Optimization for Control of a Bionic-Hand: A Brain Computer Interface Study. Front. Rehabil. Sci. 2022, 2, 802070. [Google Scholar] [CrossRef] [PubMed]
  13. Zhang, R.; Xu, P.; Guo, L.; Zhang, Y.; Li, P.; Yao, D. Z-Score Linear Discriminant Analysis for EEG Based Brain-Computer Interfaces. PLoS ONE 2013, 8, 802070. [Google Scholar] [CrossRef] [PubMed]
  14. Lotte, F.; Bougrain, L.; Cichocki, A.; Clerc, M.; Congedo, M.; Rakotomamonjy, A.; Yger, F. A Review of Classification Algorithms for EEG-Based Brain–Computer Interfaces: A 10 Year Update. J. Neural Eng. 2018, 15, 031005. [Google Scholar] [CrossRef] [PubMed]
  15. Hosseini, M.-P.; Hosseini, A.; Ahi, K. A Review on Machine Learning for EEG Signal Processing in Bioengineering. IEEE Rev. Biomed. Eng. 2021, 14, 204–218. [Google Scholar] [CrossRef]
  16. Saeidi, M.; Karwowski, W.; Farahani, F.V.; Fiok, K.; Taiar, R.; Hancock, P.A.; Al-Juaid, A. Neural Decoding of EEG Signals with Machine Learning: A Systematic Review. Brain Sci. 2021, 11, 1525. [Google Scholar] [CrossRef]
  17. Khosla, A.; Khandnor, P.; Chand, T. A Comparative Analysis of Signal Processing and Classification Methods for Different Applications Based on EEG Signals. Biocybern. Biomed. Eng. 2020, 40, 649–690. [Google Scholar] [CrossRef]
  18. Zhu, Y.; Weston, E.B.; Mehta, R.K.; Marras, W.S. Neural and Biomechanical Tradeoffs Associated with Human-Exoskeleton Interactions. Appl. Ergon. 2021, 96, 103494. [Google Scholar] [CrossRef]
  19. Perrotta, A.; Pais-Vieira, C.; Allahdad, M.K.; Bicho, E.; Pais-Vieira, M. Differential width discrimination task for active and passive tactile discrimination in humans. MethodsX 2020, 7, 100852. [Google Scholar] [CrossRef]
  20. Hülsdünker, T.; Mierau, A.; Neeb, C.; Kleinöder, H.; Strüder, H.K. Cortical processes associated with continuous balance control as revealed by EEG Spectral Power. Neurosci Lett 2015, 592, 1–5. [Google Scholar] [CrossRef]
  21. Delorme, A.; Makeig, S. EEGLAB: An Open Source Toolbox for Analysis of Single-Trial EEG Dynamics Including Independent Component Analysis. J. Neurosci. Methods 2004, 134, 9–21. [Google Scholar] [CrossRef]
  22. A—Filtering. Available online: https://eeglab.org/tutorials/05_Preprocess/Filtering.html (accessed on 30 January 2023).
  23. Ghare, P.S.; Paithane, A.N. Human Emotion Recognition Using Non Linear and Non Stationary EEG Signal. In Proceedings of the 2016 International Conference on Automatic Control and Dynamic Optimization Techniques (ICACDOT), Pune, India, 9–10 September 2016; pp. 1013–1016. [Google Scholar]
  24. Cleanline: Tool/Resource Info. Available online: https://www.nitrc.org/projects/cleanline (accessed on 30 January 2023).
  25. Jin, R.N.; Inada, H.; Négyesi, J.; Ito, D.; Nagatomi, R. Carbon Dioxide Effects on Daytime Sleepiness and EEG Signal: A Combinational Approach Using Classical Frequentist and Bayesian Analyses. Indoor Air 2022, 32, e13055. [Google Scholar] [CrossRef] [PubMed]
  26. Griffiths, O.; Jack, B.N.; Pearson, D.; Elijah, R.; Mifsud, N.; Han, N.; Libesman, S.; Rita Barreiros, A.; Turnbull, L.; Balzan, R.; et al. Disrupted Auditory N1, Theta Power and Coherence Suppression to Willed Speech in People with Schizophrenia. Neuroimage Clin. 2023, 37, 103290. [Google Scholar] [CrossRef] [PubMed]
  27. Winkler, I.; Debener, S.; Muller, K.-R.; Tangermann, M. On the Influence of High-Pass Filtering on ICA-Based Artifact Reduction in EEG-ERP. In Proceedings of the 2015 37th Annual International Conference of the IEEE Engineering in Medicine and Biology Society (EMBC), Milan, Italy, 25–29 August 2015; pp. 4101–4105. [Google Scholar]
  28. Su, S.; Chai, G.; Sheng, X.; Meng, J.; Zhu, X. Contra-lateral desynchronized alpha oscillations linearly correlate with discrimination performance of tactile acuity. J. Neural Eng. 2020, 17, 046041. [Google Scholar] [CrossRef]
  29. Cheong, L.C.; Sudirman, R.; Hussin, S.S. Feature extraction of EEG signal using wavelet transform for autism classification. J. Eng. Appl. Sci. 2015, 10, 8533–8540. [Google Scholar]
  30. Ibrahim, S.; Djemal, R.; Alsuwailem, A. Electroencephalography (EEG) Signal Processing for Epilepsy and Autism Spectrum Disorder Diagnosis. Biocybern. Biomed. Eng. 2018, 38, 16–26. [Google Scholar] [CrossRef]
  31. Kaur, B.; Singh, D.; Roy, P.P. Eyes Open and Eyes Close Activity Recognition Using EEG Signals. Commun. Comput. Inf. Sci. 2018, 801, 3–9. [Google Scholar]
  32. Jacob, J.E.; Nair, G.K.; Iype, T.; Cherian, A. Diagnosis of Encephalopathy Based on Energies of EEG Subbands Using Discrete Wavelet Transform and Support Vector Machine. Neurol. Res. Int. 2018, 2018, 1613456. [Google Scholar] [CrossRef]
  33. Machine Learning Toolbox, version: 9.4 (R2022b); The MathWorks Inc.: Natick, MA, USA, 2020.
  34. Deep Learning Toolbox, version: 9.4 (R2022b); The MathWorks Inc.: Natick, MA, USA, 2022.
  35. Wang, Q.; Zhao, D.; Wang, Y.; Hou, X. Ensemble Learning Algorithm Based on Multi-Parameters for Sleep Staging. Med. Biol. Eng. Comput. 2019, 57, 1693–1707. [Google Scholar] [CrossRef]
  36. Baghdadi, G.; Amiri, M.; Falotico, E.; Laschi, C. Recurrence Quantification Analysis of EEG Signals for Tactile Roughness Discrimination. Int. J. Mach. Learn. Cyber. 2020, 12, 1115–1136. [Google Scholar] [CrossRef]
  37. Ramírez-Arias, F.J.; García-Guerrero, E.E.; Tlelo-Cuautle, E.; Colores-Vargas, J.M.; García-Canseco, E.; López-Bonilla, O.R.; Galindo-Aldana, G.M.; Inzunza-González, E. Evaluation of Machine Learning Algorithms for Classification of EEG Signals. Technologies 2022, 10, 79. [Google Scholar] [CrossRef]
  38. Bradberry, T.J.; Gentili, R.J.; Contreras-Vidal, J.L. Reconstructing Three-Dimensional Hand Movements from Noninvasive Electroencephalographic Signals. J. Neurosci. 2010, 30, 3432–3437. [Google Scholar] [CrossRef] [PubMed]
  39. Bradberry, T.J.; Gentili, R.J.; Contreras-Vidal, J.L. Fast Attainment of Computer Cursor Control with Noninvasively Acquired Brain Signals. J. Neural Eng. 2011, 8, 036010. [Google Scholar] [CrossRef]
  40. Presacco, A.; Goodman, R.; Forrester, L.; Contreras-Vidal, J.L. Neural Decoding of Treadmill Walking from Noninvasive Electroencephalographic Signals. J. Neurophysiol. 2011, 106, 1875–1887. [Google Scholar] [CrossRef]
  41. Presacco, A.; Forrester, L.W.; Contreras-Vidal, J.L. Decoding Intra-Limb and Inter-Limb Kinematics during Treadmill Walking from Scalp Electroencephalographic (EEG) Signals. IEEE Trans. Neural Syst. Rehabil. Eng. 2012, 20, 212–219. [Google Scholar] [CrossRef]
  42. Kilicarslan, A.; Prasad, S.; Grossman, R.G.; Contreras-Vidal, J.L. High Accuracy Decoding of User Intentions Using EEG to Control a Lower-Body Exoskeleton. In Proceedings of the 35th Annual International Conference of the IEEE Engineering in Medicine and Biology Society (EMBC), Osaka, Japan, 3–7 July 2013; pp. 5606–5609. [Google Scholar]
  43. Barios, J.A.; Ezquerro, S.; Bertomeu-Motos, A.; Fernandez, E.; Nann, M.; Soekadar, S.R.; Garcia-Aracil, N. Delta-Theta Intertrial Phase Coherence Increases during Task Switching in a BCI Paradigm. In Biomedical Applications Based on Natural and Artificial Computing; Springer: Berlin/Heidelberg, Germany, 2017; pp. 96–108. [Google Scholar]
  44. Güntekin, B.; Başar, E. Review of Evoked and Event-Related Delta Responses in the Human Brain. Int. J. Psychophysiol. 2016, 103, 43–52. [Google Scholar] [CrossRef]
  45. Harmony, T. The Functional Significance of Delta Oscillations in Cognitive Processing. Front. Integr. Neurosci. 2013, 7, 83. [Google Scholar] [CrossRef] [PubMed]
  46. Pais-Vieira, C.; Allahdad, M.K.; Perrotta, A.; Peres, A.S.; Kunicki, C.; Aguiar, M.; Oliveira, M.; Pais-Vieira, M. Neurophysiological correlates of tactile width discrimination in humans. Front. Hum. Neurosci. 2023, 17, 1662–5161. [Google Scholar] [CrossRef] [PubMed]
  47. Lakshminarayanan, K.; Shah, R.; Daulat, S.R.; Moodley, V.; Yao, Y.; Sengupta, P.; Ramu, V.; Madathil, D. Evaluation of EEG Oscillatory Patterns and Classification of Compound Limb Tactile Imagery. Brain Sci. 2023, 13, 656. [Google Scholar] [CrossRef] [PubMed]
  48. Pfurtscheller, G.; Krausz, G.; Neuper, C. Mechanical Stimulation of the Fingertip Can Induce Bursts of β Oscillations in Sensorimotor Areas. J. Clin. Neurophysiol. 2001, 18, 559–564. [Google Scholar] [CrossRef] [PubMed]
  49. Aggarwal, S.; Chugh, N. Signal Processing Techniques for Motor Imagery Brain Computer Interface: A Review. Array 2019, 1–2, 100003. [Google Scholar] [CrossRef]
  50. Renard, Y.; Lotte, F.; Gibert, G.; Congedo, M.; Maby, E.; Delannoy, V.; Bertrand, O.; Lécuyer, A. OpenViBE: An Open-Source Software Platform to Design, Test, and Use Brain–Computer Interfaces in Real and Virtual Environments. Presence Teleoperators Virtual Environ. 2010, 19, 35–53. [Google Scholar] [CrossRef]
  51. He, W.; Zhao, Y.; Tang, H.; Sun, C.; Fu, W. A Wireless BCI and BMI System for Wearable Robots. IEEE Trans. Syst. Man Cybern. Syst. 2016, 46, 936–946. [Google Scholar] [CrossRef]
  52. Lee, M.-H.; Fazli, S.; Mehnert, J.; Lee, S.-W. Subject-Dependent Classification for Robust Idle State Detection Using Multi-Modal Neuroimaging and Data-Fusion Techniques in BCI. Pattern Recognit. 2015, 48, 2725–2737. [Google Scholar] [CrossRef]
  53. Ishak, M.K. Classification of EEG signal for movement intentions-based brain computer interfaces. Int. J. Adv. Comput. Sci. Technol. 2014, 3, 7–12. [Google Scholar]
  54. Rodriguez, J.D.; Perez, A.; Lozano, J.A. Sensitivity Analysis of K-Fold Cross Validation in Prediction Error Estimation. IEEE Trans. Pattern Anal. Mach. Intell. 2010, 32, 569–575. [Google Scholar] [CrossRef]
  55. Ali, N.; Neagu, D.; Trundle, P. Evaluation of K-Nearest Neighbour Classifier Performance for Heterogeneous Data Sets. SN Appl. Sci. 2019, 1, 1559. [Google Scholar] [CrossRef]
  56. Tsai, C.-Y.; Lee, Y.-H. The Parameters Effect on Performance in Ann for Hand Gesture Recognition System. Expert Syst. Appl. 2011, 38, 7980–7983. [Google Scholar] [CrossRef]
  57. Hamzah, N.; Syukur, N.A.M.; Zaini, N.; Zaman, F.H.K. EEG signal classification to detect left and right command using artificial neural network (ANN). J. Fundam. Appl. Sci. 2017, 9, 193–209. [Google Scholar] [CrossRef]
  58. Lee, H.; Ferguson, P.W.; Rosen, J. Lower Limb Exoskeleton Systems—Overview. Wearable Robot. 2020, 2020, 207–229. [Google Scholar]
  59. Cohen, M.X. Analyzing Neural Time Series Data: Theory and Practice; MIT Press: Cambridge, MA, USA, 2014. [Google Scholar]
Figure 1. Workflow diagram. The study included four different aspects: behavioral testing in experimental conditions, the recording of EEG signals, feature extraction, and classification. Subjects were tested in four different pavements (flat, carpet, foam and rubber circles) with and without the exoskeleton. To simulate the frequency and sound of the Exoskeleton condition, during the No Exoskeleton condition, the subjects’ movements were reproduced by an external operator controlling an empty exoskeleton.
Applsci 13 09356 g001
Figure 2. Neural network architecture for eight-class problem.
Applsci 13 09356 g002
Figure 3. Confusion matrix of LDA model for eight-class classification.
Applsci 13 09356 g003
Table 1. Recruitment inclusion and exclusion guidelines.
Inclusion Criteria (IC)Description
IC1Height: 1.50–1.90 m; weight: 49–102 kg
IC2Able to naturally perform the experimental movements
IC3Able to support the exoskeleton’s weight without pain
Exclusion Criteria (EC)Description
EC1Individuals under 18 years old
EC2Individuals with physical impairments
Table 2. Discrete wavelet transform signal information.
Wavelet CoefficientFrequency (Hz)EEG Band
D1125-250Noise
D264–125Noise
D332–64Gamma
D416–32Beta
D58–16Alpha
D64–8Theta
A60.5–4Delta
Table 3. Average PSD values ( μ V 2 /Hz) for No Exo and Exo conditions across four pavements.
ElectrodeConditionPavementDeltaThetaAlphaBetaGamma
C3No ExoFlat2.3170 ± 1.37330.4258 ± 0.18730.2225 ± 0.1285−0.1887 ± 0.1397−0.3795 ± 0.0167
No ExoFoam2.1061 ± 1.29620.3908 ± 0.15140.2039 ± 0.1318−0.1698 ± 0.1401−0.3549 ± 0.0163
No ExoCarpet1.9394 ± 1.16680.2990 ± 0.16330.1383 ± 0.1616−0.2164 ± 0.1276−0.3956 ± 0.0161
No ExoRubber Circles2.1863 ± 2.01320.2018 ± 0.0909−0.0036 ± 0.0715−0.2252 ± 0.0890−0.3578 ± 0.0130
C3ExoFlat2.5265 ± 1.87080.3329 ± 0.1532−0.0294 ± 0.0480−0.2371 ± 0.0819−0.3552 ± 0.0142
ExoFoam2.2340 ± 1.52810.2811 ± 0.1368−0.0170 ± 0.0577−0.2638 ± 0.0866−0.3963 ± 0.0118
ExoCarpet3.7287 ± 2.66200.6863 ± 0.26860.1938 ± 0.0513−0.1399 ± 0.1219−0.3106 ± 0.0190
ExoRubber Circles2.6858 ± 1.59780.4743 ± 0.22160.0805 ± 0.0429−0.2328 ± 0.1094−0.3779 ± 0.0129
C4No ExoFlat1.9844 ± 2.0097−0.0119 ± 0.0976−0.0325 ± 0.0361−0.2265 ± 0.0567−0.2971 ± 0.0081
No ExoFoam1.9231 ± 2.1292−0.0651 ± 0.0720−0.1544 ± 0.0298−0.2391 ± 0.0322−0.2827 ± 0.0047
No ExoCarpet2.5087 ± 2.60020.0089 ± 0.0967−0.1003 ± 0.0379−0.2053 ± 0.0393−0.2524 ± 0.0080
No ExoRubber Circles1.4477 ± 1.6558−0.1573 ± 0.0687−0.2133 ± 0.0482−0.2729 ± 0.0185−0.3010 ± 0.0059
C4ExoFlat2.2714 ± 2.01620.0723 ± 0.1043−0.0468 ± 0.0190−0.1865 ± 0.0596−0.2669 ± 0.0096
ExoFoam2.6494 ± 2.61900.0868 ± 0.10820.0527 ± 0.0462−0.0903 ± 0.0483−0.1542 ± 0.0338
ExoCarpet2.9743 ± 2.64420.2229 ± 0.14280.1947 ± 0.0763−0.0949 ± 0.0992−0.2136 ± 0.0146
ExoRubber Circles2.8070 ± 2.73650.0842 ± 0.1242−0.0534 ± 0.0338−0.1933 ± 0.0547−0.2503 ± 0.0104
Table 4. Classifiers’ performance outcomes for eight-class problem.
Accuracy (%)Recall (%)Precision (%)F1 Score
Linear SVM82.8681.2681.510.81
KNN74.2975.1774.820.75
LDA85.7186.7186.440.87
ANN63.6463.5363.800.64
- Bold row corresponds to higher performance values.
Disclaimer/Publisher’s Note: The statements, opinions and data contained in all publications are solely those of the individual author(s) and contributor(s) and not of MDPI and/or the editor(s). MDPI and/or the editor(s) disclaim responsibility for any injury to people or property resulting from any ideas, methods, instructions or products referred to in the content.

