Article

Effective Connectivity Changes among Brain Hierarchical Architecture of Pre-Supplementary Motor Area in Taxi Drivers

1
Systems Engineering Institute, Academy of Military Sciences, Beijing 100010, China
2
College of Intelligence Science and Technology, National University of Defense Technology, Changsha 410073, China
3
The Brain Science Center, Beijing Institute of Basic Medical Sciences, Beijing 100850, China
*
Authors to whom correspondence should be addressed.
Appl. Sci. 2023, 13(20), 11471; https://doi.org/10.3390/app132011471
Submission received: 25 August 2023 / Revised: 13 October 2023 / Accepted: 17 October 2023 / Published: 19 October 2023
(This article belongs to the Special Issue Anomaly Detection, Optimization and Control with Swarm Intelligence)

Abstract

:

Featured Application

A general framework for functional integration evaluation of human brain is proposed, which effectively combines whole-brain functional connectivity analysis with effective connectivity analysis based on Dynamic Causal Modeling.

Abstract

Much effort has been devoted towards the identification of brain areas recruited during driving—as one of the most common motor skills of human beings. However, how driving experience impacts on the brain’s intrinsic functional architecture has not been fully investigated. Using resting-state fMRI data collected from 20 taxi drivers and 20 nondrivers, this paper asks whether there exists specific brain network integration encoding driving behavior. First, to address this, we proposed a general framework combining whole-brain functional connectivity analysis with effective connectivity analysis based on spectral Dynamic Causal Modeling. The validation results indicated that the application of this framework could effectively discover the brain network that best explained the observed BOLD fluctuations. Second, by segmenting supplementary motor area (SMA) into pre-SMA and SMA proper sub-regions, we used the above framework and discovered a hierarchical architecture with pre-SMA located at the higher level in both driver and control groups. Third, we further evaluated the possibility that driving behavior could be encoded by directed connections among the hierarchy, and found that the effective connectivity from pre-SMA to left superior frontal gyrus could distinguish drivers from nondrivers with a sensitivity of 80%. Our findings provide a new paradigm for analyzing the brain’s intrinsic functional integration, and may shed new light on the theory of neuroplasticity that training and experience can remodel the patterns of correlated spontaneous brain activity between specific processing regions. Meanwhile, from a methodological advantage perspective, our proposed framework takes the functional connectivity results as a prior, enabling subsequent spectral DCM to efficiently assess functional integration at a whole-brain scale, which is not available by only using other DCM methods, such as stochastic DCM or the State-of-the-Art multimodal DCM.

1. Introduction

Driving a car in the real world is an acquired motor skill of human beings, which requires the cognitive ability to integrate multimodal stimuli from surroundings to produce appropriate actions. A number of previous research have used virtual simulation to study the neural underpinnings of various tasks of driving, and have found that driving recruited multiple brain areas supporting perception, motor and cognitive functions [1,2,3,4,5,6]. At the same time, the functional integration analysis of brain networks has been proved to be an efficient way to evaluate how spatially separated brain areas work together to produce more complicated cognitive performance [7,8,9], and how training and learning modulate spontaneous brain activity of specific processing areas [10,11,12,13]. Considering that driving is the most common acquired skill and a complicated social behavior, which can be described by a hierarchical model (called Michon’s model hereafter for convenience) with three levels: the top strategic level, the middle tactical level and the bottom operational level. These three levels interact with each other to complete the complex cognitive processes, such as route planning, decision adjustment and action execution and perception processing [14]. Based on this, it is very likely that valuable discoveries could be made through functional integration analysis of specific driving-related brain areas; however, few studies have fully addressed this issue.
In terms of the methodology of functional integration analysis, functional connectivity [15,16,17,18] and effective connectivity [19] are the two most important methods, which describe the dependency relationship between brain regions from the aspects of correlation (undirected) and causal effect (directed), respectively. However, how to combine these two methods has been rarely reported. In view of this, previous studies of Dynamic Causal Modeling (DCM) have discussed the relationship between these two kinds of connectivity, pointing out that functional connectivity is a necessary but insufficient condition for effective connectivity, which means that the existence of functional connectivity cannot be inferred when there is no effective connectivity; however, the absence of functional connectivity largely denies the existence of effective connectivity [20,21]. In addition, due to the lack of task design and task activations, the resting-state data cannot provide direct information to determine the regions of interest (ROIs) at the initial stage of calculation. Although there are various brain partition templates that can be used for the ROI selection [22,23,24,25], the differences between those templates also introduce much difficulty and uncertainty to the analysis. Based on the above information, we try to explore an algorithm that combines functional connectivity with effective connectivity in this paper. Firstly, functional connectivity analysis is used to find out the ROIs; then, effective connectivity analysis is carried out among the ROIs to further explore the directionality of the brain’s functional integration. This algorithm provides a new idea for the selection of ROIs in the functional integration analysis of the resting-state neuroimaging data. In terms of the effective connectivity analysis, this paper focuses on the spectral DCM, which is a computationally efficient algorithm and is suitable for the resting-state fMRI data [26,27]. The novel Parametric Empirical Bayes (PEB) is also used in the group-level analysis of effective connectivity [28,29,30].
In this paper, we focus on using a newly proposed method of functional integration analysis based on the above neuroimaging and methodological considerations to explore whether driving behavior leads to changes in the intrinsic functional architecture of the human brain. In addition, among various driving-related brain regions, the importance of supplementary motor area (SMA) has been highlighted, pointing out that this region has performed a crucial role in Michon’s model for linking cognition to action [4]. More interestingly, the SMA is suggested to be made up of two sub-regions that are anatomically and functionally separated, referring to the pre-SMA (rostral SMA) responsible for complicated cognitive situations, and the SMA proper (caudal SMA) involved in action levels [31,32,33,34]. Therefore, to be more specific, we explored the brain’s functional plasticity by identifying SMA-related functional connectivity and effective connectivity differences between drivers and nondrivers. The proposed framework comprise two main parts. In the first part, by segmenting SMA into two sub-regions (i.e., pre-SMA and SMA proper), we checked the possible driving-related changes in functional connectivity. In the second part, we took the brain regions showing significant functional correlations as ROIs, to further explore the driving-related effective connectivity changes. We hypothesized that driving may modify the directed connectivity patterns of the pre-SMA and SMA proper in distinct manners.
This paper bears the following main contributions:
  • We propose a general framework for investigating functional integration of the human brain. This framework takes functional connectivity results as a prior, enabling subsequent DCM to assess causal organization of brain network at a whole-brain scale.
  • We check the quality of DCM model fitting. The results have indicated that our framework can effectively discover the specific brain network integration that best explains the observed BOLD fluctuations.
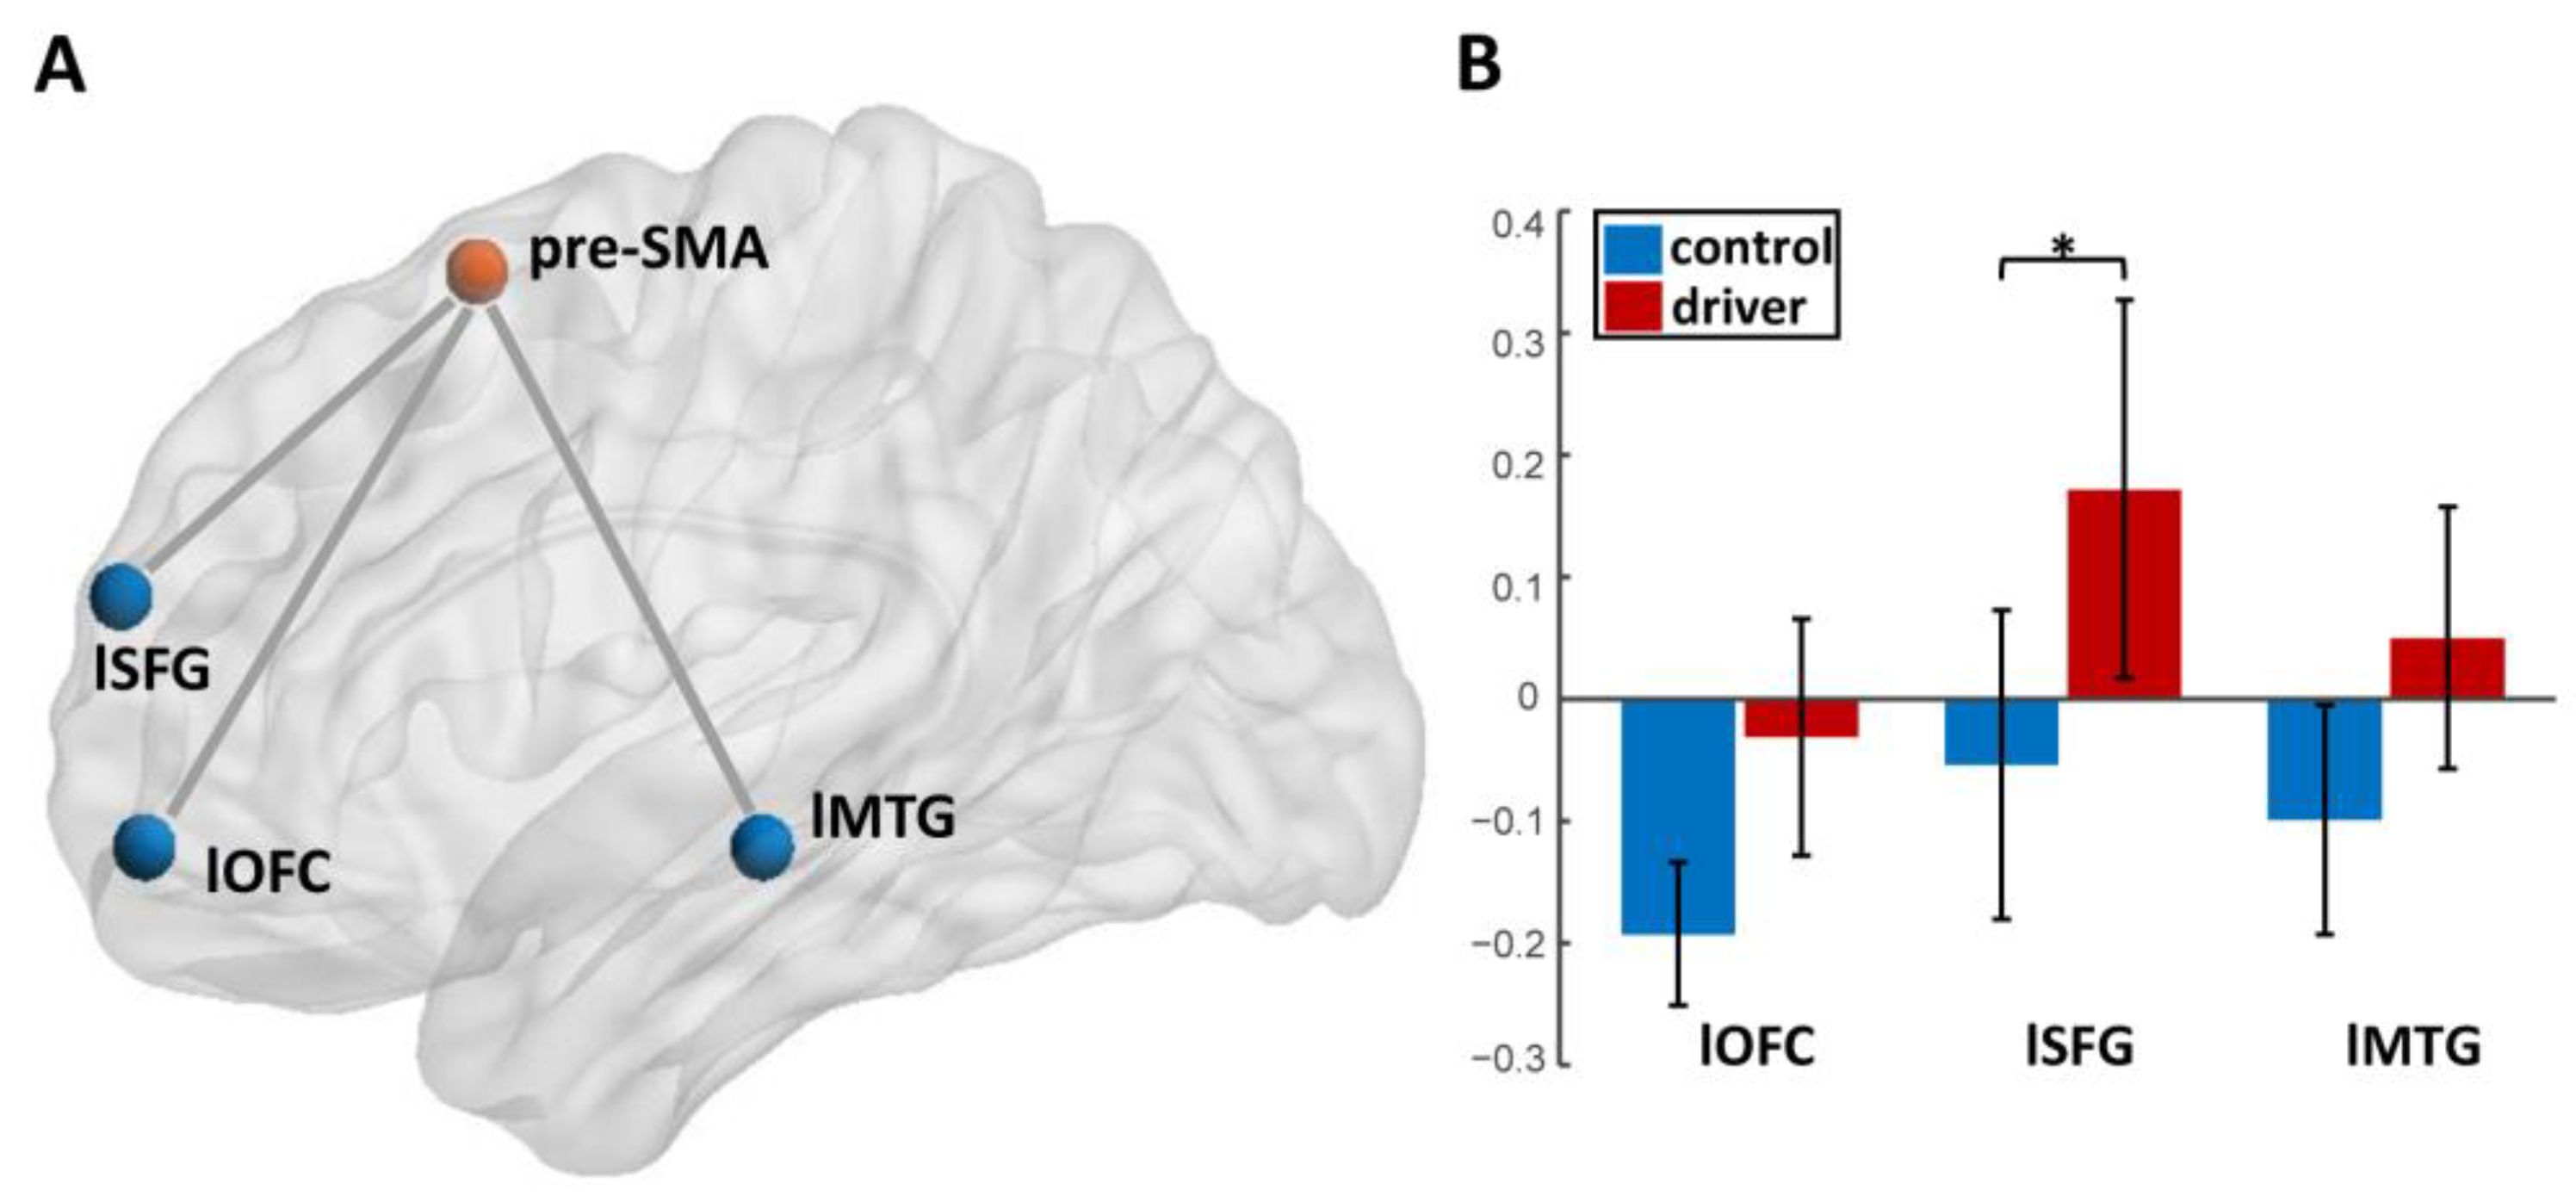
  • We apply this framework to investigate the functional plasticity of the resting human brain underlying driving experience, and, for the first time, we discover a hierarchical architecture with pre-SMA located at a higher level, and reveal that several directed connections in the hierarchy exhibit significant classification ability to distinguish drivers from nondrivers.
The organization of the article is as follows: Section 2 describes the data and methods in detail, including the basic information of the data, the data preprocessing, as well as the theoretical basis and concrete implementation steps of functional connectivity and effective connectivity analysis involved in the proposed framework. Section 3 illustrates the corresponding analysis results in detail, including the group-level functional connectivity results, the group-level effective connectivity results, the differences in effective connectivity patterns between drivers and nondrivers and the predictive validity (i.e., classification ability assessment) results. Section 4 gives explanation of the results, and discusses the significance and methodological contributions of the whole paper.

2. Materials and Methods

2.1. Subjects and Data Acquisition

Resting-state fMRI data were collected from 20 subjects who were licensed taxi drivers for more than 1 year and 20 nondrivers (i.e., controls). Considering that the demographic variables such as gender, age and education level would affect the intrinsic functional architecture of brain, we conducted statistical analysis on the demographic parameters (i.e., age, sex and education) of these subjects, showing the group mean ± standard deviation, as well as the significance level (i.e., p value) in Table 1. Two-sample t-test and Pearson’s Chi-squared test were correspondingly applied for group comparison. It can be seen that there is no significant differences in demographic parameters between the two groups (see Table 1); therefore, the subsequent results are unlikely to be influenced by the between-group differences of these uninteresting variables. All subjects signed written informed consent forms, and this study was approved by the Institutional Review Board of the Southwest University. No subjects had mass lesions (including tumors, vascular malformations or malformations of cortical development), brain trauma or history of alcohol or drug dependence.
Resting-state fMRI scans were acquired at a 3-T SIEMENS MRI scanner. All subjects were instructed to stay awake and keep their eyes closed; no other task instruction was provided. The functional images were collected using a gradient-echo echo-planar pulse sequence sensitive to blood oxygen level-dependent (BOLD) contrast with the following parameters: TR/TE = 2000/30 ms, thickness/gap = 3.0/0 mm, FOV = 200 × 200 mm2, FA = 90°, matrix = 64 × 64, slices = 32, time of scanning = 8 min, and volumes = 240.

2.2. Data Preprocessing

The routine BOLD-fMRI preprocessing procedure were conducted as follows (using GRETNA toolbox) [35]: (1) removal of the first 10 volumes of each scan for magnetization equilibrium; (2) slice timing correction to eliminate temporal offsets between slices; (3) realigning images for head motion to reduce head movement effects on the spatial correspondence of the brain across volumes; (4) normalizing images to the EPI template in the standard MNI atlas space (resampling to 3 mm isotropic voxels) to facilitate group average and group comparison; (5) spatially smoothing using a 6 mm (usually twice the voxel size) full-width half-maximum (FWHM) Gaussian kernel to improve the signal-to-noise ratio; (6) linear detrending to reduce the effects of linear drift in the signal; (7) regressing out nuisance signals including signals averaged from whole brain, white matter, CSF and head motion (Friston 24 parameters) to reduce the effects of non-neuronal fluctuations; (8) temporal filtering with a high-pass filter of 1/128 Hz to reduce the low-frequency drift. No subject in this study was excluded by significant head motions (more than 2 mm of translation and 2° of rotation).

2.3. Functional Connectivity Analysis

Using functional connectivity analysis, we would like to examine the possible SMA-related functional connectivity changes induced by long-term driving. Considering that SMA can be divided into sub-regions with distinct cognitive functions, we first conducted a functional segmentation algorithm that we have previously proposed to divide SMA into sub-regions [36]. To be more specific, this segmentation algorithm established a two-level clustering procedure to obtain a consistent result across all subjects. The first level was the individual level, where functional connectivity (i.e., Pearson’s correlation coefficients) between voxels in SMA ( n voxels) and the whole brain was calculated as the data feature for each subject (denoted as x i   ( i = 1 , 2 , , n ) ), and the maximum margin criterion used in SVM was then applied to assign x i a cluster label and a SVM classifier f x = ω ϕ x ( ω was the optimal separating hyperplane, ϕ was the feature map; linear kernel was used in this study). After finishing the above clustering procedure for all subjects ( j subjects), for each voxel i   ( i = 1 , 2 , , n ) , a set of SVM scores was obtained (marked as s i = f 1 x i 1 , , f j x i j ). The second level was the group level, where the data feature was the SVM scores s i   ( i = 1 , 2 , , n ) , and maximum margin criterion was then performed to assign s i   ( i = 1 , 2 , , n ) to two clusters. Therefore, the final clustering result reflected the consistency of brain segmentation across different subjects (for more detail please see [36]).
After performing functional segmentation algorithm, the SMA was divided into two sub-regions, i.e., the pre-SMA and the SMA proper (see Figure 1). On this basis, we, respectively took the pre-SMA and the SMA proper as seed regions for functional connectivity analysis. Pearson’s correlation coefficients between the seed time series (the averaged time series of all voxels in the seed region) and time series of all voxels in the brain were calculated, and Fisher’s z-transforms were performed for normality. The obtained correlation maps across subjects were then used to identify significant driving-related functional connectivity changes, where two-sample t-tests (p < 0.001, uncorrected, and p < 0.05, Topological FDR corrected, respectively) were conducted to identify group differences [37]. Age, sex and educational level were included as covariates in the statistical models.
Using the same procedure, we additionally evaluated the effect of precise segmentation of brain regions on functional integration analysis; namely, the group differences in functional connectivity between the entire SMA and the whole brain were also calculated.

2.4. Effective Connectivity Analysis

2.4.1. Spectral Dynamic Causal Modeling

Brain regions that showed significant functional connectivity were taken as ROIs in the spectral DCM analysis. The activity of each ROI was summarized with its weighted (using T value) mean, and a Full model (i.e., the brain regions were reciprocally interconnected, and the brain regions had inhibitory self-connection) structure was set. Spectral DCM was then applied using SPM12.
The principle of spectral DCM is the same as that of classical DCM, which is to establish a Bayesian generative model to describe how various neural systems are coupled through effective connectivity and finally generate observation data (such as BOLD signal). However, the difference is that the spectral DCM no longer estimates stochastic time series, but instead uses a deterministic model to generate the cross spectral densities (CSD) of time series.
Equation (1) denotes the neuronal model of the spectral DCM:
x ( t ) = A x t + C u t + v t
where x ( t ) is the neuronal state variable, A is the neuronal parameter (i.e., the effective connectivity), u ( t ) is the experimental stimulus input ( u t = 0 for resting-state data) and v ( t ) is the state noise.
The below hemodynamic state equation further describe how the hidden neural activity x ( t ) becomes the observed BOLD time series y ( t ) :
y ( t ) = h ( x ( t ) , φ ) + e ( t )
where φ is the hemodynamic parameter and e ( t ) is the observation noise.
Therefore, the parameters to be estimated in the above generative model are the neuronal parameter A , the hemodynamic parameter φ , the state noise v ( t ) and the observation noise e ( t ) . However, the estimation of the latter time-varying signals v t and e ( t ) is the solution of stochastic differential equations, which is computationally inefficient. To avoid this, we further calculate the CSD of these signals, which can be expressed as follows:
g v ( ω , θ ) = α v ω β v g e ( ω , θ ) = α e ω β e
where g x ω = X ( ω ) X ( ω ) is the CSD, X ( ω ) is the Fourier transform of the time-domain signal x ( t ) , α , β θ is the parameter to be estimated for controlling the amplitude and exponent of the spectral density and ω = 2 π f is the angular frequency. As a result, the original time-varying time series is replaced by its second-order statistics with time-invariant characteristics (i.e., the CSD). This is performed so that the parameter estimation of DCM can be turned into the solution of deterministic differential equations, which greatly improves the calculation efficiency.
In this study, the CSD was calculated by the 4th order autoregressive model, and the frequency range was set to [1/128, 0.1] Hz (for more detail please see [20,26,27]). After model inversion, the model evidence and the posterior mean and posterior covariance of each connection for each subject were obtained.

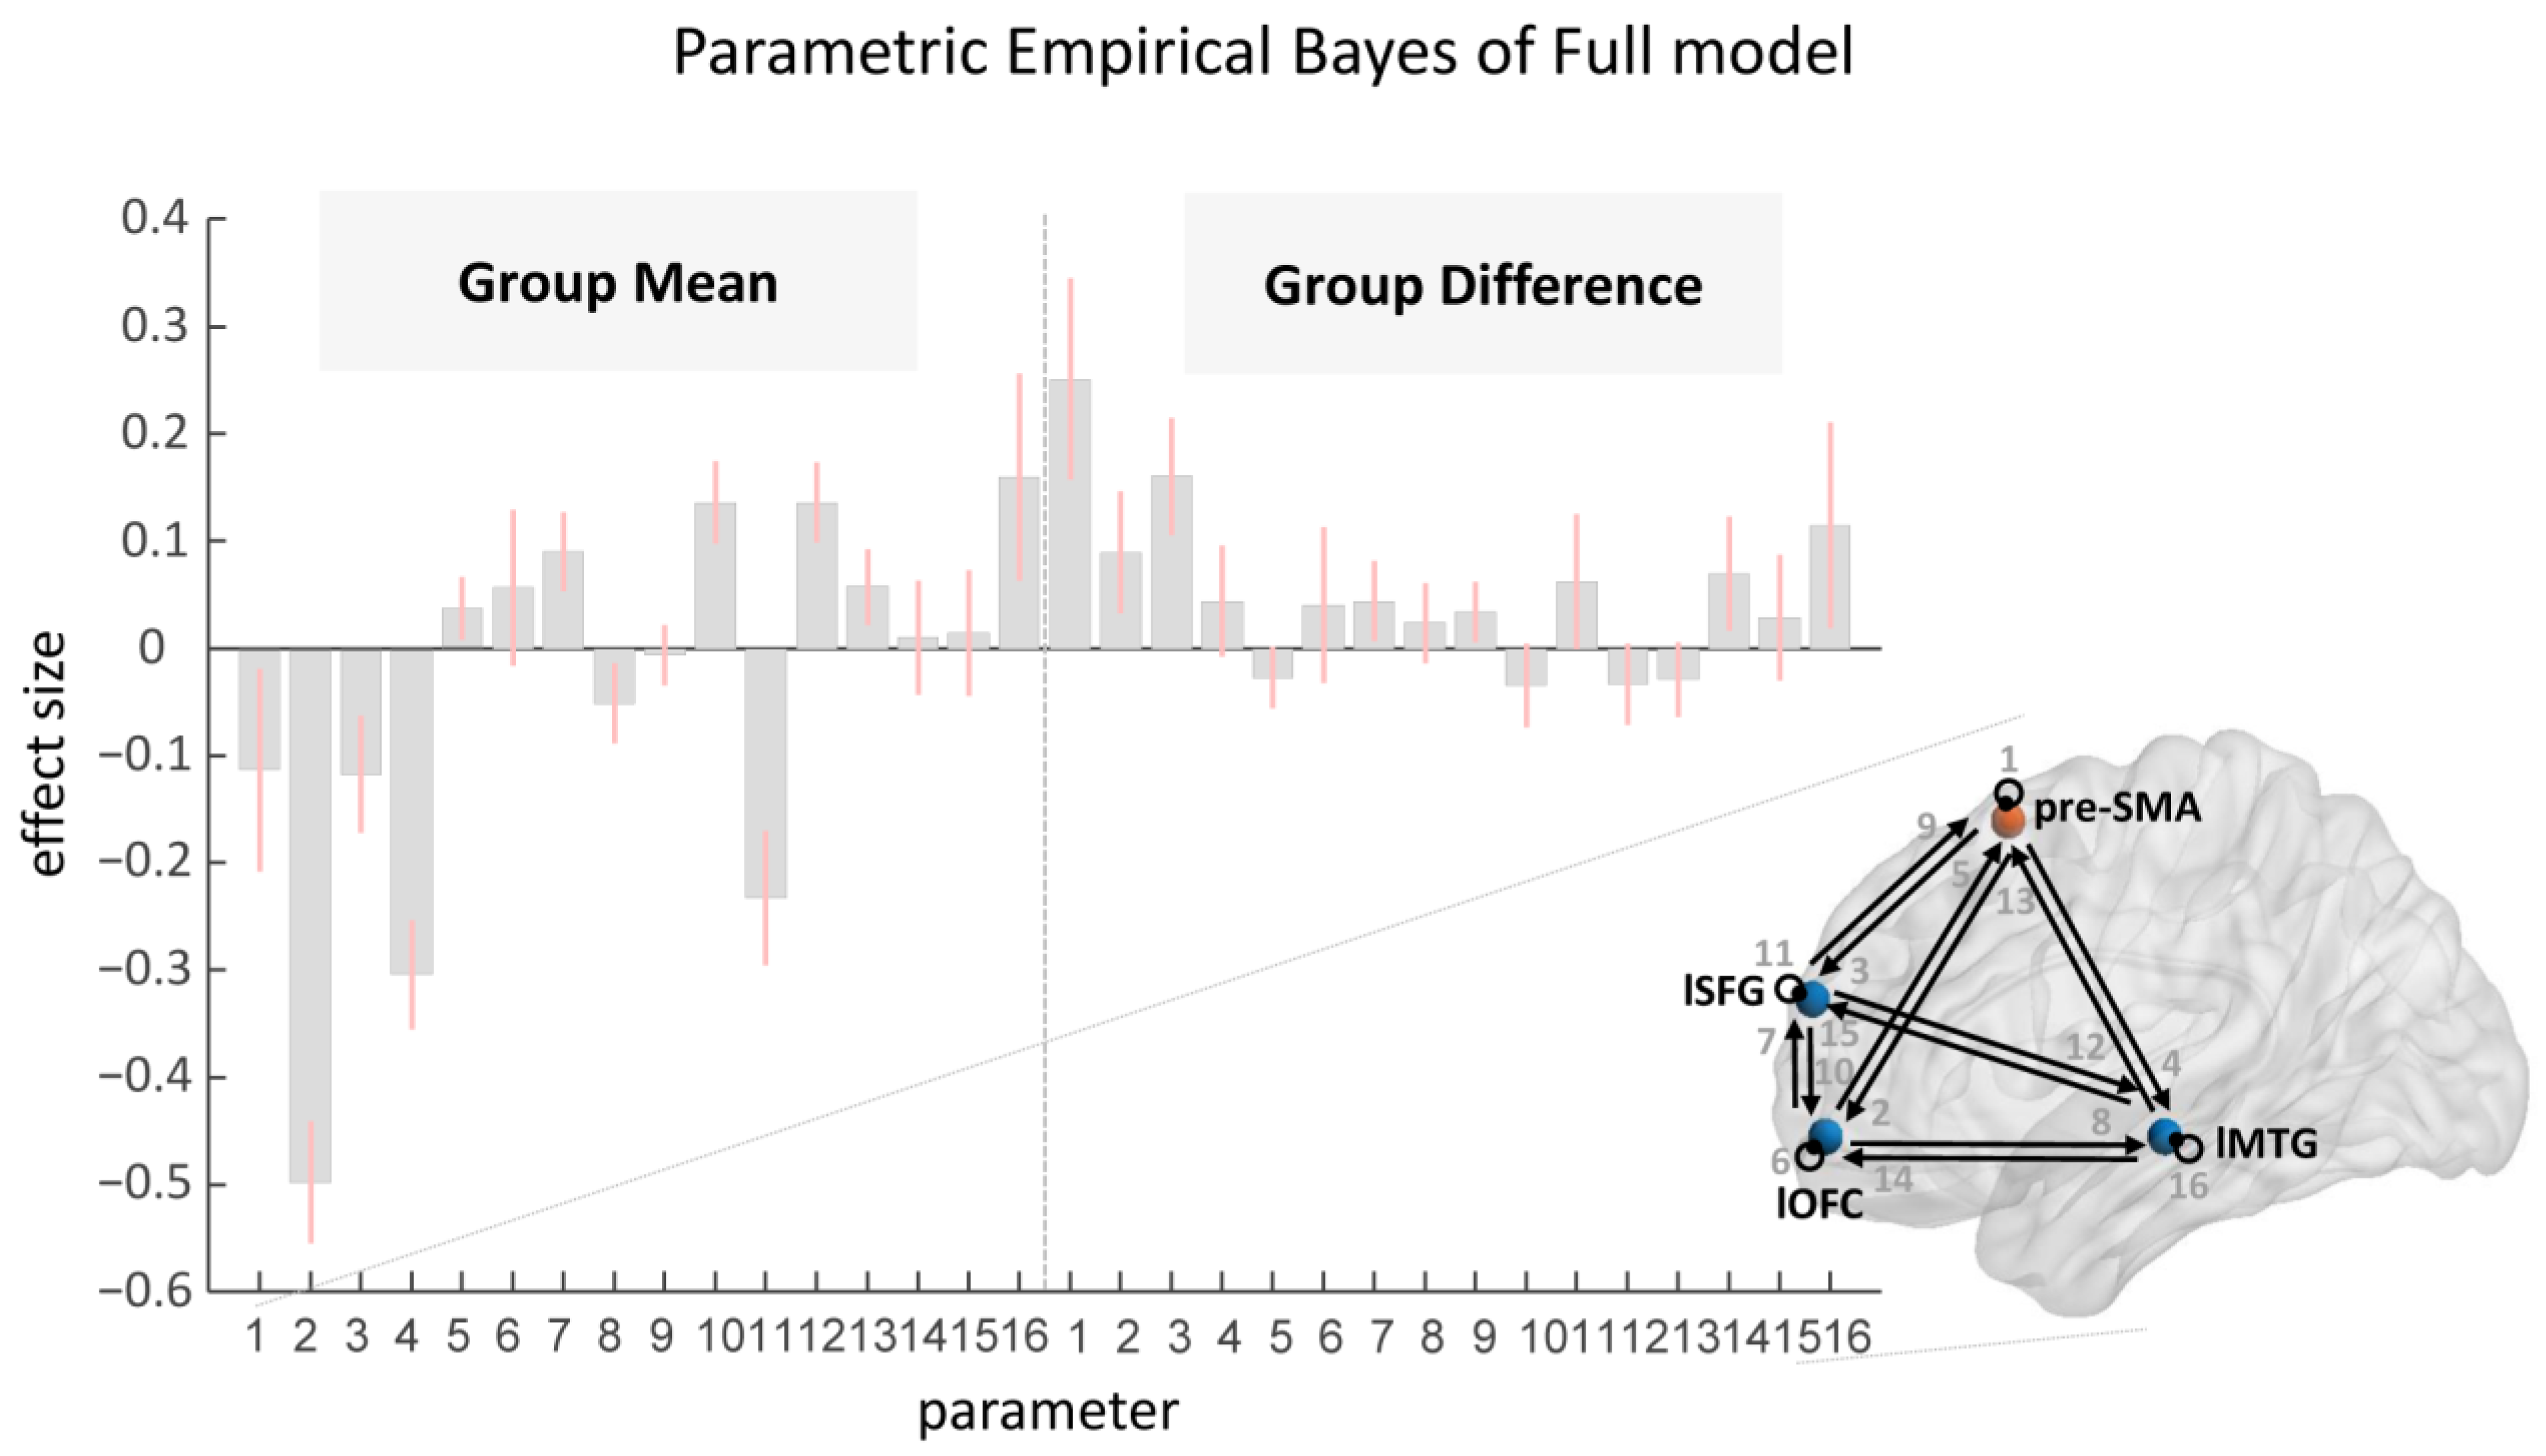
2.4.2. Parametric Empirical Bayes

The posterior densities of the effective connectivity were then engaged for group-level analysis using Parametric Empirical Bayes (PEB). In PEB, a general linear model (GLM) is established on the basis of posterior density of model parameters at individual level to obtain group level results [28,29,30], which can be formulated as follows:
y i = Γ θ i 1 + ε i ( 1 ) θ ( 1 ) = X θ ( 2 ) + ε ( 2 )
where in the first layer, y i is the BOLD time series of the i -th subject, θ i 1 is the estimated DCM model parameters for this subject and ε i ( 1 ) is the observation noise. The second layer formula is the GLM established to estimate parameters from individual level to group level, where θ ( 1 ) are the estimated DCM model parameters for all subjects; X is the design matrix of GLM, where the row numbers represent the subject numbers, and each column is a regression variable (such as age, group, etc.) that may affect DCM parameters to be considered; θ ( 2 ) is the coefficient set corresponding to each regression variable, which quantifies the influence of regression variables on DCM parameters; ε ( 2 ) is the model residual.
In this study, the design matrix X was set with the first column of all “1” to uncover commonalities across all subjects, and the second column of “1” for drivers and “−1” for controls to uncover group differences between the drivers and the controls.

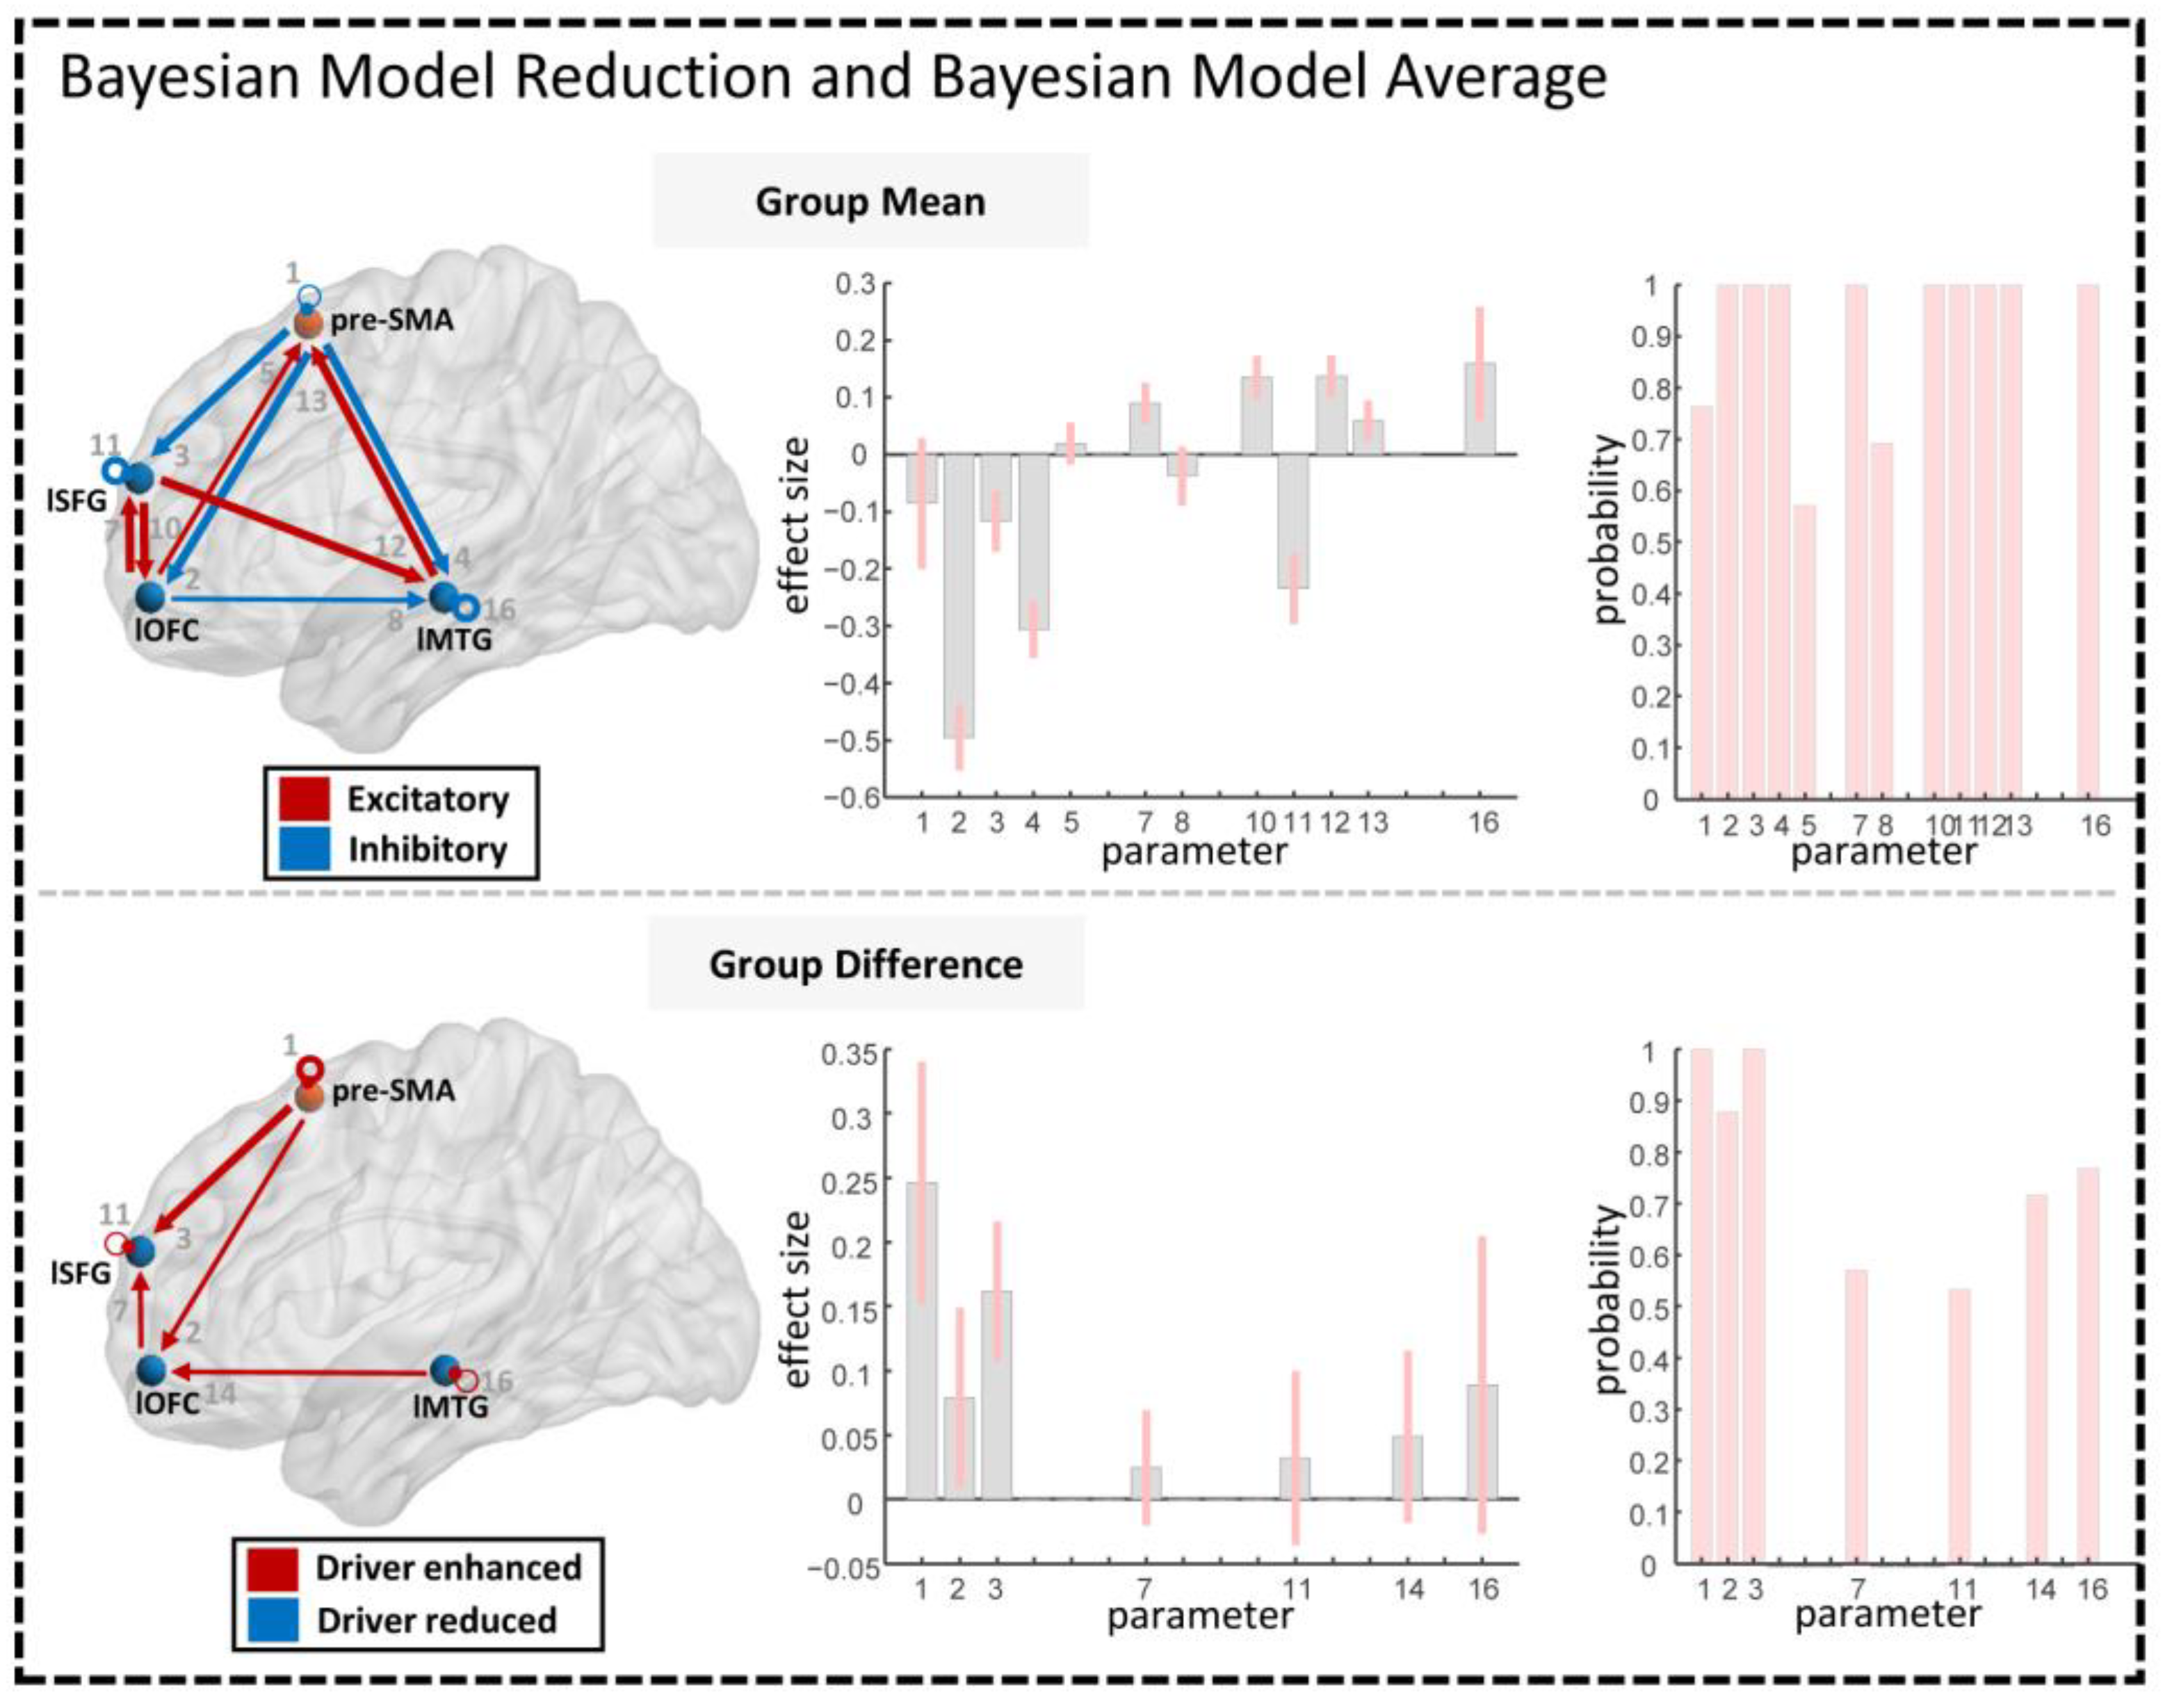
2.4.3. Bayesian Model Reduction and Bayesian Model Averaging

Using PEB analysis, we could not make an intuitive view about which effective connectivity is highlighted because of significant group effects. To answer this, Bayesian model reduction (BMR) and Bayesian model averaging (BMA) were used to further evaluate the significance of the PEB results [28]. In this study, we used SPM12 toolbox to conduct BMR, where a greedy search was automatically applied to exclude parameters that do not affect the PEB model evidence. BMA was then used to give the average parameters of the best 256 reduced models. According to BMR and BMA analysis, some unimportant connections would be switched-off, and the remaining effective connectivity could be regarded as the significant group-level results.

3. Results

3.1. Group Differences of Functional Connectivity

Table 2 reported the driving-related changes in functional connectivity. We found that the connections between the pre-SMA and the left orbital frontal cortex (lOFC), the left superior frontal gyrus (lSFG) and the left middle temporal gyrus (lMTG) were stronger in drivers than in the controls (p < 0.05, Topological FDR corrected). On the contrary, the drivers showed weaker functional connectivity (p < 0.001, uncorrected) between the pre-SMA and the right middle frontal gyrus (rMFG), and the right inferior parietal lobule (rIPL), while the significance of these two connections did not reach the predefined significance level (i.e., p < 0.05, Topological FDR corrected). Interestingly, there were no significant SMA proper-related functional connectivity differences between the drivers and controls, suggesting that the driving-related changes in functional connectivity were specific to the pre-SMA and did not extend to the SMA proper.
Taking the entire SMA as the seed region, the results showed that a functional connectivity difference was only revealed in the lSFG (p < 0.001, uncorrected); however, the significance of this connection did not pass the multiple comparison correction (p < 0.05, Topological FDR corrected). This finding suggests that the fine segmentation of brain regions can effectively improve the sensitivity of the analysis, ensuring some meaningful results would not be merged by the average effect of rough brain region division.
To sum up, we found that three brain regions (the lSFG, the lOFC and the lMTG) showed significant group differences of functional connectivity with the pre-SMA (p < 0.05, Topological FDR corrected), indicating that the brain network consisted of the above four regions, which highlighted driving-related functional integration features. Figure 2A illustrated the functional connectivity pattern among the four regions, and Figure 2B showed the error bar of each connection for the driver and the control groups.

3.2. Group Differences of Effective Connectivity

The four brain regions uncovered by the above functional connectivity analysis were engaged in the effective connectivity analysis. A Full model (any two of brain regions were interconnected, and the brain region itself had an inhibitory self-connection) of four nodes (i.e., the pre-SMA, the lSFG, the lOFC and the lMTG) was set, and the spectral DCM was applied to obtain the posterior mean and posterior covariance of each connection for each subject. PEB was then used for group-level analysis; the results are shown in Figure 3. The “Group Mean” panel in Figure 3 illustrates the posterior beliefs of all connections for the group commonality. It is worth noting that the positive posterior mean indicates that the corresponding effective connectivity is excitatory, whereas the negative mean indicates inhibitory connectivity. The excitatory and inhibitory distinction is important in the theory of predictive coding, which will be explained in detail in the Section 4. The “Group Difference” panel in Figure 3 shows the posterior beliefs of all connections for the group difference, where the positive posterior mean reveals that the corresponding effectivity connectivity is enhanced more in the drivers than in the controls, and the negative value means that the connectivity is reduced in the drivers.

3.3. Significance Evaluation of Effective Connectivity

Figure 4 shows the significant effective connectivity provided using BMR and BMA. The “Group Mean” panel illustrates the results of commonalities across all subjects. We could see that some connections were removed for a posterior probability of 0, indicating these connections are not critical for the functional network construction. The others establish a directed connectivity network of either excitatory (marked in red) or inhibitory (blue) connections among the four brain regions (the connection with a posterior probability of 100% is shown in bold). Interestingly, inhibitory connections are established from the pre-SMA to the remaining three regions, while the connections from these brain regions to the pre-SMA are excitatory.
The “Group Difference” panel shows the group difference results provided using BMR and BMA. We can now make a clear distinction that the drivers establish a total of seven enhanced effective connections relative to the controls. The posterior probabilities of all connections are shown in a bar chart, ranging from about 57% to 100%. The self-connection of the pre-SMA and the pre-SMA→lSFG connection have 100% posterior probabilities, indicating that these two connections exhibit the most significant group difference.

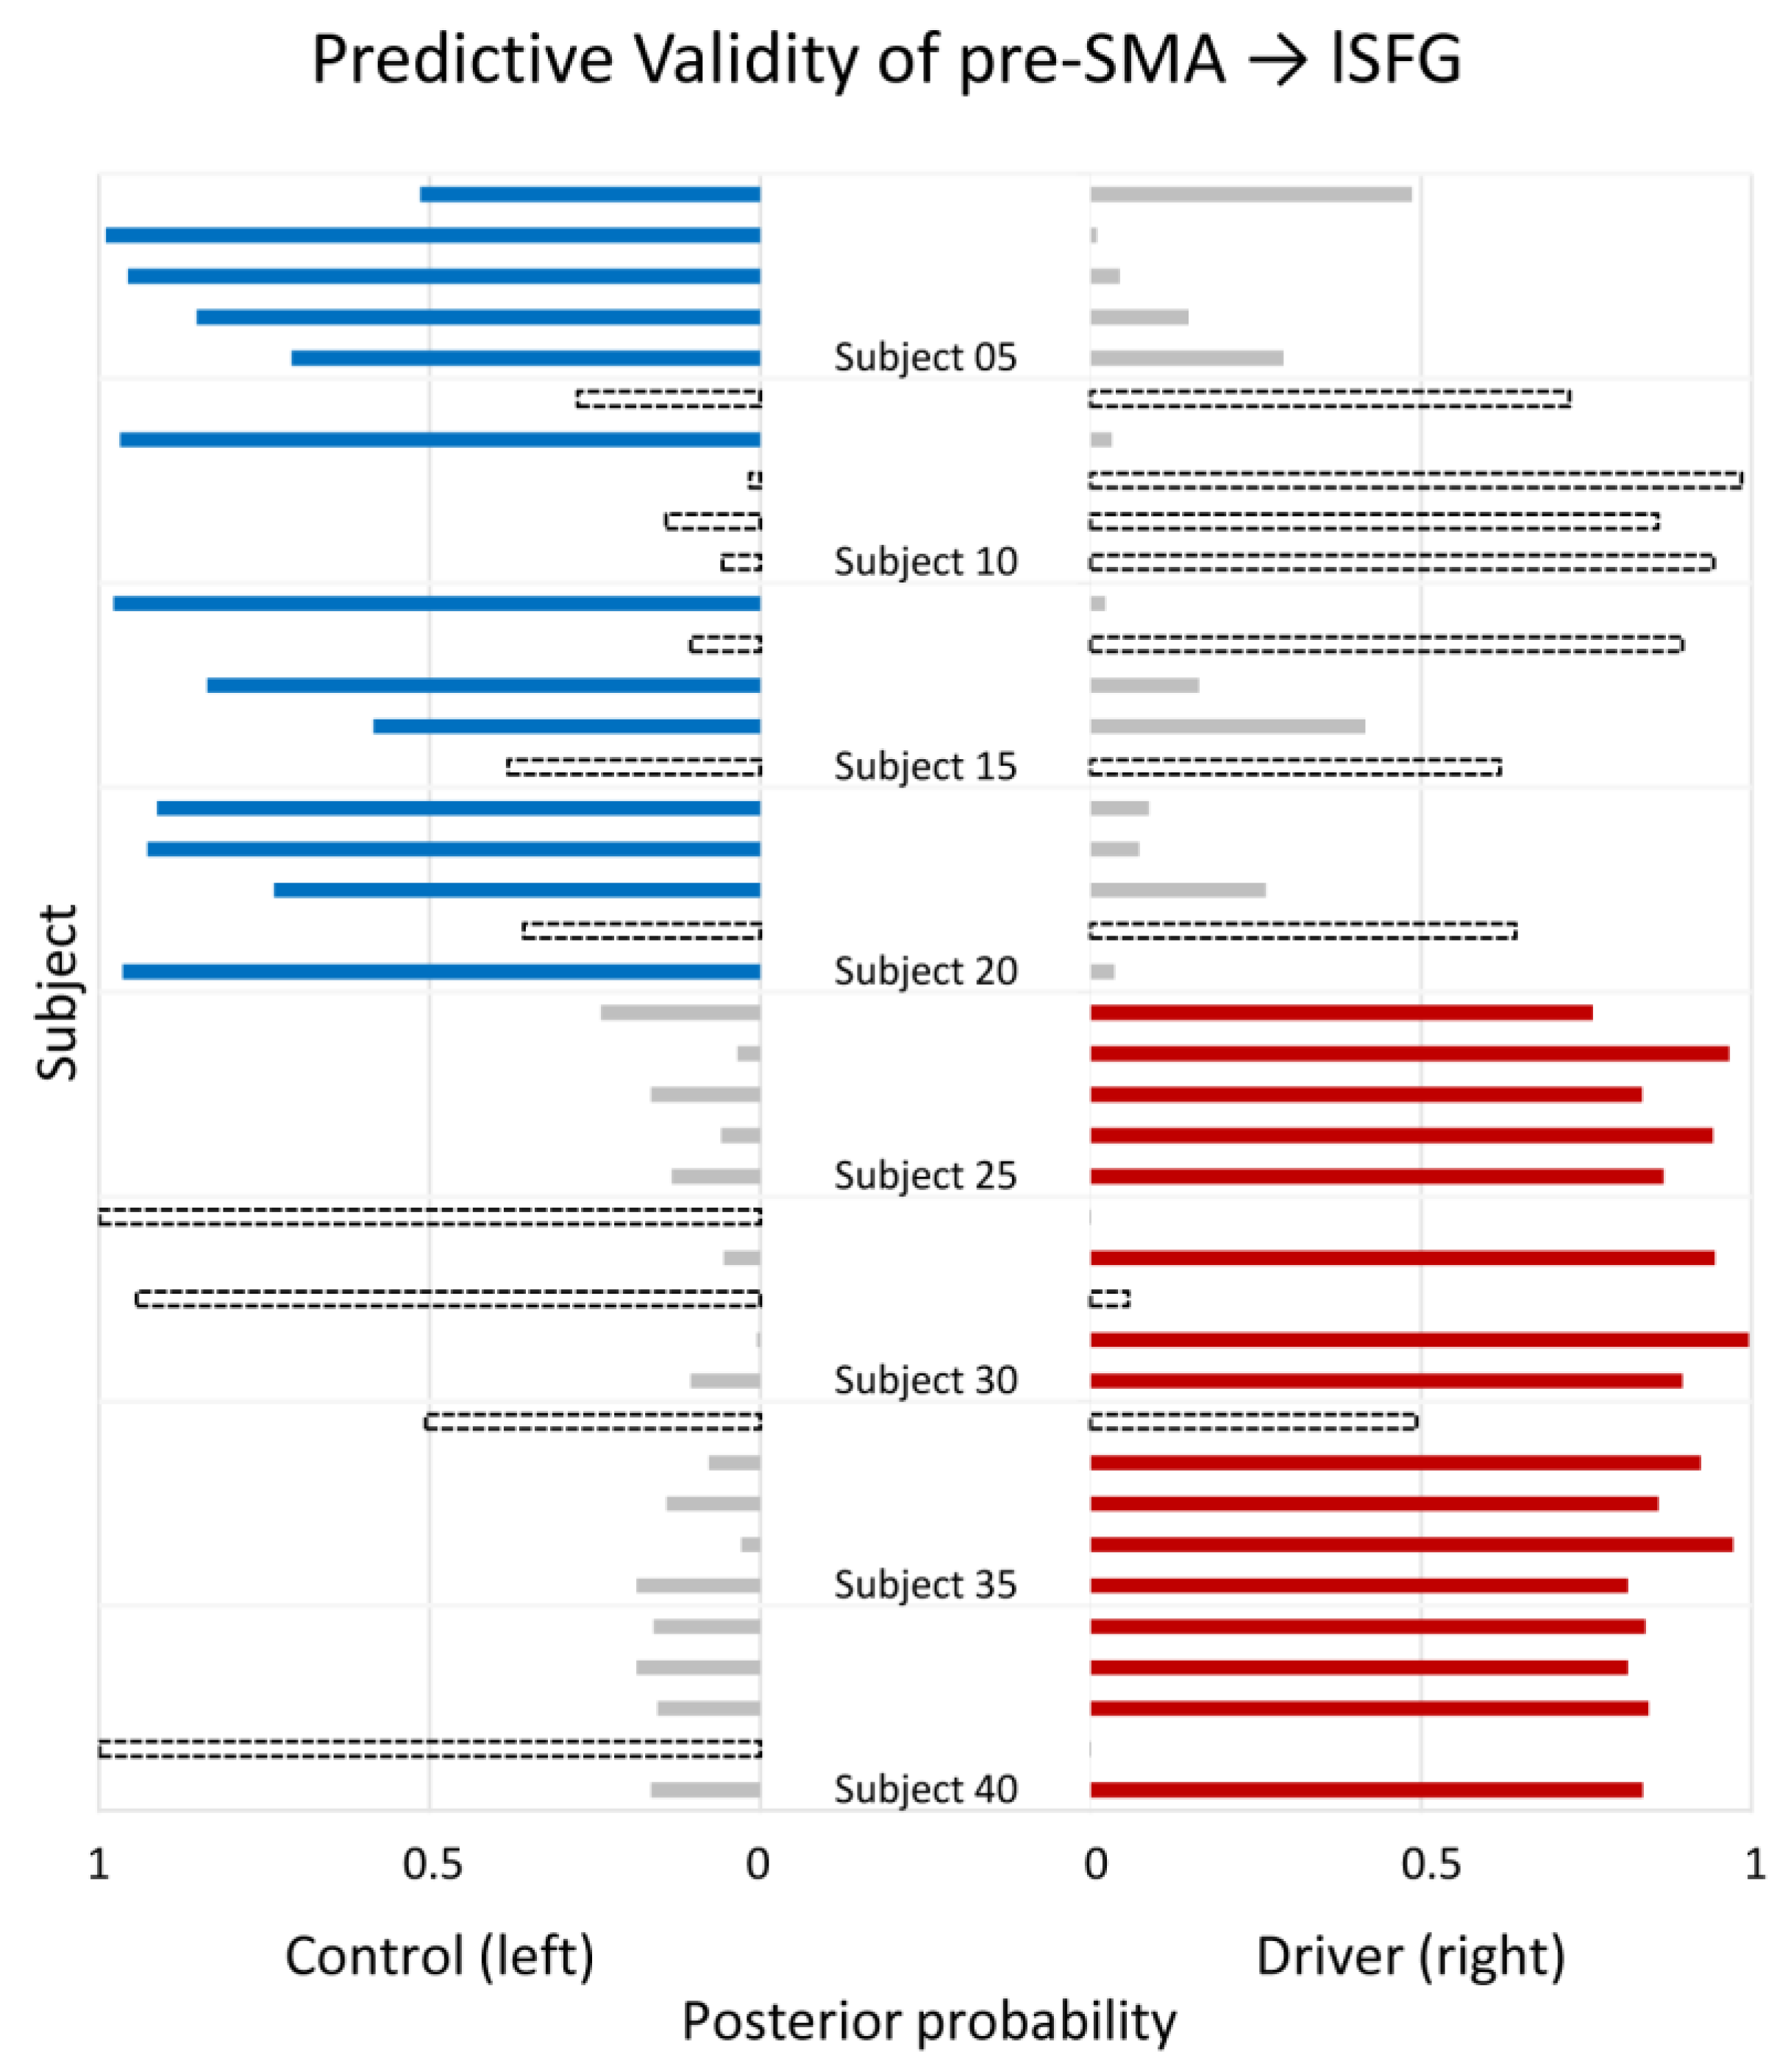
3.4. Predictive Validity Assessment of Effective Connectivity

In the previous section, we have found seven effective connections exhibiting significant group differences. Among these results, predictive validity assessment was conducted to further evaluate the classification ability of each connection. To be more specific, a PEB model was estimated while leaving out a subject from the total 40 subjects (i.e., leave-one-out cross validation), and this PEB model was then used to calculate the posterior predictive density (i.e., posterior predictive expectation, posterior predictive covariance and posterior probability) of the between-subjects effect (i.e., driver or control) for the reserved subject, based on the significant effective connectivity chosen.
Taking the predictive validity of the pre-SMA→lSFG as an example, Figure 5 shows the posterior probability of each subject belonging to the control group (left panel) and the driver group (right panel). Considering the true label of each subject (i.e., subjects 1 to 20 are controls, and subjects 21 to 40 are drivers), the true negative results (i.e., control subjects were correctly classified to control group) are marked as blue bars in the left panel in Figure 5, and the true positive results (i.e., driver subjects were correctly classified to driver group) are highlighted as red bars in the right panel. The black dotted bars show the wrongly predicted results, and we can see that 7 controls were misidentified as drivers (false positive), and 4 drivers were misidentified as controls (false negative). Therefore, in terms of the classification performance of the pre-SMA→lSFG connection, the classification accuracy, sensitivity and specificity are 72.5%, 80% and 65%, respectively. The Pearson’s correlation coefficient between the posterior predictive expectation and the true value of the group membership (correlation = 0.4057) and its significance (p = 0.0047) were also calculated (see Table 3). These results clearly show that the pre-SMA→lSFG connection can be effectively used to identify driving behavior.
The predictive validity (i.e., the classification accuracy, sensitivity, specificity, correlation coefficient and its significance) of the other six connections are reported in Table 3. We can find that the connections with 100% posterior probability of group difference, i.e., the self-connection of the pre-SMA, and the pre-SMA→lSFG connection, exhibit significant classification ability (p < 0.05) to distinguish drivers from controls (sensitivity = 80%).

4. Discussion

In this work, functional plasticity of the resting human brain underlying driving experience was evaluated using a newly proposed framework that combines functional connectivity with effective connectivity analysis. The results showed that, compared with nondrivers, the driver group established enhanced functional connectivity between the pre-SMA and several prefrontal regions. It was also found that driving-related changes were restricted to the pre-SMA and did not extend to the SMA proper. Effective connectivity analysis using spectral DCM further revealed the directionality of these connections, indicating that the pre-SMA had established a hierarchical organization with the other regions, i.e., in the context of predictive coding theory, the pre-SMA was located at a higher level, and the effective connections to the rest of the regions were inhibitory feedback connections. Particularly, the connection strength of pre-SMA→lSFG was significantly enhanced in the drivers and exhibited significant classification ability to distinguish drivers from controls.
Resting-state brain network analysis frequently requires the specification of regions of interest (ROIs). A common method uses atlases derived from structural boundaries. The main problem in using structural ROIs is that they are generally rather coarse and tend to combine functionally distinct ROIs [25,38]. In this paper, we focused on the region of SMA, where the sub-regions of this area have been reported to show different structural [31] and functional connectivity [33] profiles. Therefore, by using a two-level segmentation algorithm we have proposed previously [36], the functionally distinct sub-regions (i.e., the pre-SMA and SMA proper) showing group-level consistency were obtained for further analysis (see Figure 1).
Based on the respective time series of the pre-SMA and SMA proper, we then explored the group difference in functional connectivity between drivers and nondrivers. We found that the drivers showed stronger functional connectivity between the pre-SMA and several prefrontal regions, including the lSFG and the lOFC (approximating Brodmann’s area 10, see Table 2). Driving is a highly complicated behavior that requires the simultaneous integration of lower-level tasks of action with higher-level cognitive processing and decision making [14]. It is suggested that the prefrontal cortex plays a pivotal role in switching between externally versus internally oriented thoughts, and maintaining the stable implementation of sustained mental plans [39,40], whereas the pre-SMA is more responsible for complicated cognitive situations. Therefore, the integration of the pre-SMA and prefrontal cortex may equip humans with the ability to pursue a long-term driving plan and meanwhile respond to the demands of the immediate driving context. In addition, considering that prior experience can modify functional connectivity strength, the increased functional connectivity between the pre-SMA and the prefrontal regions may be caused by the persistent occupation of this neural circuit when driving. On the other hand, emerging evidence indicate that the strength of the resting-state functional connectivity is associated with individual differences in task performance [7,8,9]. Therefore, increased functional connectivity may facilitate communications between the pre-SMA and prefrontal regions and benefit successful performance in driving. Here, we showed that the pre-SMA, rather than SMA proper, showed significant resting-state functional connectivity differences between drivers and nondrivers (Table 2), which may help to shed light on the functional roles of SMA sub-regions. Additionally, we compared driving-related functional connectivity changes with the entire SMA and the pre-SMA, and found that the latter was more sensitive in detecting group differences (Table 2). A possible reason for that is that the use of functionally inaccurate ROIs will dilute meaningful signals. This emphasizes the great importance of specifying ROIs that are functionally homogeneous for resting-state fMRI studies.
Functional connectivity analysis has provided candidate brain networks that showed significant driving-related functional integration (see Figure 2). Effective connectivity analysis using spectral DCM was then applied on this basis to further reveal the directionality of the connections. The results revealed that the pre-SMA had established a hierarchical architecture with the lOFG, the lSFG and the lMTG, which could be judged according to the sign of the effective connectivity strength—the bottom-up connection is a feedforward connection, which is excitatory (i.e., the posterior mean of the effective connectivity strength is positive), while the opposite is a top-down feedback connection, which is inhibitory (i.e., negative effective connectivity strength). This agrees with the predictive coding theory, showing that top-down feedback connection is used to suppress prediction errors from the lower levels [41,42,43]. According to the group means of the effective connectivity provided using PEB and BMR, the posterior means of the directed connections from the pre-SMA to the lOFG, the lSFG and the lMTG were all negative, while the effective connectivity of these brain areas to the pre-SMA were all positive (see Figure 3 and Figure 4). Considering that various driving-related tasks (such as performing prepared actions, action planning and considering the traffic rules) were associated with the pre-SMA [4], the pre-SMA is more highlighted in task switching [44], response inhibition [45], learning of movement sequences [46] and motor selection [47]. Therefore, we infer that the pre-SMA is at a higher level of the brain functional network that we studied, which is responsible for integrating complex cognitive and motor functions, and suppressing the prediction errors introduced by lower levels of a hierarchy.
The results of PEB and BMR also pointed out that there significant group differences existed between drivers and controls, in which the pre-SMA→lSFG connection was significantly enhanced in the drivers with a posterior probability of 100% (Figure 4). We then conducted predictive validity assessment, and found that this connection could effectively identify group membership (see Figure 5 and Table 3), indicating that this effective connectivity could be used to judge whether the functional integration structure of the brain was reshaped by long-term driving behavior. In addition, considering that the effective connectivity of pre-SMA→lSFG was an inhibitory feedback connection (see the “Group Mean” panel of Figure 4), the enhanced value in the driver group may indicate that the driving behavior weakens the inhibitory effects of this feedback connection; namely, the pre-SMA does not need to use a strong inhibitory strength to suppress the prediction errors from the lSFG. These findings may further reflect that the mastered motor performance (all drivers have been driving taxis for more than one year) can achieve the balance of information processing without engaging the strong top-down control function from a higher level of a hierarchy.
Lastly, the methodology we proposed in this paper, namely the algorithm framework that combines functional connectivity analysis and effective connectivity analysis, deserves more emphasis. In the functional brain network analysis using resting-state fMRI, the lack of task design and task activations make the selection of ROIs a difficult issue, especially for the effective connectivity analysis using DCM; on one hand, the over-parameterized generative model limits its application in large-scale analysis, for example, the maximum number of nodes is often limited to 8 in stochastic DCM analysis [48], and even less for the more complicated multimodal DCM for EEG and fMRI [49]; on the other hand, too few nodes often arouse the problem of a missing region, leading the incomplete data involved in the analysis to affect the characterization of global functional integration structure [50]. Therefore, considering that functional connectivity is a necessary but insufficient condition for effective connectivity [20,21], we first conducted functional connectivity analysis on a whole-brain scale (to avoid missing region problem) to confirm regions of interest, and found four brain regions, including the pre-SMA, the lOFC, the lSFG and the lMTG, that exhibited significant driving-related functional integration. These four regions were then engaged in the subsequent spectral DCM analysis to further evaluate the causal relationship among hidden neural states that best explained the undirected correlations among hemodynamic responses. Figure 6 shows the quality of DCM model inversion when fitting the Full model (see Figure 3) to each subject (given by spm_dcm_fmri_check.m in SPM12 toolbox). It can be seen that the percent variance explained (a measure of difference between predicted and observed responses) of each of the 40 subjects is above 90% (the worst result is obtained from the 28th subject, with a value of 93.17%), which indicates that we have found a very good model to precisely fit the BOLD signals (on the contrary, if the percent variance explained is less than 10%, it means that the adopted model cannot explain the observed data well; therefore, a substitute model should be considered). This result also indicates that the framework of combining functional connectivity with effective connectivity analysis is an effective method to accurately determine the nodes for DCM analysis of the resting-state fMRI data.
Several limitations and future directions should be mentioned. First, due to the absence of neuropsychological tests for both drivers and controls, the precise correspondence between the significant effective connectivity and the specific cognitive functions cannot be obtained. Second, a relatively small number of subjects were included in this study, and it would be important to evaluate our findings with a larger sample size. Future works should use a pilot dataset to further validate the methodology and main findings of this paper, and some alternative data denoising procedures should also be applied [51].

5. Conclusions

In conclusion, this paper investigated how driving experience might impact the intrinsic functional organization of the human brain using a newly proposed framework that combines functional connectivity with effective connectivity analysis. The main findings and contributions of this paper can be summarized as follows. First, by dividing the SMA into two sub-regions, we found three brain regions (the lSFG, the lOFC and the lMTG) showed stronger functional connectivity with the pre-SMA in the drivers in comparison to the controls, and these driving-related changes were restricted to the pre-SMA and did not extend to the SMA proper. Second, the results of effective connectivity analysis using spectral DCM and PEB further revealed that there existed a hierarchical architecture with pre-SMA located at a higher level. Third, the directed connection from the pre-SMA to the lSFG was significantly enhanced in the drivers (using BMR and BMA analysis) and in the exhibited classification ability to distinguish drivers from controls (sensitivity = 80%). Our findings suggest that acquired motor skills can be encoded in a correlated spontaneous activity pattern of specific processing regions.

Author Contributions

Conceptualization, H.W. and D.H.; formal analysis, H.W., L.W. and L.P.; funding acquisition, H.W. and D.H.; methodology, H.W. and L.W.; validation, H.W., L.W., L.P., C.L., T.M. and D.H.; visualization, H.W.; writing—original draft, H.W. and L.W.; writing—review and editing, H.W., L.W., L.P., C.L., T.M. and D.H. All authors have read and agreed to the published version of the manuscript.

Funding

This research was funded by the National Natural Science Foundation of China, grant number 62103437.

Institutional Review Board Statement

This research was approved by the Institutional Review Board of the Southwest University. All participants signed written informed consent forms before participation.

Informed Consent Statement

Informed consent was obtained from all subjects involved in the study.

Data Availability Statement

The local datasets analyzed during this study are not publicly available due to individual privacy concerns; however, the data are available from the corresponding author upon reasonable request.

Conflicts of Interest

The authors declare no conflict of interest.

References

  1. Calhoun, V.D.; Pekar, J.J.; McGinty, V.B.; Adali, T.; Watson, T.D.; Pearlson, G.D. Different activation dynamics in multiple neural systems during simulated driving. Hum. Brain Mapp. 2002, 16, 158–167. [Google Scholar] [CrossRef] [PubMed]
  2. Callan, A.M.; Osu, R.; Yamagishi, Y.; Callan, D.E.; Inoue, N. Neural correlates of resolving uncertainty in driver’s decision making. Hum. Brain Mapp. 2009, 30, 2804–2812. [Google Scholar] [CrossRef] [PubMed]
  3. Horikawa, E.; Okamura, N.; Tashiro, M.; Sakurada, Y.; Maruyama, M.; Arai, H.; Yamaguchi, K.; Sasaki, H.; Yanai, K.; Itoh, M. The neural correlates of driving performance identified using positron emission tomography. Brain Cogn. 2005, 58, 166–171. [Google Scholar] [CrossRef]
  4. Spiers, H.J.; Maguire, E.A. Neural substrates of driving behaviour. NeuroImage 2007, 36, 245–255. [Google Scholar] [CrossRef]
  5. Uchiyama, Y.; Ebe, K.; Kozato, A.; Okada, T.; Sadato, N. The neural substrates of driving at a safe distance: A functional MRI study. Neurosci. Lett. 2003, 352, 199–202. [Google Scholar] [CrossRef]
  6. Walter, H.; Vetter, S.C.; Grothe, J.; Wunderlich, A.P.; Hahn, S.; Spitzer, M. The neural correlates of driving. Neuroreport 2001, 12, 1763–1767. [Google Scholar] [CrossRef] [PubMed]
  7. Damoiseaux, J.S.; Beckmann, C.F.; Arigita, E.J.; Barkhof, F.; Scheltens, P.; Stam, C.J.; Smith, S.M.; Rombouts, S.A. Reduced resting-state brain activity in the “default network” in normal aging. Cereb. Cortex 2008, 18, 1856–1864. [Google Scholar] [CrossRef]
  8. Hampson, M.; Driesen, N.R.; Skudlarski, P.; Gore, J.C.; Constable, R.T. Brain connectivity related to working memory performance. J. Neurosci. Off. J. Soc. Neurosci. 2006, 26, 13338–13343. [Google Scholar] [CrossRef]
  9. Seeley, W.W.; Menon, V.; Schatzberg, A.F.; Keller, J.; Glover, G.H.; Kenna, H.; Reiss, A.L.; Greicius, M.D. Dissociable intrinsic connectivity networks for salience processing and executive control. J. Neurosci. Off. J. Soc. Neurosci. 2007, 27, 2349–2356. [Google Scholar] [CrossRef]
  10. Albert, N.B.; Robertson, E.M.; Miall, R.C. The resting human brain and motor learning. Curr. Biol. CB 2009, 19, 1023–1027. [Google Scholar] [CrossRef]
  11. Duan, X.; He, S.; Liao, W.; Liang, D.; Qiu, L.; Wei, L.; Li, Y.; Liu, C.; Gong, Q.; Chen, H. Reduced caudate volume and enhanced striatal-DMN integration in chess experts. NeuroImage 2012, 60, 1280–1286. [Google Scholar] [CrossRef]
  12. Lewis, C.M.; Baldassarre, A.; Committeri, G.; Romani, G.L.; Corbetta, M. Learning sculpts the spontaneous activity of the resting human brain. Proc. Natl. Acad. Sci. USA 2009, 106, 17558–17563. [Google Scholar] [CrossRef] [PubMed]
  13. Taubert, M.; Lohmann, G.; Margulies, D.S.; Villringer, A.; Ragert, P. Long-term effects of motor training on resting-state networks and underlying brain structure. NeuroImage 2011, 57, 1492–1498. [Google Scholar] [CrossRef] [PubMed]
  14. Michon, J.A. A critical view of driver behavior models: What do. In Human Behavior and Traffic Safety; Springer: Berlin/Heidelberg, Germany, 1985; pp. 485–524. [Google Scholar]
  15. Biswal, B.; Yetkin, F.Z.; Haughton, V.M.; Hyde, J.S. Functional connectivity in the motor cortex of resting human brain using echo-planar MRI. Magn. Reson. Med. 1995, 34, 537–541. [Google Scholar] [CrossRef] [PubMed]
  16. Damoiseaux, J.S.; Rombouts, S.A.; Barkhof, F.; Scheltens, P.; Stam, C.J.; Smith, S.M.; Beckmann, C.F. Consistent resting-state networks across healthy subjects. Proc. Natl. Acad. Sci. USA 2006, 103, 13848–13853. [Google Scholar] [CrossRef] [PubMed]
  17. Fox, M.D.; Raichle, M.E. Spontaneous fluctuations in brain activity observed with functional magnetic resonance imaging. Nat. Rev. Neurosci. 2007, 8, 700–711. [Google Scholar] [CrossRef]
  18. Greicius, M.D.; Krasnow, B.; Reiss, A.L.; Menon, V. Functional connectivity in the resting brain: A network analysis of the default mode hypothesis. Proc. Natl. Acad. Sci. USA 2003, 100, 253–258. [Google Scholar] [CrossRef]
  19. Friston, K.J.; Harrison, L.; Penny, W. Dynamic causal modelling. Neuroimage 2003, 19, 1273–1302. [Google Scholar] [CrossRef]
  20. Razi, A.; Seghier, M.L.; Zhou, Y.; McColgan, P.; Zeidman, P.; Park, H.J.; Sporns, O.; Rees, G.; Friston, K.J. Large-scale DCMs for resting-state fMRI. Netw. Neurosci. 2017, 1, 222–241. [Google Scholar] [CrossRef]
  21. Seghier, M.L.; Friston, K.J. Network discovery with large DCMs. NeuroImage 2013, 68, 181–191. [Google Scholar] [CrossRef]
  22. Cohen, A.L.; Fair, D.A.; Dosenbach, N.U.; Miezin, F.M.; Dierker, D.; Van Essen, D.C.; Schlaggar, B.L.; Petersen, S.E. Defining functional areas in individual human brains using resting functional connectivity MRI. NeuroImage 2008, 41, 45–57. [Google Scholar] [CrossRef] [PubMed]
  23. Craddock, R.C.; James, G.A.; Holtzheimer, P.E., 3rd; Hu, X.P.; Mayberg, H.S. A whole brain fMRI atlas generated via spatially constrained spectral clustering. Hum. Brain Mapp. 2012, 33, 1914–1928. [Google Scholar] [CrossRef] [PubMed]
  24. Nelson, S.M.; Cohen, A.L.; Power, J.D.; Wig, G.S.; Miezin, F.M.; Wheeler, M.E.; Velanova, K.; Donaldson, D.I.; Phillips, J.S.; Schlaggar, B.L.; et al. A parcellation scheme for human left lateral parietal cortex. Neuron 2010, 67, 156–170. [Google Scholar] [CrossRef]
  25. Shirer, W.R.; Ryali, S.; Rykhlevskaia, E.; Menon, V.; Greicius, M.D. Decoding subject-driven cognitive states with whole-brain connectivity patterns. Cereb. Cortex 2012, 22, 158–165. [Google Scholar] [CrossRef]
  26. Friston, K.J.; Kahan, J.; Biswal, B.; Razi, A. A DCM for resting state fMRI. NeuroImage 2014, 94, 396–407. [Google Scholar] [CrossRef] [PubMed]
  27. Razi, A.; Kahan, J.; Rees, G.; Friston, K.J. Construct validation of a DCM for resting state fMRI. NeuroImage 2015, 106, 1–14. [Google Scholar] [CrossRef]
  28. Friston, K.J.; Litvak, V.; Oswal, A.; Razi, A.; Stephan, K.E.; van Wijk, B.C.M.; Ziegler, G.; Zeidman, P. Bayesian model reduction and empirical Bayes for group (DCM) studies. NeuroImage 2016, 128, 413–431. [Google Scholar] [CrossRef]
  29. Zeidman, P.; Jafarian, A.; Corbin, N.; Seghier, M.L.; Razi, A.; Price, C.J.; Friston, K.J. A guide to group effective connectivity analysis, part 1: First level analysis with DCM for fMRI. NeuroImage 2019, 200, 174–190. [Google Scholar] [CrossRef]
  30. Zeidman, P.; Jafarian, A.; Seghier, M.L.; Litvak, V.; Cagnan, H.; Price, C.J.; Friston, K.J. A guide to group effective connectivity analysis, part 2: Second level analysis with PEB. NeuroImage 2019, 200, 12–25. [Google Scholar] [CrossRef]
  31. Johansen-Berg, H.; Behrens, T.E.; Robson, M.D.; Drobnjak, I.; Rushworth, M.F.; Brady, J.M.; Smith, S.M.; Higham, D.J.; Matthews, P.M. Changes in connectivity profiles define functionally distinct regions in human medial frontal cortex. Proc. Natl. Acad. Sci. USA 2004, 101, 13335–13340. [Google Scholar] [CrossRef]
  32. Matsuzaka, Y.; Aizawa, H.; Tanji, J. A motor area rostral to the supplementary motor area (presupplementary motor area) in the monkey: Neuronal activity during a learned motor task. J. Neurophysiol. 1992, 68, 653–662. [Google Scholar] [CrossRef] [PubMed]
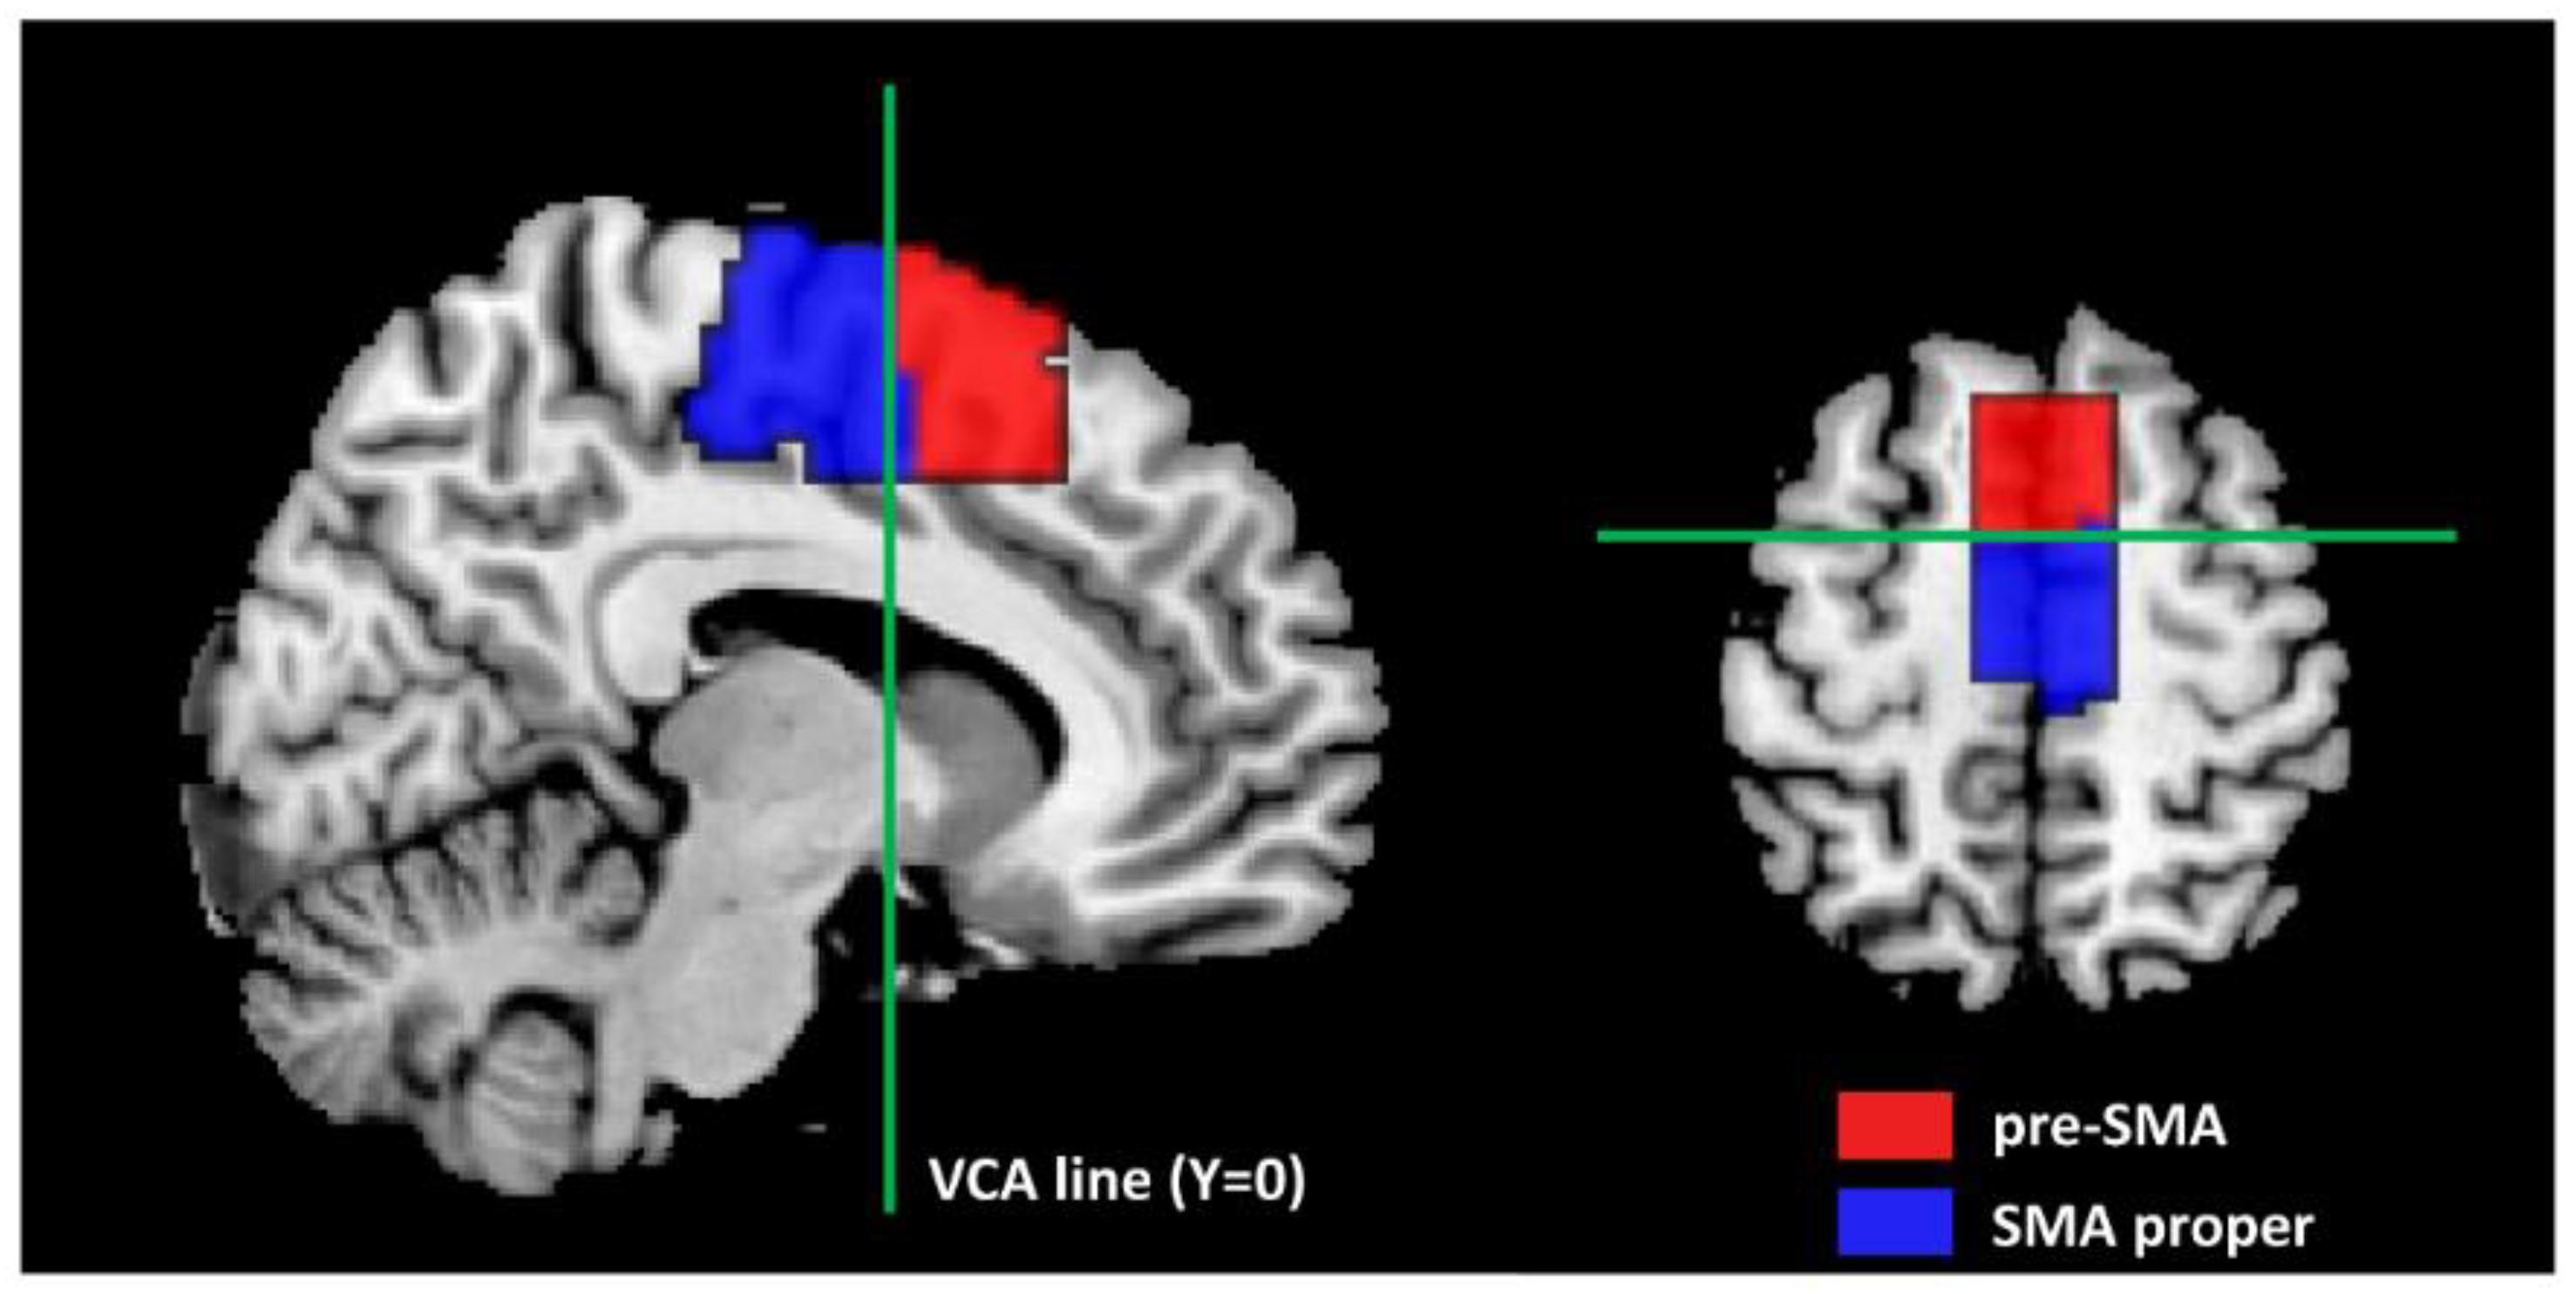
  33. Kim, J.H.; Lee, J.M.; Jo, H.J.; Kim, S.H.; Lee, J.H.; Kim, S.T.; Seo, S.W.; Cox, R.W.; Na, D.L.; Kim, S.I.; et al. Defining functional SMA and pre-SMA subregions in human MFC using resting state fMRI: Functional connectivity-based parcellation method. NeuroImage 2010, 49, 2375–2386. [Google Scholar] [CrossRef] [PubMed]
  34. Nachev, P.; Kennard, C.; Husain, M. Functional role of the supplementary and pre-supplementary motor areas. Nat. Rev. Neurosci. 2008, 9, 856–869. [Google Scholar] [CrossRef] [PubMed]
  35. Wang, J.; Wang, X.; Xia, M.; Liao, X.; Evans, A.; He, Y. GRETNA: A graph theoretical network analysis toolbox for imaging connectomics. Front. Hum. Neurosci. 2015, 9, 386. [Google Scholar]
  36. Wang, L.; Qiang, L.; Hong, L.; Hu, D. Functional Connectivity-Based Parcellation of Human Medial Frontal Cortex via Maximum Margin Clustering. In Proceedings of the International Conference on Intelligent Science and Intelligent Data Engineering, Nanjing, China, 15–17 October 2012. [Google Scholar]
  37. Chumbley, J.R.; Friston, K.J. False discovery rate revisited: FDR and topological inference using Gaussian random fields. NeuroImage 2009, 44, 62–70. [Google Scholar] [CrossRef]
  38. Smith, S.M.; Miller, K.L.; Salimi-Khorshidi, G.; Webster, M.; Beckmann, C.F.; Nichols, T.E.; Ramsey, J.D.; Woolrich, M.W. Network modelling methods for FMRI. NeuroImage 2011, 54, 875–891. [Google Scholar] [CrossRef]
  39. Burgess, P.W.; Dumontheil, I.; Gilbert, S.J. The gateway hypothesis of rostral prefrontal cortex (area 10) function. Trends Cogn. Sci. 2007, 11, 290–298. [Google Scholar] [CrossRef]
  40. Koechlin, E.; Hyafil, A. Anterior prefrontal function and the limits of human decision-making. Science 2007, 318, 594–598. [Google Scholar] [CrossRef]
  41. Friston, K. Learning and inference in the brain. Neural Netw. 2003, 16, 1325–1352. [Google Scholar] [CrossRef]
  42. Friston, K. A theory of cortical responses. Philos. Trans. R. Soc. Lond. 2005, 360, 815–836. [Google Scholar] [CrossRef]
  43. Stephan, K.E.; Iglesias, S.; Heinzle, J.; Diaconescu, A.O. Translational Perspectives for Computational Neuroimaging. Neuron 2015, 87, 716–732. [Google Scholar] [CrossRef] [PubMed]
  44. Rushworth, M.F.; Hadland, K.A.; Paus, T.; Sipila, P.K. Role of the human medial frontal cortex in task switching: A combined fMRI and TMS study. J. Neurophysiol. 2002, 87, 2577–2592. [Google Scholar] [CrossRef]
  45. Li, C.S.; Huang, C.; Constable, R.T.; Sinha, R. Imaging response inhibition in a stop-signal task: Neural correlates independent of signal monitoring and post-response processing. J. Neurosci. Off. J. Soc. Neurosci. 2006, 26, 186–192. [Google Scholar] [CrossRef]
  46. Hikosaka, O.; Sakai, K.; Miyauchi, S.; Takino, R.; Sasaki, Y.; Putz, B. Activation of human presupplementary motor area in learning of sequential procedures: A functional MRI study. J. Neurophysiol. 1996, 76, 617–621. [Google Scholar] [CrossRef] [PubMed]
  47. Lau, H.C.; Rogers, R.D.; Ramnani, N.; Passingham, R.E. Willed action and attention to the selection of action. NeuroImage 2004, 21, 1407–1415. [Google Scholar] [CrossRef] [PubMed]
  48. Li, B.; Daunizeau, J.; Stephan, K.E.; Penny, W.; Hu, D.; Friston, K. Generalised filtering and stochastic DCM for fMRI. NeuroImage 2011, 58, 442–457. [Google Scholar] [CrossRef] [PubMed]
  49. Wei, H.; Jafarian, A.; Zeidman, P.; Litvak, V.; Friston, K.J. Bayesian fusion and multimodal DCM for EEG and fMRI. NeuroImage 2020, 211, 116595. [Google Scholar] [CrossRef]
  50. Goncalves, M.S.; Hall, D.A. Connectivity analysis with structural equation modelling: An example of the effects of voxel selection. NeuroImage 2003, 20, 1455–1467. [Google Scholar] [CrossRef]
  51. Behzadi, Y.; Restom, K.; Liau, J.; Liu, T.T. A component based noise correction method (CompCor) for BOLD and perfusion based fMRI. NeuroImage 2007, 37, 90–101. [Google Scholar] [CrossRef]
Figure 1. Brain template of supplementary motor area (SMA) sub-regions. The area marked in red refers to the pre-SMA, and the blue area is the SMA proper. These two sub-regions can be effectively divided by vertical commissure anterior (VCA) line (Y = 0).
Applsci 13 11471 g001
Figure 2. Driving-related changes in functional connectivity. (A) Connections between the pre-SMA and the left orbital frontal cortex (lOFC), the left superior frontal gyrus (lSFG) and the left middle temporal gyrus (lMTG) were stronger in drivers than in controls. (B) Bar chart plot the mean correlation values of the above connections in the driver and control groups; error bars ± SEM (* p < 0.05, Topological FDR corrected; two-sample t-test).
Applsci 13 11471 g002
Figure 3. Results of the effective connectivity analysis using spectral Dynamic Causal Modeling (DCM) and Parametric Empirical Bayes (PEB). The “Group Mean” panel illustrates the posterior beliefs of all connections for the group commonality. The positive posterior mean indicates the corresponding effective connectivity is excitatory, whereas the negative mean indicates inhibitory connectivity. The “Group Difference” panel shows the posterior beliefs of all connections for the group difference, where the positive posterior mean reveals that the corresponding effective connectivity is enhanced more in drivers than in controls, and the negative value means the connectivity is reduced in drivers. The numbers next to the arrowhead label the corresponding connections, in accordance with the figures on the abscissa.
Applsci 13 11471 g003
Figure 4. Significance of the effective connectivity revealed using Bayesian model reduction (BMR) and Bayesian model averaging (BMA). The “Group Mean” panel illustrates the significance of the effective connectivity for the group commonality. Some connections were removed for a posterior probability of 0; the others establish a directed connectivity network of either excitatory (marked in red) or inhibitory (blue) connections among the four brain regions (the connection with a posterior probability of 100% is shown in bold). The “Group Difference” panel illustrates the effective connectivity of the significant group difference. The drivers establish a total of seven enhanced effective connections relative to the controls (marked in red). The posterior means and probabilities of all connections are shown as bar charts. The numbers next to the arrowhead label the corresponding connections, in accordance with the figures on the abscissa.
Applsci 13 11471 g004
Figure 5. The predictive validity of the pre-SMA→lSFG connection. The bar chart shows the posterior probability of each subject (subjects 1 to 20 are controls, and subjects 21 to 40 are drivers) belonging to control group (left) and driver group (right), respectively. The bars marked with blue highlight the true negative results (i.e., control subjects were correctly classified to control group), whereas the bars marked with red highlight the true positive results (i.e., driver subjects were correctly classified to driver group). The black dotted bars show the misidentified results.
Applsci 13 11471 g005
Figure 6. Diagnosis of DCM model inversion. It shows the quality of DCM model inversion (given by spm_dcm_fmri_check.m in SPM12 toolbox) when fitting the Full model of the four nodes (i.e., the pre-SMA, the lSFG, the lOFC and the lMTG) to each subject. The percent variance explained of each of the 40 subjects is above 90% (the worst result is obtained from the 28th subject, with a value of 93.17%).
Applsci 13 11471 g006
Table 1. The demographic parameters of the subjects.
VariableDriversControlsp Value
Number of subjects2020
Age (years)39.5 ± 5.841.1 ± 5.00.34 a
Sex (male/female)20/018/20.15 b
Education (years)9.5 ± 1.89.0 ± 1.40.37 a
Duration of taxi driving (years)4.9 ± 3.5
Duration of total driving (years)11.7 ± 4.9
a Two-sample t-test. b Pearson’s Chi-squared test.
Table 2. Brain regions exhibit significant functional connectivity differences with sub-regions of the supplementary motor area between the driver and control groups.
Anatomical AreaSizeMNI CoordinatesT Valuep Value
(FDR Corrected)
Brodmann’s Area
xyz
Pre-SMA
Driver > control
Left orbital frontal cortex113−2157−95.620.00310, 11
Left superior frontal gyrus63−1860214.520.0119, 10
Left middle temporal gyrus51−60−21−94.430.01121
Driver < control
Right middle frontal gyrus27396394.470.1896, 9
Right inferior parietal lobule3351−30364.150.1382, 40
SMA proper
No significance
Whole SMA
Driver > control
Left superior frontal gyrus29−2157214.120.49710
Table 3. Predictive validity of the significant effective connectivity.
Effective ConnectivitySensitivity
(%)
Specificity
(%)
Accuracy
(%)
CorrelationSignificance
(p Value)
Pre-SMA→pre-SMA8060700.33520.0172
Pre-SMA→lOFC6555600.09770.2744
Pre-SMA→lSFG806572.50.40570.0047
lOFC→lSFG705562.50.05560.3666
lSFG→lSFG605557.5−0.21160.9050
lMTG→lOFC555052.50.16090.1606
lMTG→lMTG804562.5−0.02220.5542
Disclaimer/Publisher’s Note: The statements, opinions and data contained in all publications are solely those of the individual author(s) and contributor(s) and not of MDPI and/or the editor(s). MDPI and/or the editor(s) disclaim responsibility for any injury to people or property resulting from any ideas, methods, instructions or products referred to in the content.

