Article

Ultimate Compressive Strength of H-Section Stub Columns Subject to Random Pitting Corrosion Damage

Department of Civil Engineering, Jiangsu University of Science and Technology, Zhenjiang 212100, China
*
Author to whom correspondence should be addressed.
Appl. Sci. 2023, 13(19), 11051; https://doi.org/10.3390/app131911051
Submission received: 6 September 2023 / Revised: 27 September 2023 / Accepted: 4 October 2023 / Published: 7 October 2023
(This article belongs to the Special Issue Steel Structures Design and Evaluation in Building Engineering)

Abstract

:
H-section columns with random pitting corrosion exhibit localized damage, making it imperative to conduct a thorough assessment in order to guarantee their long-term structural safety and integrity. This paper presents a method for constructing finite element models of randomly pitted H-section stub columns. The accuracy of the models was first validated against existing experiments. Various scenarios, accounting for different levels of pitting intensities and locations of corrosion occurrence, were considered, to elucidate the mechanisms of the reduction in ultimate strength and stiffness, as well as the failure of columns. Additionally, the influence of the width-to-thickness ratio of the plate on the ultimate strength of stub columns was also taken into account. A method to address the thickness loss resulting from random pitting corrosion was proposed for the ultimate strength assessment of randomly pitted stub columns, and its accuracy was verified based on the Chinese and European Standards. An empirical formula was proposed and verified upon the results of numerous stochastic simulations of randomly pitted H-section columns. The results demonstrated that for axially loaded H-section stub columns, both ultimate strength and stiffness decrease significantly and nonlinearly with the increase in the degree of pitting damage. Corrosion can change the failure mode of a stub column by inducing local buckling in a plate that initially satisfies the buckling criterion before the overall column failure.

1. Introduction

H-section columns are widely used in various industries and applications due to their high load-bearing capacity and stability [1]. However, when exposed to corrosive environments, such as marine or industrial environments, steel material can deteriorate over time. The random corrosion of H-section columns poses significant risks to the structural stability and safety since it can reduce load-bearing capacity and compromise structural integrity [2]. It is, therefore, important to understand the behavior of the columns under different corrosion conditions, and develop accurate models to predict their load-carrying capacity for maintaining safety and sustainability and preventing catastrophic failures.
In harsh servicing environments, especially the marine environment, steel structures often suffer from failure of the coating and cathodic protection, resulting in different types and levels of corrosion damage [3]. Ultimate strength is the primary consideration for determining their actual safety margin [4,5]. In this context, two typical columns with tubular and H-sections have been widely considered. The compressive strength of circular steel tubes with general (uniform) corrosion damage aroused more attention, and numerous experimental and numerical studies were conducted to explore the effects of location and degree of corrosion damage on strength reduction [6,7]. It was reported that the failure mode of corroded steel pipes was not affected by general corrosion, which leads to uniform thickness loss over the entire member, but by localized uniform corrosion, which causes local thickness loss in part of surface of the member. In particular, its location has a significant impact on residual bearing capacity, with an unfavorable effect in the middle of the tube more than in the end. In the case of the combination of internal pressure and bending, corrosion damage, in spite of causing a localized uniform thickness loss, had a significant impact on the ultimate bearing capacity of thin-walled steel pipes [8]. This was due to the fact that the bending capacity of corroded pipes drastically decreased with the increase in corrosion depth. On the other hand, corrosion along the circumferential direction of the pipe had a more adverse effect on the bending behavior of corroded pipes compared to that along the longitudinal direction. Compared to general corrosion, random pitting corrosion, which is widely spread or locally distributed on the member, can lead to a more serious reduction in ultimate strength under the same degree of corrosion damage [9,10]. Particularly, the random nature of pitting corrosion in the size, shape and distribution of corrosion pits results in a significant variation in ultimate strength.
The ultimate strength of H-section steel stub columns with artificial corrosion, mechanically introduced with localized uniform corrosion, was experimentally studied under uniaxial compression [11]. It was shown that the localized reduction in flanges in an asymmetric pattern had an insignificant impact on the axial strength of columns, and the degradation of flange thickness more significantly reduced the axial strength of tested columns than the web degradation. More compression tests were performed on H-shaped steel columns with corrosion damage, induced as general corrosion by accelerated corrosion tests, to study the failure mode, local buckling load and ultimate load [12]. The failure mode of columns may be affected by the corrosion, with gradually decreased half-wavelength with the increase in corrosion intensity, transforming from strength failure to instability. Meanwhile, the ultimate compressive load of the columns was only dependent on the damage degree of the weakest section with corrosion damage. However, the general corrosion had no influence on the failure mode of four-point bending H-section beams, regardless of whether it caused degradation in the bearing capacity, stiffness and ductility [13]. Unlike general corrosion, pitting corrosion consisting of random corrosion pits easily led to buckling in the compressive web area of corroded H-shaped beams, and the reduction in local bearing capacity of the web was simultaneously related to the losses of thickness and mass caused by corrosion damage [14]. It was stated that for random pitting corrosion, the reduction factor of elastic buckling strength may vary by up to more than 20% due to the change in corrosion location under the same degree of corrosion damage [15]. In addition, the increasing use of high-strength steel makes the cross-section of structural members slimmer. Corrosion damage may render a high risk of instability in this type of steel member [16,17]. Although regular rather than random corrosion pits with an identical depth were introduced by mechanical drilling in the tested high-strength-steel columns, they resulted in a large strength reduction, even up to 40.4%, with 15% volume loss due to the corroded material [18].
All current codes standards, such as DET NORSKE VERITAS (DNV) specification [19], widely recommend the equivalent thickness method for residual strength assessment, but they are based on the uniform thickness loss defined upon the whole member. Nonetheless, the ultimate compressive load of a randomly pitted member is always lower than a uniformly corroded one with the equivalent thickness. Furthermore, it is a challenge to accurately define the equivalent thickness for an actual corroded member, given the presence of highly uneven corrosion and variations in thickness across different positions of the member [20]. Importantly, the random nature of corrosion pits in real long-term corrosive environments, in terms of their size, shape and distribution, was not taken into account simultaneously. Resultantly, a simple and applicable method for predicting the ultimate strength of randomly pitted H-section columns is greatly needed.
This paper investigates the mechanisms behind the reduction in compressive strength and failure in randomly pitted H-section steel stub columns. To represent the random nature of actual corrosion pits accurately, a numerical modeling method is introduced, considering the variations in their size, shape and distribution simultaneously. The study focuses on analyzing the effects of the corrosion pattern, the pitting intensity and the width-to-thickness ratio of the plate element on the ultimate strength of the H-section steel stub columns. Additionally, the equivalent thickness method for random pitting corrosion is proposed, verified in terms of both the Chinese and European Standards.

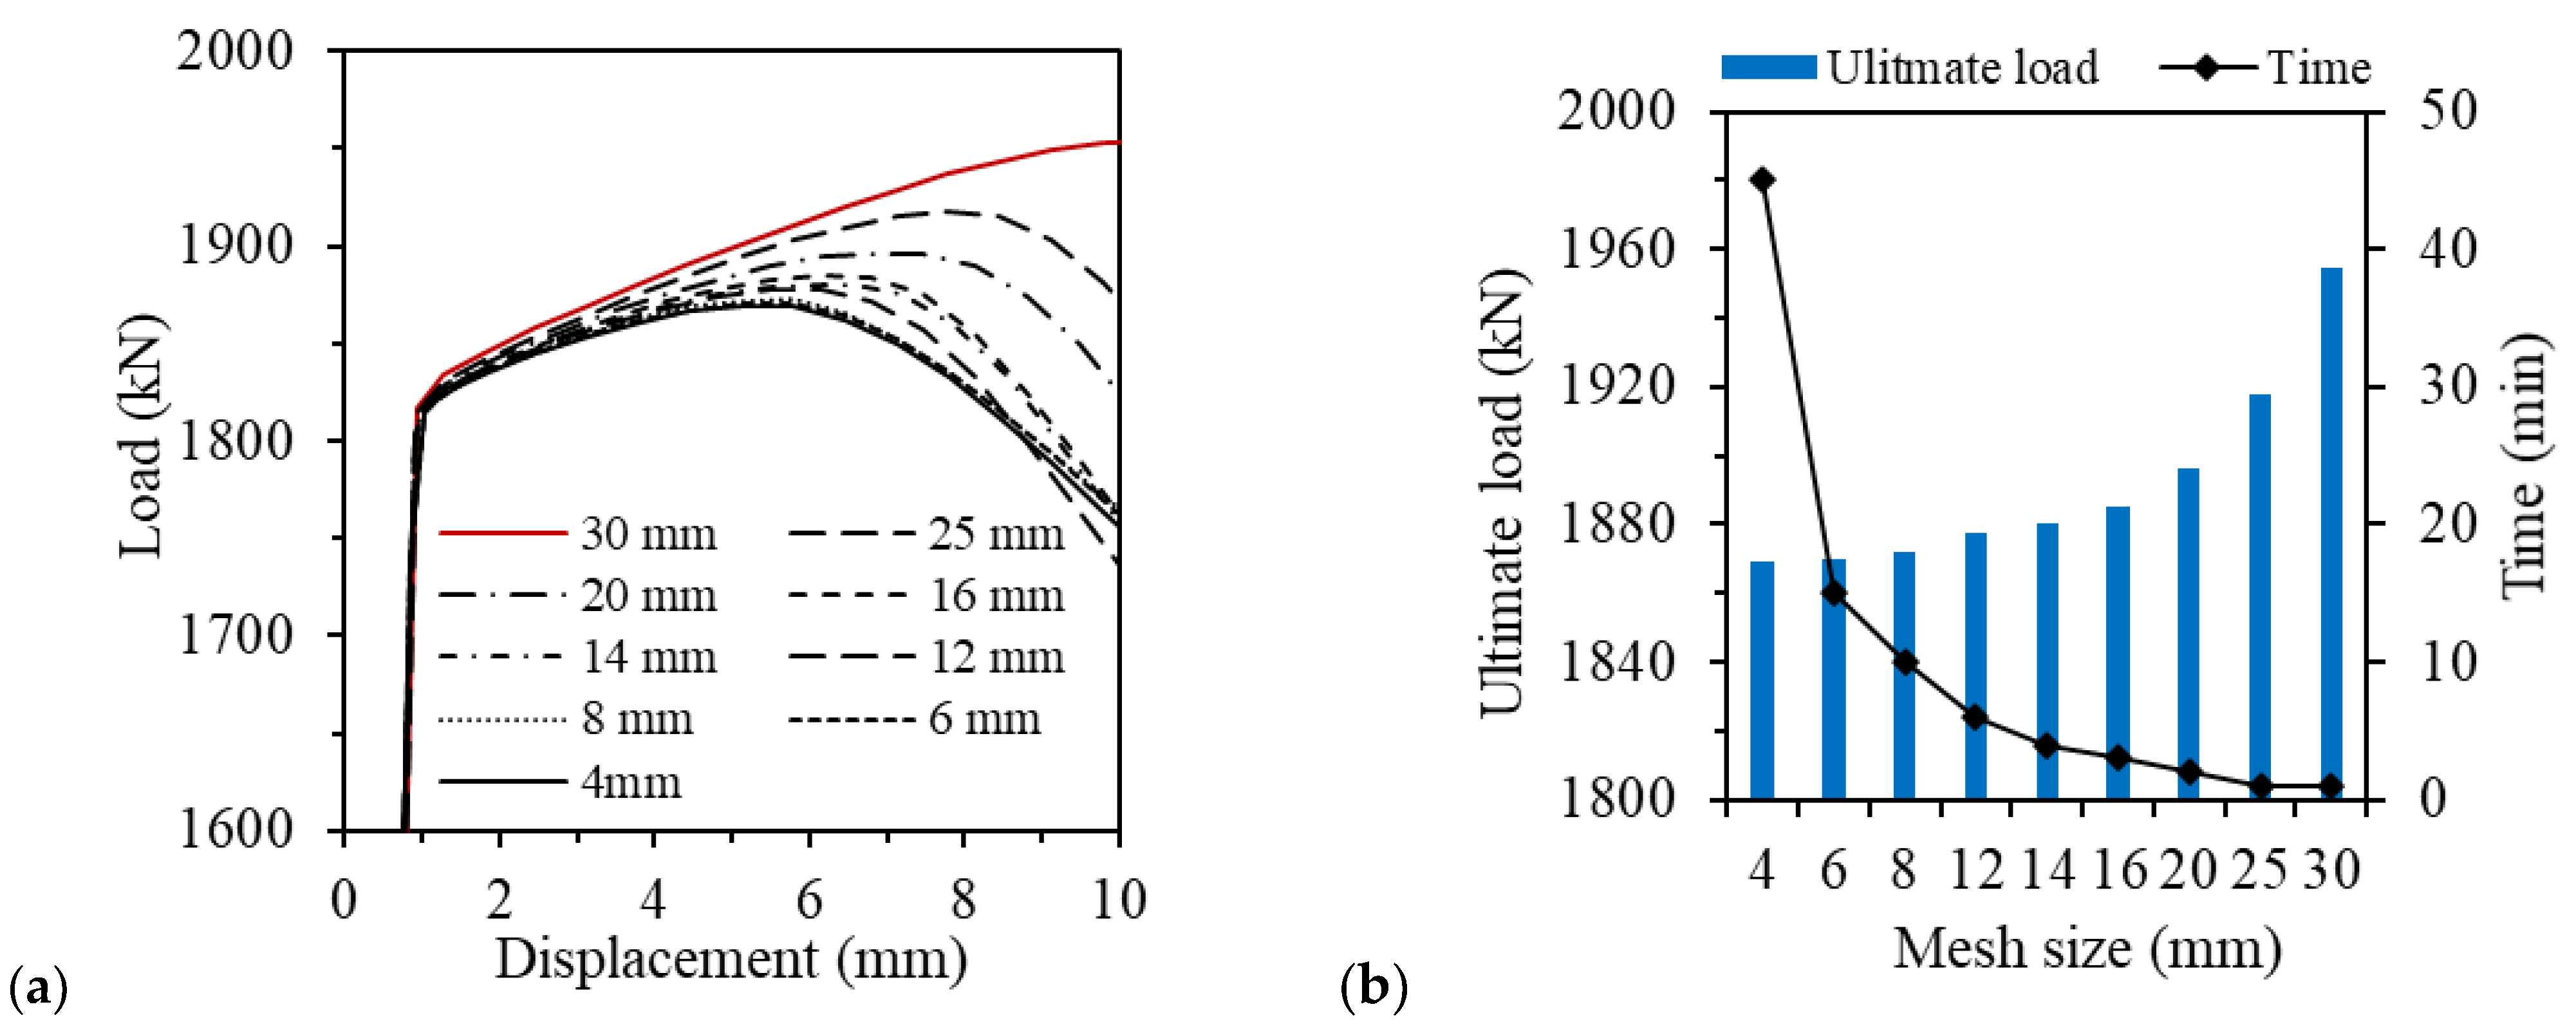
2. Numerical Modelling of H-Section Columns

Pitting corrosion is a significant concern for structures such as pipelines, ships and offshore structures. It occurs when protective coatings and cathodic protection systems are either absent or no longer effective [21]. Steel structures exposing to marine conditions for a prolonged period often exhibit signs of severe surface corrosion, as illustrated in Figure 1 [9]. A numerical modeling approach was developed to construct finite element models of H-section stub columns, taking into account the presence of random pitting corrosion. These models accounted for both individual and multiple randomly pitted plate elements. The corrosion data were acquired from corrosion inspections conducted on authentic plates from an aged ship structure servicing in an ocean environment [22]. Additionally, the validity of the numerical models was ensured through comparison with existing experimental results. This verification process allowed a series of numerical analyses to be performed, enabling an in-depth exploration of the impact of random pitting corrosion on the ultimate compressive strength of H-section columns under various corrosion scenarios.

2.1. Randomly Pitted H-Section Columns

According to the requirements of current specifications for corrosion inspection, the normal inspection can present a set of statistical data of pitting corrosion but not detailed corrosion map, usually including the mean values of the pit diameter and depth, μD and μd, their standard deviations, σD and σd, and the maximum values, Dmax and dmax. The degree of volume loss of corroded material, DOV, is a key parameter that characterizes the pitting intensity of a corroded column, defined as:
D O V = Δ V V 0 × 100   %
where ∆V represents the volume of corroded material caused by pitting corrosion, and V0 is the original volume of one intact plate of a column. Figure 2 illustrates the flowchart of numerically modelling the randomly pitted H-section columns.
A set of pit data (N) with a random diameter and depth was firstly generated via the simple random number method, which follows a certain probabilistic distribution, such as the normal, log-normal or Weibull distribution. Note that the probabilistic models for the pit size (diameter and depth) are highly dependent on the stage of corrosion evolution in a specific marine environment, and they change according to the simulated environment. For each pit generated above, its shape was also randomly decided to be circular, conical or hemi-ellipsoidal in order to reflect the random nature of pit shape in actual corrosion. One pit of random size and shape was sequentially selected, and its volume was superposed onto the cumulative volume of corrosion pits, ∆V, until the target degree of volume loss of corrosion damage, DOVt, was reached, and then n (n << N) pits with random diameter, depth and shape were determined. This was followed by the determination of the location of each of the pits. The random coordinates (x, y and z) of each pit on the H-section columns were decided using the simple random number method, each of which was constrained on the column web or flanges. It is noteworthy that the coalescence of corrosion pits was not taken into account, because such pits can be modelled as one pit [23]. The aforementioned procedures to generate random pits can be implemented using any finite element software package with a user-oriented secondary development function, such as ANSYS and ABAQUS, and the former was adopted in this paper.
The corrosion data from the real plates [22] show that the mean and maximum diameters of the pits were μD = 21.84 mm and Dmax = 30.91 mm, respectively, and the mean and maximum depths of the pits were μd = 3.04 mm and dmax = 4.89 mm, respectively. The diameter-to-depth ratios of the pits varied in the range from 4:1 to 8:1. The probabilistic models for the pit size (the diameter and depth of pits) were assumed to be normal distributions herein, and their standard deviations were decided to be 3.0 and 0.6 mm, respectively, based on the “3σ” principle indicating that the value of the pit size is within the range of μ ± 3σ by 99.7%. Five hundred random pits were generated to ensure that the target pitting intensity can be simulated in randomly pitted columns, as shown in Figure 3a,b.
The FE element, SOLID 187, in ANSYS software was used to construct the finite element model of H-section stub columns with random pitting corrosion. Figure 3c,d display the size scheme of H-section and the numerical model of a randomly pitted column. Corrosion pits were involved on one side of the plate element, since the plate element has more adverse influence on the compressive strength and behavior of pitted plates because of extra bending induced by the thickness deviation in corroded areas.
In natural corrosive environments, corrosion damage may occur on a structural component, being highly dependent on its specific service condition. The uncertainty of corrosion occurrence on the surface of a structural component is significant. Therefore, the compressive strength and behavior of H-section columns were studied, considering different corrosion patterns. They included four basic corrosion patterns, such as single-flange corrosion (SF), double-flange corrosion (symmetric, DF, and asymmetric, AF), web corrosion (W), and combined corrosion with both the flange and web corrosion, as shown in Figure 4. The term “single-flange corrosion” referred to a corrosion pattern where only one side of the flange near the web was pitted, as depicted in Figure 4a. “Double-flange corrosion” indicated corrosion on both the upper and lower flanges, which can be further classified as symmetric or asymmetric. In the symmetric pattern, both the upper and lower flanges suffered from identical pitting corrosion in the degree of volume loss (DOV) and distribution of corrosion pits. In contrast, the asymmetric pattern shows different distributions of corrosion pits while maintaining the same DOV, as illustrated in Figure 4b. Figure 4c exemplifies “web corrosion”, which occurred on one side of the web.
Based on the aforementioned corrosion patterns, combined corrosion occurred when flange and web corrosion coexisted. The combined corrosion pattern contained single-flange and web corrosion, known as “single-flange combined corrosion” (SF + W), as well as double-flange and web corrosion. In the latter case, symmetric and asymmetric combined corrosion were denoted as “DF + W” and “AF + W,” respectively. It is important to note that throughout the following study, unless explicitly stated otherwise, all numerical models strictly adhered to this nomenclature.
As an example, “H11.5 × 7.5−DF + W−13.8%” represented a randomly corroded H-section column with a flange thickness of 11.5 mm and a web thickness of 7.5 mm. The column was subject to combined corrosion on the flanges and web, with a symmetric corrosion pattern. Each plate element of the column had the same DOV of corroded material, specifically 13.8%.
The H-section stub steel columns tested in reference [24] possessed the following dimensions: a length of 450 mm, a flange width (B) of 175 mm, a section height (H) of 175 mm, a flange thickness (tf) of 11.5 mm and a web thickness (tw) of 7.5 mm. These identical H-section sizes were adopted for the numerical models in this study. To mimic axial loading, the constraint condition of the numerical models was set as fixed end, in accordance with the experimental study, but one end of the numerical models was allowed to exert axial displacement. For numerical analyses, a bilinear ideal elastic-plastic model was utilized as the constitutive model for the steel. The material properties included an elastic modulus (E) of 196 GPa, Poisson’s ratio (ν) of 0.3, yield strength (fy) of 390.09 MPa, and tensile strength (fu) of 626.05 MPa, which were all identical to the tested columns [24]. Both material and geometric nonlinearity were taken into account, while the influence of residual stress was disregarded. The initial deflection of the columns was determined based on the measured values of real H-sections [12]. The peak values of B/153 and h0/385 were applied to the flanges and web of the columns, respectively.

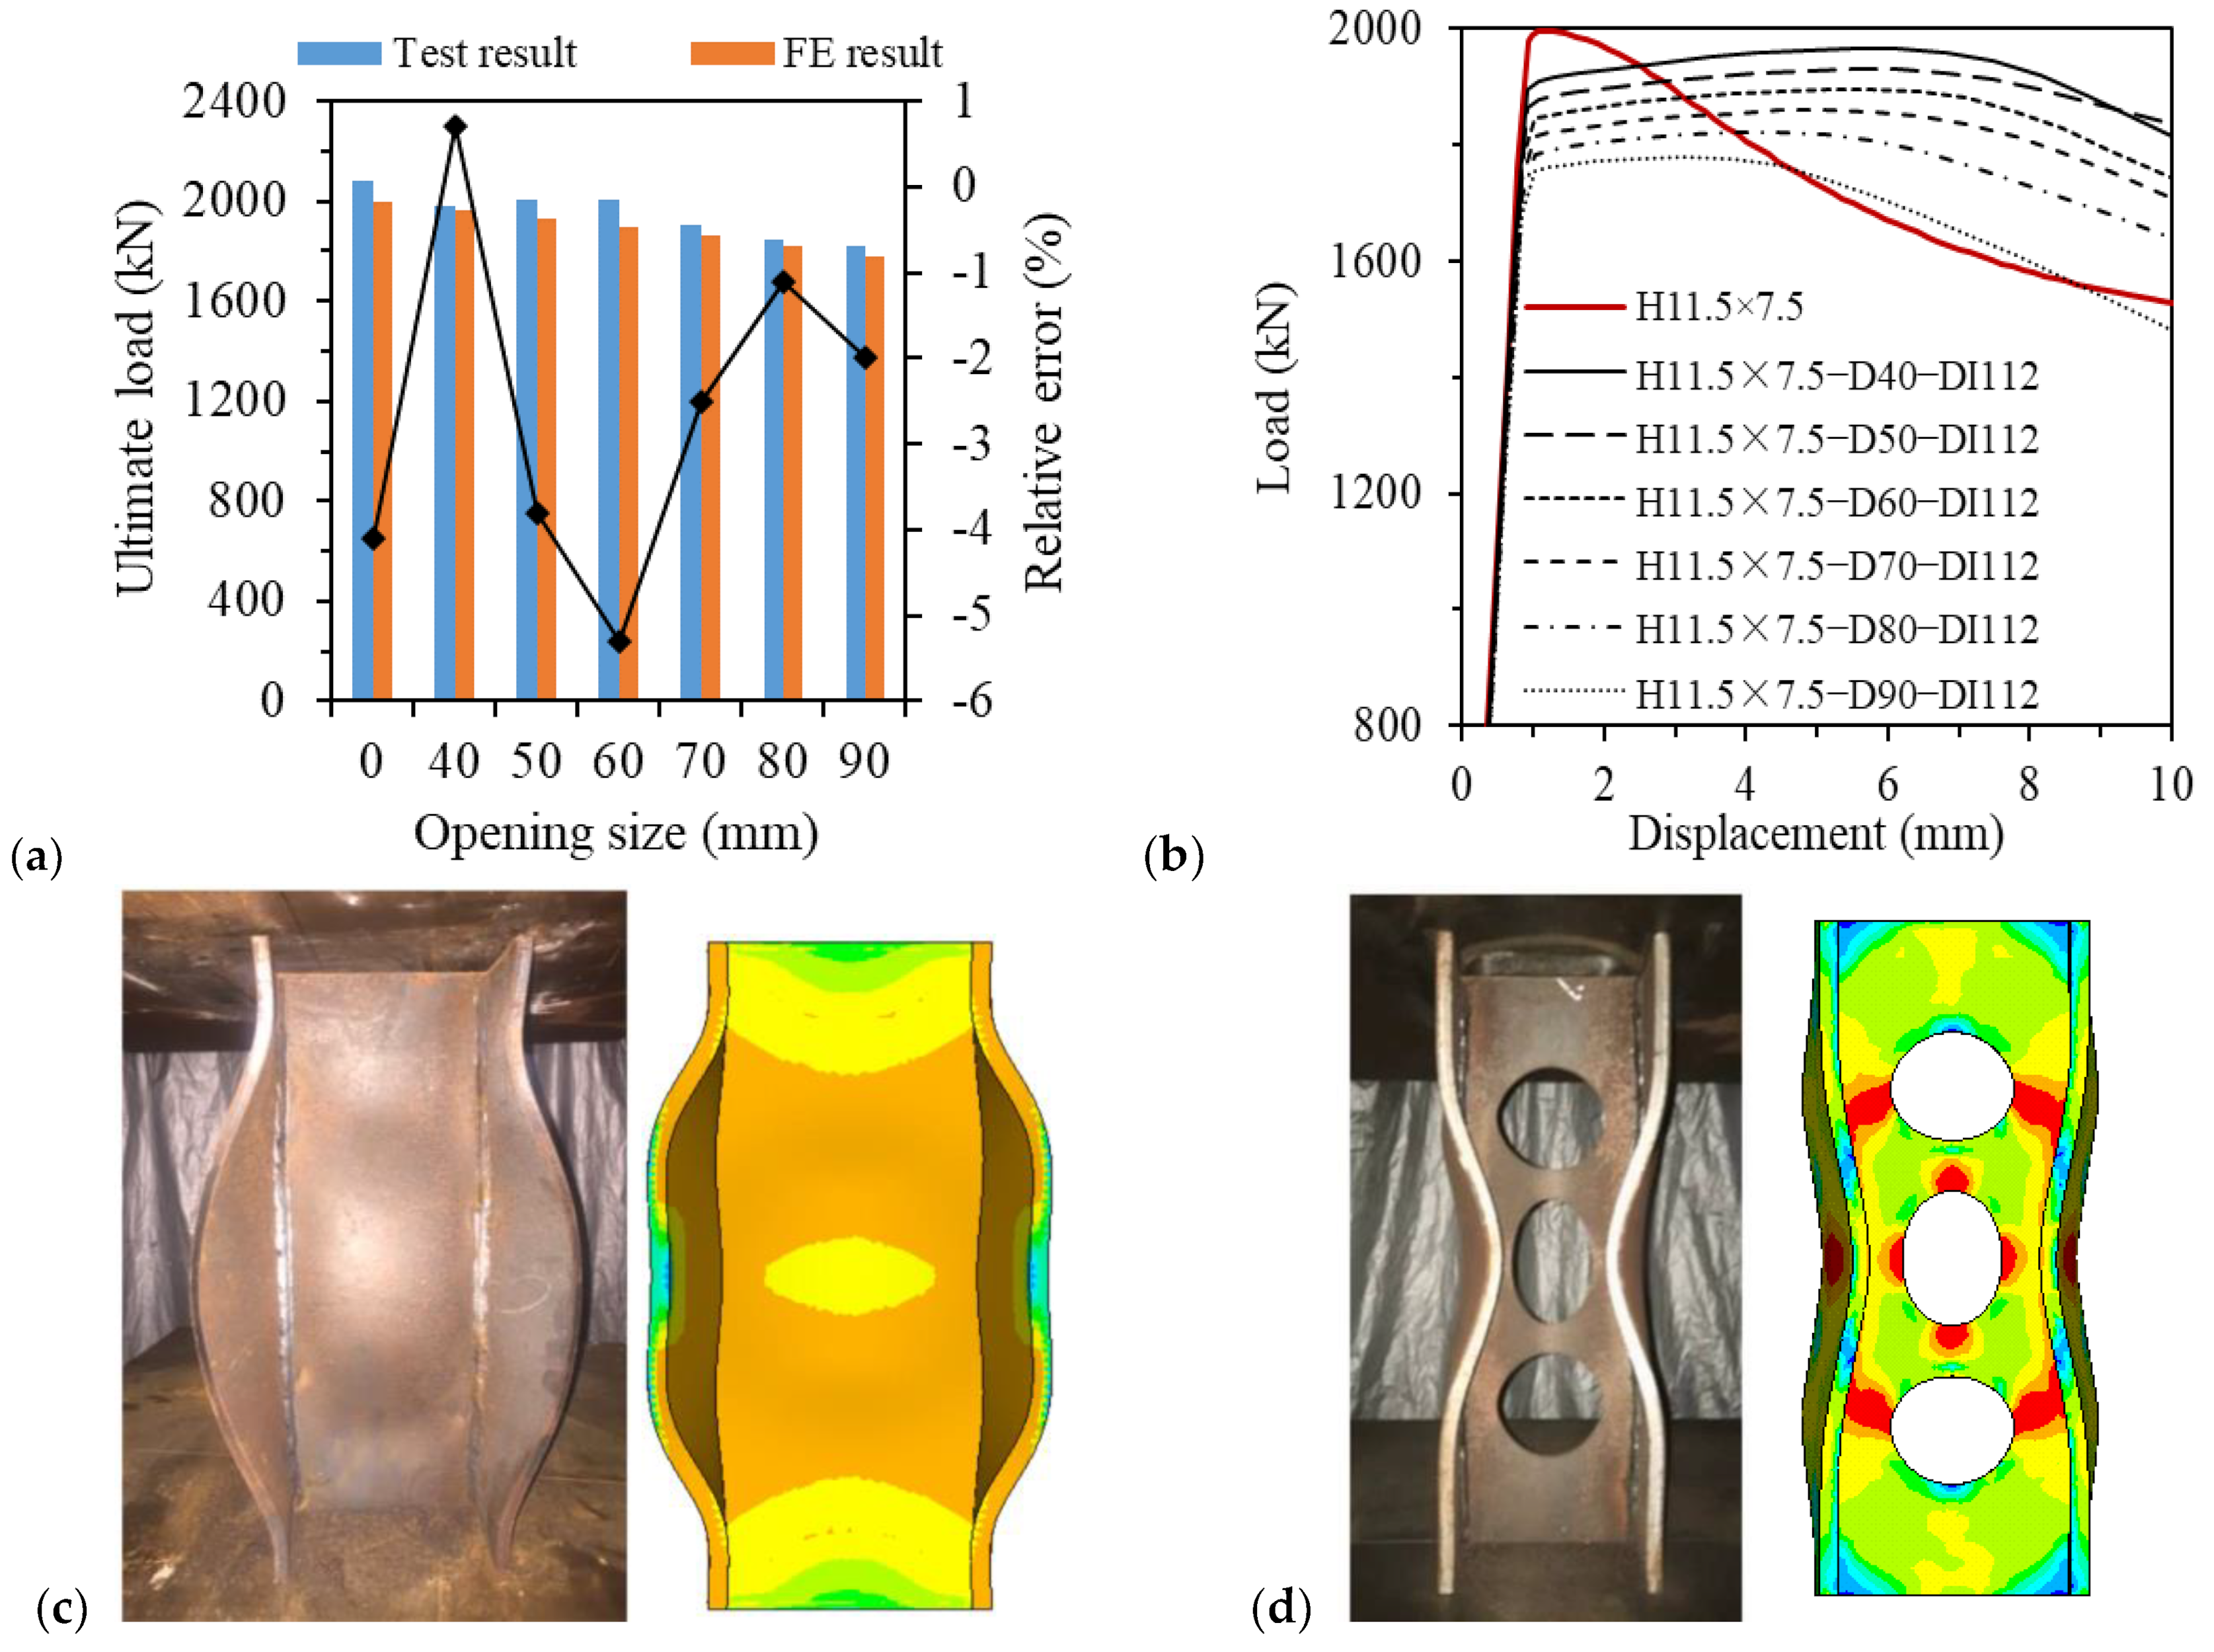
2.2. Validation of Numerical Models

In this section, the numerical models of pitted H-section stub columns were validated against the test results [24]. The experiments involved axial compression tests on perforated steel H-section stub columns, where the presence of perforations signifies severe pitting corrosion damage. The detailed material and dimensional information of the tested columns were introduced in the above section. Six of the columns were retrieved, each of which had three identical circular holes regularly and equidistantly assigned on the column web. The diameters of the openings of the six columns were 40, 50, 60, 70, 80 and 90 mm, respectively. Additionally, the distance between the center of the first opening to the column bottom (designated as DI) was 112 mm. Each column was assigned a label to indicate its size information, including the dimensions of each section and its opening. For example, H11.5 × 7.5−D70−DI112 represented an H-section column with a flange thickness (tf) of 11.5 mm, a web thickness (tw) of 7.5 mm, a circular hole diameter of 70 mm and a distance (DI) of 112 mm. For the initial study of the mesh convergence of finite element models, a tested column with a moderate-sized (70 mm) hole (H11.5 × 7.5−D70−DI112) was selected, since the test results, such as test load and failure mode, of this kind of column has been reported in detail, making it convenient for the validation. Figure 5 demonstrates the load–displacement curves and ultimate loads of the column under different mesh sizes.
It is evident that there was no significant difference observed in the load–displacement curves when the mesh size was less than 16 mm, and convergence appeared with the decrease in mesh size. Notably, for mesh sizes of 4 and 6 mm, the ultimate loads were nearly identical, but the former resulted in an approximately three-times-longer computing time than the latter. Specifically, it took approximately 45 min to compute the 4 mm meshes, while it took about 15 min for the 6 mm meshes (these calculations were performed on a personal computer equipped with a 12th Gen Intel® Core™ i5-12600K processor and 16 GB of RAM). However, a finer mesh allows for a more detailed representation of corrosion pits. As a result, a relatively fine mesh with a size of 6 mm was adopted for following numerical analyses. In Figure 6, a comparative study between the results of tests and numerical analyses of the six tested columns was illustrated, focusing on the ultimate loads, load–displacement curves, and typical failure modes.
Figure 6a,b reveal the significant impact of the opening size in H-section columns on their ultimate load and load–displacement behavior. It is observed that larger opening sizes correspond to lower ultimate loads. For example, with an opening size of 40 mm, the perforated column demonstrated an ultimate load of 1966 kN, resulting in a reduction in strength of approximately 1.5% compared to the intact column. As the opening size increased to 70 mm, the strength reduction reached approximately 6.8%, with an ultimate load of 1860 kN. Similarly, for a 90 mm opening, the strength reduction increased to around 10.8%, with an ultimate load of 1780 kN.
Moreover, Figure 6a indicates that the maximum relative error between the numerical models and experimental results for the ultimate loads of the six columns was less than 5.3%. The numerical models exhibited a slight underestimation of the test results, which is consistent with the findings of the original paper [24]. Several factors may contribute to this discrepancy, including the absence of residual stress and a significant but imprecisely measured initial geometric deflection being incorporated into the numerical models.
Furthermore, the numerical models successfully replicated the failure modes observed in the tested columns, as depicted in Figure 6c,d. The intact column exhibited local buckling in both its flanges and web, with the numerical models capturing these deformations precisely. On the other hand, the perforated column (H11.5 × 7.5−D70−DI112) demonstrated a distinctive symmetrical X-shaped deformation pattern resulting from local buckling in the flanges. Notably, the three openings in the column displayed varying deformation behaviors under compressive loads, as shown in Figure 6d. Specifically, the upper and lower openings were subjected to compression, while the middle opening experienced tension. This discrepancy can be attributed to the local buckling occurring in the flanges near the middle opening. In this scenario, the region encompassing the buckling half-wave in the flanges bore the axial compressive load, exacerbating the local buckling behavior. Conversely, the region near the middle opening in the column web was subjected to tension. Remarkably, the numerical models successfully reproduced the complex failure behavior observed in the experiments. Therefore, the proposed numerical modeling method can be extensively applied in the following numerical analyses.

3. Results and Analyses

3.1. Compressive Behavior of Randomly Pitted Columns

To elucidate the failure behavior and quantify the reduction in ultimate strength of H-section columns, a study was conducted on the ultimate strength, axial stiffness and failure mode, considering various corrosion patterns in Figure 4 and their combinations. Each corrosion pattern encompassed five levels of pitting intensities (DOV 4.8%, 6.8%, 8.8%, 11.8% and 13.8%). The dimensions, material properties, and loading and boundary conditions adhered entirely to those of the tested columns [24]. For the sake of convenience, the ultimate loads of the intact and randomly pitted H-section columns were denoted as Fu0 and Fu, respectively, and the residual compressive strength was represented by the ratio Fu/Fu0.

3.1.1. Ultimate Strength

Figure 7 depicts the relationship between the residual strength of H-section columns, subjected to axial compression, and the DOV under different corrosion patterns. Specifically, Figure 7a showcases the ultimate strength of columns affected by either flange corrosion and web corrosion, aiming to differentiate the location impact of corrosion damage. Figure 7b pertains to the ultimate strength of columns subjected to combined corrosion. In Figure 7a, it is evident that corrosion at the same level of pitting intensity caused a greater reduction in strength for columns with flange corrosion than that with web corrosion. At the lower DOV of 4.8%, the column with single-flange corrosion (H11.5 × 7.5−SF) experienced a strength reduction of 5.1%, while the column with web corrosion (H11.5 × 7.5−W) demonstrated a strength reduction of 3.9%. However, at the higher DOV of 13.8%, these strength reductions increased to 9.1% and 6.5%, respectively.
Moreover, in the case of double-flange corrosion, the variance in corrosion pit distribution between symmetric and asymmetric patterns had an insignificant impact on strength reduction. Even at the higher DOV of 13.8%, the strength reductions caused by the symmetric (H11.5 × 7.5−DF) and asymmetric (H11.5 × 7.5−AF) double-flange corrosion were merely 17.8% and 17.4%, respectively, as indicated in Figure 7a. Similarly, a marginal distinction was observed in the combined corrosion scenario at the higher DOV of 13.8%. The symmetric (H11.5 × 7.5−DF + W) and the asymmetric (H11.5 × 7.5−AF + W) corrosion patterns resulted in strength reductions of 24.2% and 23.5%, respectively, as displayed in Figure 7b.
Interestingly, the reduction in ultimate strength of H-section columns resulting from random pitting can be predicted by linearly superimposing reduction in ultimate strength caused by corrosion in each plate element. At a DOV of 4.8%, the single-flange corrosion column (H11.5 × 7.5−SF) exhibited an ultimate strength of 1895 kN, with a strength reduction of 5.1%, while the double-flange corrosion column (H11.5 × 7.5−DF) displayed an ultimate strength of 1803 kN, with a strength reduction of 9.6%, approximately twice the former, as depicted in Figure 7a. Meanwhile, the ultimate strength observed in the column with web corrosion (H11.5 × 7.5−W) demonstrated a reduction of 3.9%. However, in the case of single-flange combined corrosion (H11.5 × 7.5−SF + W), the strength reduction amounted to 8.5%, as shown in Figure 7b, approximately equivalent to the combined reductions from flange corrosion (5.1%) and web corrosion (3.9%). Similarly, the strength reduction for double-flange combined corrosion (H11.5 × 7.5−DF + W) was 12.7%, equivalent to the sum of combined reductions from double-flange corrosion (9.6%) and web corrosion (3.9%).
At the higher DOV of 13.8%, a similar trend was observed. The strength reductions due to single-flange corrosion (H11.5 × 7.5−SF) and double−flange corrosion (H11.5 × 7.5−DF) were 9.1% and 17.8%, respectively, with the latter almost twice as significant as the former, as depicted in Figure 7a. Furthermore, web corrosion (H11.5 × 7.5−W) resulted in a strength reduction of 6.5%. Concerning the combined corrosion patterns illustrated in Figure 7b, the single-flange combined corrosion (H11.5 × 7.5−SF + W) and double-flange combined corrosion (H11.5 × 7.5−DF + W) exhibited strength reductions of 15.4% and 24.2%, respectively. The reduction of 15.4% was calculated as the sum of the reductions caused by single-flange corrosion (9.1%) and web corrosion (6.5%), while the reduction of 24.2% was determined as the sum of the reductions caused by double-flange combined corrosion (17.8%) and web corrosion (6.5%).

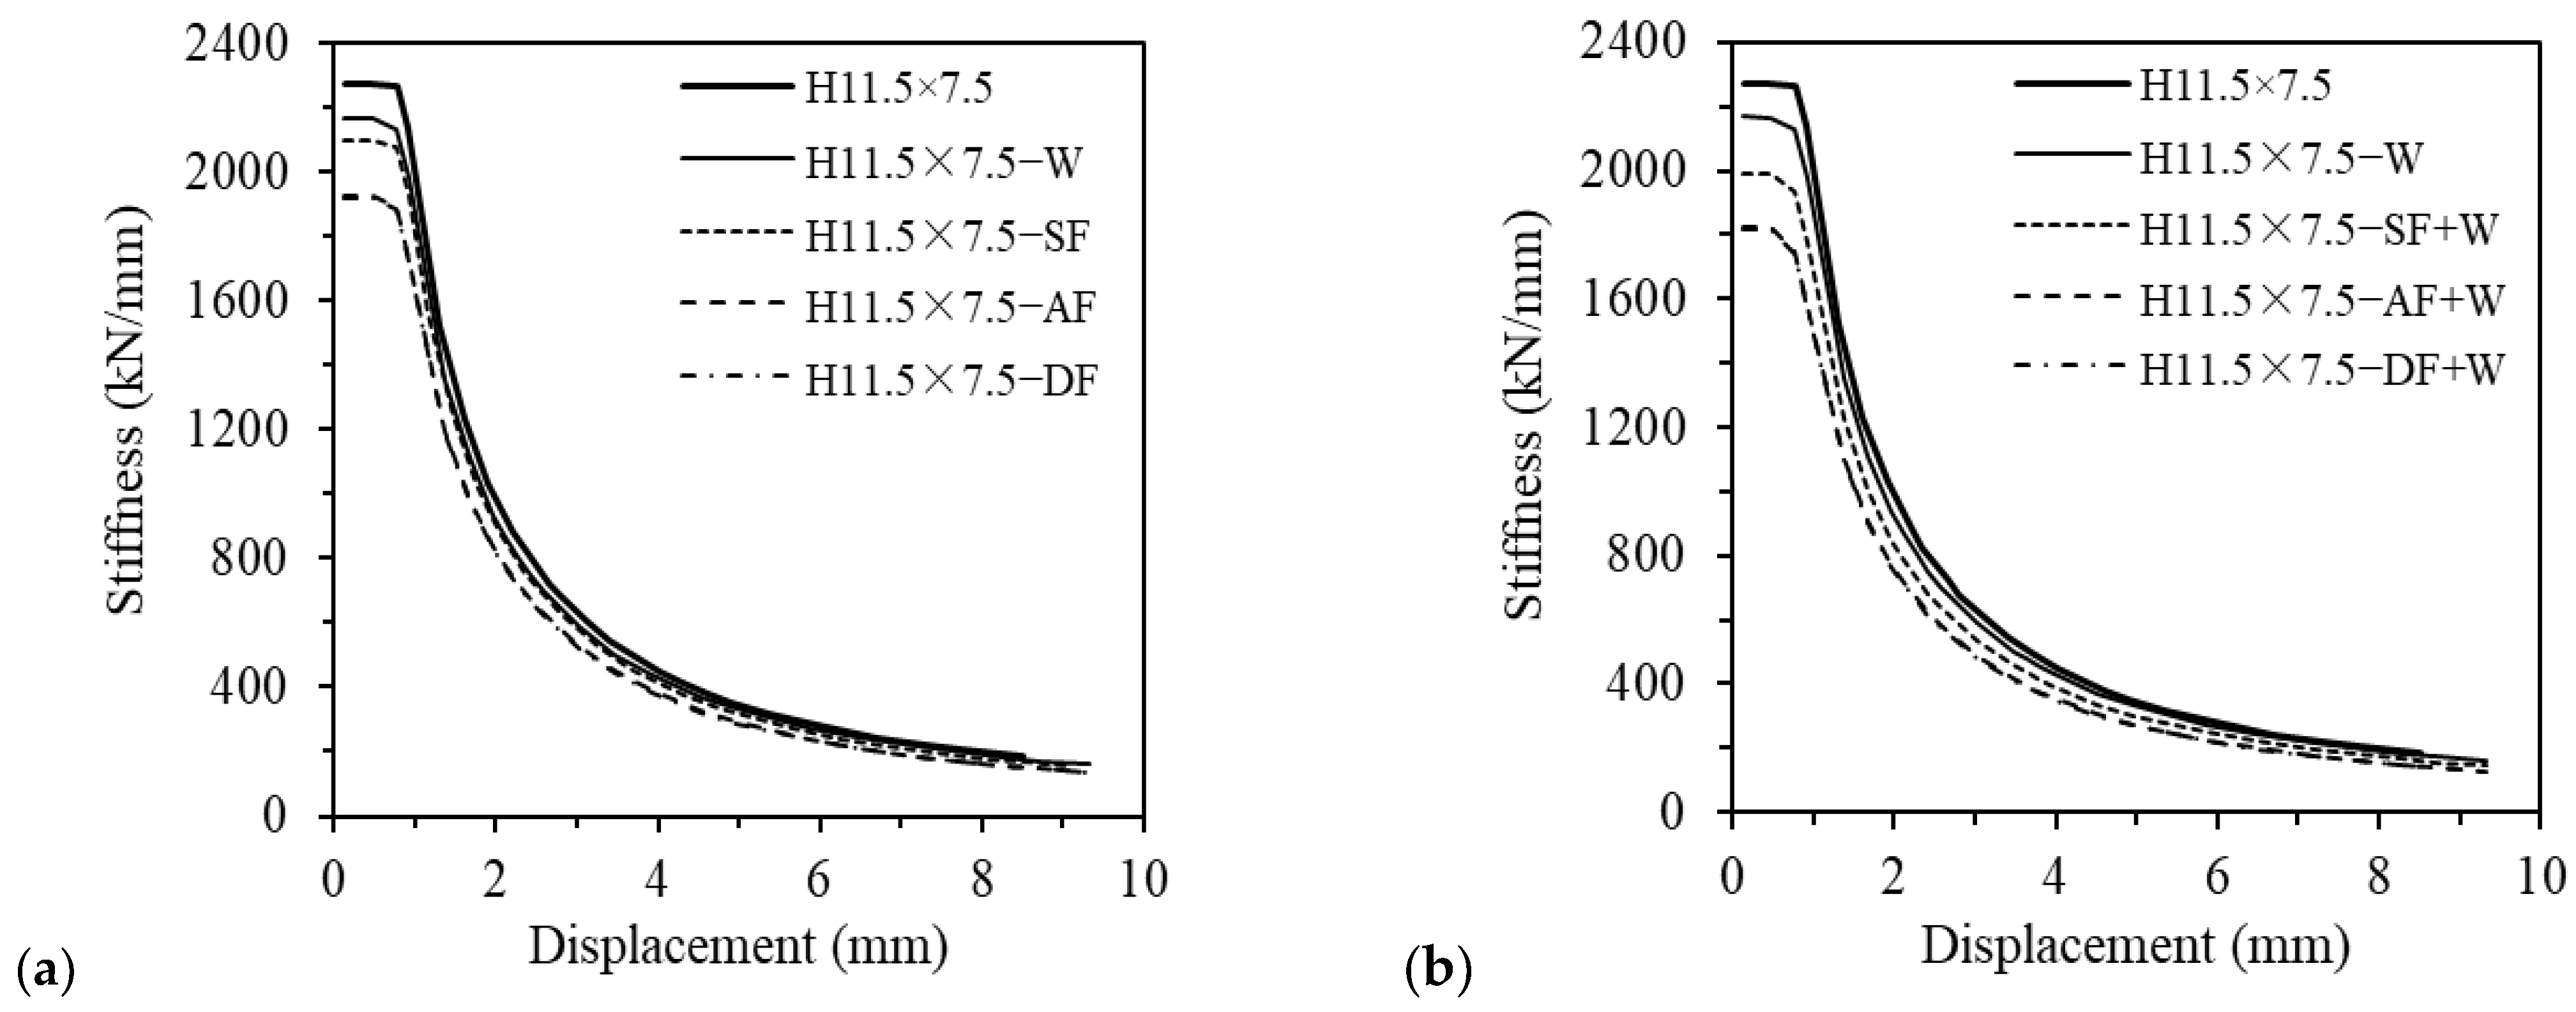
3.1.2. Axial Stiffness
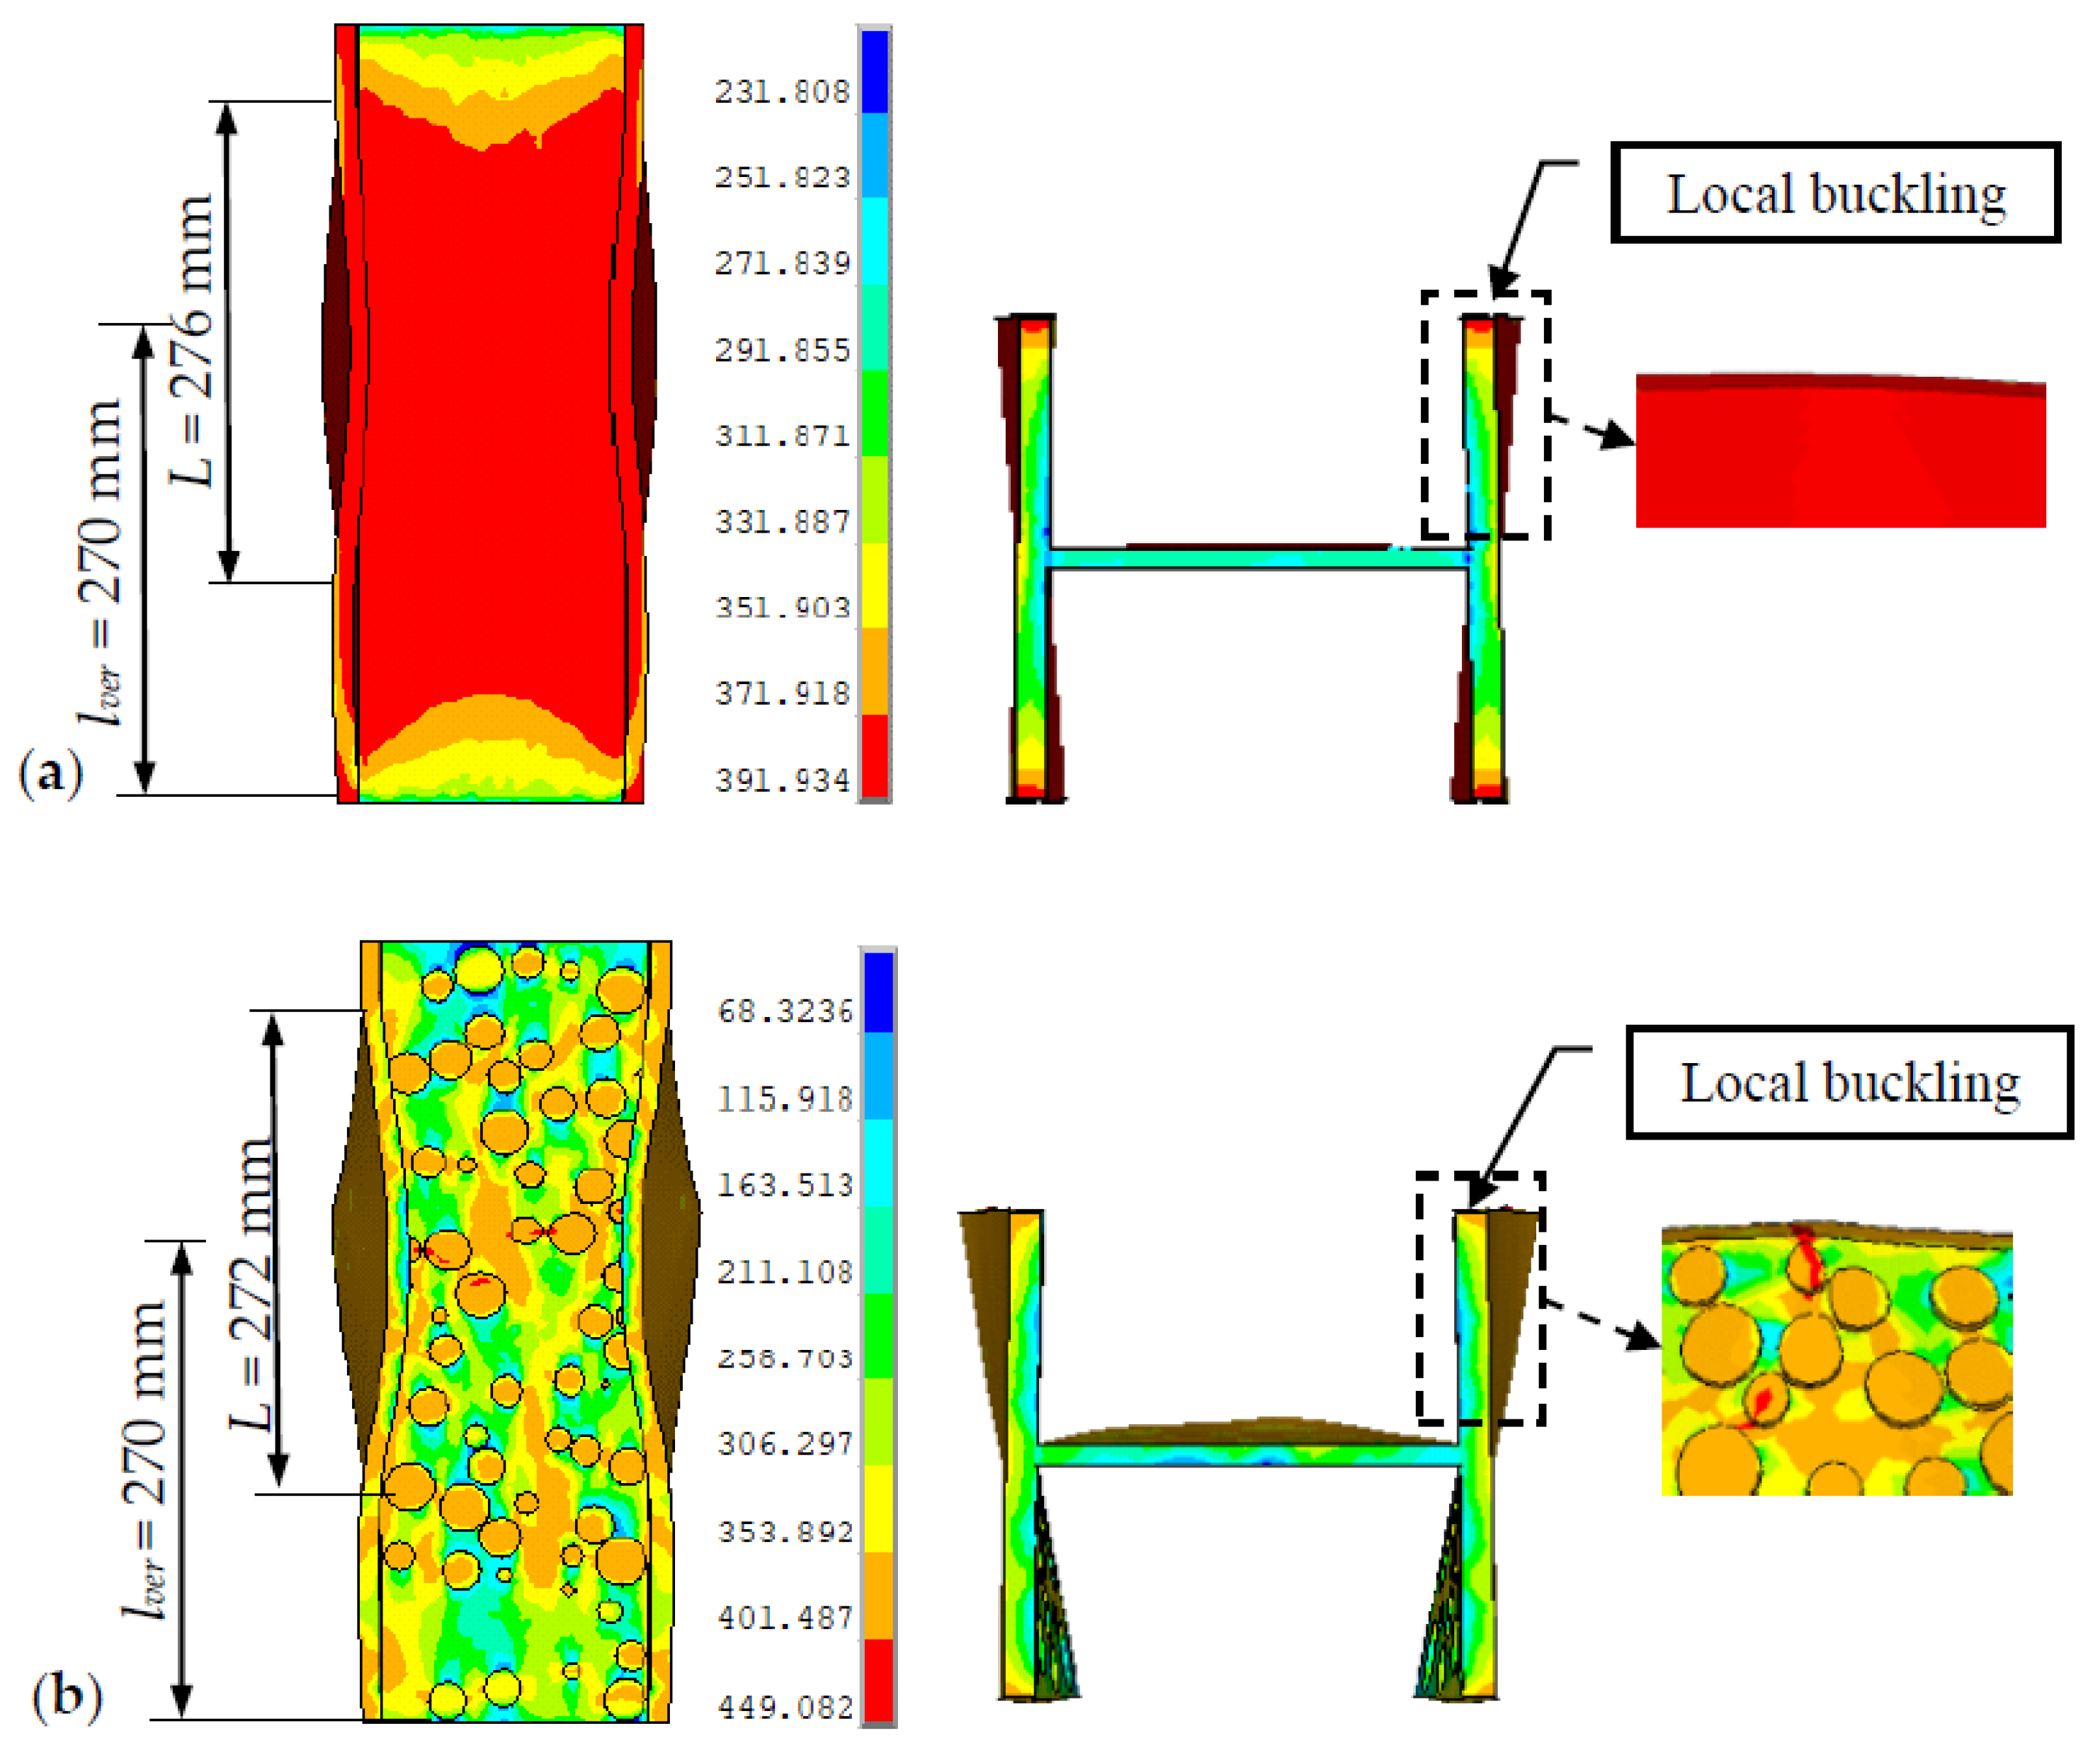
The axial stiffness of H-section columns with diverse corrosion patterns was examined at a higher level of pitting intensity, specifically DOV 13.8%. Figure 8 illustrates the load–displacement curves of H-section columns subjected to different corrosion patterns. It is evident that these patterns exerted a substantial influence on the load–displacement behavior during both the elastic and inelastic deformation stages of H-section columns. This is demonstrated by a noticeable deterioration in axial stiffness, which is represented by the slope of each column’s load–displacement curve.
The variation in axial stiffness in the damaged column was reflected by the secant stiffness of each column, as depicted in Figure 9, throughout the loading stage. In this study, the initial stiffness was denoted as K0 in the elastic deformation stage, which corresponded to the curve slope at 40% of the ultimate load [24].
Figure 9a illustrates that the flange corrosion (H11.5 × 7.5−SF) induced a more significant reduction in axial stiffness than web corrosion (H11.5 × 7.5−W), with reductions of 7.7% and 4.6%, respectively. Consequently, when combined with flange corrosion, there was a notable decrease in axial stiffness, as depicted in Figure 9b. The reductions in axial stiffness for single-flange corrosion (H11.5 × 7.5−SF + W) and double-flange corrosion (H11.5 × 7.5−DF + W) were 12.3% and 19.9%, respectively. Similarly, the stiffness reductions for symmetric flange corrosion (H11.5 × 7.5−DF) and asymmetric flange corrosion (H11.5 × 7.5−AF) were nearly identical, with reductions of 15.4% and 15.1%, respectively, as shown in Figure 9a. Likewise, the combined corrosion of (H11.5 × 7.5−DF + W) and (H11.5 × 7.5−AF + W) led to reductions of 19.9% and 19.7%, respectively, as depicted in Figure 9b. Therefore, only the symmetric corrosion pattern was considered for subsequent investigations.
Similar to the strength reduction, the reduction in axial stiffness also exhibited a trend of linear superposition. The stiffness reduction caused by double-flange corrosion was approximately twice as large as that caused by single-flange corrosion, with reductions of 15.4% and 7.7%, respectively, as illustrated in Figure 9a. Additionally, the web corrosion (H11.5 × 7.5−W) led to a stiffness reduction of 4.6%. As observed in Figure 9b, the stiffness reduction for the combined corrosion of single-flange (H11.5 × 7.5−SF + W) was 12.3%, calculated as the sum of 7.7% and 4.6%. In the case of double-flange combined corrosion (H11.5 × 7.5−DF + W), the stiffness reduction was 19.9%, derived from the sum of either 12.3% and 7.7% or 15.4% and 4.6%.

3.1.3. Failure Mode

The failure modes of randomly pitted H-section columns were investigated under two corrosion patterns: double-flange corrosion and double-flange combined corrosion. Figure 10 depicts the typical failure modes observed in both intact and corroded columns, along with the Von Mises stress contour. For clarity, column deformations in this figure are amplified by a factor of 5. The parameter “lver” represents the distance from the vertex of a buckling half-wave to the bottom of the column, and “L” denotes the length of the buckling half-wave.
The findings from Figure 10 reveal a significant impact of random pitting corrosion on the failure behavior and stress distribution of H-section columns. In the ultimate state, local buckling occurred on both flanges of the columns. This was characterized by the presence of buckling half-waves along the length and width of the columns, with the outstand flange deforming outward or concaving inward along the column width. When comparing the intact column in Figure 10a to those affected by random pitting corrosion in Figure 10b, a more pronounced deformation resulting from local buckling was evident. Table 1 provides details concerning the length and location of buckling half-waves along the column length at the ultimate state, considering two corrosion patterns and varying levels of pitting intensities. Herein “lmin” represents the distance from the minimum cross-sectional area to the bottom of the column. It is worth noting that the length and position of the buckling half-wave did not exhibit clear regularity. This differed from that observed in the H-section columns with general corrosion, where the half-wavelength decreases with the increase in corrosion intensity [12]. For instance, in the case of double-flange corrosion (H11.5 × 7.5−DF), the half-wavelength (l) was 261 mm at a DOV of 4.8, being less than that (l = 266 mm) at the higher DOV of 13.8%. Moreover, the local buckling did not necessarily emerge on the minimum cross-section denoted by lmin = 38 mm but occurred on the cross-section at lver = 269 mm. This can be attributed to the uncertainty associated with random pitting corrosion, which leads to irregular cross-sections throughout the column length. Consequently, rather than the weakest section of the column, the relatively weaker section, which was affected by random pitting damage, may prompt the local buckling of the column flanges, as shown in Figure 10b.

3.2. Influence of Width-to-Thickness Ratio of Plate

This section delves into investigating the influence of the width-to-thickness ratio on the ultimate strength of randomly pitted H-section columns. Specifically, the study examines the variations in flange and web thickness, as they play a vital role in the buckling behavior of the columns. Based on the insights garnered from the preceding section regarding corrosion patterns, this section focuses on double-flange combined corrosion. This particular corrosion pattern was chosen due to its substantial impact on the reduction in ultimate strength of randomly corroded columns. Additionally, the study investigates the effect of flange and web thickness under five levels of pitting intensities: DOV 4.8%, 6.8%, 8.8%, 11.8% and 13.8%.

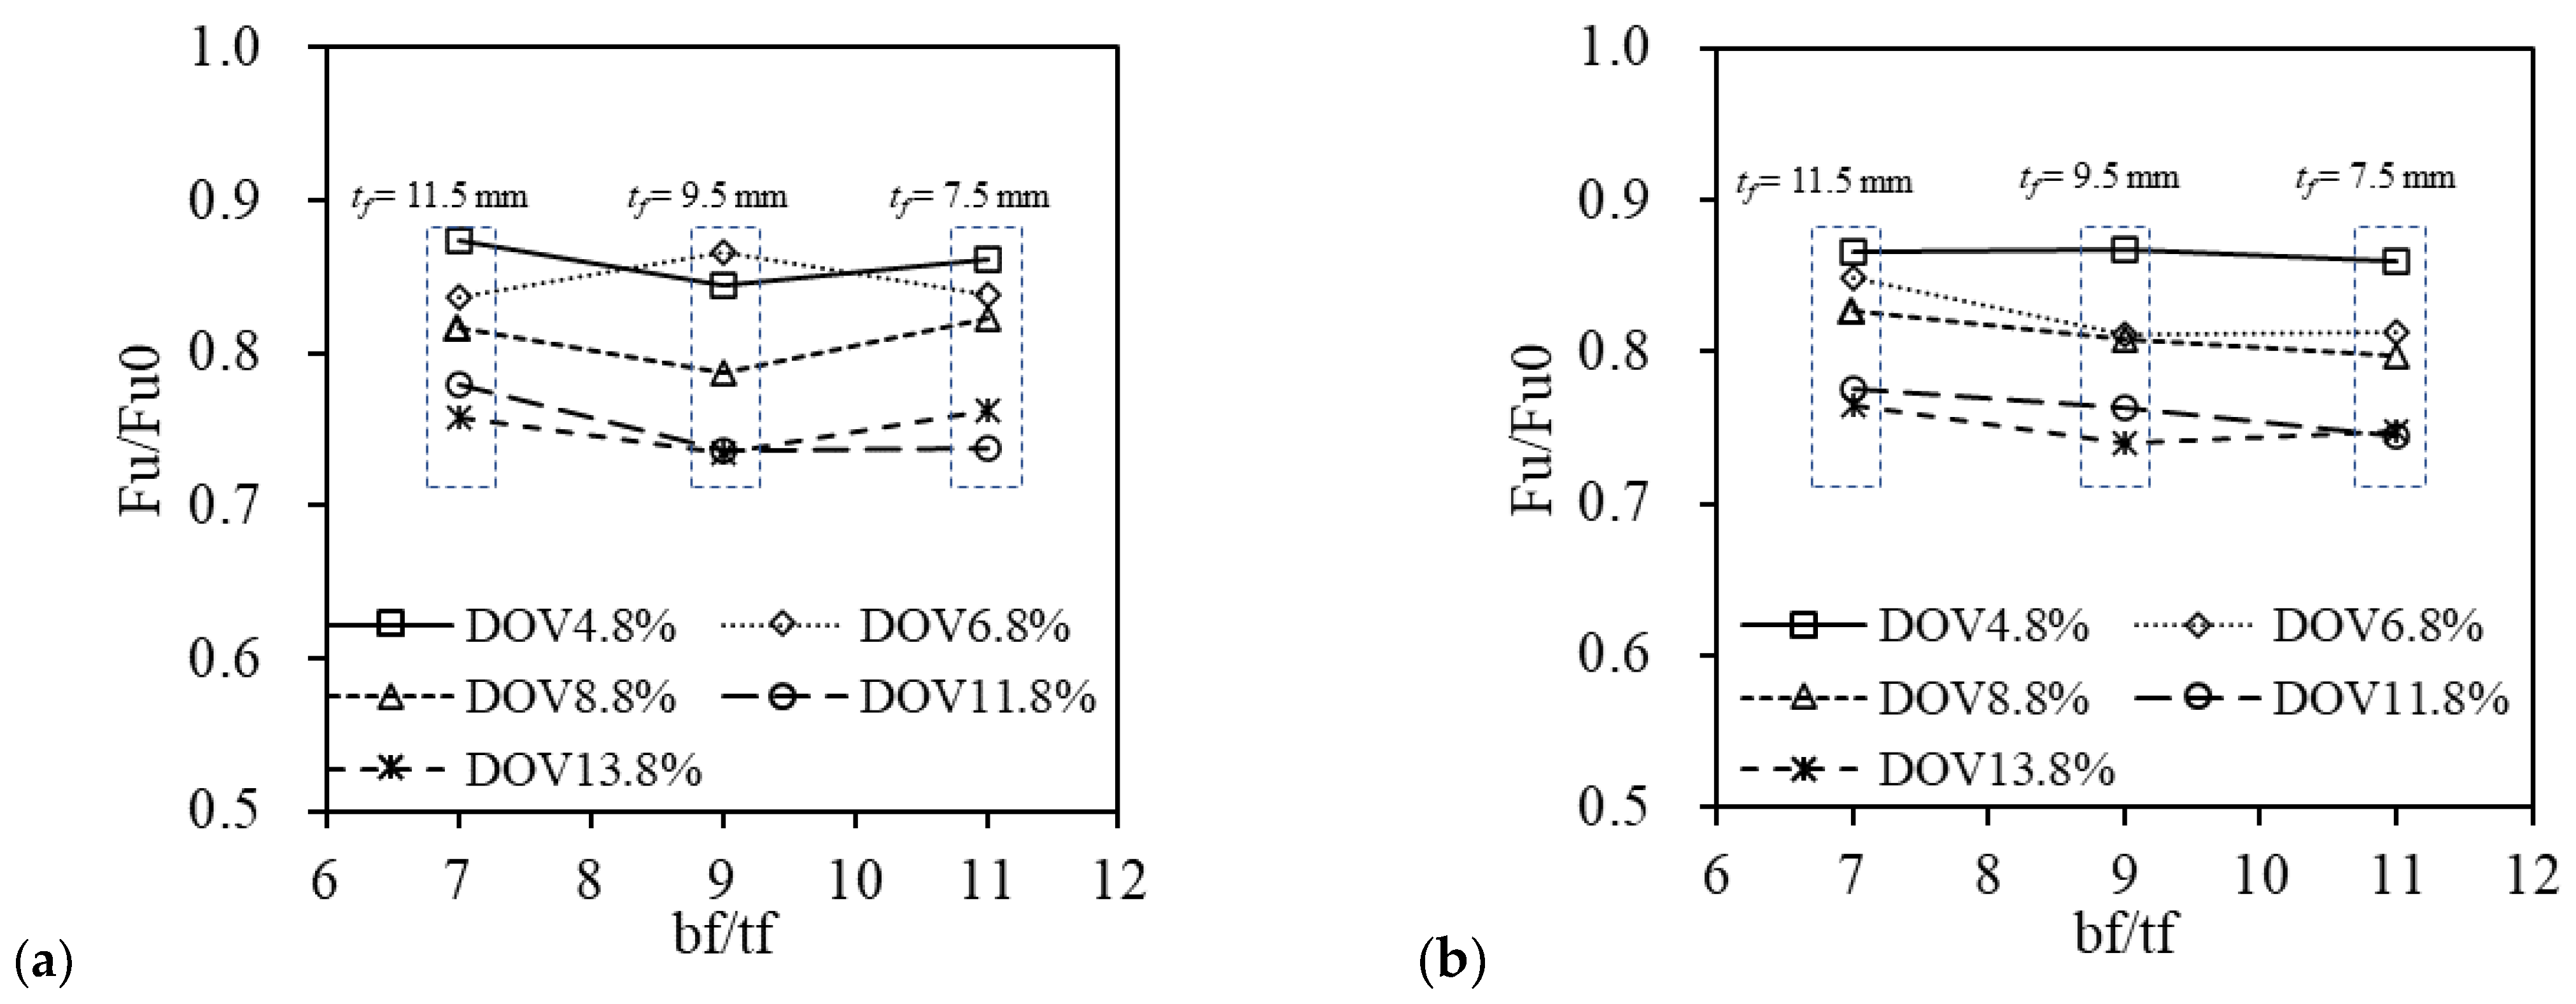
3.2.1. Influence of Flange Thickness

The influence of the width-to-thickness ratio of the flange on the ultimate strength of H-section columns was studied, considering two different web thicknesses of 7.5 and 9.5 mm. The flange thickness varied as 11.5, 9.5 and 7.5 mm. Figure 11 illustrates the impact of flange thickness on the ultimate strength of the columns. The findings indicate that the change in the width-to-thickness ratio of the flange resulting from variation in flange thickness minimally affected the ultimate strength under different levels of pitting intensities. For the thinner web (tw = 7.5 mm), at a lower level of pitting intensity (DOV 4.8%), the reductions in ultimate strength for the three flange thicknesses (11.5, 9.5 and 7.5 mm) were 12.6%, 15.5% and 13.9%, respectively, with the maximal difference in strength reduction of about 2.9%, as shown in Figure 11a. Similarly, at a higher level of pitting intensity (DOV 13.8%), the reductions in ultimate strength for the three flange thicknesses were 24.2%, 26.6% and 23.7%, respectively, also with a difference of about 2.9%. It was reported that coefficient of variation (COV) was up to 12.6% for the unstiffened plate under the same DOV [25]. In view of such inherent strength variation resulting from random pitting corrosion, the impact of the width-to-thickness ratio of the flange on ultimate strength of H-section columns can be considered negligible.
A similar influence of the width-to-thickness ratio was observed for the thicker web (tw = 9.5 mm), as depicted in Figure 11b. The ultimate strength reductions were 13.3%, 13.2% and 14.0% for the three flange thicknesses, respectively, at the DOV 4.8%. Additionally, at the DOV 13.8%, the strength reductions were 23.5%, 25.9% and 25.1%, respectively. It is worth noting that there was a minor discrepancy in the strength reduction resulting from the variation in flange thickness under the same DOV.

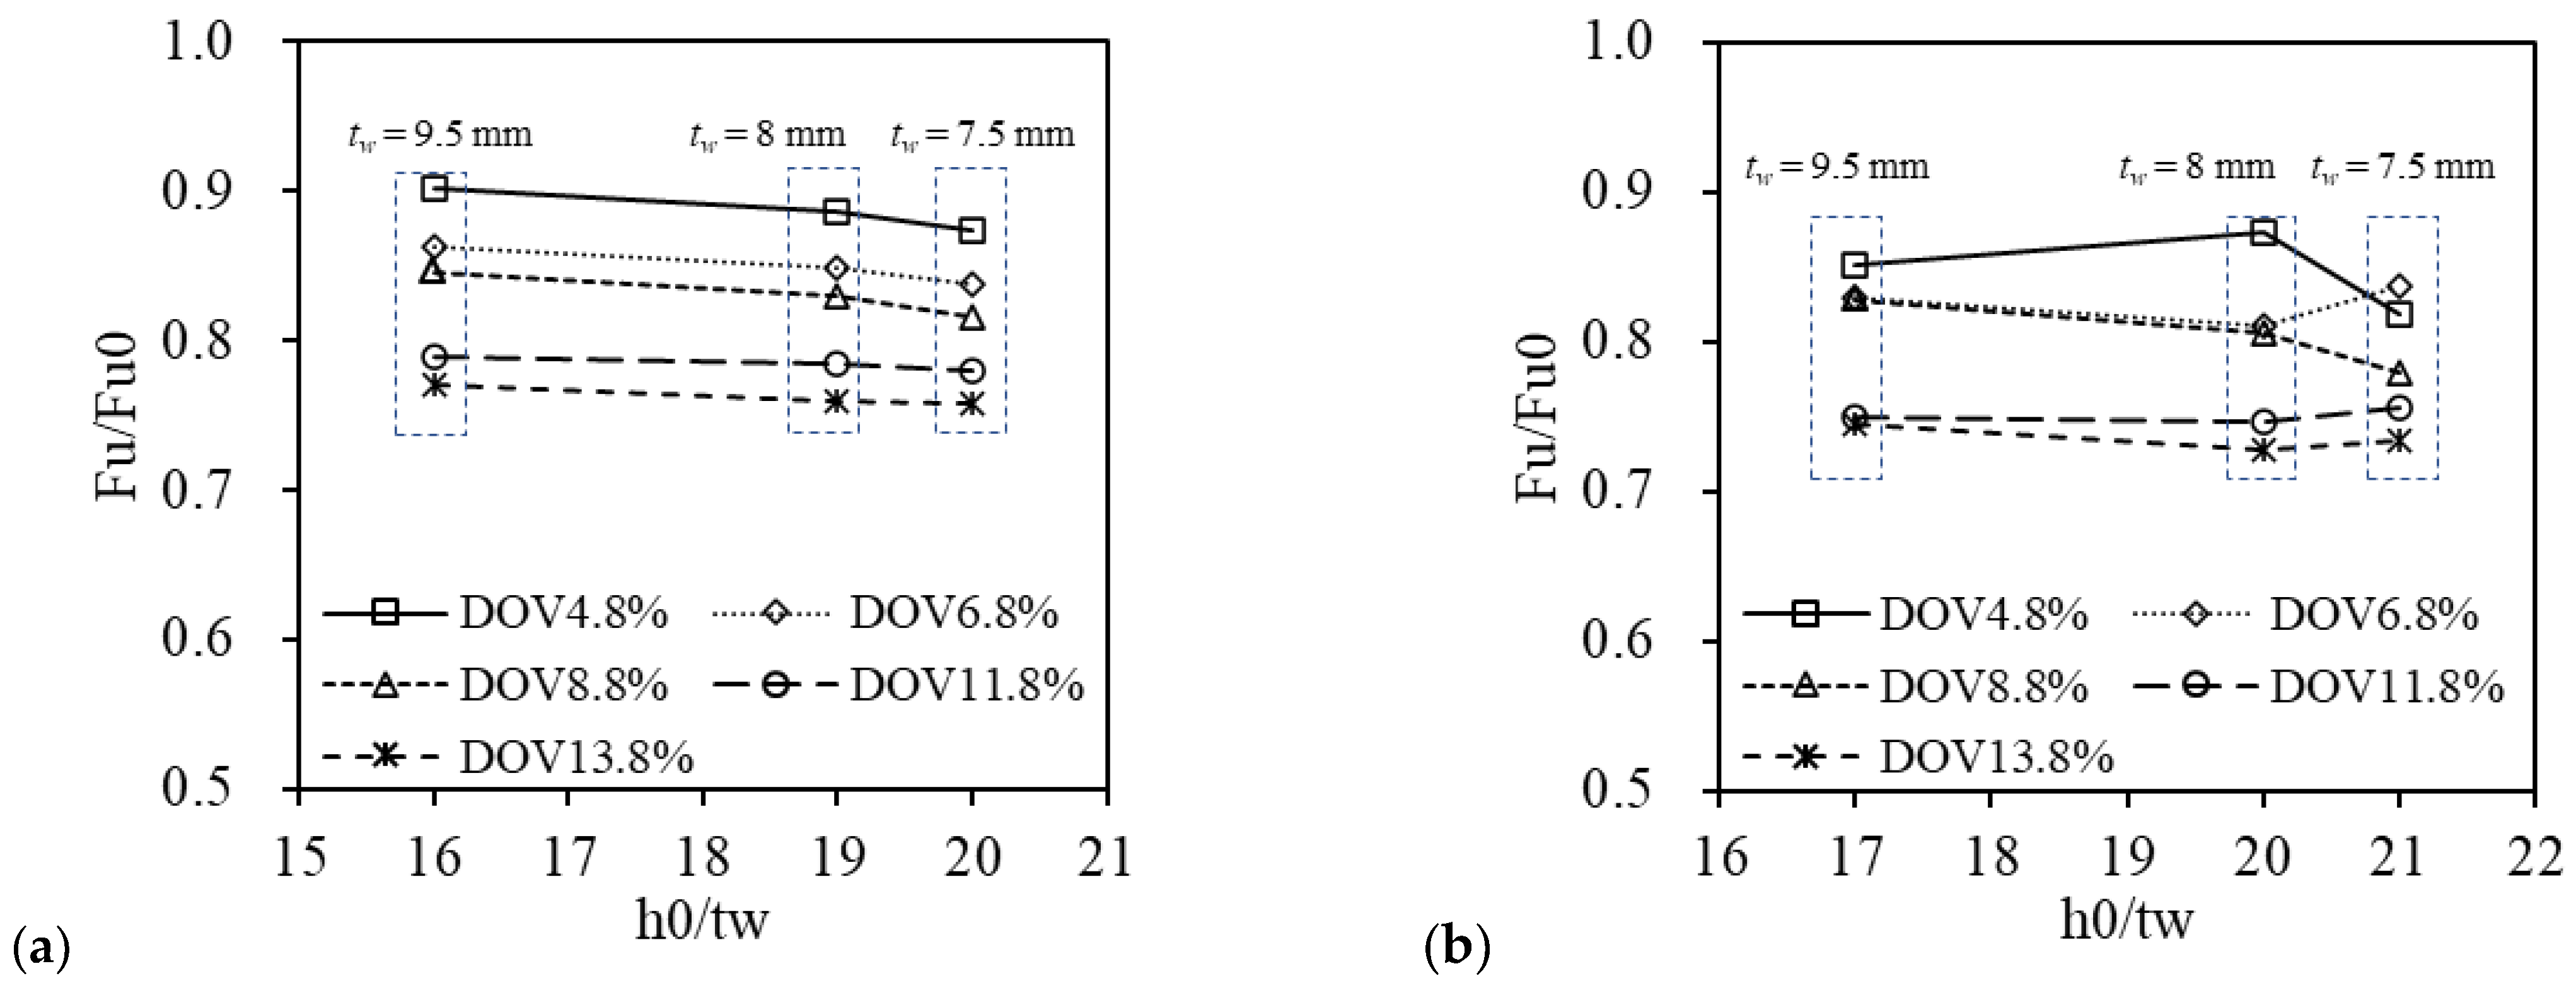
3.2.2. Influence of Web Thickness

The influence of the width-to-thickness ratio of the web was examined under two different flange thicknesses of 7.5 and 11.5 mm. The web thickness was varied as 9.5, 8 and 7.5 mm. Figure 12 depicts the impact of the web width-to-thickness ratio on the ultimate strength of randomly pitted columns. Evidently, the change in web thickness did not significantly affect the reduction in ultimate strength at the same level of pitting intensity. For the thinner flange (tf = 7.5 mm), the strength reductions were 14.9%, 12.7% and 18.1%, respectively, due to the change in web thickness (9.5, 8 and 7.5 mm), at the DOV 4.8%, as shown in Figure 12a. Similarly, at the DOV 13.8%, the strength reductions for the three web thicknesses were 25.5%, 27.1% and 26.6%, respectively.
Similarly, for the thicker flange (tf = 11.5 mm), the strength reductions for three web thicknesses (9.5, 8 and 7.5 mm) at the DOV 4.8% were 9.8%, 11.4% and 12.6% respectively, as illustrated in Figure 12b. Likewise, at the DOV 13.8%, the strength reductions for the three web thicknesses were 23.0%, 24.0% and 24.2%, respectively. In conclusion, the variation in flange and web thickness insignificantly impacts the reduction in ultimate strength in randomly pitted H-section columns.

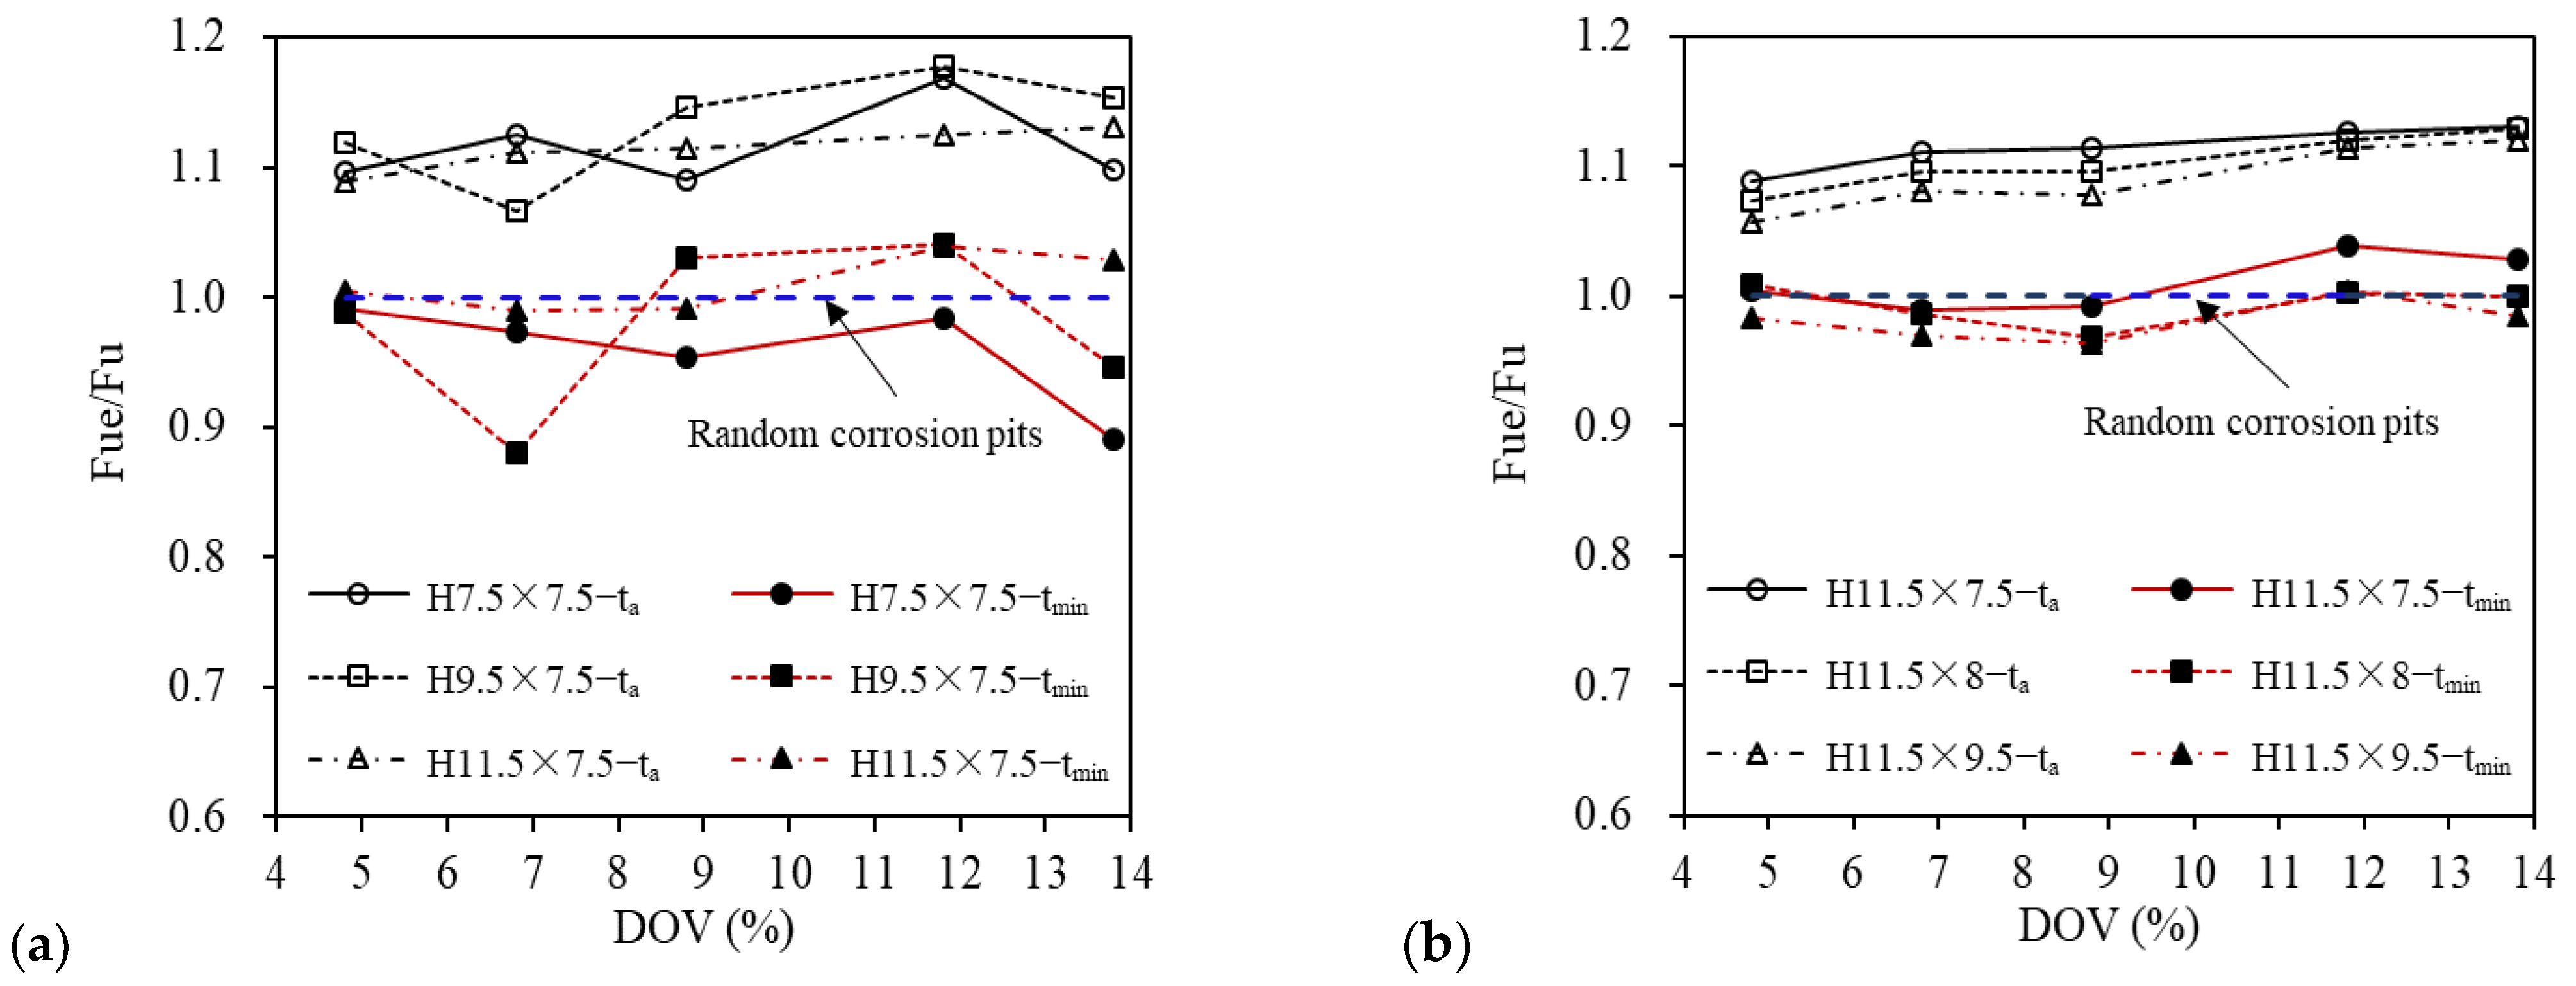
3.3. Equivalent Thickness Method

Accurately determining the minimum cross-section of randomly pitted columns is a challenging task, despite the close relationship between the failure of damaged columns and their cross-sectional area. Therefore, this section aimed to comparatively analyze various methods for equalizing thickness loss caused by random pitting corrosion. The objective was to replace the modeling of random pitting corrosion with a uniform thickness loss for assessing ultimate strength. The methods verified in this section included the DOV−based equivalent thickness, ta, namely, the average thickness resulting from general corrosion with the same volume loss caused by corrosion damage. Additionally, the minimum cross-sectional equivalent thickness, tmin, and the thickness correlated to the standard deviation of depth of actual measured corrosion pits (referred to as σ−based equivalent thickness, a modification of the average thickness), te, were considered. The definitions of these three types of equivalent thicknesses were as follows:
t a = t 1 D O V ,
t m i n = t × A m i n A 0 ,
t e = t a + k σ .  
where t is the original thickness of plate elements (flange or web) of as H-section column. Amin is the area of the minimum cross-section of the pitted column, while A0 is the area of section of the intact column. Additionally, σ is the standard deviation of depth of random corrosion pits, and k is a constant coefficient that requires determination for the subsequent investigation. In this study, σ is assumed to be 0.6 mm in association with pseudo-random corrosion pits based on the measured corrosion data.
The randomly pitted columns analyzed in the previous section were reintroduced here. Using the equivalent thicknesses obtained from Equations (2)–(4), the numerical models of these columns were reconstructed with a uniformly reduced thickness. Since the average thickness determined by Equation (2) is widely endorsed in current specifications, it was used as a reference in the subsequent analyses for comparison with those obtained from Equations (3) and (4). To facilitate result presentation, the ultimate strength derived from the equivalent thickness was denoted as Fue, while the ultimate strength obtained from random pitting corrosion model was represented as Fu. Once the equivalent thickness was determined through the comparative study, its suitability was further confirmed by referencing the current specifications, including the Chinese Standard (GB 50017−2017) [26] and the European Standard (Eurocode 3) [27].

3.3.1. Equivalent Thickness Based on Minimum Cross-Sectional Area

Figure 13 displays the ultimate strength of corroded H-section columns, derived from the average thickness and the minimum cross-sectional thickness. The impact of thickness change in the column flange is illustrated in Figure 13a, while Figure 13b demonstrates the influence of thickness change on the column web. Note that in the figure, the blue dashed line corresponding to 1.0 represents the results of columns with random pitting corrosion.
Clear differences emerge between the predicted ultimate strength based on the average thickness and minimum cross-sectional thickness of randomly pitted columns. This distinction arose from the fact that the failure of columns was primarily influenced by the minimum cross-section in comparison to the average cross-section. However, variation was observed in the predicted results due to the effect of the random nature of pitting corrosion. To assess the precision of different equivalent thicknesses, the mean relative errors were calculated for five levels of pitting intensities. For columns with various flange thicknesses of 7.5, 9.5 and 11.5 mm, depicted in Figure 13a, the average thickness resulted in mean errors of 11.5%, 13.2% and 11.3%, respectively. In contrast, the minimum cross-sectional thickness yielded significantly smaller mean errors of −4.1%, −2.3% and 1.0%, respectively. Similarly, for columns with different web thicknesses of 7.5, 8 and 9.5 mm, shown in Figure 13b, the average thickness generated mean errors of 11.3%, 10.2% and 8.9%, while the minimum cross-sectional thickness resulted in smaller mean errors of 1.0%, −0.7% and −1.9%, respectively.
However, it is noteworthy that the minimum cross-sectional thickness may occasionally lead to undue underestimation of the ultimate strength of randomly pitted columns, particularly in cases where the flange thickness was thinner. For instance, for a flange thickness of 7.5 mm (H7.5 × 7.5−DF + W), the error amounted to −10.9% under the DOV of 13.8%, while it increased to −11.9% under the DOV of 6.8%, for the flange thickness of 9.5 mm (H9.5 × 7.5−DF + W).

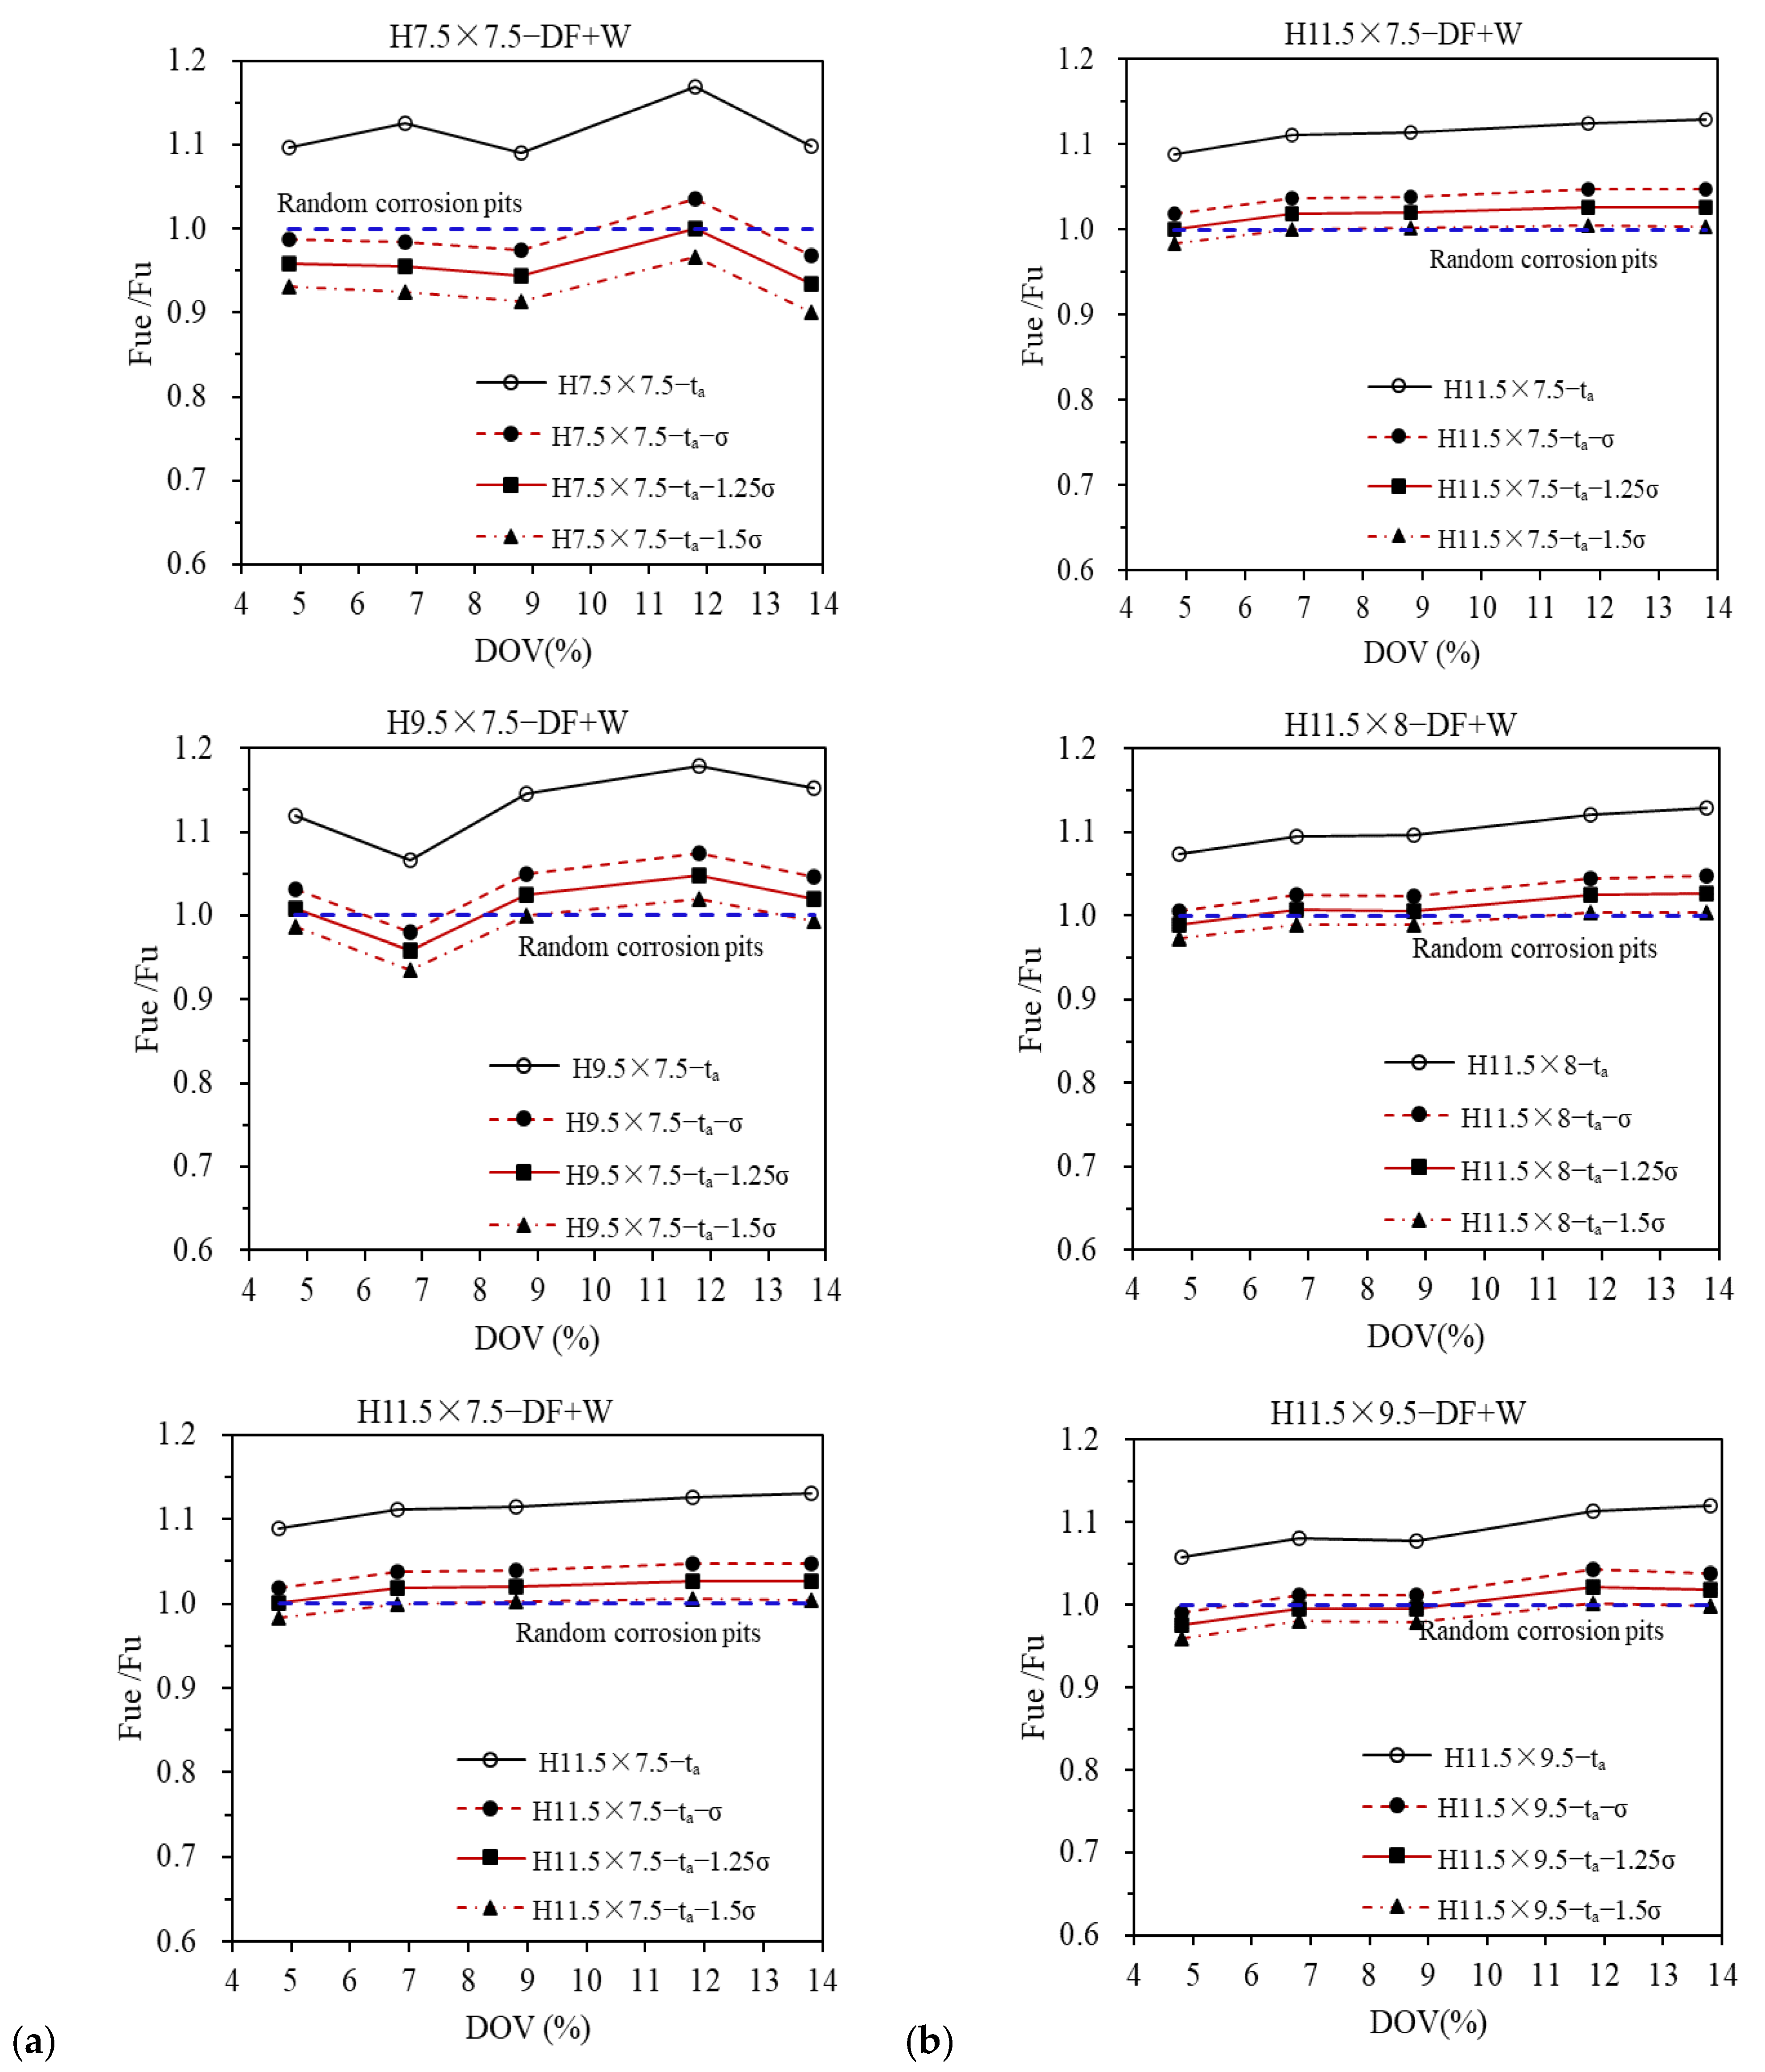
3.3.2. Equivalent Thickness Based on Standard Deviation of Pit Depth

The aforementioned research indicates that neither the DOV−based (average) thickness nor the minimum cross-sectional thickness appeared to fulfill the requirement of accurately predicting the ultimate strength of randomly pitted columns. To address this issue, the standard deviation of pit depth was incorporated to refine the average thickness, leading to the modified thickness formulation te = ta + . The parameter k was determined as −1.0, −1.25 and −1.5 through empirical assumptions. Figure 14 depicts the ultimate strength of H-section columns, categorized based on the flange and web thickness variations, utilizing the σ−based equivalent thickness. The study illustrates that the ultimate strength of randomly corroded columns can be effectively assessed by utilizing the σ−based equivalent thickness. Overall, a value of k = −1.25 yielded a more accurate prediction of the ultimate strength for randomly pitted columns. This was due to the fact that the mean error, being the average between errors of the results from the equivalent thickness and random pitting corrosion model under five levels of pitting intensities, was mostly less than 3% for the k value.

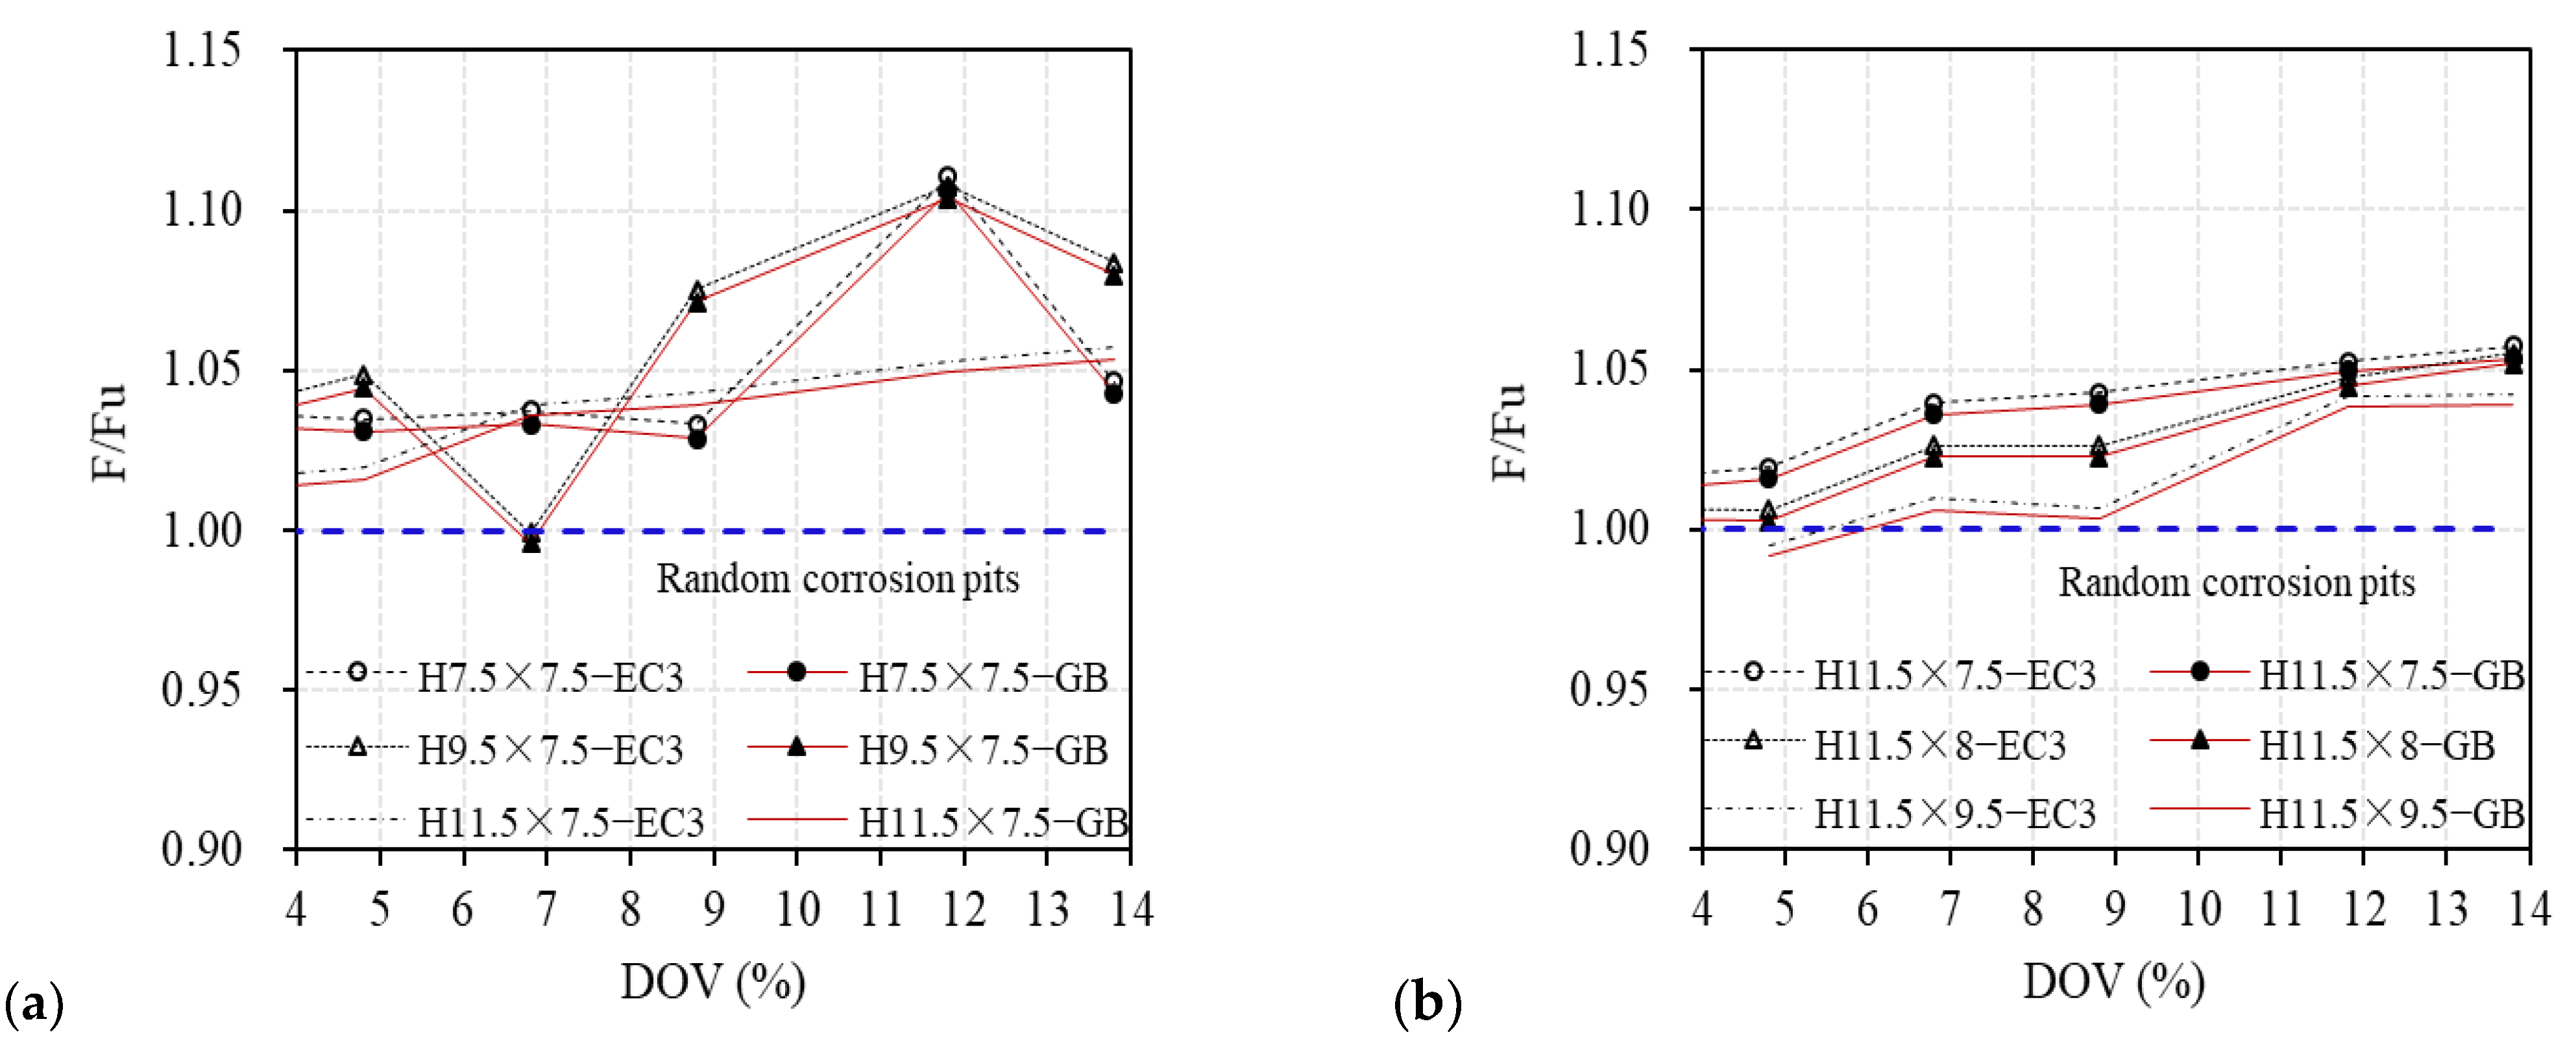
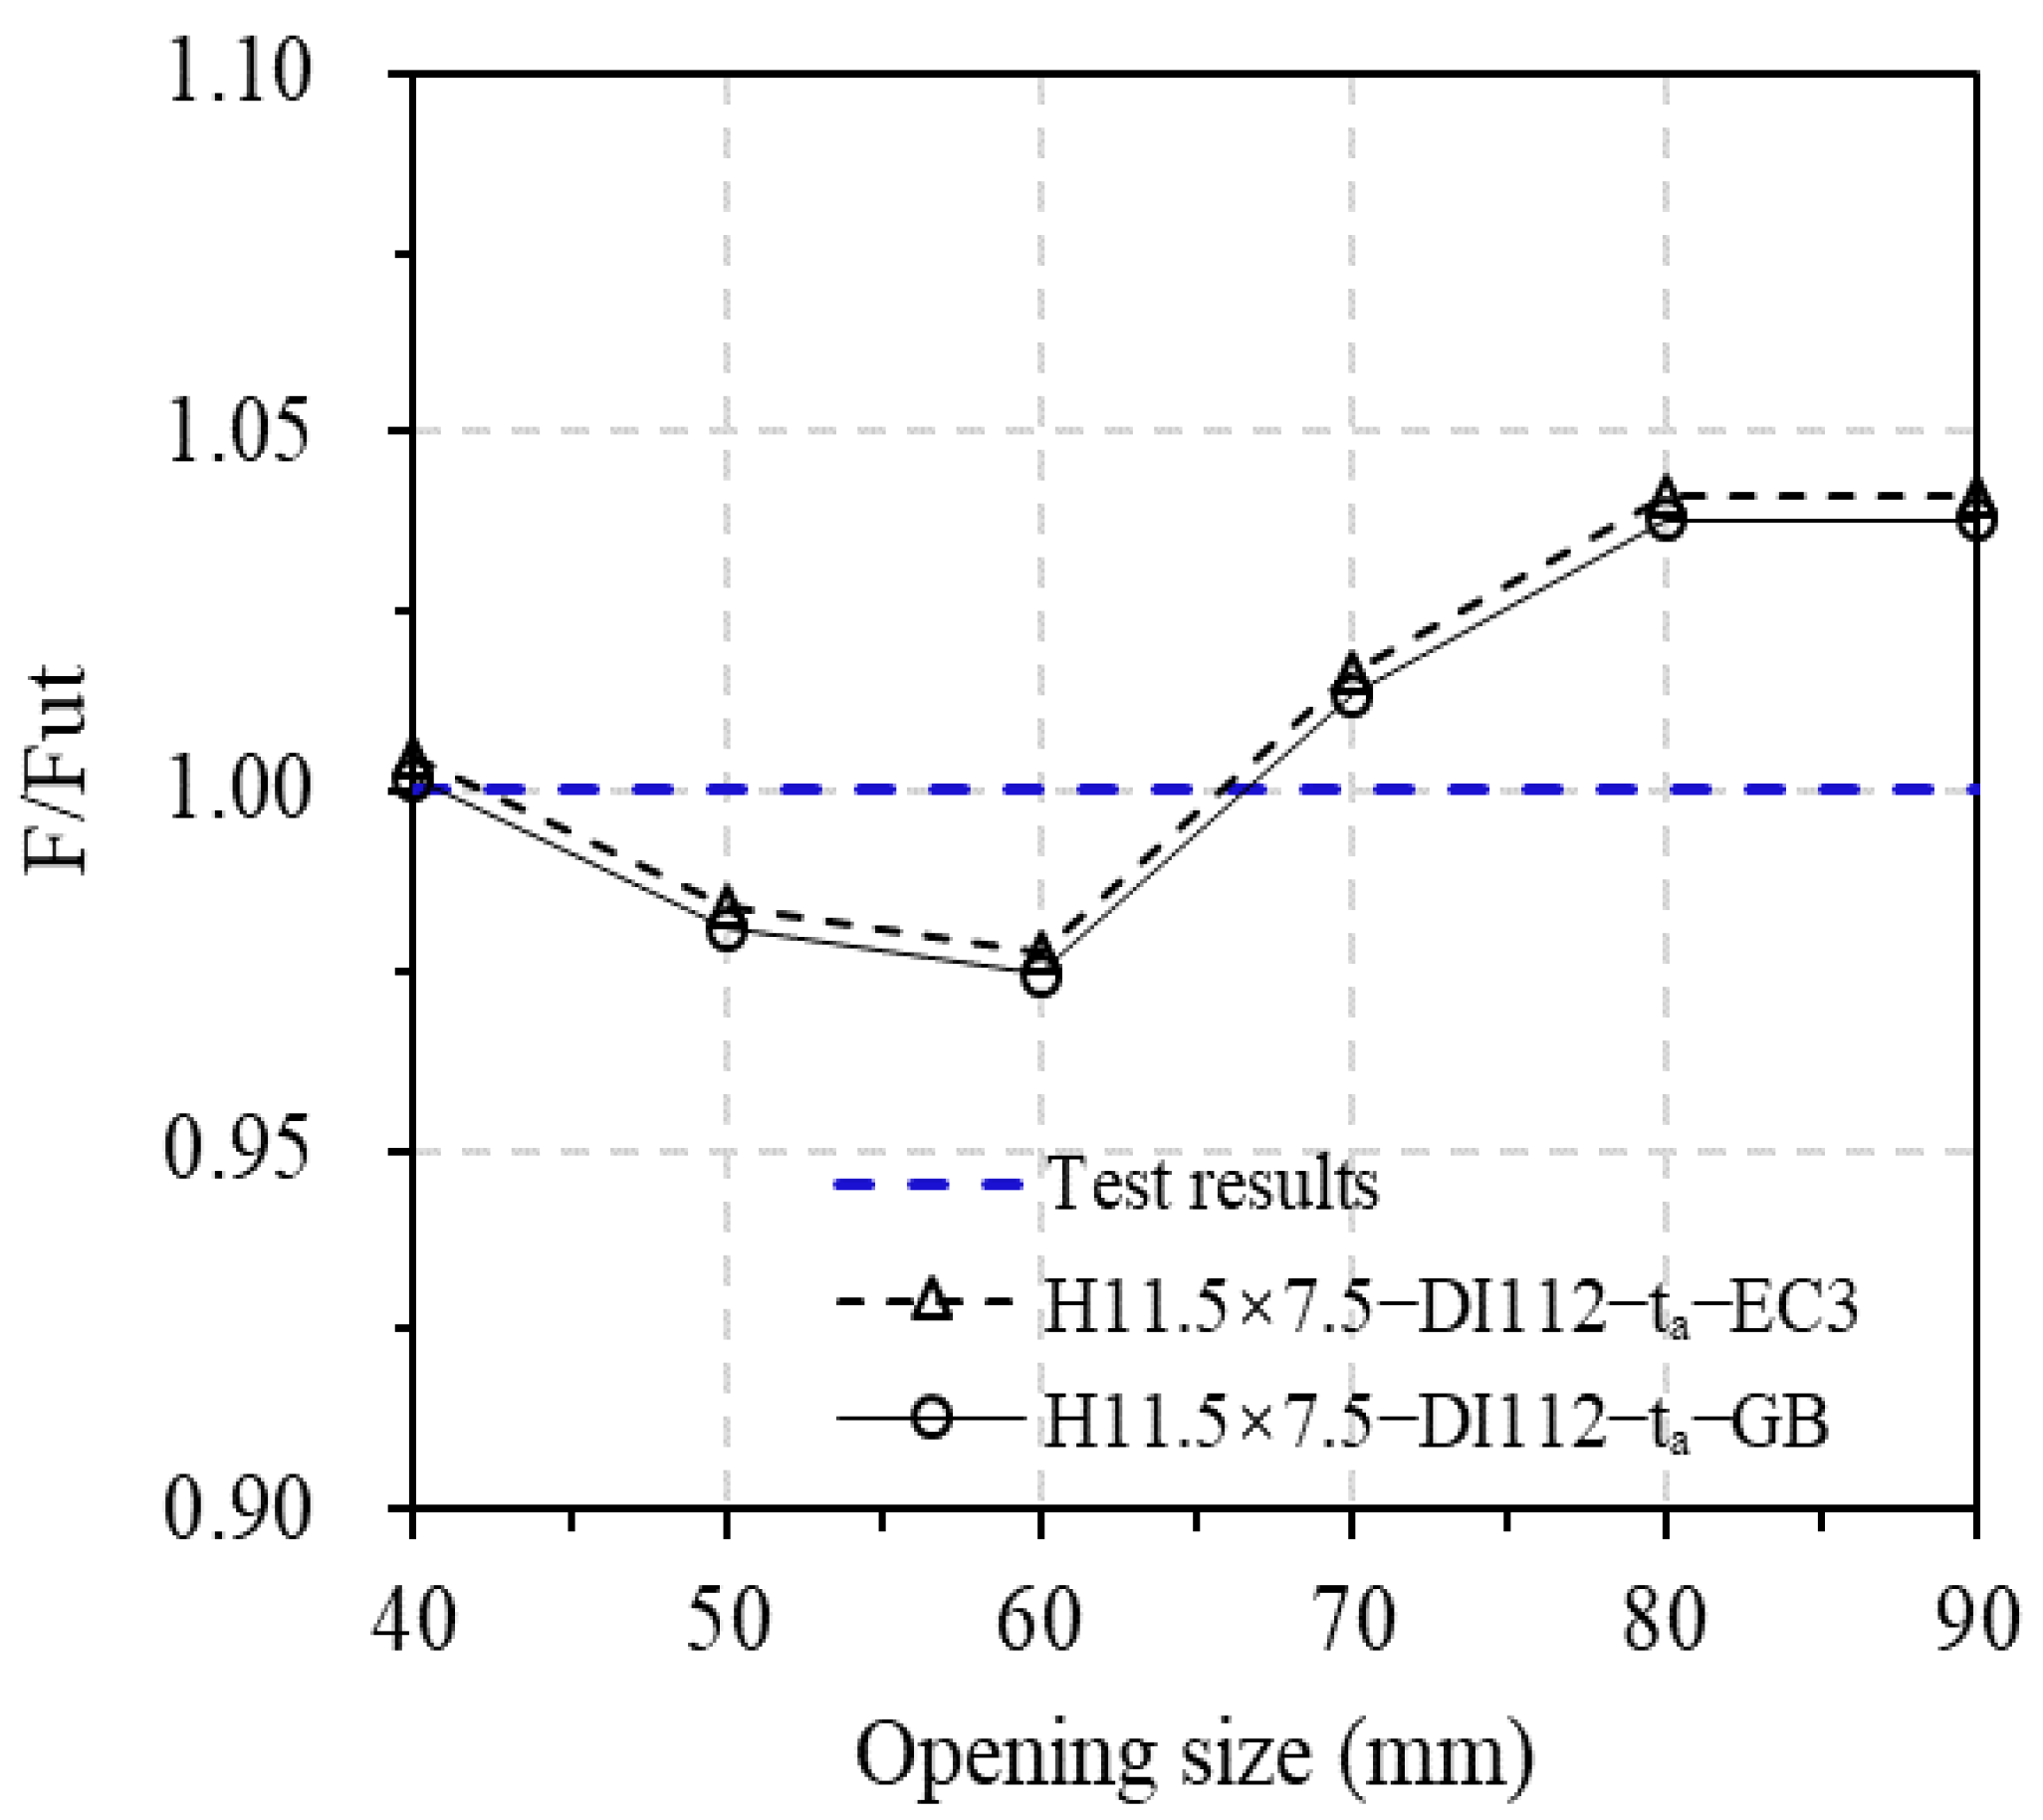
3.3.3. Verification of Equivalent Thickness Method

According to the Chinese standard [26], the ultimate strength, F, of axially loaded stub H-section columns can be calculated as follows:
F = φ A f y ,  
A = ρ i A i ,  
φ = 1 a 1 λ n 2                                         λ n 0.215 ,   φ = 1 2 λ n 2 ( a 2 + a 3 λ n + λ n 2 ) ( a 2 + a 3 λ n + λ n 2 ) 2 4 λ n 2           λ n > 0.215 .    
where A is the cross-sectional area of a column, fy is the yield strength of steel, φ is the stability coefficient of the column, and ρi is the effective section coefficient for a plate of the H-section; λn is the dimensionless slenderness ratio of the column, λ n = λ π f y E , λ is the slenderness ratio, λ = μ l i = μ l I 0 / A 0 , wherein µ is the calculated length factor, i is the radius of gyration, and I0 is the moment of inertia of the section; a1, a2 and a3 are coefficients corresponding to the respective section categories.
For an axial compressive column, the ultimate strength is addressed in the European Standard [27], as follows:
F = χ A f y γ M 1 ,  
χ = 1   λ ¯ 0.2 , χ = 1 ϕ + ϕ 2 λ ¯ 2   λ ¯ > 0.2 ,  
ϕ = 0.5 1 + α λ ¯ 0.2 + λ ¯ 2 ,  
where χ is the reduction factor for the relevant buckling mode, ϕ is global initial sway imperfection, γM1 is the local safety factor, taken as 1.0, α is the defect factor, λ is the dimensionless slenderness ratio of the column, λ ¯ = A f y N c r , and Ncr is the elastic critical force based on the gross section properties for the relevant buckling mode.
Figure 15 exhibits the ultimate strength of randomly pitted columns, considering different flange and web thicknesses, based on both the Chinese and European standards. The determination of the equivalent thickness was based on the σ−based equivalent thickness with k = −1.25. The comparison is divided into two cases: different flange thickness and different web thickness.
The prediction of ultimate strength on the basis of the σ−based equivalent thickness did not significantly differ between the Chinese and European standards. However, as the level of pitting intensity increases, both standards tended to overestimate the ultimate strength, leading to a failure risk in the damaged members. This suggests that the current specifications had limitations when used to predict ultimate strength. In the case of columns with different flange thicknesses, as displayed in Figure 15a, the relative errors remained below 5% when the DOV was less than 9%. However, at a higher DOV of 11.8%, the relative errors reached about 11% for both the Chinese Standard and European Standard.
Conversely, for columns with different web plate thicknesses, both the Chinese and European standards provided more accurate predictions, as depicted in Figure 15b. The maximum relative errors for both standards were 5.3% and 5.7% respectively, occurring at a DOV of 13.8%.
Furthermore, the Chinese and European Standards were employed to verify the tested H-sections with openings presented in reference [24], using the equivalent thickness method. Figure 16 illustrates the ultimate strength of columns with different opening sizes, where Fut represents the test results. It is noteworthy that in the tested columns, the perforated opening can be considered a case resulting from severe pitting corrosion, with the pit depth standard deviation being zero. Thus, in this scenario, the equivalent thickness calculated using Equation (4) was identical to that obtained from Equation (2).
The method based on the presented equivalent thickness was proven to be effective in predicting the ultimate strength of all the tested columns, as illustrated in Figure 16. The maximum relative error was less than 5%. For openings with diameters smaller than 70 mm, both the Chinese and European Standards displayed a tendency to underestimate the ultimate strength, with a relative error less than 2.5%. Conversely, for openings with diameters larger than 70 mm, both standards tended to slightly overestimate the ultimate strength, albeit with a relative error of no more than 4.1%.

3.4. Ultimate Strength Assessment

This section aims to examine the ultimate strength assessment of randomly pitted columns. Three types of sections of H7.5 × 7.5, H11.5 × 7.5 and H11.5 × 9.5 were considered. The first two sections were designed to clarify the influence of flange thickness under the constant web thickness of 7.5 mm. The latter two sections were used to explore the impact of web thickness under the constant flange thickness of 11.5 mm. Stochastic simulations were employed to generate numerous numerical models of columns with random pitting corrosion, thoroughly considering the random nature of size, shape and distribution of corrosion pits. The ultimate strength of damaged columns was evaluated, and the results were further used to verify the existing standards for predicting the ultimate strength of plated structures.
In addition to the ultimate strength obtained from nonlinear finite element (FE) analyses, results from both the Chinese and European Standards were considered, based on the equivalent thickness determined by Equation (4). Figure 17 presents the results of the stochastic simulations alongside the current standards. Specifically, Figure 17a–c display, respectively, the results for columns with three types of sections, consolidated in Figure 17d.
There are limitations in the current standards to predict the ultimate strength of randomly pitted columns based on the equivalent thickness, as depicted in Figure 17. The standards demonstrated better predictions for columns with relatively thinner plate thickness. From Figure 17a–c, a point of intersection between the results of stochastic simulations and standards is observed at a certain DOV for each section, indicating a correlation with column section size. For the H7.5 × 7.5, H11.5 × 7.5 and H11.5 × 9.5 sections, these DOV values were 7.8%, 6.5% and 5.9%, respectively. Interestingly, this trend suggests that as the plate element of the column became thicker, the corresponding DOV value decreased, signifying a decline in range of application of the current standards. Specifically, compared to the H11.5 × 7.5, the increase in the flange thickness of the H7.5 × 7.5 decreased the upper range of application from DOV 7.8% to 6.5%. Similarly, increasing the web thickness of the H11.5 × 9.5 further reduced the range to 5.9%. Overall, both the current standards consistently exhibited a conservative prediction of the ultimate strength of randomly pitted columns within their range of application, with a similar prediction accuracy.
Furthermore, a regression analysis was conducted to derive an exponential function based on the stochastic simulation results of each type of section, as presented in Figure 17 a–c. The observed function exhibited a similar trend under different sizes of columns. Hence, these findings, along with the results obtained from the existing empirical formula, are synthetically illustrated in Figure 17d. The CCS Specification [28] utilizes an adjustment coefficient to account for the impact of random pitting corrosion on the ultimate strength of plates under uniaxial longitudinal compression, as follows:
F u F u 0 = 1 54.716 D O V 3 + 14.804 D O V 2 3.298 D O V ,   D O V 10 % .  
Moreover, the first author proposed a power function, based on a set of stochastic simulations, to predict the ultimate strength of unstiffened plates affected by random pitting damage [25], defined as
F u F u 0 = 1 0.04749 ( D O V × 100 ) 0.6459 .
It should be emphasized that the prediction provided by Equation (13) represents the mean value of the ultimate strength of unstiffened plates with random pitting corrosion damage, which follows a normal distribution in the size. It is evident in Figure 17d that Equation (11) consistently underestimated the ultimate strength when the DOV exceeded 9%. This indicates that for severe corrosion, it yielded overly conservative predictions. In comparison, Equation (12) produced more accurate predictions for the ultimate strength of randomly pitted columns with various types of sections. This implies that the H-section columns with random pitting corrosion damage can be predicted by the same method as Equation (12) derived from unstiffened plates. Therefore, under random pitting corrosion, H-section columns with wide flanges can also be treated as plated structures. Nevertheless, further investigation is warranted to clarify the probabilistic model of ultimate strength for randomly pitted columns under specific levels of pitting intensities.

4. Discussion

The compressive behavior and ultimate strength of randomly pitted H-section stub columns have been studied under various corrosion patterns, pitting intensities and sizes of plate elements. The strength reduction in columns with multiple corroded plate elements can be linearly superposed by the individual plates, being highly related to the pitting intensity. The method to equalize the thickness loss due to pitting corrosion was regarded to be closely correlated with the standard deviation of depth of random corrosion pits.
The columns with section sizes of H11.5 × 7.5 and H7.5 × 7.5 were utilized herein to further study on the failure mechanism of randomly pitted columns. Cross-sections of H11.5 × 7.5 along the column length were segmented by 1 mm intervals, and the area of each cross-section, with random corrosion pits, was calculated upon its irregular section. Figure 18 shows the variation in the cross-sectional area along the column length under two corrosion patterns. The minimum cross-sectional area, Amin, the average cross-sectional area, Aave, and the cross-sectional area, Aver, at the vertex of the buckling half-wave were found. Note that the average cross-sectional area, Aave, was determined by tackling random pitting corrosion as general corrosion based on the same DOV, represented by the red dashed lines in Figure 18.
It is proven in Figure 18 that the local buckling of H-section columns tended to occur at the smallest or relatively smaller cross-section [12]. For the double-flange corrosion shown in Figure 18a, under the DOV 4.8%, the minimum cross-sectional area was 4668 mm2 at lmin = 224 mm. The local buckling occurred at lver = 228 mm, with the cross-sectional area of 4712 mm2 being very close to the minimum cross-sectional area. Similarly, under the DOV 13.8%, the minimum cross-sectional area was 4237 mm2 at lmin = 38 mm, but the local buckling arose at lver = 269 mm, with the relatively smaller cross-sectional area of 4268 mm2, which was also close to the minimum cross-sectional area.
As for double-flange combined corrosion in Figure 18b, under the DOV 4.8%, the minimum cross-sectional area was 4533 mm2 at lmin = 313 mm, while the local buckling occurred at lver = 220 mm with the cross-sectional area of 4577 mm2. Under the DOV 13.8%, the minimum cross-sectional area was 4084 mm2 at lmin = 269 mm, while the local buckling took place at lver = 270 mm, with a cross-sectional area of 4095 mm2 which was close to the minimum cross-section. This was due to the fact that multiple corrosion pits with larger sizes clustered at the relatively smaller cross-section, leading to serious stress concentration and then causing local buckling on such a relatively smaller cross-section rather than the minimum cross-section, as shown in Figure 10.
Obviously, it is not rational to simplify random pitting corrosion into general corrosion based on the same DOV, as the variation in cross-sectional area along the column length became more pronounced with the increase in DOV, leading to an increasing COV, as shown in Figure 18. In fact, the failure of randomly pitted columns always arose at the minimum or relatively smaller cross-section, but not the average cross-section. On the other hand, the random pitting corrosion significantly differs from regular pitting corrosion, since the latter caused less strength reduction in the columns with regularly distributed pits less than those with uniform thickness loss [12]. The difference between the average cross-section and the minimum cross-section became more and more significant for the higher DOV, as shown in Figure 19. This meant that in the case of serious pitting corrosion, the overestimation in predicting the ultimate strength based on the average thickness may become more excessive.
In fact, for the double-flange corrosion in Figure 19a, at the DOV 4.8%, the area loss ratios of the average and minimum cross-sections were 3.8% and 9.6%, respectively. At the DOV 13.8%, the area loss ratios of two types of cross-sections were 10.8% and 17.9%, respectively. For double-flange combined corrosion in Figure 19b, at the DOV 4.8%, the area loss ratios of the average and minimum cross-sections were 4.8% and 11.8%, respectively. At the DOV 13.8%, the area loss rates of two types of cross-sections were 13.8% and 20.9%, respectively. In addition, it seems difficult to determine the minimum cross-section under random pitting corrosion damage due to variation in pitting features in the size, shape and location. Figure 19a shows that in the case of the double-flange corrosion, a larger residual cross-section occurred at the DOV 11.8% despite its higher level of pitting damage compared with the DOV 8.8%. This influenced the strength reduction concurrently with a significant variation in the strength of randomly pitted structures [25].
Local buckling may occur in the flange and web of H-section columns if the width-to-thickness ratio of a plate is h0/tw > 33εk for the web, and bf/tf > 9εk/α for the flanges (where ε k = 235 / f y and α = 0.5) in line with the European Standard [27]. Based on the equivalent thickness determined by Equation (4), the width-to-thickness ratios of all the randomly pitted columns were checked. It was found that the resistance of local buckling was good enough for the web of the columns, but the thinner flanges may not meet the local buckling criteria due to pitting corrosion. For example, in the column with a flange thickness of 7.5 mm (H7.5 × 7.5−DF + W−13.8%), the limitation of local buckling in the intact column was bf/tf = 9εk/α = 14.0, while the width-to-thickness ratio of the pitted column was actually 14.8, signifying that the local buckling took place in the damaged column.
Figure 20 illustrates the load–displacement curves of the column obtained from the models with random pitting corrosion and the equivalent thickness. The ultimate load of the random pitting model was Fu = 1061 kN, which was larger than that of the equivalent thickness model, Fue = 1021 kN. There was no significant disparity in the load–displacement behavior of the two types of models before the ultimate state. However, at the post-collapse stage, the random pitting model showed a significantly better resistance to axial deformation.
The outstand flange of an H-section column can be treated as a rectangular plate with three sides supported and one side free. The local buckling stress, σcr, can be decided by
σ c r = 0.425 + b 2 a 2 π 2 t 2 E 12 1 ν 2 b 2 .  
where a is the length of the H-section column, b is the length of the outstand flange, bf; and t is the thickness of the flange, tf.
Combining Equation (4) with Equation (13), the elastic buckling load (Fcr = Aeσcr, Ae is the cross-sectional area in terms of the σ−based equivalent thickness) can be determined to be 1006 kN. Since the Fcr is smaller than both Fue = 1021 kN and Fu = 1061 kN, the local buckling arose before the overall failure of the column H7.5 × 7.5−DF + W−13.8%, resulting in a significant reduction in the ultimate strength of the corroded column. Figure 21 illustrates the deformation (amplified by five times) during typical loading stages corresponding to those shown in Figure 20, where the deformation contour was the displacement along y axes, i.e., the height of the column. The typical loading stages referred herein to the elastic stage (40% of the ultimate load before collapse), the ultimate state and the post-collapse stage (90% of the ultimate load after collapse).
The deformation during the elastic stage was minimal for both the intact and pitted columns. However, as the ultimate state was approached, the pitted column exhibited significant deformation in its flanges, indicating the occurrence of local buckling in the column. This buckling was observed not only in the column with the equivalent thickness but also in that with random pitting corrosion. Specifically, the corrosion damage had a notable impact on the deformation behavior of the column flange during the post-collapse stage of the damaged columns. When subjected to a 10% unloading of the ultimate load, the out-of-plane deformation of the intact column’s flanges measured only 5.3 mm. In contrast, the columns with the equivalent thickness and random corrosion underwent deformations of 11.8 mm and 7.2 mm in their flanges, respectively.

5. Conclusions

Compressive behavior and ultimate strength of randomly pitted H-section stub columns were numerically investigated under various corrosion patterns and different levels of pitting intensities, using a proposed method for modeling random pitting corrosion. This study verified different approaches to address the thickness loss resulting from random pitting corrosion, according to current design standards. Additionally, stochastic simulations were used to elucidate the degradation law of compressive strength, and the mechanism of structural failure in randomly pitted H-section columns. The following conclusions can be drawn.
(1)
The proposed modeling method can replicate the impact of random pitting corrosion on compressive strength and failure behavior of damaged H-section stub columns. It leads to availability to reflect the variation in compressive strength caused by the random nature of pitting corrosion that is not captured by the method based on simplified regular corrosion pits or uniform corrosion.
(2)
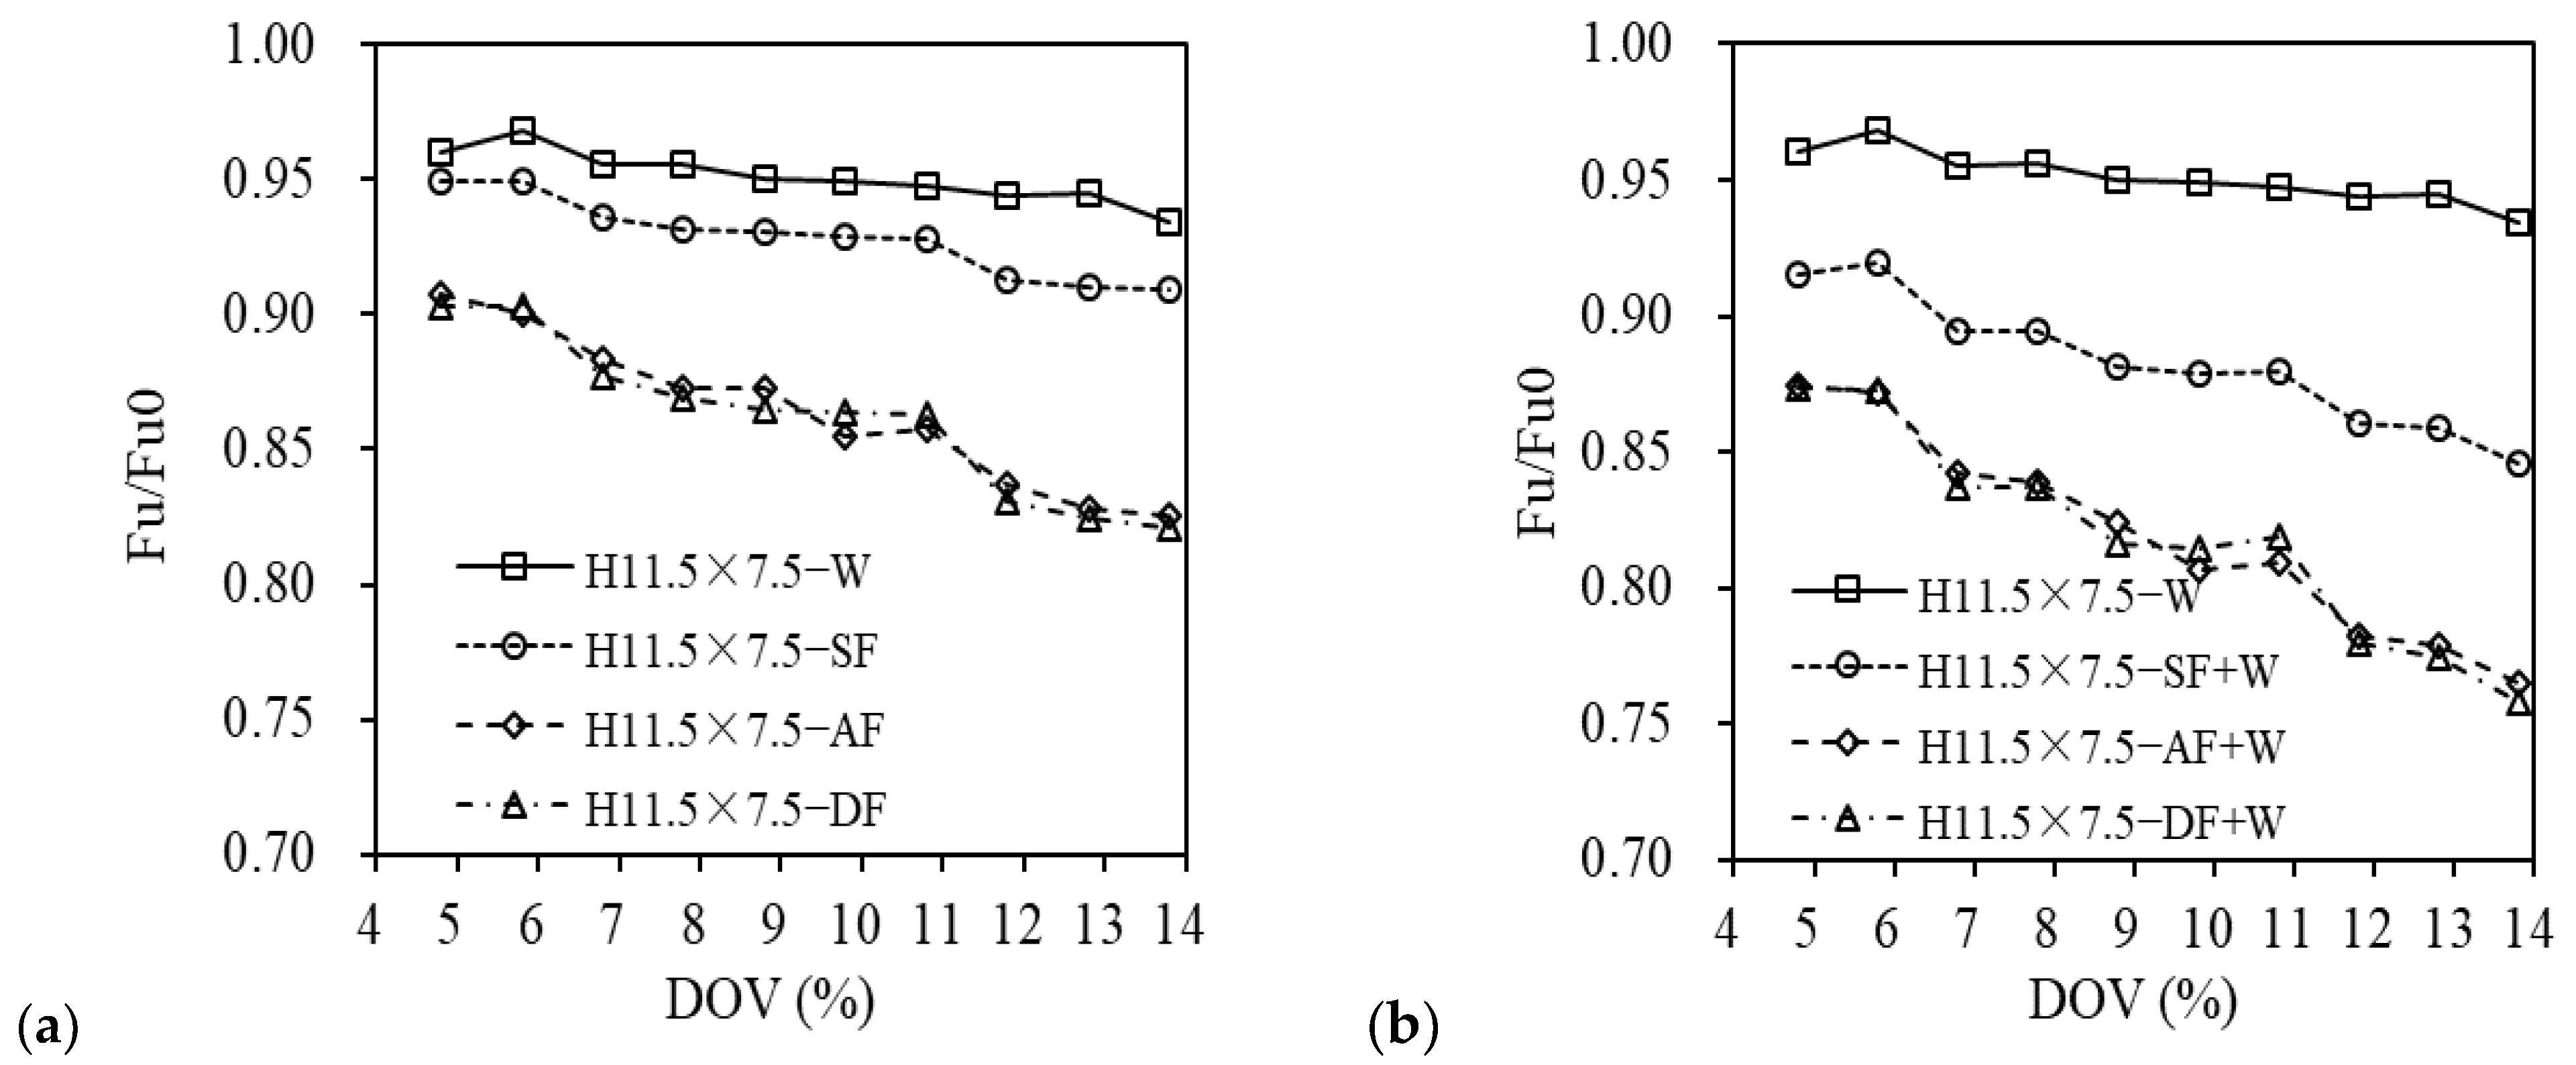
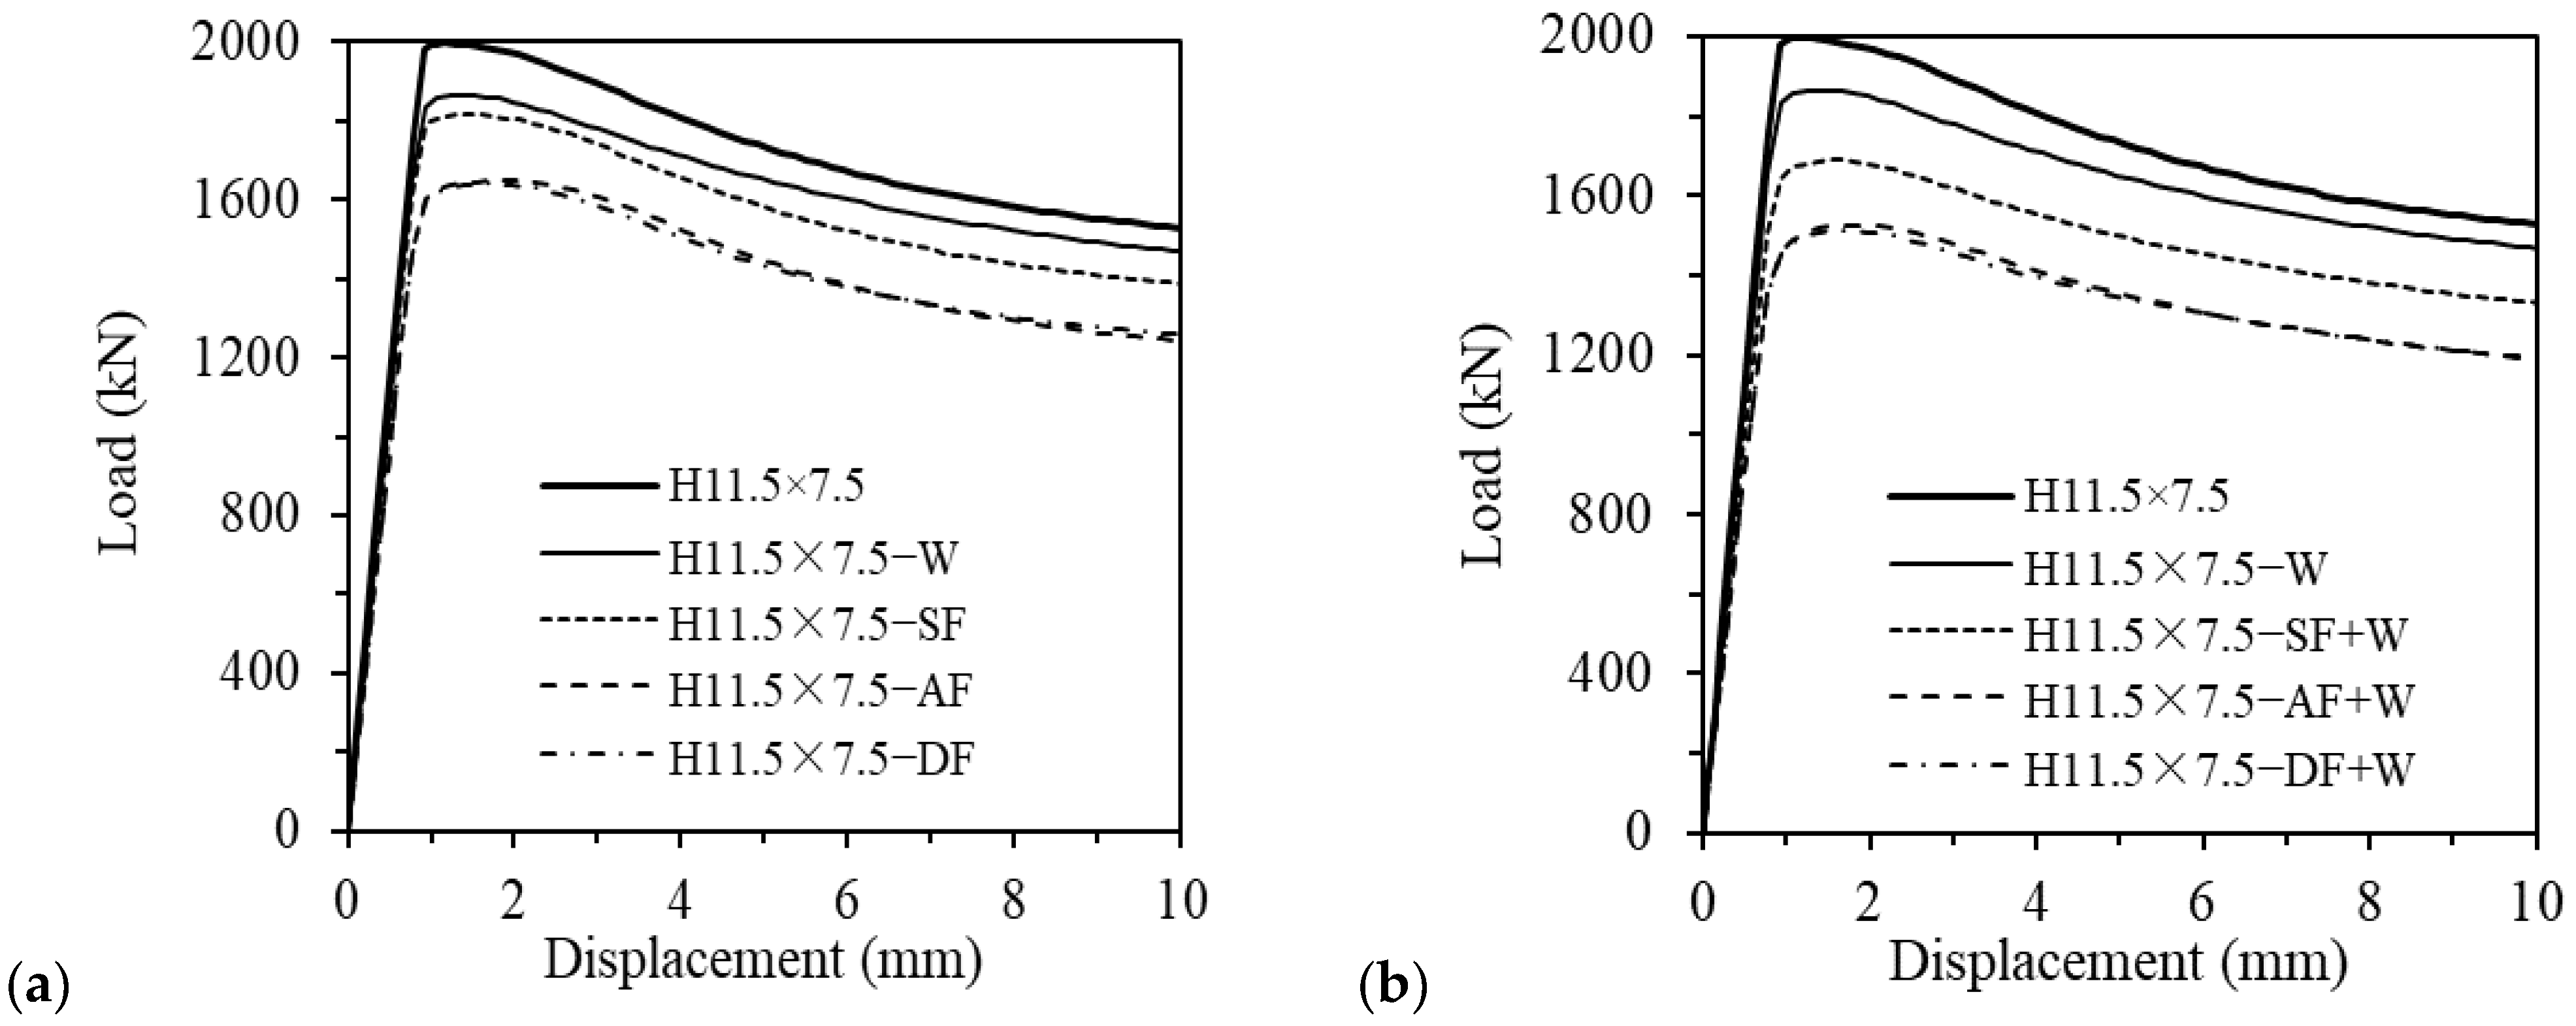
Corrosion damage on the column flange causes more reduction in ultimate strength and axial stiffness than that on the column web. For the columns with corrosion damage simultaneously on web and flange plates, the reductions in strength and stiffness can be linearly superposed by the reductions in the strength and stiffness of individual plates. For the columns studied herein at the DOV 13.8%, the reduction in strength was up to 24.2%, and the reduction in stiffness was about 19.9%.
(3)
The ratios of width-to-thickness for both flange and web plates have a negligible effect on the strength reduction in a damaged column since the change in such ratios only causes less than a 3% strength variation, which is smaller than that caused by random nature of pitting corrosion. However, the column with a larger width-to-thickness ratio may locally buckle due to random pitting corrosion, thereby altering failure mode, with a significant strength reduction.
(4)
The equivalent thickness method that induces −1.25 times standard deviation of pit depth to account for uneven material loss caused by random corrosion pits, plus the uniform thickness loss, yields a relatively accurate prediction, based on the Chinese and European Standards. For different sizes of flange and web plates under pitting corrosion damage at the DOV less than 9%, the maximum relative error of predicted results was no more than 5%.
It is noteworthy that both Chinese and European standards are applicable only within a certain level of pitting intensity and closely related to the web and flange thickness of columns. The empirical formula proposed for plated structures applies to compressive strength prediction of randomly pitted columns, which can consider the uncertainty of strength reduction caused by random nature of pitting corrosion. In addition, based on the proposed modelling method, the statistical features of residual strength of randomly pitted columns can be clarified in further research.

Author Contributions

Conceptualization, R.W.; methodology, R.W.; software, F.W.; validation, F.W. and R.W.; investigation, F.W. and R.W.; data curation, F.W. and J.J.; writing—original draft preparation, F.W. and J.J.; writing—review and editing, R.W.; supervision, R.W.; project administration, R.W.; funding acquisition, F.W. and R.W. All authors have read and agreed to the published version of the manuscript.

Funding

This research was funded by [Postgraduate Research & Practice Innovation Program of Jiangsu Province] grant number [SJCX23_2223].

Institutional Review Board Statement

Not applicable.

Informed Consent Statement

Not applicable.

Data Availability Statement

Not available due to privacy or ethical restrictions.

Conflicts of Interest

The authors declare no conflict of interest.

References

  1. Cheng, X.; Du, H.; Shi, X.; Mansour, M. Ultimate biaxial bending resistance of H-section steel members under different loading paths. J. Constr. Steel Res. 2023, 200, 107678. [Google Scholar] [CrossRef]
  2. Zhao, Z.; Liu, J.; Wang, B.; Gao, Y. Post-buckling shear capacity of the corroded end panels of H-shaped steel beams. Thin-Walled Struct. 2023, 184, 110499. [Google Scholar] [CrossRef]
  3. Refani, A.N.; Nagao, T. Corrosion effects on the mechanical properties of spun pile materials. Appl. Sci. 2023, 13, 1507. [Google Scholar] [CrossRef]
  4. Zhang, S. A review and study on ultimate strength of steel plates and stiffened panels in axial compression. Ships Offshore Struct. 2016, 11, 81–91. [Google Scholar] [CrossRef]
  5. Rahman, M.; Okui, Y.; Shoji, T.; Komuro, M. Probabilistic ultimate buckling strength of stiffened plates, considering thick and high-performance steel. J. Constr. Steel Res. 2017, 138, 184–195. [Google Scholar] [CrossRef]
  6. Wang, H.; Zhang, Z.; Qian, H.; Fan, F. Effect of local corrosion on the axial compression behavior of circular steel tubes. Eng. Struct. 2020, 224, 111205. [Google Scholar] [CrossRef]
  7. Wu, Z.; Wei, Y.; Wang, X.; Huang, C.; Jiang, S.-F. Mechanical behavior of circular steel tubular beam-columns corroded uniformly in atmospheric environment. Appl. Sci. 2020, 10, 1998. [Google Scholar] [CrossRef]
  8. Chegeni, B.; Jayasuriya, S.; Das, S. Effect of corrosion on thin-walled pipes under combined internal pressure and bending. Thin-Walled Struct. 2019, 143, 106218. [Google Scholar] [CrossRef]
  9. Wang, R.; Guo, H.; Shenoi, R.A. Compressive strength of tubular members with localized pitting damage considering variation of corrosion features. Mar. Struct. 2020, 73, 102805. [Google Scholar] [CrossRef]
  10. Wang, R.; Shenoi, R.A. Experimental and numerical study on ultimate strength of steel tubular members with pitting corrosion damage. Mar. Struct. 2019, 64, 124–137. [Google Scholar] [CrossRef]
  11. Karagah, H.; Shi, C.; Dawood, M.; Belarbi, A. Experimental investigation of short steel columns with localized corrosion. Thin-Walled Struct. 2015, 87, 191–199. [Google Scholar] [CrossRef]
  12. Zhang, Z.; Xu, S.; Wang, Y.; Nie, B.; Wei, T. Local and post-buckling behavior of corroded axially-compressed steel columns. Thin-Walled Struct. 2020, 157, 107108. [Google Scholar] [CrossRef]
  13. Sheng, J.; Xia, J.; Chang, H. Bending behavior of corroded H-shaped steel beam in underground environment. Appl. Sci. 2021, 11, 938. [Google Scholar] [CrossRef]
  14. Zhao, Z.; Gao, T.; Liu, J.; Dai, B.; Gao, H. Local bearing capacity of steel beam webs with random pit corrosion. Structures 2023, 48, 1259–1270. [Google Scholar] [CrossRef]
  15. Zhang, J.-Z.; Chen, L.; Liu, S.-W.; Yam, M.C.H. Efficient elastic buckling assessment algorithm for steel members with random non-uniform corrosion. Eng. Struct. 2022, 266, 114550. [Google Scholar] [CrossRef]
  16. Su, A.; Zhao, O. Experimental and numerical investigations of S960 ultra-high strength steel slender welded I-section columns failing by local–flexural interactive buckling. Thin-Walled Struct. 2022, 180, 109898. [Google Scholar] [CrossRef]
  17. Yin, F.; Yang, L.; Xu, K.; Wang, J.; Fan, J. Tests, numerical study and design of Q1100 ultra-high strength steel welded I-section stub columns. Eng. Struct. 2022, 269, 114812. [Google Scholar] [CrossRef]
  18. Jia, C.; Zhong, L.; Shao, Y.; Li, J.; Guo, L. Experimental and numerical investigations of Q690 high-strength steel welded I-section columns with pitting corrosion. Thin-Walled Struct. 2023, 190, 110961. [Google Scholar] [CrossRef]
  19. DNV Class Notes 72.1; Allowable Thickness Diminution for Hull Structure. DNVGL: Albany, NY, USA, 2014.
  20. Nakai, T.; Matsushita, H.; Yamamoto, N. Effect of pitting corrosion on the ultimate strength of steel plates subjected to in-plane compression and bending. J. Mar. Sci. Technol. 2006, 11, 52–64. [Google Scholar] [CrossRef]
  21. Melchers, R.E. Extreme value statistics and long-term marine pitting corrosion of steel. Probab. Eng. Mech. 2008, 23, 482–488. [Google Scholar] [CrossRef]
  22. Zhang, Y.; Huang, Y.; Wei, Y. Ultimate strength experiment of hull structural plate with pitting corrosion damage under unaxial compression. Ocean Eng. 2017, 130, 103–114. [Google Scholar] [CrossRef]
  23. Wang, R.; Lin, S.; Dou, P. Statistical constitutive model of steel in randomly pitted structures. Ocean Eng. 2022, 243, 110211. [Google Scholar] [CrossRef]
  24. Kong, W.; Lin, Q.; Zhang, X.; Chen, Y. Test on axial compression performance of perforated welded H-shaped steel stub column. J. Constr. Steel Res. 2022, 191, 107191. [Google Scholar] [CrossRef]
  25. Wang, R.; Shenoi, R.A.; Sobey, A. Ultimate strength assessment of plated steel structures with random pitting corrosion damage. J. Constr. Steel Res. 2018, 143, 331–342. [Google Scholar] [CrossRef]
  26. GB50017−2017; Standard for Design of Steel Structures. China Architecture & Building Press: Beijing, China, 2017. (In Chinese)
  27. EN 1993−1−1; Eurocode 3: Design of Steel Structures—Part 1-1: General Rules and Rules for Buildings. European Committee for Standardisation: Brussels, Belgium, 2004.
  28. Application Guide for Corrosion Limits and Replacement Criteria for Offshore Mobile Platforms; China Classification Society: Beijing, China, 2023. (In Chinese)
Figure 1. Steel columns with random pitting corrosion in a marine environment [9]. (a) Tubular section; (b) H-section.
Applsci 13 11051 g001
Figure 2. Flowchart of modelling the randomly pitted H-section column.
Applsci 13 11051 g002
Figure 3. H-section analysis model: (a) distribution of pit depth; (b) distribution of pit diameter; (c) size parameters of H-section; and (d) H-section with random corrosion pits.
Applsci 13 11051 g003
Figure 4. Schematic diagram of corrosion pattern of H-section columns: (a) single-flange corrosion (SF); (b) double-flange corrosion (DF or AF); and (c) web corrosion (W).
Applsci 13 11051 g004
Figure 5. Mesh convergence study: (a) load–displacement curves; (b) ultimate loads and computing time.
Applsci 13 11051 g005
Figure 6. Comparison between tests and numerical analyses of perforated columns: (a) ultimate loads; (b) load–displacement curves; (c) failure mode of intact column; and (d) failure mode of perforated column.
Applsci 13 11051 g006
Figure 7. Residual ultimate strength under different corrosion patterns: (a) flange and web corrosion; (b) combined corrosion.
Applsci 13 11051 g007
Figure 8. Load–displacement curves of H-section columns under diverse corrosion patterns: (a) flange and web corrosion; (b) combined corrosion.
Applsci 13 11051 g008
Figure 9. Axial stiffness under various corrosion patterns: (a) flange or web corrosion; (b) combined corrosion.
Applsci 13 11051 g009
Figure 10. Failure modes of intact and randomly pitted columns (stress contour unit: MPa): (a) intact column; (b) column at DOV 13.8%.
Applsci 13 11051 g010
Figure 11. Influence of flange width-to-thickness ratio on ultimate strength: (a) tw = 7.5 mm; (b) tw = 9.5 mm.
Applsci 13 11051 g011
Figure 12. Influence of web width-to-thickness ratio on ultimate strength: (a) tf = 7.5 mm; (b) tf = 11.5 mm.
Applsci 13 11051 g012
Figure 13. Ultimate strength of H-section columns with equivalent thickness: (a) different flange thickness; (b) different web thickness.
Applsci 13 11051 g013
Figure 14. Ultimate strength of corroded columns based on pit depth σ−based equivalent thickness: (a) different flange thickness; (b) different web thickness.
Applsci 13 11051 g014
Figure 15. Comparison of ultimate strength for corroded columns: (a) different flange thickness; (b) different web thickness.
Applsci 13 11051 g015
Figure 16. Comparison of ultimate strength for H-section columns with openings.
Applsci 13 11051 g016
Figure 17. Ultimate strength of columns with random pitting corrosion: (a) H7.5 × 7.5; (b) H11.5 × 7.5; (c) H11.5 × 9.5; and (d) collected data.
Applsci 13 11051 g017
Figure 18. Variation of cross-sectional area of a corroded column (H11.5 × 7.5) along its length: (a) double-flange corrosion; (b) double-flange combined corrosion.
Applsci 13 11051 g018
Figure 19. Comparison between the average and minimum cross-sectional area of a corroded column (H11.5 × 7.5): (a) double-flange corrosion; (b) double-flange combined corrosion.
Applsci 13 11051 g019
Figure 20. Load–displacement curve of H-section columns (H7.5 × 7.5).
Applsci 13 11051 g020
Figure 21. Failure modes of H-section columns (H7.5 × 7.5) (displacement contour unit: mm): (a) intact model; (b) equivalent thickness model; and (c) random corrosion model.
Applsci 13 11051 g021
Table 1. Location and length of half-wave of intact and randomly pitted columns.
No.DOV (%)lmin (mm)lver (mm)l (mm)
H11.5 × 7.50270276
H11.5 × 7.5−DF4.8224228261
6.8283288287
8.8280288340
11.8263270319
13.838269266
H11.5 × 7.5−DF + W4.8313220261
6.8283288319
8.8278294293
11.8161270298
13.8269270272
Disclaimer/Publisher’s Note: The statements, opinions and data contained in all publications are solely those of the individual author(s) and contributor(s) and not of MDPI and/or the editor(s). MDPI and/or the editor(s) disclaim responsibility for any injury to people or property resulting from any ideas, methods, instructions or products referred to in the content.

