Article

A Temperature-Controlled Apparatus for Gas Permeability under Low Gas Pressure

1
Key Laboratory of Ministry of Education for Geomechanics and Embankment Engineering, Hohai University, Nanjing 210098, China
2
Geotechnical Engineering Research Center of Jiangsu Province, Nanjing 210098, China
3
Engineering Research Center of Dredging Technology of Ministry of Education, Hohai University, Changzhou 213000, China
4
Department of Civil and Environmental Engineering, Shenzhen, Harbin Institute of Technology, Shenzhen 518055, China
*
Author to whom correspondence should be addressed.
Appl. Sci. 2023, 13(19), 10943; https://doi.org/10.3390/app131910943
Submission received: 7 July 2023 / Revised: 27 September 2023 / Accepted: 27 September 2023 / Published: 3 October 2023

Abstract

:

Featured Application

Soil gas permeability in various fields.

Abstract

The measurement of soil gas permeability is influenced by the temperature and pressure fluctuation in the low gas pressure region. In order to investigate these influences, a soil temperature-controlled apparatus connected to a low-gas-pressure supply equipment is proposed in this study. The low constant gas pressure is supplied by two Mariotte bottles, by which the airflow rate is measured. Meanwhile, the soil specimen is controlled by a temperature-controlled apparatus. During the test, the negative pore water pressure and volume change of the soil specimen are measured. Through the temperature-controlled apparatus, it is observed that as the temperature increases from 25 °C to 60 °C, there is a corresponding increase in soil sample porosity by 5.4%, while the negative pressure of pore water decreases by 11.1%. This can be attributed to the reduction in the surface tension of contractile skin caused by elevated temperatures. Furthermore, due to variations in gas viscosity with temperature, there was a significant decrease in the gas flow rate by 50.5%. And, the relationship between permeability and volumetric gas content at different temperatures in low-pressure regions well confirms the existing power-law model. In addition, the existence of a temperature-independent critical negative pore water pressure is observed, beyond which the intrinsic permeability remains constant. At 36 kPa of negative pore water pressure, the intrinsic permeability at 60 °C exhibits an 81.8% reduction compared to that at 25 °C. This decline in intrinsic permeability can be attributed to a diminished pore connectivity, resulting from elevated temperatures.

1. Introduction

Similar to water permeability, gas permeability in unsaturated soil, which characterizes the capacity of gas transport, is an important hydraulic property. The gas permeability of soils is concerned in various fields, e.g., landfill gas emission and oxidation for waste landfill cover systems [1,2,3,4,5,6], soil aeration for plant growth [7,8], soil moisture distribution for land surface [9,10], three-phase (water, gas, and oil) permeability in the oil industry [11,12], and the sealing efficiency of CO2 [13,14,15]. Among these fields, the increase in gas pressure above atmospheric pressure is typically below 10 kPa and falls within the measurement range of the gas supply equipment (20 kPa). In the field of landfill, the gas pressure generated by anaerobic decomposition of organic waste under the cover system is usually less than 10 kPa [16]. Likewise, in the agricultural field, the applied gas pressure for measuring soil permeability is recommended to be lower than 8 kPa (that corresponds to a single water column of 0.80 m high) [7]. The gas pressure driven by the water vapor pressure gradient and dry air density gradient during the migration of moisture in the soil is usually about several kPa [9]. The pressure used to study gas permeability in these fields is only 0.1% to 0.05% of that required for CO2 sealing and oil extraction. For example, in the field of CO2 sealing, the gas breakthrough pressure of mudstone in the gas reservoir sealing area can reach several MPa [17]. The gas injection pressure in low-permeability reservoirs in the oil extraction has also reached 10–20 MPa [18]. Therefore, it is necessary to develop a special low-pressure supply equipment suitable for triaxial permeameters.
Soil gas permeability and water permeability are the characterizations of the intrinsic permeability of different fluid media under given environmental conditions. Therefore, the study of gas permeability can draw lessons from the study of water permeability. The water permeability is mainly affected by two aspects, namely the change of water viscosity and adsorbed water content [19]. Both of them are greatly affected by temperature, which directly affects the viscosity of water and leads to the transformation of adsorbed water to free water [20]. However, unlike water, the compressibility of gas cannot be ignored. Therefore, when studying gas permeability, it is necessary to fix the gas pressure to accurately study the impact of temperature. In the fields with low gas pressure mentioned above, its temperature will vary within a certain range. Due to the heat generated by degradation in the landfill, the temperature inside the landfill varies dynamically over time and can reach 65 °C [21,22]. In agriculture, the temperature of soil and air changes with the change of temperature day and night [23]. Currently, few published studies consider the impact of temperature on the permeability of unsaturated soil.
Gas permeameters can be categorized into two types based on the type of gas pressure applied: transient and steady states. The transient test method uses a gas pressure that is not constant, meaning that the density of the gas is in a state of fluctuation, which is relatively inaccurate in determining the gas flow [24]. The gas pressure applied to the soil sample used in the steady-state test method is fixed, so the steady-state test method is more favorable. Table 1 summarizes the technology parameters of air steady-state devices for determining soil air permeability, including solid-wall permeameters, flexible wall permeameters, and triaxial permeability instruments. The homemade devices have a simple structure, but a lack of ability to apply confining and principal pressures, a wide range of gas pressure fluctuations (±15%), and low testing accuracy for the edge gas leakage [25,26,27]. The solid-wall permeameter addresses the issue of low testing accuracy through thoughtful design and processing machining, but still cannot solve the problems of applying pressure, temperature control, and high fluctuation gas pressure (1.5 kPa) [28,29]. Given these limitations, the flexible wall permeameter is proposed. Although it can measure the volume change of soil samples using a flexible wall cell and apply confining pressure, it still does not solve the problem of gas pressure fluctuation (15 kPa) [30,31,32,33,34]. Compared with the flexible wall permeameter, although the triaxial permeameter does not solve the problem of gas pressure fluctuation (3.2 kPa), it is widely used due to its high testing accuracy and the ability to apply confining pressure and principal pressure [35,36,37,38,39]. By developing a gas supply device with two Mariotte bottles [40] as the core component, Chen et al. (2021) effectively addressed the gas pressure fluctuation under low pressures (20 kPa), simplified the measurement of gas flow velocity, and improved the gas pressure supply accuracy to 0.01 kPa [24]. The triaxial permeameter incorporating the gas supply equipment has also been successfully utilized in multiple published studies under low pressures, demonstrating its efficacy and scientific value [24,32,41]. The temperature-dependent triaxial permeameter proposed in this paper is a modification of the triaxial permeameter developed by Chen et al. (2021). However, the ability to control temperature is not available in these permeameters. Furthermore, considering that temperature significantly affects gas viscosity [42,43,44,45] and consequently permeability, further investigation into the influence of this variable on low-pressure gas permeability is warranted. Therefore, utilizing the current apparatus to measure gas permeability with low-level gas pressure poses a challenge.
The existing permeameters suffer from the drawbacks of unstable gas supply and uncontrolled soil sample temperature under low pressure, thereby limiting their ability to investigate the impact of temperature changes on soil under low-pressure conditions. To address these limitations, a triaxial permeameter incorporating a temperature control device and a proven gas supply equipment is proposed. This device enables a series of tests to be conducted on soil gas permeability. By utilizing this triaxial permeameter, the measurement and verification of soil gas permeability under different temperatures can be achieved even at low levels of gas pressure. The subsequent section provides a detailed description of the design of this novel permeameter, followed by a series of soil gas permeability tests conducted with the osmometer. The testing procedure is then described. Ultimately, the test results are discussed to substantiate the reliability and significance of the permeameter.

2. Materials and Methods

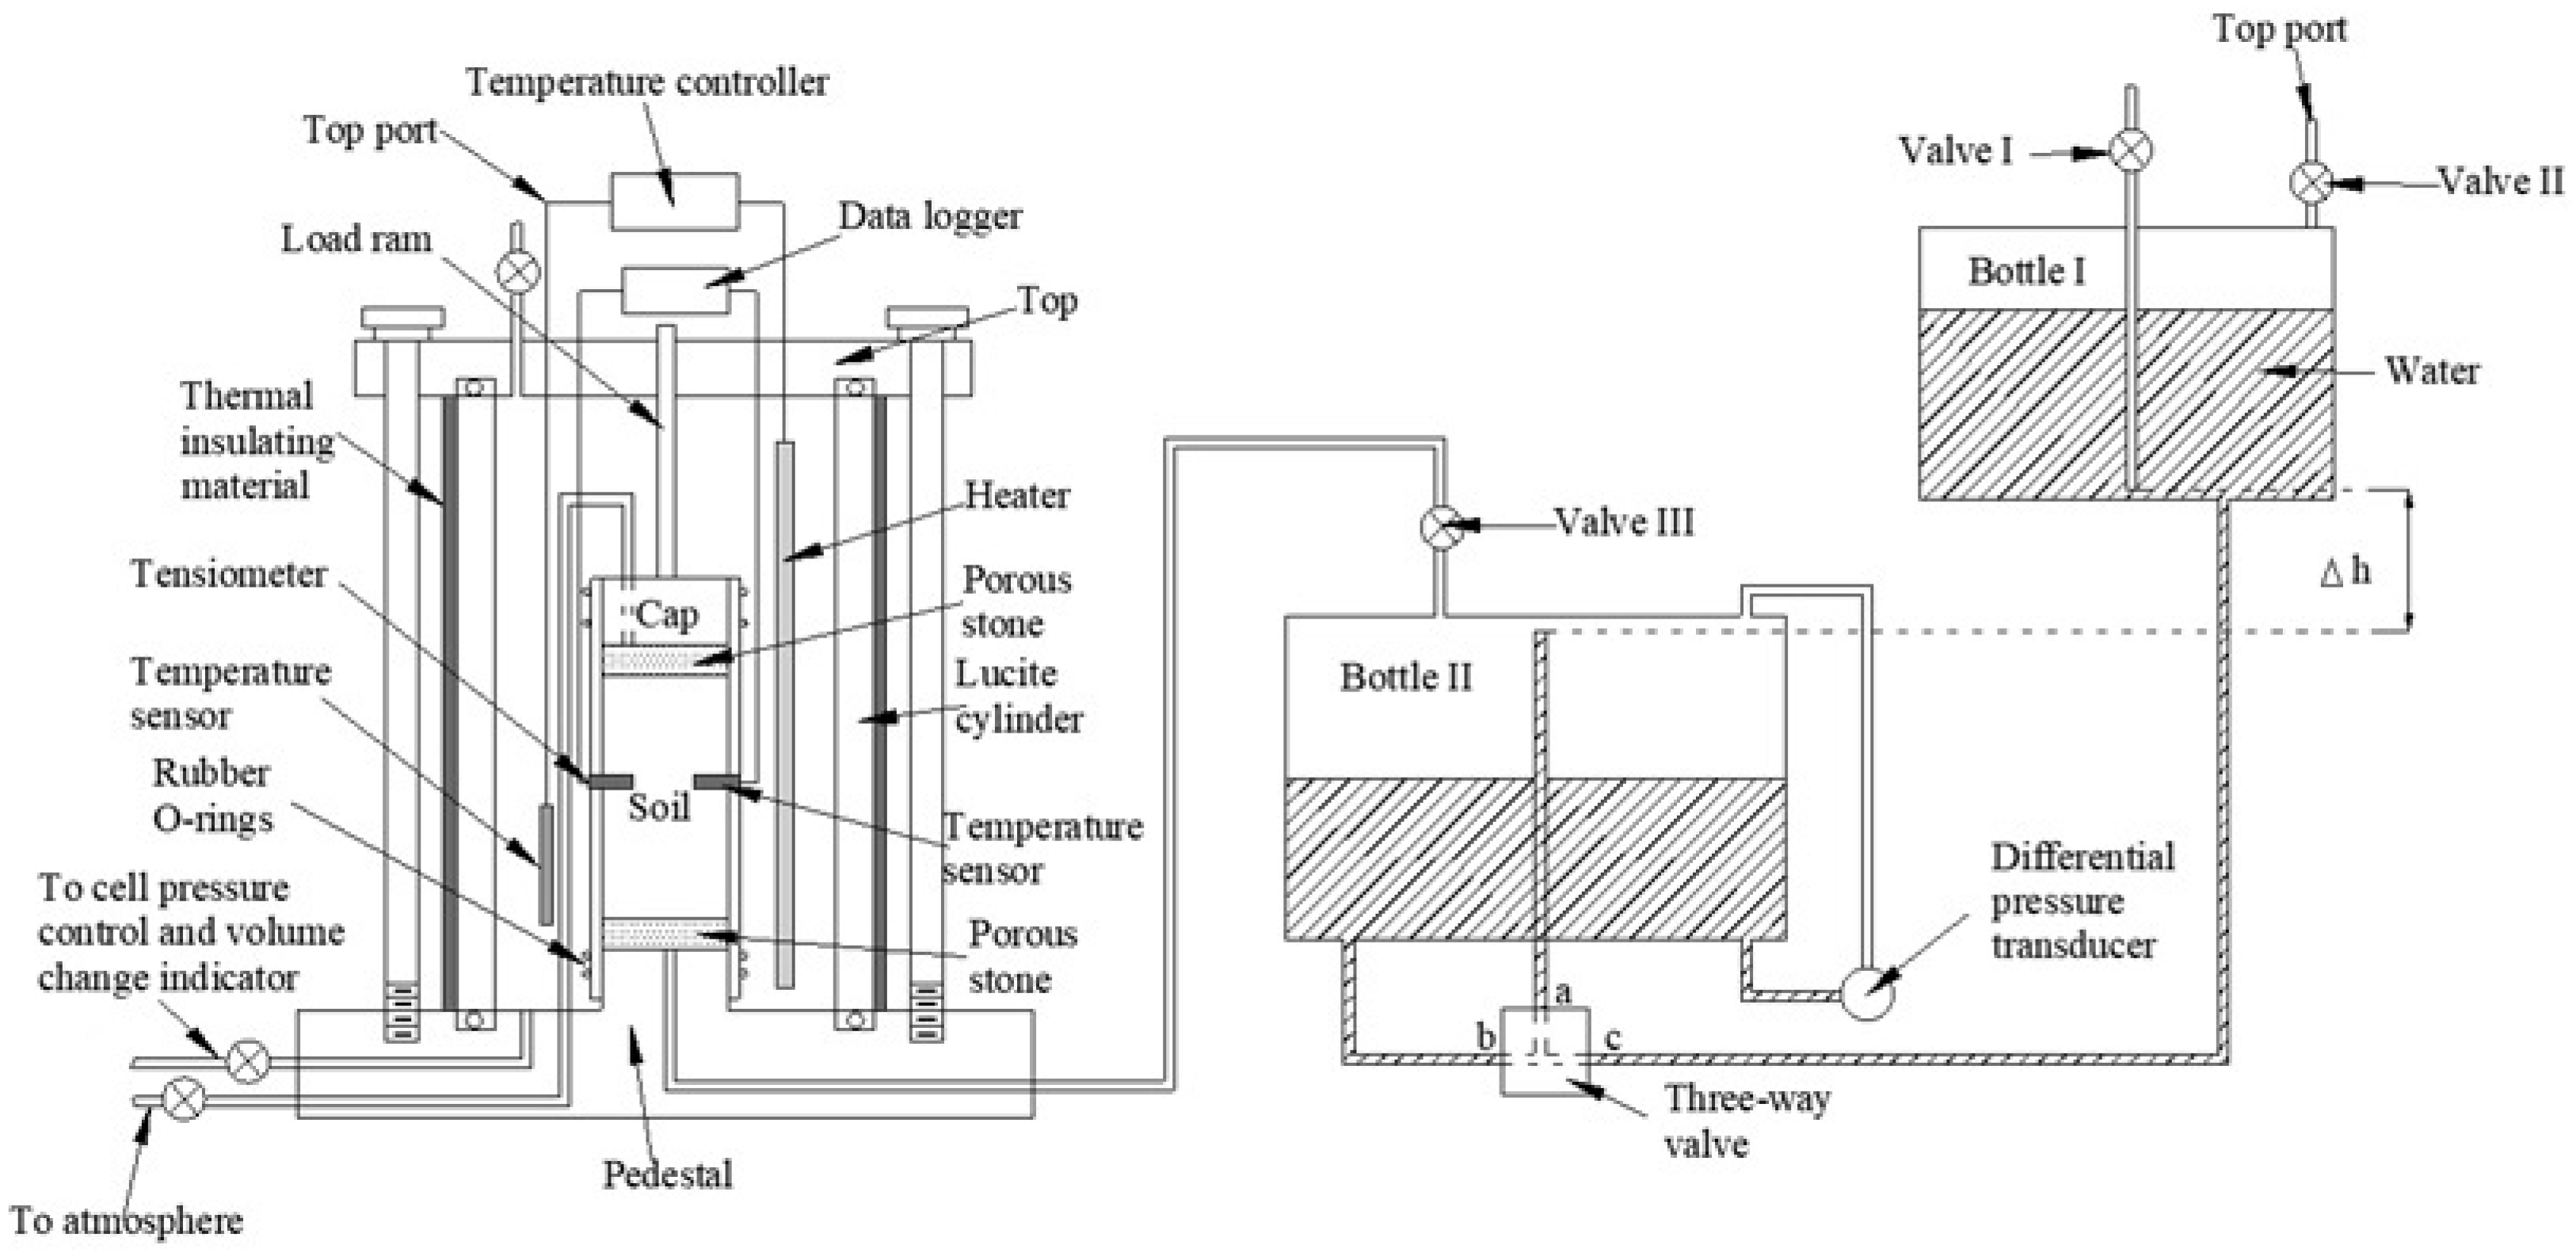
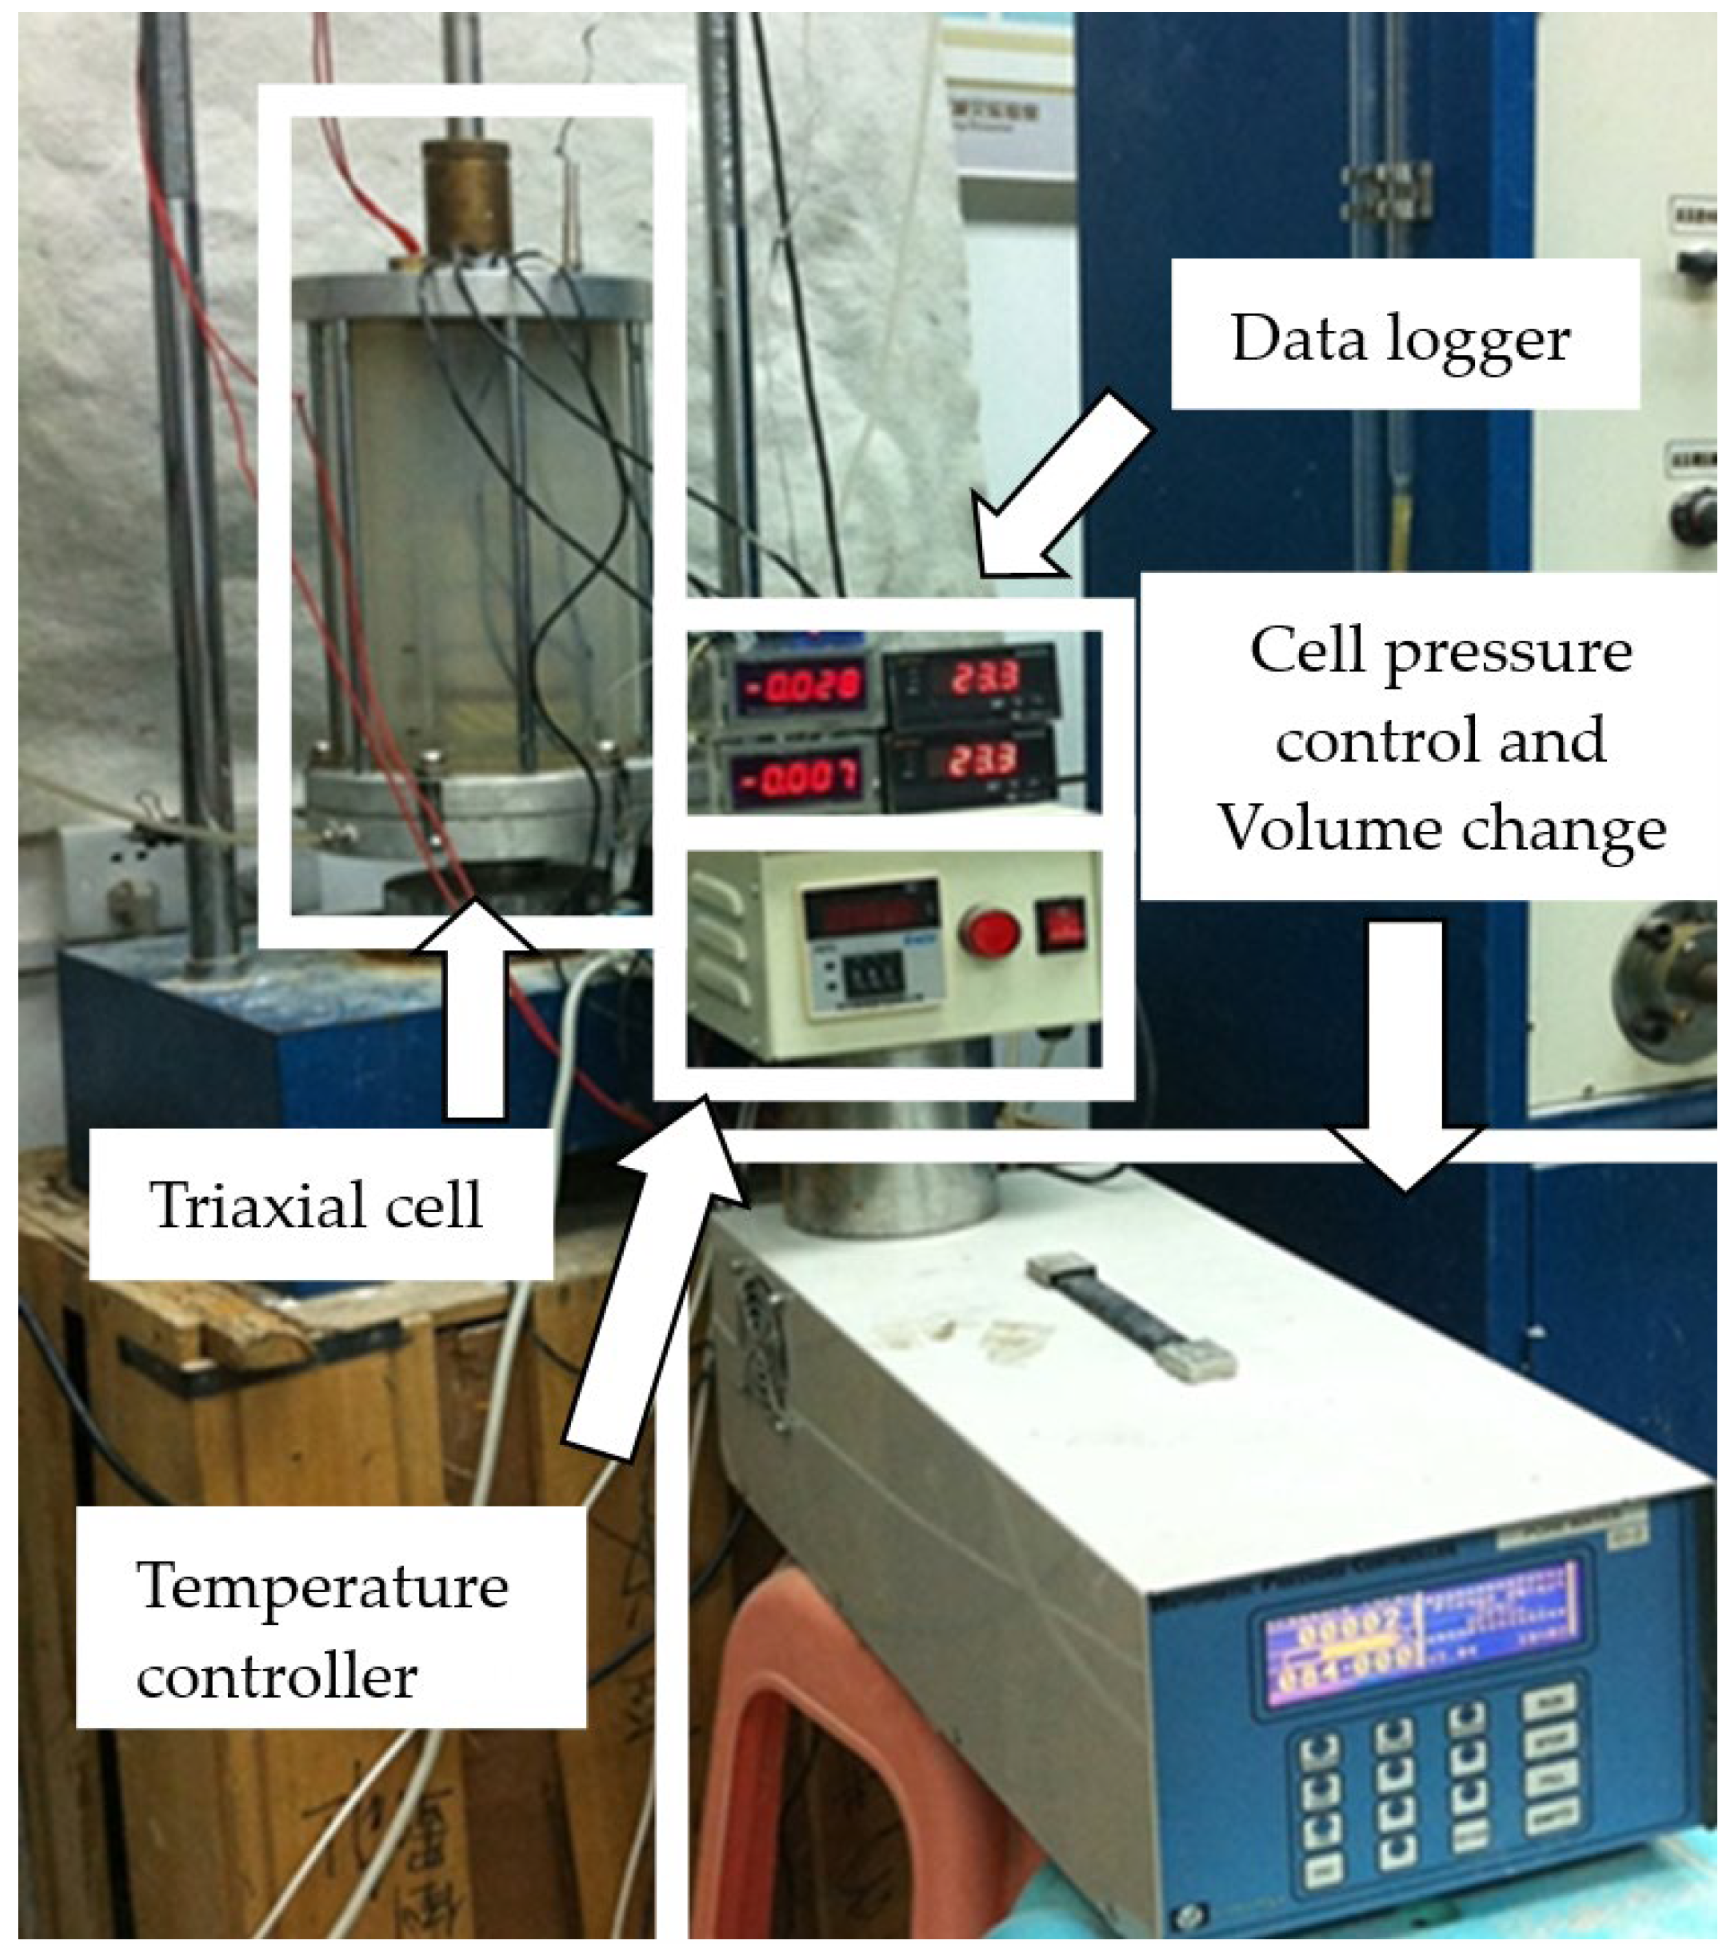
2.1. Low-Gas-Pressure Supply Equipment for Soil Gas Permeability Measurement

The apparatus for soil gas permeability measurement is improved by a triaxial cell connecting a low-gas-pressure supply equipment, as shown in Figure 1. The low-gas-pressure supply equipment contains two Mariotte bottles (Bottles I and II), a differential pressure transducer, and a three-way valve, as shown in Figure 2. The function of the Marriott bottle is to output the liquid under a constant water head regardless of the changing depth in the bottle. In order to guarantee the accurate measurement of gas output as the volume of water outflow, thereby ensuring gas compression stability, two Marriott Bottles are employed in the gas supply equipment. Bottle I stands upright, whereas Bottle II stands upside down. When Bottle I is relatively higher than Bottle II, the connection between the pipe and the Mariotte bottle ensures that the water pressure from Bottle I is balanced with the gas pressure from Bottle II. The establishment of this equilibrium leads to the compression of gas in Bottle II, resulting in a stable volume. Consequently, the gas pressure remains constant until all the liquid in Bottle I has been exhausted. Therefore, the gas pressure in Bottle II remains constant. In the study, the diameter of each bottle is 330 mm, whereas its height is 300 mm. In the two bottles, water is used to supply gas pressure, and thus, Bottle I is h higher than Bottle II. According to the principle of Mariotte bottle for constant pressure, h is determined as follows:
h = P s ρ w g
where P s is the desired gas pressure for supplying the triaxial cell, g is gravitational acceleration, and ρ w is water density. In the study, a forklift is used to provide h , as shown in Figure 2. h is 2 m to supply the gas pressure of 20 kPa.
Not only can these two bottles supply the constant gas pressure, but also the volume change and rate of the supplied gas can be measured. As the water flows from Bottle I to Bottle II, the total volume of the supplied gas, V a , equals the increased volume of the water in Bottle II, V w :
V a = V w
The gas flow rates can be calculated by the differentiation of the volume change with respect to time:
υ a = d V a d t
where υ a is gas flow rate and t is time. Combining Equations (2) and (3), we obtain:
υ a = d V w d t
In the study, V w is measured by a differential pressure transducer. Unlike traditional apparatus, it is not necessary that the gas outlet in the triaxial cell connects a series of bubble flow meters to measure gas flow rates [46,47]. It is noted that a three-way valve is installed between Bottles I and II, which is designed to reuse these two Mariotte bottles. Before any test, all water should be stored in Bottle I. Valve I is opened, whereas valves II and III are closed. For the three-way valve, a is connected to c. In this condition, the two Mariotte bottles are able to supply the constant gas pressure. As the gas in Bottle II flows into the soil specimen, the water also flows from Bottle I to Bottle II. When all water is at Bottle II, the two Mariotte bottles cannot supply the gas anymore. In order to reuse these two Mariotte bottles, valve I is closed, whereas valves II and III are opened. Valve III is connected to the atmosphere, but valve II to a vacuum pump. For the three-way valve, b is connected to c. With the help of the vacuum pump, water flows back to Bottle I and the two Mariotte bottles can supply the constant gas pressure again.
In the triaxial cell, with the cell pressure and load control, the desired stress state and stress path can be imposed to the soil specimen, as shown in Figure 3. For the cell control, a pressure/volume controller is used to apply constant cell pressure and meanwhile measure the volume change of the soil specimen. The accuracy is 1 kPa for pressure and 1 mm3 for volume. To measure the pore water pressure of the soil specimen, a high-capacity tensiometer is employed [48]. The high-capacity tensiometer mainly consists of a high-gas-entry-value (500 kPa) ceramic tip, a small water reservoir, and a diaphragm connected to a transducer. This tensiometer is able to measure a negative pore water pressure as large as 500 kPa. For each test, the triaxial system is equipped with a tensiometer for measuring the pore water pressure at the middle half of each specimen.
Considering the effect of temperature on the gas volume, a temperature-controlled system is installed between the Lucite cylinder and the soil specimen. It consists of a heater, a temperature controller, and a temperature sensor (a thermoelectrical resistance temperature sensor with an accuracy of 0.1 °C). The temperature controller is a thermostat. When the ambient temperature measured by the sensor is lower than the desired value, the thermostat closes contacts with the heater and the ambient temperature heats. As the temperature rises over the desired value, the heater is stopped and the temperature cools down. To decrease the loss of temperature, a thermally insulating material is sealed outside the Lucite cylinder. To check the temperature of the soil specimen, it is sensible to use an additional temperature sensor to measure the temperature of the middle half of each specimen.

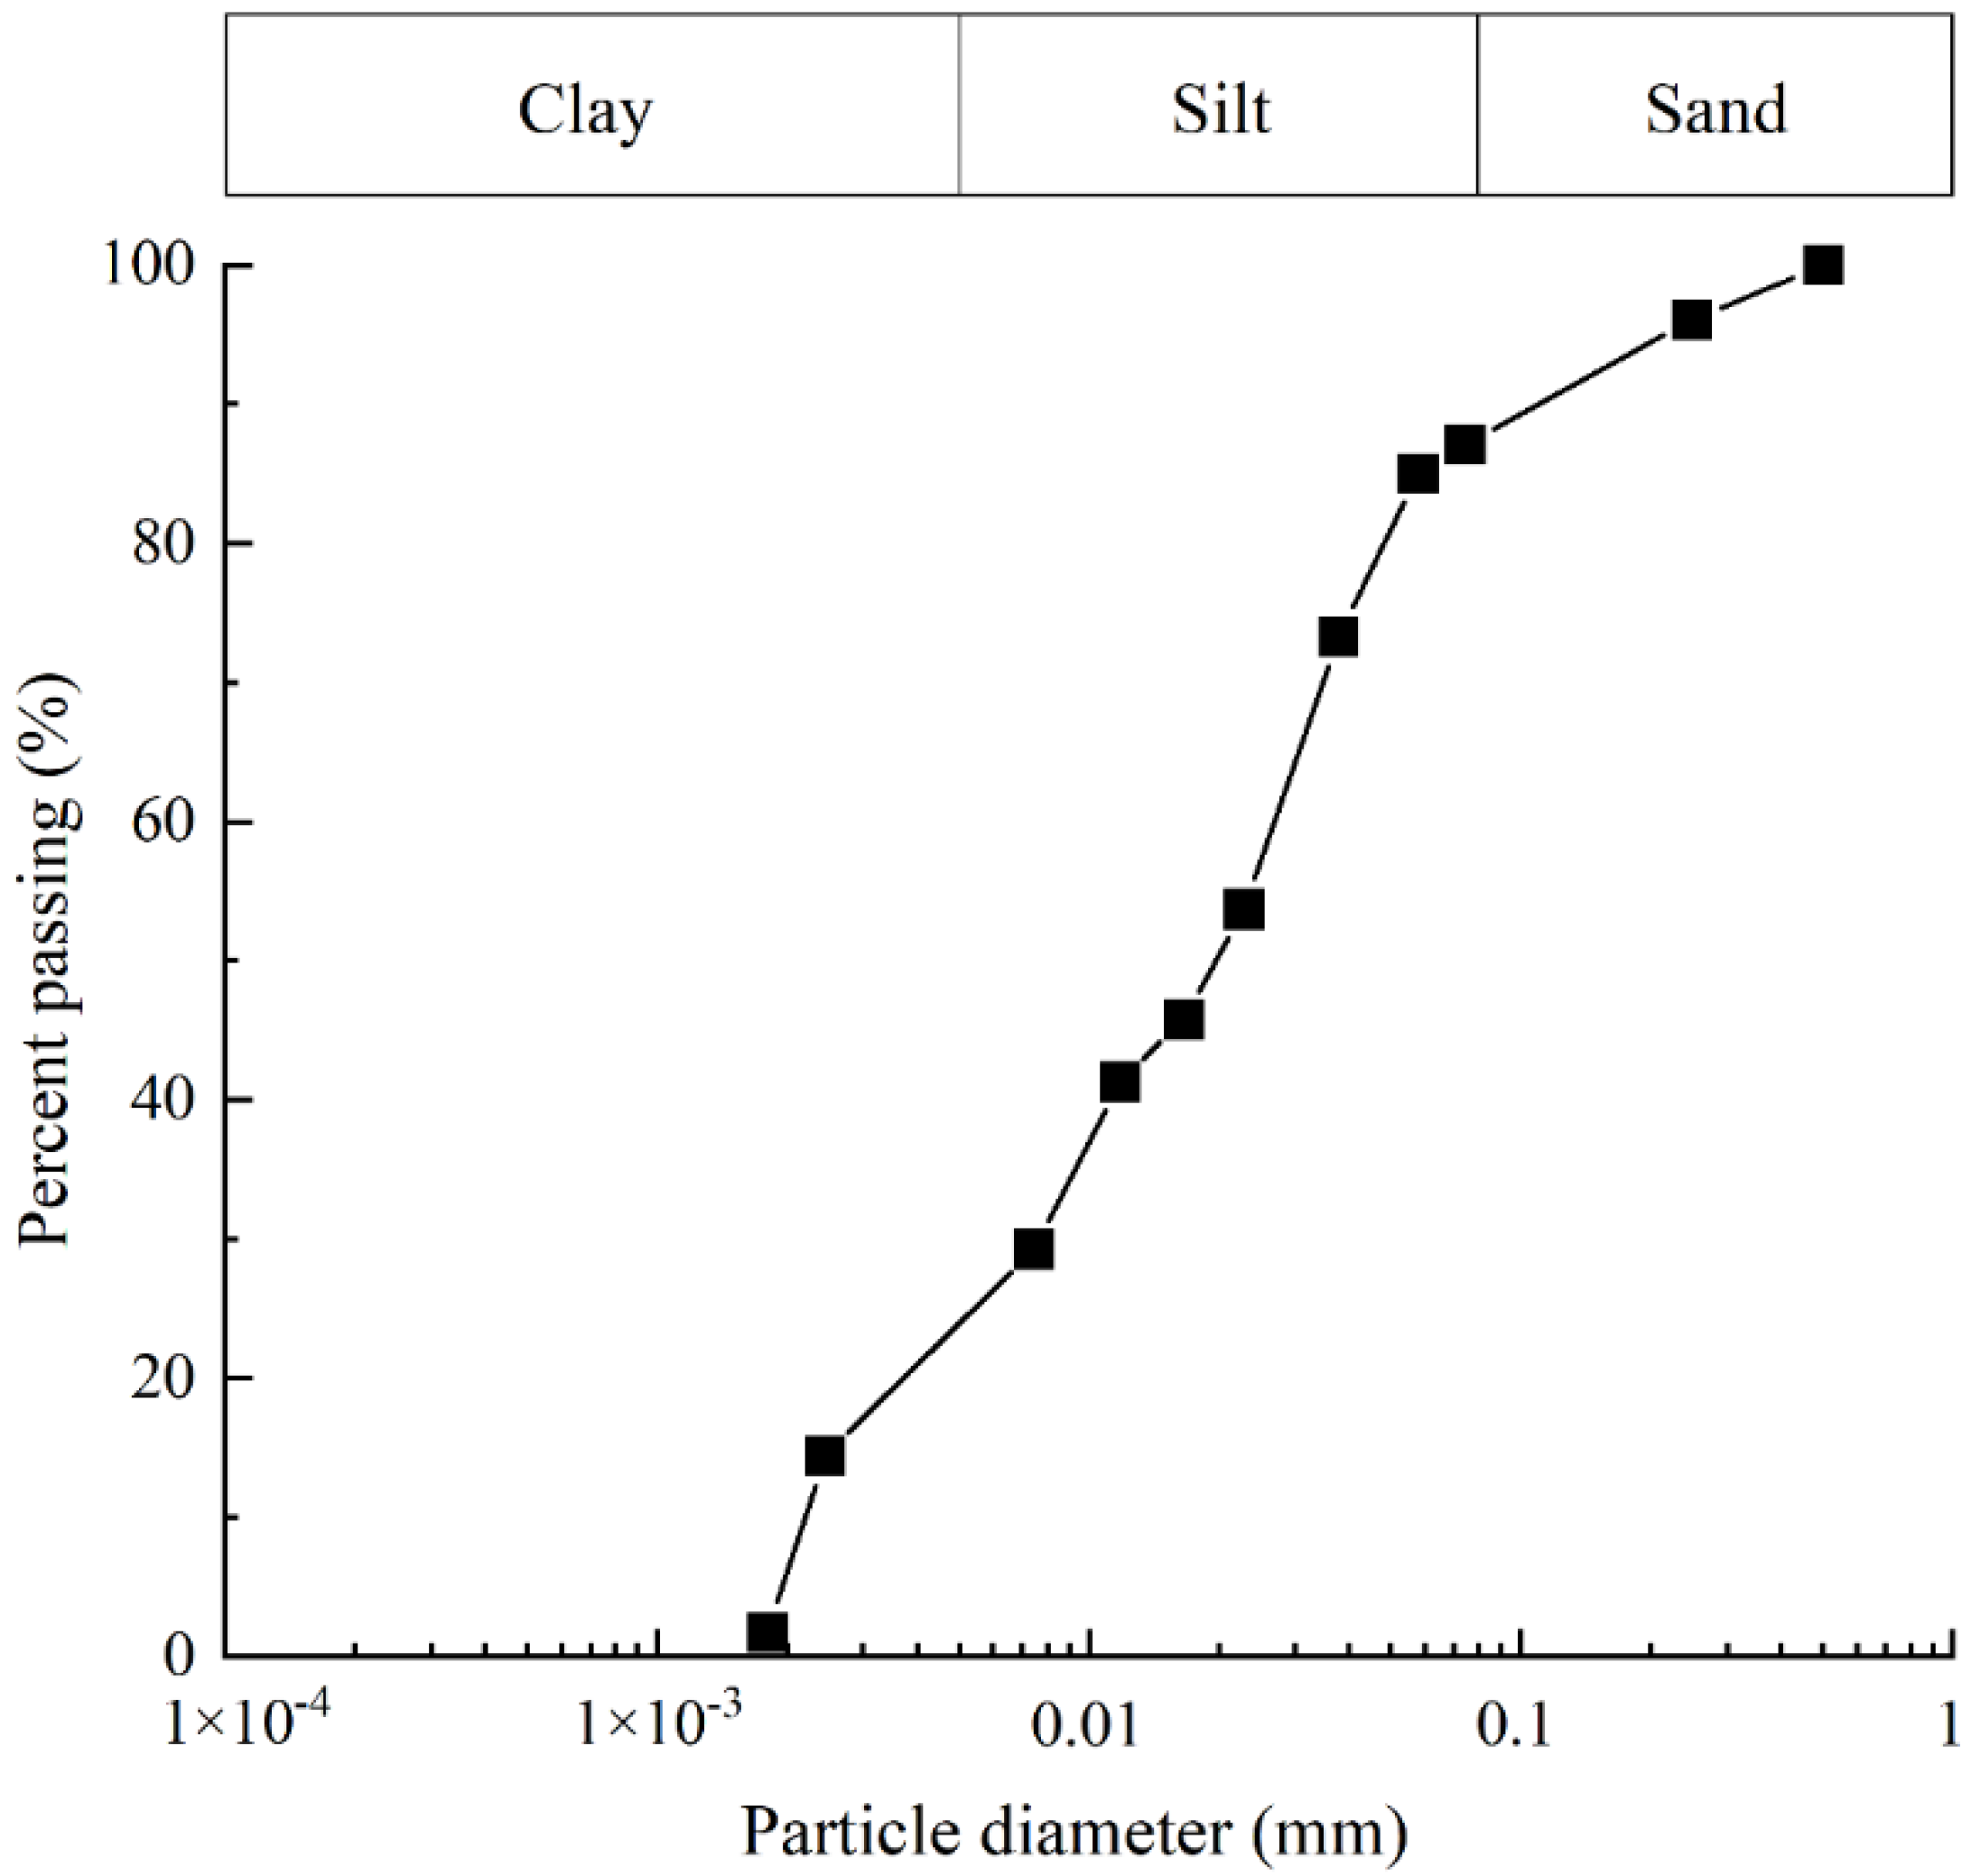
2.2. Soil Type, Specimen Preparation

The material tested is a manual soil mixed with 75% of 500-mesh quartz powder, 13% of 100-mesh quartz sand, and 12% of 800-mesh kaolin clay, as shown in Figure 4. It is described as silt (ML) according to the Unified Soil Classification System of the American Society of Testing and Materials [49]. The physical properties of the silt are summarized in Table 2.
To obtain soil specimens with identical dry density, all specimens are prepared following the same method. Deaired water is first added to oven-dried soil to obtain the optimum water content. The soil and water are mixed thoroughly. Large aggregates of soil formed during mixing are crushed using a pestle. Thereafter, the mixed soil is sieved through a 2 mm sieve and any remaining lumps of soil are again crushed with the pestle. The soil that passes through the sieve is transferred to a plastic bag, which is then sealed and kept in a temperature- and moisture-controlled room for 48 h for moisture equalization. Then, a soil specimen, 100 mm in diameter and 100 mm in height, is statically compacted in 6 layers in a mold at a loading rate of 1.5 mm/min. To prevent the excessive densification of the lower layers during the compaction of the upper layers, the compaction follows the method described by Ladd [50]. After sample compaction, the initial dry density of each soil specimen is found to be 1.41 g/cm3, which corresponds to a dry density ratio of 80%. Each soil specimen is subsequently dried (evaporation) or wetted (wet gas) to obtain the desired gravimetric water content. In the study, six soil specimens with different gravimetric water contents of 0.07, 0.1, 0.13, 0.18, 0.25, and 0.30 are obtained.

2.3. Test Program and Procedures

The tests are conducted at temperatures of 25, 45, and 60 °C. The initial gravimetric water contents of the soil specimen are set as 0.07, 0.1, 0.13, 0.18, 0.25, and 0.30.
Before any test, all instruments used in the test are calibrated, including a differential pressure transducer for gas supply equipment, a temperature sensor, and a high-capacity tensiometer. For the calibration of the differential pressure transducer, a soap flowmeter is connected to valve III to calibrate the gas flow rate. Figure 5a shows its calibration curve, and the gas flow rate measured by these two instruments is very close. It indicates that the two bottles can be used to measure gas flow rate. The temperature sensor and tensiometer are also calibrated by applying a given temperature and water pressure head, respectively. Figure 5b,c show the calibration results of the temperature sensor and tensiometer, respectively. The applied value (temperature or water pressure head) shows a satisfying linear relationship with the measured results (temperature or voltage). It is noted that it is very difficult to apply a water pressure head lower than −10 m for the calibration [51]. Based on the linear relationship, the portion in water pressure heads ranging from −50 m to −10 m is extrapolated from the calibration line ranging from −10 m to 50 m [52].
After the calibration of instruments, each specimen is set up in the triaxial cell. For simplifying the stress state and path, only cell pressure is applied as its soil pressure. Taking a 1.4 m thick landfill cover, for example, the maximum soil pressure is about 20 kPa. Therefore, each soil specimen is compressed isotopically by a cell pressure of 20 kPa till no volume change of the soil specimen occurs. Thereafter, the cell pressure is kept and the temperature is increased to the desired value. The changes in soil specimen volume, pore water pressure, and temperature during this period are recorded till the measured temperature reaches the desired value. Finally, valve III is opened till a steady-state gas flow is maintained. During the test, temperature, pore water pressure, the volume change of water in Bottle II, and the volume change of the soil specimen are recorded by a data logger.

3. Calculation of Gas Permeability

After measuring the gas flow rate during the test, a series of calculations are required to obtain the gas permeability of the soil specimen. Assuming the gas flow follows Darcy’s law, the experimentally derived equation for the one-dimensional gas flow through the soil specimen is as follows:
υ a = k a A d h d l
where k a is the gas coefficient of permeability, A is the cross-section area, and d h / d l is the gas pressure head gradient. k a varies with properties of gas. In order to avoid the effect of gas properties on k a , intrinsic permeability, K, is constant for a given pore structure [53]. The relationship between K and k a is
k a = g ρ a μ K
where ρ a is gas density; μ is dynamic viscosity. Combining Equations (5) and (6), the following generalized equation can be obtained:
υ a = K μ A d P d l
where d P / d l is the gas pressure gradient. In the soil specimen, υ a is not constant due to gas compressibility and pressure gradient. For the test, the pressure gradient is constant (steady state). Then, Equation (9) can be derived from Equation (8) as follows:
μ υ a P d l = K A P d P
Integrate Equation (9) to obtain:
μ υ a B P B L = K A P A 2 P B 2 2
where υ a B is the outlet gas flow rate, P B is outlet pressure, and P A is inlet pressure. For each test, the temperature T is constant and Equation (10) can be simplified as
υ a A P A = υ a B P B = K μ A P A 2 P B 2 2 L
where υ a A is the inlet gas flow rate. Therefore, K can be calculated using Equation (11).
K = υ a A P A 2 μ L A P A 2 P B 2
It should be noted that the proposed method for calculating the intrinsic permeability is improved from the method by Fredlund [47]. In this paper, the gas volume varying with its pressure is considered.

4. Experimental Results and Discussion

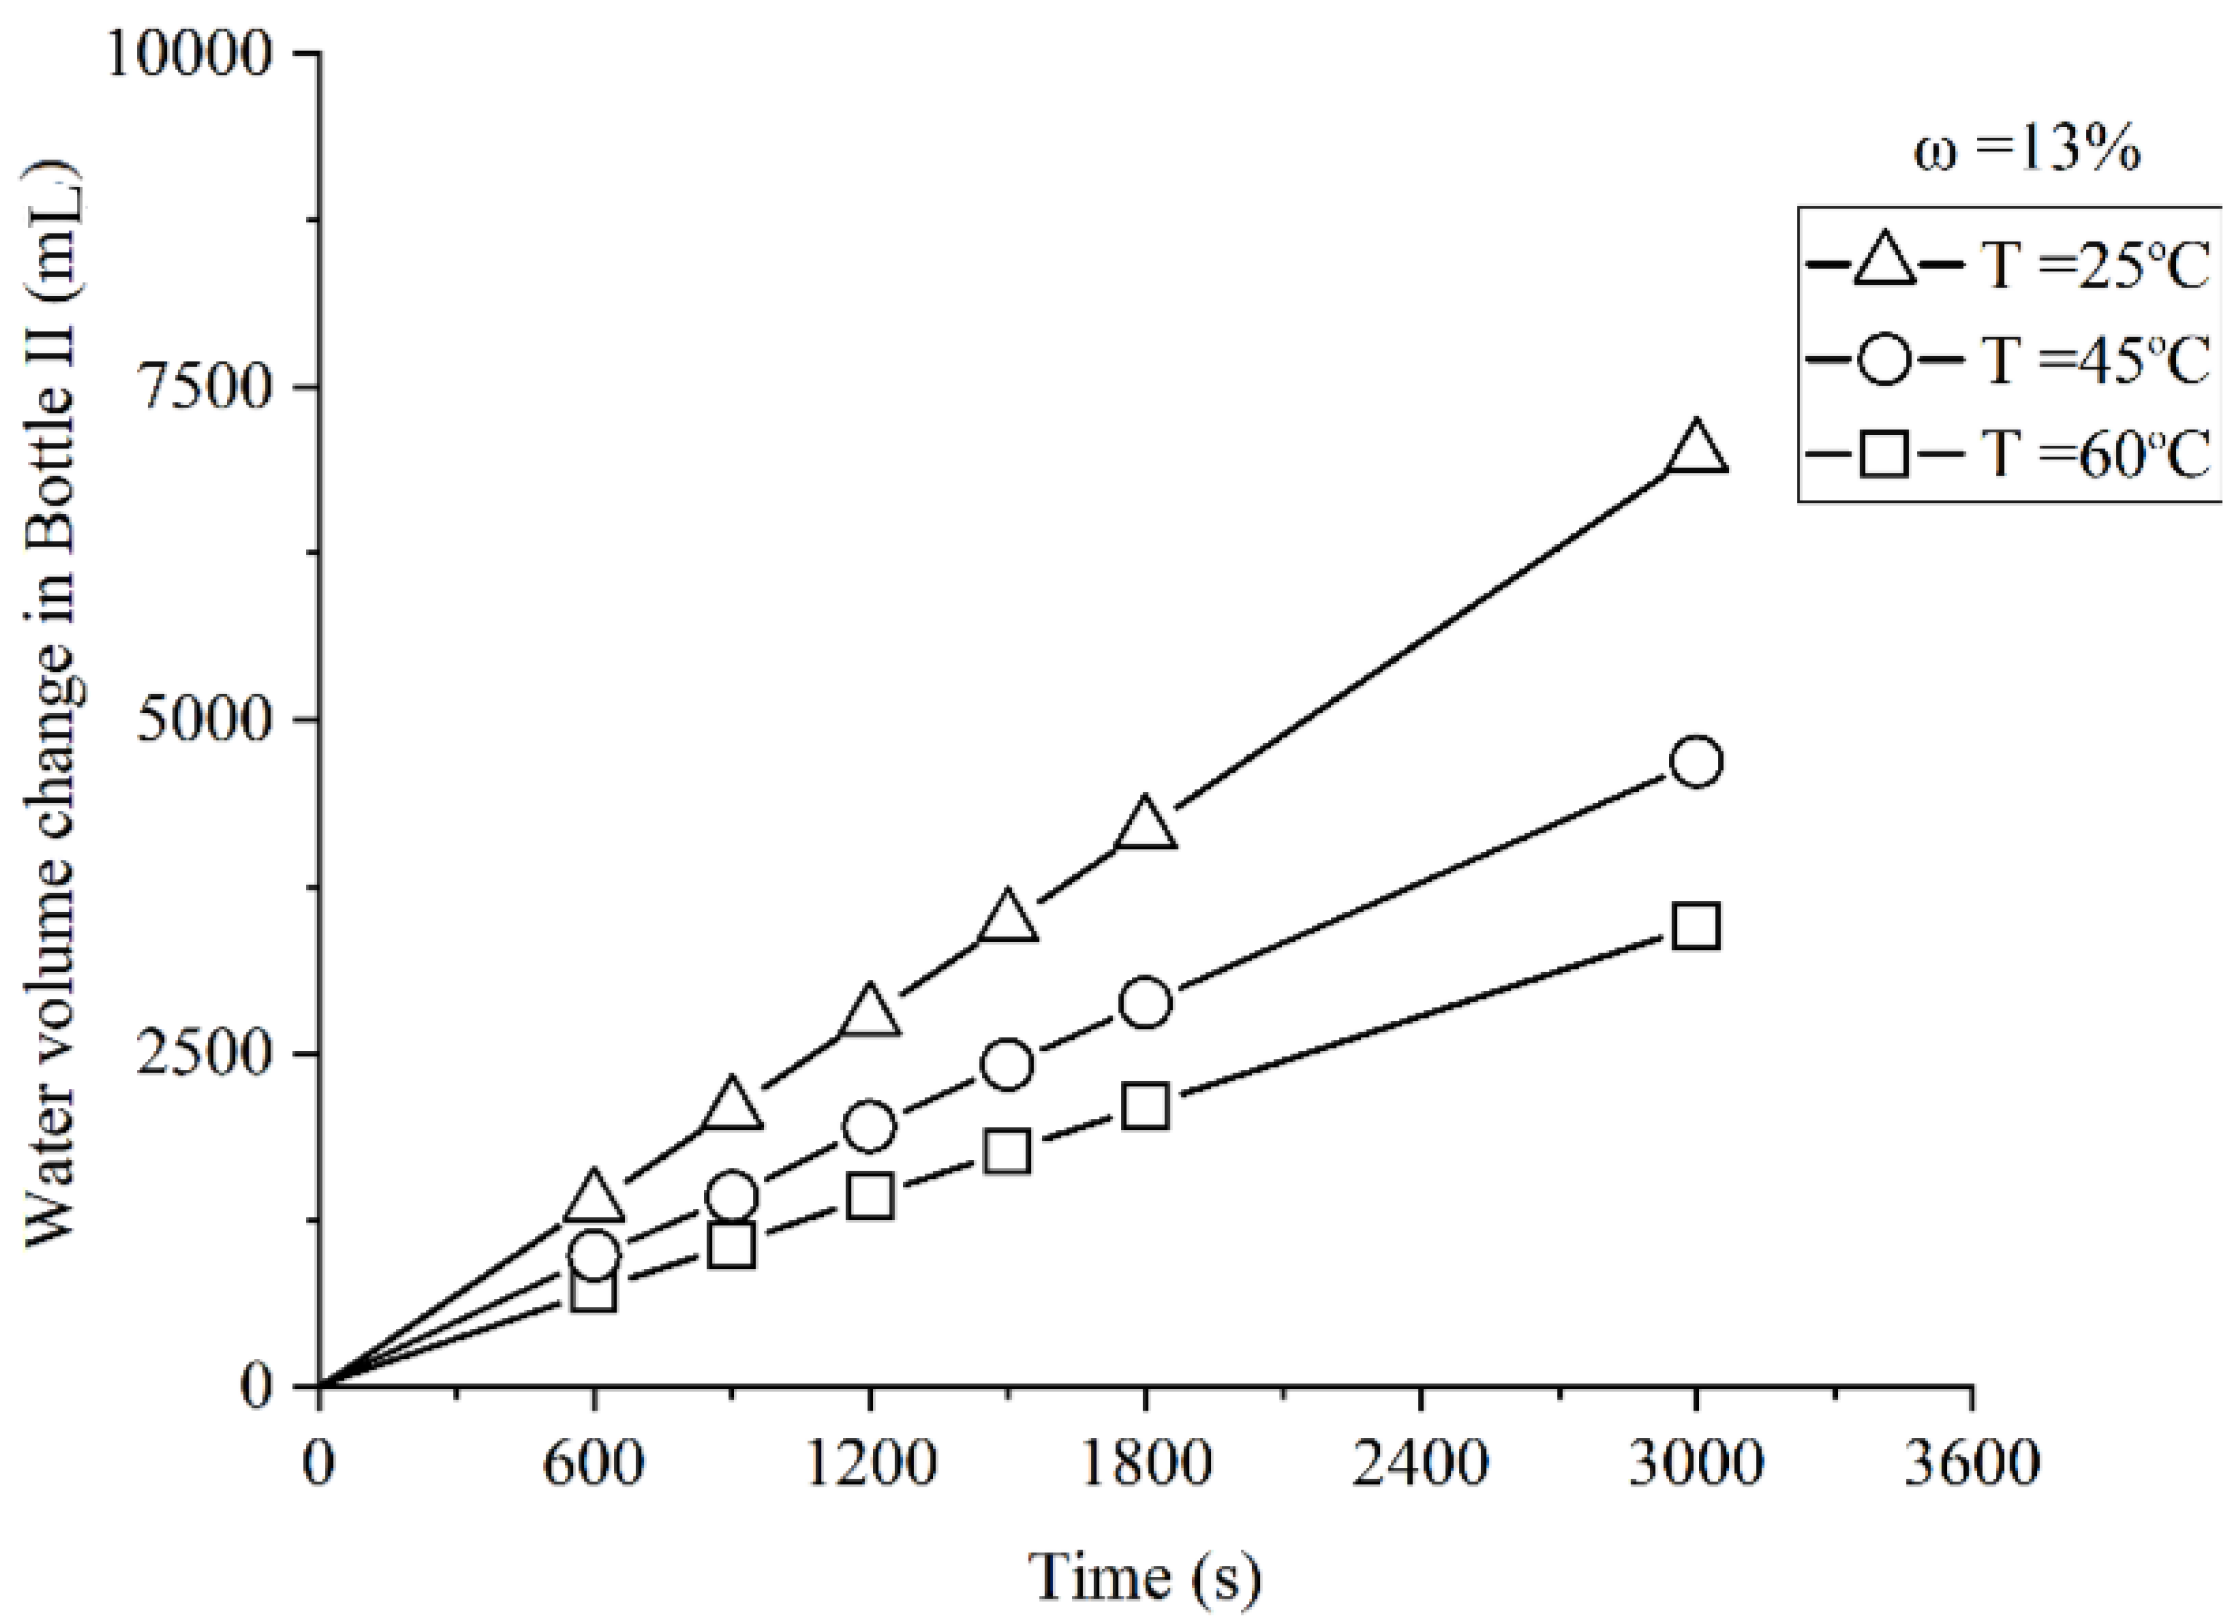
4.1. Gas Flow Volume Change

Figure 6 shows the measured water flow volume change for soil specimens with a gravimetric water content of 13% at a steady state. The temperatures of 25, 45, and 60 °C are considered. The abscissa is a period at the steady state while the ordinate is the water volume change in Bottle II during this period. At each temperature, the water volume change increases linearly with time. It indicates that the water change rate has not changed during this 50 min and a steady state has been obtained. According to Equation (4), the slope of each line can calculate the gas flow rate. The gas flow rate through the soil specimen is 139.7, 93.1, and 69.1 mL/min for 25, 45, and 60 °C, respectively. The gas flow rate at 60 °C is observed to be 50.5% lower than that at 30 °C when the gravimetric water content reaches 0.13. The higher the temperature, the smaller the gas flow rate. It is due to the large gas absolute (dynamic) viscosity for high temperature [42,43,44,45].

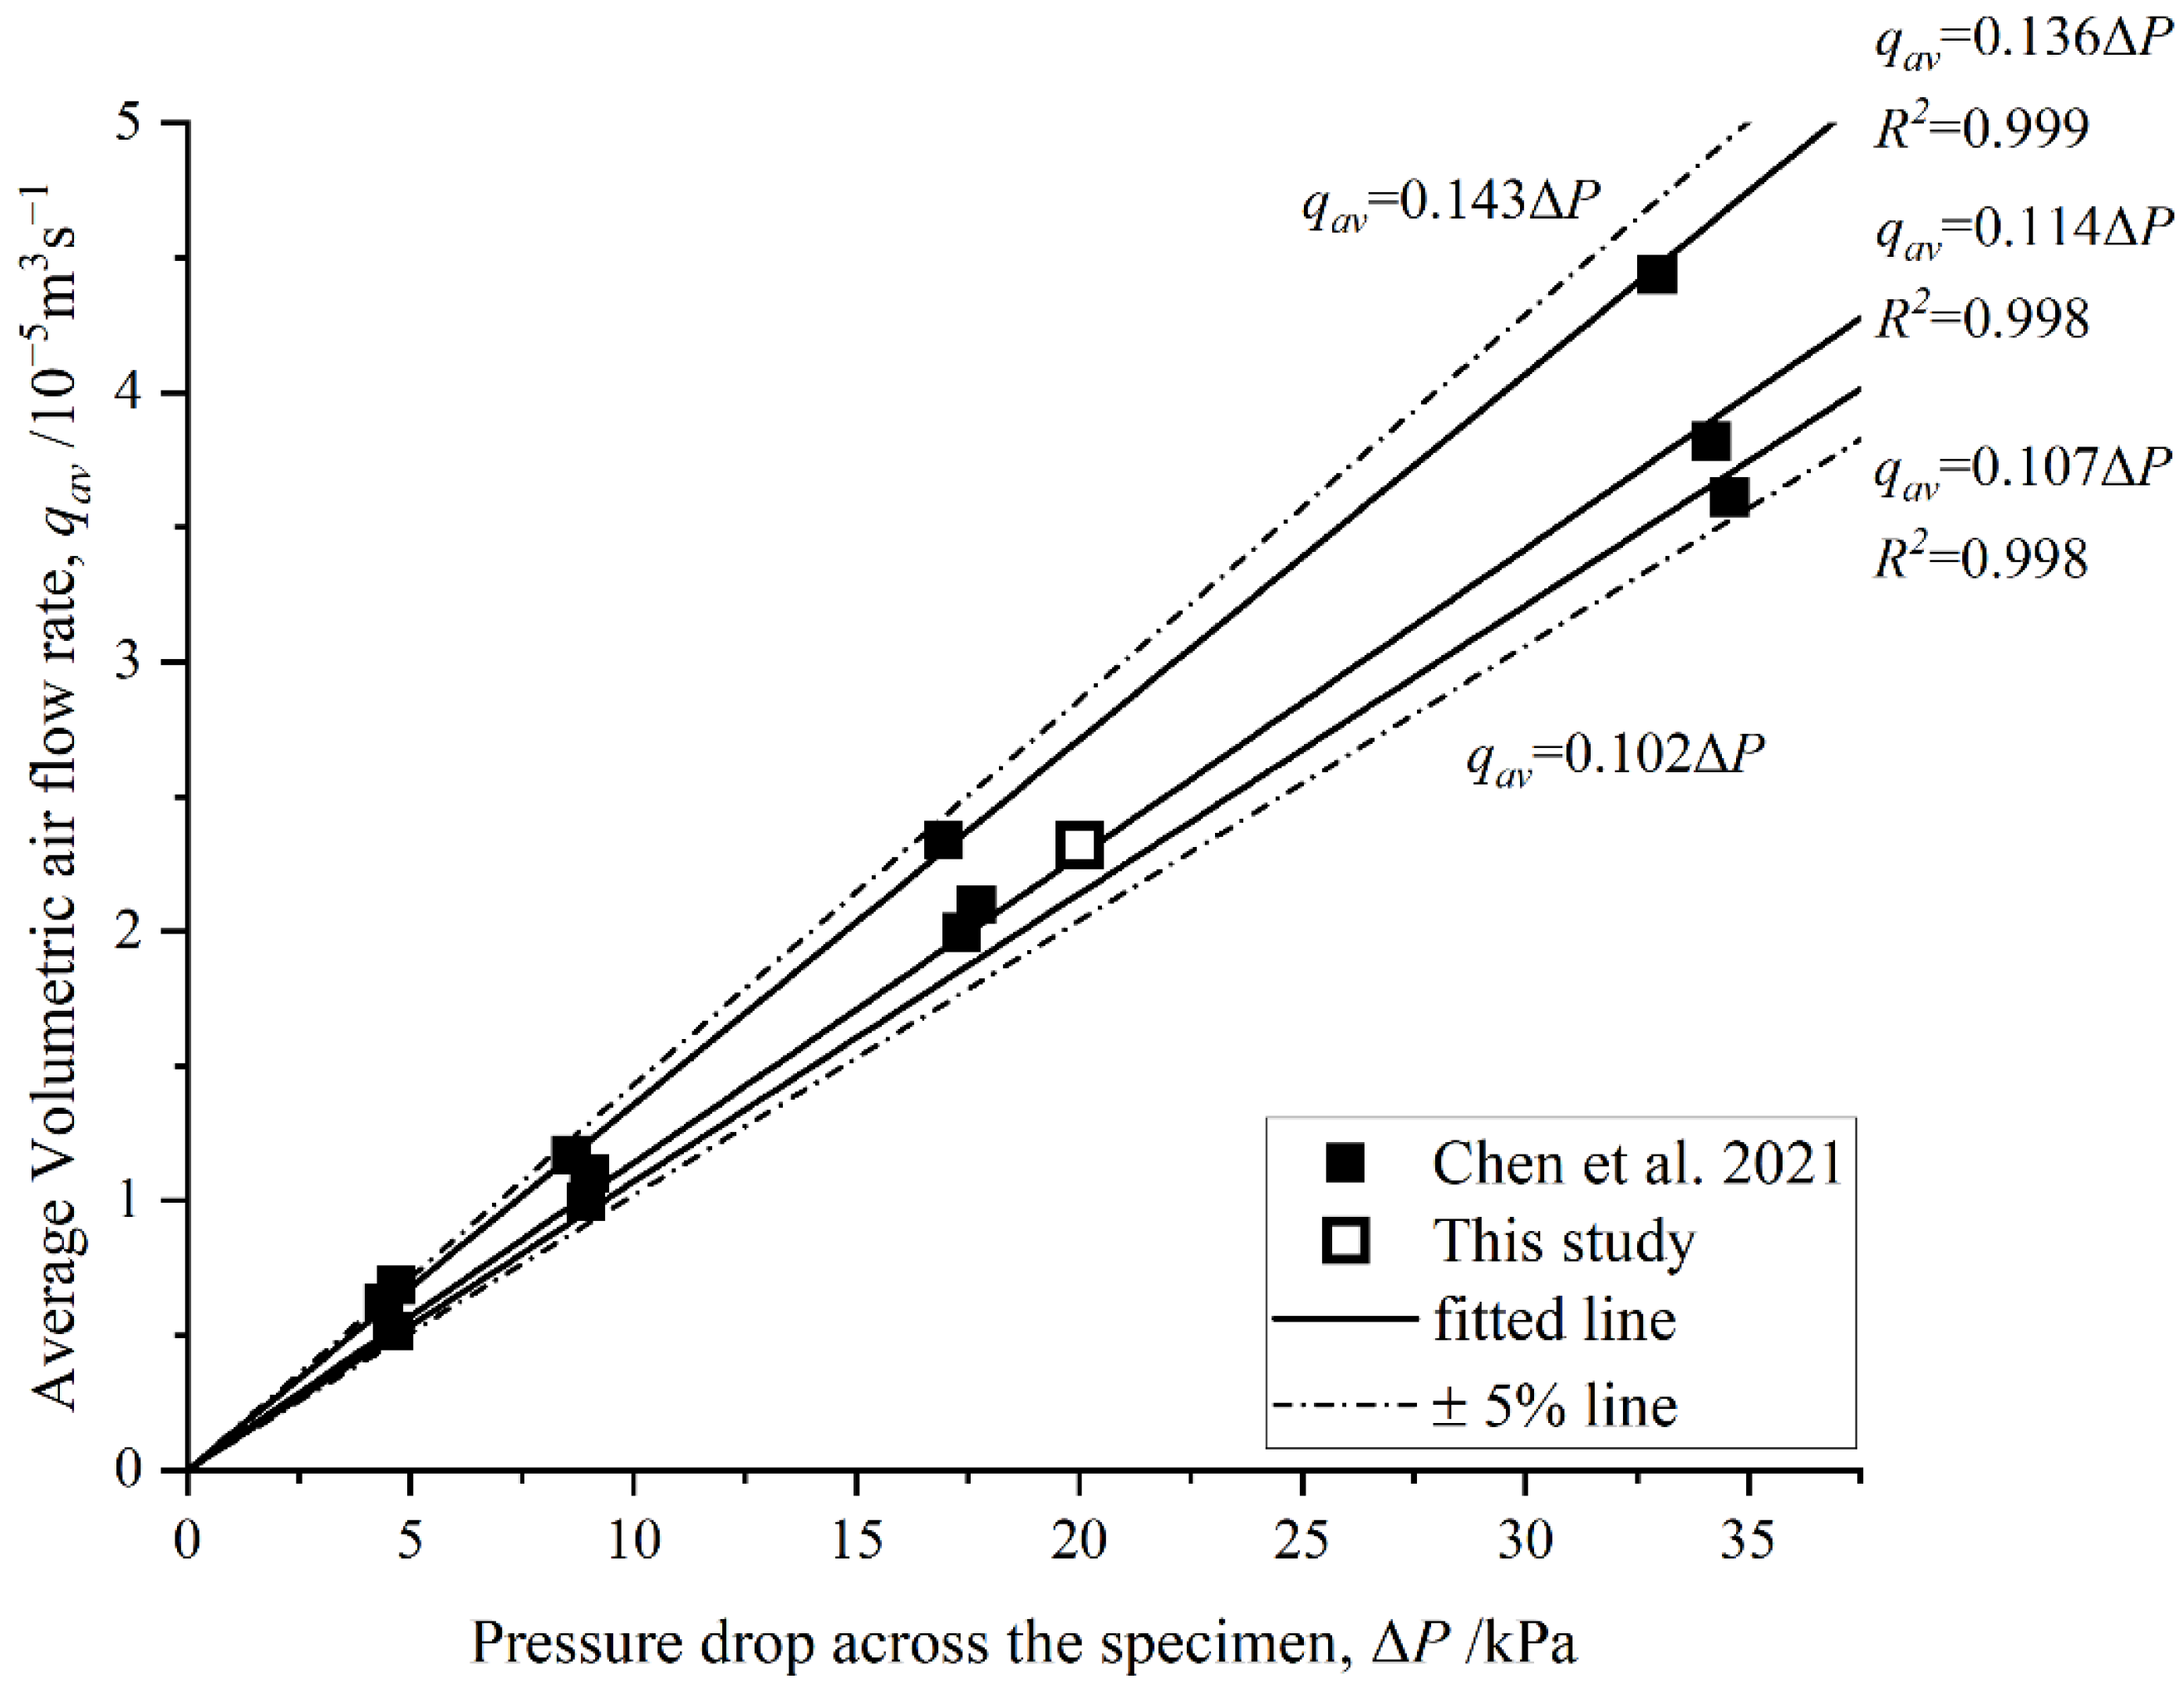
4.2. Comparison of Average Volumetric Air Flow Rate

Figure 7 shows the average volumetric air flow rate measured by the ASTM-recommended triaxial permeameter used by Chen and the triaxial permeameter consisting of the new gas pressure supply equipment proposed in this study [24]. It should be noted that the soil specimens used by Chen and the ones used in this experiment have the same materials and compositional ratios, so the results can be compared and analyzed. In Figure 7, hollow and solid symbols represent the results measured by this study and Chen, respectively. The data obtained from the tests is fitted by a linear function with a fixed intercept of zero. And the range of ±5% error is obtained from the fitted straight line, with upper and lower limits indicated by dot-dashed lines. The equations and variances of the fitted line and the dot-dashed line characterizing the error range are presented in Figure 7. Firstly, the test results of Chen’s gas permeameter are very close to the best-fit line, indicating that the results comply with Darcy’s law. Secondly, the data measured by the triaxial permeameter proposed in this paper are within ±5% error, which demonstrates that the new gas supply equipment is accurate, reliable, and of scientific value.

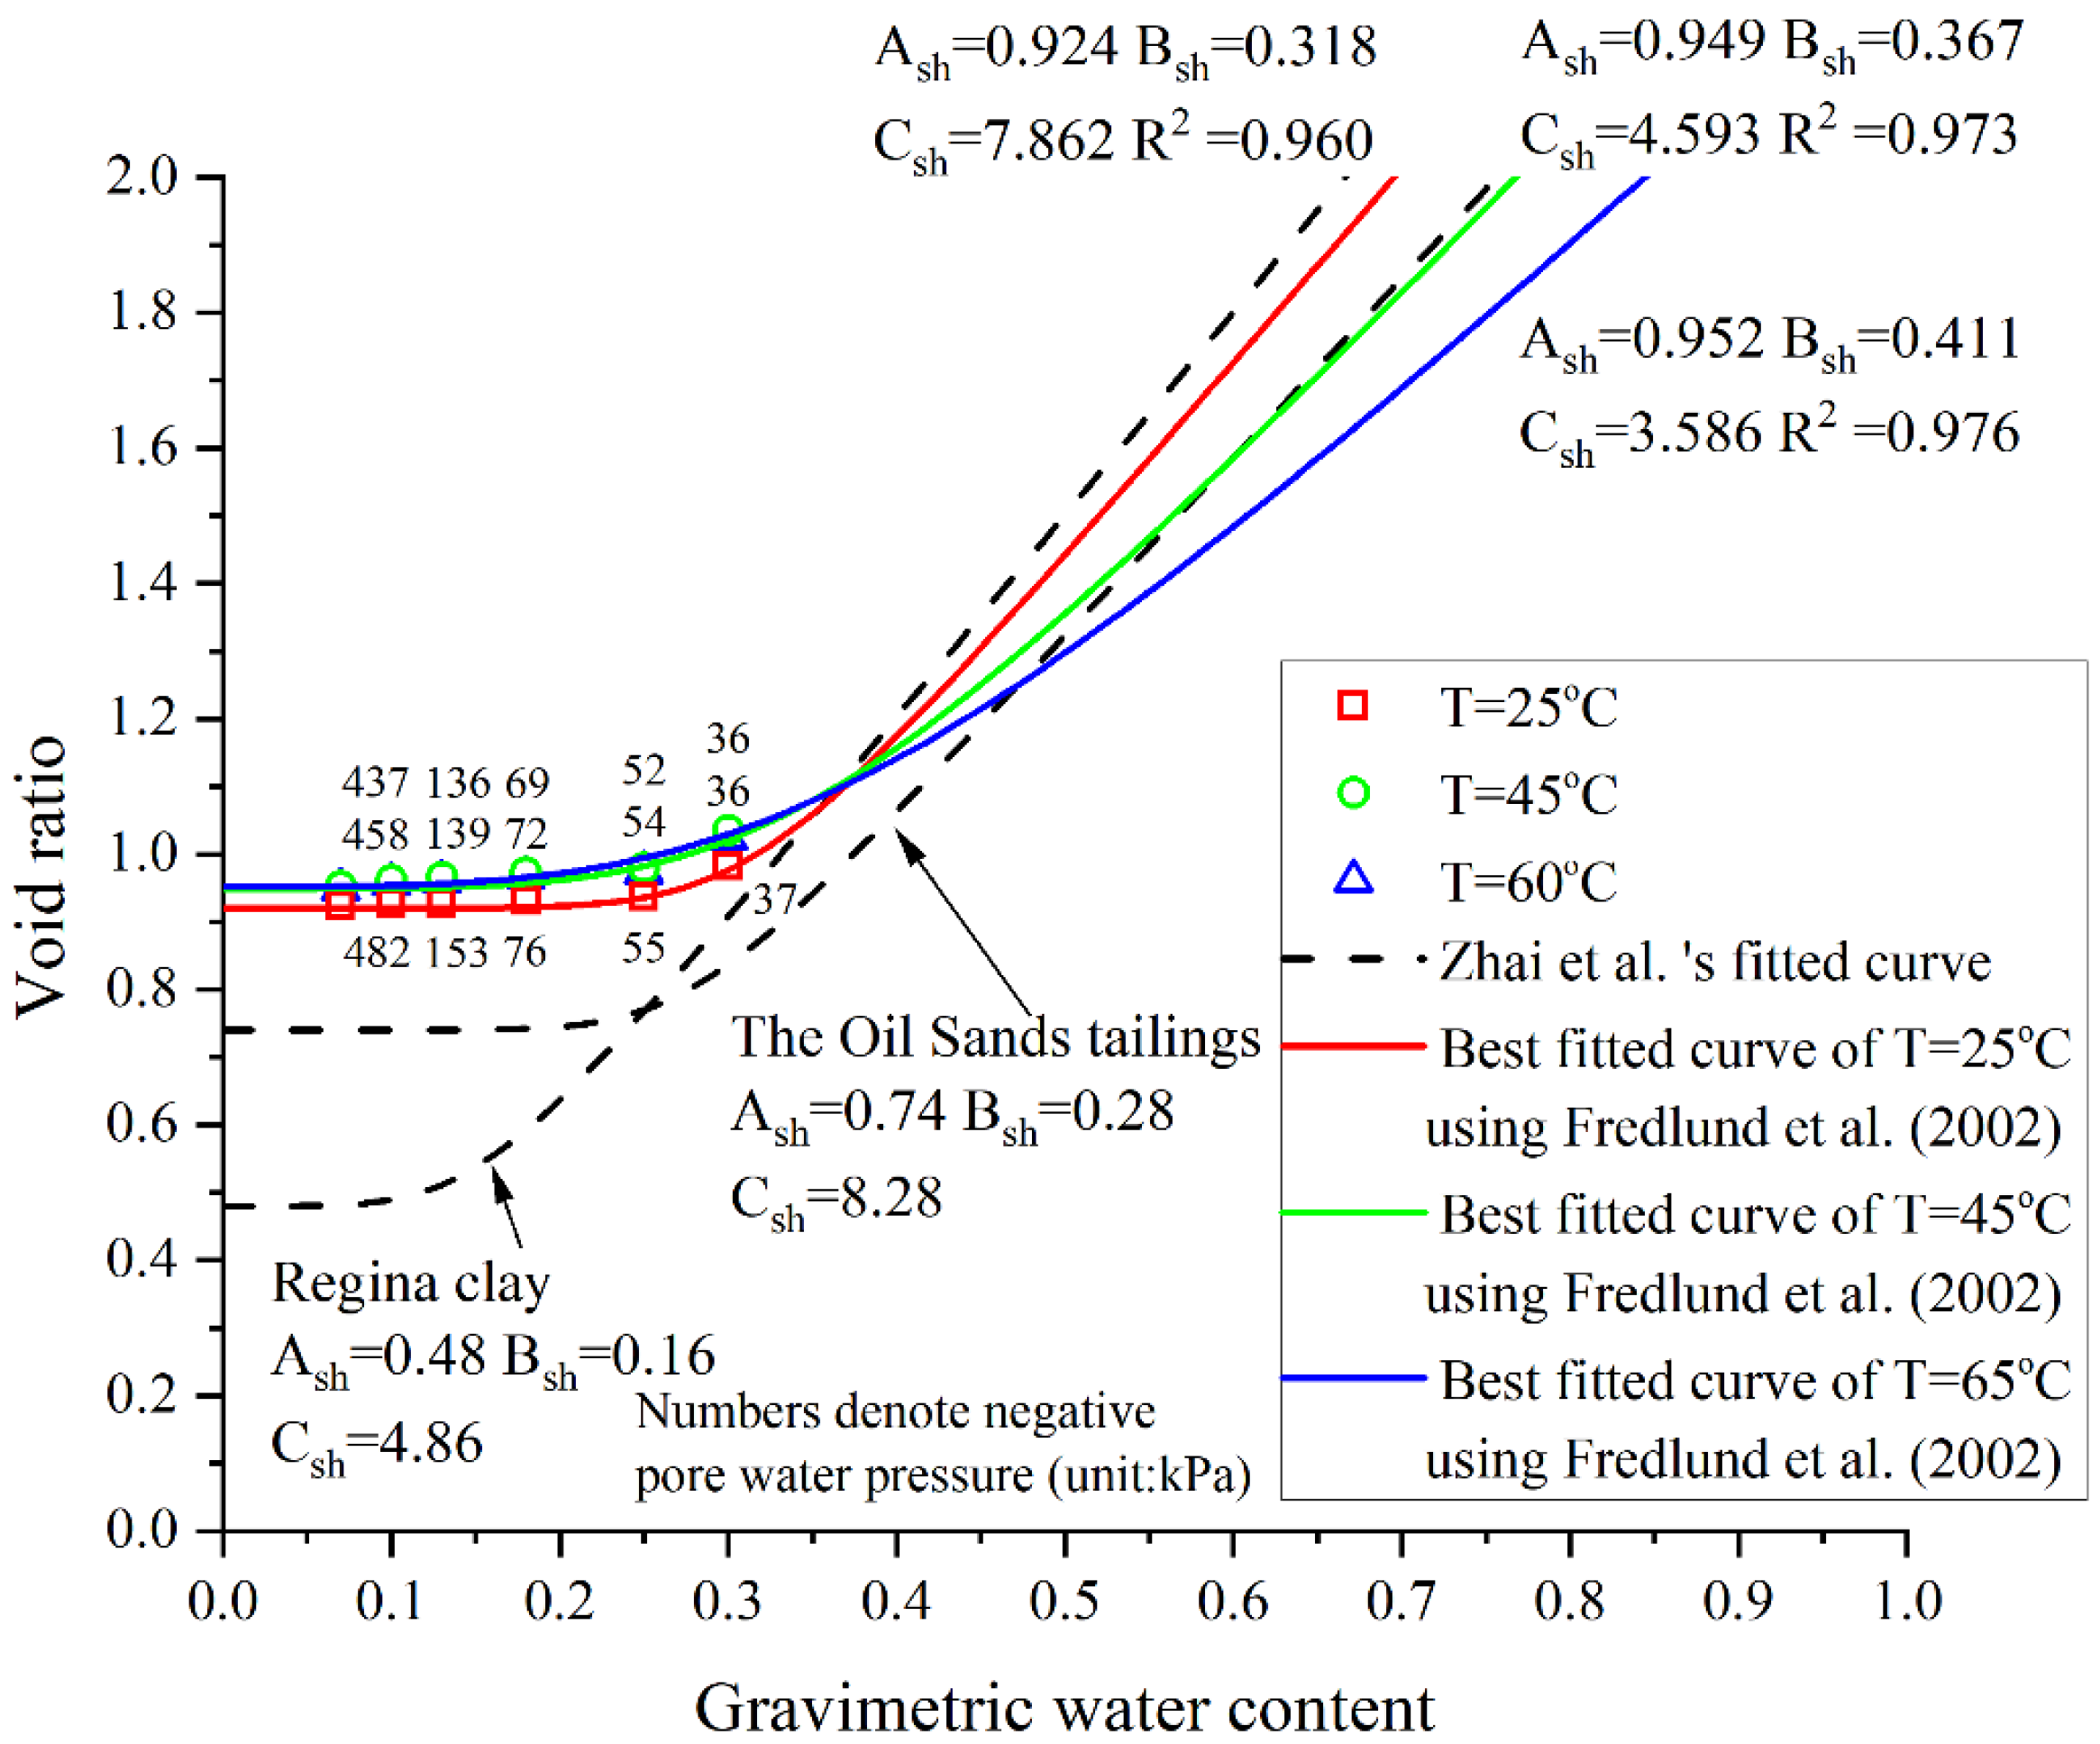
4.3. Volume Change of Soil Specimen

As previously stated, the soil specimen volume change is measured by the volume change indicator, whereas pore water pressure is measured by tensiometer during each test. Combining this volume change and the initial void ratio, the void ratio at any period, e, can be calculated as follows:
e = G s ρ w ρ d V 0 V 0 + V 1
where G s is specific gravity, ρ d is the dry density of compacted soil specimen, V 0 is the volume of soil specimen at an initial state, and V is its volume change. Figure 8 shows the change in void ratio obtained from this study and Zhai’s research for the soil specimens at steady state [54]. The numbers denote negative pore water pressure at that void ratio. The negative pore water pressure with the gravimetric water content of 0.07 has exceeded the measurement range of the tensiometer (i.e., 500 kPa), which is not shown in Figure 8. At each given temperature, the void ratio increases with its gravimetric water content. It is due to the relative movement of the water phase in the soil specimen. Similar changes can also be found in Tadepalli et al. [54,55]. On the other hand, at each given gravimetric water content, as the temperature increases, the negative pore water pressure decreases, whereas the void ratio increases. It is because the increase in the temperature leads to a decrease in the surface tension of contractile skin [56,57] and thus a negative pore water pressure with a maximum decrease of 11.1%. As the negative pore water pressure decreases, the force equilibrium between soil particles is broken, and thus the volume of the soil specimen swells as well. For the volume change, when the temperature increases from 25 °C to 60 °C and the initial gravimetric water content is 0.3, the void ratio exhibits an increase of 0.053, corresponding to a maximum increment of 5.4%. These results differ from those obtained from Uchaipichat and Khalili [58], in which the specific volume (the inverse of density) decreased as the temperature increased from 25 to 60 °C. It is noted that the condition used by Uchaipichat and Khalili [58] was suction-controlled. The influence of the temperature on pore water pressure was ignored.
In addition, in order to verify the reliability of the obtained data, the volumetric shrinkage curve fitted by the experimental data is compared with the curve in the published research. Fredlund’s equation [47] of estimating the volumetric shrinkage curve is best fitted to the experimental data of soil specimens. The fitting parameters (Ash, Bsh, and Csh) in Fredlund et al.’s equation, the best fitted curves, and Zhai’s fitted curve [54] are illustrated in Figure 8. The curve obtained in this study has the same trend as Zhai’s curve. As the water content increases, the void ratio remains unchanged at first, and then the change rate of the void ratio gradually rises until it reaches a constant value. The difference between the curves is significant for the initial constant minimum void ratio, curvature, and rate of change of void ratio. The three differences are represented by three parameters (Ash, Bsh, and Csh), respectively. Moreover, it is noteworthy that an increase in Ash corresponds to a proportional increase in Bsh, aligning with Fredlund’s findings [59,60] and further validating the reliability of the acquired data.

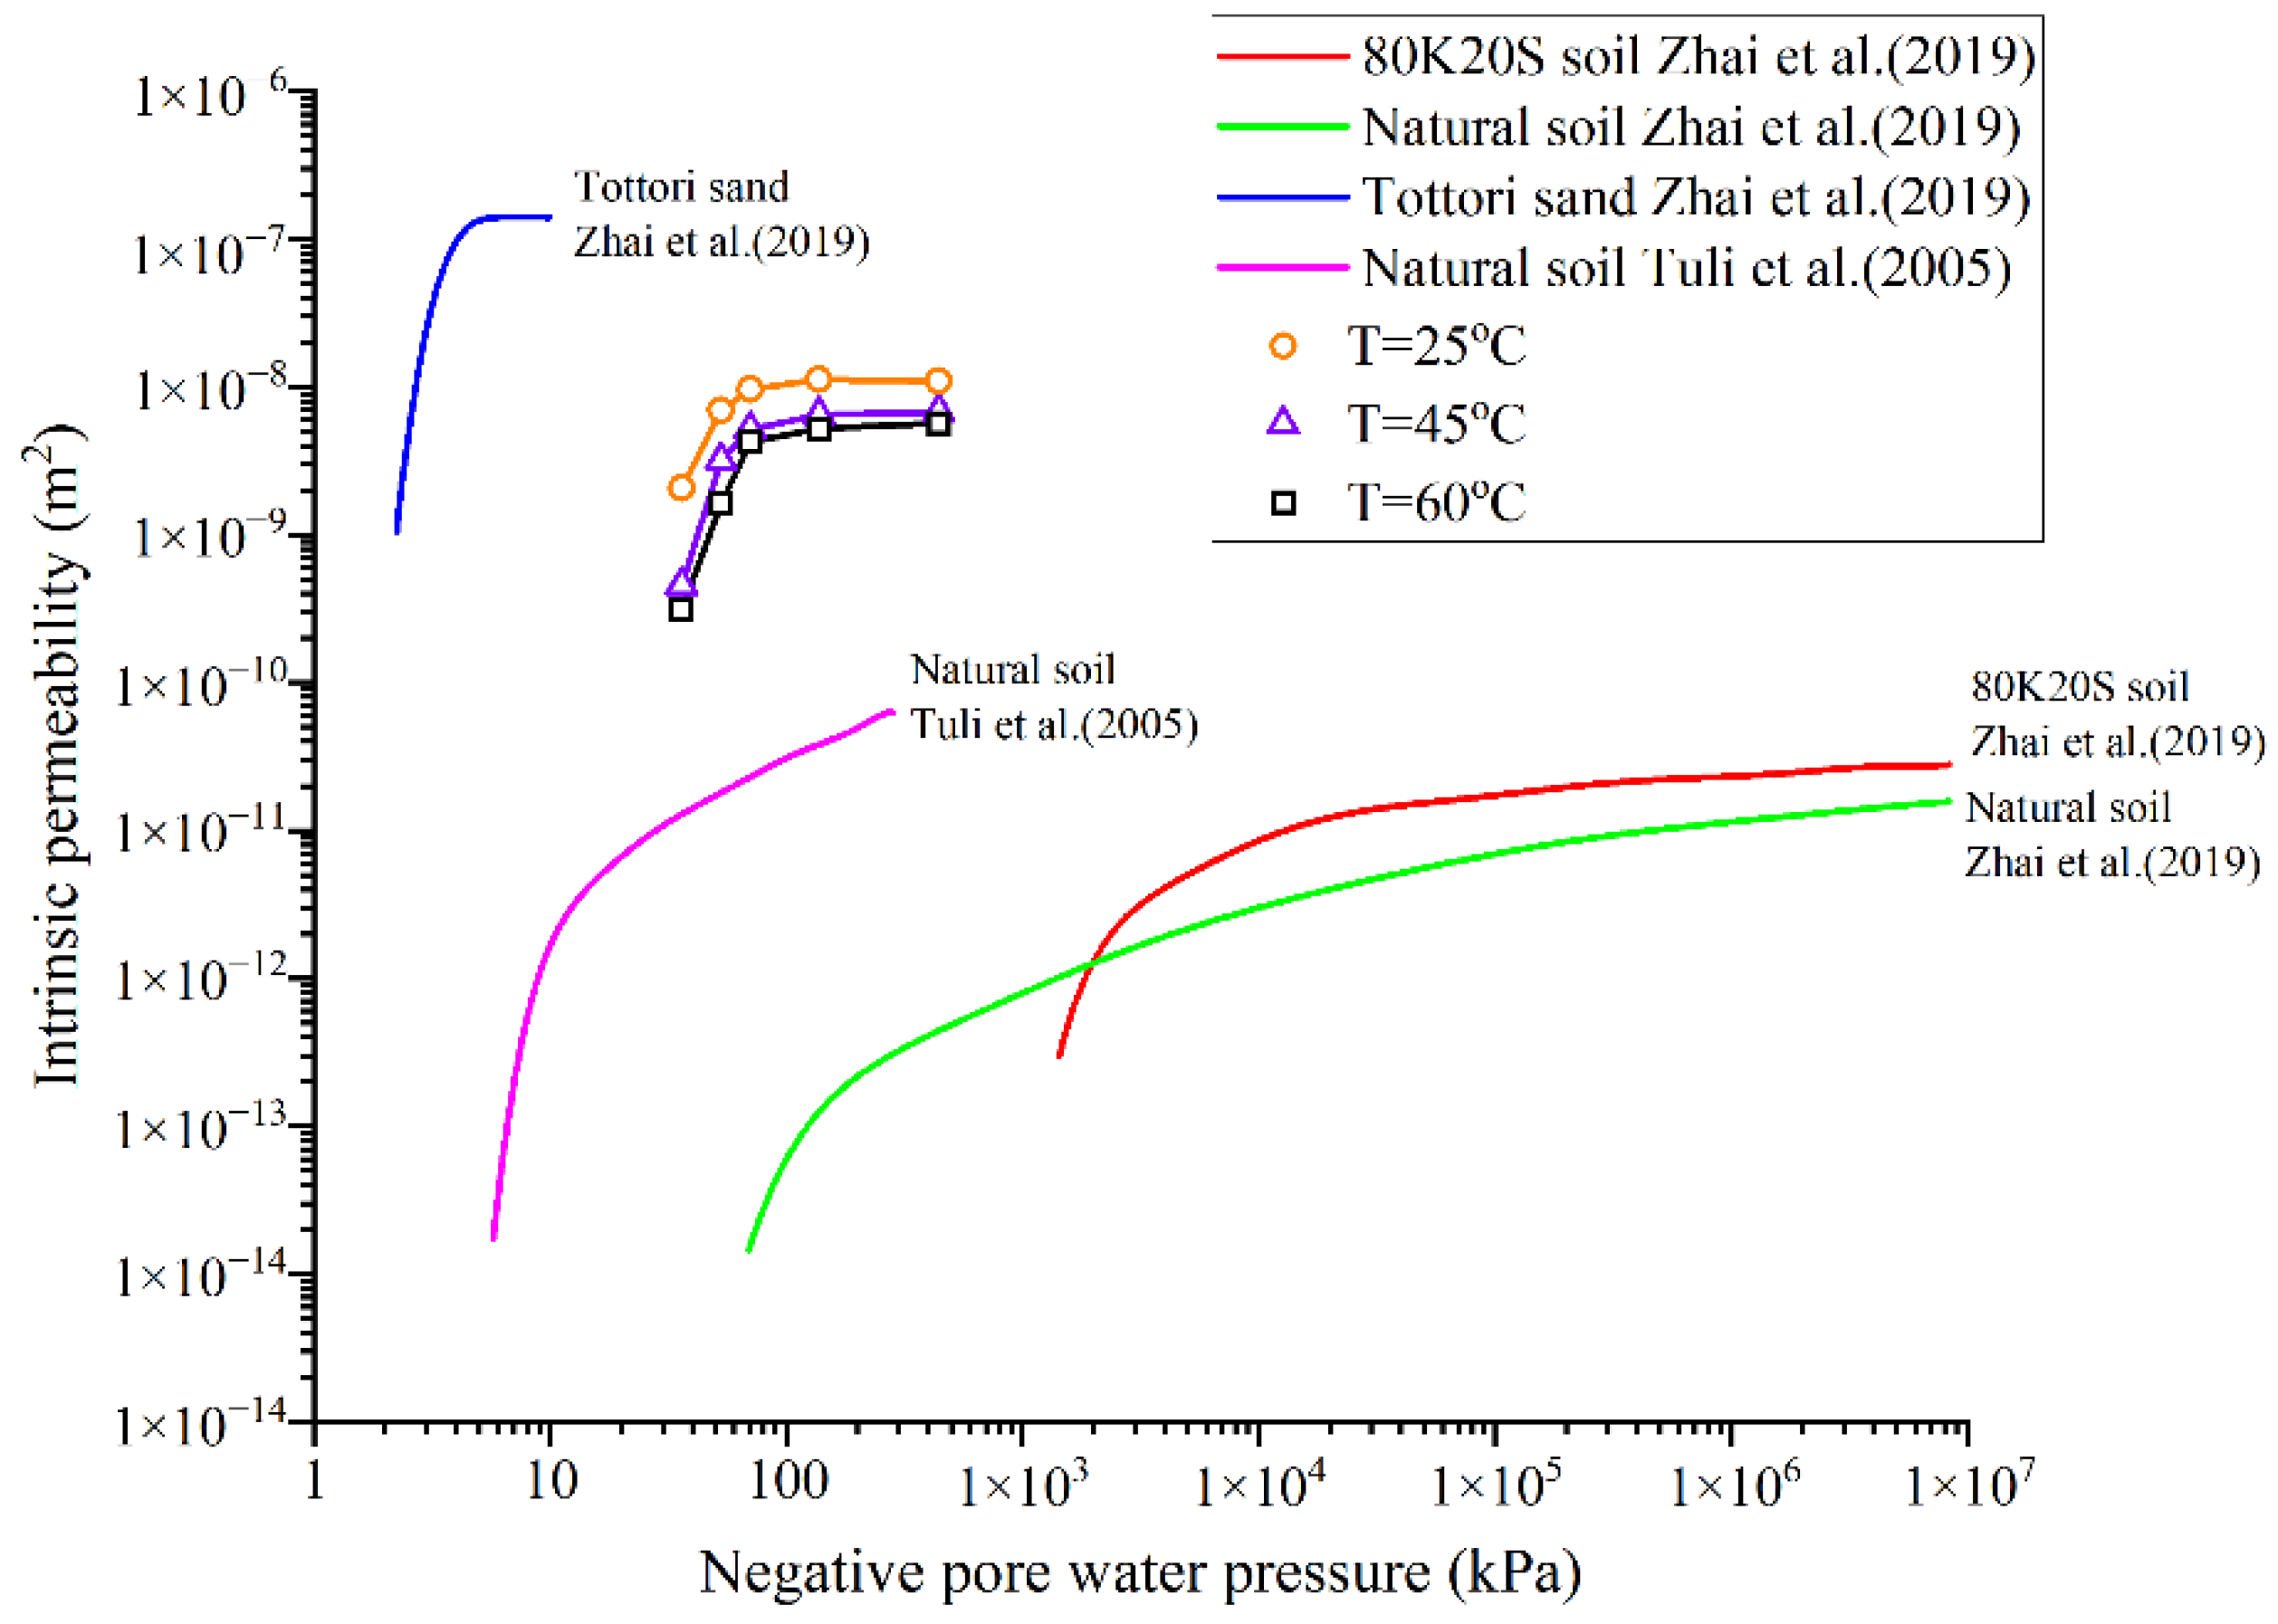
4.4. Relationship between Intrinsic Permeability and Negative Pore Water Pressure

Figure 9 shows the relationship between intrinsic permeability and negative pore water pressure at each temperature. And, in order to obtain the trend and characteristics of the curve more accurately and reliably, the correlation curve obtained by existing studies is shown in Figure 9. At any given temperature, the intrinsic permeability first increases with the negative pore water pressure and then maintains almost constant. Obviously, there exists a critical negative pore water pressure, beyond which the intrinsic permeability is irrelevant to negative pore water pressure. The critical values for 25, 45, and 60 °C are all about 65 kPa, irrelevant to the negative pore water pressure. A similar change was also found by Tuli [61] and Zhai [62]. The curves of different soil specimens acquired from Tuli and Zhai also reflect that the intrinsic permeability first increases and is then unchanged as the negative pore water pressure reaches critical values. Due to the difference of soil specimens, the critical negative pore water pressure does not fluctuate around a specific value. It is because below the critical value, the gas phase in the pore of the soil specimen becomes occluded, and the gas flow takes place as the diffusion of gas through water. As the temperature increases, the intrinsic permeability decreases. When the negative pore water pressure is about 36 kPa, the intrinsic permeability at 60 °C is 81.8% lower than that at 25 °C. This is due to the increase in the void ratio of soil specimens.

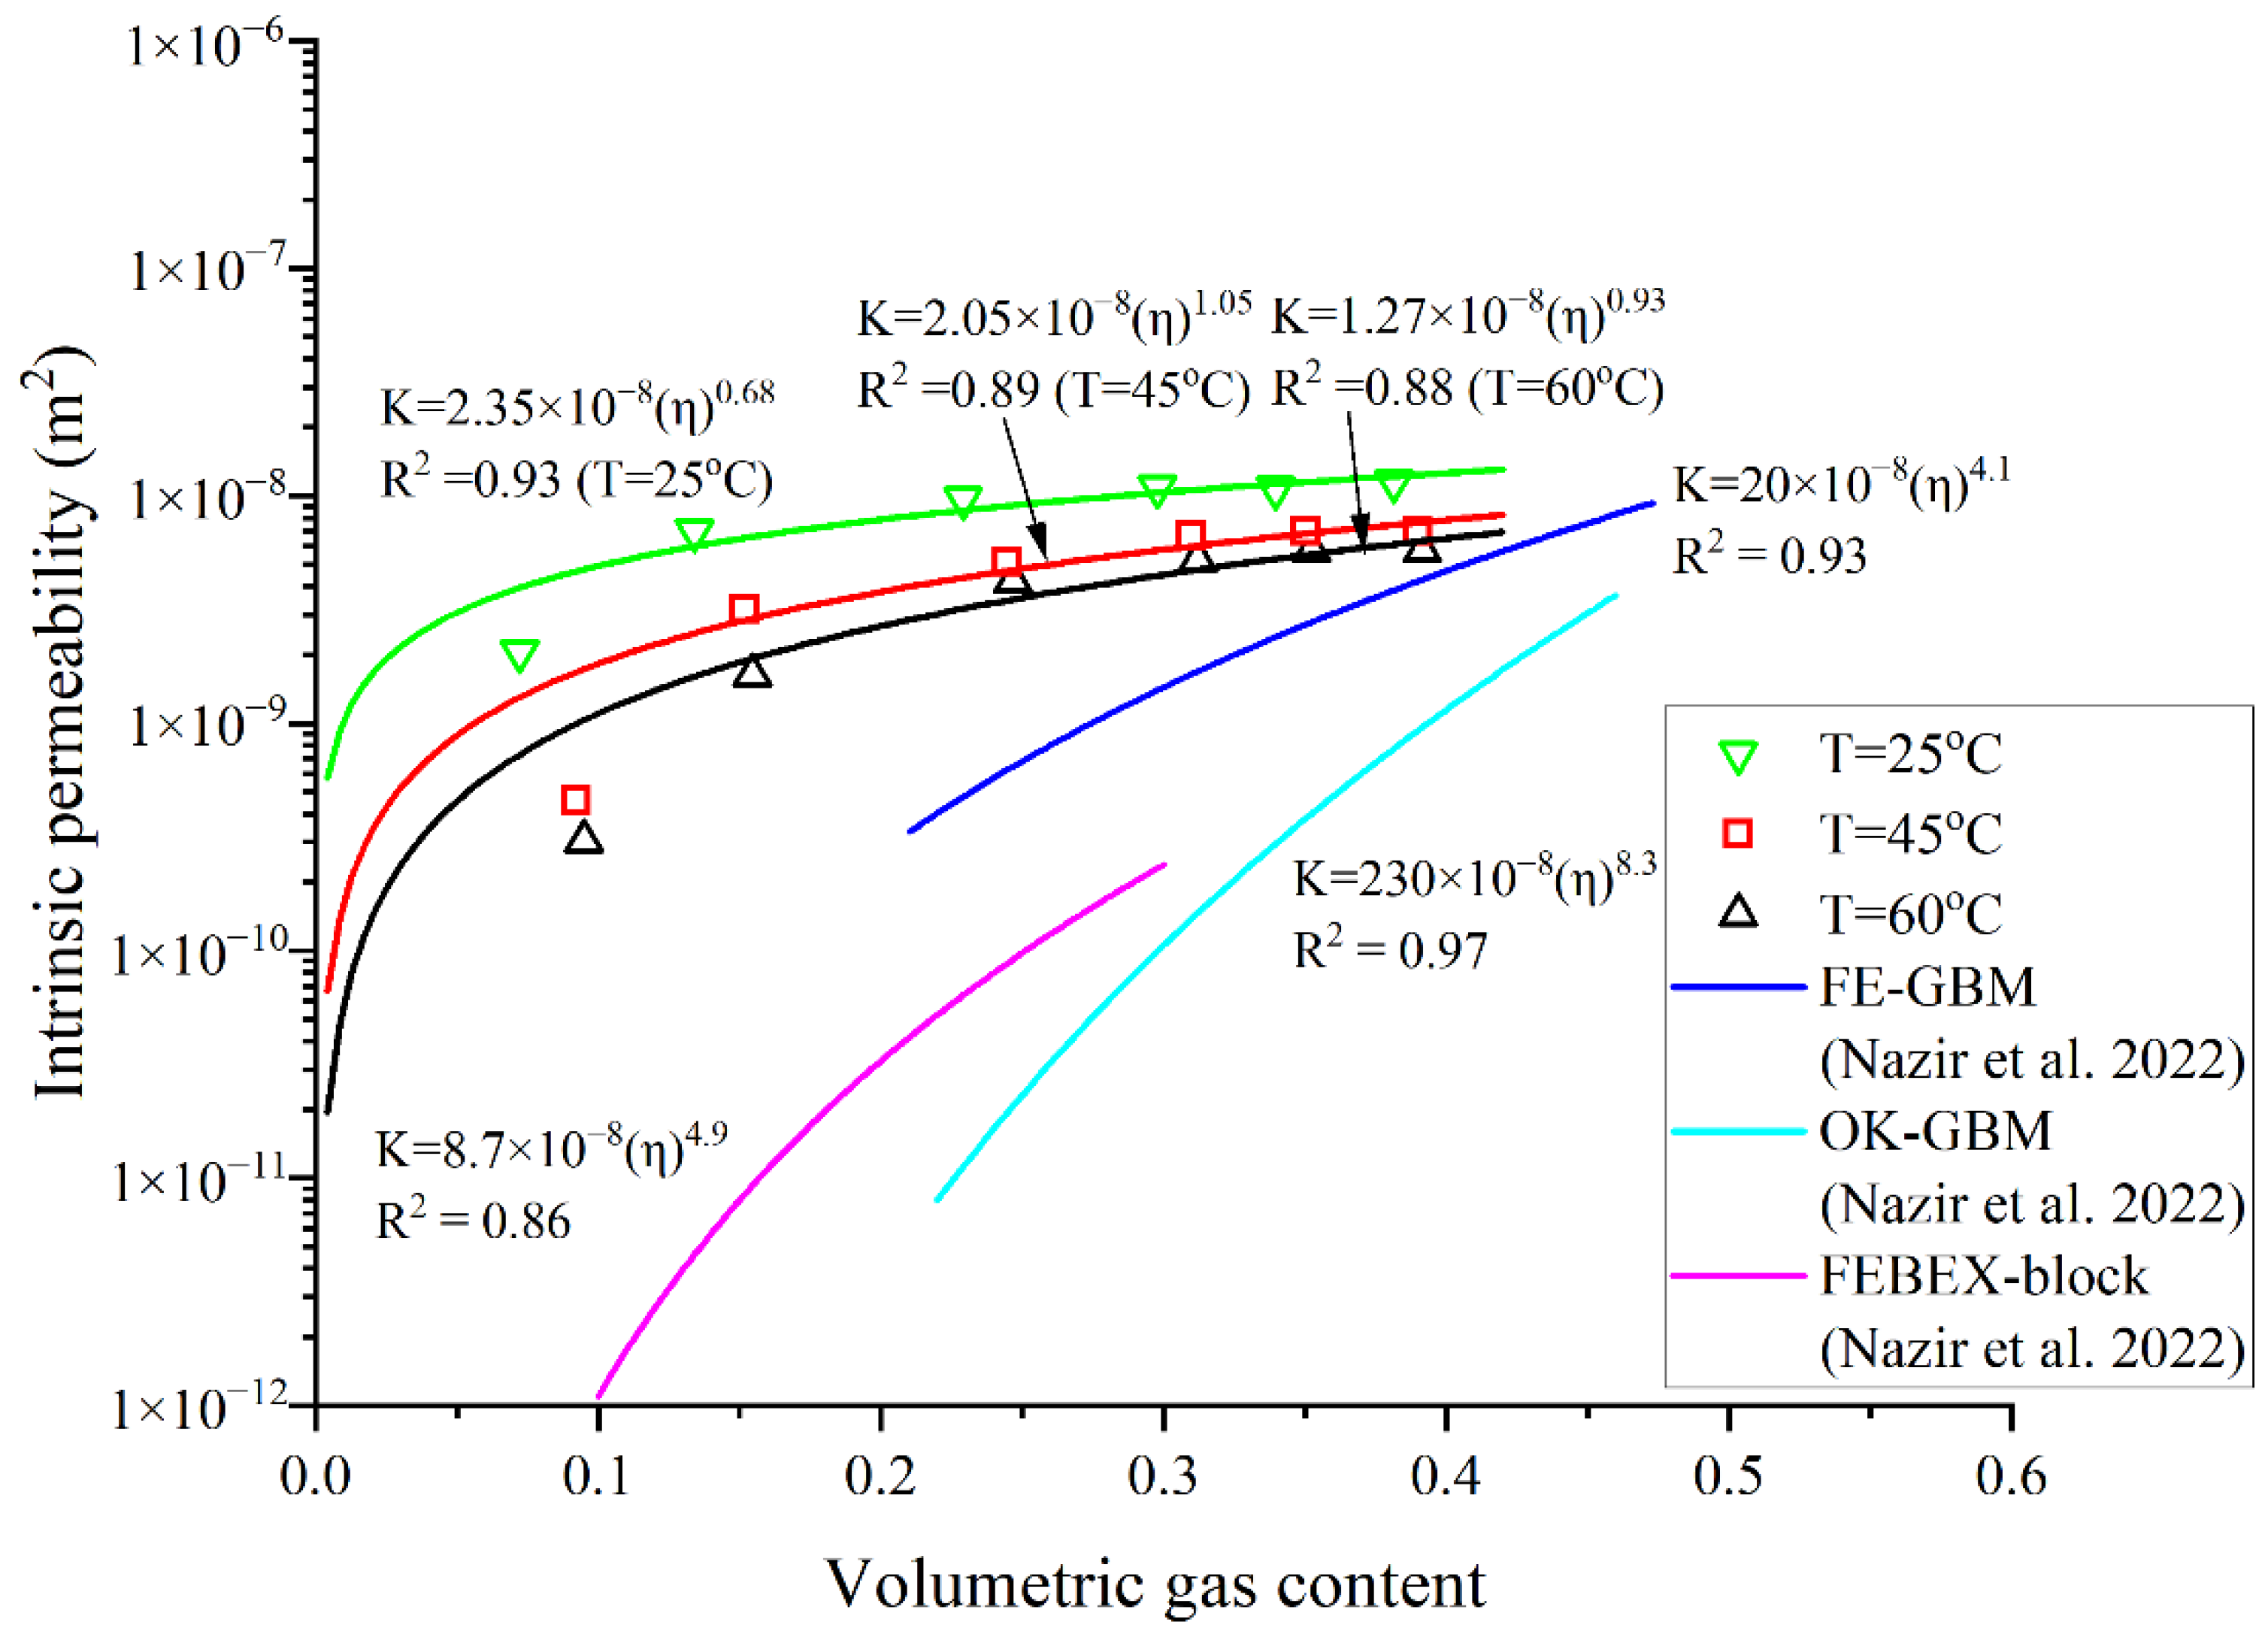
4.5. Relationship between Intrinsic Permeability and Volume Gas Content

A direct factor, volumetric gas content, is employed to investigate gas permeability by many previous studies [63,64,65,66,67]. Most existing models for estimating gas permeability are also built up based on the volumetric gas content [68,69,70]. Among these relationships, the power-law model is the most common:
K = α η β
where η is volumetric gas content, α is constantly related to the pore connectivity, and β is a power-law exponent labeled as a water blockage factor [71]. Figure 10 shows the relationship between intrinsic permeability and volumetric gas content at different temperatures. Additionally, the correlation curves and fitted equations obtained by Nazir are shown in Figure 10 [72]. As expected, the intrinsic permeability increases as the volumetric gas content increases. Generally, the measured intrinsic permeability and Nazir’s curves agree satisfyingly with the power-law model. However, since Nazir’s study does not discuss the effect of temperature differences, the subsequent analysis does not involve Nazir’s curve. Based on Equation (13), α for 25, 45, and 60 °C are 2.35 × 10⁻⁸, 2.05 × 10⁻⁸, and 1.27 × 10⁻⁸, respectively. It indicates that a higher temperature leads to small pore connectivity. It is noted that in the small region of volumetric gas content (0–0.1), a relatively large difference occurs between the measured and estimated results. It indicates that it is necessary to use the advanced apparatus to measure the gas permeability of the soil specimen, especially in small regions of volumetric gas content.

5. Conclusions

This paper proposes a new temperature-controlled apparatus to measure gas permeability under low gas pressure (i.e., under 20 kPa). The low gas pressure is supplied by two Mariotte bottles, by which the airflow rate is measured in the meanwhile. During the test, the negative pore water pressure and volume change of the soil specimen need to be measured. Through the temperature-controlled apparatus, it is observed that as the temperature increases from 25 °C to 60 °C, there is a corresponding increase in soil sample porosity by 5.4%, while the negative pressure of pore water decreases by 11.1%. This can be attributed to the reduction in the surface tension of contractile skin caused by elevated temperatures. Furthermore, due to variations in gas viscosity with temperature, there was a significant decrease in the gas flow rate by 50.5%. And, the relationship between permeability and volumetric gas content at different temperatures in low-pressure regions well confirms the existing power-law model. In addition, the existence of a temperature-independent critical negative pore water pressure is observed, beyond which the intrinsic permeability remains constant. At 36 kPa of negative pore water pressure, the intrinsic permeability at 60 °C exhibits an 81.8% reduction compared to that at 25 °C. This decline in intrinsic permeability can be attributed to a diminished pore connectivity, resulting from elevated temperatures.

Author Contributions

Conceptualization, Y.W., J.L. and R.C.; methodology, Y.W., R.C. and J.L.; validation, Y.H., J.L. and R.C.; formal analysis, Y.W., Y.H., J.L. and R.C.; investigation, Y.W., J.L. and R.C.; resources, Y.H. and J.L.; data curation, Y.W. and Y.H.; writing—original draft preparation, Y.W., Y.H. and J.L.; writing—review and editing, J.L. and R.C.; visualization, Y.H. and J.L.; supervision, Y.W. and J.L.; project administration, Y.W. and J.L.; funding acquisition, Y.W. All authors have read and agreed to the published version of the manuscript.

Funding

This research was funded by the Fundamental Research Funds for the Central Universities, grant number B200204036 and B200204032.

Institutional Review Board Statement

Not applicable.

Informed Consent Statement

Not applicable.

Data Availability Statement

The data presented in this study are available in this article.

Acknowledgments

The authors would like to acknowledge the Fundamental Research Funds for the Central Universities (grant number B200204036 and B200204032).

Conflicts of Interest

The authors declare no conflict of interest.

References

  1. Berger, J.; Fornés, L.V.; Ott, C.; Jager, J.; Wawra, B.; Zanke, U. Methane Oxidation in a Landfill Cover with Capillary Barrier. Waste Manag. 2005, 25, 369–373. [Google Scholar] [CrossRef] [PubMed]
  2. Dagenais, A.M.; Mbonimpa, M.; Bussiere, B. A modified oxygen consumption test to evaluate gas flux through oxygen barrier cover systems. Geotech. Test. J. 2011, 35, 150–158. [Google Scholar]
  3. Zhan, L.; Wu, T.; Feng, S.; Lan, J.-W.; Chen, Y.-M. A simple and rapid in situ method for measuring landfill gas emissions and methane oxidation rates in landfill covers. Waste Manag. Res. 2020, 38, 588–593. [Google Scholar] [CrossRef] [PubMed]
  4. Duan, Z.; Scheutz, C.; Kjeldsen, P. Trace gas emissions from municipal solid waste landfills: A review. Waste Manag. 2021, 119, 39–62. [Google Scholar] [CrossRef] [PubMed]
  5. Huang, D.; Du, Y.; Xu, Q.; Ko, J.H. Quantification and Control of Gaseous Emissions from Solid Waste Landfill Surfaces. J. Environ. Manag. 2022, 302, 114001. [Google Scholar] [CrossRef] [PubMed]
  6. Beck-Broichsitter, S.; Fleige, H.; Gerke, H.H.; Horn, R. Effect of artificial soil compaction in landfill capping systems on anisotropy of air-permeability. J. Plant Nutr. Soil Sci. 2020, 183, 144–154. [Google Scholar] [CrossRef]
  7. Tang, A.M.; Cui, Y.J.; Richard, G.; Défossez, P. A study on the air permeability as affected by compression of three French soils. Geoderma 2011, 162, 171–181. [Google Scholar] [CrossRef]
  8. Garg, A.; Huang, H.; Cai, W.; Reddy, N.G.; Chen, P.; Han, Y.; Kamchoom, V.; Gaurav, S.; Zhu, H.-H. Influence of soil density on gas permeability and water retention in soils amended with in-house produced biochar. J. Rock Mech. Geotech. Eng. 2021, 13, 593–602. [Google Scholar] [CrossRef]
  9. Zeng, Y.; Su, Z.; Wan, L.; Wen, J. Numerical Analysis of Air-Water-Heat Flow in Unsaturated Soil: Is It Necessary to Consider Airflow in Land Surface Models? J. Geophys. Res. 2011, 116, D20107. [Google Scholar] [CrossRef]
  10. Li, X.; Zhou, H.; Chen, B.; Song, X.; Liu, Z.; Zhao, J.; Yin, G.; Li, Y.; Zong, Y.; Li, Q.; et al. Effects of Different Degrees of Hydrophobic Treatment on Soil–Water Characteristic Curves and Infiltration Coefficients of Hygroscopic Soils. Coatings 2022, 12, 1424. [Google Scholar] [CrossRef]
  11. Klinkenberg, L.J. The Permeability Porous Media to Liquids Gases; American Petroleum Institute Drilling and Production-Practice: Washington, DC, USA, 1941. [Google Scholar]
  12. Almutairi, M.S. A comprehensive review of soft computing models for permeability prediction. IEEE Access 2020, 9, 4911–4922. [Google Scholar] [CrossRef]
  13. Li, S.; Dong, M.; Li, Z.; Huang, S.; Qing, H.; Nickel, E. Gas breakthrough pressure for hydrocarbon reservoir seal rocks: Implications for the security of long-term CO2 storage in the Weyburn field. Geofluids 2005, 5, 326–334. [Google Scholar] [CrossRef]
  14. Hernández, P.A.; Notsu, K.; Okada, H.; Mori, T.; Sato, M.; Barahona, F.; Pérez, N.M. Diffuse Emission of CO2 from Showa-Shinzan, Hokkaido, Japan: A Sign of Volcanic Dome Degassing. Pure Appl. Geophys. 2006, 163, 869–881. [Google Scholar] [CrossRef]
  15. Yue, P.; Zhang, R.; Sheng, J.J.; Yu, G.; Liu, F. Study on the influential factors of CO2 storage in low permeability reservoir. Energies 2022, 15, 344. [Google Scholar] [CrossRef]
  16. Zeng, G. Study on landfill gas migration in landfilled municipal solid waste based on gas–solid coupling model. Environ. Prog. Sustain. Energy 2020, 39, e13352. [Google Scholar] [CrossRef]
  17. Wu, T.; Pan, Z.; Connell, L.D.; Liu, B.; Fu, X.; Xue, Z. Gas breakthrough pressure of tight rocks: A review of experimental methods and data. J. Nat. Gas Sci. Eng. 2020, 81, 103408. [Google Scholar] [CrossRef]
  18. Li, Y.; Guan, C.; Chen, X.; Qi, H.; He, S.; Hu, W. The contribution of low temperature oxidation of heavy crude oil to oil displacement efficiency during air injection in low permeability reservoirs. Pet. Sci. Technol. 2021, 39, 373–380. [Google Scholar] [CrossRef]
  19. Shao, Y.X.; Shi, B.; Liu, C.; Gao, L. Experimental study on temperature effect on engineering properties of clayey soils. Adv. Mater. Res. 2012, 512, 1905–1918. [Google Scholar] [CrossRef]
  20. Joshaghani, M.; Ghasemi-Fare, O. Exploring the effects of temperature on intrinsic permeability and void ratio alteration through temperature-controlled experiments. Eng. Geol. 2021, 293, 106299. [Google Scholar] [CrossRef]
  21. Bouazza, A.; Nahlawi, H.; Aylward, M. In situ temperature monitoring in an organic-waste landfill cell. J. Geotech. Geoenviron. Eng. 2011, 137, 1286–1289. [Google Scholar] [CrossRef]
  22. Zhang, T.; Shi, J.; Qian, X.; Ai, Y. Temperature and gas pressure monitoring and leachate pumping tests in a newly filled MSW layer of a landfill. Int. J. Environ. Res. 2019, 13, 1–19. [Google Scholar] [CrossRef]
  23. Farhangmehr, V.; Cobo, J.H.; Mohammadian, A.; Payeur, P.; Shirkhani, H.; Imanian, H. A Convolutional Neural Network Model for Soil Temperature Prediction under Ordinary and Hot Weather Conditions: Comparison with a Multilayer Perceptron Model. Sustainability 2023, 15, 7897. [Google Scholar] [CrossRef]
  24. Chen, R.; Huang, J.W.; Zhou, C.; Ping, Y.; Chen, Z.K. A new simple and low-cost gas permeameter for unsaturated soils. Soil Tillage Res. 2021, 213, 105083. [Google Scholar] [CrossRef]
  25. Chen, Z.H.; Xie, D.Y.; Wang, Y.S. Experimental studies of laws of fluid motion, suction and pore pressures in unsaturated soil. Chin. J. Geotech. Eng. 1993, 15, 9–20. [Google Scholar]
  26. Li, H.; Jiao, J.J.; Luk, M. A falling-pressure method for measuring air permeability of asphalt in laboratory. J. Hydrol. 2004, 286, 69–77. [Google Scholar] [CrossRef]
  27. Zhao, M.; He, H. Experiment on water-gas permeability of unsaturated loess. J. Xi’an Univ. Sci. Technol. 2005, 25, 292–295. [Google Scholar]
  28. Wang, Y.; Cui, Y.J.; Tang, A.M.; Benahmed, N.; Duc, M. Effects of aggregate size on the compressibility and air permeability of lime-treated fine-grained soil. Eng. Geol. 2017, 228, 167–172. [Google Scholar] [CrossRef]
  29. Jian-yong, S.H.I.; Yi, Z. Influence of air pressure and void on permeability coefficient of air in municipal solid waste (MSW). Chin. J. Geotech. Eng. 2015, 37, 586–593. [Google Scholar]
  30. Huang, S.; Fredlund, D.G.; Barbour, S.L. Measurement of the coefficient of permeability for a deformable unsaturated soil using a triaxial permeameter. Can. Geotech. J. 1998, 35, 426–432. [Google Scholar] [CrossRef]
  31. Samingan, A.S.; Leong, E.C.; Rahardjo, H. A flexible wall permeameter for measurements of water and air coefficients of permeability of residual soils. Can. Geotech. J. 2003, 40, 559–574. [Google Scholar] [CrossRef]
  32. Chen, Z.; Chen, C.; Kamchoom, V.; Chen, R. Gas permeability and water retention of a repacked silty sand amended with different particle sizes of peanut shell biochar. Soil Sci. Soc. Am. J. 2020, 84, 1630–1641. [Google Scholar] [CrossRef]
  33. Li, M.-Y.; Sun, W.-J.; Wang, Y.-J.; Sun, D.-A.; Tan, Y.-Z. Air permeability of biochar-amended clay cover. Arab. J. Geosci. 2021, 14, 732. [Google Scholar] [CrossRef]
  34. Rahimi, A.; Rahardjo, H. Direct measurement of unsaturated permeability of kaolin-sand mixtures. Bull. Eng. Geol. Environ. 2023, 82, 88. [Google Scholar] [CrossRef]
  35. Barden, L.; Pavlakis, G. Air and water permeability of compacted unsaturated cohesive soil. J. Soil Sci. 1971, 22, 302–318. [Google Scholar] [CrossRef]
  36. Miao, Q.Q.; Chen, Z.H.; Zhang, L.; Huang, X.F.; Qian, N.G. Experimental study of gas permeability of unsaturated clayey sand. Rock Soil Mech. 2010, 31, 3746–3750. [Google Scholar]
  37. Chen, C.-L.; Zhang, D.-F.; Zhang, J.; Chen, H.; Yang, F.; Wu, K. Gas permeability of intact Q3 loess under isotropic stresses. Chin. J. Geotechnol. 2017, 39, 287–294. [Google Scholar]
  38. Wen, S.; Cheng, W.C.; Li, D.; Hu, W. Evaluating gas breakthrough pressure and gas permeability in a landfill cover layer for mitigation of hazardous gas emissions. J. Environ. Manag. 2023, 336, 117617. [Google Scholar] [CrossRef]
  39. Lu, S.F.; Han, Z.J.; Xu, L.; Lan, T.-G.; Wei, X.; Zhao, T.-Y. On measuring methods and influencing factors of air permeability of soils: An overview and a preliminary database. Geoderma 2023, 435, 116509. [Google Scholar] [CrossRef]
  40. McCarthy, E.L. Mariotte’s bottle. Science 1934, 80, 100. [Google Scholar] [CrossRef]
  41. Chen, Z.; Kamchoom, V.; Leung, A.K.; Xue, J.; Chen, R. Influence of biochar on the water permeability of compacted clay subjected to freezing–thawing cycles. Acta Geophys. 2023, 1–11. [Google Scholar] [CrossRef]
  42. Bear, J. Dynamics of Fluids in Porous Media; Elsevier: New York, NY, USA, 1972; p. 764. [Google Scholar]
  43. Silveira, L.R.; Brito, A.S.; Mota, J.C.A.; Moraes, S.O.; Libardi, P.L. Data acquisition system for measurement equipment of soil air permeability. Rev. Bras. Ciência Solo 2011, 35, 429–436. [Google Scholar] [CrossRef]
  44. Bobovnik, G.; Kutin, J. Experimental identification and correction of the leakage flow effects in a clearance-sealed piston prover. Metrologia 2018, 56, 015013. [Google Scholar] [CrossRef]
  45. Huang, W.; Chen, K.P. Thermal effect on drainage flow of a viscous gas from a semisealed narrow channel. Phys. Rev. Fluids 2019, 4, 084202. [Google Scholar] [CrossRef]
  46. Moon, S.; Nam, K.; Kim, J.Y.; Hwan, S.K.; Chung, M. Effectiveness of Compacted Soil Liner as a Gas Barrier Layer in the Landfill Final Cover System. Waste Manag. 2008, 28, 1909–1914. [Google Scholar] [CrossRef] [PubMed]
  47. Fredlund, D.G. Unsaturated soil mechanics in engineering practice. J. Geotech. Geoenviron. Eng. 2006, 132, 286–321. [Google Scholar] [CrossRef]
  48. Chen, R.; Chen, Z.K.; Zhang, M.; Deng, G. Applications of a high-capacity tensiometer for direct measurement of suction. J. Hydraul. Eng. 2013, 44, 743–747. [Google Scholar]
  49. ASTM. Standard Practice for Classification of Soils for Engineering Purpose (Unified Soil Classification System); American Society of Testing and Materials: West Conshohocken, PA, USA, 2020. [Google Scholar]
  50. Ladd, R.S. Preparing test specimens using undercompaction. ASTM Geotech. Test. J. 1978, 1, 16–23. [Google Scholar]
  51. Tarantino, A.; Mongiovì, L. Calibration of tensiometer for direct measurement of matric suction. Géotechnique 2003, 53, 137–141. [Google Scholar] [CrossRef]
  52. Lourenço SD, N.; Gallipoli, D.; Toll, D.G.; Augarde, C.E.; Evans, F.D.; Medero, G.M. Calibrations of a high-suction tensiometer. Géotechnique 2008, 58, 659–668. [Google Scholar] [CrossRef]
  53. Bloomfield, J.P.; Williams, A.T. An empirical liquid permeability—Gas permeability correlation for use in aquifer properties studies. Q. J. Eng. Geol. Hydrogeol. 1995, 28 (Suppl. S2), S143–S150. [Google Scholar] [CrossRef]
  54. Zhai, Q.; Zhu, Y.; Rahardjo, H.; Satyanaga, A.; Dai, G.; Gong, W.; Zhao, X.; Ou, Y. Prediction of the soil–water characteristic curves for the fine-grained soils with different initial void ratios. Acta Geotech. 2023, 18, 5359–5368. [Google Scholar] [CrossRef]
  55. Tadepalli, R.; Rahardjo, H.; Fredlund, D.G. Measurements of matric suction and volume changes during inundation of collapsible soil. Geotech. Test. J. 1992, 15, 115–122. [Google Scholar]
  56. Kaye GW, C.; Laby, T.H. Tables of Physical and Chemical Constants and Some Mathematical Functions; Longmans: London, UK, 1926; p. 386. [Google Scholar]
  57. Cheng, Q.; Zhou, C.; Ng, C.W.W.; Tang, C. Thermal effects on water retention behaviour of unsaturated collapsible loess. J. Soils Sediments 2020, 20, 756–762. [Google Scholar] [CrossRef]
  58. Uchaipichat, A.; Khalili, N. Experimental investigation of thermo-hydro-mechanical behaviour of an unsaturated silt. Géotechnique 2009, 59, 339–353. [Google Scholar] [CrossRef]
  59. Fredlund, M.D.; Wilson, G.W.; Fredlund, D.G. Representation and estimation of the shrinkage curve. In Proceedings of the 3rd International Conference on Unsaturated Soils, UNSAT 2002, Recife, Brazil, 10–13 March 2002; pp. 145–149. [Google Scholar]
  60. Fredlund, D.G.; Houston, S.L. Interpretation of soil-water characteristic curves when volume change occurs as soil suction is changed. Adv. Unsaturated Soils 2013, 1, 15. [Google Scholar]
  61. Tuli, A.; Hopmans, J.W.; Rolston, D.E.; Moldrup, P. Comparison of air and water permeability between disturbed and undisturbed soils. Soil Sci. Soc. Am. J. 2005, 69, 1361–1371. [Google Scholar] [CrossRef]
  62. Zhai, Q.; Rahardjo, H.; Satyanaga, A. Estimation of air permeability function from soil-water characteristic curve. Can. Geotech. J. 2019, 56, 505–513. [Google Scholar] [CrossRef]
  63. Moldrup, P.; Yoshikawa, S.; Olesen, T.; Komatsu, T.; Rolston, D.E. Air permeability in undisturbed volcanic ash soils: Predictive model test and soil structure fingerprint. Soil Sci. Soc. Am. J. 2003, 67, 32–40. [Google Scholar] [CrossRef]
  64. Poulsen, T.G.; Moldrup, P. Air permeability of compost as related to bulk density and volumetric air content. Waste Manag. Res. 2007, 25, 343–351. [Google Scholar] [CrossRef]
  65. Arthur, E.; Moldrup, P.; Schjønning, P.; de Jonge, L.W. Linking particle and pore size distribution parameters to soil gas transport properties. Soil Sci. Soc. Am. J. 2012, 76, 18–27. [Google Scholar] [CrossRef]
  66. Camarda, M.; Prano, V.; Cappuzzo, S.; Gurrieri, S.; Valenza, M. Temporal variations in air permeability and soil CO2 flux in volcanic ash soils (island of Vulcano, Italy). Geochem. Geophys. Geosystems 2017, 18, 3241–3253. [Google Scholar] [CrossRef]
  67. Kawamoto, K.; Moldrup, P.; Schjønning, P.; Iversen, B.V.; Komatsu, T.; Rolston, D.E. Gas transport parameters in the vadose zone: Development and tests of power-law models for air permeability. Vadose Zone J. 2006, 5, 1205–1215. [Google Scholar] [CrossRef]
  68. Olivella, S.; Alonso, E.E. Gas flow through clay barriers. Géotechnique 2008, 58, 157–176. [Google Scholar] [CrossRef]
  69. Hamamoto, S.; Moldrup, P.; Kawamoto, K.; Komatsu, T.; Rolston, D.E. Unified measurement system for the gas dispersion coefficient, air permeability, and gas diffusion coefficient in variably saturated soil. Soil Sci. Soc. Am. J. 2009, 73, 1921–1930. [Google Scholar] [CrossRef]
  70. Beltrán-Torres, S.; Szabó, K.Z.; Tóth, G.; Tóth-Bodrogi, E.; Kovács, T.; Szabó, C. Estimated versus field measured soil gas radon concentration and soil gas permeability. J. Environ. Radioact. 2023, 265, 107224. [Google Scholar] [CrossRef] [PubMed]
  71. Wickramarachchi, P.; Kawamoto, K.; Hamamoto, S.; Nagamori, M.; Moldrup, P.; Komatsu, T. Effects of Dry Bulk Density and Particle Size Fraction on Gas Transport Parameters in Variably Saturated Landfill Cover Soil. Waste Manag. 2011, 31, 2464–2472. [Google Scholar] [CrossRef] [PubMed]
  72. Nazir, M.; Kawamoto, K.; Sakaki, T.; Komatsu, T.; Moldrup, P. Gas transport parameters of differently compacted granulated bentonite mixtures (GBMs) under air-dried conditions. Soils Found. 2022, 62, 101223. [Google Scholar] [CrossRef]
Figure 1. Schematic of apparatus for soil gas permeability using low-gas-pressure supply equipment.
Applsci 13 10943 g001
Figure 2. Photograph of low-gas-pressure supply equipment.
Applsci 13 10943 g002
Figure 3. Set up of equipment for soil gas permeability measurement subjected to different temperatures.
Applsci 13 10943 g003
Figure 4. Particle size distribution of soil specimen.
Applsci 13 10943 g004
Figure 5. Calibration of (a) differential pressure transducer for gas supply equipment; (b) temperature sensor and (c) tensiometer.
Applsci 13 10943 g005aApplsci 13 10943 g005b
Figure 6. Measured water volume changes through soil specimen with the gravimetric water content of 13%.
Applsci 13 10943 g006
Figure 7. Comparison of average volumetric air flow rate under different pressure drops across the specimen (data obtained from Chen et al. [24]).
Applsci 13 10943 g007
Figure 8. Change of void ratio at different gravimetric water content (curves obtained from Zhai et al. [54]).
Applsci 13 10943 g008
Figure 9. Relationship between intrinsic permeability and negative pore water pressure (curves obtained from Tuli et al. [61] and Zhai et al. [62]).
Applsci 13 10943 g009
Figure 10. Relationship between intrinsic permeability and volumetric gas content (curves obtained from Nazir et al. [72]).
Applsci 13 10943 g010
Table 1. Basic properties and characteristics of the test devices.
Air Permeameter ReferenceAir
Pressure
Pressure Fluctuation RangeAir Supply
Device
AdvantageDisadvantage
Flexible wall improved Huang et al.,
1998 [30]
10, 25, 40,
50, 70,
100, 120 kPa
15 kPaGas cylinder Ability to
apply
confining pressure
Fluctuation of gas pressure;
Uncontrollable temperature
Flexible wall improved Saminan
et al.,
2003 [31]
60, 110,
168, 240 kPa
4 kPa Stepper
motor
and gearbox;
pressure
cylinder and piston
Ability to
apply
confining pressure
Fluctuation of gas pressure;
Uncontrollable temperature
Triaxial improved Miao et al.,
2010 [36]
5, 10, 20, 30, 40, 50,
60 kPa
3.2 kPaWater tank Volume test withwater instead of airIgnorance of gas compressibility;
Uncontrollable temperature
Solid-wall improvedShi et al.,
2015 [29]
2, 3, 4, 6, 7,
10, 12, 16,
20 kPa
1.5 kPaAir compressor Uniform
water
content of the specimen
Lack of ability to control peripatetic pressure;
Uncontrollable temperature
Table 2. Index properties of soil specimen.
Soil TypeMeasured Value
Unified soil classification systemML
Liquid limit, LL (%)22
Plastic limit, PL (%)16
Grain size distribution
D60 (mm)0.027
D30 (mm)0.007
D10 (mm)0.002
Coefficient of uniformity, Cu13.5
Coefficient of curvature, Cc0.91
Fine content (<0.075 mm; %)
Dry density, ρd (Mg/m3)
25
1.41
Disclaimer/Publisher’s Note: The statements, opinions and data contained in all publications are solely those of the individual author(s) and contributor(s) and not of MDPI and/or the editor(s). MDPI and/or the editor(s) disclaim responsibility for any injury to people or property resulting from any ideas, methods, instructions or products referred to in the content.

