Article

Modeling the Effects of Particle Shape on Damping Ratio of Dry Sand by Simple Shear Testing and Artificial Intelligence

by
Abolfazl Baghbani
1,*,
Susanga Costa
1,
Roohollah Shirani Faradonbeh
2,*,
Amin Soltani
3 and
Hasan Baghbani
4
1
School of Engineering, Deakin University, Waurn Ponds, VIC 3216, Australia
2
WA School of Mines: Minerals, Energy and Chemical Engineering, Curtin University, Kalgoorlie, WA 6430, Australia
3
Institute of Innovation, Science and Sustainability, Federation University, Churchill, VIC 3842, Australia
4
School of Engineering, Ferdowsi University of Mashhad, Mashhad 9177948974, Iran
*
Authors to whom correspondence should be addressed.
Appl. Sci. 2023, 13(7), 4363; https://doi.org/10.3390/app13074363
Submission received: 28 February 2023 / Revised: 28 March 2023 / Accepted: 28 March 2023 / Published: 29 March 2023

Abstract

:
This study investigates the effects of sand particle shape, in terms of roundness, sphericity and regularity, on the damping ratio of a dry sand material. Twelve different cyclic simple shear testing scenarios were considered and applied using vertical stresses of 50, 150 and 250 kPa and cyclic stress ratios (CSR) of 0.2, 0.3, 0.4 and 0.5 in both constant- and controlled-stress modes. Each testing scenario involved five tests, using the same sand that was reconstructed from its previous cyclic test. On completion of the cyclic tests, corresponding hysteresis loops were established to determine the damping ratio. The results indicated that the minimum and maximum damping ratios for this sand material were 6.9 and 25.5, respectively. It was observed that the shape of the sand particles changed during cyclic loading, becoming progressively more rounded and spherical with an increasing number of loading cycles, thereby resulting in an increase in the damping ratio. The second part of this investigation involved the development of artificial intelligence models, namely an artificial neural network (ANN) and a support vector machine (SVM), to predict the effects of sand particle shape on the damping ratio. The proposed ANN and SVM models were found to be effective in predicting the damping ratio as a function of the particle shape descriptors (i.e., roundness, sphericity and regularity), vertical stress, CSR and number of loading cycles. Finally, a sensitivity analysis was conducted to identify the importance of the input variables; the vertical stress and regularity were, respectively, ranked as first and second in terms of importance, while the CSR was found to be the least important parameter.

1. Introduction

The damping ratio is a fundamental soil property that determines its response to various dynamic loading scenarios, including earthquakes, vibrations and machine operations [1,2,3,4]. The damping ratio is influenced by several factors, namely soil type, grain-size distribution, soil particle shape and confining pressure. Many researchers are interested in the effects of particle shape on the damping ratio of sand [5,6,7,8,9,10].
Previous investigations have demonstrated that the damping ratio of sand tends to decrease with increasing strain amplitude [7,11,12]. As the amplitude of cyclic loading increases, the soil particles undergo more severe deformations, thereby rendering the energy dissipation through damping less effective. Accordingly, it is important to consider the effects of strain amplitude when evaluating the damping ratio of sand [7,11,12].
Stress history can also influence the soil’s damping attributes [13,14]. For instance, cyclic loading can result in the development of excess pore pressure, which can affect the soil’s damping response [15]. The buildup of excess pore pressure can cause changes in the effective stress, which in turn alters the soil stiffness and damping behavior. Moreover, the magnitude and duration of cyclic loading can influence the stress history of the soil, thereby impacting the damping ratio [16].
The sand’s saturation degree can also affect its damping properties [17,18,19,20]. In general, the damping ratio tends to increase with increasing saturation, as the presence of water within the soil matrix provides a pathway for energy dissipation through viscous damping. As the saturation degree increases, the viscous damping effect becomes more prominent, leading to a higher damping ratio. However, it should be noted that the effects of saturation on damping are not always consistent and depend on other factors, including soil type and loading conditions [17,18,19,20].
The confining pressure is another parameter that influences the damping ratio of sands. Referring to Bayat et al. [21], the damping ratio of sands decreases as the confining pressure increases. Other reported variables that can influence the damping ratio of sands include moisture content and loading frequency; an increase in these parameters has been reported to, respectively, increase [22] and decrease [23] the damping ratio. The grain-size distribution, or uniformity coefficient, has also been investigated for its influence on the damping ratio of sands. Referring to Wichtmann et al. [24], the damping ratio of sands decreases as the gradational uniformity increases. In view of the above, it is evident that several interrelated variables can influence the damping ratio of sands, including grain-size distribution, sand particle shape, confining pressure, moisture content (and saturation) and loading frequency [25,26,27,28,29,30,31]. Hence, the complex relationship between these interrelated parameters and the damping ratio (of sands) warrants further investigation.
As of late, the application of artificial intelligence (AI) models, such as artificial neural networks (ANNs), has become increasingly popular (and accepted) in solving diverse engineering problems due to their ability to learn and generalize complex nonlinear relationships between input and output variables [20]. Conventional neural networks have been successfully applied in various engineering fields, including (but not limited to) civil, geotechnical, mechanical and electrical engineering. The success of these conventional AI-based models has led to the development of novel techniques and algorithms, such as deep learning, which have demonstrated even more promise in solving complex engineering problems. The feasibility of neural networks in engineering highlights their potential to provide insights and solutions to multifaceted problems that may not have been possible (in the past) using traditional analytical and statistical methods.
The available literature on the application of AI-based models to investigate the complex relationship between various governing variables and the damping ratio of sands is still fairly limited [32,33,34,35,36]. Cabalar and Cevik [32] presented neural network models for predicting the damping ratio and shear modulus of sand–mica mixtures based on stress, mica content and strain. The reported models were established using experimental data from consolidated torsional resonant column tests on various mixtures of mica and Leighton Buzzard sand. The predictive performance of their models was found to be high, with R2 = 0.97 and 0.99 for the damping ratio and shear modulus parameters, respectively. Keshavarz and Mehramiri [33] proposed models based on gene expression programming (GEP) to predict the normalized shear modulus and the damping ratio of sands as a function of the mean effective confining pressure, void ratio and shear strain percentage; their proposed models were validated using published experimental data from the literature. Their GEP-based models demonstrated acceptable accuracy, with relative error margins lower than ±6% and ±2% for the normalized shear modulus and damping ratio parameters, respectively. In another study performed by Akbulut et al. [34], a neuro-fuzzy network was developed to model the dynamic behaviors of sand–rubber mixtures under varying conditions. Three predictive systems were trained and tested, using experimental data, to predict the shear modulus and damping ratio parameters. The study found that the adaptive neuro-fuzzy inference system (ANFIS) was the most effective method for predicting the dynamic behaviors of the composite materials, and further investigations of this paradigm were encouraged.
The present study contributes significantly to the research literature by being the first of its kind to systematically investigate the effects of sand particle shape on the damping ratio of dry sand where the minerals are identical and the only variable is the shape and size of the sand particles. The study’s unique approach involves the application of cyclic loading tests to examine the effects of cyclic stress ratio (CSR) loading on the relationship between particle shape and the damping ratio. This type of cyclic loading is particularly useful as it can simulate the impacts of earthquakes, which are important in geotechnical engineering practice. The first objective was to experimentally investigate the effects of particle shape on the damping ratio of dry sands. To this end, a series of sand samples with different particle shapes were tested in a cyclic simple shear apparatus in both constant-stress and controlled-stress modes to determine the damping ratio under different scenarios. The analysis of the test results was then incorporated into different correlations in the form of curves.
The second objective of this study involved performing a pioneering investigation into the use of AI-based models for predicting the damping ratio as a function of sand particle shape, vertical stress, CSR and the number of loading cycles. Although AI-based methods have been successfully employed in different areas of geotechnical engineering [37,38,39,40,41,42,43,44], this study marks the first time they were applied to the aforementioned problem. This study represents an important step toward expanding the application of AI-based models in geotechnical engineering. Finally, in developing the AI-based models, the study focuses on analyzing the importance of the input parameters to gain a better understanding of how they impact damping ratio predictions.

2. Materials and Methods

2.1. Test Sand

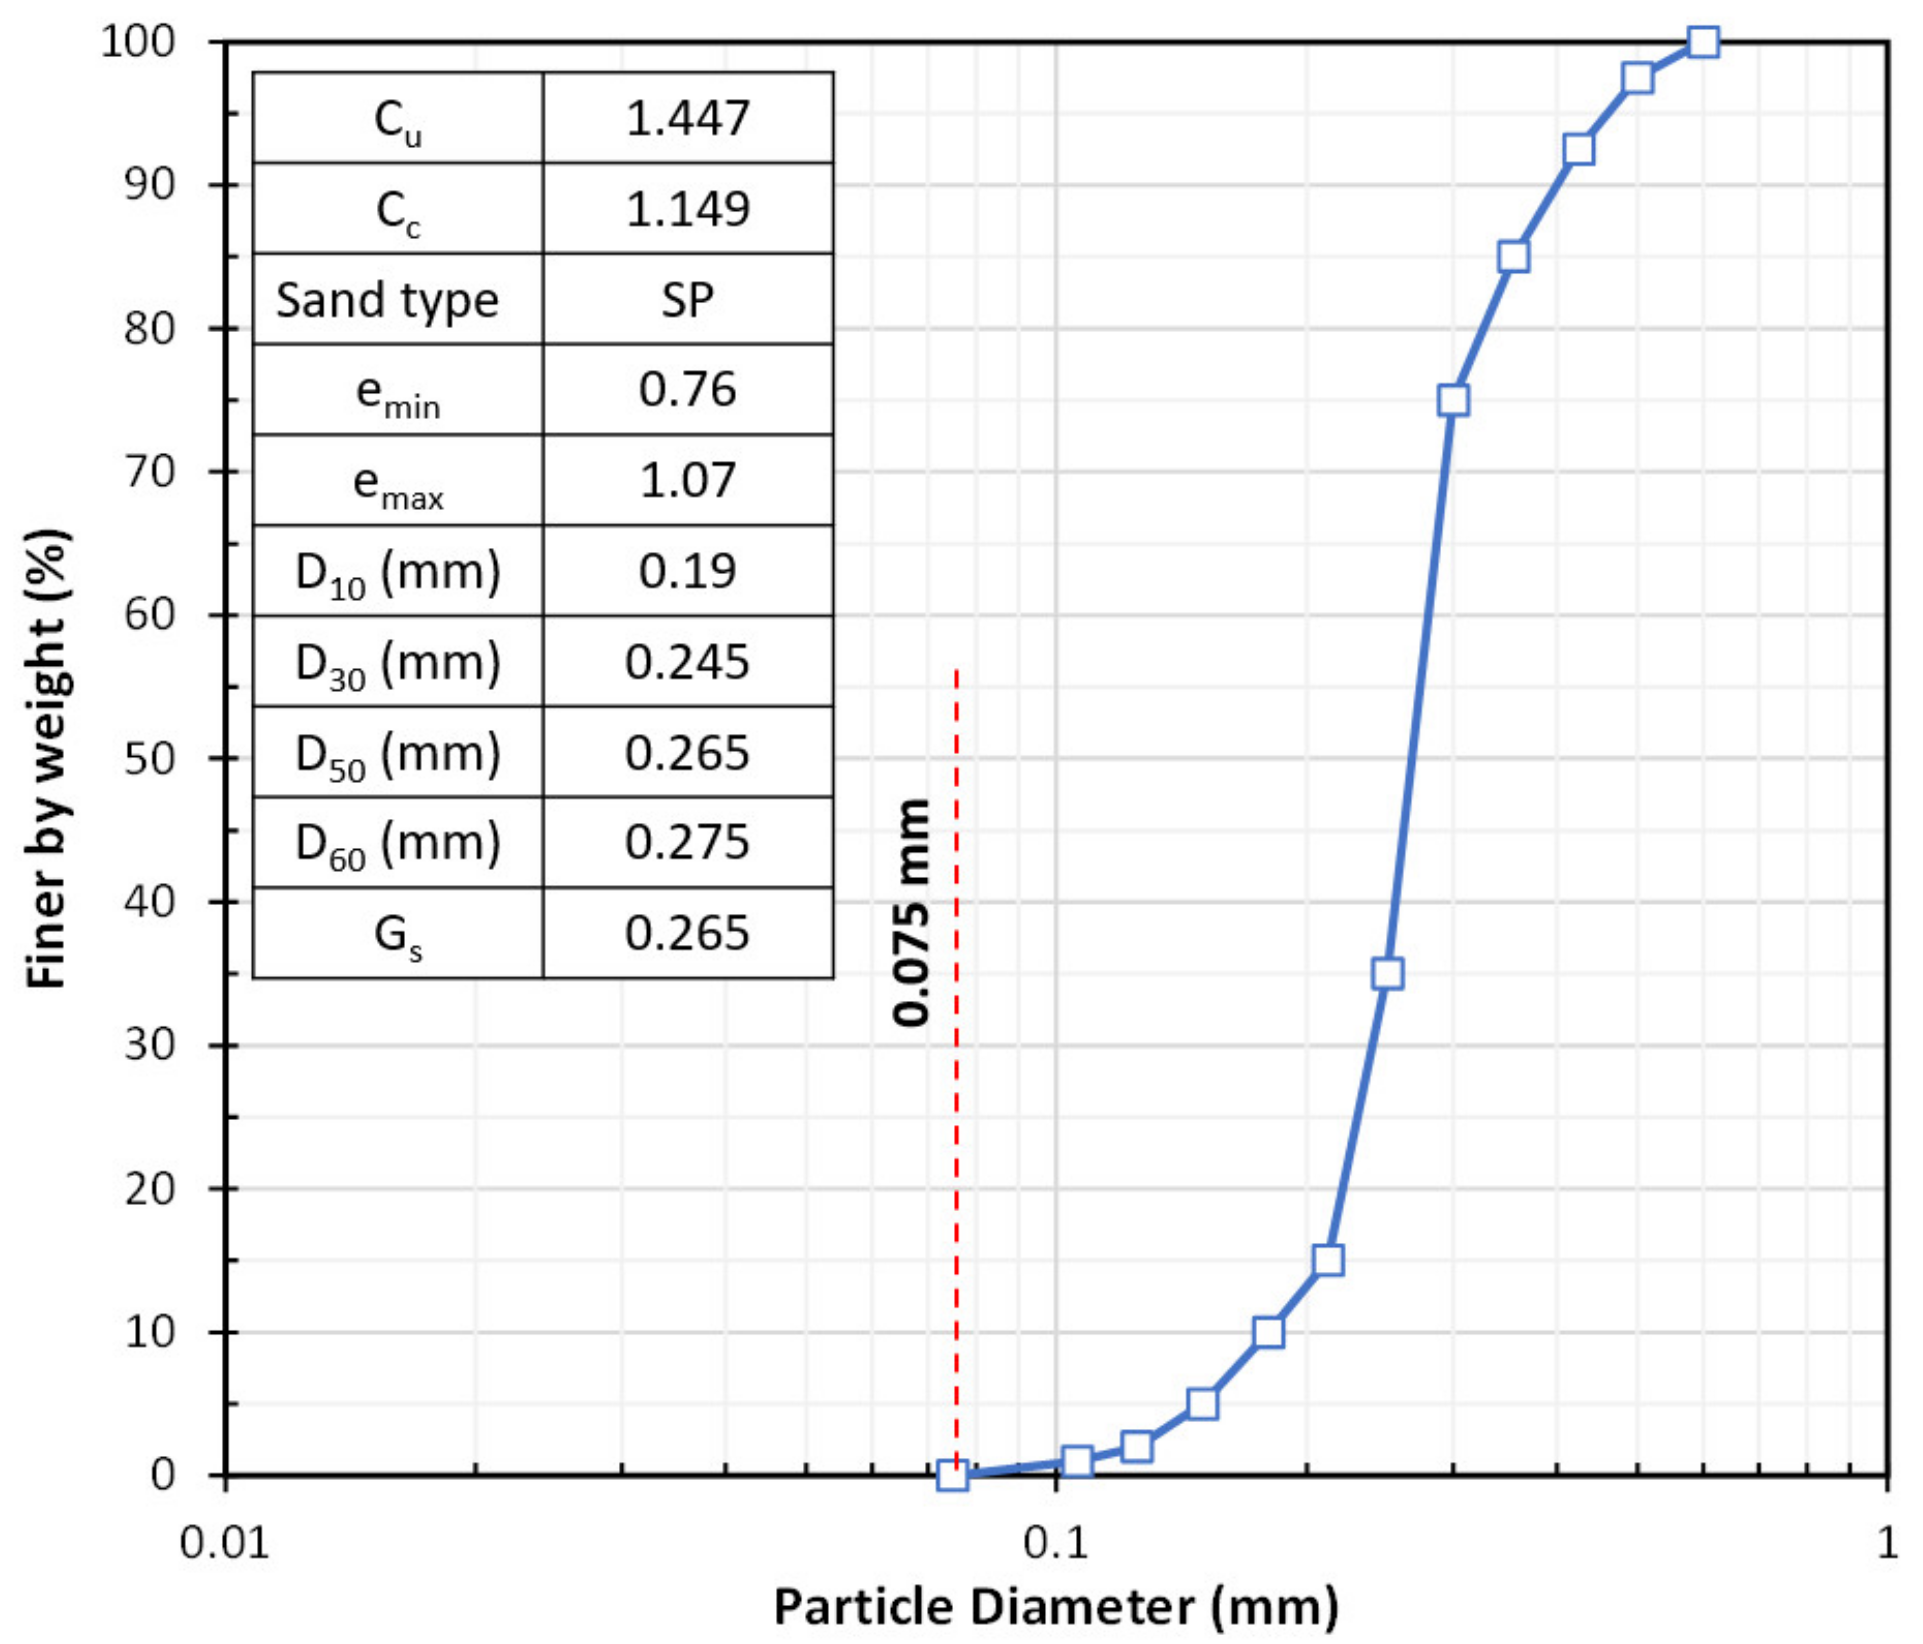
The grain-size distribution curve of the test sand, obtained through the conventional sieve analysis test performed, is provided in Figure 1. The particle diameters corresponding to 10%, 30%, 50% and 60% finer were obtained as D10 = 0.19 mm, D30 = 0.245 mm, D50 = 0.265 mm and D60 = 0.275 mm. In view of these values, the uniformity (i.e., Cu = D60/D10) and curvature (i.e., Cc = D302/(D10D60)) coefficients were calculated as 1.447 and 1.149, respectively; these values indicate that the test sand is poorly graded (i.e., SP) based on the Unified Soil Classification System (USCS) [45].
Other physical attributes of the test sand included a specific gravity of Gs = 2.65 (measured as per ASTM D854 [45]), along with maximum and minimum void ratios (measured as per ASTM D4253 [46] and ASTM D4254 [47]) of emax = 1.07 and emin = 0.76, respectively. In view of the emax and emin values, the test sand can be characterized as having relatively poor compactability. It should be mentioned that the mineralogical composition of the examined sand was dominated primarily by silica, along with traces of 2.3% magnesium silicate and 1.2% ferric oxide.

2.2. Dynamic Simple Shear Apparatus and Testing Plan

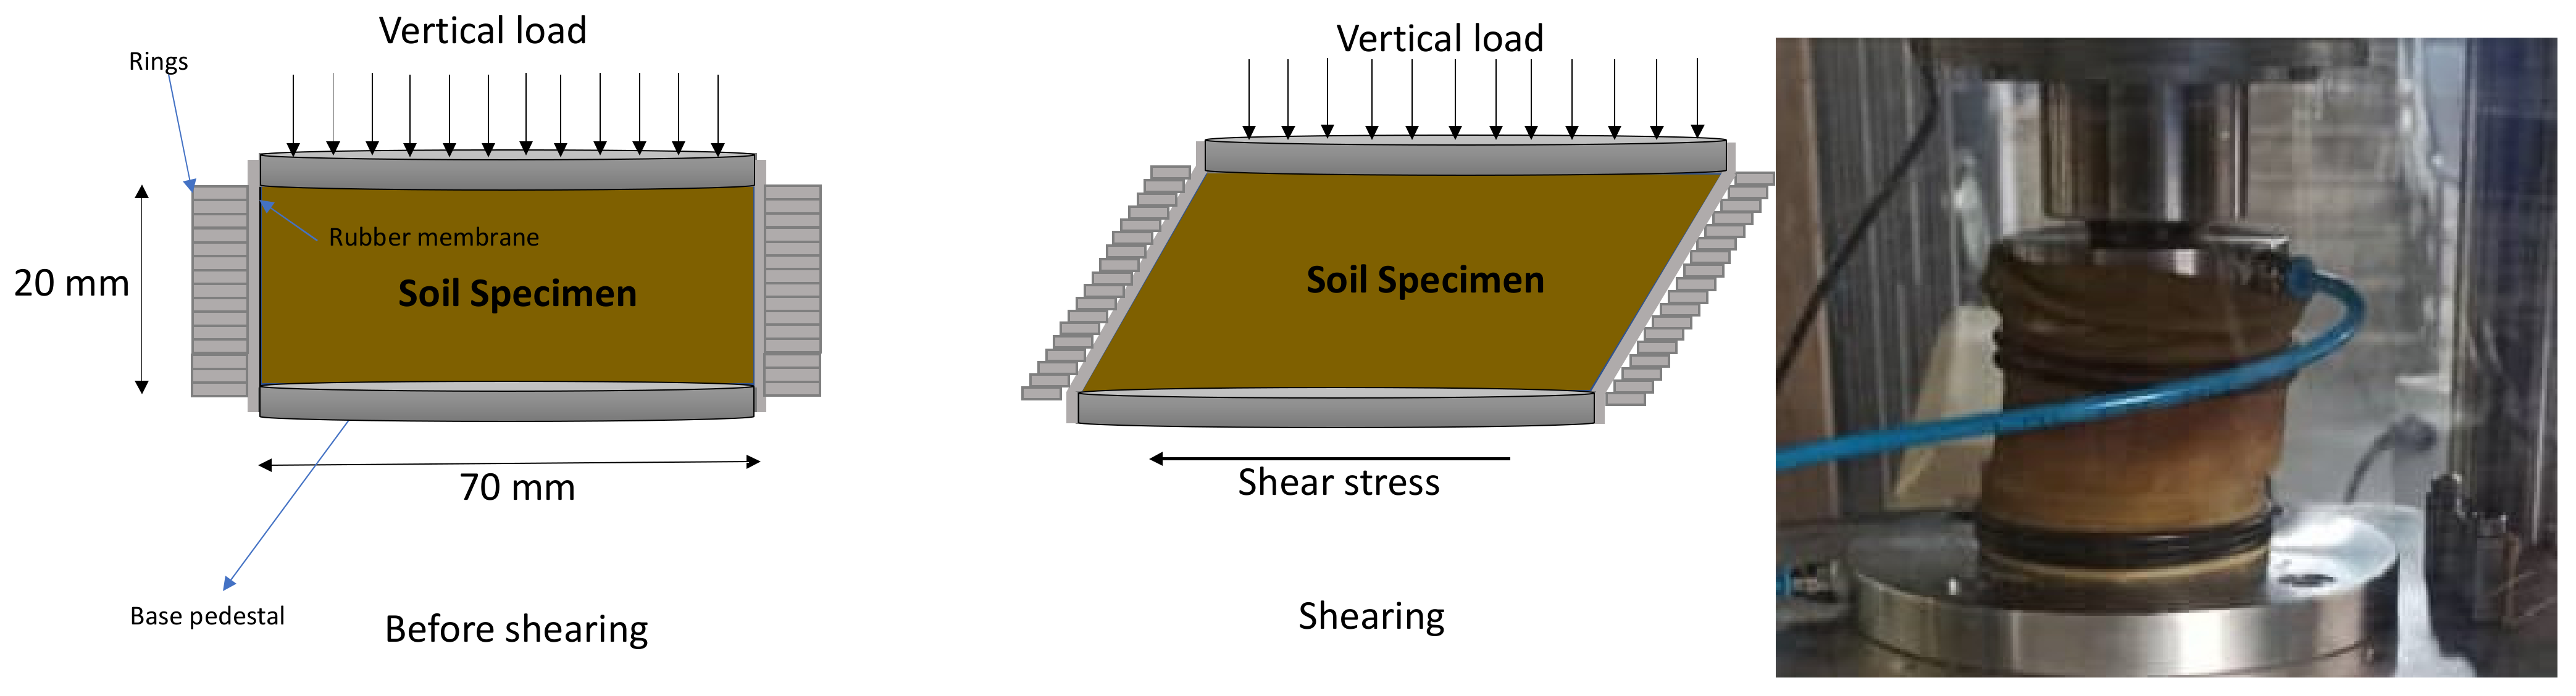
A two-dimensional simple shear test scheme was employed to assess the dynamic properties of the test sand under cyclic loading conditions. The test involved applying forces in two directions: a vertical force along the sample’s axis and a shear force parallel to its horizontal surface. The cyclic shear stress was applied to the samples sinusoidally using the dynamic simple shear apparatus, and the frequency of the device was 0.5 Hz. The samples, measuring 70 mm in diameter and 20 mm in height, were prepared using dry sand following the wet tamping method with a moisture content of 7%, as per Ladd [48].
Figure 2 provides a schematic illustration of the described dynamic simple shear test. This testing scheme is useful in determining the shear strength, deformation characteristics, and stress–strain response of sand samples [49]. The data obtained from such testing regimes are crucial in understanding the response of sandy materials to cyclic loading, which is relevant to various geoengineering applications, including the design of foundations, retaining walls and embankments.
Before investigating the dynamic properties of the test sand through cyclic testing, a series of monotonic tests were also performed, which indicated a dilative behavior for the investigated sand, as also noted by Baghbani et al. [
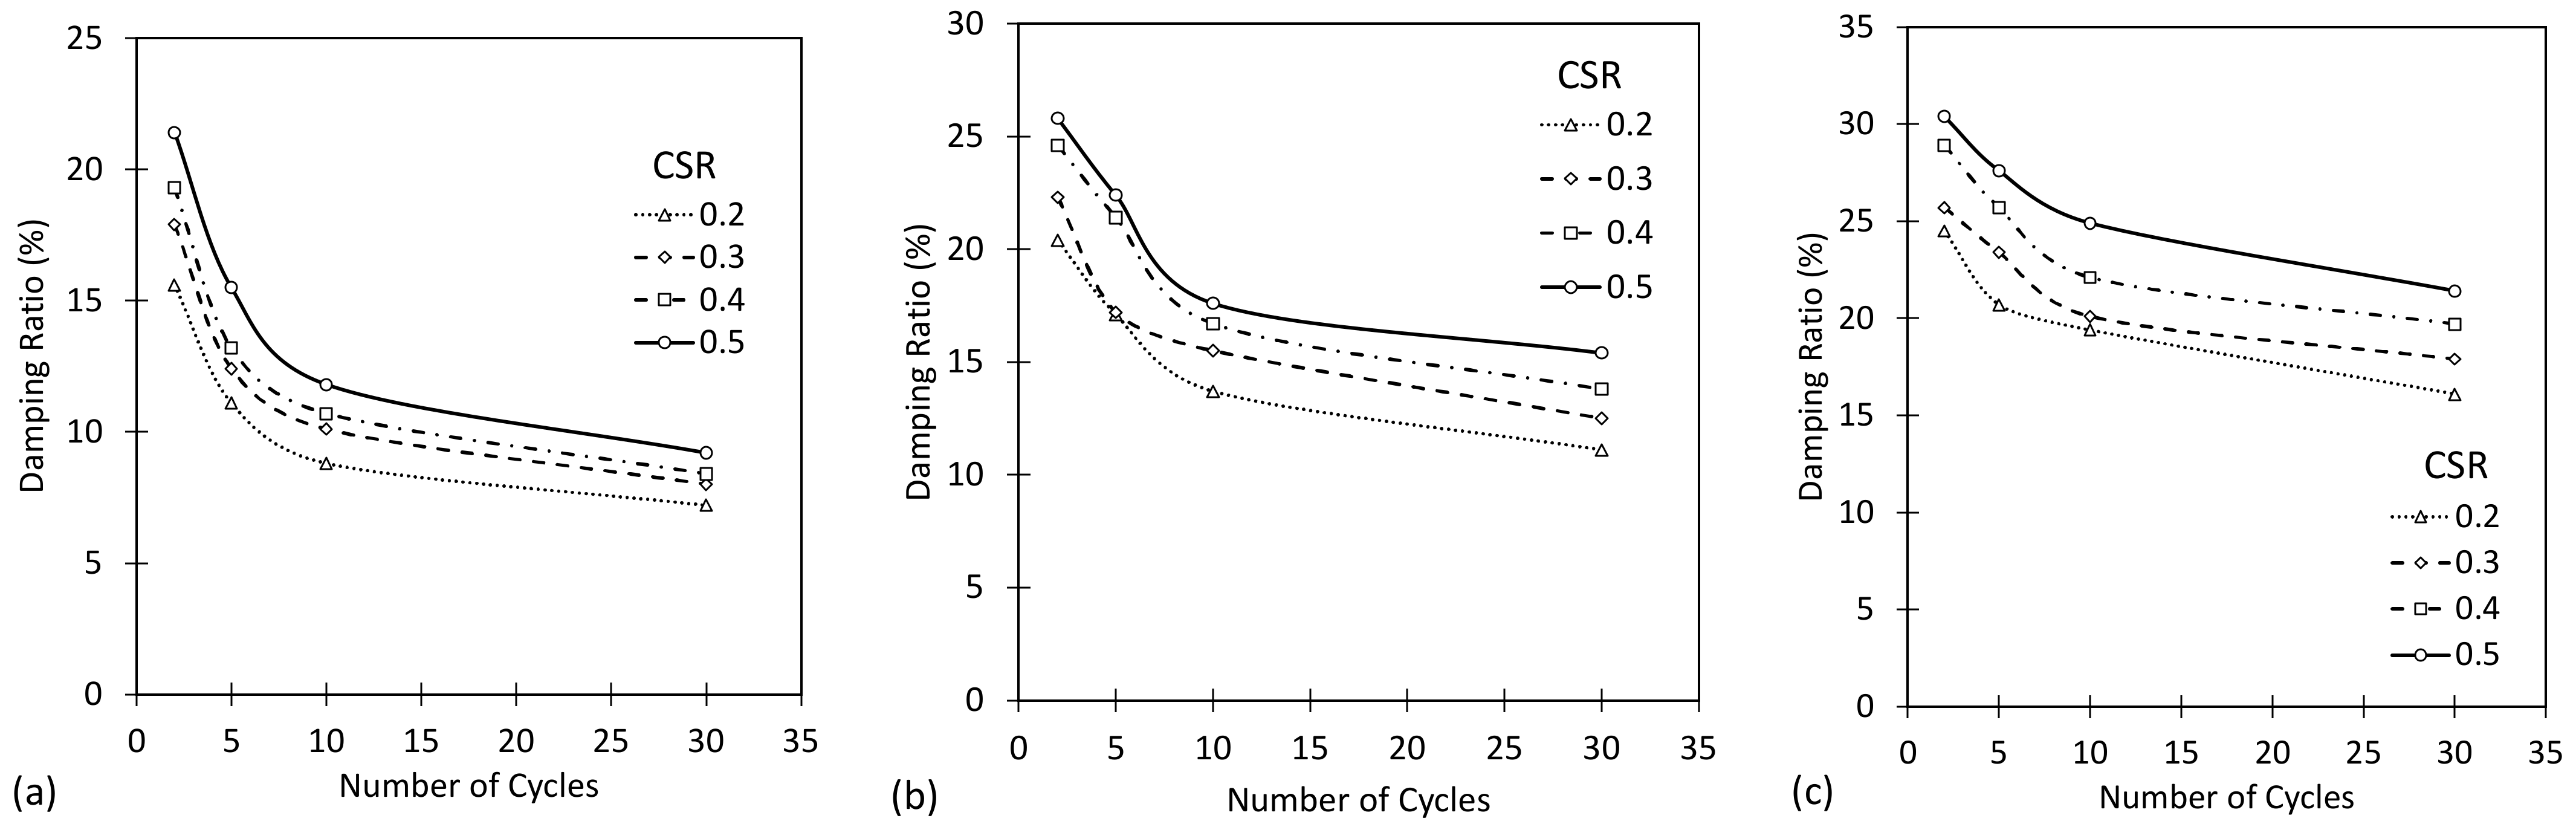
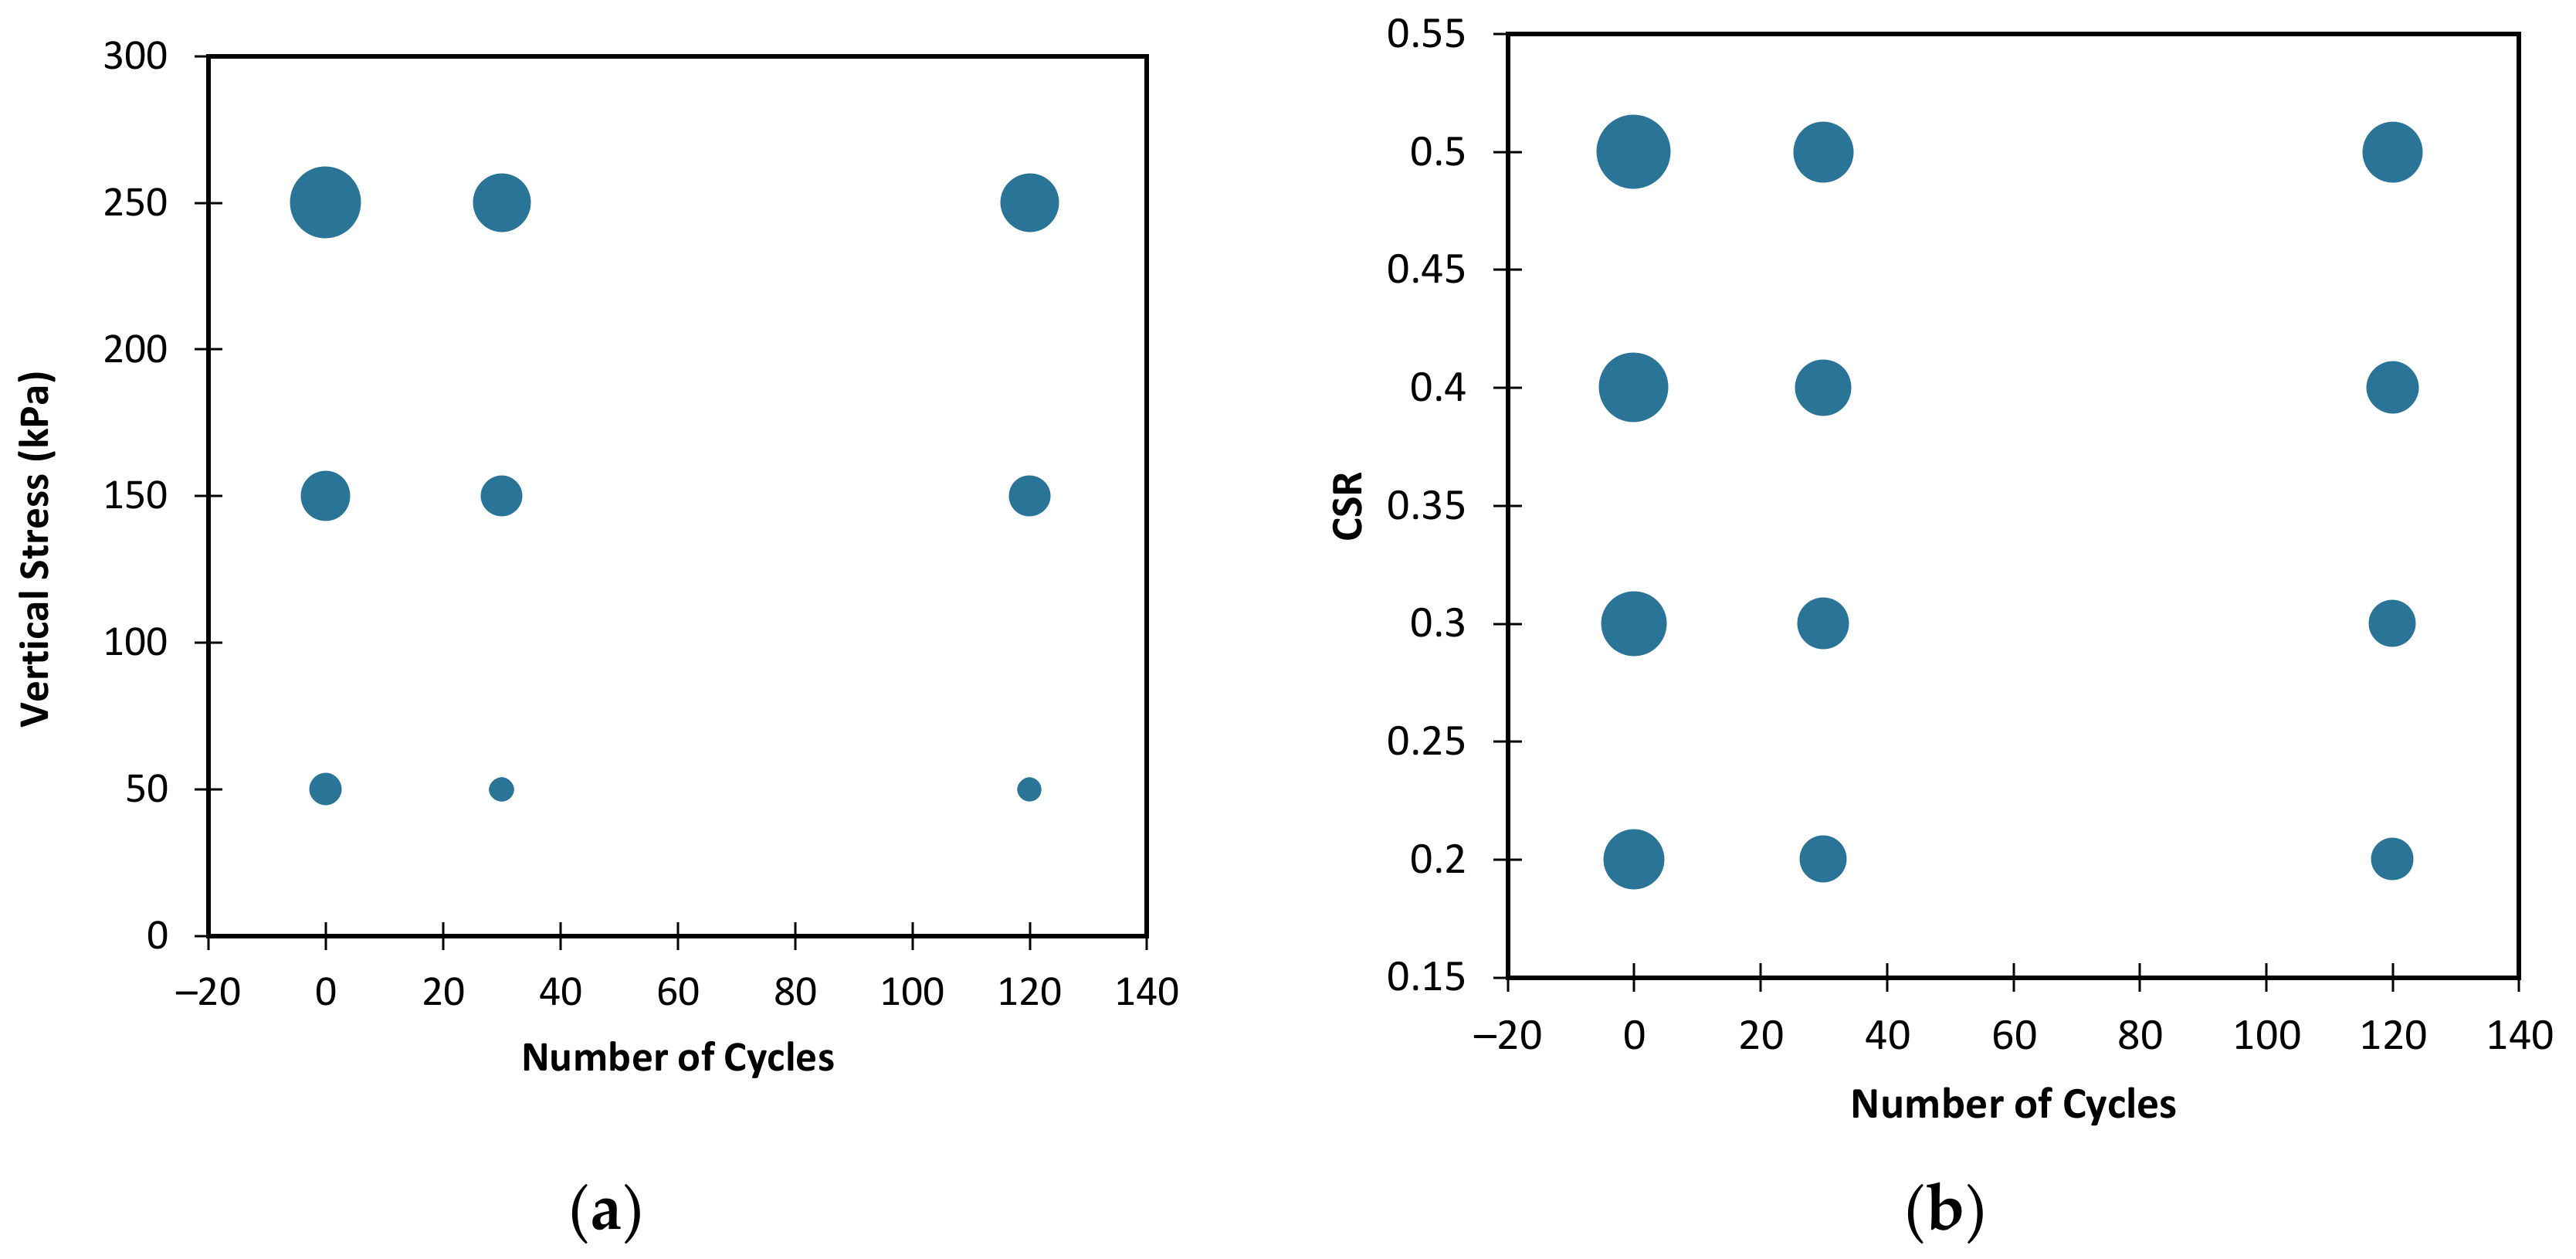
27]. The cyclic tests were carried out on samples prepared with a relative density of approximately 45%; vertical stresses of 50, 150 and 250 kPa were applied, with each test conducted using different cyclic stress ratios of 0.2, 0.3, 0.4 and 0.5. The cyclic loading involved applying a vertical load at a rate of 5 N/s, followed by sinusoidal shear loading. Constant-stress and stress-control modes were employed during cyclic testing, with the same sample being utilized for five repetitions under identical conditions. CSR loading is commonly used to evaluate the resistance of soils to cyclic loading and their ability to withstand repeated cycles of stress and strain. This method directly applies cyclic stress to the test soil, and its response is measured in terms of strain. CSR loading is particularly useful in simulating the loading conditions experienced by soils during an earthquake, particularly for soils with low plasticity index values.
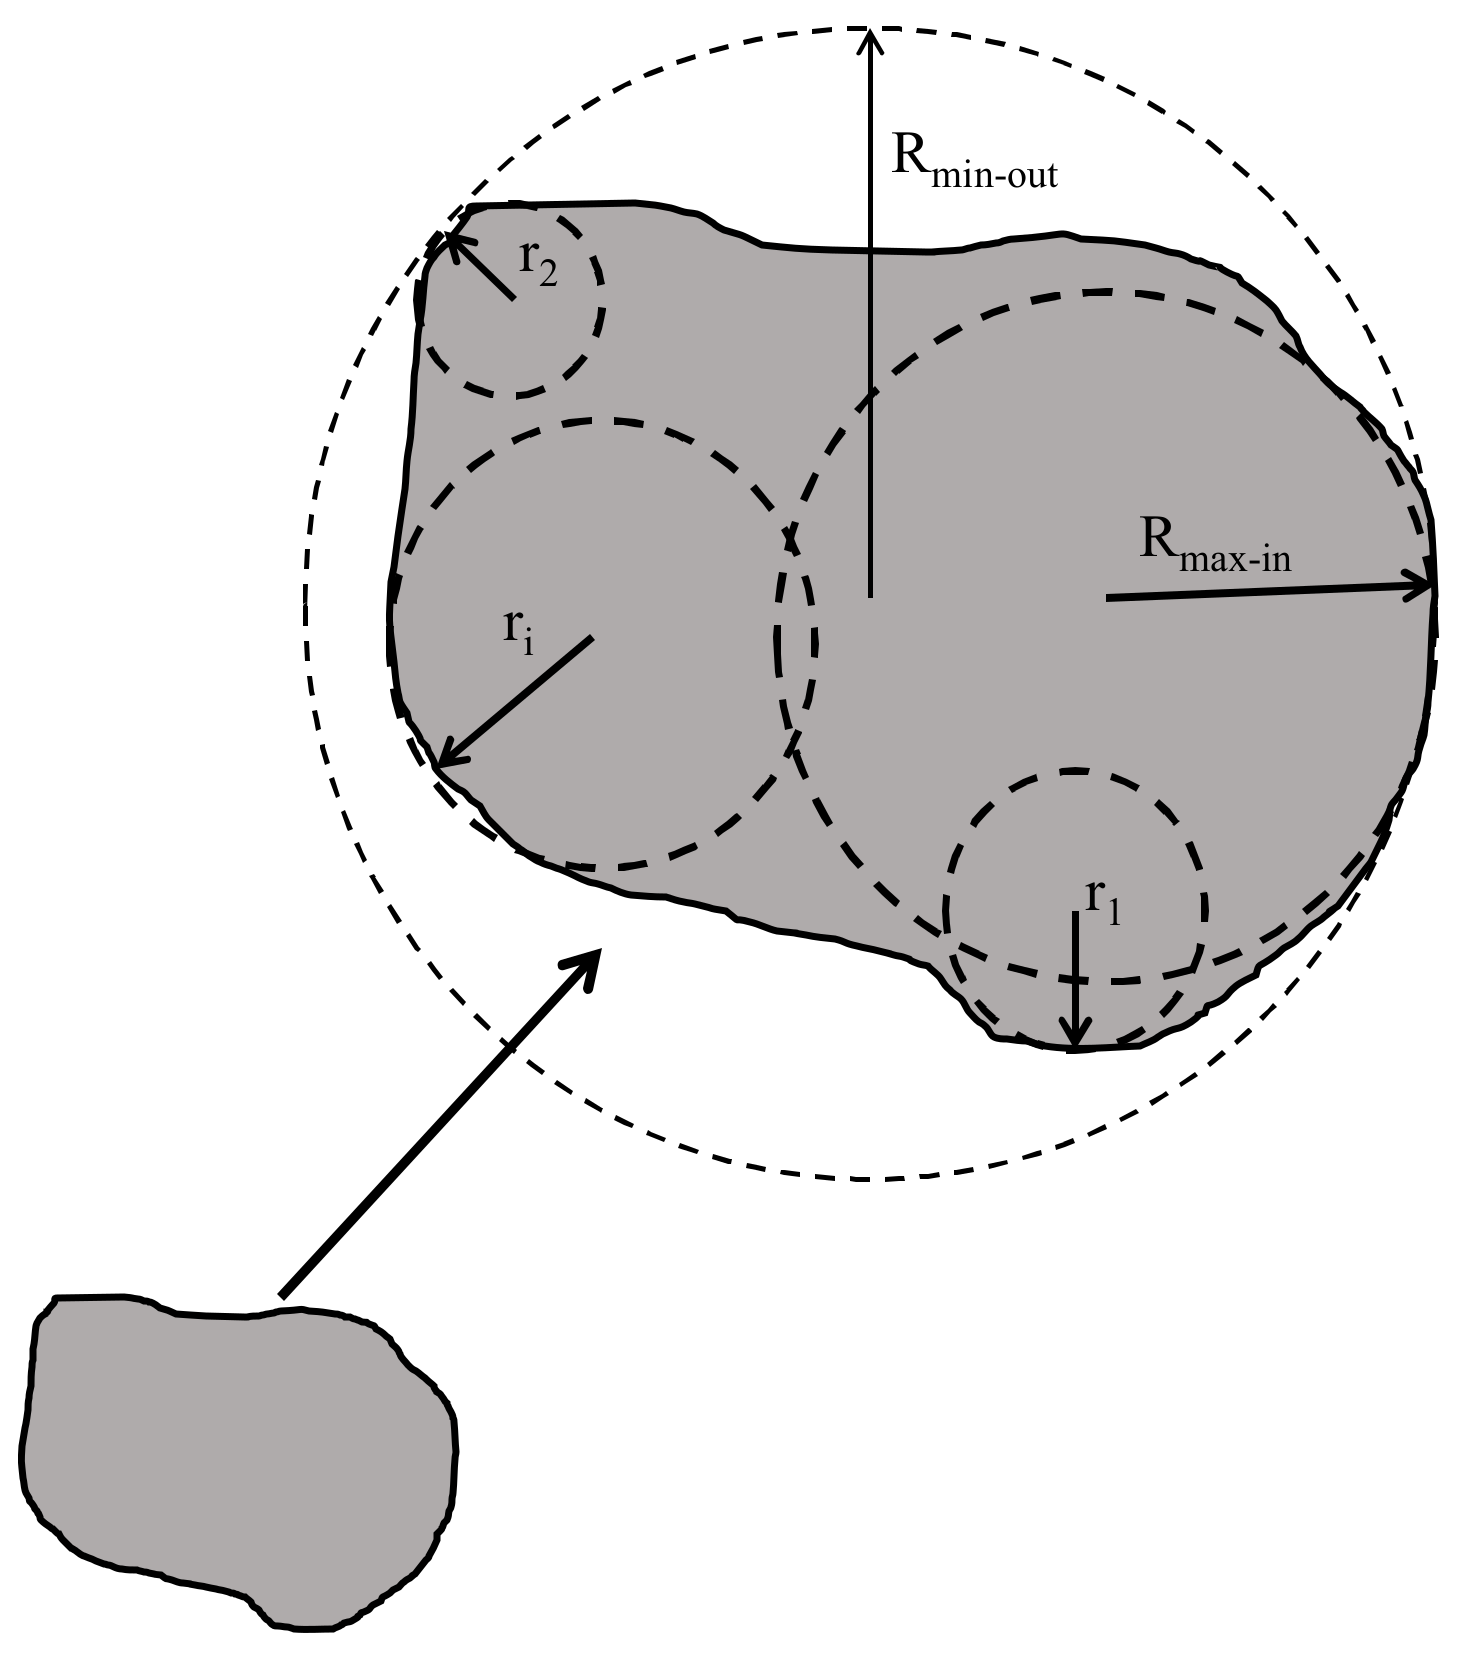
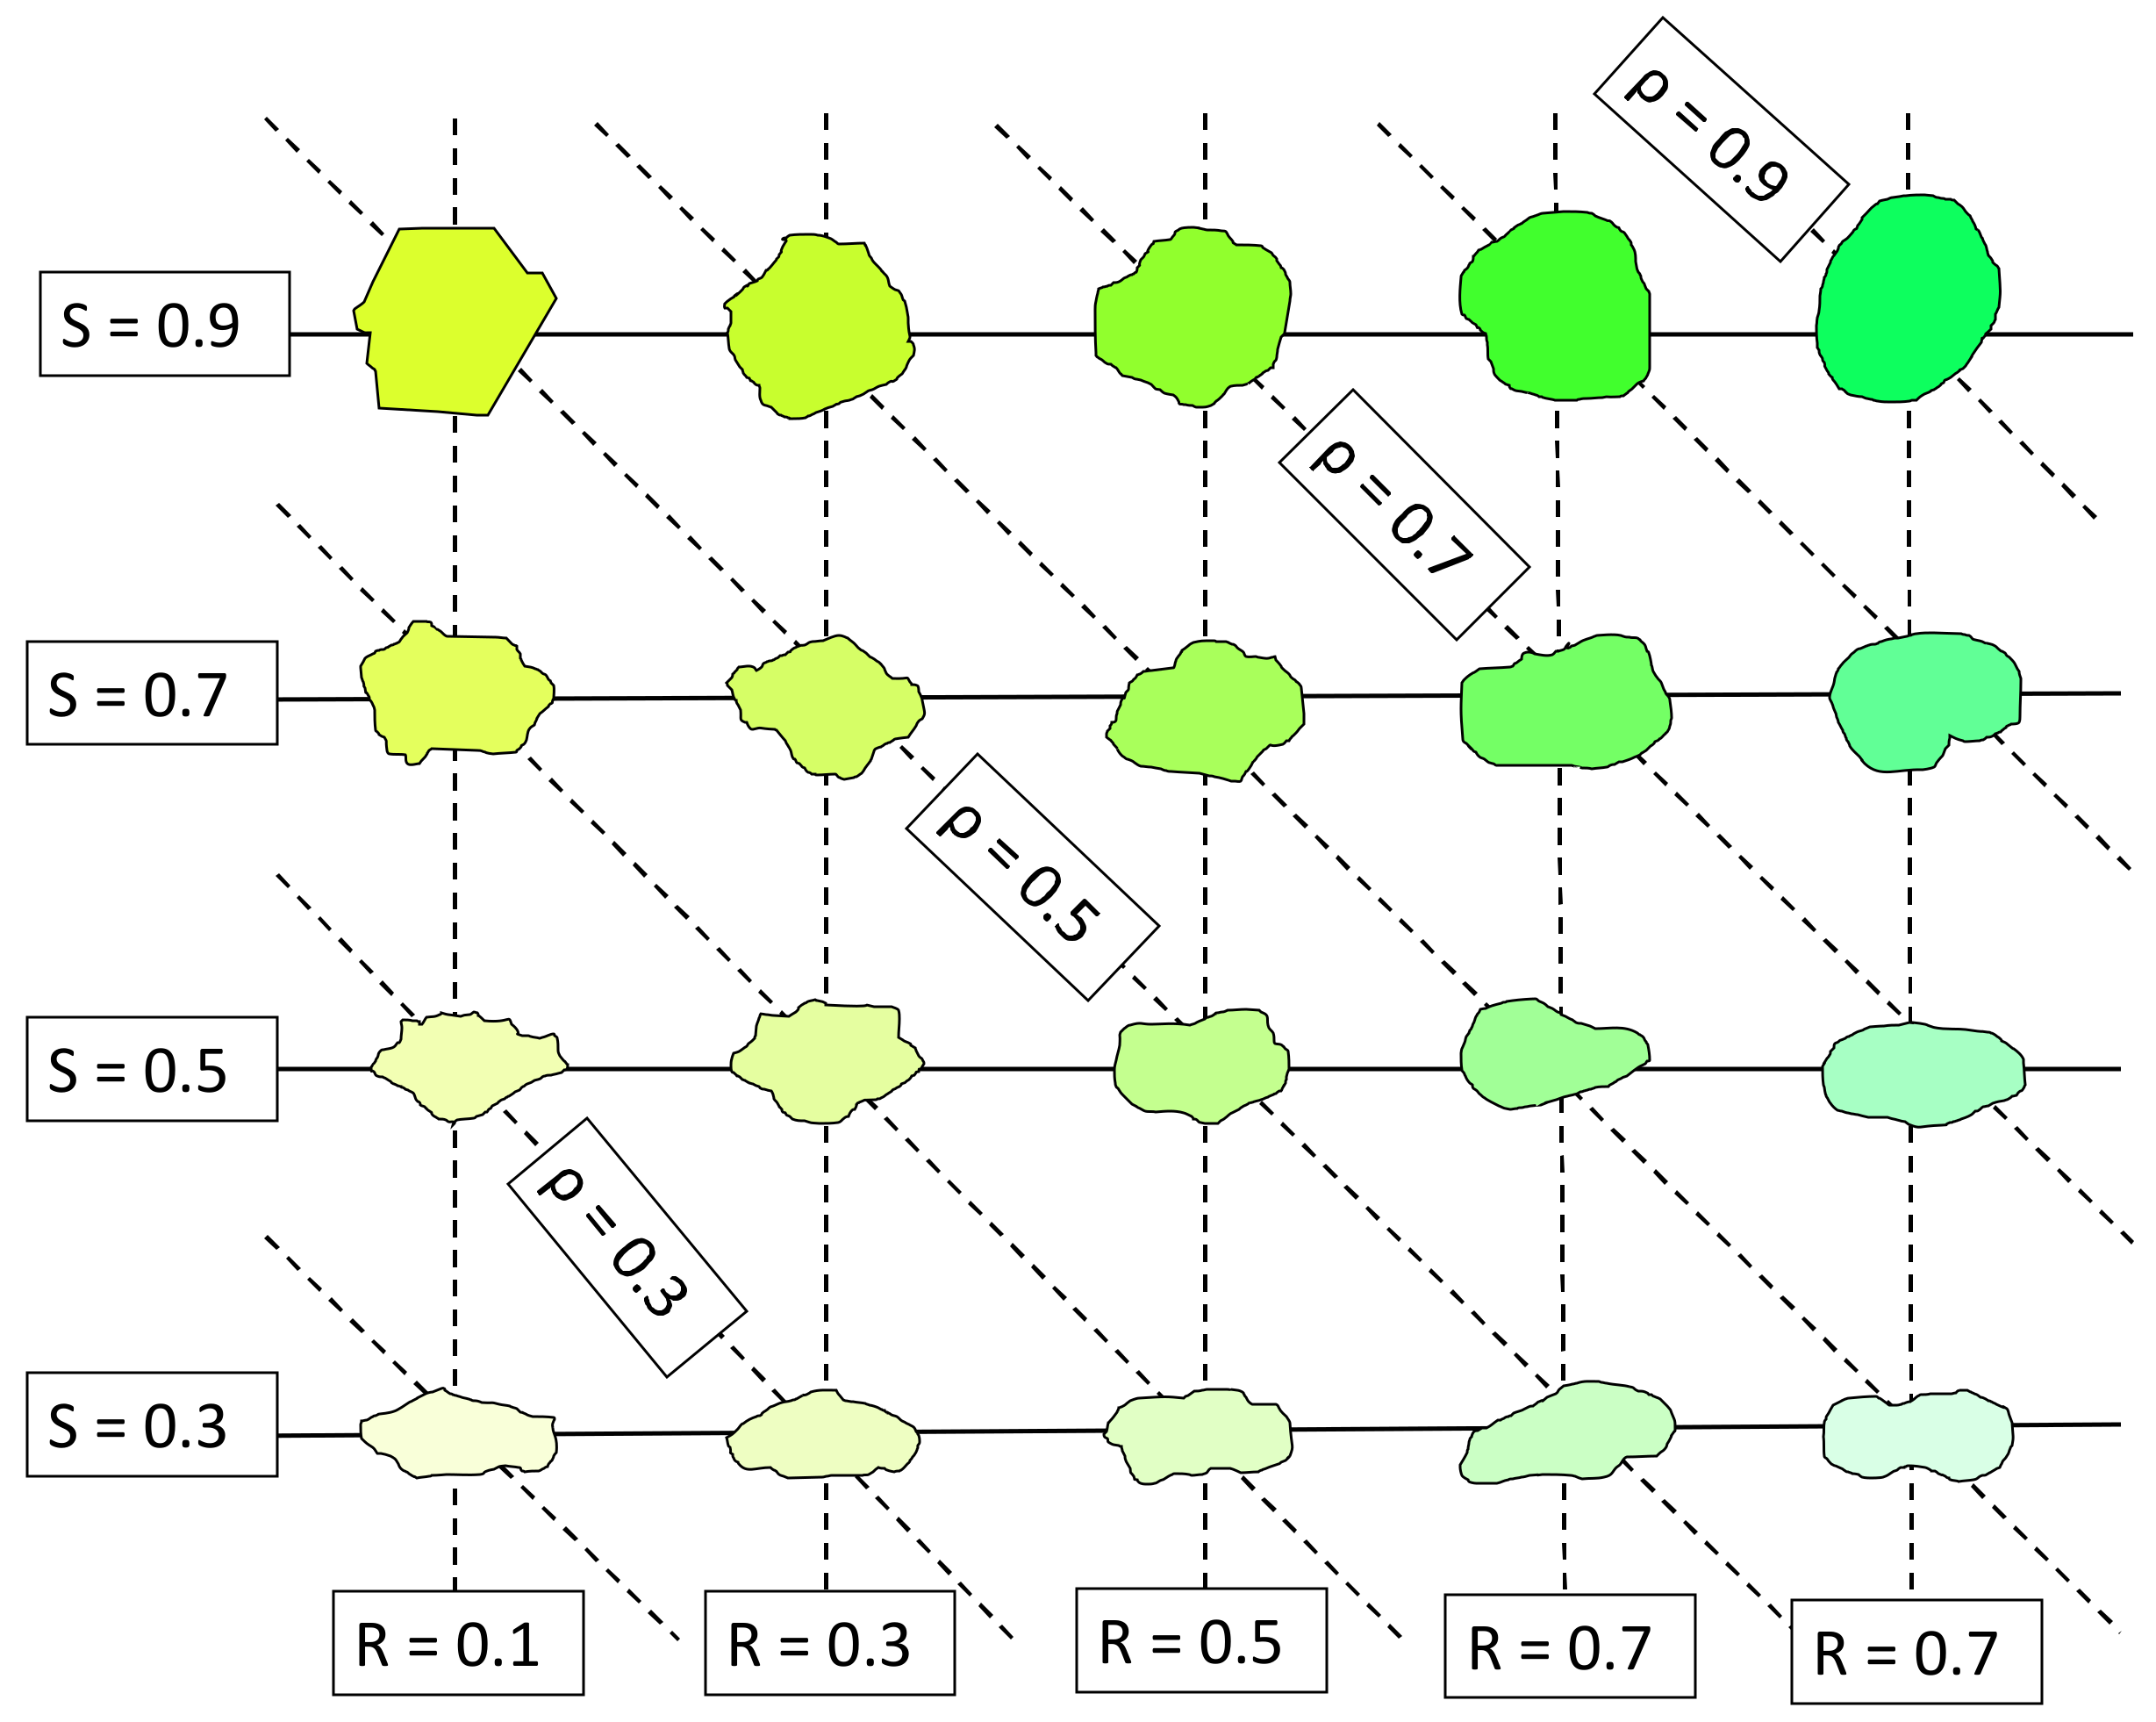
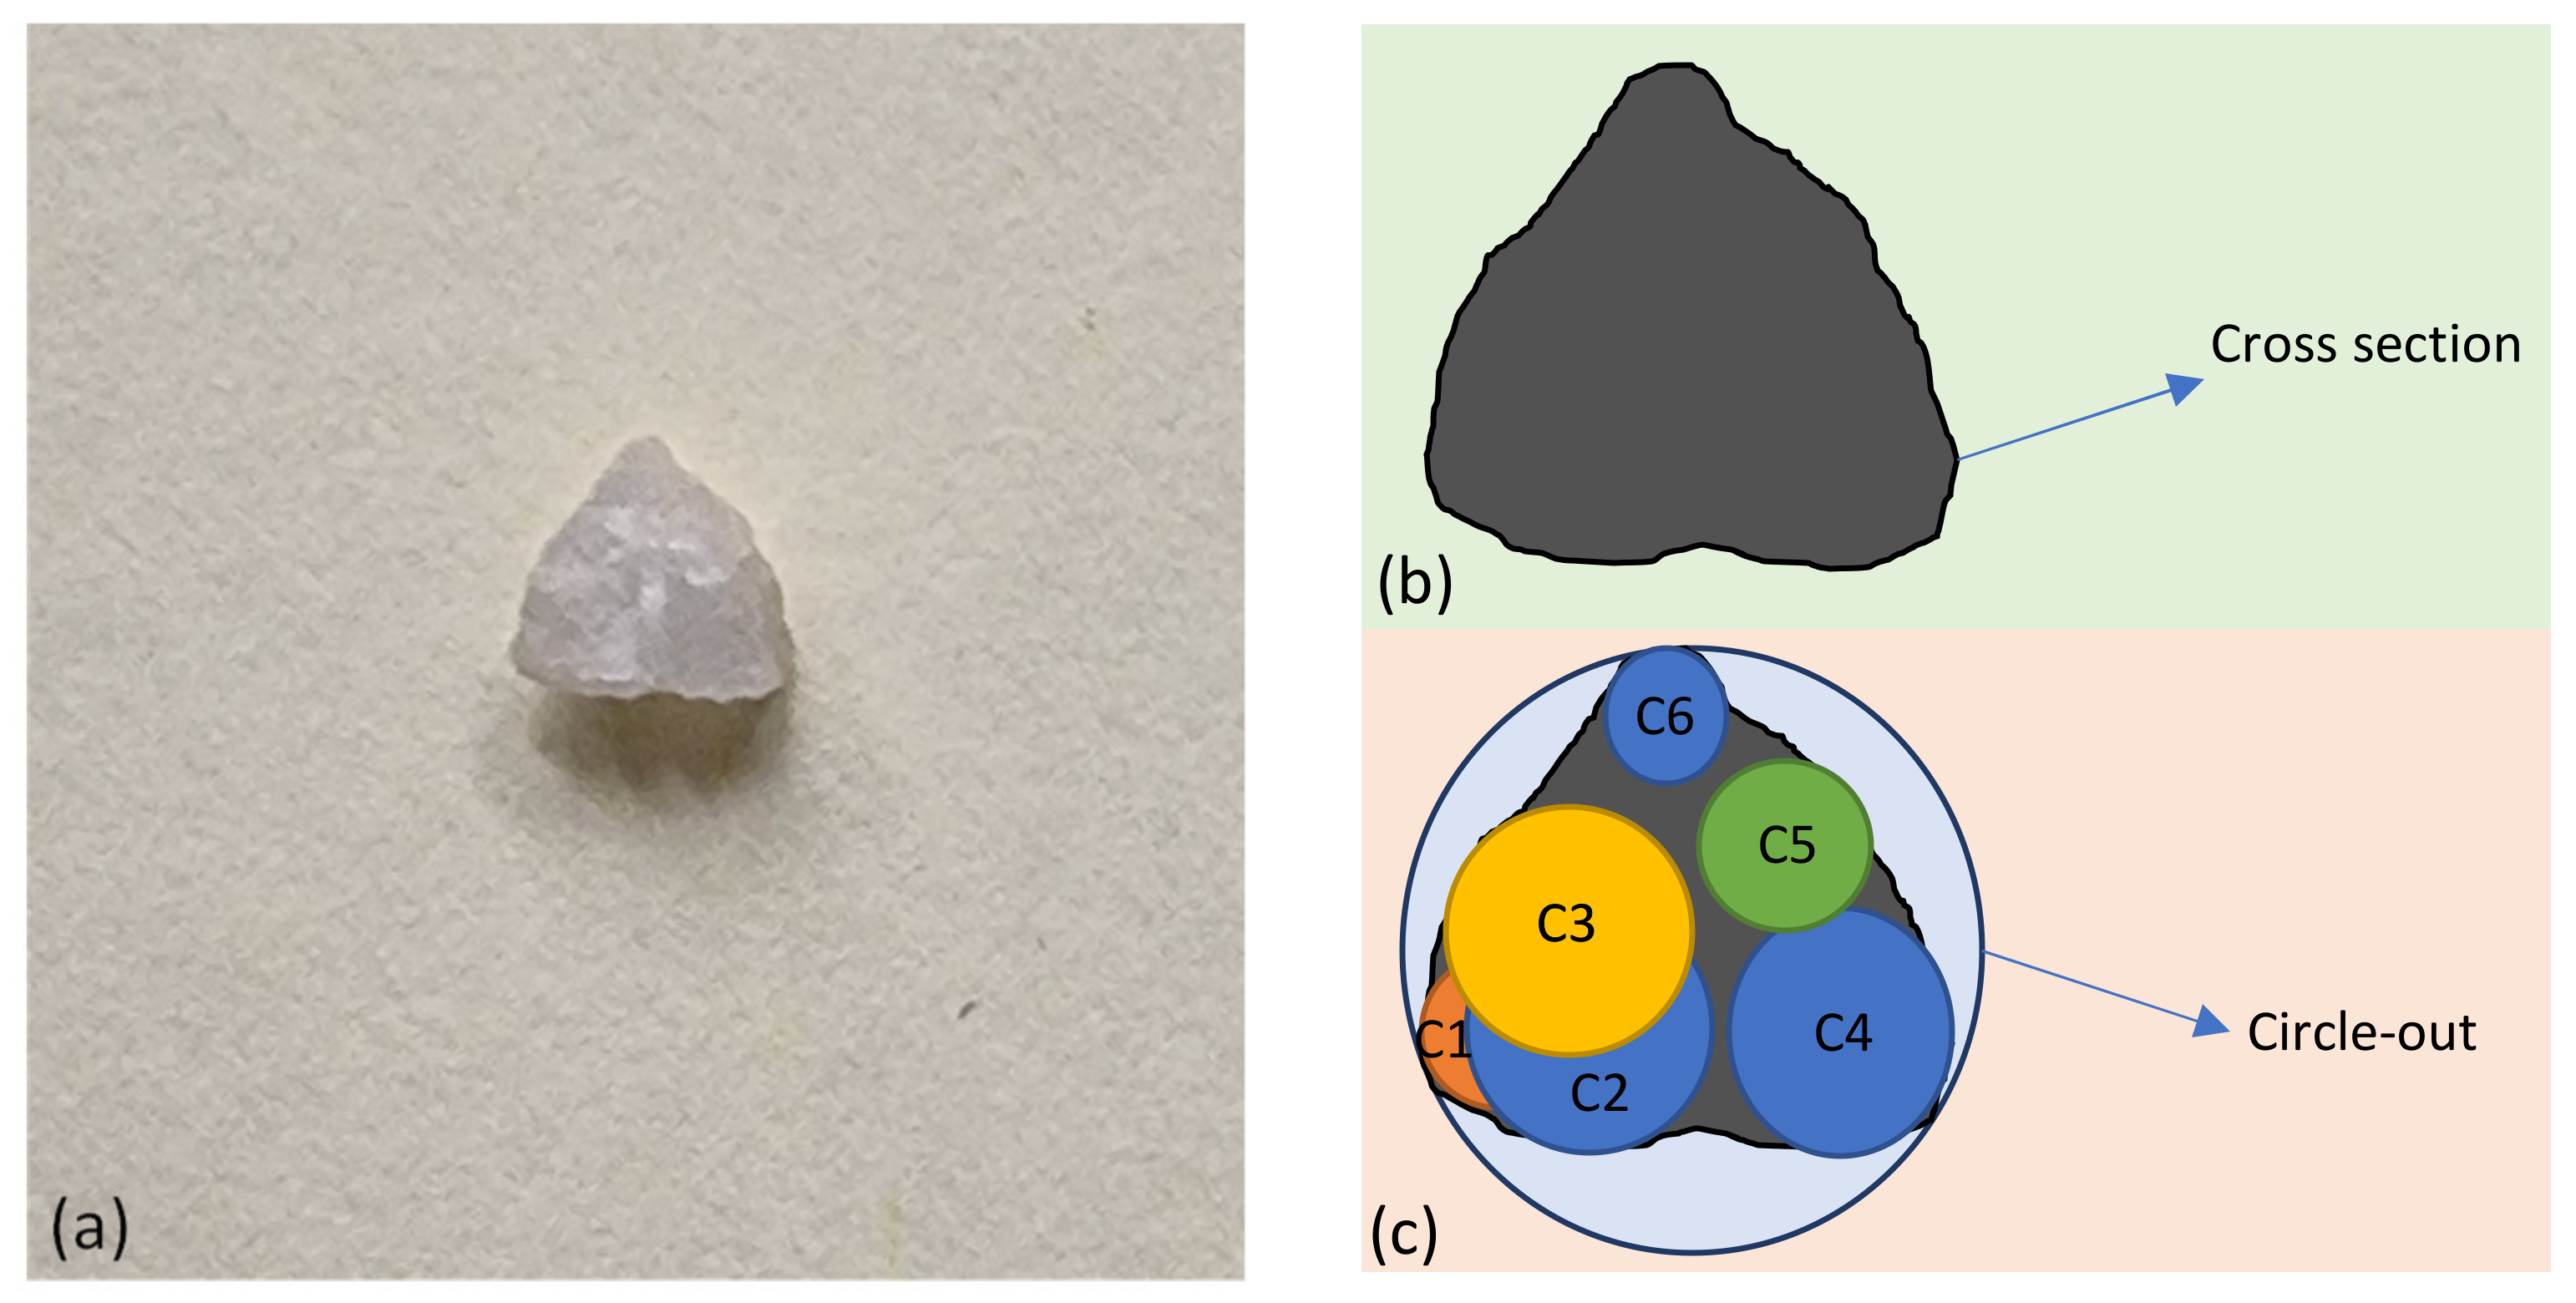
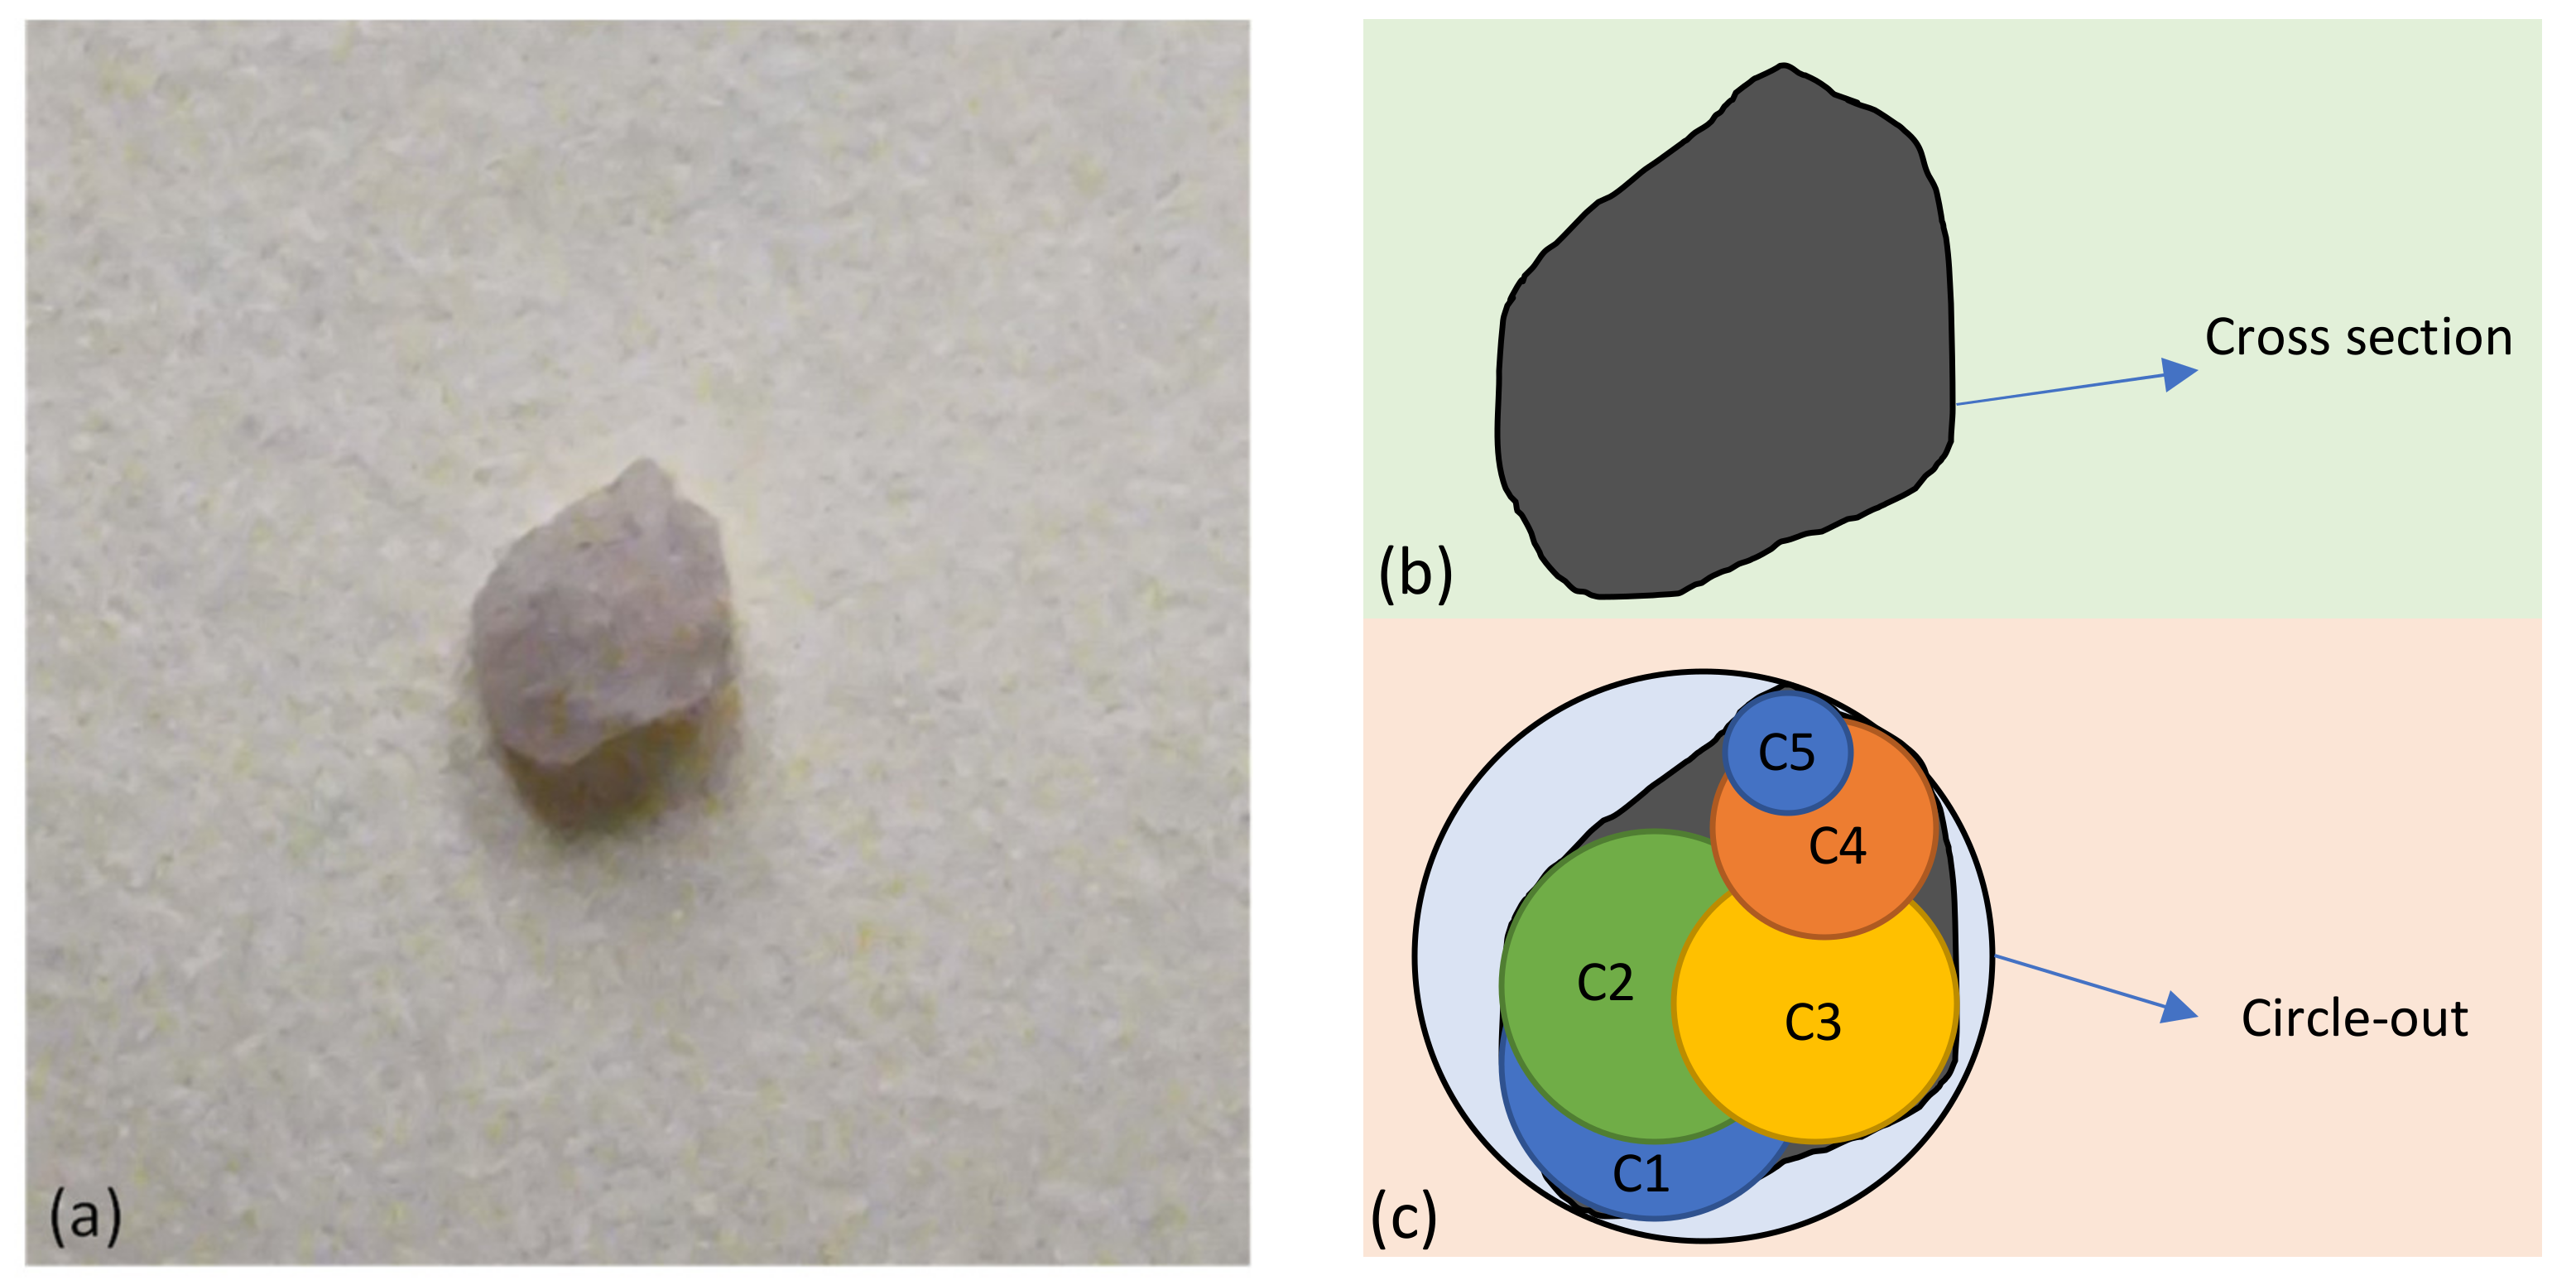
To quantify the shape characteristics of the sand grains, the empirical chart proposed by Krumbein and Sloss [50] was employed. This chart uses an optical microscope to express grain shape in various ways; roundness R, sphericity S and regularity ρ were the three shape descriptors quantified in this study using Equations (1)–(3), respectively. Note that Figure 3 and Figure 4, adapted from Krumbein and Sloss [50] and Cho et al. [51], define the various parameters used in these equations.
R = i = 1 N r i R max in
S = R max in R min cir
ρ = R + S 2
where r = radius of the sand particle corners; Rmax–in = largest inner radius of the sand particle corners; Rmin–out = smallest outer radius of the sand particle; i = index of summation; and N = number of inscribed spheres.
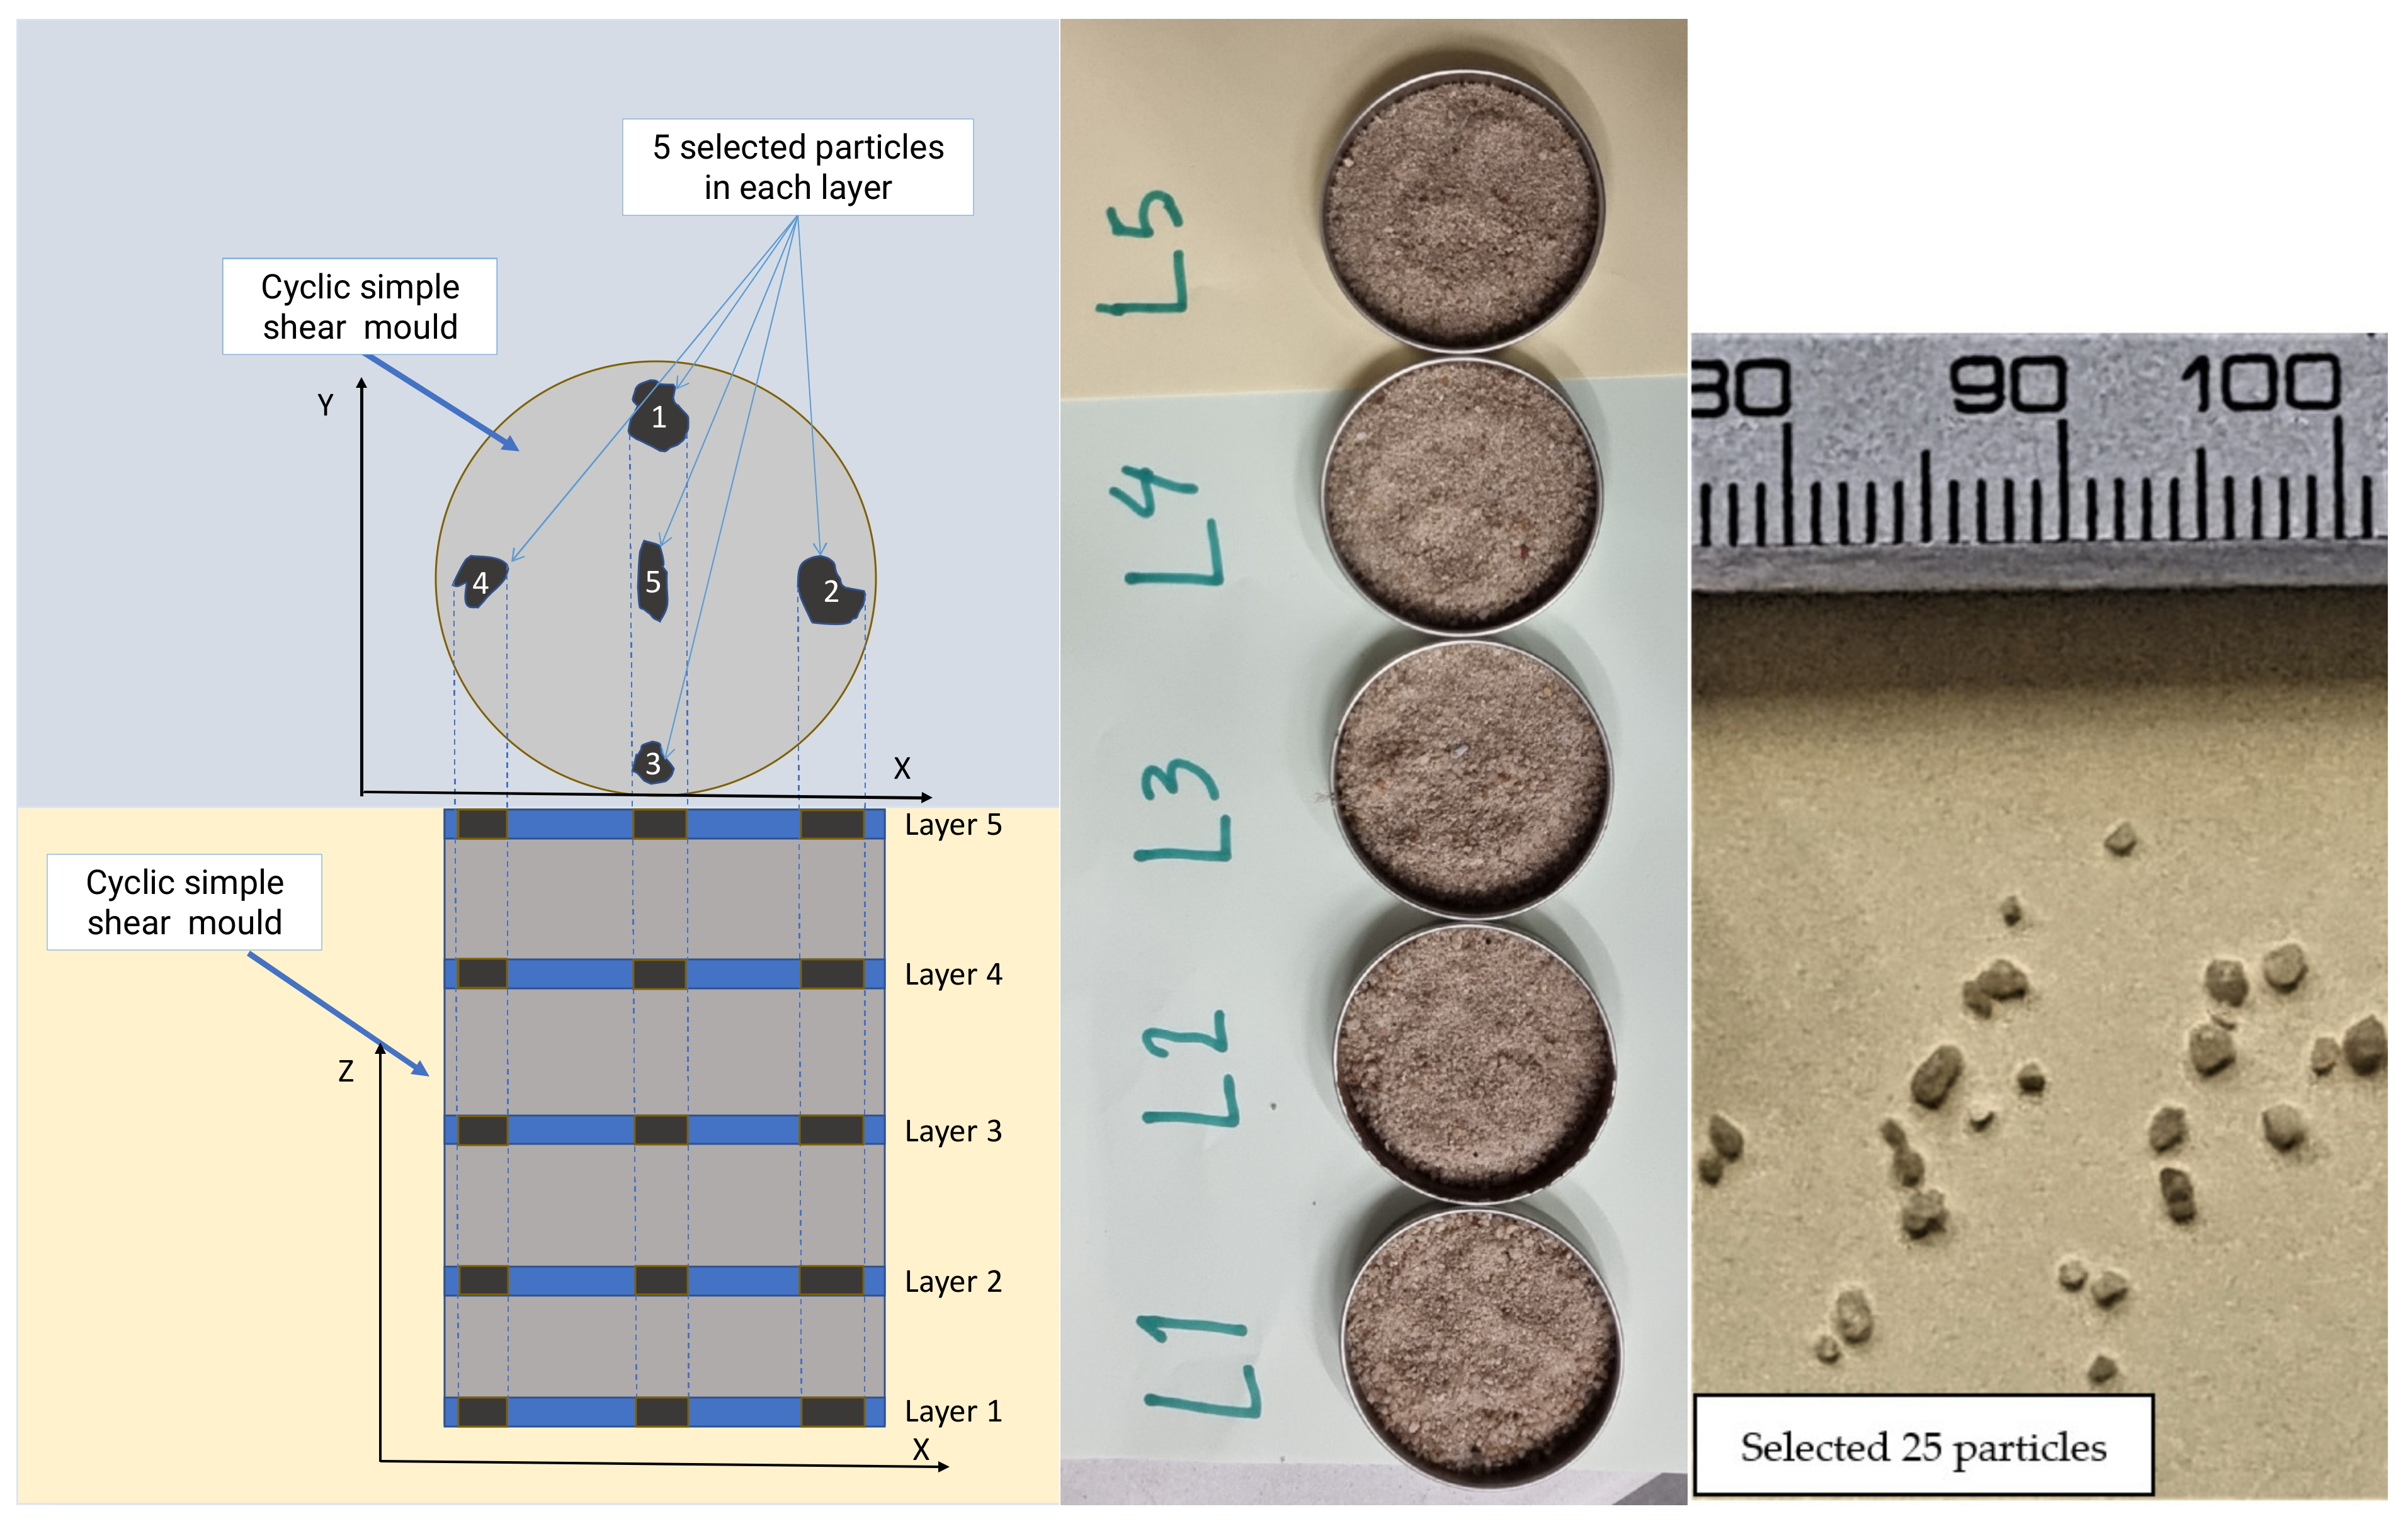
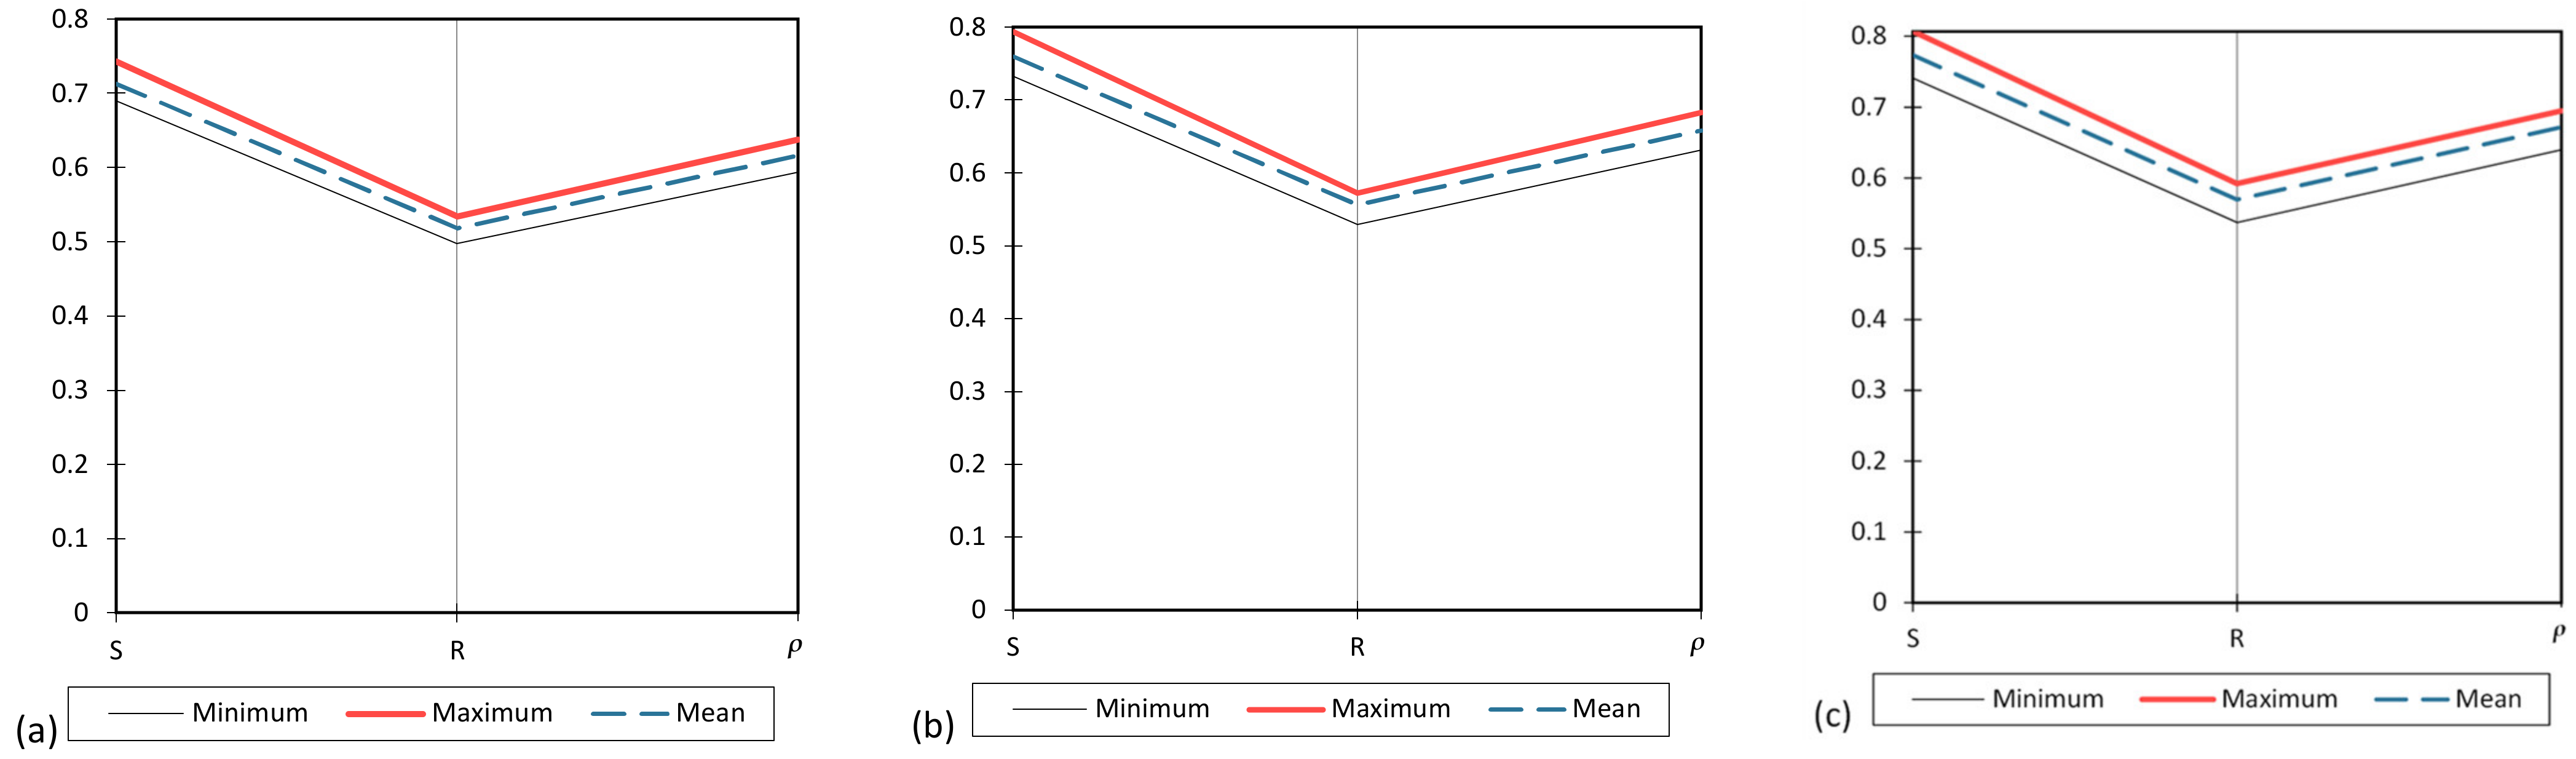
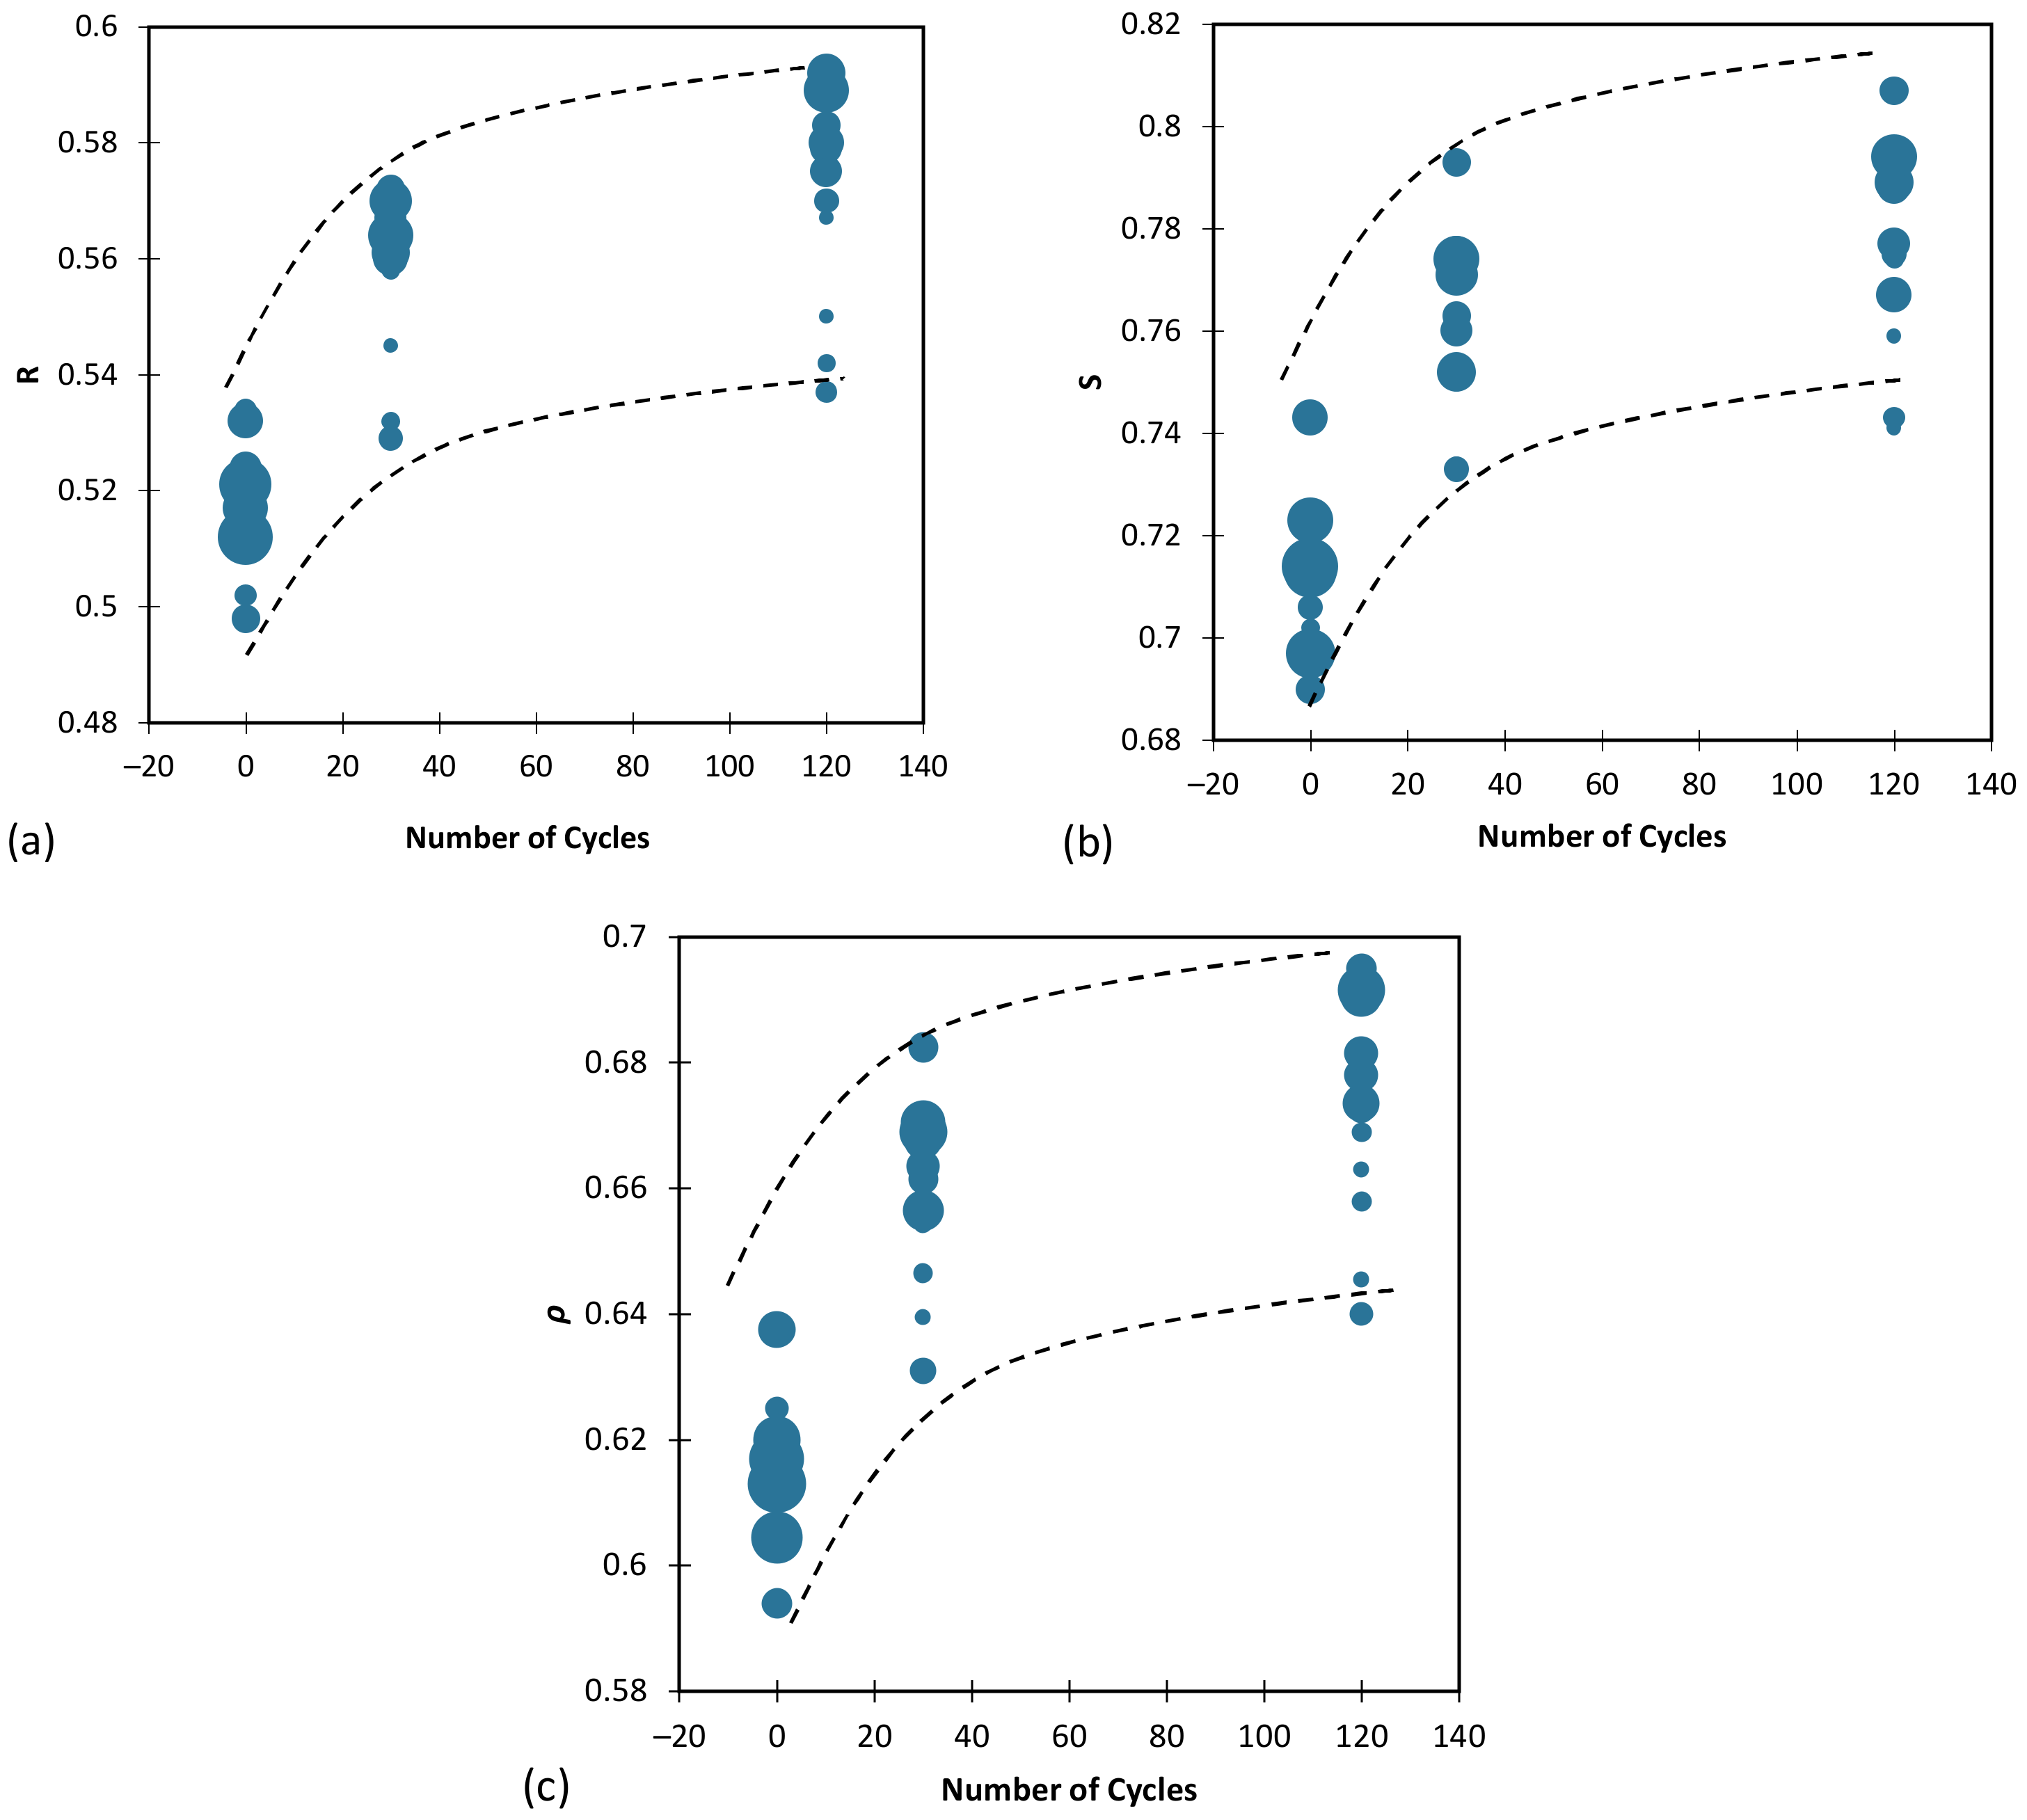
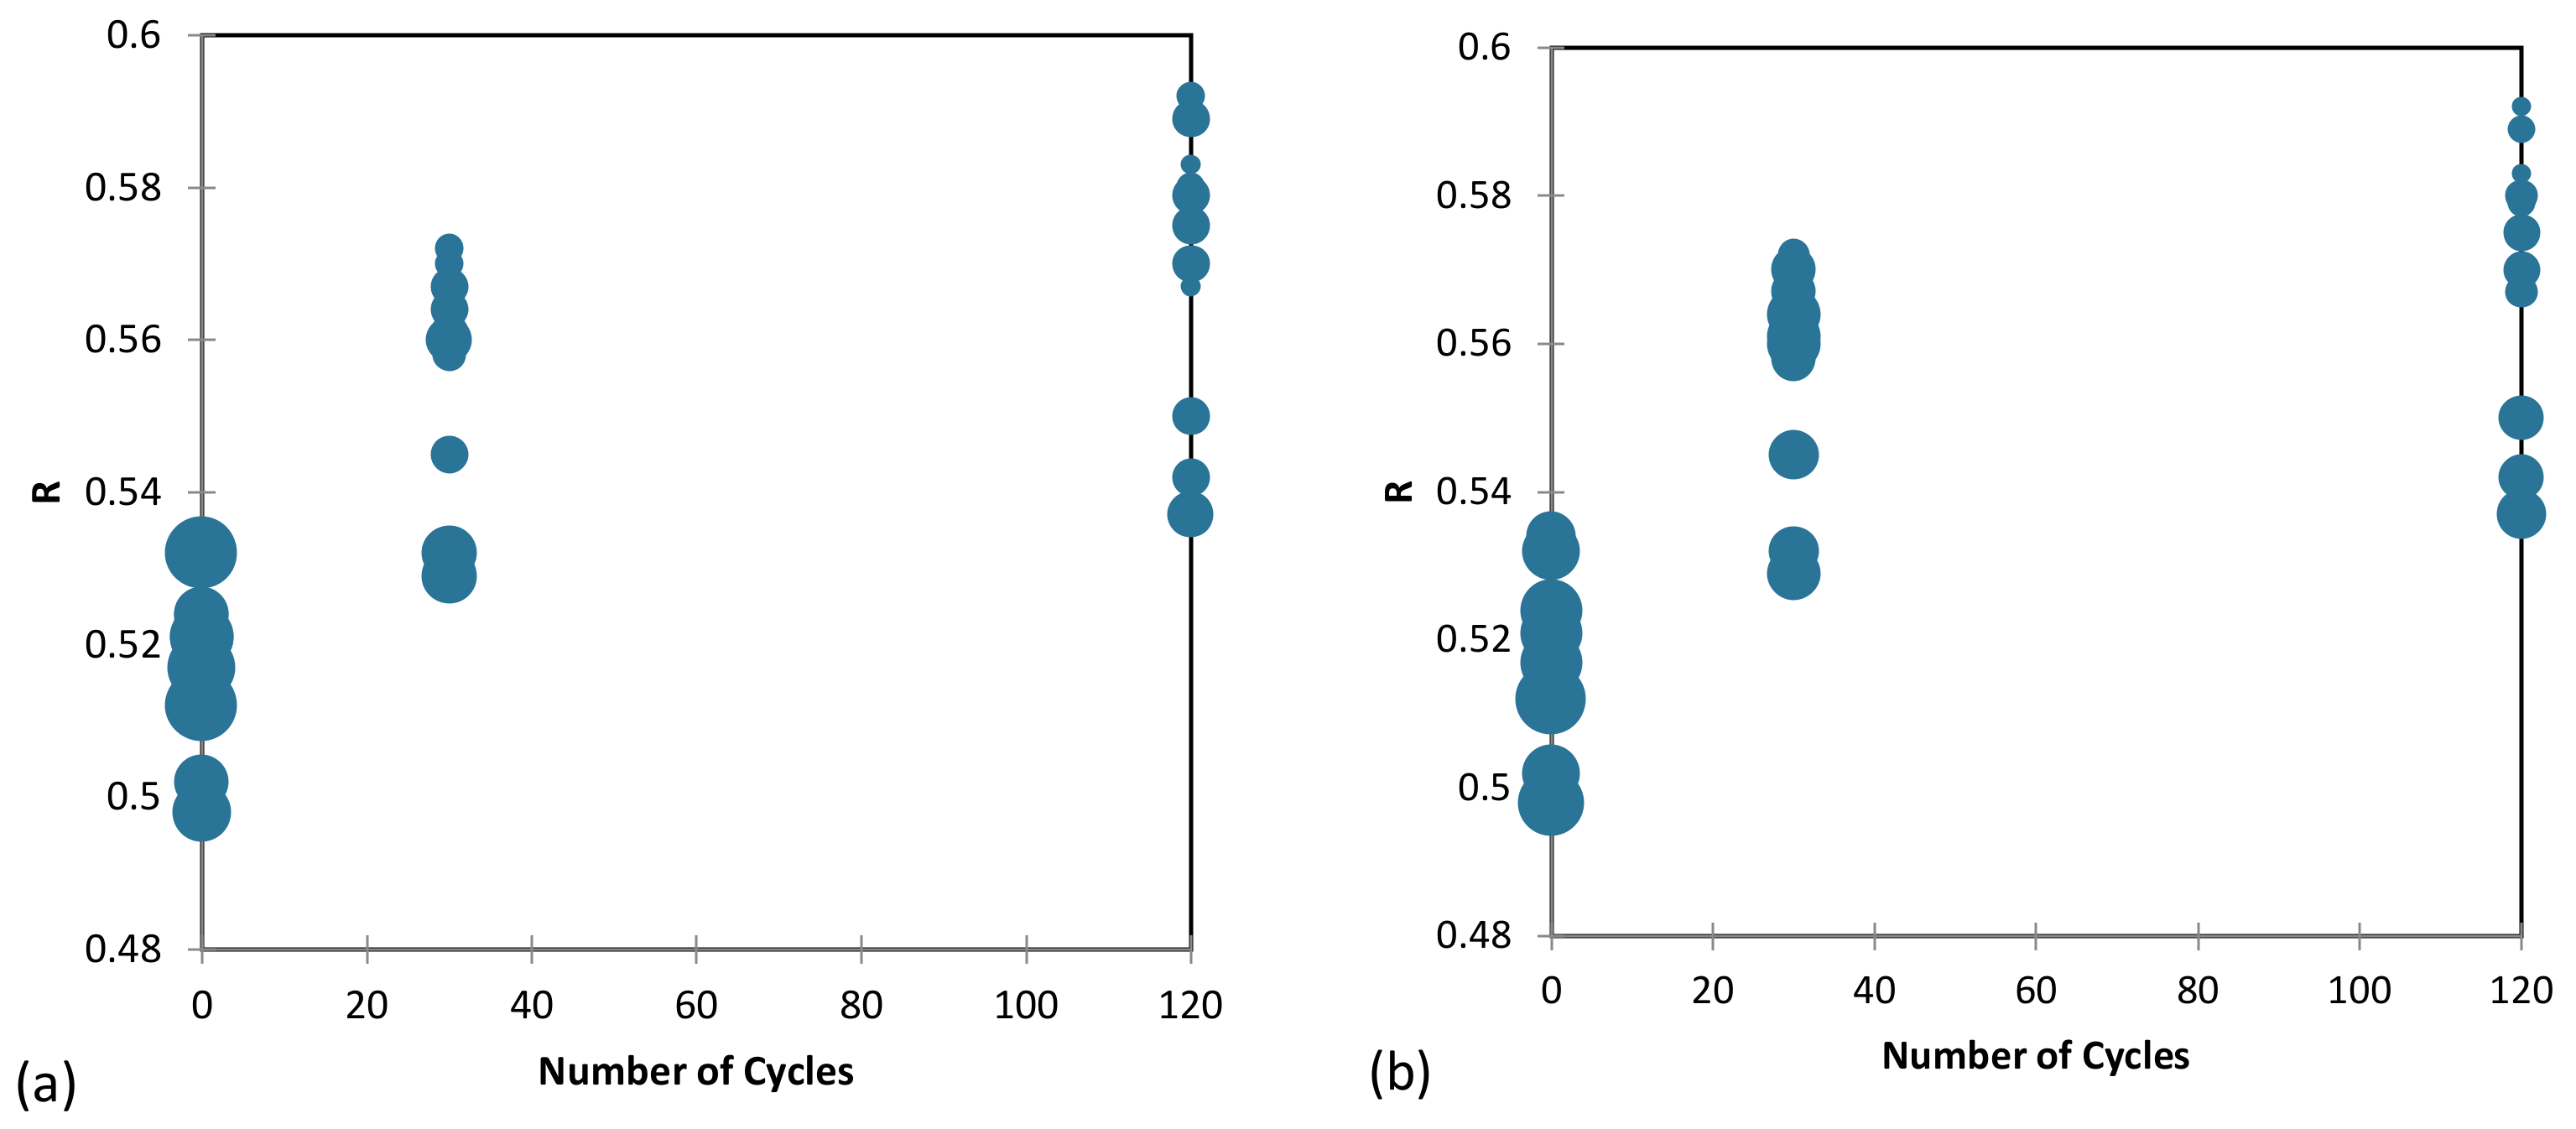
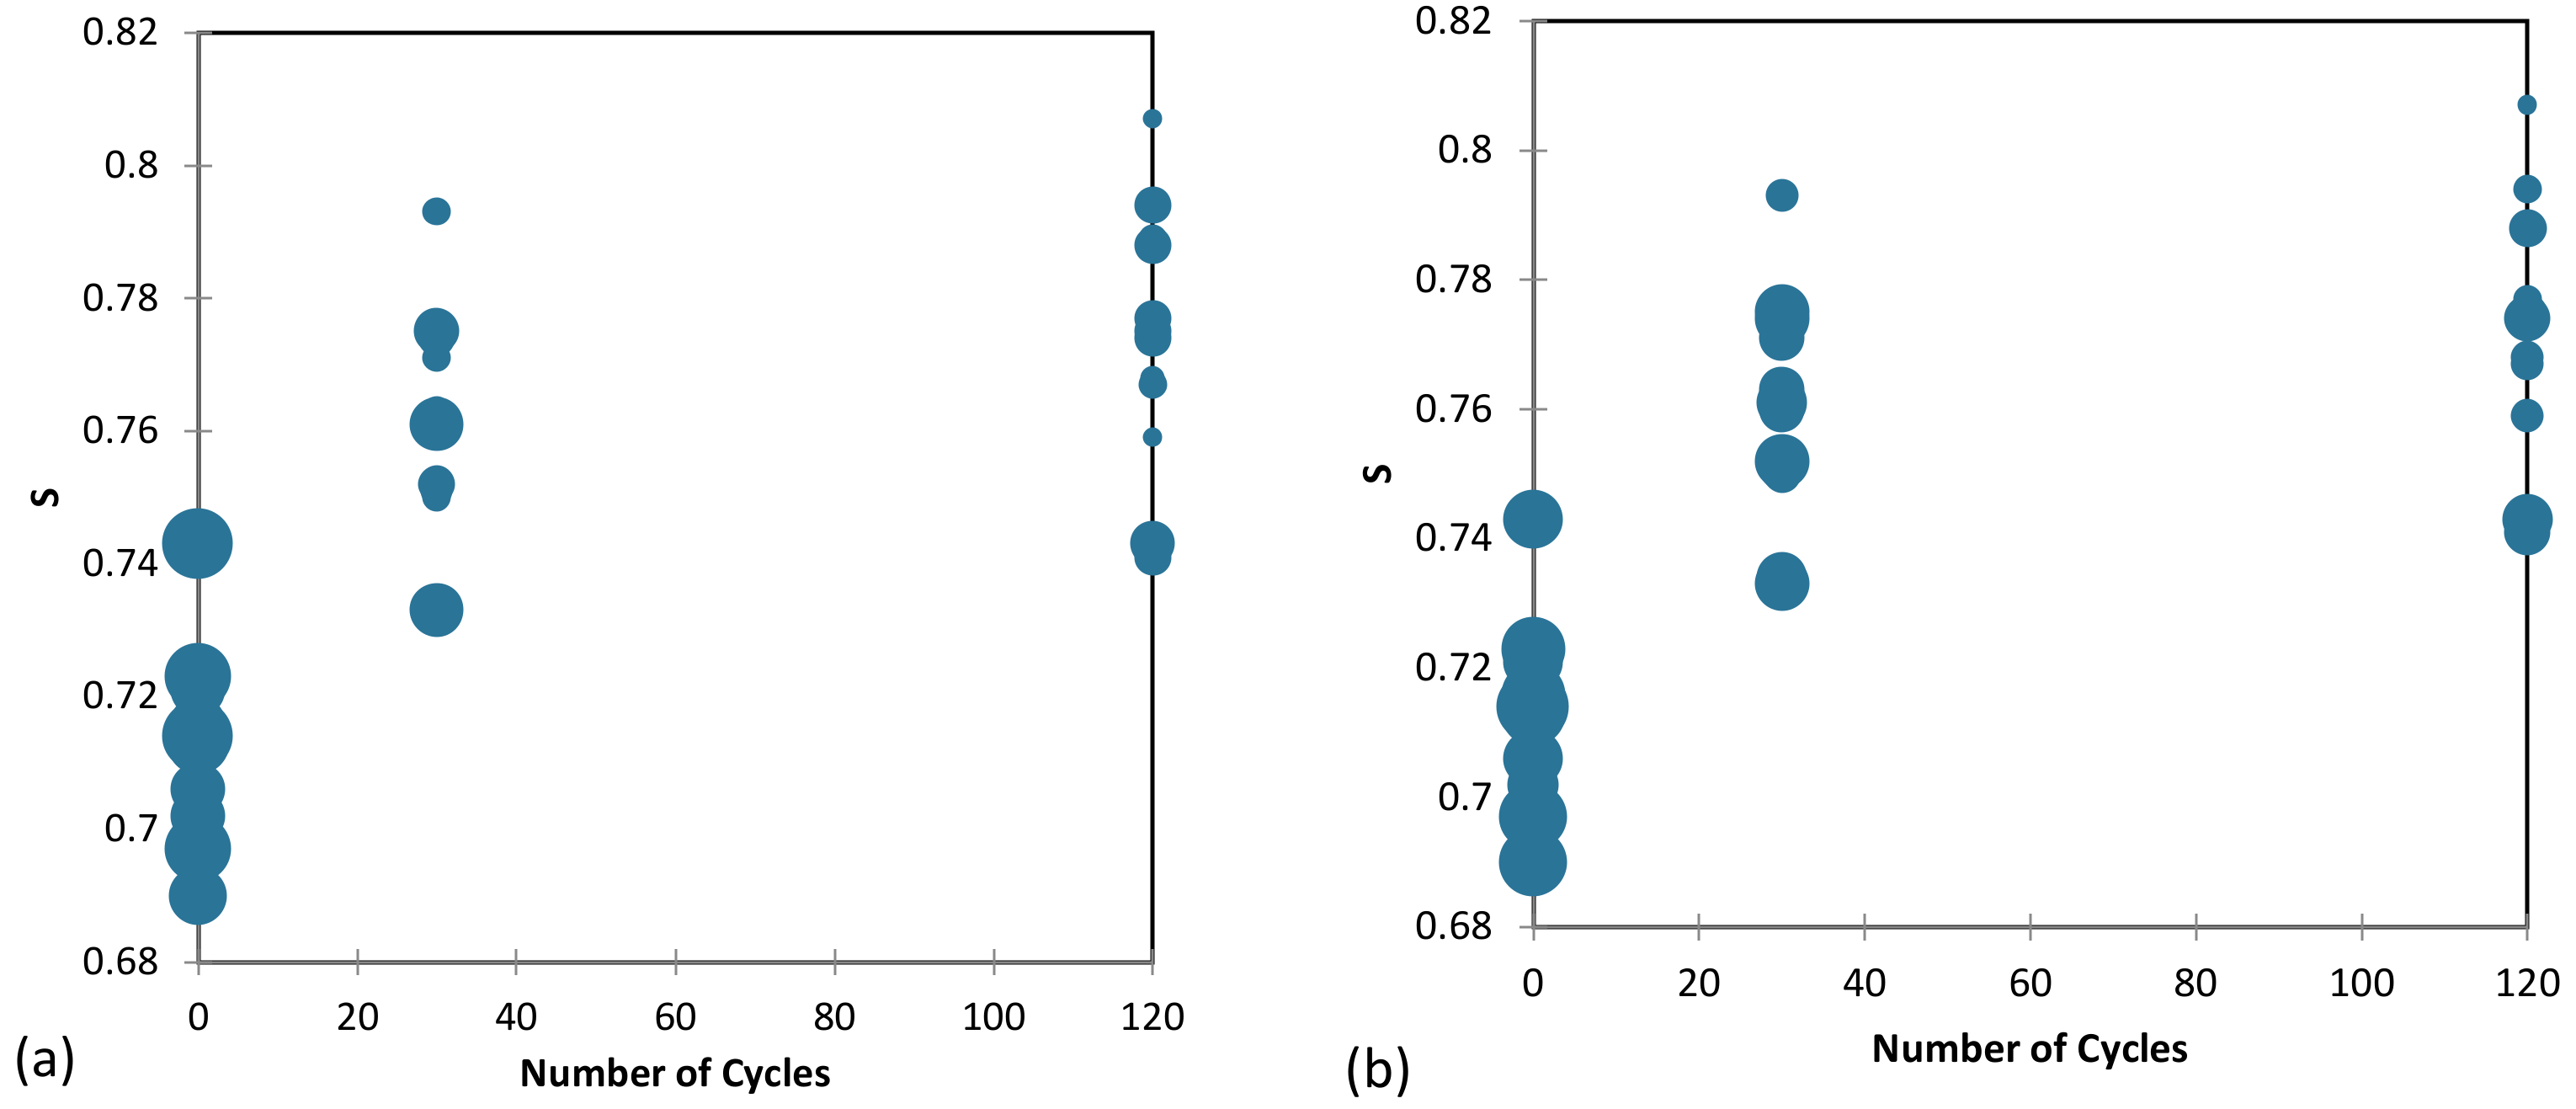
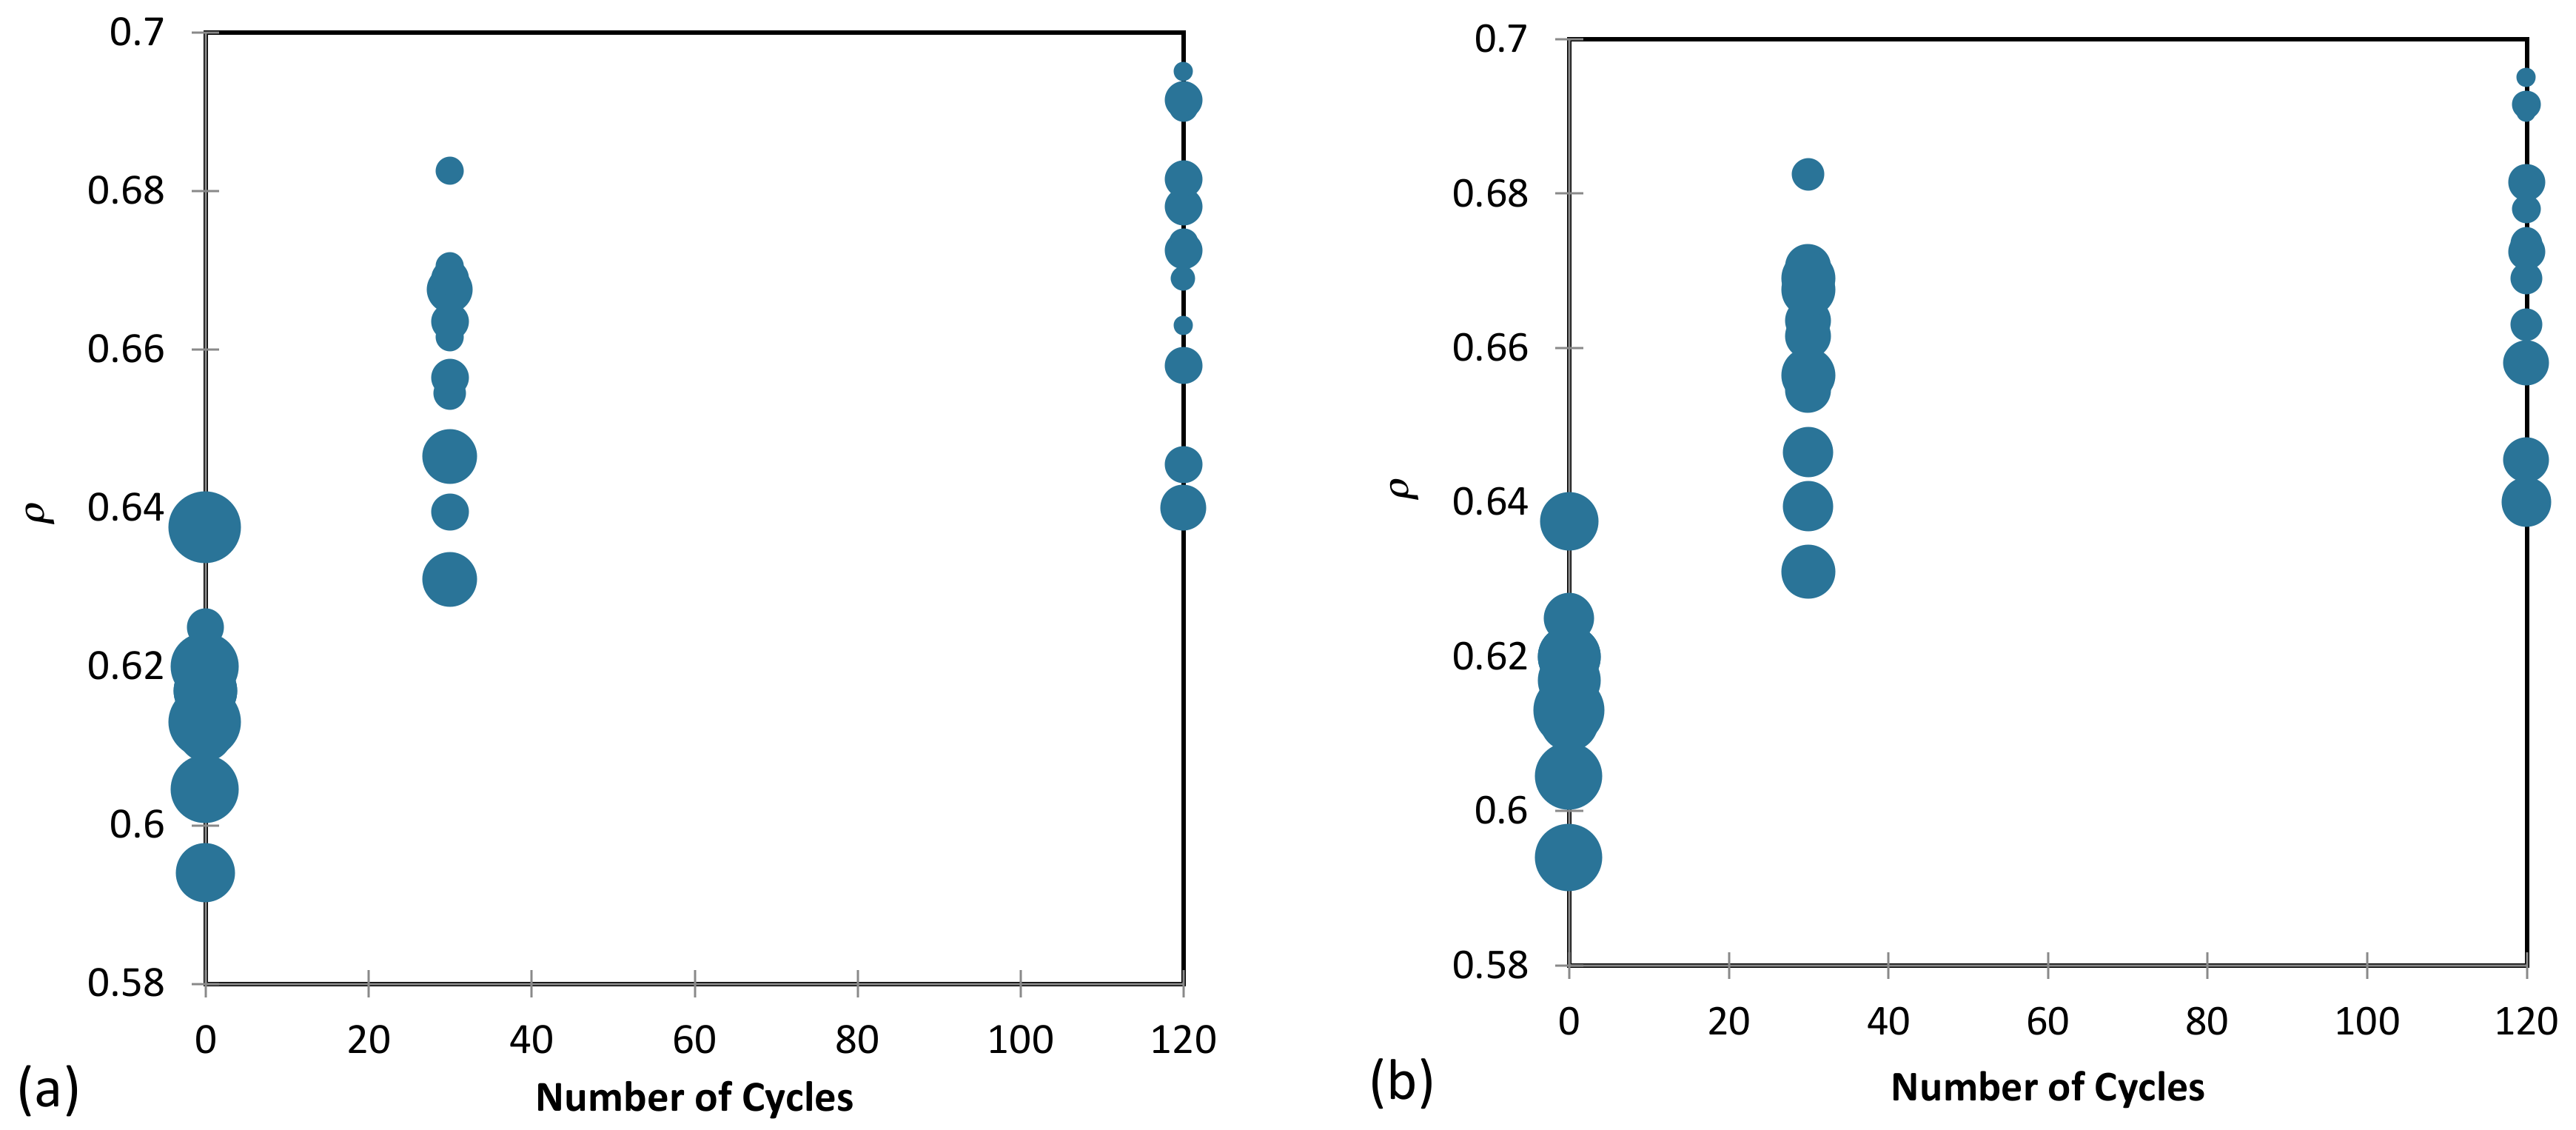
This study conducted a comprehensive investigation into the effects of particle shape changes on the damping ratio. To this end, 25 sand particles were randomly selected at three stages, namely, before testing, prior to the second test, and before the fifth test. The three shape descriptors (Equations (1)–(3)) were quantified for each selected particle, and their averages for the 25 particles were considered the R, S and ρ parameters for each stage. This approach was employed to isolate the effects of particle shape changes on the damping ratio as other physical variables remained nearly constant.
It should be mentioned that a test group was first conducted to determine the optimum number of grains. Initially, ten particles were selected; however, after conducting the investigation, it was found that the standard deviation of the three shape parameters R, S and ρ was insufficient (for ten particles), with values of 0.014, 0.010 and 0.013, respectively. To address this, the study proceeded to the second step and analyzed twenty particles. The results showed that the standard deviations for the three parameters R, S and ρ were acceptable at 0.0033, 0.0024 and 0.0028, respectively. However, to ensure sufficient accuracy, 25 particles were selected. The particles were removed in five layers during the particle selection procedure (see Figure 5), with five particles randomly selected from each layer. This ensured that 25 grains were selected almost perfectly with a uniform distribution in height and horizontal surface.

2.3. Artificial Neural Network (ANN)

ANNs have a rich and fascinating history that spans several decades. The roots of ANNs can be traced back to the late 1940s and the work of Warren McCulloch and Walter Pitts, who proposed a mathematical model of a neuron known as the McCulloch–Pitts neuron [52]. They suggested that neurons in the brain could be modeled as binary on–off switches, which laid the foundation for ANNs. In the 1950s and 1960s, several researchers began to develop neural network models, including the ‘perceptron’ proposed by Frank Rosenblatt in 1958 [53]. The perceptron is a single-layer neural network that can learn to classify patterns by adjusting its weights. In the 1970s and 1980s, the development of the backpropagation algorithm by Paul Werbos and others revolutionized the field of ANNs [54]. This algorithm allowed for the training of multi-layer neural networks, which could learn to perform more complex tasks compared to single-layer perceptrons.
ANNs can be used for various tasks, including classification, regression analyses and time-series prediction [55]. They have been successfully applied in different fields, such as finance, healthcare and image recognition. However, the accuracy of ANN models relies heavily on the quality and quantity of the training data [56]. The models may also suffer from the problem of vanishing gradients, where the gradients become too small to update the weights during backpropagation [57].
To implement the ANN methodology, first, the data are divided into training and testing sets. The ANN model is then trained on the training set using a backpropagation algorithm to minimize the error between the predicted and actual outputs. The number of hidden layers and the number of neurons in each layer are determined using a trial-and-error procedure (or by a validation set). The performance of the ANN model is evaluated on the testing set using various statistical metrics, such as mean squared error (MSE) and mean absolute error (MAE). The hyperparameters of the ANN model, such as learning rate and momentum, are optimized using techniques such as grid search or randomized search.
Moreover, before training the ANN model, the input data need to be preprocessed by normalizing the data to ensure that all features have equal importance. The activation function for each neuron is selected based on the problem being addressed (e.g., sigmoid, hyperbolic tangent (tanh), or rectified linear unit (ReLU)). Regularization techniques, such as dropout or weight decay, may also be applied to prevent overfitting during the training process.

2.4. Support Vector Machine (SVM)

An SVM is a supervised learning algorithm used for classification and regression analyses. It was first proposed by Vapnik and colleagues in the 1990s and has since been widely employed in various fields, such as finance, biology and image recognition [58,59,60]. The idea behind SVMs is to find a hyperplane that separates the data into different classes in the highest possible margin. The margin is the distance between the hyperplane and the closest data points from each class. The SVM algorithm then attempts to maximize this margin by finding the optimal hyperplane.
Initially, the SVM was developed for linearly separable data only, where a single hyperplane could separate the data perfectly. Later, it was extended to non-linearly separable data using kernel functions to map the data to a higher dimensional space, where they could be linearly separated [60].
An SVM has several advantages over other classification algorithms, including its ability to handle high-dimensional data and its robustness to manage outliers. Its performance, however, can be affected by choices made for the kernel function and hyperparameters. Over the years, several variants of SVMs have been proposed, such as support vector regression (SVR) for regression analysis and multiple kernel learning (MKL) for combining multiple kernel functions. SVMs remain an active area of research, with ongoing efforts to improve their performance and scalability for large datasets [61].
To implement the SVM methodology, first, the data are divided into training and testing sets. The SVM model is then trained on the training set using a kernel function, such as a linear, polynomial, or radial basis function (RBF). The optimal values of the hyperparameters, such as C (penalty parameter) and Gamma (kernel coefficient), are determined using grid search or randomized search techniques. The performance of the SVM model is evaluated on the testing set by various metrics, including accuracy, precision, recall and F1-score. The SVM model can also be used for regression tasks by modifying the objective function and using the epsilon-insensitive loss function. The performance of the SVM regression model can be evaluated using metrics such as the MSE and MAE parameters [60,61,62].

3. Results

After conducting the simple shear tests (as described in Section 2), the collected data comprised displacements and forces. These raw data were then transformed into horizontal and vertical stress–strain values employing displacement–strain and stress–force relationships. The damping ratio parameter D was then calculated by Equations (4) and (5) and Figure 6.
D = Δ W 2 π W = A Loop 2 π W
W = γ max γ min τ γ max τ γ min 2

3.1. Results of Cyclic Tests

The results of the experiments demonstrate the effects of particle shape changes on the damping ratio of sand. The hysteresis loops of shear stress–strain were plotted after each cyclic test, and the damping ratio was estimated using Equation (4). Figure 7 illustrates a typical example of the results obtained during cyclic tests, where the CSR and vertical stresses were 0.3 and 150 kPa, respectively. The results demonstrate that the volumetric strain exhibits a negative trend with an increasing number of cycles. This indicates that the sample experienced settlement and, hence, its density increased after cycling; the constant vertical pressure loading in the cyclic tests is the primary reason for this phenomenon.
The impact of the number of cycles on the damping ratio under different CSR conditions and vertical stresses is demonstrated in Figure 8, Figure 9 and Figure 10 for the reconstruction of the first, second and fifth samples, respectively. As shown in these figures, the damping ratio decreased with an increasing number of cycles in all tests.
To find the worst-case scenario in this study, it is evident from the results in Section 3.1 that the behavior of dry sand grains is greatly influenced by three parameters: the CSR, number of cycles and vertical stress. The damping ratio decreases with an increase in the cyclic shear ratio (CSR) and the number of cycles. For the studied sand, the worst-case scenario could be when the CSR is 0.5, the number of cycles is around 35 and the vertical stress is 250 kPa. In this vertical pressure and CSR, particles showed the most change in their shapes and damping ratios.
In Figure 11 and Figure 12, three-dimensional images, two-dimensional cross-sectional areas and circles used to determine the values of three shape parameters, S, R and ρ, are displayed for two different particles. The first particle was examined before cyclic testing, while the second particle was examined after undergoing four cyclic tests, each consisting of 30 loading cycles with CSR = 0.2 and vertical stress = 150 kPa. It is evident from the figures that the average radius of the inner circles in Figure 11 is smaller than in Figure 12, implying an increase in S, R and ρ.
Table 1, Table 2 and Table 3 and Figure 13 present the results of various tests conducted on samples before cycling (Table 1), after 30 cycles (Table 2) and after 120 cycles (Table 3). The tables report the minimum, maximum, mean and standard deviation (SD) values for the three shape descriptors, namely sphericity S, roundness R and regularity ρ, as well as the damping ratio D. Comparing the values between these tables allows one to draw some conclusions on how these shape descriptors and the damping ratio are affected by cycling.
Referring to Table 1, it can be seen that the mean values for S, R, ρ and D before cycling were 0.713, 0.518, 0.616 and 16.050, respectively. The SDs for S, R and ρ were relatively small (i.e., 0.014, 0.011 and 0.011, respectively), indicating that the samples were fairly consistent in terms of particle shape characteristics/variations. For D, however, the SD was found to be 5.903, suggesting greater variability in the damping ratio.
Considering Table 2, it can be seen that after 30 cycles, the mean values for S, R, ρ and D were 0.760, 0.557, 0.658 and 13.392, respectively. The mean values for the three shape descriptors were higher compared to those reported in Table 1 (before cycling), suggesting that the particles became more spherical, rounder and more regular (in shape) after 30 cycles. Furthermore, the damping ratio decreased compared to its pre-cycling value, indicating that the samples became less stiff and more flexible over the course of cycling.
Finally, after 120 cycles, it can be seen that the mean values for S, R, ρ and D were 0.774, 0.570, 0.672 and 12.425, respectively (see Table 3). The mean values for the three shape descriptors continued to increase (when compared to Table 2), suggesting that the particles became even more spherical, rounder and more regular after 120 cycles. The damping ratio also continued to fall, implying an even lesser stiffness (more flexibility) for the samples with additional cycling (from 30 to 120 cycles).
This section investigates the effects of loading cycles on the three particle shape descriptors and the damping ratio. The experimental results are presented in Figure 14 and Figure 15, where the circle diameters represent the magnitude of the damping ratio. It was observed that an increase in the number of loading cycles led to an increase in the shape descriptors S, R and ρ, indicating that the particles became more spherical, rounder and more regular. Moreover, an increase in the number of cycles (i.e., an increase in S, R and ρ) resulted in a decrease in the circle diameters and subsequently the damping ratio. These findings, which demonstrate the relationships between the number of loading cycles, particle shape and damping ratio, highlight the importance of considering these factors in the design and optimization of granular materials for various geoengineering applications.
Figure 15a,b illustrate the variations in vertical stress and the CSR against the number of applied loading cycles, respectively; in these figures, the size of the circle diameters represents the magnitude of the damping ratio. The findings indicate that the damping ratio increases with increasing vertical stress levels, as evidenced by the increases observed in the circle diameters. These results provide insight into the influence of loading stresses on the damping behavior of sand, which has significant implications for the design and construction of various geotechnical structures.

3.2. Artificial Neural Network (ANN) Performance

Equations (6)–(11) provide definitions for the various parameters that can be employed to evaluate an ANN’s performance. These parameters include mean absolute error (MAE), mean squared error (MSE), root mean squared error (RMSE), mean squared logarithmic error (MSLE), root mean squared logarithmic error (RMSLE) and coefficient of determination (R2).
MAE = N X m X p N
MSE = N X m X p 2 N
RMSE = N X m X p 2 N
MSLE = N log 10 X m + 1 log 10 X p + 1 2 N
RMSLE = N log 10 X m + 1 log 10 X p + 1 2 N
R 2 = N X m X m ¯ X p X p ¯ N X m X m ¯ 2 N X p X p ¯ 2 2
where N = number of datasets; Xm and Xp = actual and predicted values, respectively; and X m ¯ and X p ¯ = average of the actual and predicted values, respectively. Note: Ideally, the model should have R2 = 1 and MAE, MSE, RMSE, MSLE and RMSLE values of 0.
To implement data-driven models, two types of datasets are necessary, namely training and testing datasets. In this study, 80% of the main database was assigned to training and the remaining 20% to testing. Table 4 and Table 5 present descriptive statistics for the training and testing datasets, respectively. As is evident from these tables, the statistical descriptors for these two datasets are quite close, which can improve the accuracy of AI-based models. In addition, Table 6 displays the linear correlation matrix for both input and output parameters. Based on the findings, it can be concluded that there is no significant linear correlation observed among any of the parameters.
Several parameters, including the number of hidden layers and neurons, can impact the accuracy of ANN models. To obtain the optimal and most accurate ANN model, multiple models were generated and assessed to determine the best one. The performance of the selected model was evaluated by comparing the predicted damping ratio values against those of the testing dataset, as illustrated in Figure 16. The results demonstrate the high accuracy of the ANN model in predicting the damping ratio of sand.
To elaborate further on the results of the ANN model, it should be noted that the model had one hidden layer, and the number of neurons in the input layer was five, corresponding to the five independent variables employed, namely the three particle shape parameters (i.e., S, R and ρ), vertical stress, the number of loading cycles and the CSR. The number of neurons in the hidden layer was initially set to 50, but through an iterative process of trial and error, the optimum number of neurons was determined to be 28. This process is essential for optimizing the model’s performance and ensuring that it is not overfitting the training data.
Table 7 presents various performance metrics (i.e., MAE, MSE, RMSE, MSLE, RMSLE and R2) for the proposed ANN model, trained using a Levenberg–Marquardt (LM) algorithm, to predict the damping ratio as a function of the sand particle shape, vertical stress, number of loading cycles and CSR. The results indicate that the ANN model performs well in predicting the damping ratio, as evidenced by the high R2 value of 0.962 for both the training and testing datasets, indicating that 96.2% of the variations in the actual output variable (i.e., the damping ratio) is captured and explained by the proposed ANN model. The MAE, MSE and RMSE values for the training dataset were found to be higher than those obtained for testing, indicating that the model performs better on the testing dataset. This could be due to overfitting, which occurs when the model fits the training data too closely, leading to relatively poorer performance on new (unseen) datasets. The MSLE and RMSLE values were low for both the training and testing datasets, implying that the predictions were associated with low forecast errors. In conclusion, the results suggest that the ANN model trained using the LM algorithm is a promising approach for predicting the damping ratio of sand based on the sand particle shape, vertical stress, number of loading cycles and CSR. However, further research is needed to validate the model’s performance on larger (and/or more diverse) datasets.

3.3. Support Vector Machine (SVM)

The accuracy of SVM models can be significantly impacted by various parameters, including the kernel function and the C and Gamma parameters. To obtain the optimal and most accurate SVM model, several models were trained and evaluated, and the best one was selected. The evaluation process was carried out by comparing the predicted damping ratio values against their actual counterparts from the testing dataset, as illustrated in Figure 17. The results indicate the high accuracy of the SVM model in predicting the damping ratio of sand.
The overall performance of the proposed SVM model to predict the damping ratio for both training and testing datasets is presented in Table 8. The SVM model achieved MAE values of 0.716 and 0.831 for the training and testing datasets, respectively. The corresponding MSE and RMSE values were 0.761 and 0.872 for training and 1.302 and 1.141 for testing, respectively. Moreover, the model’s MSLE and RMSLE values were obtained as 0.006 and 0.079 for the training dataset and 0.003 and 0.057 for the testing dataset, respectively. In terms of correlation, the SVM model produced R2 = 0.973 and 0.892 for the training and testing datasets, respectively. Like the proposed ANN model, these results suggest that the SVM model performs well in predicting the damping ratio of sand based on the selected input parameters (the sand particle shape, vertical stress, number of loading cycles and CSR conditions).

4. Discussion

4.1. Effects of Void Ratio Changes on Damping Ratio

An investigation was also conducted to examine the effects of cyclic loading on the void ratio of the tested samples. The minimum and maximum void ratio (i.e., emin and emax) variations against the number of cycles based on the R, S and ρ parameters are provided in Figure 18, Figure 19 and Figure 20, respectively. Note that the circle diameters in these figures represent the magnitude of the void ratio parameter. The findings demonstrate that with an increase in the number of loading cycles, and thus a consequent rounding of the sand grains, the void ratio between the grains reduces. This can be attributed to the fact that more rounded and spherical particles possess a higher packing capability, which leads to a reduction in the volume of voids (and an increase in the contact levels achieved between the particles). This increase in inter-particle interaction leads to higher energy dissipation during cyclic loading, which is reflected in the higher damping ratio (with an increasing number of cycles).

4.2. Importance of Input Parameters and Sensitivity Analysis

A sensitivity analysis was conducted on the input parameters of the proposed ANN and SVM models to investigate their impacts on (the accuracy of) the output variable (or the damping ratio). For this purpose, each input parameter was increased and decreased individually by 100%, and the resulting error was measured to establish the sensitivity of the model to that parameter. The results of the sensitivity analysis are plotted in Figure 21, which illustrates the mean increase in error as the input parameters were increased or decreased. The higher the error, the more sensitive the model is to the input parameter.
Table 9 presents the ranking results of variable importance for the proposed ANN and SVM models. The input parameters for each model include the number of loading cycles, S, R, ρ, vertical stress and the CSR. Note that the ranking results are based on the total score obtained by each input parameter. From Table 9, it can be observed that the most important input parameter is vertical stress, with a total score of 2 and a ranking of 1. The significance of vertical stress in regulating the contact forces between the particles, and thus the dissipation of energy during cyclic loading, is the main reason behind this phenomenon. The second most important input parameter is R, with a total score of 5 and a ranking of 2. This is followed by ρ, with a total score of 6 and a ranking of 3. The fourth and fifth most important input parameters are the number of cycles and S, with total scores of 7 and 10 (rankings of 4 and 5), respectively. Finally, the CSR has the lowest total score of 12 and is ranked last in terms of importance. These rankings provide valuable insight into the relative importance of the input variables in predicting the damping ratio (for the models considered in this study). This information can be useful in optimizing the models and selecting the most important input variables for particular applications.
It is necessary to mention that the best AI model can be applied to other dry sands with similar particle shape parameters and minerology.

4.3. Limitations and Scope for Future Works

Although the present investigation provides significant progress towards understanding the effects of sand particle shape on the damping ratio of dry sand, with the proposed AI-based models being applicable to other dry sands with similar particle shape parameters and minerology, there still exist some limitations and hence scope for future investigations. Firstly, this study was conducted using only one type of sand, which may limit the generalizability of the findings to other soil types (in terms of, for instance, gradation and mineralogy). Moreover, the present investigation only focused on three conventional shape parameters to characterize sand particle shape and did not consider other factors, such as particle size, particle sorting and loading rate, which may also affect the damping ratio. In addition, a further suggestion for future research is to explore the combined effects of moisture content and particle shape on the damping ratio of sands. That is, moisture content can have a significant impact on the mechanical properties of soils, including the damping ratio, as it affects inter-particle forces and particle arrangements. Therefore, mindful of the above points, further research is needed to validate and build on the experimental results and AI-based models presented in this study. It is also worth mentioning that the validity of any data-driven model, including the AI-based models proposed in this study, is dependent on the accuracy (correctness) of the data from which it is established. That is, successful predictions based on unreliable experimental data hold no practical significance. This highlights the importance of the data selection stage and the need to ensure data reliability before modeling applications. Note that the database employed in this study was compared against historical data [27] and also evaluated for reproducibility prior to application. Future research studies in the field of AI should exercise caution when selecting their database for model development.

5. Summary and Conclusions

This study employed a unique approach of cyclic loading (via simple shear testing) to evaluate the effects of particle shape (in terms of roundness, sphericity and regularity) on the damping ratio of dry sand, which has practical implications for geotechnical engineering applications. Moreover, two AI-based models (ANN and SVM) were developed that can effectively predict the effects of sand particle shape on the damping ratio. Based on the experimental results and AI-based modeling results, the following conclusions can be drawn:
  • The shape of the sand particles changes during cyclic loading, becoming progressively more rounded and spherical with an increasing number of loading cycles, resulting in an increase in the damping ratio.
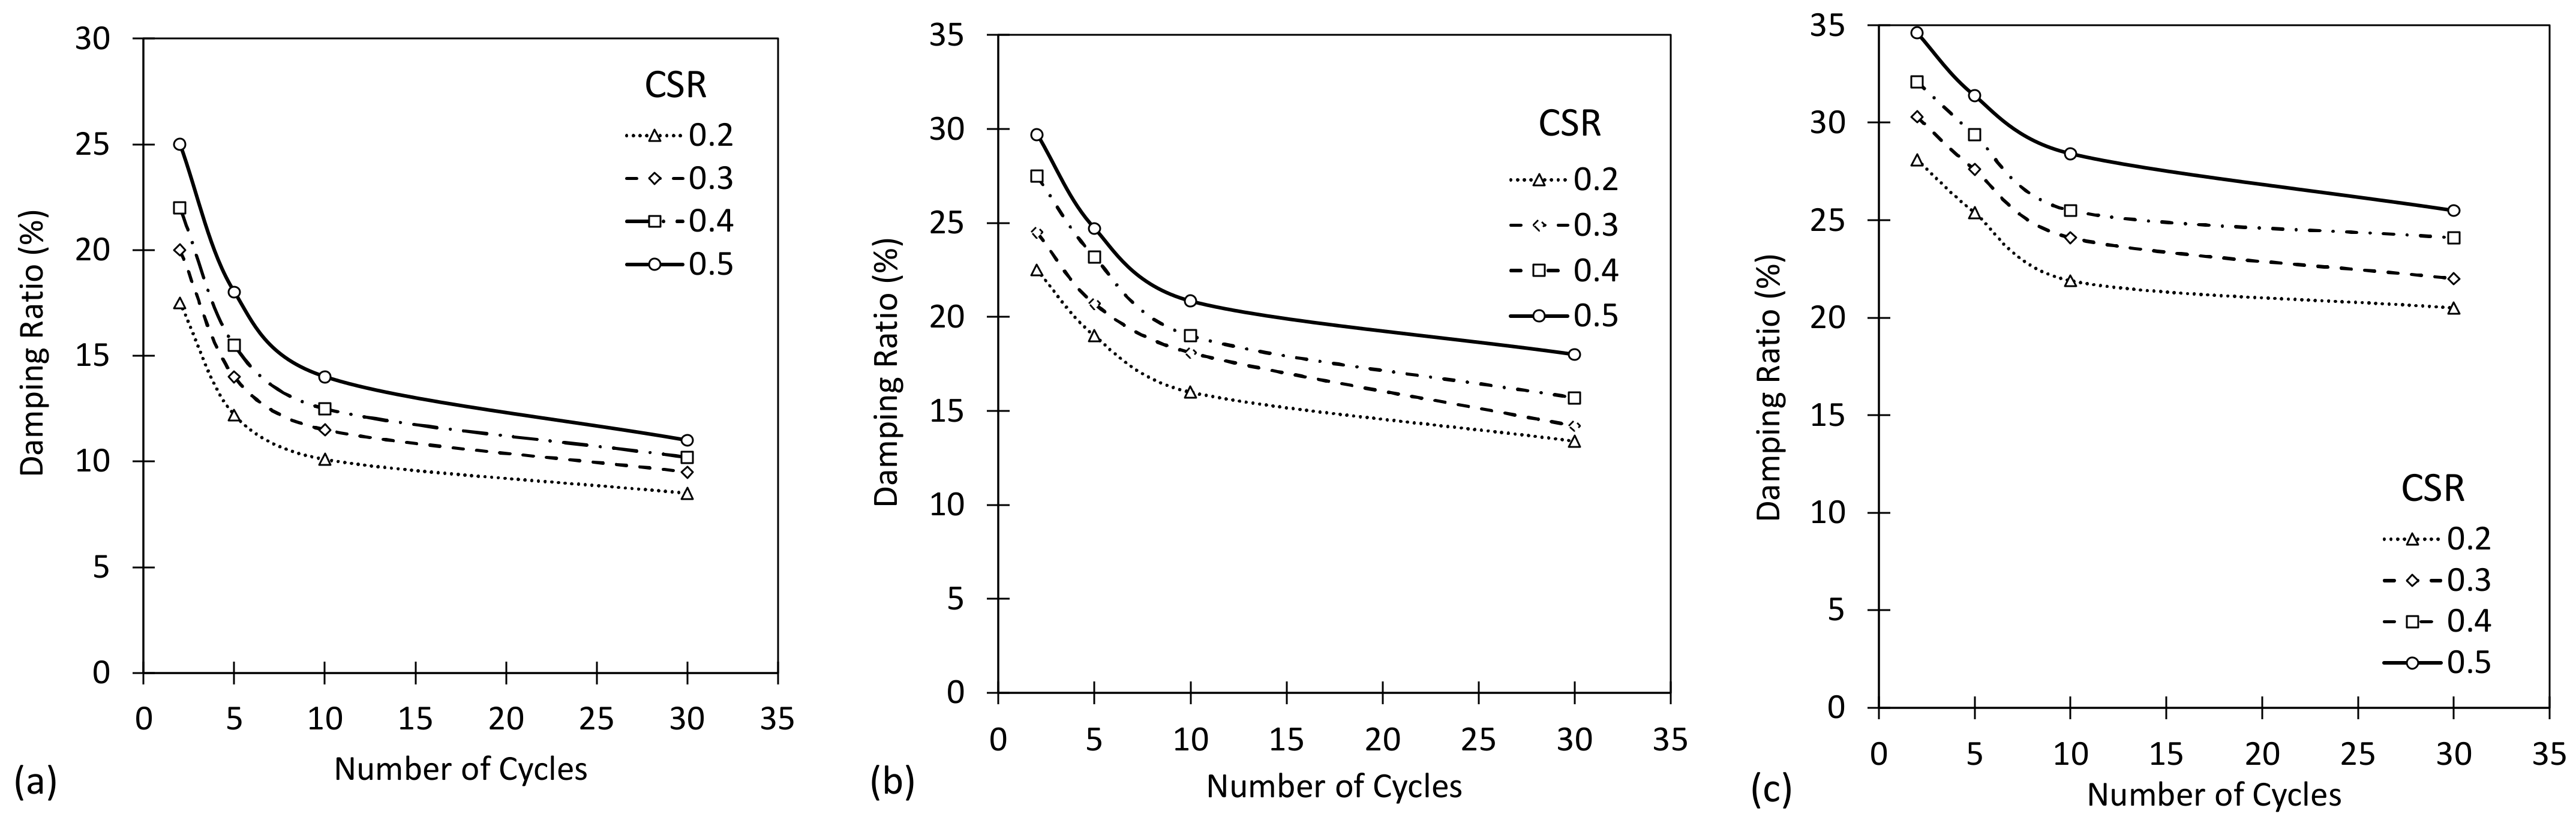
  • The damping ratio was found to decrease as the number of loading cycles increased. This can be attributed to the fact that cyclic loading rearranges the sand particles, prompting an increase in the packing capability (and hence a decrease in the volume of voids) of the samples. This is followed by an increase in the number of contact points between the particles, thereby leading to higher energy dissipation during cyclic loading.
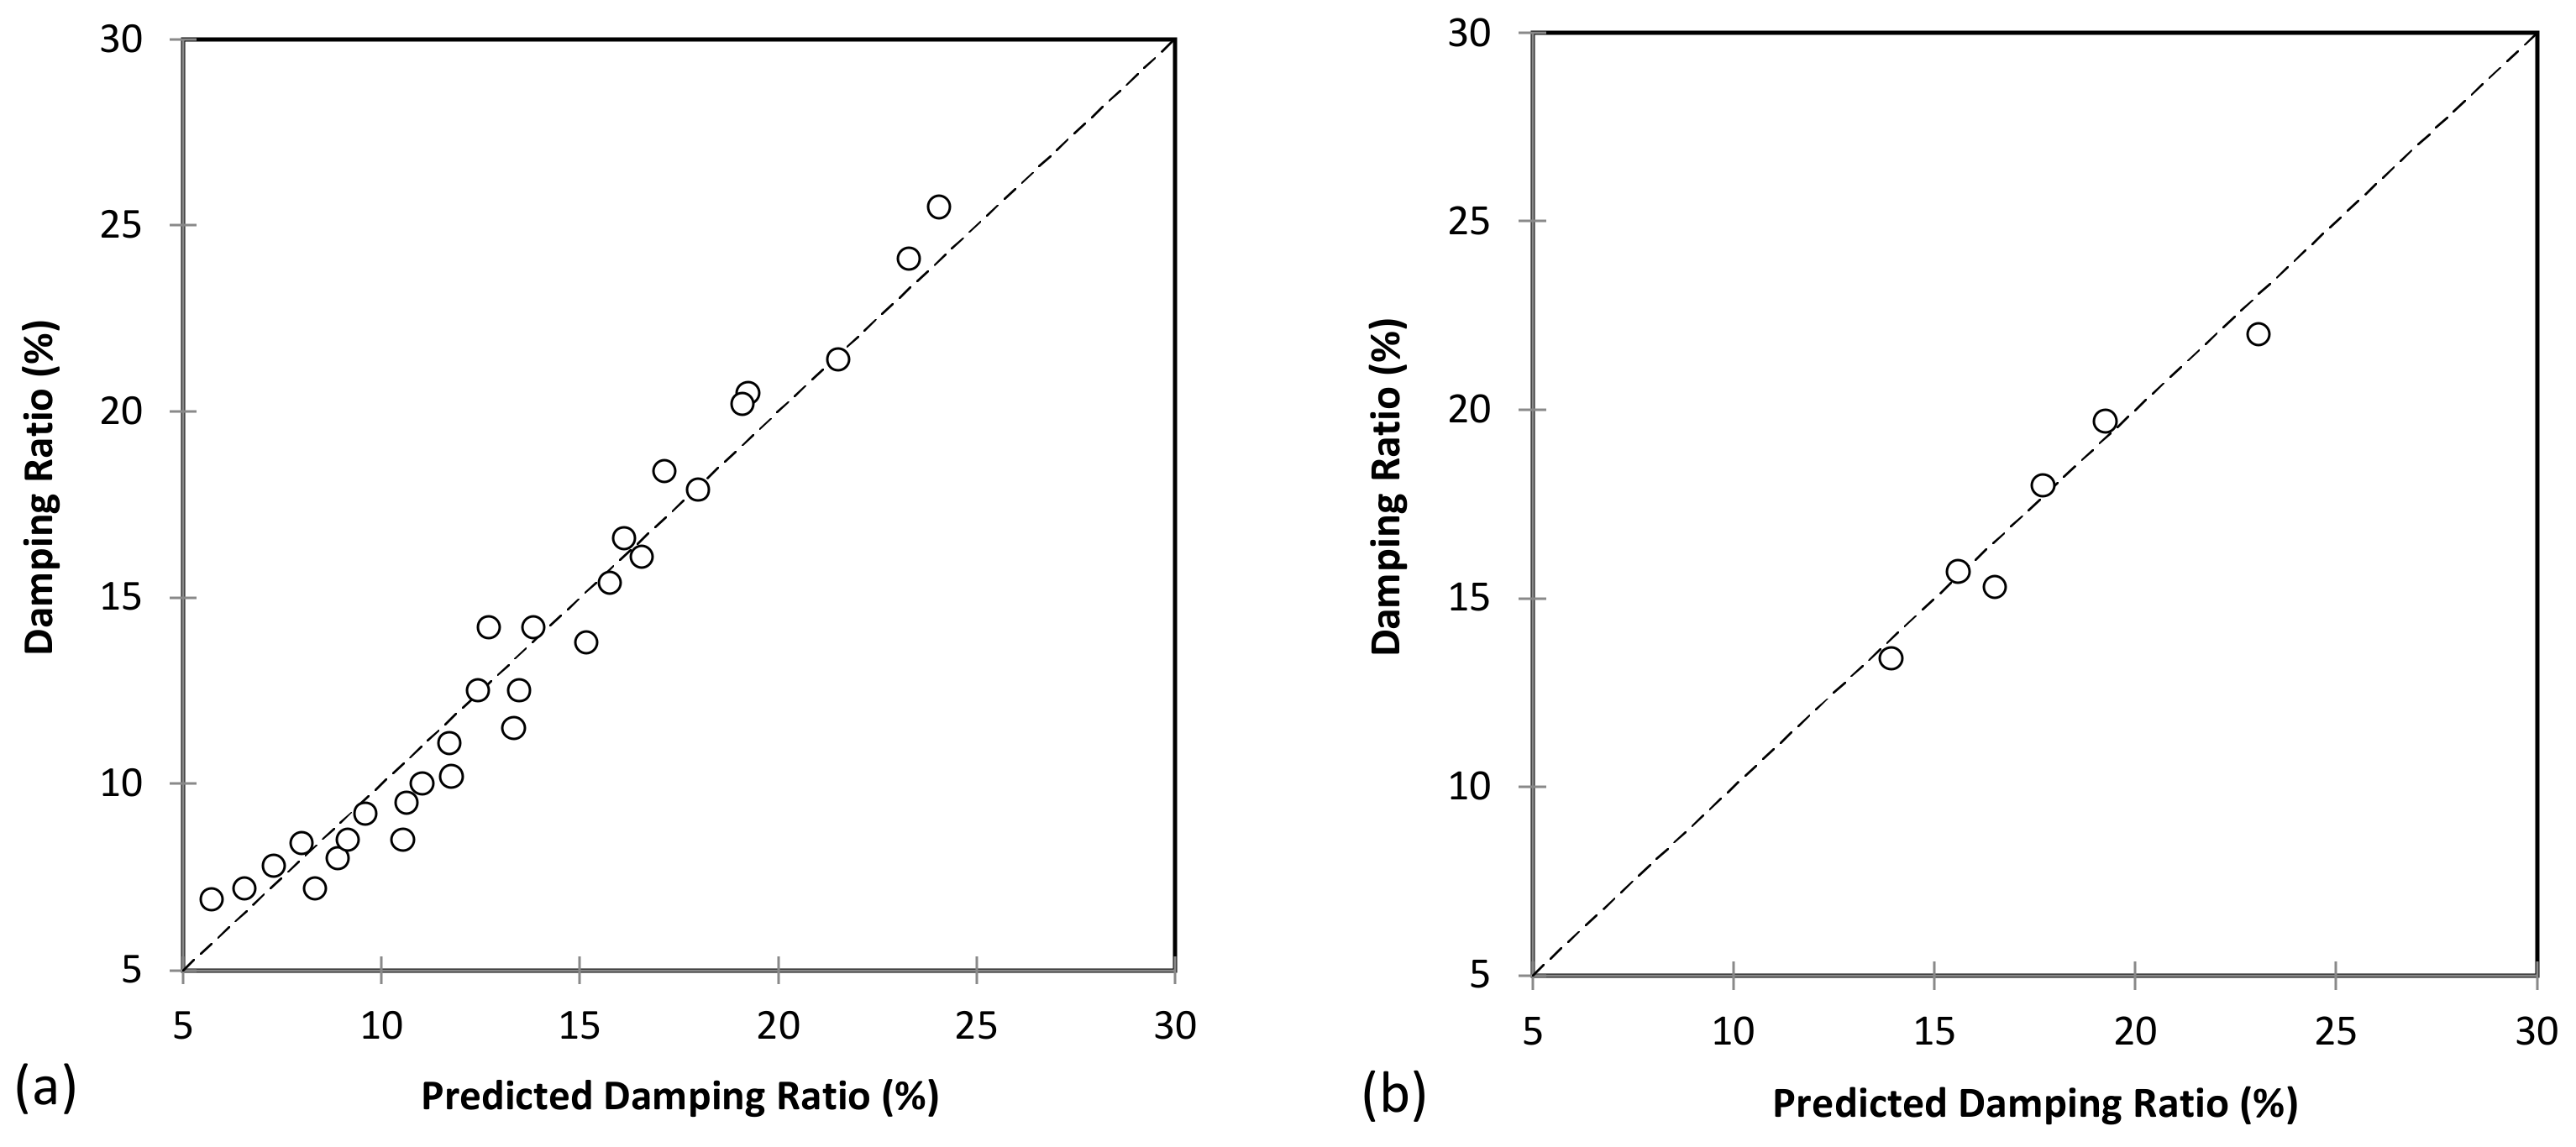
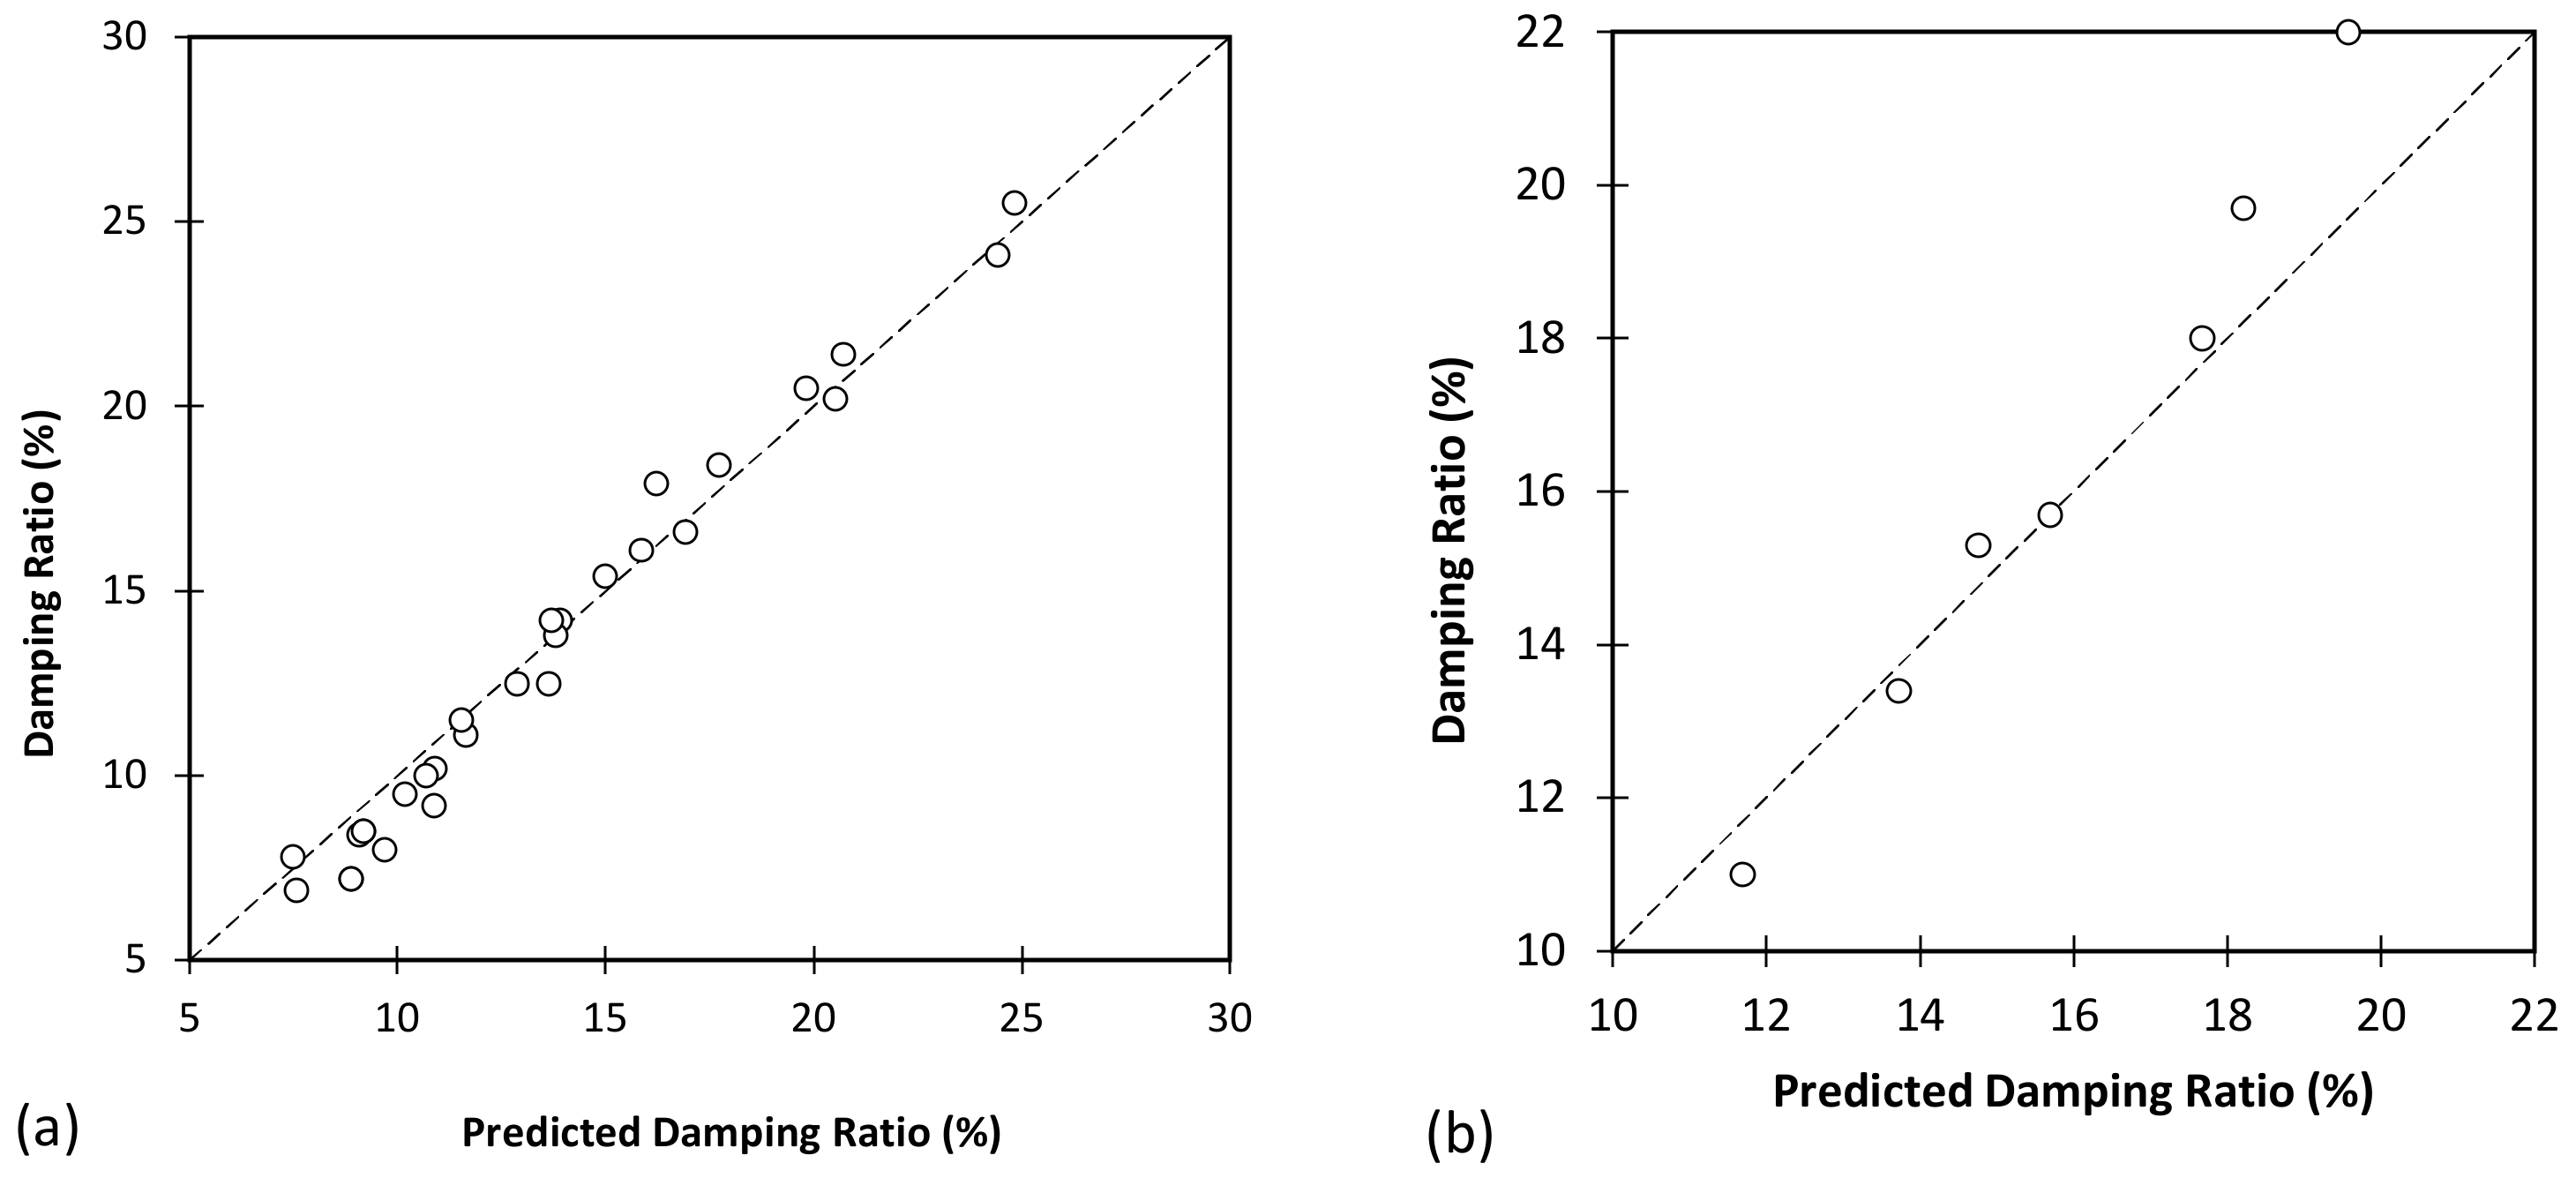
  • Compared to the SVM, the proposed ANN model, trained using LM algorithms, was found to produce more promising results in predicting the damping ratio of the dry sand as a function of the particle shape parameters, vertical stress, number of loading cycles and CSR. This was supported by the model’s high R2 value of 0.962 for both the training and testing datasets.
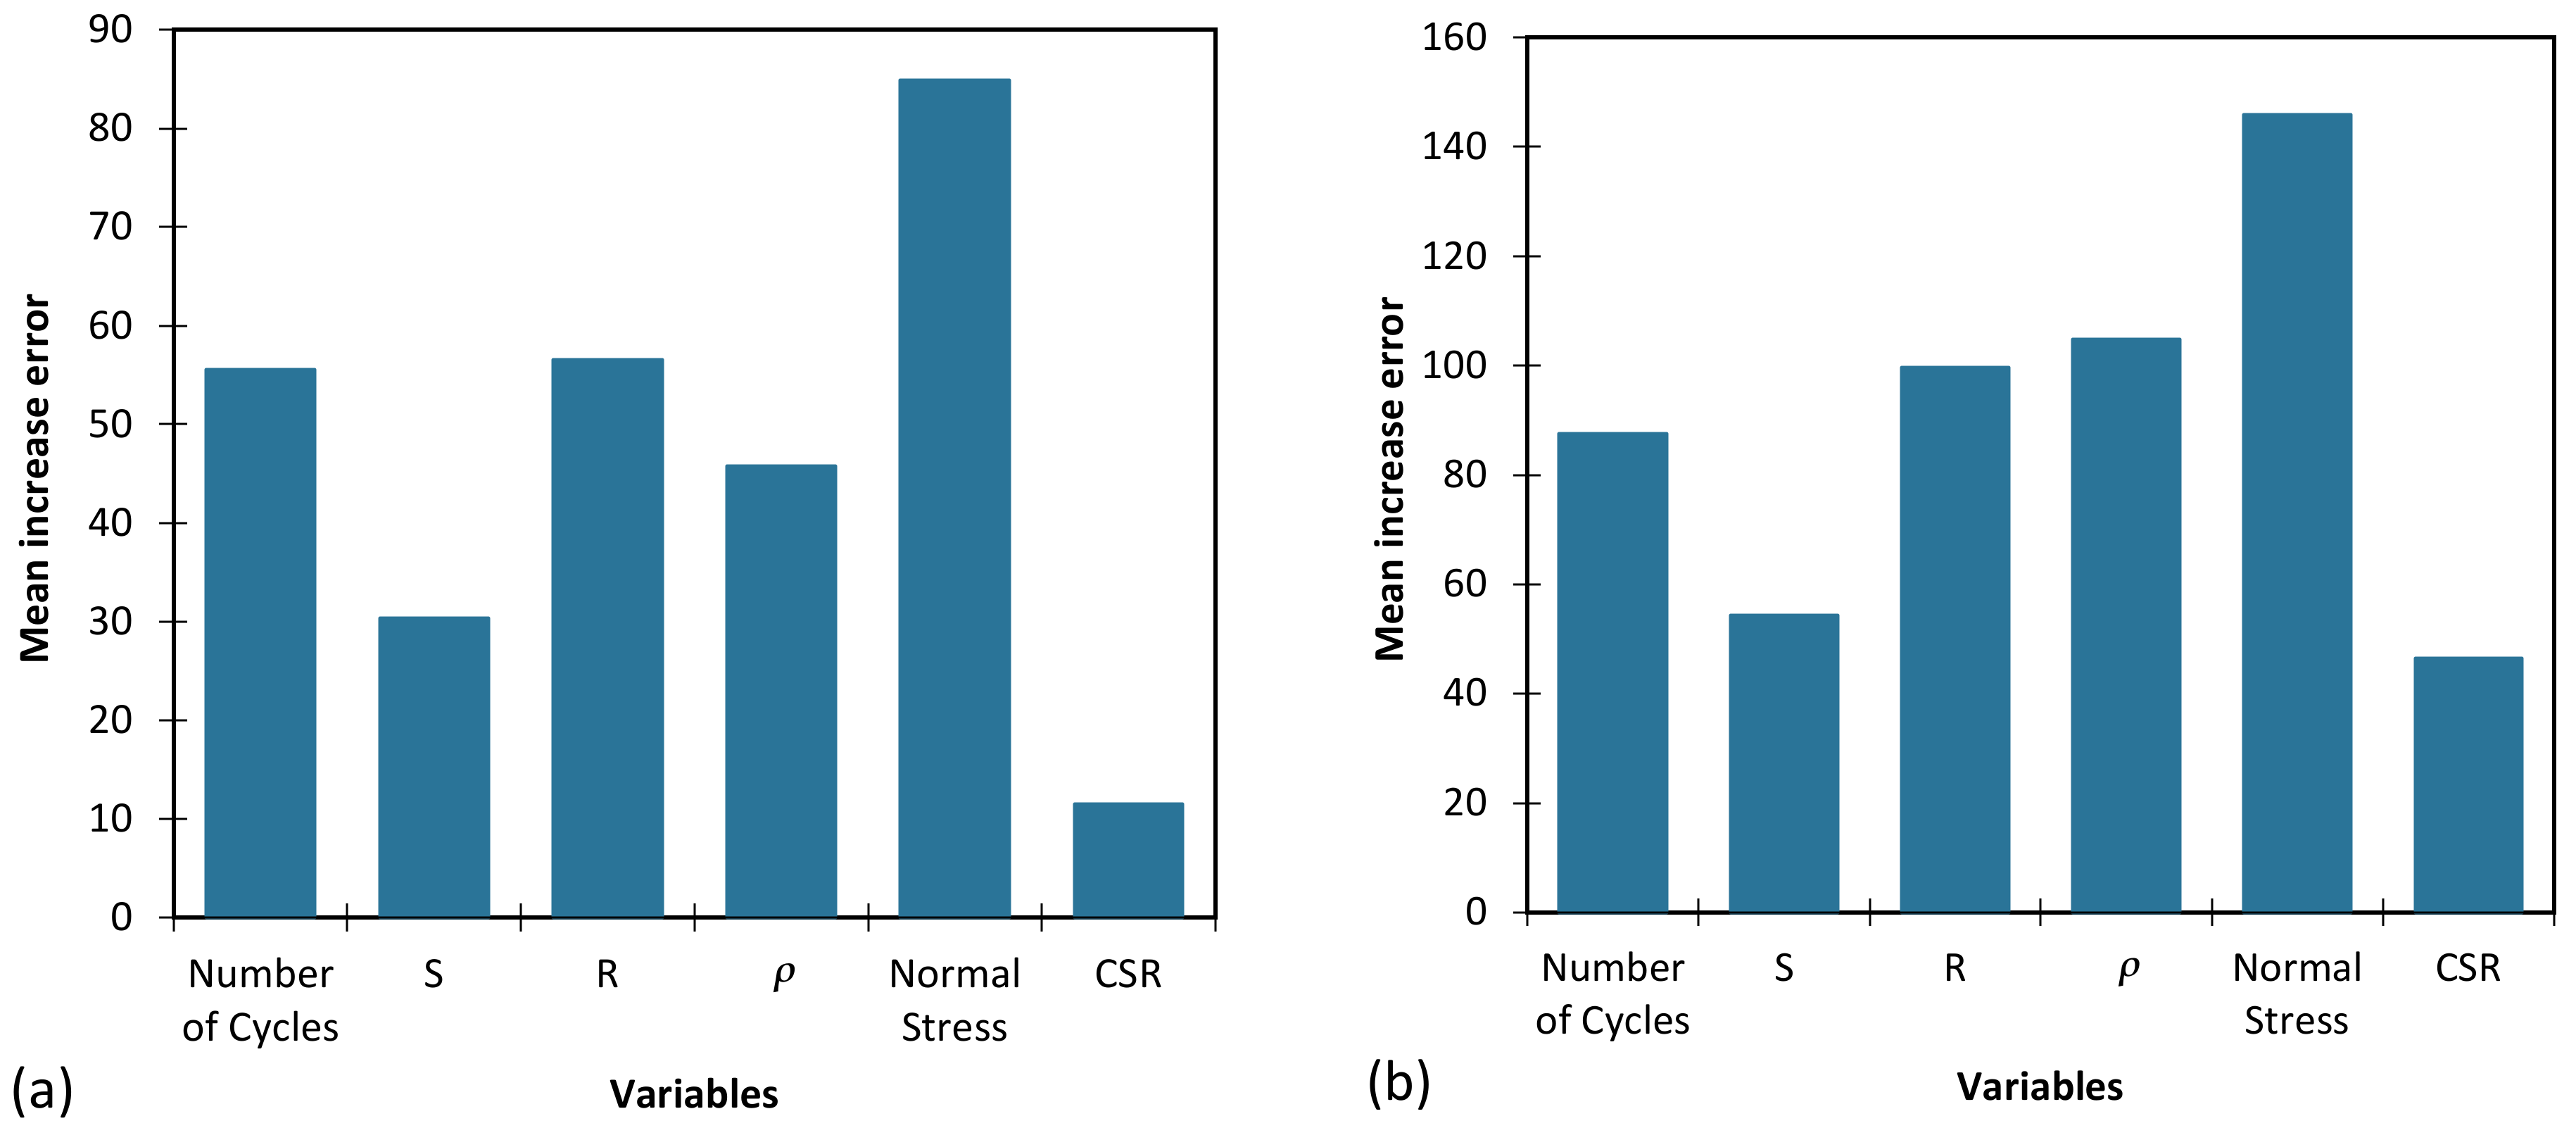
  • Based on the sensitivity analysis results, vertical stress was found to be the most important parameter affecting the damping ratio, while the effects/importance of the CSR were relatively small. That is, increasing the vertical stress resulted in an increase in the damping ratio, while the effects of increasing the CSR on the damping ratio were fairly small. This is because vertical stress plays a major role in controlling the contact forces between the sand particles (and hence the energy dissipation) during cyclic loading.
Further research is recommended to validate the results of the proposed AI-based model and to investigate the impacts of other factors on the damping ratio, such as particle size, particle sorting and loading rate. Moreover, the study could be expanded to include other soil types and to investigate the effects of particle shape on other relevant geotechnical properties, such as shear strength and compressibility.

Author Contributions

Conceptualization, A.B.; methodology, A.B.; software, A.B., R.S and H.B.; validation, A.B., S.C. and A.S.; formal analysis, A.S.; investigation, A.B.; resources, A.B.; data curation, A.B. and R.S.F.; writing—original draft preparation, A.B. and A.S.; writing—review and editing, A.B., A.S. and R.S.F.; visualization, A.B., A.S. and H.B.; supervision, S.C.; project administration, A.B.; funding acquisition, A.B. and S.C. All authors have read and agreed to the published version of the manuscript.

Funding

This research received no external funding.

Institutional Review Board Statement

Not applicable.

Informed Consent Statement

Not applicable.

Data Availability Statement

Not aplicable.

Acknowledgments

The first author gratefully acknowledges Deakin University for making this research possible through the provision of the Australian Government Research Training Program (RTP) Scholarship.

Conflicts of Interest

The authors declare that they have no known competing financial interests or personal relationships that could have appeared to influence the work reported in this paper.

References

  1. Ashmawy, A.K.; Salgado, R.; Guha, S.; Drnevich, V.P. Soil damping and its use in dynamic analyses. In Proceedings of the International Conferences on Recent Advances in Geotechnical Earthquake Engineering and Soil Dynamics, St. Louis, MO, USA, 2–7 April 1995; Volume 9. [Google Scholar]
  2. Luna, R.; Jadi, H. Determination of dynamic soil properties using geophysical methods. In Proceedings of the first international conference on the application of geophysical and NDT methodologies to transportation facilities and infrastructure, St. Louis, MO, USA, 11–15 December 2000; pp. 1–15. [Google Scholar]
  3. Ventura, C.E.; Finn, W.L.; Lord, J.F.; Fujita, N. Dynamic characteristics of a base isolated building from ambient vibration measurements and low level earthquake shaking. Soil Dyn. Earthq. Eng. 2003, 23, 313–322. [Google Scholar] [CrossRef]
  4. Sahebzadeh, S.; Heidari, A.; Kamelnia, H.; Baghbani, A. Sustainability features of Iran’s vernacular architecture: A comparative study between the architecture of hot–arid and hot–arid–windy regions. Sustainability 2017, 9, 749. [Google Scholar] [CrossRef] [Green Version]
  5. Seed, H.B.; Wong, R.T.; Idriss, I.M.; Tokimatsu, K. Moduli and damping factors for dynamic analyses of cohesionless soils. J. Geotech. Eng. 1986, 112, 1016–1032. [Google Scholar] [CrossRef]
  6. Senetakis, K.; Payan, M. Small strain damping ratio of sands and silty sands subjected to flexural and torsional resonant column excitation. Soil Dyn. Earthq. Eng. 2018, 114, 448–459. [Google Scholar] [CrossRef]
  7. Senetakis, K.; Anastasiadis, A.; Pitilakis, K. Normalized shear modulus reduction and damping ratio curves of quartz sand and rhyolitic crushed rock. Soils Found. 2013, 53, 879–893. [Google Scholar] [CrossRef] [Green Version]
  8. Edinçliler, A.; Yildiz, O. Effects of processing type on shear modulus and damping ratio of waste tire-sand mixtures. Geosynth. Int. 2022, 29, 389–408. [Google Scholar] [CrossRef]
  9. Akbarimehr, D.; Fakharian, K. Dynamic shear modulus and damping ratio of clay mixed with waste rubber using cyclic triaxial apparatus. Soil Dyn. Earthq. Eng. 2021, 140, 106435. [Google Scholar] [CrossRef]
  10. Payan, M.; Senetakis, K.; Khoshghalb, A.; Khalili, N. Characterization of the small-strain dynamic behaviour of silty sands; contribution of silica non-plastic fines content. Soil Dyn. Earthq. Eng. 2017, 102, 232–240. [Google Scholar] [CrossRef]
  11. Li, W.; Lang, L.; Wang, D.; Wu, Y.; Li, F. Investigation on the dynamic shear modulus and damping ratio of steel slag sand mixtures. Constr. Build. Mater. 2018, 162, 170–180. [Google Scholar] [CrossRef]
  12. Wichtmann, T.; Triantafyllidis, T. Effect of uniformity coefficient on G/G max and damping ratio of uniform to well-graded quartz sands. J. Geotech. Geoenviron. Eng. 2013, 139, 59–72. [Google Scholar] [CrossRef] [Green Version]
  13. Hardin, B.O.; Drnevich, V.P. Shear modulus and damping in soils: Measurement and parameter effects (terzaghi leture). J. Soil Mech. Found. Div. 1972, 98, 603–624. [Google Scholar] [CrossRef]
  14. Kumar, S.S.; Krishna, A.M.; Dey, A. Parameters influencing dynamic soil properties: A review treatise. In Proceedings of the National Conference on Recent Advances in Civil Engineering, Bhiwani, India, 15–16 November 2013; pp. 1–10. [Google Scholar]
  15. Okur, D.V.; Ansal, A. Stiffness degradation of natural fine grained soils during cyclic loading. Soil Dyn. Earthq. Eng. 2007, 27, 843–854. [Google Scholar] [CrossRef]
  16. Wichtmann, T.; Triantafyllidis, T. Influence of a cyclic and dynamic loading history on dynamic properties of dry sand, part I: Cyclic and dynamic torsional prestraining. Soil Dyn. Earthq. Eng. 2004, 24, 127–147. [Google Scholar] [CrossRef]
  17. Jafarzadeh, F.; Sadeghi, H. Experimental study on dynamic properties of sand with emphasis on the degree of saturation. Soil Dyn. Earthq. Eng. 2012, 32, 26–41. [Google Scholar] [CrossRef]
  18. Wu, S.; Gray, D.H.; Richart, F.E., Jr. Capillary effects on dynamic modulus of sands and silts. J. Geotech. Eng. 1984, 110, 1188–1203. [Google Scholar] [CrossRef]
  19. Clayton, C.R.; Priest, J.A.; Best, A.I. The effects of disseminated methane hydrate on the dynamic stiffness and damping of a sand. Geotechnique 2005, 55, 423–434. [Google Scholar] [CrossRef]
  20. Baghbani, A.; Choudhury, T.; Costa, S.; Reiner, J. Application of artificial intelligence in geotechnical engineering: A state-of-the-art review. Earth Sci. Rev. 2022, 228, 103991. [Google Scholar] [CrossRef]
  21. Bayat, M.; Ghalandarzadeh, A. Stiffness degradation and damping ratio of sand-gravel mixtures under saturated state. Int. J. Civ. Eng. 2018, 16, 1261–1277. [Google Scholar] [CrossRef]
  22. Ling, X.Z.; Zhang, F.; Li, Q.L.; An, L.S.; Wang, J.H. Dynamic shear modulus and damping ratio of frozen compacted sand subjected to freeze–thaw cycle under multi-stage cyclic loading. Soil Dyn. Earthq. Eng. 2015, 76, 111–121. [Google Scholar] [CrossRef]
  23. Chen, G.; Zhou, Z.; Sun, T.; Wu, Q.; Xu, L.; Khoshnevisan, S.; Ling, D. Shear modulus and damping ratio of sand–gravel mixtures over a wide strain range. J. Earthq. Eng. 2019, 23, 1407–1440. [Google Scholar] [CrossRef]
  24. Wichtmann, T.; Hernández, M.N.; Triantafyllidis, T. On the influence of a non-cohesive fines content on small strain stiffness, modulus degradation and damping of quartz sand. Soil Dyn. Earthq. Eng. 2015, 69, 103–114. [Google Scholar] [CrossRef]
  25. Tong, L.; Wang, Y.H. DEM simulations of shear modulus and damping ratio of sand with emphasis on the effects of particle number, particle shape, and aging. Acta Geotech. 2015, 10, 117–130. [Google Scholar] [CrossRef]
  26. Jafarian, Y.; Javdanian, H.; Haddad, A. Dynamic properties of calcareous and siliceous sands under isotropic and anisotropic stress conditions. Soils Found. 2018, 58, 172–184. [Google Scholar] [CrossRef]
  27. Baghbani, A.; Costa, S.; O’Kelly, B.C.; Soltani, A.; Barzegar, M. Experimental study on cyclic simple shear behaviour of predominantly dilative silica sand. Int. J. Geotech. Eng. 2022, 23, 91–105. [Google Scholar] [CrossRef]
  28. Baghbani, A.; Choudhury, T.; Samui, P.; Costa, S. Prediction of secant shear modulus and damping ratio for an extremely dilative silica sand based on machine learning techniques. Soil Dyn. Earthq. Eng. 2023, 165, 107708. [Google Scholar] [CrossRef]
  29. Nguyen, M.D.; Baghbani, A.; Alnedawi, A.; Ullah, S.; Kafle, B.; Thomas, M.; Moon, E.M.; Milne, N.A. Experimental Study on the Suitability of Aluminium-Based Water Treatment Sludge as a Next Generation Sustainable Soil Replacement for Road Construction. Available online: https://ssrn.com/abstract=4331275 (accessed on 25 March 2023).
  30. Baghbani, A.; Baumgartl, T.; Filipovic, V. Effects of Wetting and Drying Cycles on Strength of Latrobe Valley Brown Coal. In Proceedings of the Copernicus Meetings, Vienna, Austria, 23–28 April 2023. [Google Scholar]
  31. Baghbani, A.; Nguyen, M.D.; Alnedawi, A.; Milne, N.; Baumgartl, T.; Abuel-Naga, H. Improving Soil Stability with Alum Sludge: An AI-Enabled Approach for Accurate Prediction of California Bearing Ratio. Preprints 2023, 2023030197. [Google Scholar]
  32. Cabalar, A.F.; Cevik, A. Modelling damping ratio and shear modulus of sand–mica mixtures using neural networks. Eng. Geol. 2009, 104, 31–40. [Google Scholar] [CrossRef]
  33. Keshavarz, A.; Mehramiri, M. New Gene Expression Programming models for normalized shear modulus and damping ratio of sands. Eng. Appl. Artif. Intell. 2015, 45, 464–472. [Google Scholar] [CrossRef]
  34. Akbulut, S.; Hasiloglu, A.S.; Pamukcu, S. Data generation for shear modulus and damping ratio in reinforced sands using adaptive neuro-fuzzy inference system. Soil Dyn. Earthq. Eng. 2004, 24, 805–814. [Google Scholar] [CrossRef]
  35. Manafi Khajeh Pasha, S.; Hazarika, H.; Yoshimoto, N. An Artificial Intelligence Approach for Modeling Shear Modulus and Damping Ratio of Tire Derived Geomaterials. In Advances in Computer Methods and Geomechanics: IACMAG Symposium 2019; Springer: Singapore, 2020; Volume 2, pp. 591–606. [Google Scholar]
  36. Abdolrasol, M.G.; Hussain, S.S.; Ustun, T.S.; Sarker, M.R.; Hannan, M.A.; Mohamed, R.; Ali, J.A.; Mekhilef, S.; Milad, A. Artificial neural networks based optimization techniques: A review. Electronics 2021, 10, 2689. [Google Scholar] [CrossRef]
  37. Baghbani, A.; Daghistani, F.; Baghbani, H.; Kiany, K. Predicting the Strength of Recycled Glass Powder-Based Geopolymers for Improving Mechanical Behavior of Clay Soils Using Artificial Intelligence; EasyChair: Manchester, UK, 2023. [Google Scholar]
  38. Baghbani, A.; Daghistani, F.; Baghbani, H.; Kiany, K.; Bazaz, J.B. Artificial Intelligence-Based Prediction of Geotechnical Impacts of Polyethylene Bottles and Polypropylene on Clayey Soil; EasyChair: Manchester, UK, 2023. [Google Scholar]
  39. Baghbani, A.; Daghistani, F.; Kiany, K.; Shalchiyan, M.M. AI-Based Prediction of Strength and Tensile Properties of Expansive Soil Stabilized with Recycled Ash and Natural Fibers; EasyChair: Manchester, UK, 2023. [Google Scholar]
  40. Baghbani, A.; Daghistani, F.; Naga, H.A.; Costa, S. Development of a Support Vector Machine (SVM) and a Classification and Regression Tree (CART) to Predict the Shear Strength of Sand Rubber Mixtures. In Proceedings of the 8th International Symposium on Geotechnical Safety and Risk (ISGSR), Newcastle, Australia, 14–16 December 2022. [Google Scholar]
  41. Baghbani, A.; Costa, S.; Choundhury, T.; Faradonbeh, R.S. Prediction of Parallel Desiccation Cracks of Clays Using a Classification and Regression Tree (CART) Technique. In Proceedings of the 8th International Symposium on Geotechnical Safety and Risk (ISGSR), Newcastle, Australia, 14–16 December 2022. [Google Scholar]
  42. Baghbani, A.; Baghbani, H.; Shalchiyan, M.M.; Kiany, K. Utilizing artificial intelligence and finite element method to simulate the effects of new tunnels on existing tunnel deformation. J. Comput. Cogn. Eng. 2022, 2022, 1–10. [Google Scholar]
  43. Shahin, M.A. Artificial intelligence in geotechnical engineering: Applications, modeling aspects, and future directions. In Metaheuristics in Water, Geotechnical and Transport Engineering; Elseiver: Amsterdam, The Netherlands, 2013; p. 169204. [Google Scholar]
  44. Ebid, A.M. 35 Years of (AI) in geotechnical engineering: State of the art. Geotech. Geol. Eng. 2021, 39, 637–690. [Google Scholar] [CrossRef]
  45. ASTM D2487-17; Standard Practice for Classification of Soils for Engineering Purposes (Unified Soil Classification System). ASTM International: West Conshohocken, PA, USA, 2017.
  46. ASTM D854–14; Standard Test Methods for Specific Gravity of Soil Solids by Water Pycnometer. ASTM International: West Conshohocken, PA, USA, 2014.
  47. ASTMD4253 A; Standard Test Methods for Maximum Index Density and Unit Weight of Soils Using a Vibratory Table. ASTM International: West Conshohocken, PA, USA, 2006.
  48. ASTMD4254 A; Standard Test Methods for Minimum Index Density and Unit Weight of Soils and Calculation of Relative Density. ASTM International: West Conshohocken, PA, USA, 2006.
  49. Ladd, R.S. Specimen preparation and liquefaction of sands. J. Geotech. Eng. Div. 1974, 100, 1180–1184. [Google Scholar] [CrossRef]
  50. Carraro, J.A.; Prezzi, M.; Salgado, R. Shear strength and stiffness of sands containing plastic or nonplastic fines. J. Geotech. Geoenviron. Eng. 2009, 135, 1167–1178. [Google Scholar] [CrossRef]
  51. Krumbein, W.C.; Sloss, L.L. Stratigraphy and Sedimentation; LWW: Philadelphia, PA, USA, 1951; Volume 71, p. 401. [Google Scholar]
  52. Cho, G.C.; Dodds, J.; Santamarina, J.C. Closure to “particle shape effects on packing density, stiffness, and strength: Natural and crushed sands” by Gye-Chun Cho, Jake Dodds, and J. Carlos Santamarina. J. Geotech. Geoenviron. Eng. 2007, 133, 1474. [Google Scholar] [CrossRef]
  53. Kay, L.E. From logical neurons to poetic embodiments of mind: Warren S. McCulloch’s project in neuroscience. Sci. Context 2001, 14, 591–614. [Google Scholar] [CrossRef]
  54. Yadav, N.; Yadav, A.; Kumar, M.; Yadav, N.; Yadav, A.; Kumar, M. History of neural networks. In An Introduction to Neural Network Methods for Differential Equations; Springer: Dordrecht, The Netherlands, 2015; pp. 13–15. [Google Scholar]
  55. Werbos, P.J. The Roots of Backpropagation: From Ordered Derivatives to Neural Networks and Political Forecasting; John Wiley & Sons: Hoboken, NJ, USA, 1994. [Google Scholar]
  56. Azadeh, A.; Ghaderi, S.F.; Sohrabkhani, S. Forecasting electrical consumption by integration of neural network, time series and ANOVA. Appl. Math. Comput. 2007, 186, 1753–1761. [Google Scholar] [CrossRef]
  57. Cruz, J.A.; Wishart, D.S. Applications of machine learning in cancer prediction and prognosis. Cancer Inform. 2006, 2, 117693510600200030. [Google Scholar] [CrossRef]
  58. Pascanu, R.; Mikolov, T.; Bengio, Y. On the difficulty of training recurrent neural networks. In Proceedings of the International Conference on Machine Learning, Atlanta, GA, USA, 16–21 June 2013; pp. 1310–1318. [Google Scholar]
  59. Kecman, V. Learning and Soft Computing: Support Vector Machines, Neural Networks, and Fuzzy Logic Models; MIT Press: Cambridge, MA, USA, 2001. [Google Scholar]
  60. Vapnik, V.; Chapelle, O. Bounds on error expectation for support vector machines. Neural Comput. 2000, 12, 2013–2036. [Google Scholar] [CrossRef] [Green Version]
  61. Boswell, D. Introduction to Support Vector Machines; Departement of Computer Science and Engineering, University of California: San Diego, CA, USA, 2002. [Google Scholar]
  62. Joshua, V.; Priyadharson, S.M.; Kannadasan, R. Exploration of machine learning approaches for paddy yield prediction in eastern part of Tamilnadu. Agronomy 2021, 11, 2068. [Google Scholar] [CrossRef]
Figure 1. Grain-size distribution curve of the test sand.
Applsci 13 04363 g001
Figure 2. Illustration of the employed dynamic simple shear test scheme.
Applsci 13 04363 g002
Figure 3. Particle shape parameters used in defining roundness [50,51].
Applsci 13 04363 g003
Figure 4. Particle shape characterization chart [50,51].
Applsci 13 04363 g004
Figure 5. Illustration of the selection process for the 25 sand particles for each sample (not to scale).
Applsci 13 04363 g005
Figure 6. Hysteresis loop in cyclic tests.
Applsci 13 04363 g006
Figure 7. Results of the cyclic tests for CSR = 0.3 and vertical stress = 150 kPa: (a) shear stress–strain hysteresis loops; and (b) volumetric strain by number of cycles.
Applsci 13 04363 g007
Figure 8. Effects of increasing number of loading cycles on the damping ratio for different CSR conditions and vertical stresses of (a) 50 kPa, (b) 150 kPa and (c) 250 kPa for the first reconstruction.
Applsci 13 04363 g008
Figure 9. Effects of increasing number of loading cycles on the damping ratio for different CSR conditions and vertical stresses of (a) 50 kPa, (b) 150 kPa and (c) 250 kPa for the second reconstruction.
Applsci 13 04363 g009
Figure 10. Effects of increasing number of loading cycles on the damping ratio for different CSR conditions and vertical stresses of (a) 50 kPa, (b) 150 kPa and (c) 250 kPa for the fifth reconstruction.
Applsci 13 04363 g010
Figure 11. (a) Three-dimensional image, (b) two-dimensional cross-sectional area and (c) calculation of the three shape parameters S, R and ρ for one particle before cyclic testing.
Applsci 13 04363 g011
Figure 12. (a) Three-dimensional image, (b) two-dimensional cross-sectional area and (c) calculation of the three shape parameters S, R and ρ for one particle after four cyclic tests.
Applsci 13 04363 g012
Figure 13. Variations of the three shape descriptors (a) before cycling, (b) after 30 cycles and (c) after 120 cycles. Note: S, R and ρ denote sphericity, roundness and regularity, respectively.
Applsci 13 04363 g013
Figure 14. Effects of number of loading cycles, along with (a) R, (b) S and (c) ρ, on the damping ratio.
Applsci 13 04363 g014
Figure 15. Effects of number of loading cycles, along with (a) vertical stress and (b) CSR, on the damping ratio.
Applsci 13 04363 g015
Figure 16. Performance of the best ANN model to predict the damping ratio for (a) training and (b) testing datasets.
Applsci 13 04363 g016
Figure 17. Correlation performance of the best SVM model to predict the damping ratio for (a) training and (b) testing datasets.
Applsci 13 04363 g017
Figure 18. Effects of cycling loading on (a) emin and (b) emax based on the roundness R parameter.
Applsci 13 04363 g018
Figure 19. Effects of cycling loading on (a) emin and (b) emax based on the sphericity S parameter.
Applsci 13 04363 g019
Figure 20. Effects of cycling loading on (a) emin and (b) emax based on the regularity ρ parameter.
Applsci 13 04363 g020
Figure 21. The importance of input parameters on the MAE of the best (a) ANN and (b) SVM model.
Applsci 13 04363 g021
Table 1. Shape descriptors and damping ratio before cycling.
VariableMinimumMaximumMeanSD
S (–)0.6900.7430.7130.014
R (–)0.4980.5340.5180.011
ρ (–)0.5940.6380.6160.011
D (%)8.50025.50016.0505.903
Table 2. Shape descriptors and damping ratio after 30 cyclic tests.
VariableMinimumMaximumMeanSD
S (–)0.7330.7930.7600.017
R (–)0.5290.5720.5570.014
ρ (–)0.6310.6830.6580.014
D (%)7.20021.40013.3924.784
Table 3. Shape descriptors and damping ratio after 120 cyclic tests.
VariableMinimumMaximumMeanSD
S (–)0.7410.8070.7740.020
R (–)0.5370.5920.5700.018
ρ (–)0.6400.6950.6720.018
D (%)6.90020.20012.4254.536
Table 4. Descriptive statistics for the training dataset.
VariableObservationsMinimumMaximumMeanSD
Damping Ratio, D (%)296.90025.50013.3555.370
Number of Cycles (–)290.000120.00056.89751.555
Sphericity, S (–)290.7020.8070.7530.028
Roundness, R (–)290.5020.5920.5520.025
Regularity, ρ (–)290.6120.6950.6530.025
Vertical Stress (kPa)2950.000250.000143.10384.223
CSR (%)290.2000.5000.3480.112
Table 5. Descriptive statistics for the testing dataset.
VariableObservationsMinimumMaximumMeanSD
Damping Ratio, D (%)711.00022.00016.4433.756
Number of Cycles (–)70.000120.00021.42944.881
Sphericity, S (–)70.6900.7880.7300.038
Roundness, R (–)70.4980.5750.5330.029
Regularity, ρ (–)70.5940.6820.6310.033
Vertical Stress (kPa)750.000250.000178.57175.593
CSR (%)70.2000.5000.3570.127
Table 6. Correlation matrix for the input and output variables.
VariableNumber of CyclesSRρVertical StressCSRD
Number of Cycles10.7050.7150.7270.0000.000−0.256
Sphericity, S0.7050.7050.7800.1930.227−0.044
Roundness, R0.7150.7050.7710.1930.206−0.040
Regularity, ρ0.7270.7800.7710.1980.223−0.043
Vertical Stress0.0000.1930.1930.1980.3240.798
CSR0.0000.2270.2060.2230.3240.277
Damping Ratio, D−0.256−0.044−0.040−0.0430.7980.277
Table 7. Overall performance of the best ANN model to predict the damping ratio for both training and testing datasets.
MetricTraining DatasetTesting Dataset
MAE (%)0.8870.551
MSE (%)1.0560.460
RMSE (%)1.0270.679
MSLE (%)0.0070.001
RMSLE (%)0.0840.037
R2 (–)0.9620.962
Table 8. Overall performance of the best SVM model to predict the damping ratio for both training and testing datasets.
MetricTraining DatasetTesting Dataset
MAE (%)0.7160.831
MSE (%)0.7611.302
RMSE (%)0.8721.141
MSLE (%)0.0060.003
RMSLE (%)0.0790.057
R2 (–)0.9730.892
Table 9. Ranking results of variable importance for the proposed ANN and SVM models.
ModelInput Parameters
Number of CyclesSRρVertical StressCSR
ANN352416
SVM453216
Total Score71056212
Ranking452316
Disclaimer/Publisher’s Note: The statements, opinions and data contained in all publications are solely those of the individual author(s) and contributor(s) and not of MDPI and/or the editor(s). MDPI and/or the editor(s) disclaim responsibility for any injury to people or property resulting from any ideas, methods, instructions or products referred to in the content.

