Article

Aerodynamic Drag Reduction Analysis of Race Walking Formations Based on CFD Numerical Simulations and Wind Tunnel Experiments

1
Department of Transportation Science and Engineering, Beihang University, Beijing 100191, China
2
Department of Competitive Sports, Beijing Sports University, Beijing 100084, China
*
Authors to whom correspondence should be addressed.
Appl. Sci. 2023, 13(19), 10604; https://doi.org/10.3390/app131910604
Submission received: 9 September 2023 / Revised: 16 September 2023 / Accepted: 18 September 2023 / Published: 23 September 2023
(This article belongs to the Section Applied Biosciences and Bioengineering)

Abstract

:
Drafting formations have been long recognized as highly effective for reducing drag and enhancing athletic performance, particularly in race walking events. The precise spacing and positioning of the race walkers are critical to optimizing the effectiveness of drafting. In this study, drag reduction in 15 drafting formations is investigated using wind tunnel experiments and CFD numerical simulations. The results show excellent consistency in drag reduction rate between the two methods, with differences being within 10%. This can be attributed to spacing replacing body shape differences as the primary factor influencing drag reduction. Optimal double, triple, and quadruple drafting formations produce the same results in both the wind tunnel experiments and CFD simulation, resulting in drag reductions of 67%, 66%, and 81% (wind tunnel) and 65%, 72%, and 85% (CFD). The sources of drag differences in the two methods are discussed from various aspects. The flow field obtained through CFD analysis is used to examine the mechanism of drag reduction, revealing that drafting formations have a significant shielding effect on incoming air, which reduces the number and speed of airflow impacting the core race walker. This shielding effect is identified as the primary cause of drag reduction. Using an empirical model for mechanical power output, optimal double, triple, and quadruple drafting formations enhance sports economy (4.4–5.7%), speed (3.61–4.67%), and performance (173.8–223.3 s) compared to race walking alone. The findings can serve as a reference for race walkers’ positioning strategies and provide insights for considering drafting formations in various running events.

1. Introduction

In most sports where athletes compete or are timed alongside others, athletes are required to exert their utmost effort to overcome the drag caused by the surrounding fluid (e.g., water or air). The magnitude of this drag frequently plays a critical role in competition results. Hence, utilizing the presence of other athletes to reduce drag has become a popular competitive strategy in racing events. For example, when athletes form a drafting formation, the wake created by the leading athletes not only significantly reduces the fluid velocity, but also generates a negative pressure coefficient that creates a suction effect. These factors contribute to the improved performance of the athletes following behind.
Drafting formation strategies are widely employed in various summer sports, such as cycling [1,2,3,4,5], swimming [6,7], and winter sports, such as short-track speed skating [8,9], speed skating [10,11], and cross-country skiing [12,13]. Rundell (1996) [8] conducted a study on drafting in short-track speed skating and reported positive effects on metabolic activity, heart rate, and lactate response. Terra (2023) [10] evaluated the aerodynamic benefits of drafting in speed skating by varying the lateral and longitudinal spacing between the lead and trailing athletes and found that up to 40% drag reduction could be achieved. van den Brandt (2021) [11] studied the effects of drafting in speed skating training and showed that at the same external intensity, the drafting benefit resulted in lower physical and perceived intensity compared to speed skating alone and would lead to mental relaxation in athletes. Ainegren (2022) [12] observed clear positive effects of drafting behind a skier during double poling. This resulted in reductions in propulsive force, drag area, oxygen cost, metabolic rate, and heart rate.
Similarly, drafting is a key strategy employed in most track and field events. In track and field competitions, the large number of participants leads to various arrangements during the race. Different configurations in terms of the number of participants and spacing can influence the aerodynamic drag experienced by individual athletes, sometimes even increasing drag, thereby affecting their performance in the competition. Hence, conducting research on the drag reduction effect and mechanism of drafting formations will provide valuable scientific guidance for athletes in selecting the most advantageous positions within the competition formation. For example, athletes can achieve this by either strategically creating optimal formations or avoiding unfavorable positions. This approach mitigates the adverse impact of aerodynamic drag, thereby enhancing race performance. In addition to the wind tunnel experiment, which often involves the use of scaled models with similar Reynolds numbers, computational fluid dynamics (CFDs) has emerged as a prevalent method for precisely evaluating drag distribution among athletes. Beaumont (2021, 2019) [14,15] used CFD simulation to study the effect of drafting in two formations. The results showed that the second in a line of five runners achieved the optimal drag reduction of 63.3%, whereas the third runner in a line of three runners had a drag reduction of only 33%. A reduction of 63.3% in drag was associated with a 4.4% increase in running economy and a 2.9% increase in running speed. Similarly, a 33% drag reduction led to a 6% decrease in oxygen consumption, a 1% reduction in heart rate, and a 33% decrease in energy consumption. Polidori (2020) calculated the drag and energy expenditure corresponding to three quadruple formations and found that maintaining a spacing of 1.3 m from the middle runner in the front resulted in a 57.3% reduction in drag and a 2.84% decrease in metabolic power [16]. However, the above studies were conducted to evaluate the impact of drag reduction on runners’ economy and physiological parameters. They specifically concentrated on drag reduction using CFD simulation without incorporating analyses of the flow field or the mechanism behind drag reduction. Schickhofer (2021) [17] employed CFD simulation to investigate the effects of various drafting formations (one double, two triple, and one quadruple) during a marathon race. They discovered that the most significant drag reduction of 75.6% and a performance improvement of 154 s were achieved when a runner positioned themselves between two runners, one in front and one behind. Furthermore, a basic analysis of the drag reduction mechanism suggested that the reduction in drag is a result of no sharp deceleration of air and the resulting formation of areas of high stagnation pressure on the core runner’s surface. However, the study lacked an explanation of the pressure reduction mechanism and did not quantify the pressure changes. Additionally, no conclusions have been reached regarding the impact of other athletes on pressure and the mechanism by which it influences the drag reduction effect when exploring additional formations. Moreover, there is currently limited research on drafting formations in race walking, and the existing research on drafting formations in track and field events primarily focuses on the simple formations mentioned above, neglecting more complex formations.
Furthermore, the majority of drag calculations for athletes in drafting formations are based on CFD simulations and lack verification through wind tunnel experiments. Due to the complex structure of the human body, the geometry and motion of the athletes need to be simplified during CFD numerical simulations compared to wind tunnel experiments. Consequently, there is often a significant disparity in drag obtained by these two methods. Blocken (2018) [18] was the first to perform numerical simulations of tandem interactions, considering various cyclist postures. The result showed that the greatest reduction in drag was observed for trailing riders when two riders maintained an upright position at the closest distance, resulting in a drag reduction of 27% compared to riding alone. This drag reduction trend was consistent with the results of the wind tunnel experiment by Zdravkovich (1996) and Kawamura (1993) [19,20], where the drag reduction benefit decreased linearly as the traction distance increased for all riders’ postures. However, the drag variation was large, especially when the spacing was 1 m, and the difference in drag between the CFD simulation and wind tunnel experiment reached 21%. The drag results from different wind tunnel experiments on complex human structures sometimes differ as well. Barry (2015) [21] performed a full-scale wind tunnel experiment under controlled conditions and observed a significant 40% reduction in drag at a distance of 0.7 m, showing a large difference of about two times the results of Zdravkovich’s [19] wind tunnel experiment. Whether this difference is attributable to differences in posture or experimental artifacts (e.g., high blockage rates) remains unclear.
Therefore, it is crucial to verify the results of the wind tunnel experiment through CFD numerical simulations. The accuracy of the findings can be ensured by validating the agreement between the aerodynamic drag obtained from both methods. Furthermore, if any discrepancies exist between the drag of the two methods, further investigations should be conducted to explore alternative explanations for the inconsistencies.
This study aims to achieve the following objectives: firstly, to investigate the drag reduction in drafting formations involving two, three, and four race walkers using both wind tunnel experiments and CFD simulations. The comparison of the drag coefficients obtained from both methods will be analyzed to identify the contributing factors leading to the differences between them. Additionally, the drag reduction rates of the two methods will be assessed to verify their consistency. Secondly, the CFD analysis will provide a detailed study of the flow field of different formations based on the differences between their streamlines and pressure to elucidate the mechanism behind the optimal drafting formation with various numbers of race walkers. Lastly, using the 20 km race walking event as an example, the benefits of drafting formations with different numbers of race walkers will be evaluated based on sports economy, speed, and overall performance.

2. Methods for Drag Reduction in Drafting Formations in Race Walking

2.1. Wind Tunnel Experiment

The wind tunnel experiments to test race walking drafting formations were conducted at the National Ice and Snow Sports Training and Research Base in Beijing, China. The wind tunnel employed in this study was an open-circuit, low-velocity wind tunnel with a resident room. Situated inside the resident room, the test section had dimensions of 8 m in length and a rectangular cross-section measuring 2.5 m by 3.0 m. The test wind speed ranged from 0 to 42 m/s and could be smoothly adjusted in a continuous manner.
The turbulence level of the airflow was maintained below 0.75%, and the deflection angle of the airflow was kept below 0.75°. Specifically, the wind tunnel experiments focused on race walkers from the Chinese national team participating in various drafting formations involving two, three, and four race walkers. These formations were simulated in order to measure the aerodynamic drag under different drafting formations. In each formation, a core race walker was positioned statically on a boxed six-component balance in a standard stance posture during walking, while auxiliary race walkers were added according to the desired formation. With the PLC control system configured for the wind tunnel fan, the precision of the wind speed can be controlled to within 2% (when the wind speed is less than 10 m/s), and when the wind speed is more than 10 m/s, the precision of the wind speed can be controlled to be within 1%. The measurement accuracy of the force measurement system is 0.05%. The primary errors of the wind tunnel experiment consist of two factors: the test error of the wind tunnel itself and the error caused by personnel shaking during the test. According to the error transfer formula, the C d A test error of race walking alone is −3.9% to 4.2%. The latter error is mainly eliminated by selecting the average value of multiple tests in the wind tunnel experiment.
Figure 1 depicts the positions of seven double drafting formations and a race-walking scene. Specifically, Figure 1b represents the wind tunnel experiment conducted by Hu (2022) [22], corresponding to double formation 4 in Figure 1a. The core race walker is represented by a red point in Figure 1a, while the auxiliary race walkers are indicated by blue points. The longitudinal and lateral spacings between the race walkers in the drafting formations are determined based on the criterion of not interfering with the race walkers’ stride, with a minimum longitudinal spacing of 1.1 m and a minimum lateral spacing of 0.75 m. For more detailed information on the wind tunnel experiment, please refer to the literature by Hu (2022) [22].

2.2. Numerical Simulation Method Based on Computational Fluid Dynamics

2.2.1. Race Walker Geometry

This study employs static models of race walkers in typical drafting formations. A 3D scanner is used to acquire a model of the core race walker in a standard race walking pose. The 3D-scanned human body model exhibits high precision and captures intricate details such as clothing folds, ears, and noses. Nevertheless, these gaps pose challenges for subsequent mesh generation. During the pre-processing stage, Spaceclaim v19 offers the Shrinkwrap feature, which generates a patch-based enclosure, wraps the model, closes gaps, and smooths sharp areas, thereby improving the mesh quality. It is crucial for researchers to meticulously determine the ideal size of the gaps around the ears and nose. The study investigates the impact of gap sizes (3 mm, 5 mm, and 10 mm) on drag and observes that the drag error remained below 0.5%. Consequently, a gap size of 10 mm is selected in this paper to improve the grid quality and decrease the number of grids. Figure 2 presents the model of the core race walker and an example of drafting formations in CFD simulation. The model of the core race walker has a height of 1.76 m, an orthographic windward area of 0.46 m2, a mass of 61.2 kg, and a volume of 0.656 m3.
In wind tunnel experiments and CFD simulations, static human models are typically preferred over dynamic models. This preference arises from the complexity introduced by dynamic models and the associated challenges, such as accommodating the changing postures of athletes. Presently, there is a deficiency in well-established technologies for effectively addressing these challenges. Static models can partially meet our needs for studying the drafting effect of the human body model. Static human models partially fulfill our needs for studying the drafting effect of the human body model by allowing us to gather essential data on aerodynamic drag and drafting effects. This approach proves particularly suitable for comparing aerodynamic variations among athletes under different speeds and wind conditions. For instance, the majority of recent studies investigating the drafting effect of humans in motion employ static models, encompassing a range of sports including cycling, running, swimming, and cross-country skiing [1,2,3,4,5,6,7,8,9,10,11,12,13,14,15,16,17]. While static models cannot replicate all the intricacies and dynamics of real motion, they can still yield valuable insights and guidance through a thorough analysis of comprehensive experimental data and computational models. These research findings offer valuable assistance in sports equipment design, training optimization, and the formulation of competitive strategies.
In actual competitions, each athlete’s body shape and movement posture are different, and the situation is also very complicated. This poses challenges for wind tunnel experiments and CFD calculations to account for differences between multiple athletes. Current studies generally employ some simplifying methods and assumptions. For example, in wind tunnel experiments, multi-person experiments are usually performed. Although the body shape of each athlete is different, the movement posture remains the same. This makes it easier to compare differences in aerodynamic properties between athletes of different body shapes. These experiments are usually analyzed using averaged parameters and metrics to draw general conclusions about aerodynamic drag and other aerodynamic properties. Similarly, CFD simulations typically employ a single-scanned human body model. This occurs because considering variations in the body shape and posture of multiple athletes significantly escalates model complexity, simultaneously demanding greater computational resources and time. Consequently, to streamline models and computations, single-scan human body models are commonly employed to capture general aerodynamic effects and trends [16,17]. Despite the inherent limitations of these simplified methods and assumptions, they can still offer valuable guidance. As an illustration, we can derive some general principles regarding the impact of body shape and motion posture on aerodynamic drag, providing valuable insights, particularly for the drag reduction effect of drafting formations emphasized in this article.

2.2.2. Governing Equation

Computational fluid dynamics (CFDs) is utilized with the finite volume method to compute the flow field variables and resultant aerodynamic forces acting on the race walkers. The Navier–Stokes equations, governing momentum conservation, are discretized using the Reynolds-averaged (RANS) approach. The simulations are performed with the commercial CFD code Ansys Fluent v19 [23]. Under the assumption of an unsteady state, the governing equation for the mainstream region can be expressed as follows [24]:
(1) Continuity equation:
ρ t + x i ( ρ u i u j ) = 0 ,
(2) Momentum equation:
t ρ u i + x i ρ u i u j = p x i + τ i j x i + F i ,
where ρ is the air density, u i is the velocity of the air in each direction, p is the hydrostatic pressure, τ i j is the stress tensor in each direction, F i is the external forces in each direction.
(3) Energy equation:
t ρ E + x i u i ρ E + p = x i k e f f T x i j h j J j + u j τ i j e f f + S h ,
where k e f f is the effective conduction coefficient, h is the enthalpy, J is the diffusive flow, S h is the heat source term.
The turbulence model plays a crucial role in aerodynamic drag calculations, particularly in capturing momentum transfer near surfaces and within boundary layers. This in turn influences the occurrence of flow separation, which is pivotal for precise drag predictions. The k ω SST turbulence model has undergone extensive validation in the field of external aerodynamics, exhibiting superior performance in flow situations involving adverse pressure gradients and free shear layers when compared to other models such as the Spalart–Allmaras and k ε models [25]. In this study, a recently developed generalized k ω turbulence model is utilized, delivering comparable accuracy to the k ω SST model while demanding fewer mesh requirements. Moreover, the discretization in this study employs a second-order scheme for the spatial derivatives. Pressure, velocity, and enthalpy are calculated using a coupled approach. Convergence is achieved in this study when the total residual value in all the above-mentioned equations falls below 10−6.

2.2.3. Computational Domains and Meshes

This paper’s main objective is to investigate the drag reduction mechanisms in drafting formations. Thus, ensuring that the computational domain aligns more closely with real-world conditions than the wind tunnel experiment becomes imperative. By adopting the core race walker’s length as the reference ( L ), the dimensions of the entire computational domain are defined as 35 L × 20 L × 10 L , as depicted in Figure 3. The left and right boundaries are positioned at a distance of 10 L from the central position of the core athlete, while the gap between the upper boundary and the core athlete measures 15 L .
To determine the boundary conditions for the athlete’s upper, lower, left, and right sides in the CFD simulation, the actual situation serves as a guideline, and either the Symmetry boundary or Wall boundary is chosen. Symmetry boundary reduces the impact of boundary effects by setting the normal velocity and tangential force in the motion equation to zero and applying zero heat flux in the energy equation to decrease the temperature gradient along the symmetry plane. Wall boundaries assigned to surfaces of a fluid region prevent flow through those surfaces. When opting for Wall boundaries, it is necessary to account for the force conditions acting on the wall and furnish details concerning slip conditions, wall velocity, slip model, friction coefficient, and other pertinent parameters. In the actual open race walking environment, there are no upper, left, or right boundaries. Therefore, opting for the Symmetry boundary is recommended to minimize its influence on the overall flow field calculation.
In real competitions, as athletes constantly move forward, there exists a relative speed difference with respect to the ground. Hence, it is advisable to adopt moving boundary conditions similar to those of a treadmill. For instance, Inoue (2016) [26] conducted an analysis of the impact of moving ground on running. His findings revealed that employing moving ground conditions can mitigate the development of an unrealistic ground boundary layer, making the simulation more realistic. Nevertheless, due to hardware and technical constraints in wind tunnel experiments, the cited experiments in this article did not employ moving wall conditions, potentially introducing some errors. Therefore, this study includes the moving ground boundary in CFD simulation research and adopts settings consistent with Schickhofer’s moving ground boundary conditions. Furthermore, this paper compares the disparities in calculating the drag coefficient of race walking alone on moving ground versus stationary ground. The results indicate that employing moving ground conditions yields a drag coefficient of 0.70, whereas the use of stationary ground conditions results in a drag coefficient of 0.68, representing a decrease of 2.8%.
The inlet velocity shown in Figure 3 is set to the typical race-walking velocity of 6 m/s, which is the combination of the race-walking velocity of 4 m/s in the absence of ambient wind and the headwind velocity of 2 m/s. The selected speed of 4 m/s is based on the core race walker’s average speed of 1:22:03 in the 20 km of the 2021 Tokyo Olympics [27]. The headwind velocity is selected based on the super wind speed of 2 m/s in track and field rules [28]. The turbulence intensity is set to 0.5%, consistent with the value used in the wind tunnel experiment. At the outlet, a pressure boundary condition is applied with an ambient static pressure of 1 atm. The ambient temperature was set to 303 K, while the body surface temperature was set to 303 K.
The 3D mesh was generated by a stable growth factor of 1.2 and an expansion layer thickness of 10 layers. The average mesh size near the surface is 5 × 10⁻⁴ m, while the average cell size at the outer boundary is 0.2 m. To ensure accurate results, all solid boundaries were directly inserted, resulting in a y+ value of approximately 1 at the surface of the human model. Furthermore, during grid refinement for different numbers of race walkers, the grid count increased by a factor of five while the drag coefficient remained constant, thereby confirming grid independence. The mesh size varies from 8.35 million cells for a single race walker to 22.39 million cells for four race walkers. Taking a single race walker grid independence as an example, its refinement stage is shown in Figure 4.

2.3. CFD Numerical Simulation Results and Verification

2.3.1. Results of Race Walking Alone

Owing to disparities in human models and boundary conditions used in CFD simulation versus those in wind tunnel experiments, discrepancies may arise in their calculated results for race walking alone. Consequently, it is imperative to offer a comparison of the corrected drag coefficient to account for error sources in the wind tunnel experiment and CFD simulation. In this study, the discrepancies between the CFD simulation and wind tunnel experiment primarily pertain to the following aspects: (1) Model discrepancy: certain intricate structural details may be lost during the 3D scanning process for CFD analysis, resulting in delayed air separation and diminished drag. Loose clothing, for instance, causes earlier air separation and increases drag, resulting in an approximate increase of 4.2% [29]. Similarly, hair length contributes to a drag increase ranging from 4% to 6% [30]. Longer hair moves with more friction and interference with the surrounding air, leading to an increase in air-flow instability and separation phenomena. In addition, longer hair alters the flow field around the head, making it easier for the airflow to separate from the head surface, which further increases drag. (2) Posture discrepancies: prolonged standing during wind tunnel experiments can cause posture alterations and subsequent shaking. (3) System errors in both wind tunnel experiments and CFD simulations, including a higher blockage rate for race walkers, control and measurement errors in parameters such as wind velocity and direction, as well as discretization, mesh-related, turbulence models, boundary conditions, and numerical errors in CFD simulations.
Error analysis has shown that wind tunnel experiments need to consider the impact of loose clothing and hair length on drag, which differs from CFD simulations. As a result, wind tunnel experiment drag is approximately 8.2% to 10% higher than that in CFD simulation. Additionally, the CFD simulation revealed that drag decreases by 2.8% when on moving ground compared to stationary ground. However, the wind tunnel experiment utilized a stationary ground, requiring an upward adjustment of the drag coefficient by 2.8%. Furthermore, it is essential to consider the systematic error in the wind tunnel experiment, which ranges from −3.9% to −4.2%. Accounting for these error factors, the wind tunnel experiment’s drag coefficient will be adjusted from 0.77 to a range of 0.69–0.75. To validate the accuracy of drag coefficient calculations in CFD simulations, we conducted a comprehensive comparison that encompassed CFD simulations, corrected wind tunnel experiment outcomes, and corrected drag coefficients from similar studies. Specifically, the model employed by Schickhofer [17] does not account for the influence of loose clothing and hair length on human body drag, and the boundary conditions precisely match those in this paper. Therefore, its drag coefficient [17] remains unaltered. However, Polidori [16], despite not accounting for loose clothing and hair length, utilized a stationary ground, necessitating an upward adjustment of its original drag coefficient of 0.81 by 2.8%. Other literature [31,32] did not adjust the drag coefficient due to unknown wind tunnel experiment equipment and the applied theoretical analysis method. The detailed correction Cd and rationales are presented in Table 1.
The CFD numerical simulation conditions employed in this paper closely resemble those in Schickhofer’s work. The sole difference lies in the positioning of the arms and legs in the human body model. However, the Cd values for the two are highly similar, with a deviation of only −2.8%. The drag coefficient computed in this article is 0.70, and it falls within the range of the adjusted wind tunnel experiment results, ranging from 0.69 to 0.75. Furthermore, it aligns with the wind tunnel experiment outcomes reported by Walpert and Kyle, ranging from 0.64 to 0.79, and correlates with the results derived by Pugh through theoretical calculations. These findings serve as additional confirmation of the accuracy of the CFD simulation results presented in this article.
Similarly, the calculation of individual drag is intricately tied to a multitude of factors, including athletic movements and the positions of the legs and hands. For instance, both Polidori and Schickhofer [17] employed the k ω SST model to investigate the aerodynamic drag reduction effect of static models in running postures. Despite their models sharing similar postures, their drag coefficients significantly differ, with values of 0.68 and 0.81, respectively, constituting a 19% difference. When considering the contrast in the bottom boundary conditions (Polidori [16] employs stationary ground, while Schickhofer [17] uses moving ground), the error expands to 22%. In comparison to Polidori’s [16] findings, this article exhibits a similarly high error rate of 18.5%. Presently, the precise causes underlying this error necessitate further investigation. A more accurate comparative error analysis can only be conducted when the calculation conditions are rigorously identical.

2.3.2. Race Walking in Drafting Formations

Given that the primary objective of this article is to investigate the drag reduction mechanism of drafting formations, demonstrating the consistency of drag reduction results in these formations takes precedence over verifying the accuracy of individual drag calculations. Therefore, this paper proposes a new parameter, drag reduction rate θ , to evaluate the drag reduction effect of the drafting formation. The drag reduction rate is defined as the rate of the difference in drag between the core race walker in drafting formations and race walking alone.
θ = F d 0 F d F d 0 × 100 % ,
where F d 0 is the aerodynamic drag when race walking alone, F d is the current aerodynamic drag. Figure 5 depicts the positions for five triple drafting formations and three quadruple drafting formations.
Figure 6 depicts Cd and the drag reduction rate of the core race walker for 15 drafting formations obtained from both the wind tunnel experiments and CFD simulations. The maximum absolute error in drag reduction rate for all drafting formations is 6%, with a corresponding maximum relative error of 9.2%, which falls below 10%. Importantly, the optimal drafting formations of different numbers of race walkers are consistent in the CFD simulations and wind tunnel experiments. Specifically, double formation 3, triple formation 4, and quadruple formation 3 exhibit the highest drag reduction rates among their respective numbers of race walkers. The drag reduction rates of these formations in the wind tunnel experiment are 67%, 66%, and 81%, respectively. In the CFD numerical simulation, the corresponding drag reduction rates are 65%, 72%, and 85%.
According to Figure 6, both the wind tunnel experiment and CFD simulation demonstrate that double drafting formations 1, 2, and 3 can significantly reduce the aerodynamic drag experienced by the core race walker who is following behind another one. Among the three formations, double drafting formation 3, where the two walkers are closest to each other, exhibits the highest effectiveness, achieving a drag reduction rate of 65% in the CFD simulation and 67% in the wind tunnel experiment. Conversely, the other double drafting formations have minimal effect on drag reduction. Therefore, it is recommended that the core race walker maintain a position as close as possible directly behind the front race walker to achieve the greatest reduction in drag when utilizing double drafting formation in race walking.
Regarding triple drafting formations, the most notable reduction in drag is observed in triple drafting formation 4, where an additional race walker is added behind the core race walker of the optimal double drafting formation. This drafting formation resulted in a drag reduction rate of 72% in the CFD simulation and a 66% reduction in the wind tunnel experiment. The second highest reduction is achieved by triple drafting formation 5, where an additional race walker is added in front of the front race walker of the optimal double drafting formation. This drafting formation results in a drag reduction rate of 62% in the CFD simulation and a 64% reduction in the wind tunnel experiment. The other triple formations have minimal or negative effects on drag reduction. Thus, in triple drafting formation, it is advisable for the core race walker to position themselves between two race walkers in front and behind him.
Among the quadruple drafting formations, the aerodynamic drag experienced by the core race walker is reduced, although to different extents. The quadruple drafting formation 3, which adds one race walker to the front left and right of the optimal double drafting formation, forming a V shape in front of the core race walker, demonstrates the most significant reduction in drag. This formation achieves the highest drag reduction rate, with a reduction of up to 85% in the CFD simulation and 81% in the wind tunnel experiment. If the two side race walkers in front move back to a side-by-side position (quadruple drafting formation 1), the drag reduction rate decreases to 71% in the CFD simulation and 65% in the wind tunnel experiment. If they move further back to an inverted V position (quadruple drafting formation 2), the drag reduction rate further deteriorates to 44% in the CFD simulation and the wind tunnel experiment. Thus, in quadruple drafting formations, it is ideal for the three auxiliary race walkers in front of the core race walker to form a V shape.
Figure 7 displays the fitting results of the drag reduction rate obtained from the wind tunnel experiment and CFD simulation, demonstrating a strong agreement between the two methods with a fitting error below 10%. This further illustrates the consistency of the drag reduction rate between the two methods and validates the accuracy of the CFD numerical simulation results.
The primary cause of the drag error in the drafting formation lies in the use of different race walker models in the wind tunnel experiment, whereas the CFD simulation employs the core race walker model. Consequently, significant disparities exist in their model postures. Interestingly, notwithstanding the substantial shape disparities between the models, the error in the drag reduction rate remains below 10%. This confirms that within a drafting formation, the primary influence on the drag reduction effect stems from the relative positions of athletes, with the variation in model posture having a lesser impact. To validate this conclusion, the following experiments were carried out:
(1) The front race walker model in the optimal double drafting formation was mirrored, and the results showed that the drag reduction rate of the core race walker was reduced from 65% to 62%, with an error of 4.6%;
(2) The drag reduction performance of optimal double and triple drafting formations, as observed in both Schickhofer’s [17] study and this article, was compared. Results showed that when Schickhofer [17] applied the optimal double drafting formation similar to the one used here, the core race walker achieved a 69% drag reduction rate, differing by 6% from the 65% reported in this article. Similarly, when Schickhofer [17] employed the optimal triple drafting formation akin to that used here, the core race walker also achieved a 76% drag reduction rate, with a 6% deviation from the 69% reported in this article.
In single-athlete drag calculations, drag is affected by various postural factors, resulting in significant variations in drag data from different sources. Conversely, when studying drafting formation, the primary factor driving the drag reduction effect is the relative positioning of athletes, with posture having minimal influence on the reduction effect. Consequently, future research will utilize these formation models for a thorough analysis of the formation’s drag reduction mechanism. This drag-reduction mechanism can also be universally applied to similar movements under different postures.

3. Drag Reduction Mechanism in Race Walking Drafting Formations

In race walking, aerodynamic drag is characterized by an augmented pressure difference between the front and rear of the race walker, caused by the impact of airflow ahead of the race walker. The pressure coefficient is defined as:
C p = P P 1 2 ρ U 2 ,
where the static pressure at infinity P = 101,325 Pa, the incoming velocity U = 6 m/s, P is the static pressure at the specific point, ρ is the air density.
The drag experienced by the core race walker is primarily determined by the pressure difference between the front and back.
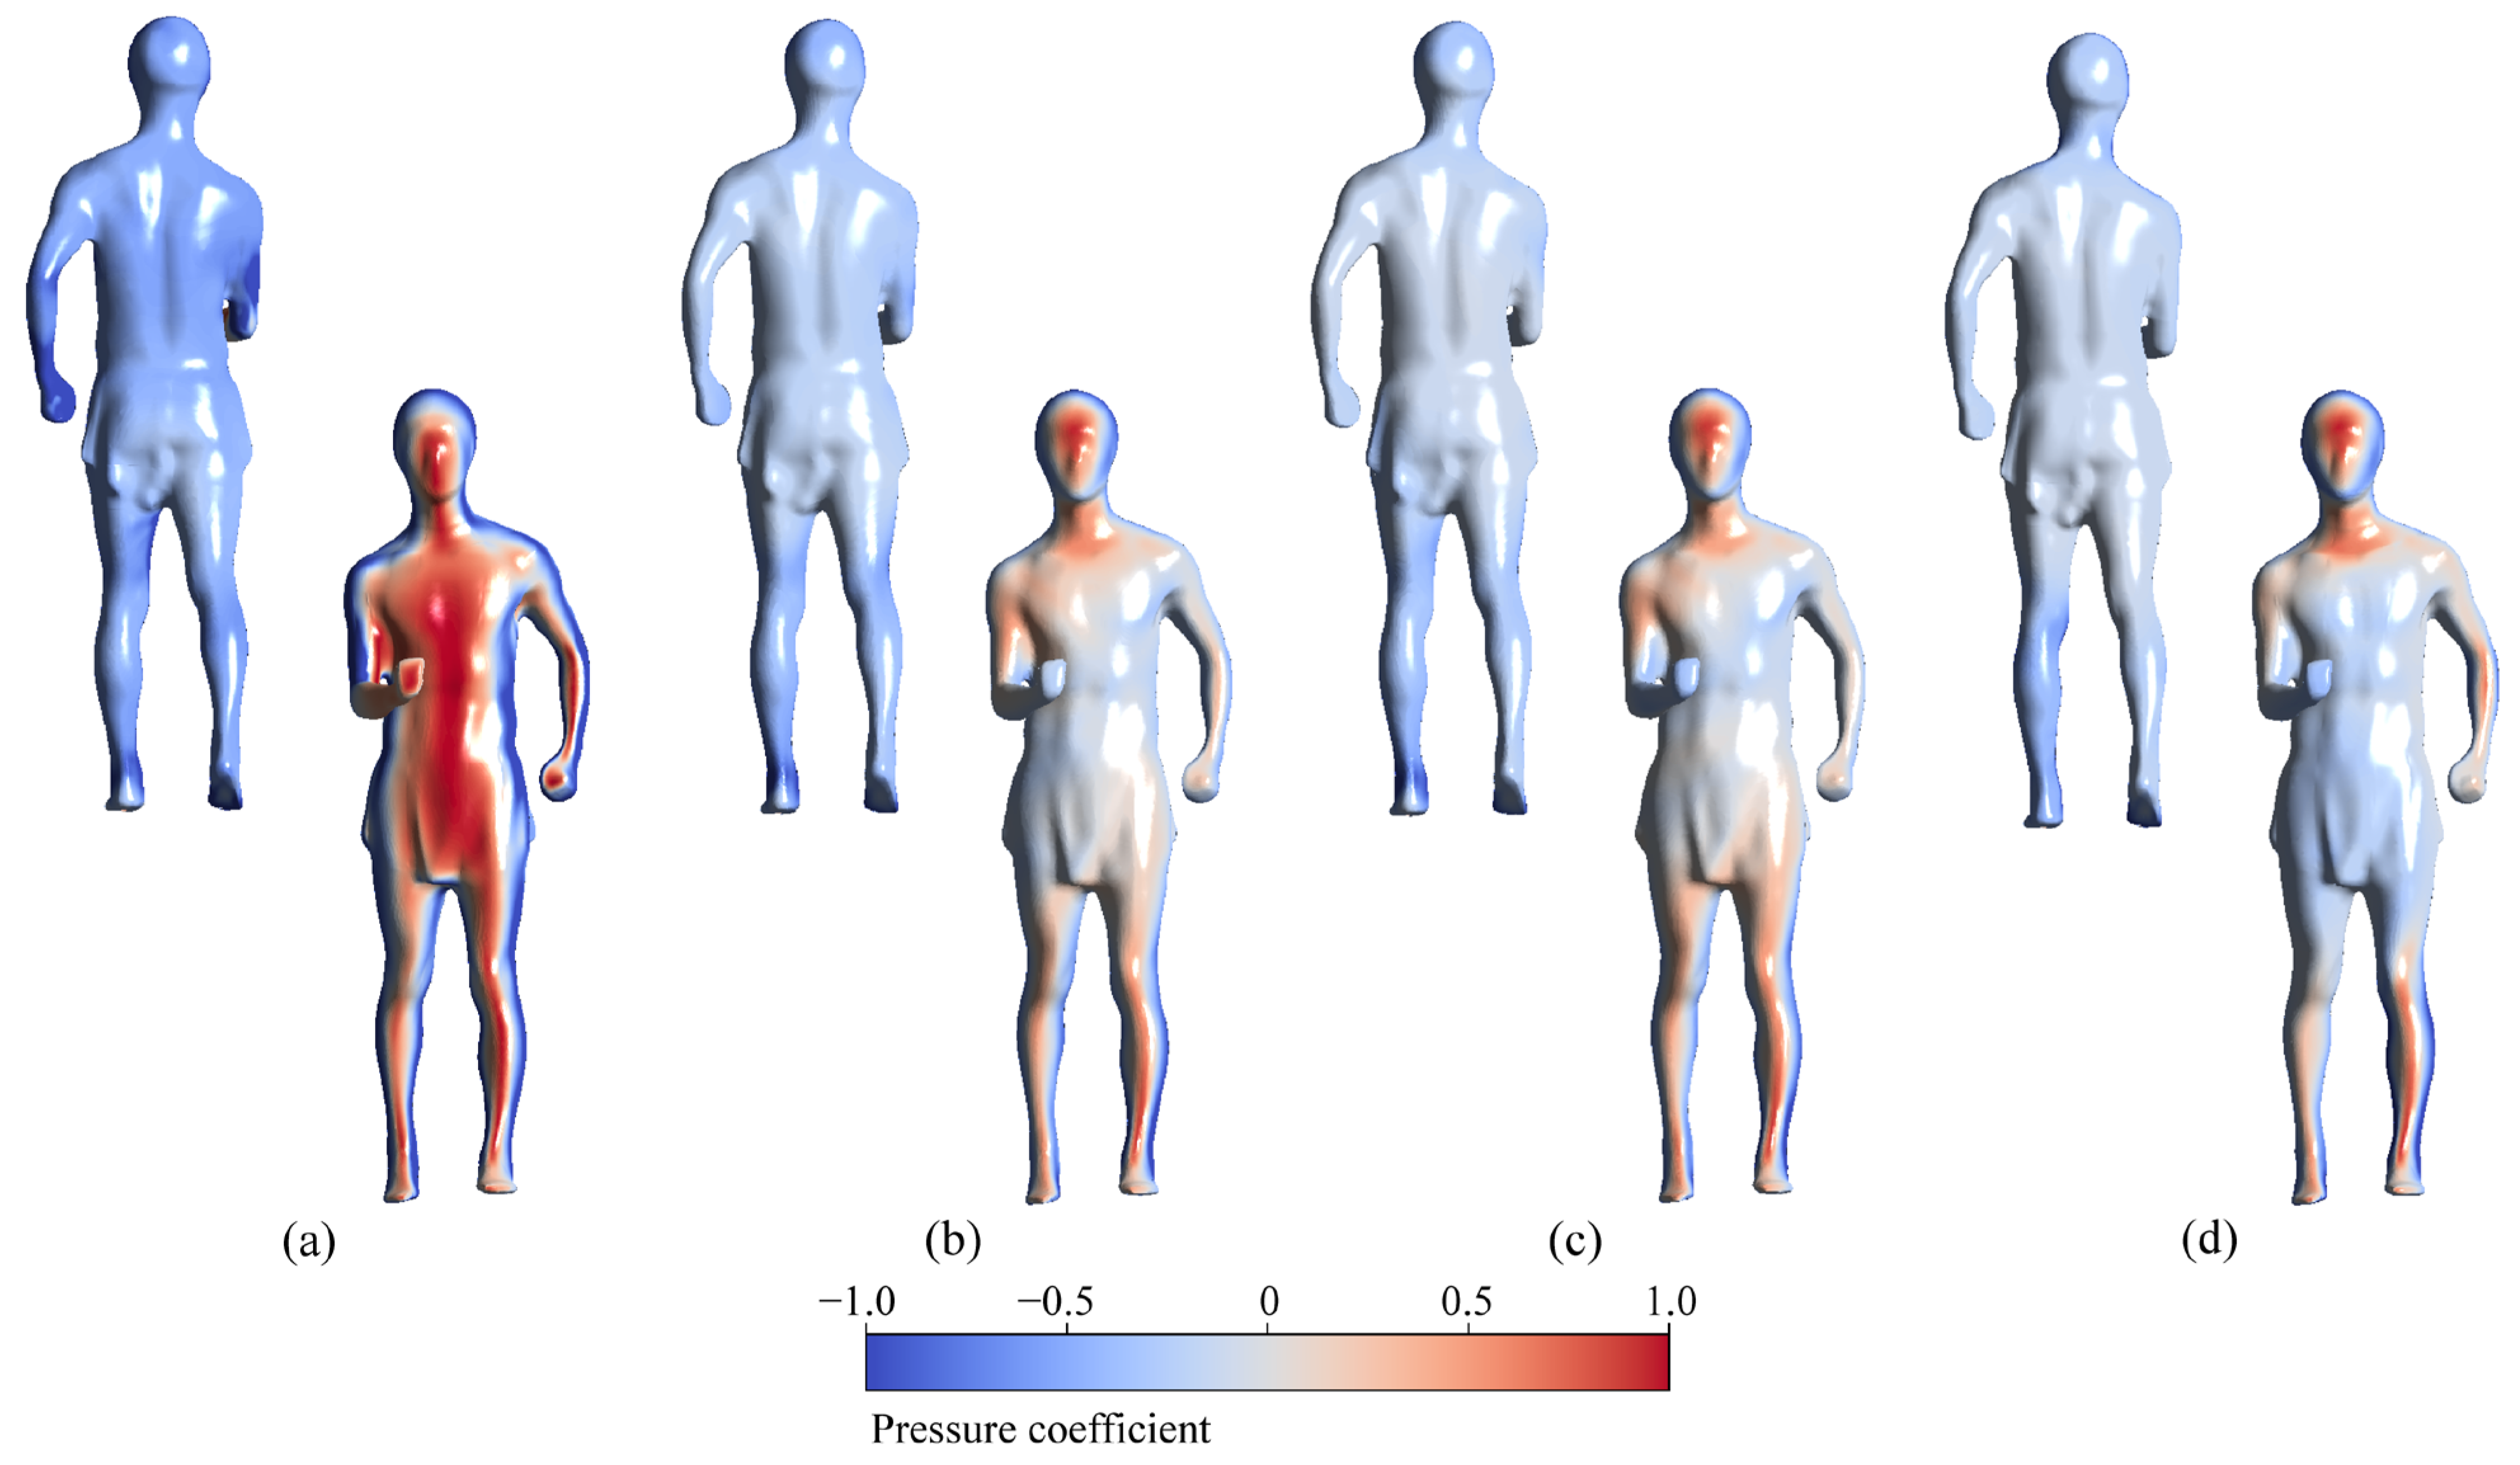
 Figure 8 and Figure 9 display the surface pressure of the core race walker and the ambient pressure experienced around the core race walkers in different optimal drafting formations. Figure 8 clearly shows that as the number of race walkers in optimal formations increases (from left to right), the pressure coefficient in front of the core race walker decreases gradually, while the pressure coefficient at the back increases gradually. This results in a smaller pressure difference between the front and rear, thereby achieving a better drag reduction effect. The drag reduction effects, as indicated by CFD simulation, are 0%, 65%, 72%, and 85% from left to right. Figure 9 also provides an intuitive view that, as the number of race walkers in optimal formations increases, the positive pressure area in front of the core athlete and the negative pressure area at the rear gradually decrease. Taking the chest pressure of the core race walker as an example, when race walking alone, the chest pressure is 0.95 and the back chest pressure is −0.55, resulting in a front-to-back pressure difference of 1.4. However, with an increase in the number of optimal formations, the front-to-back pressure difference gradually decreases to 0.75 in double drafting formation, 0.16 in triple drafting formation, and 0.06 in quadruple drafting formation, respectively.
In the optimal formation of double drafting, a race walker is added and positioned directly in front of the core race walker at the shortest distance, resulting in a reduction in aerodynamic drag of 65%. When compared to race walking alone, race walking in different formations demonstrates a more significant decrease in the pressure difference from front to back, as depicted in 
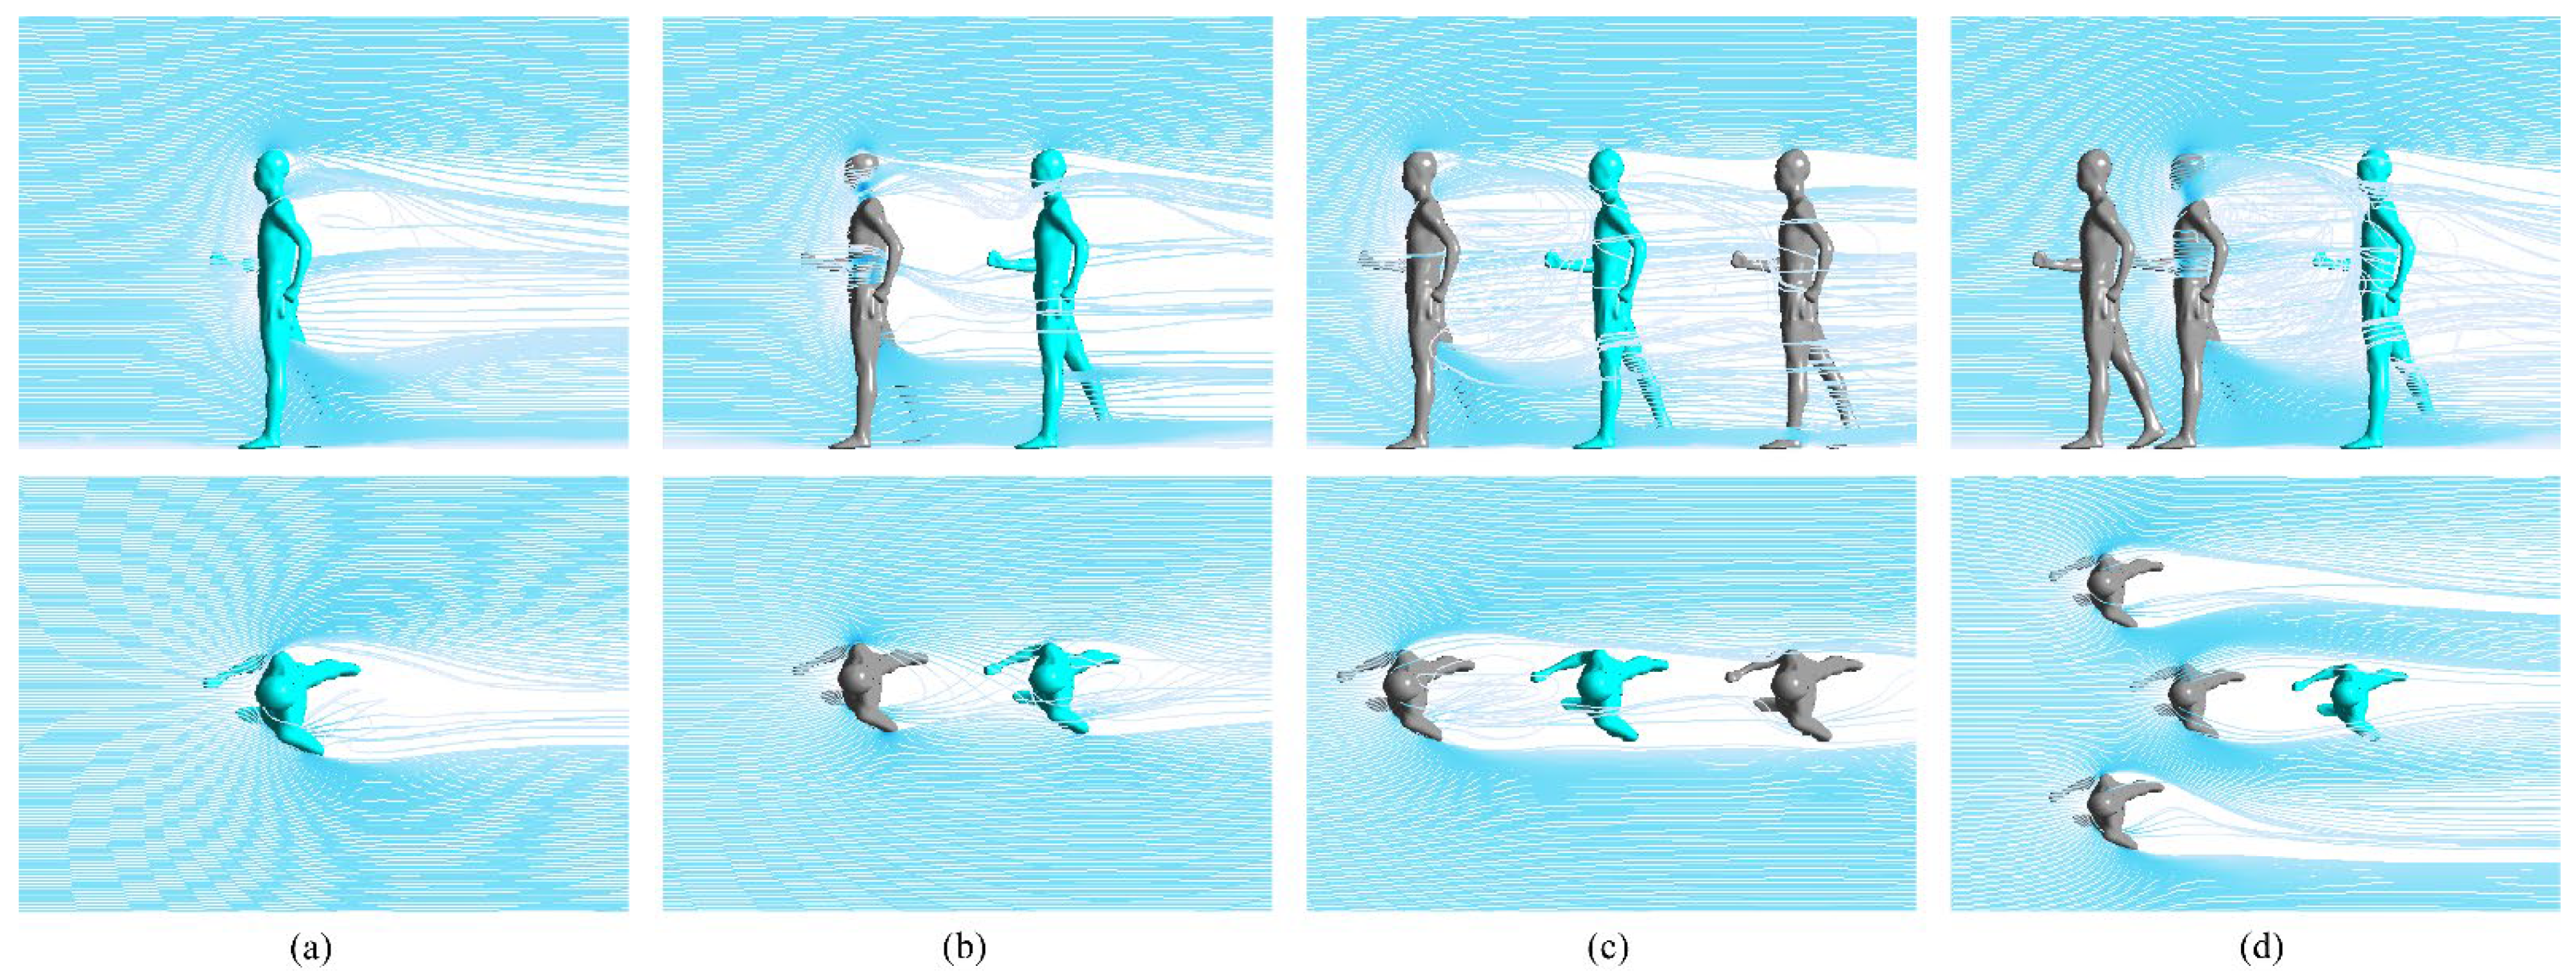
Figure 9b. Taking the coefficient of chest pressure as an example, the coefficient decreases by 0.36 in the front and increases by 0.14 in the rear in comparison to race walking alone. This results in a reduction in the pressure difference by 0.5. To better comprehend the changes in the pressure difference between the front and rear, an analysis was carried out on the velocity, streamline, and velocity vector around the core race walker, as illustrated in Figure 10b, Figure 11b and Figure 12b. These figures demonstrate the streamlines in the optimal double drafting formation, illustrating the shielding effect of the airflow by the front race walker. 
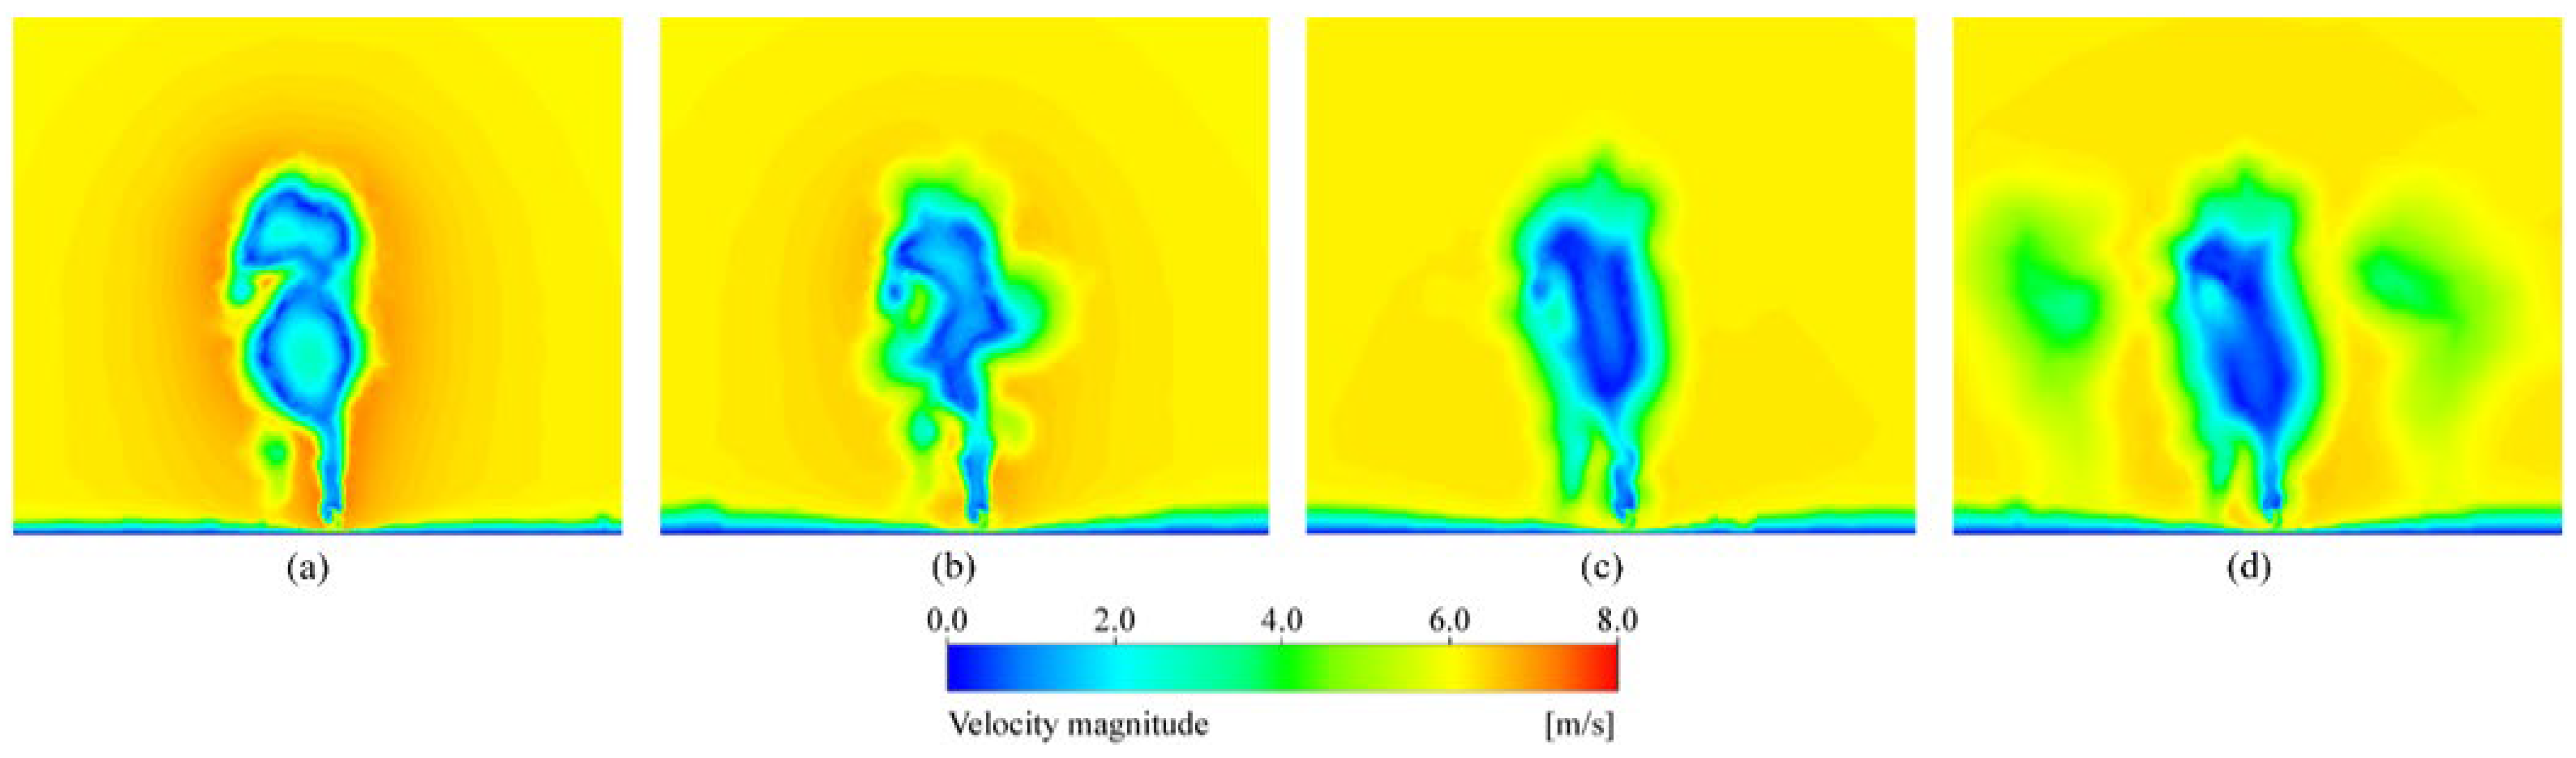
Figure 10b clearly indicates a noticeable decrease in velocity in front of the core race walker when compared to Figure 10a, resulting in reduced kinetic energy of the incoming flow. Consequently, the core race walker experiences less impact and lower pressure at the front. From Figure 11b and Figure 12b, it can be observed that only a small portion of the incoming airflow directly passes through the gap, impacting the core race walker, while the majority of the airflow is diverted towards the sides due to the obstruction created by the front race walker. The diverted airflow gradually converges towards the center as a result of the pressure difference between the diverted airflow and the inner airflow, impacting the core race walker. The extent of convergence of the diverted airflow primarily depends on the velocity of the air on both sides, wherein higher velocity leads to lower pressure and slower convergence. Consequently, the core race walker experiences reduced impact from the airflow, resulting in lower pressure on the front surface of the core walker. Furthermore, Figure 13b illustrates that the reduction in the number and velocity of incoming airflow directly leads to a decrease in the air velocity behind the core race walker. This reduction mitigates the formation of turbulence and vortex at the rear, thereby increasing the pressure in the rear regions.
Analyzing the flow field in the optimal double drafting formation reveals that achieving superior drag reduction necessitates minimizing the quantity and speed of incoming airflow affecting the core race walker. Firstly, minimizing airflow that directly affects the core race walker through gaps between front race walkers is crucial. Secondly, delaying the convergence of airflow on both sides is necessary to alleviate its impact.
The optimal triple drafting formation improves upon the optimal double drafting formation by introducing an additional race walker behind the core race walker. This augmentation further enhances the drag reduction effect, achieving a rate of 72%. Additionally, Figure 8c displays an additional decrease in frontal pressure and an elevation in rear pressure on the core race walker in comparison to Figure 8b, leading to a reduction in the disparity between front and rear pressures. Figure 9a–c depicts that the frontal chest pressure coefficient of the core race walker measures −0.01, while the rear chest pressure coefficient stands at −0.03. As a result, a pressure differential of 0.02 emerges, which is 0.6 units lower than race walking alone and 0.1 lower than race walking in double drafting formation. Additionally, Figure 10c presents a continued reduction in the velocity ahead of the core race walker. Moreover, Figure 11c and Figure 12c visually depict instances of backflow caused by the airflow colliding with the trailing race walker, leading to a delay in the inward convergence of the airflow. These factors contribute to a continued reduction in the impact of airflow on the core race walker. Meanwhile, the sustained decrease in the quantity and speed of airflow affecting the core walker leads to a decrease in the rear air velocity, as demonstrated in Figure 13c. This, in turn, further suppresses the development of rear turbulence and vortex, elevates the pressure coefficient at the rear, and reduces the pressure differential between the front and rear.
The optimal quadruple drafting formation is an extension of the optimal double drafting formation, involving the inclusion of race walkers at the left front and right front positions of the leading walker, creating a V-shaped formation. This augmentation substantially amplifies the drag reduction effect, yielding an impressive rate of 85% in drag reduction. A comparison between Figure 8c,d reveals that the optimal quadruple drafting formation showcases a more pronounced reduction in frontal pressure in comparison to the optimal triple drafting formation. Meanwhile, the rear pressure experiences relatively minor alterations. Figure 9d displays the most minimal pressure disparity between the frontal and rear chest areas across all drafting configurations, measuring at −0.02. Figure 10d illustrates that having race walkers on both sides ahead of the V-shaped formation leads to heightened airflow speed on both flanks of the leading race walker. This, in turn, leads to a decrease in the pressure variance between the airflow on the sides and the inner aspect, as evident in Figure 11d. This delay in the inward merging of the airflow additionally contributes to mitigating the influence of the core race walkers on the airflow, when contrasted with Figure 11c. Nonetheless, given that both the optimal triple and quadruple formations attain notable drag reduction, distinctions between Figure 12c,d and between Figure 13c,d are marginal and not discernible from visual inspection of the figures. For a more comprehensive understanding of airflow’s role in drag reduction, the velocity within Figure 12 and Figure 13 is subjected to quantitative analysis. The mean velocity vector magnitude in Figure 12c measures 3.29, contrasting with the mean velocity of 2.97 in Figure 12d, affirming reduced airflow influence in the optimal quadruple drafting configuration. In both Figure 13c,d, the average velocity stands at 4.08, suggesting a minimal divergence in diminishing the generation of rear turbulence and vortices. Hence, the disparity in the rear pressure coefficient between the optimal triple and quadruple drafting formations is minor.
Analyzing both race walking alone and three optimal drafting formations reveals that drag reduction is achieved through the shielding effect of the front race walker on the oncoming flow. This effect minimizes the impact of fluid on the core race walker, leading to a reduced pressure difference between the front and rear.

4. Metabolic Power Savings and Performance Predictions

To calculate the power consumed by the core race walker against the aerodynamic drag, the basic kinematic equations and an empirical mathematical model of mechanical power output are utilized. Cavagna (1977) conducted an experiment with race walkers on a force platform to establish an empirical model of mechanical power output [33]. This model considers the power generated by moving the center of mass, limb movement, and the work required to overcome aerodynamic drag, enabling the expression of mechanical power output.
P R = ( 9.42 + 4.73 v + 0.266 v 1.993 ) 4.1868 m 60 + P a e r o ,
where v is the speed, P R is the mechanical power output, P a e r o is the work required to overcome aerodynamic drag, m is the mass of the core race walker.
The formula for overcoming the work required by aerodynamic drag is
P a e r o = F a r e o · v ,
where F a r e a is aerodynamic drag.
The metabolic power P m e c h can be expressed as:
P m e c h = P R ϵ ,
where ϵ is the metabolic efficiency. Race walking, while similar in form to walking, requires athletes to sustain a fast pace for extended periods, demanding significant physical fitness. Metabolically, it shares more similarities with running than traditional walking. Cavagna’s experiments involved walking speeds ranging from 2.5 to 8 km/h, considerably slower than race walking’s pace at 4 m/s (equivalent to 14.4 km/h), aligning it more closely with running in terms of speed. Cavagna’s findings suggest that running speeds between 10 and 15 km per hour primarily rely on aerobic processes, consistent with the metabolic demands of race walking. Within this speed range, running efficiency typically ranges from 0.4 to 0.5. Therefore, this study adopts a metabolic efficiency ϵ value of 0.488, corresponding to a speed of 4 m/s [33].
The sports economy R E can be expressed as [34].
R E = P m e c h m ,
In accordance with the drag coefficient calculations presented in Section 2.3, the work required by aerodynamic drag P a e r o , the mechanical power P R , the mechanical power P m e c h , and sports economy R E of core race walker in different drafting formations are computed utilizing Equations (6)–(9), as depicted in Table 2. According to Table 2, the optimal double, triple, and quadruple drafting formations result in R E increases of 4.4%, 4.9%, and 5.7%, respectively, compared to race walking alone.
Kipp (2019) observed that in high-level racing events, speed increases with R E , as shown in Figure 14 [34]. When R E increased by 3% relative to the 2:04:00 time of the Berlin Marathon in 2015 (with the introduction of a more economical running shoe), the speed increased by 1.97%, resulting in a time of 2:01:36. This time is remarkably close to the recent world record set by Kipchoge, thus confirming the accuracy of Kipp’s model [34]. Figure 14 indicates that at a speed of 4 m/s, an increase in R E by 1% corresponds to a 0.82% increase in speed.
Table 3 presents the speed and performance of the core race walker in the optimal formations with different numbers of race walkers in the 20 km race walking competition after improving the sports economy. Based on the R E in Table 2, the core race walker’s speed is increased by 3.61%, 4.03%, and 4.67% in the optimal double, triple, and quadruple drafting formations, and the performance is improved by 173.8 s (3.48%), 193.5 s (3.87%), and 223.3 s (4.47%).

5. Limitations

5.1. Limitations of a Single Stationary Human Body Model

This study employs static models for both CFD simulations and wind tunnel experiments, opting for simplicity over complex dynamic models. This choice is made due to the limitations of current CFDs’ technology in handling the dynamic changes in athlete models effectively. Static models can furnish vital insights into aerodynamic drag and formation effects, fulfilling the requirements of research on drafting formation effects. Furthermore, static models are extensively employed in other research domains like cycling, running, swimming, and cross-country skiing to investigate drafting effects in human movement [1,2,3,4,5,6,7,8,9,10,11,12,13,14,15,16,17]. While static models cannot completely mimic the dynamic intricacies of actual motion, a thorough analysis of combined experimental data and computational models can yield valuable insights and guidance.
Moreover, in real competitions, athletes exhibit diverse body shapes and movements, resulting in a highly intricate scenario. To streamline research, current methodologies frequently rely on simplified models and assumptions. For instance, in wind tunnel experiments, multiple individuals are frequently tested in identical movement positions, regardless of their varying body shapes. This approach facilitates the comparison of aerodynamic properties among athletes with diverse body types. Similarly, CFD simulations often use a single human body model. This is due to the fact that accounting for variations in the body shape and posture of multiple athletes would substantially elevate model complexity, demanding greater computational resources and time. Despite the limitations of these simplified methods and assumptions, they continue to offer valuable guidance.
The study revealed that, despite variations in the postures of human models in CFD and wind tunnel experiments, the difference in drag reduction rates remained below 10%. Furthermore, a comparison with the drag reduction rate of the optimal double drafting formation after mirroring and similar formations in existing literature revealed that even with variations in model posture and body shape, the drag reduction rate error after mirroring was merely 4.6%. Moreover, the discrepancy in drag reduction rates between the optimal triple drafting formation, the optimal double drafting formation, and Schickhofer’s research results is also below 6%. These findings indicate that while a single static model possesses certain limitations, its influence on the drag reduction effect of drafting formations is minimal, rendering it suitable as a benchmark for analyzing the drag reduction effect and mechanism.

5.2. Limitations on Wind Speed

In real walking competitions, the human body’s aerodynamic drag is influenced by the constantly changing wind speed, direction, and varied walking routes. The chosen windward side’s constant wind speed of 2 m/s in this study may not precisely replicate actual competition conditions. Drag coefficient and drag reduction rate outcomes are predominantly determined by the Reynolds number and the human body shape. During race walking competitions, the wind speed varies relatively little (0–2 m/s), leading to minimal fluctuations in the Reynolds number. Furthermore, the human model used in the CFD simulation remained constant. Therefore, the selected speeds and normal wind speeds have a marginal impact on the drag coefficient and drag reduction rate results, with no effect on the analysis of the drafting drag reduction mechanism.
To confirm the limited effect of wind speed on drag coefficient and drag reduction rate, we conducted a comparison between two wind speed conditions: 0 m/s ( R e = 1.9 × 10 5 ) and 2 m/s ( R e = 2.8 × 10 5 ). The results demonstrate that at 0 m/s wind speed, the drag coefficient for an individual walking is 0.69, a mere 1% reduction compared to 0.70 at 2 m/s wind speed. Furthermore, at 0 m/s wind speed, the optimal double drafting formation achieves a drag reduction rate of 65.4%, representing a 0.6% improvement over the 65% rate observed at 2 m/s wind speed. It is evident that varying wind velocities have minimal influence on both drag coefficient and drag reduction rate, ensuring that the analysis of drag reduction effects and mechanisms remains unaffected.

6. Conclusions and Discussions

This study utilizes wind tunnel experiments and CFD numerical simulations to investigate the drag reduction impact of different drafting formations. The main conclusions can be drawn as follows:
Firstly, this paper introduces a method to evaluate drag reduction consistency in drafting formations with different numbers of race walkers by comparing wind tunnel experiments and CFD simulations using the drag reduction rate θ . The results show that both methods have drag reduction rate errors below 10%, which is better than the comparison of single-person drag calculations. This underscores that in drafting formations, athlete positioning is the key factor influencing drag reduction, with model posture differences having a minimal impact. This article supports this assertion by comparing the drag reduction rates before and after mirroring the postures of the front race walker in the optimal double formation, resulting in rates of 65% and 62%, respectively, with an error of 4.8%. Furthermore, the drag reduction rate discrepancies between this article and Schickhofer’s optimal double and triple formations are both below 6%, further validating this point. These research findings not only emphasize the importance of athletes’ relative positions in formation walking for drag reduction effects but also provide a reliable basis for using static models to study drag reduction effects in drafting formations.
Secondly, the drag reduction in 15 different drafting formations was evaluated using both CFD simulations and wind tunnel experiments. Our findings indicate that the optimal drafting formations are consistent with different numbers of race walkers in both CFD simulations and wind tunnel experiments. The core race walker experiences drag reductions of 67%, 66%, and 81% in double, triple, and quadruple formations in the wind tunnel experiment, and 65%, 72%, and 85% in the CFD simulations. The utilization of CFD analysis to investigate drafting formations in race walking revealed that drag reduction is achieved through the shielding effect of the race walkers on the oncoming flow. This effect minimizes the impact of fluid on the core race walker, resulting in a reduced pressure difference between the front and rear.
Finally, the effect of drag reduction on performance is analyzed by an empirical model for mechanical power output. Using a 20 km race walk as a case study, the benefits of different drafting formations with race walkers are evaluated in terms of sports economy, speed, and performance. The results indicate that, compared to race walking alone, the core race walker in the optimal double, triple, and quadruple drafting formations experienced improved sports economy of 4.4%, 4.9%, and 5.7%, increased speed by 3.61%, 4.03%, and 4.67%, and enhanced performances by 173.8 s (3.48%), 193.5 s (3.87%), and 223.3 s (4.47%).
It is worth mentioning that in the CFD simulation, the race walkers’ model remains static, and only one model is used in the formation with a fixed posture, which may differ from the situation in actual race walking. However, the main research purpose of this paper was to focus on the interaction between air and race walkers in the drafting formation and the drag reduction effect. The study found that the drag reduction rates of different race walkers in the formation, both in the wind tunnel experiment and the CFD simulation with a single model, are essentially the same. This result also confirms that the spacing between race walkers, rather than the differences in body posture, is the most critical factor affecting the drag reduction effect and the drag reduction mechanism of the drafting formation. Therefore, this study suggests that CFD simulations using specific postures can provide a foundation for understanding drag reduction effects and mechanisms in race walkers within various formations.
Furthermore, race walkers share similar body shapes and speeds (4–6 m/s) with marathoners and middle-distance runners, resulting in a Reynolds number range of 2–4 × 10⁵. Within this specific Reynolds number range, the aerodynamic drag law behaves similarly. Hence, the aerodynamic drag analysis of race walking drafting formations can be applicable to drafting formations in marathon and middle-distance running as well. This approach would lead to a more precise understanding of the drag reduction mechanism in drafting formations and facilitate the determination of an optimal positioning strategy.
However, in this study, the examination of the drag reduction in 15 typical drafting formations may not comprehensively consider the influence of race walkers’ spacing on drag reduction. To overcome this limitation, future research could employ CFD simulations to investigate drafting formations with different spacing. Additionally, while the formation does provide a certain level of aerodynamic drag reduction, it also has the effect of blocking the wind, leading to a decrease in convective heat exchange between the core race walker and the surrounding air. This reduced heat exchange may elevate the core race walker’s body temperature, impeding heat dissipation and, consequently, affecting their performance. Hence, it is advisable to consider further research on the heat dissipation effects of drafting formations in future studies.

Author Contributions

Formal analysis, Y.Z. and P.K.; Methodology, Y.Z. and P.K.; Writing—original draft, Y.Z.; Writing—review and editing, Y.Z., P.K. and P.H. All authors have read and agreed to the published version of the manuscript.

Funding

This research was funded by the Funding for National key research and development plan project, grant number 2021YFF0306401.

Institutional Review Board Statement

Not applicable.

Informed Consent Statement

Informed consent was obtained from all subjects involved in the study.

Data Availability Statement

Not applicable.

Acknowledgments

The authors would like to express their gratitude to Bo Li from Beijing Jiaotong University in China and Qi Hu from the Winter Sports Management Center of the State General Administration of Sports in China for their work and contributions in the field of wind tunnel experiments.

Conflicts of Interest

The authors declare no conflict of interest.

References

  1. Beaumont, F.; Bogard, F.; Murer, S.; Polidori, G. Fighting crosswinds in cycling: A matter of aerodynamics. J. Sci. Med. Sport. 2023, 26, 46–51. [Google Scholar] [CrossRef] [PubMed]
  2. Blocken, B.; Toparlar, Y.; van Druenen, T.; Andrianne, T. Aerodynamic drag in cycling team time trials. J. Wind Eng. Ind. Aerodyn. 2018, 182, 128–145. [Google Scholar] [CrossRef]
  3. Blocken, B.; Malizia, F.; Druenen, T.V.; Gillmeier, S. Aerodynamic benefits for a cyclist by drafting behind a motorcycle. J. Sci. Med. Sport. 2020, 23, 19. [Google Scholar] [CrossRef]
  4. Fitton, B.; Caddy, O.; Symons, D. The impact of relative athlete characteristics on the drag reductions caused by drafting when cycling in a velodrome. Proc. Inst. Mech. Eng. Part P J. Sports Eng. Technol. 2018, 232, 39–49. [Google Scholar] [CrossRef]
  5. Spoelstra, A.; Sciacchitano, A.; Scarano, F.; Mahalingesh, N. On-site drag analysis of drafting cyclists. J. Wind Eng. Ind. Aerodyn. 2021, 219, 104797. [Google Scholar] [CrossRef]
  6. Janssen, M.; Wilson, B.D.; Toussaint, H.M. Effects of Drafting on Hydrodynamic and Metabolic Responses in Front Crawl Swimming. Med. Sci. Sports Exerc. 2009, 41, 837–843. [Google Scholar] [CrossRef] [PubMed]
  7. Silva, A.J.; Rouboa, A.; Moreira, A.; Reis, V.M.; Alves, F.; Vilas-Boas, J.P.; Marinho, D.A. Analysis of drafting effects in swimming using computational fluid dynamics. J. Sports Sci. Med. 2008, 7, 60–66. [Google Scholar]
  8. Rundell, K.W. Effects of drafting during short-track speed skating. Med. Sci. Sports Exerc. 1996, 28, 765–771. [Google Scholar] [CrossRef] [PubMed]
  9. Hext, A.; Hettinga, F.J.; McInernery, C. Tactical positioning in short-track speed skating: The utility of race-specific athlete-opponent interactions. Eur. J. Sport Sci. 2022, 22, 77–84. [Google Scholar] [CrossRef] [PubMed]
  10. Terra, W.; Spoelstra, A.; Sciacchitano, A. Aerodynamic benefits of drafting in speed skating: Estimates from in-field skater’s wakes and wind tunnel measurements. J. Wind Eng. Ind. Aerodyn. 2023, 233, 105329. [Google Scholar] [CrossRef]
  11. van den Brandt, F.A.P.; Stoter, I.K.; Otter, R.T.A.; Elferink-Gemser, M.T. Why Train Together When Racing Is Performed Alone? Drafting in Long-Track Speed Skating. Int. J. Sports Physiol. Perform. 2021, 16, 1874–1879. [Google Scholar] [CrossRef] [PubMed]
  12. Ainegren, M.; Linnamo, V.; Lindinger, S. Effects of Aerodynamic Drag and Drafting on Propulsive Force and Oxygen Consumption in Double Poling Cross-Country Skiing. Med. Sci. Sports Exerc. 2022, 54, 1058–1065. [Google Scholar] [CrossRef] [PubMed]
  13. Brownlie, L. Aerodynamic drag reduction in winter sports: The quest for “free speed”. Proc. Inst. Mech. Eng. Part P J. Sports Eng. Technol. 2021, 235, 365–404. [Google Scholar] [CrossRef]
  14. Beaumont, F.; Legrand, F.; Bogard, F.; Murer, S.; Vernede, V.; Polidori, G. Aerodynamic interaction between in-line runners: New insights on the drafting strategy in running. Sports Biomech. 2021, 7, 1–16. [Google Scholar] [CrossRef] [PubMed]
  15. Beaumont, F.; Bogard, F.; Murer, S.; Polidori, G.; Madaci, F.; Taiar, R. How does aerodynamics influence physiological responses in middle-distance running drafting? Math. Modell. Eng. Probl. 2019, 6, 129–135. [Google Scholar] [CrossRef]
  16. Polidori, G.; Legrand, F.; Bogard, F.; Madaci, F.; Beaumont, F. Numerical investigation of the impact of Kenenisa Bekele’s cooperative drafting strategy on its running power during the 2019 Berlin marathon. J. Biomech. 2020, 107, 109854. [Google Scholar] [CrossRef]
  17. Schickhofer, L.; Hanson, H. Aerodynamic effects and performance improvements of running in drafting formations. J. Biomech. 2021, 122, 110457. [Google Scholar] [CrossRef]
  18. Blocken, B.; Defraeye, T.; Koninckx, E.; Carmeliet, J.; Hespel, P. CFD simulations of the aerodynamic drag of two drafting cyclists. Comput. Fluids 2018, 71, 435–445. [Google Scholar] [CrossRef]
  19. Zdravkovich, M.M. Effect of cyclist’s posture and vicinity of another cyclist on aerodynamic drag. Eng Sport. 1996, 1, 21–28. [Google Scholar]
  20. Kawamura, T.M. Wind Drag of Bicycles; Report No.1; Tokyo University: Tokyo, Japan, 1953. [Google Scholar]
  21. Barry, N.; Burton, D.; Sheridan, J.; Thompson, M.; Brown, N.A.T. Aerodynamic drag interactions between cyclists in a team pursuit. Sports Eng. 2015, 18, 93–103. [Google Scholar] [CrossRef]
  22. Hu, Q.; Li, B.; Ke, P.; Shen, M.; Hong, P. Aerodynamic Drag Reduction Effect of Drafting Formation in Race Walking Based on Wind Tunnel Tests. J. Shanghai Univ. Sport. 2022, 46, 62–71. [Google Scholar]
  23. Fluent, A. ANSYS Fluent Guide 2019; ANSYS Inc.: Canonsburg, PA, USA, 2019. [Google Scholar]
  24. Anderson, J.D. Computational Fluid Dynamics, 2nd ed.; McGraw-Hill: Newy York, NY, USA, 1995; pp. 15–51. [Google Scholar]
  25. Defraeye, T.; Blocken, B.; Koninckx, E.; Hespel, P.; Carmeliet, J. Computational fluid dynamics analysis of cyclist aerodynamics: Performance of different turbulence-modelling and boundary-layer modelling approaches. J. Biomech. 2010, 43, 2281–2287. [Google Scholar] [CrossRef]
  26. Inoue, T.; Okayama, T.; Teraoka, T.; Maeno, S.; Hirata, K. Wind-tunnel experiment on aerodynamic characteristics of a runner using a moving-belt system. Cogent Eng. 2016, 3, 1231389. [Google Scholar] [CrossRef]
  27. Kilometres Race Walk Men. Available online: https://worldathletics.org/results/olympic-games/2021/the-xxxii-olympic-games-athletics-7132391/men/20-kilometres-race-walk/final/result (accessed on 20 July 2023).
  28. Wind Assistance. Available online: https://en.wikipedia.org/wiki/Wind_assistance (accessed on 20 July 2023).
  29. Kyle, C.R.; Caiozzo, V.J. The effect of athletic clothing aerodynamics upon running speed. J. Med. Sci. Sports Exerc. 1986, 18, 509–515. [Google Scholar] [CrossRef]
  30. Nørstrud, H. The diverse manifestations of physical performance. In Sport Aerodynamics, 1st ed.; CISM: Udine, Italy, 2008; pp. 50–55. [Google Scholar]
  31. Walpert, R.A.; Kyle, C.R. Aerodynamics of the human body in sports. J. Biomech. 1989, 22, 1096. [Google Scholar] [CrossRef]
  32. Pugh, L.G.C.E. The influence of wind resistance in running and walking and the mechanical efficiency of work against horizontal or vertical forces. J. Physiol. 1971, 213, 255–276. [Google Scholar] [CrossRef] [PubMed]
  33. Cavagna, G.A.; Kaneko, M. Mechanical work and efficiency in level walking and running. J. Physiol. 1977, 268, 467–481. [Google Scholar] [CrossRef]
  34. Kipp, S.; Kram, R.; Hoogkamer, W. Extrapolating metabolic savings in running: Implications for performance predictions. Front. Physiol. 2019, 10, 79. [Google Scholar] [CrossRef]
Figure 1. Positions of seven different double drafting formations and a race walking scene. Red point indicates core race walker, blue points indicate auxiliary race walkers. (a) Positions of double drafting formation, (b) double drafting formation 4 experiment site [22].
Applsci 13 10604 g001
Figure 2. The model of (a) core race walker and (b) an example of double drafting formation. The core race walker is in blue.
Applsci 13 10604 g002
Figure 3. Computational domain and boundary conditions. The core race walker is in blue.
Applsci 13 10604 g003
Figure 4. Mesh convergence demonstrated by the final four refinement stages of single race walker. (a) Relationship between the number of cell sizes and the drag coefficient, (b) the mesh on and around the human body surface after mesh refinement.
Applsci 13 10604 g004
Figure 5. Race walking positions of triple and quadruple drafting formations. Red points indicate core race walker, blue points indicate auxiliary race walkers. (a) Triple formation, (b) quadruple formation.
Applsci 13 10604 g005
Figure 6. Comparison of Cd and drag reduction rate of the core race walker in 15 drafting formations between wind tunnel experiment and CFD simulation; (a) Cd of race walking in double drafting formation, (b) Cd of race walking in triple and quadruple drafting formation, (c) drag reduction rate of race walking in double drafting formation, (d) drag reduction rate of race walking in triple and quadruple drafting formation.
Applsci 13 10604 g006
Figure 7. Wind tunnel experiment and CFD simulation fitting result of drag reduction rate of core race walker while race walking in 15 drafting formations (error line, 10%).
Applsci 13 10604 g007
Figure 8. Pressure coefficient of the core race walker in optimal drafting formations: (a) race walking alone, (b) race walking in optimal double formation, (c) race walking in optimal triple formation, and (d) race walking in optimal quadruple formation.
Applsci 13 10604 g008
Figure 9. Pressure coefficient of race walking in optimal drafting formations: (a) race walking alone, (b) race walking in optimal double formation, (c) race walking in optimal triple formation, and (d) race walking in optimal quadruple formation.
Applsci 13 10604 g009
Figure 10. Speed contour of race walking in optimal drafting formations: (a) race walking alone, (b) race walking in optimal double formation, (c) race walking in optimal triple formation, and (d) race walking in optimal quadruple formation.
Applsci 13 10604 g010
Figure 11. Streamline of race walking in optimal drafting formations: (a) race walking alone, (b) race walking in optimal double formation, (c) race walking in optimal triple formation, and (d) race walking in optimal quadruple formation.
Applsci 13 10604 g011
Figure 12. Velocity vector diagram of 0.2 m in front of the core race walker: (a) race walking alone, (b) race walking in optimal double formation, (c) race walking in optimal triple formation, and (d) race walking in optimal quadruple formation.
Applsci 13 10604 g012
Figure 13. Speed contour of 0.1 m behind the core race walker of race walking in optimal drafting formations: (a) race walking alone, (b) race walking in optimal double formation, (c) race walking in optimal triple formation, and (d) race walking in optimal quadruple formation.
Applsci 13 10604 g013
Figure 14. Percentage increase in operating speed after the improvement in operating economy [34].
Applsci 13 10604 g014
Table 1. Comparison of drag coefficients in various track and field events.
AuthorActivitiesMethodSpeed (m/s)CdCorrected CdCorrection ReasonError
This studyRace walkingCFD60.700.70 Basis
Hu et al. [22]
(2022)
Race walkingWind tunnel60.770.69–0.75Moving ground + (2.8%)
System error + (−3.9%–4.2%)
Model discrepancy − (8.2%–10%)
−1.4–7.1%
Schickhofer et al. [17]
(2021)
RunningCFD5.830.680.68 −2.8%
Polidori et al. [16]
(2020)
RunningCFD5.750.810.83Move ground + (2.8%)18.5%
Walpert and Kyle [31]
(1989)
RunningWind tunnel4.5–130.64–0.790.64–0.79 −8.5–12.8%
Pugh [32]
(1971)
WalkingAnalytical5.490.700.70 0%
Table 2. Aerodynamic power P a e r o , mechanical power P R , metabolic power P m e c h , and sports economy R E of core race walker in optimal drafting formations.
Drafting Formations F a r e a ( N ) P a e r o ( W ) P a e r o P R ( W ) P R P m e c h ( W ) R E ( W / k g ) R E
Race walking alone7.545 675.3 1383.822.61
Double formation2.615.665%645.94.4%1323.621.624.4%
Triple formation2.112.672%642.95.1%1317.421.534.8%
Quadruple formation1.16.685%636.95.7%1305.121.335.7%
Table 3. The speed and performance of core race walker in optimal drafting formations in the 20 km race walking competition after improving sports economy.
Optimal Drafting FormationsSpeed after Improving Sports Economy (m/s)Percentage Increase in SpeedCompetition Time (s)Time Difference (s)Percentage Improvement in Performance
Race walking alone4 5000
Double formation4.1443.61%4826.2173.83.48%
Triple formation4.1614.03%4806.5193.53.87%
Quadruple formation4.1874.67%4776.7223.34.47%
Disclaimer/Publisher’s Note: The statements, opinions and data contained in all publications are solely those of the individual author(s) and contributor(s) and not of MDPI and/or the editor(s). MDPI and/or the editor(s) disclaim responsibility for any injury to people or property resulting from any ideas, methods, instructions or products referred to in the content.

