
Geophysical and Geochemical Exploration of the Pockmark Field in the Gulf of Patras: New Insights on Formation, Growth and Activity

 , , , ,
  , ,
, ,  , and
, and
Abstract
:1. Introduction
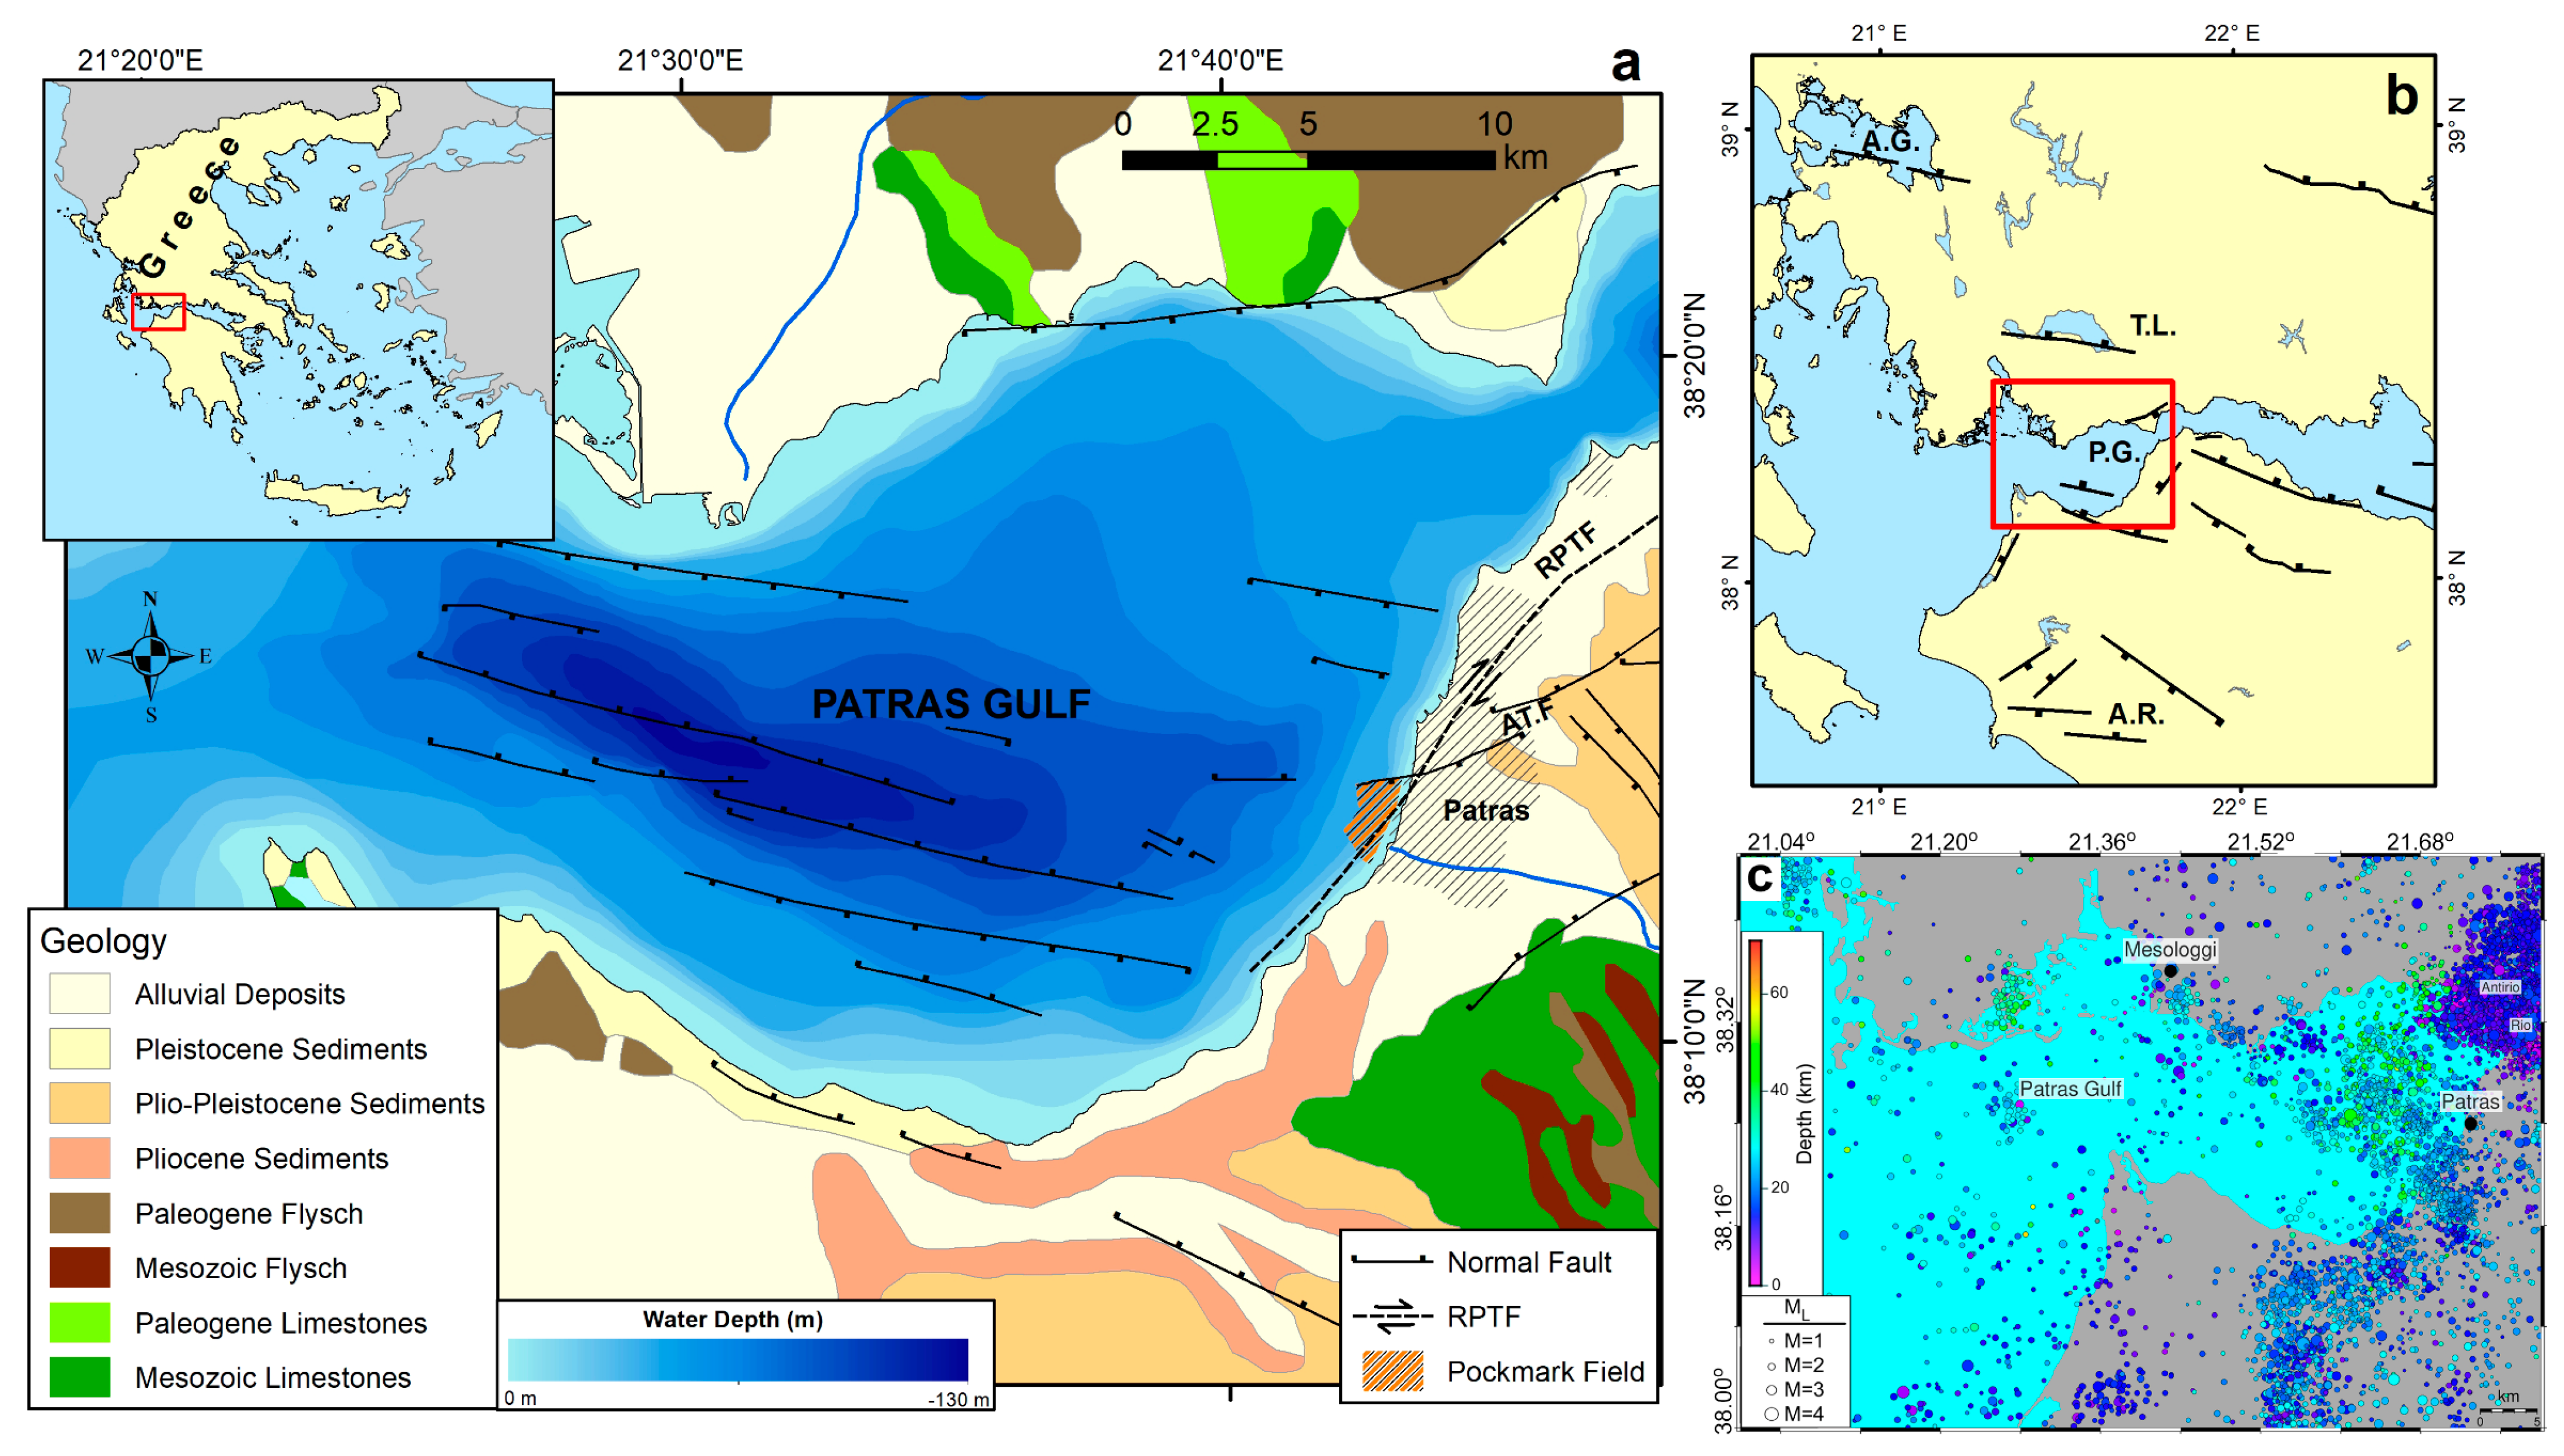
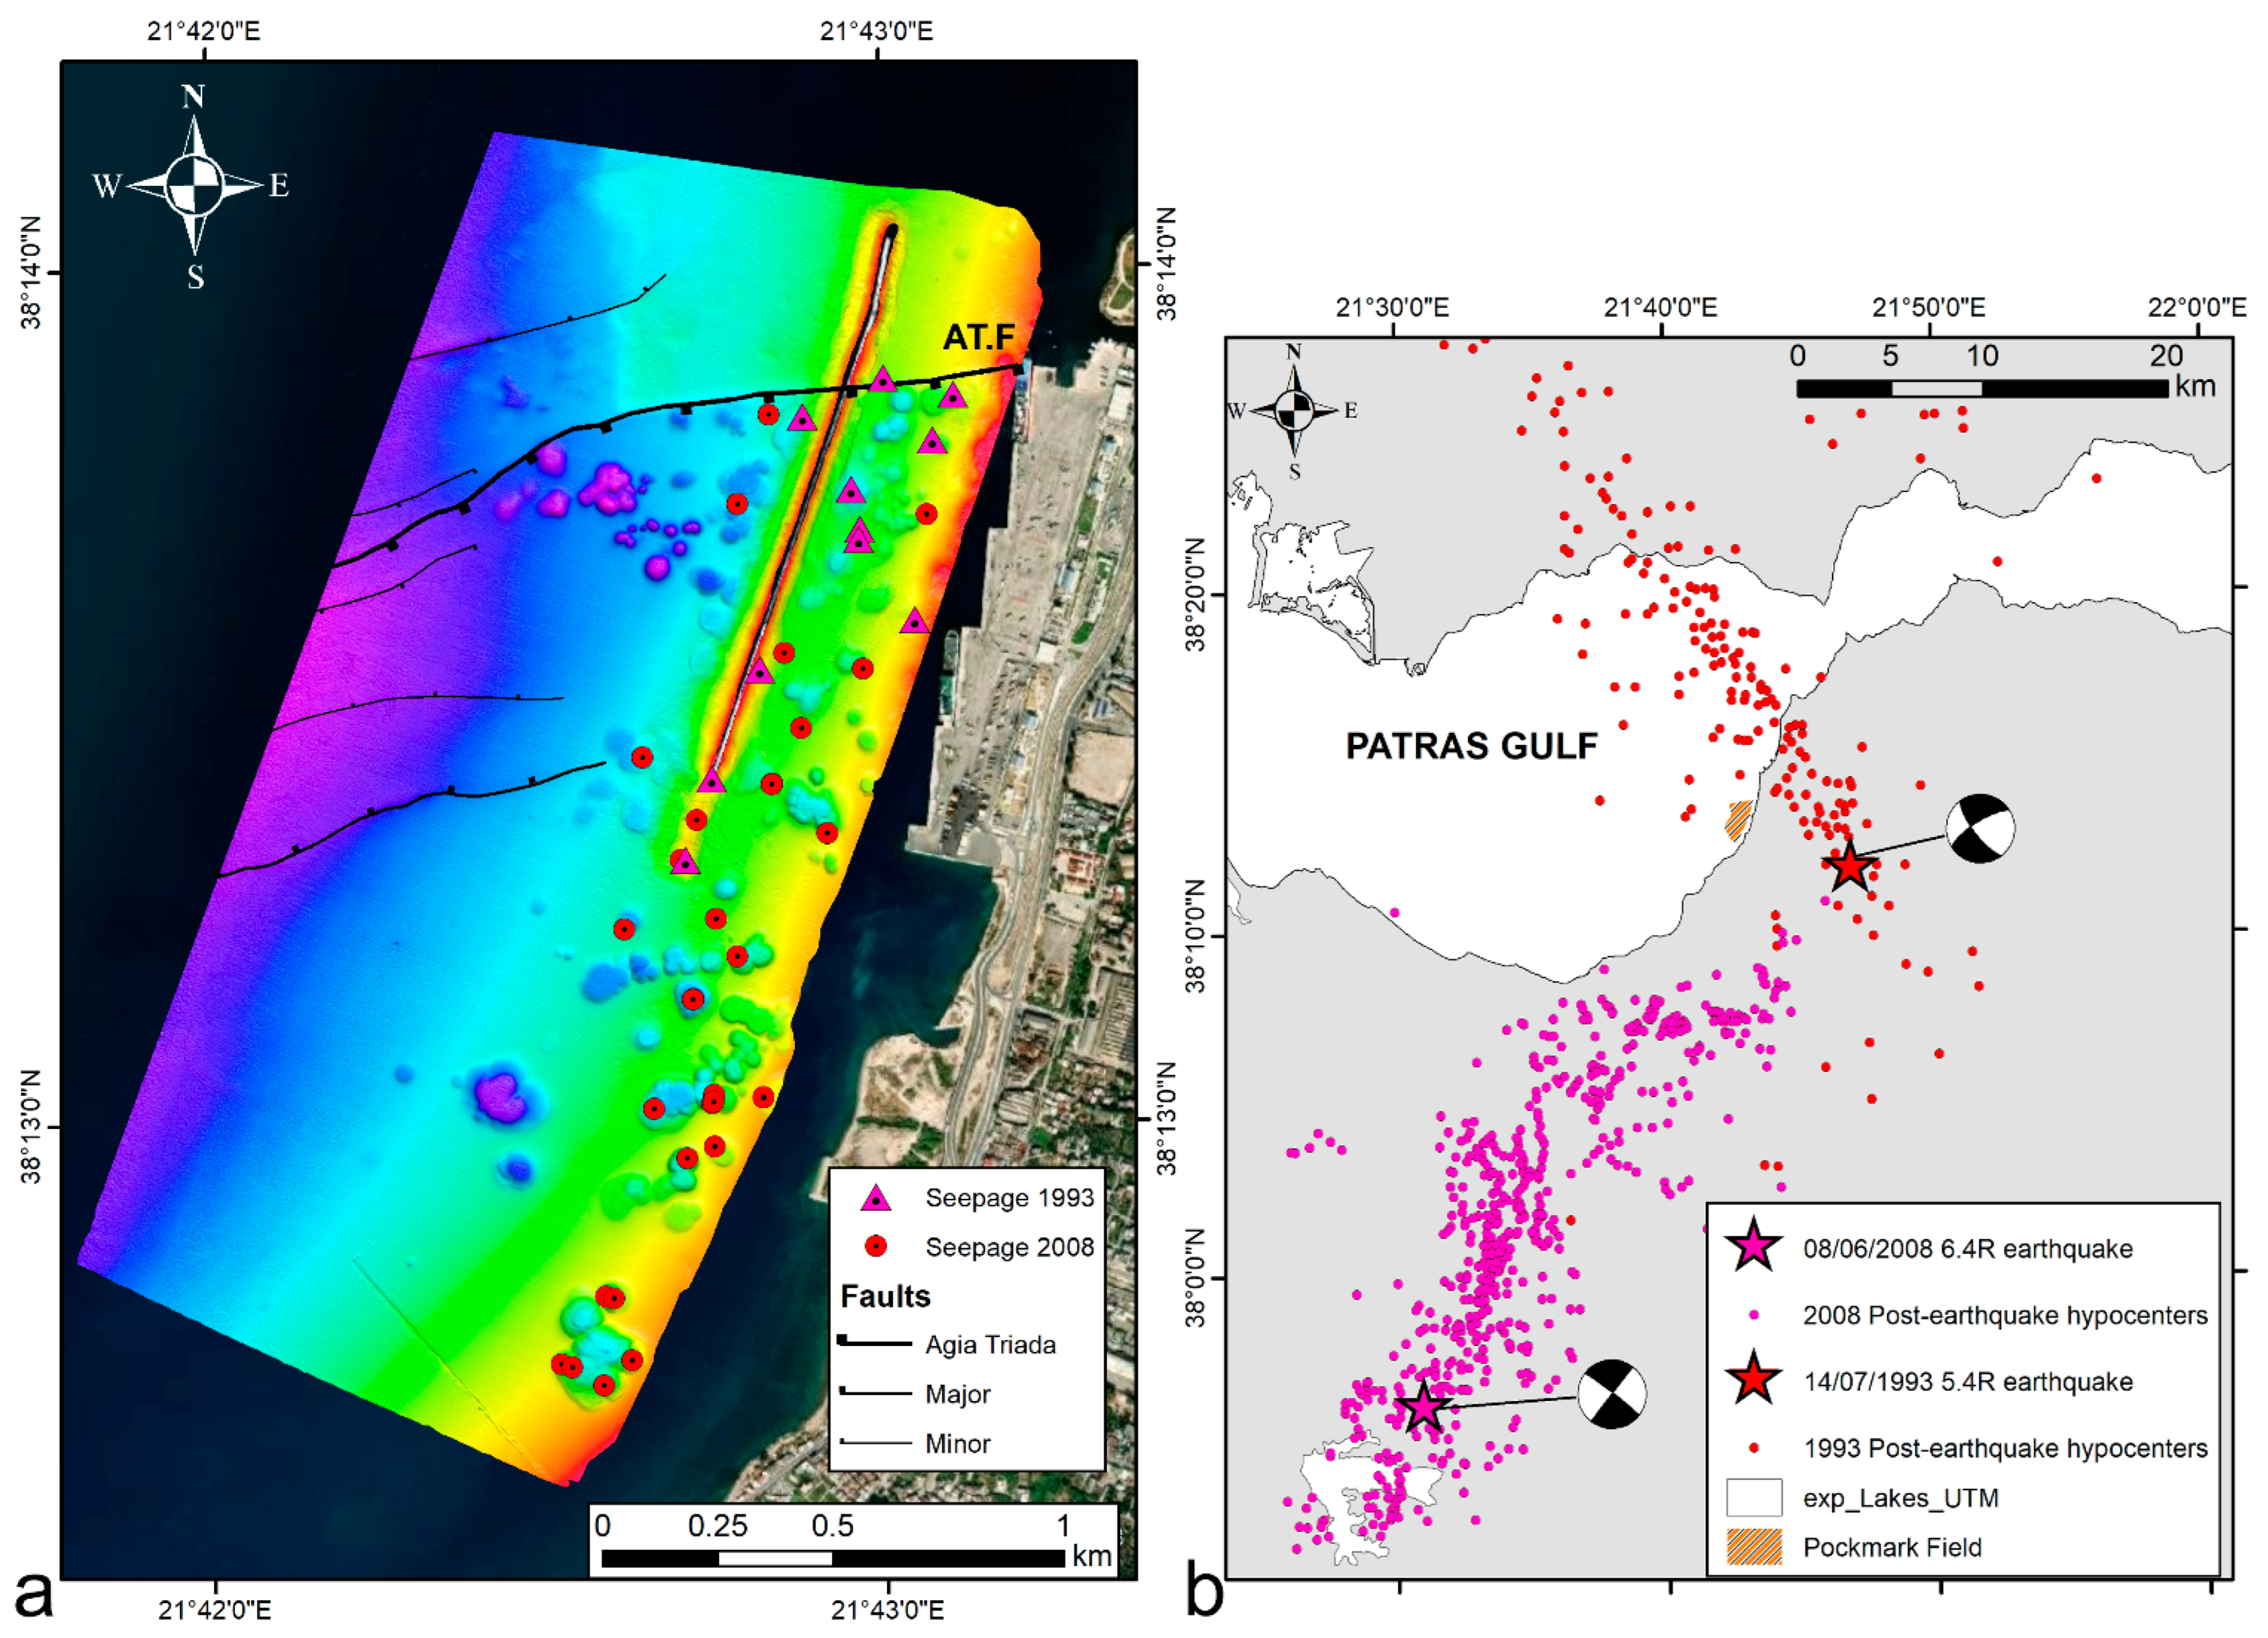
1.1. Regional Setting
1.2. Previous Studies—Pockmark Field Activity
1.2.1. Activation Due to the 5.4 R Earthquake of 14 July 1993
1.2.2. In-Situ CH4 Measurements
1.2.3. Gas Monitoring Module (GMM)
1.2.4. Activation by the 6.4 R Earthquake of 8 June 2008
2. Materials and Methods
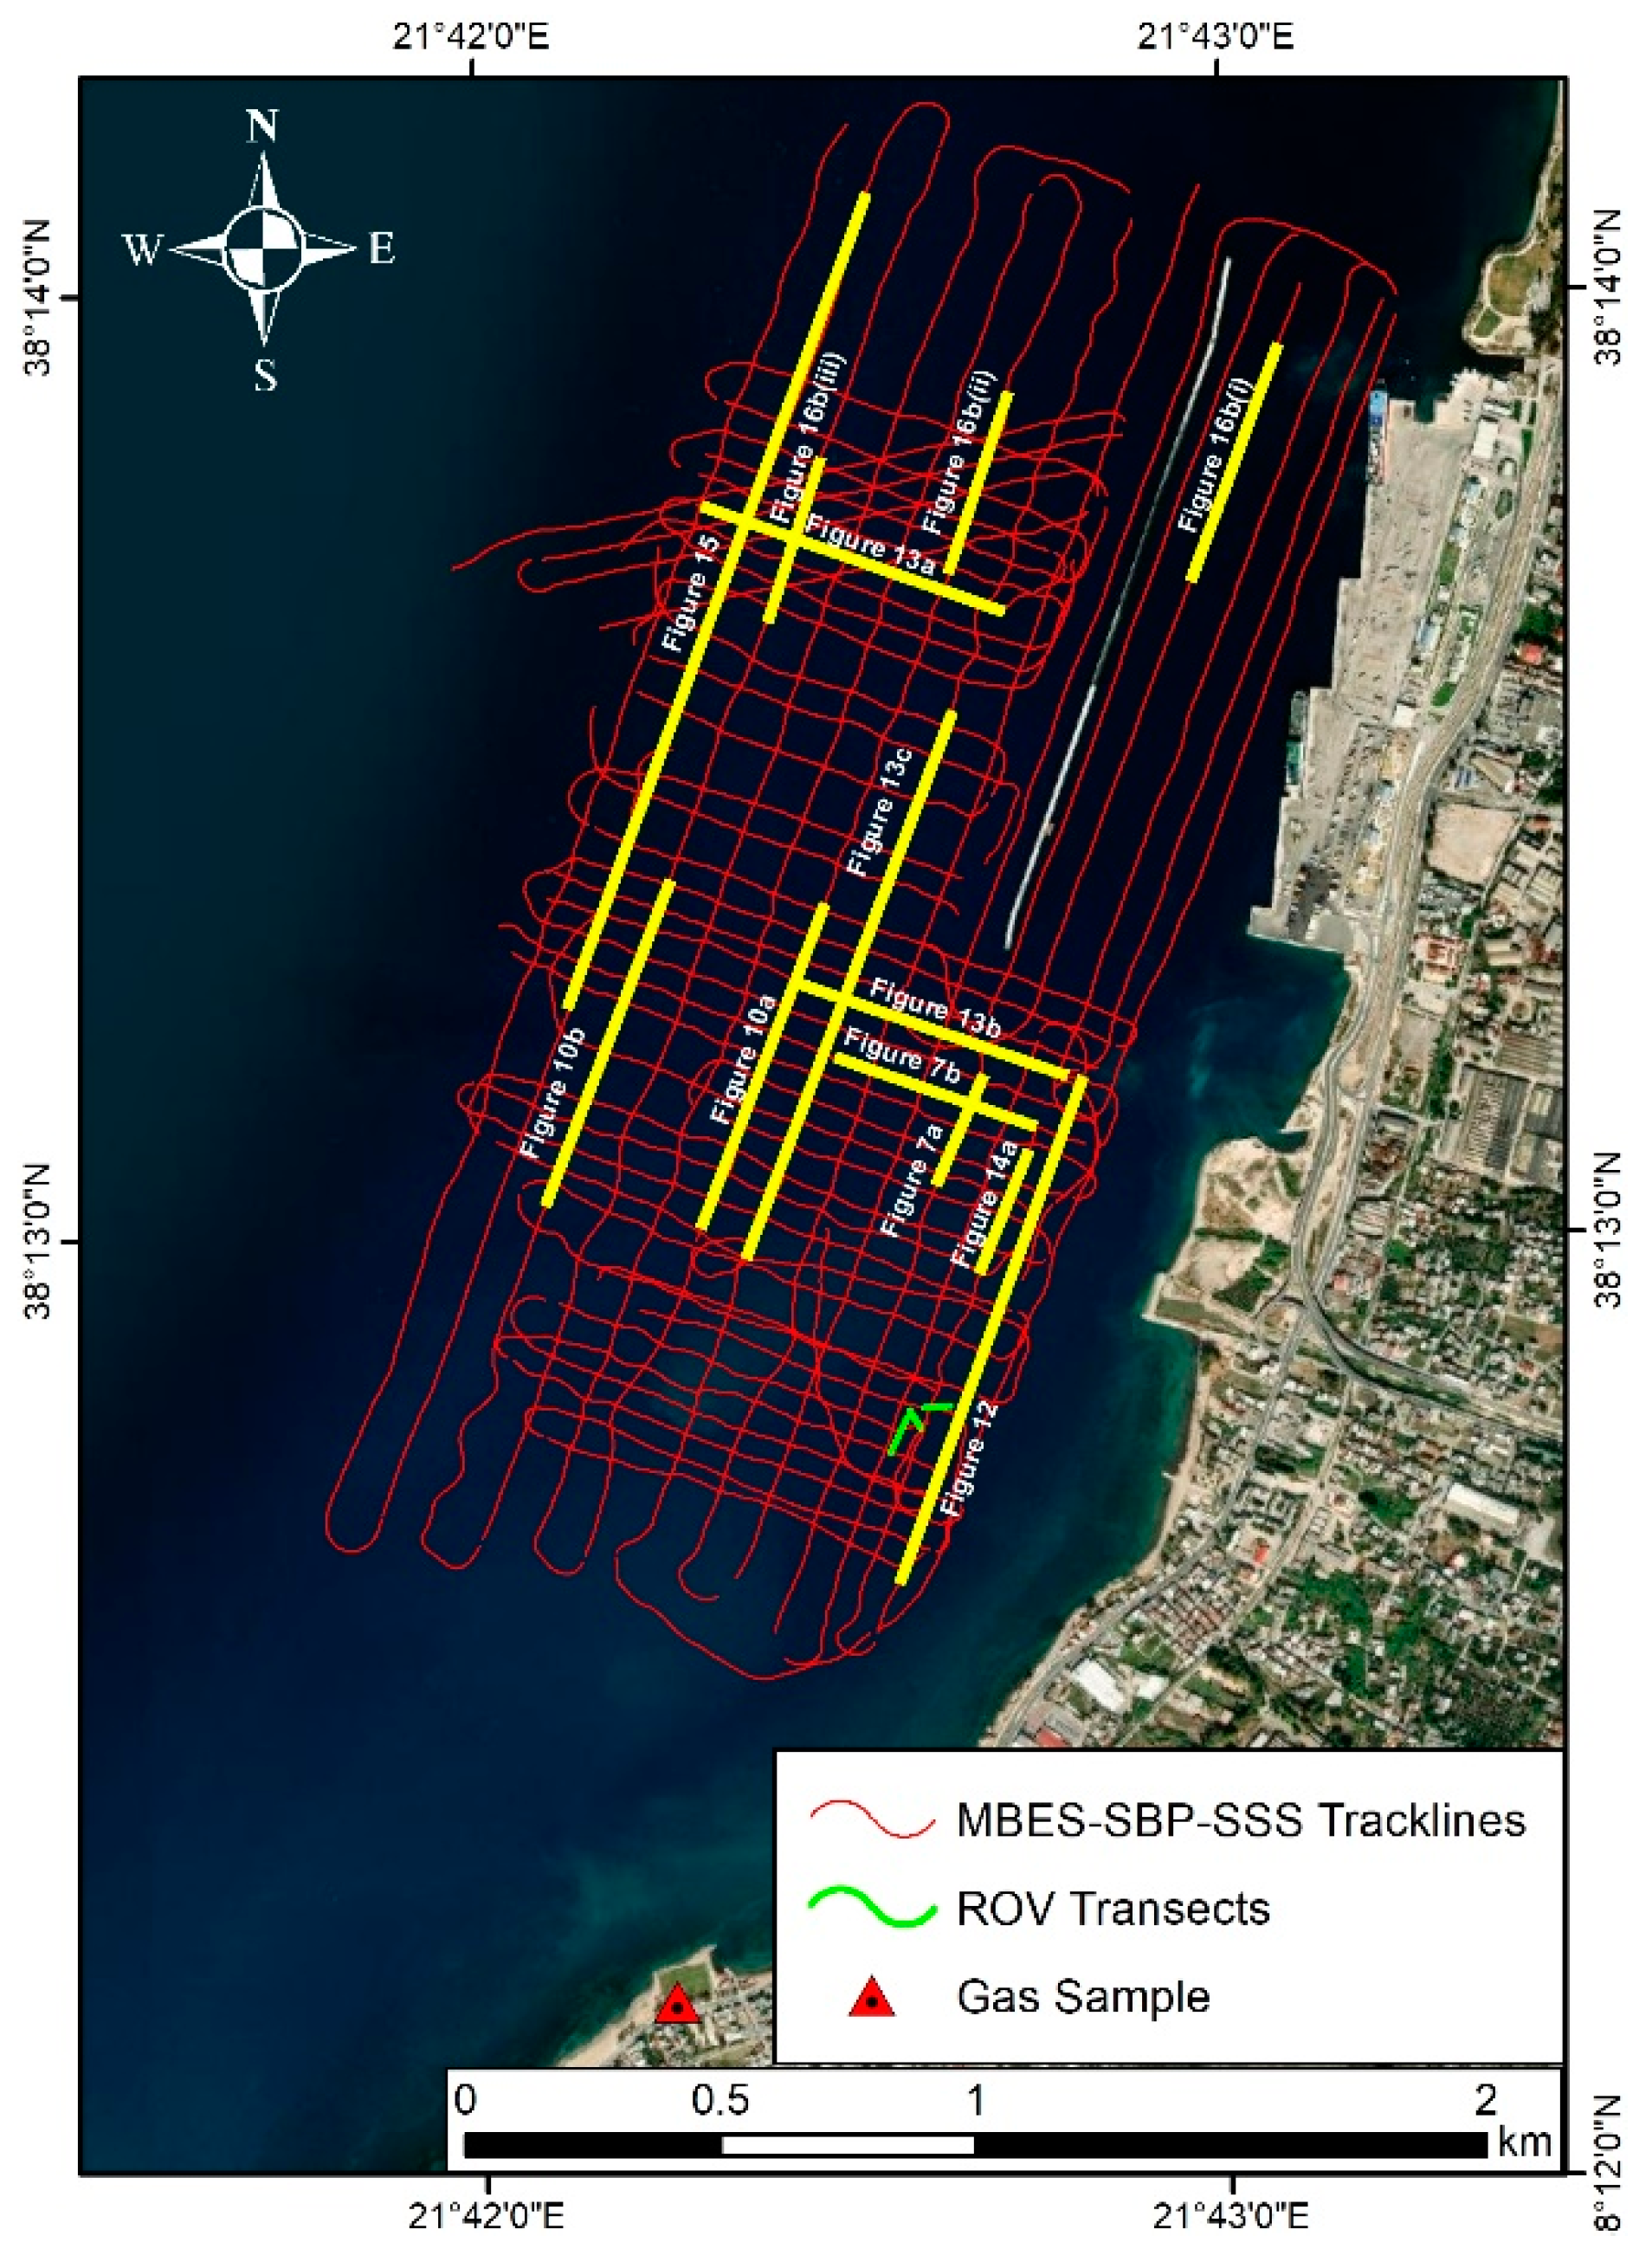
2.1. Marine Geophysical Survey
2.2. Gas Analysis
3. Results
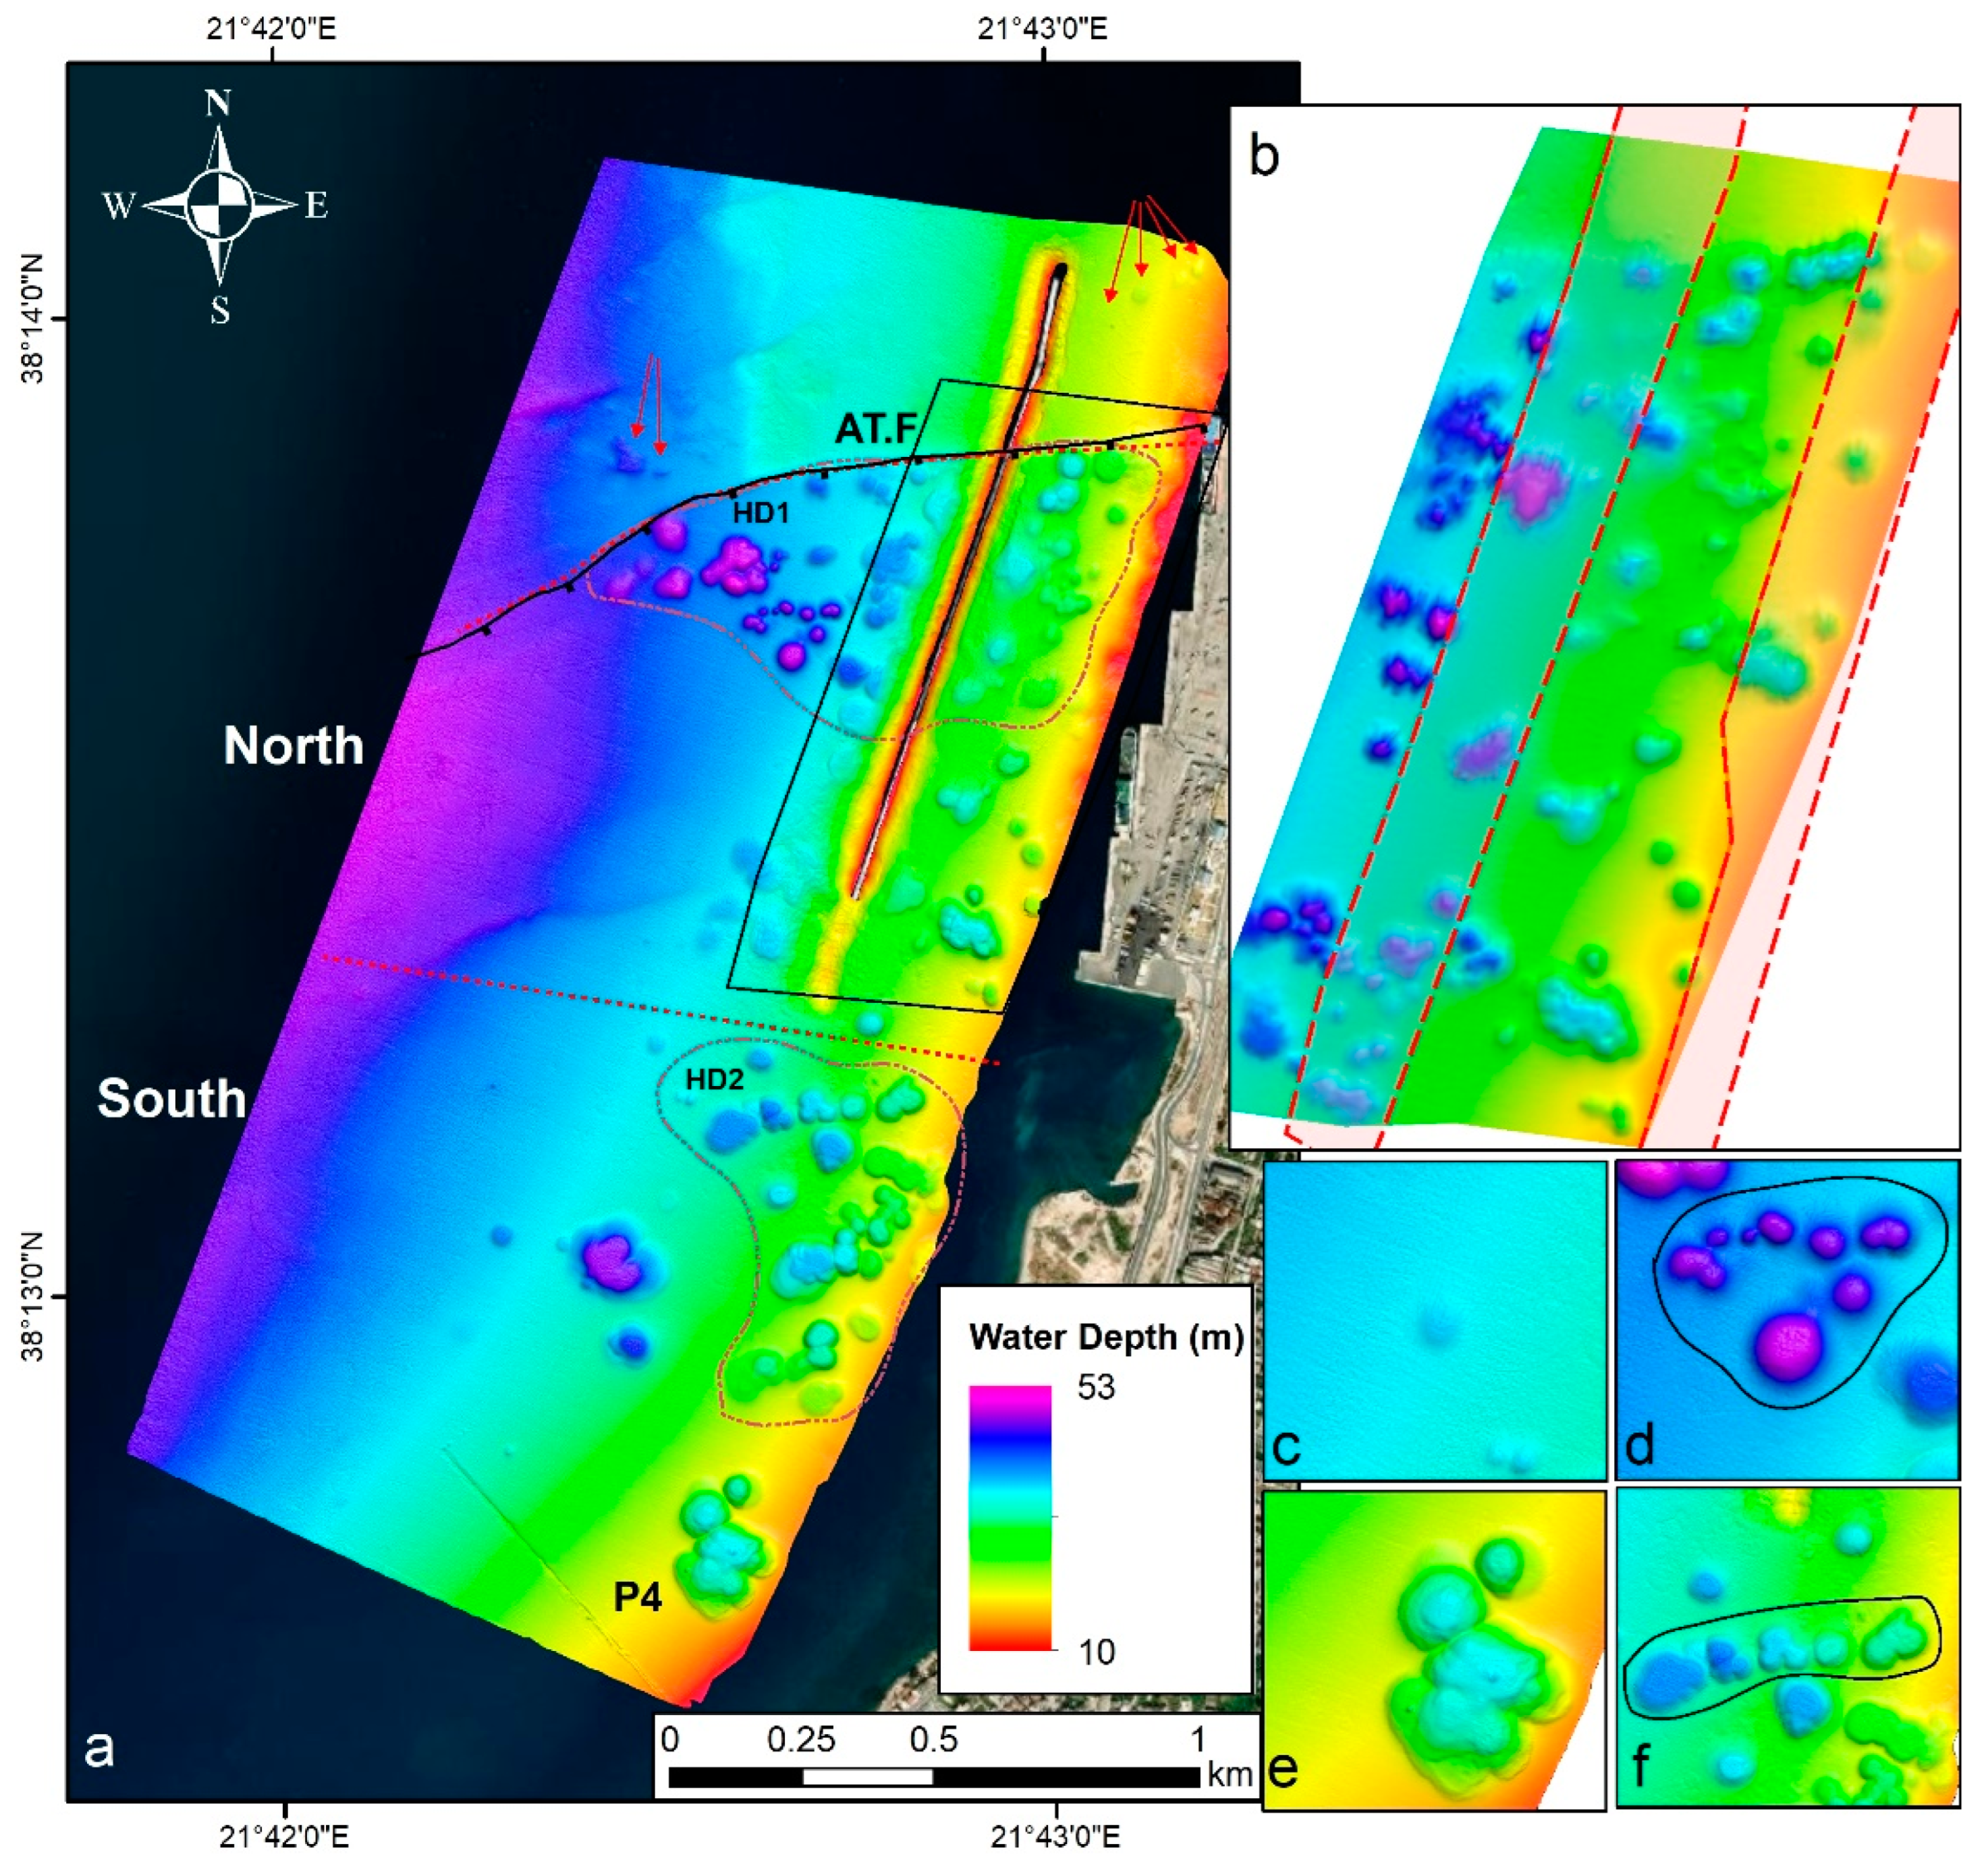
3.1. Pockmark Field
3.1.1. Pockmark Distribution, Size and Shape
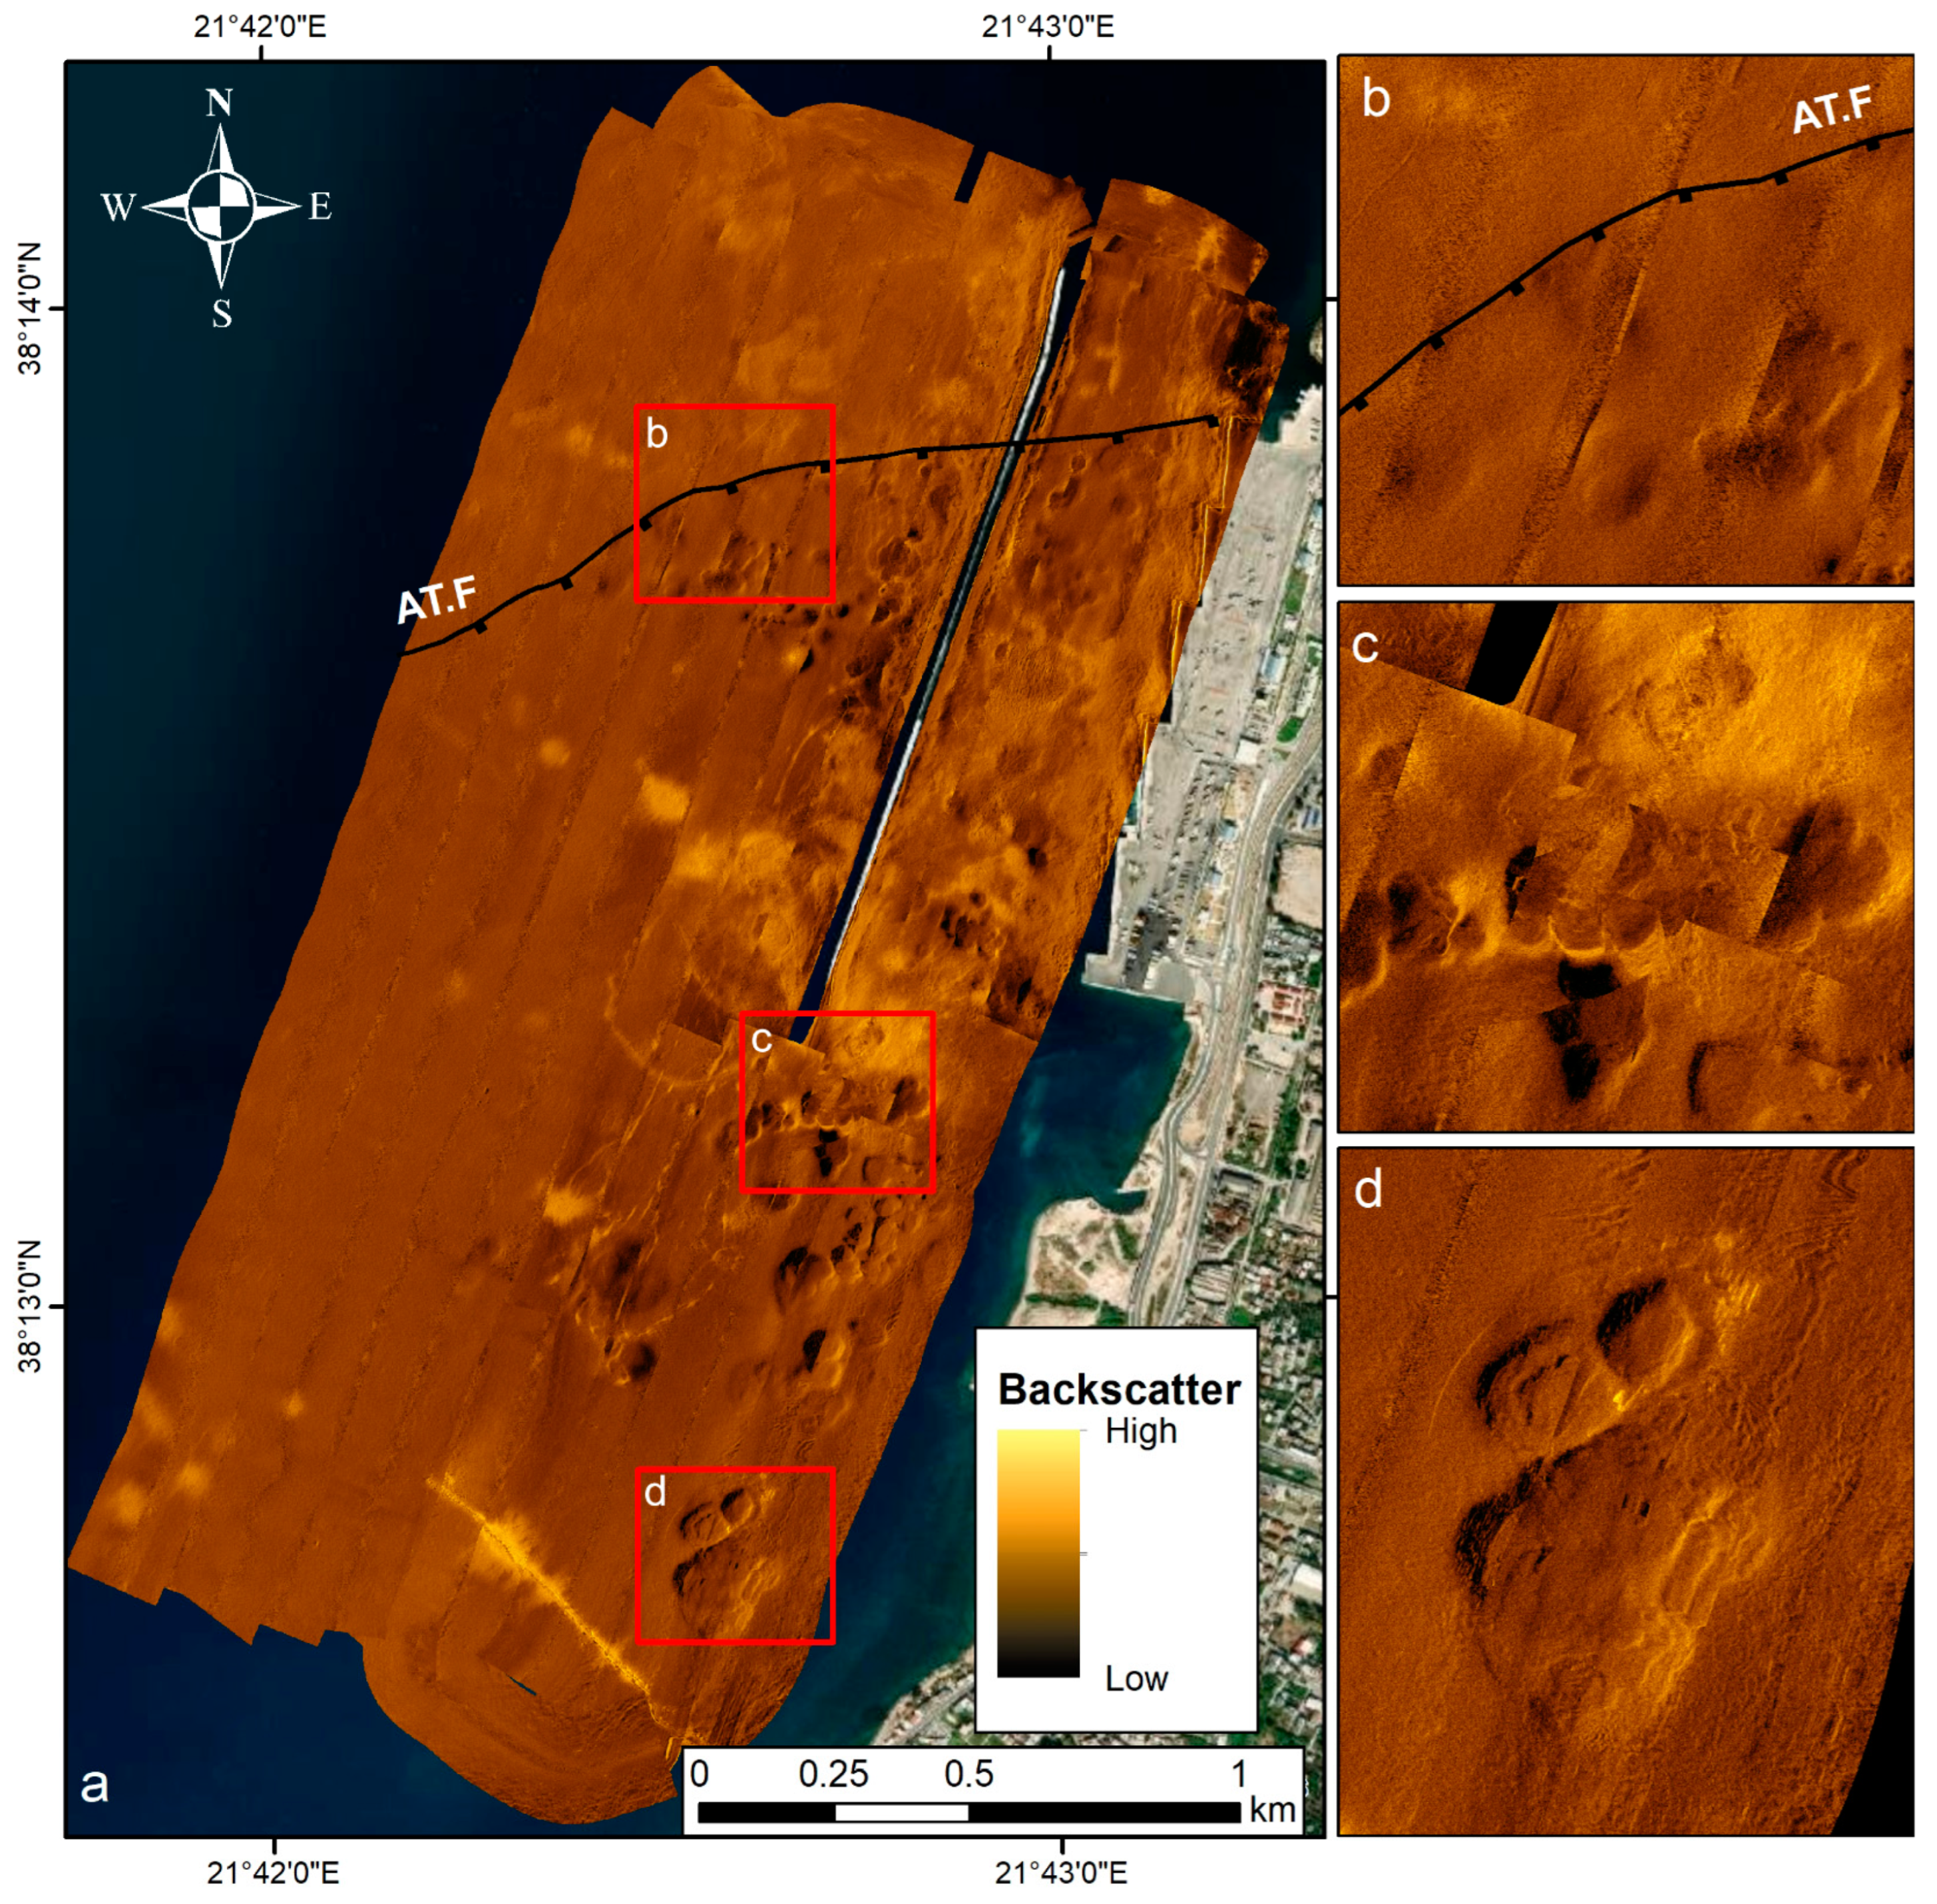
- Unit pockmarks: they have a diameter of 8 to 20 m, and their relative depth, compared to the surrounding seabed, varies from 1 to 5 m. They are small in size, and they could be considered early stages of development (Figure 3a,c).
- Normal pockmarks: they are circular or ellipsoidal in plan view, the diameter ranges from 20 to 130 m, and their relative depth reaches 14 m. These pockmarks can be characterised as being in a mature stage of development (Figure 3a,d).
- Composite or complex pockmarks: they have an irregular shape in plan view, their size is large and reaches a perimeter of 805 m, and their relative depth reaches up to 20 m. They are pockmarks that resulted from the amalgamation of neighbouring normal and unit pockmarks (Figure 3a,e).
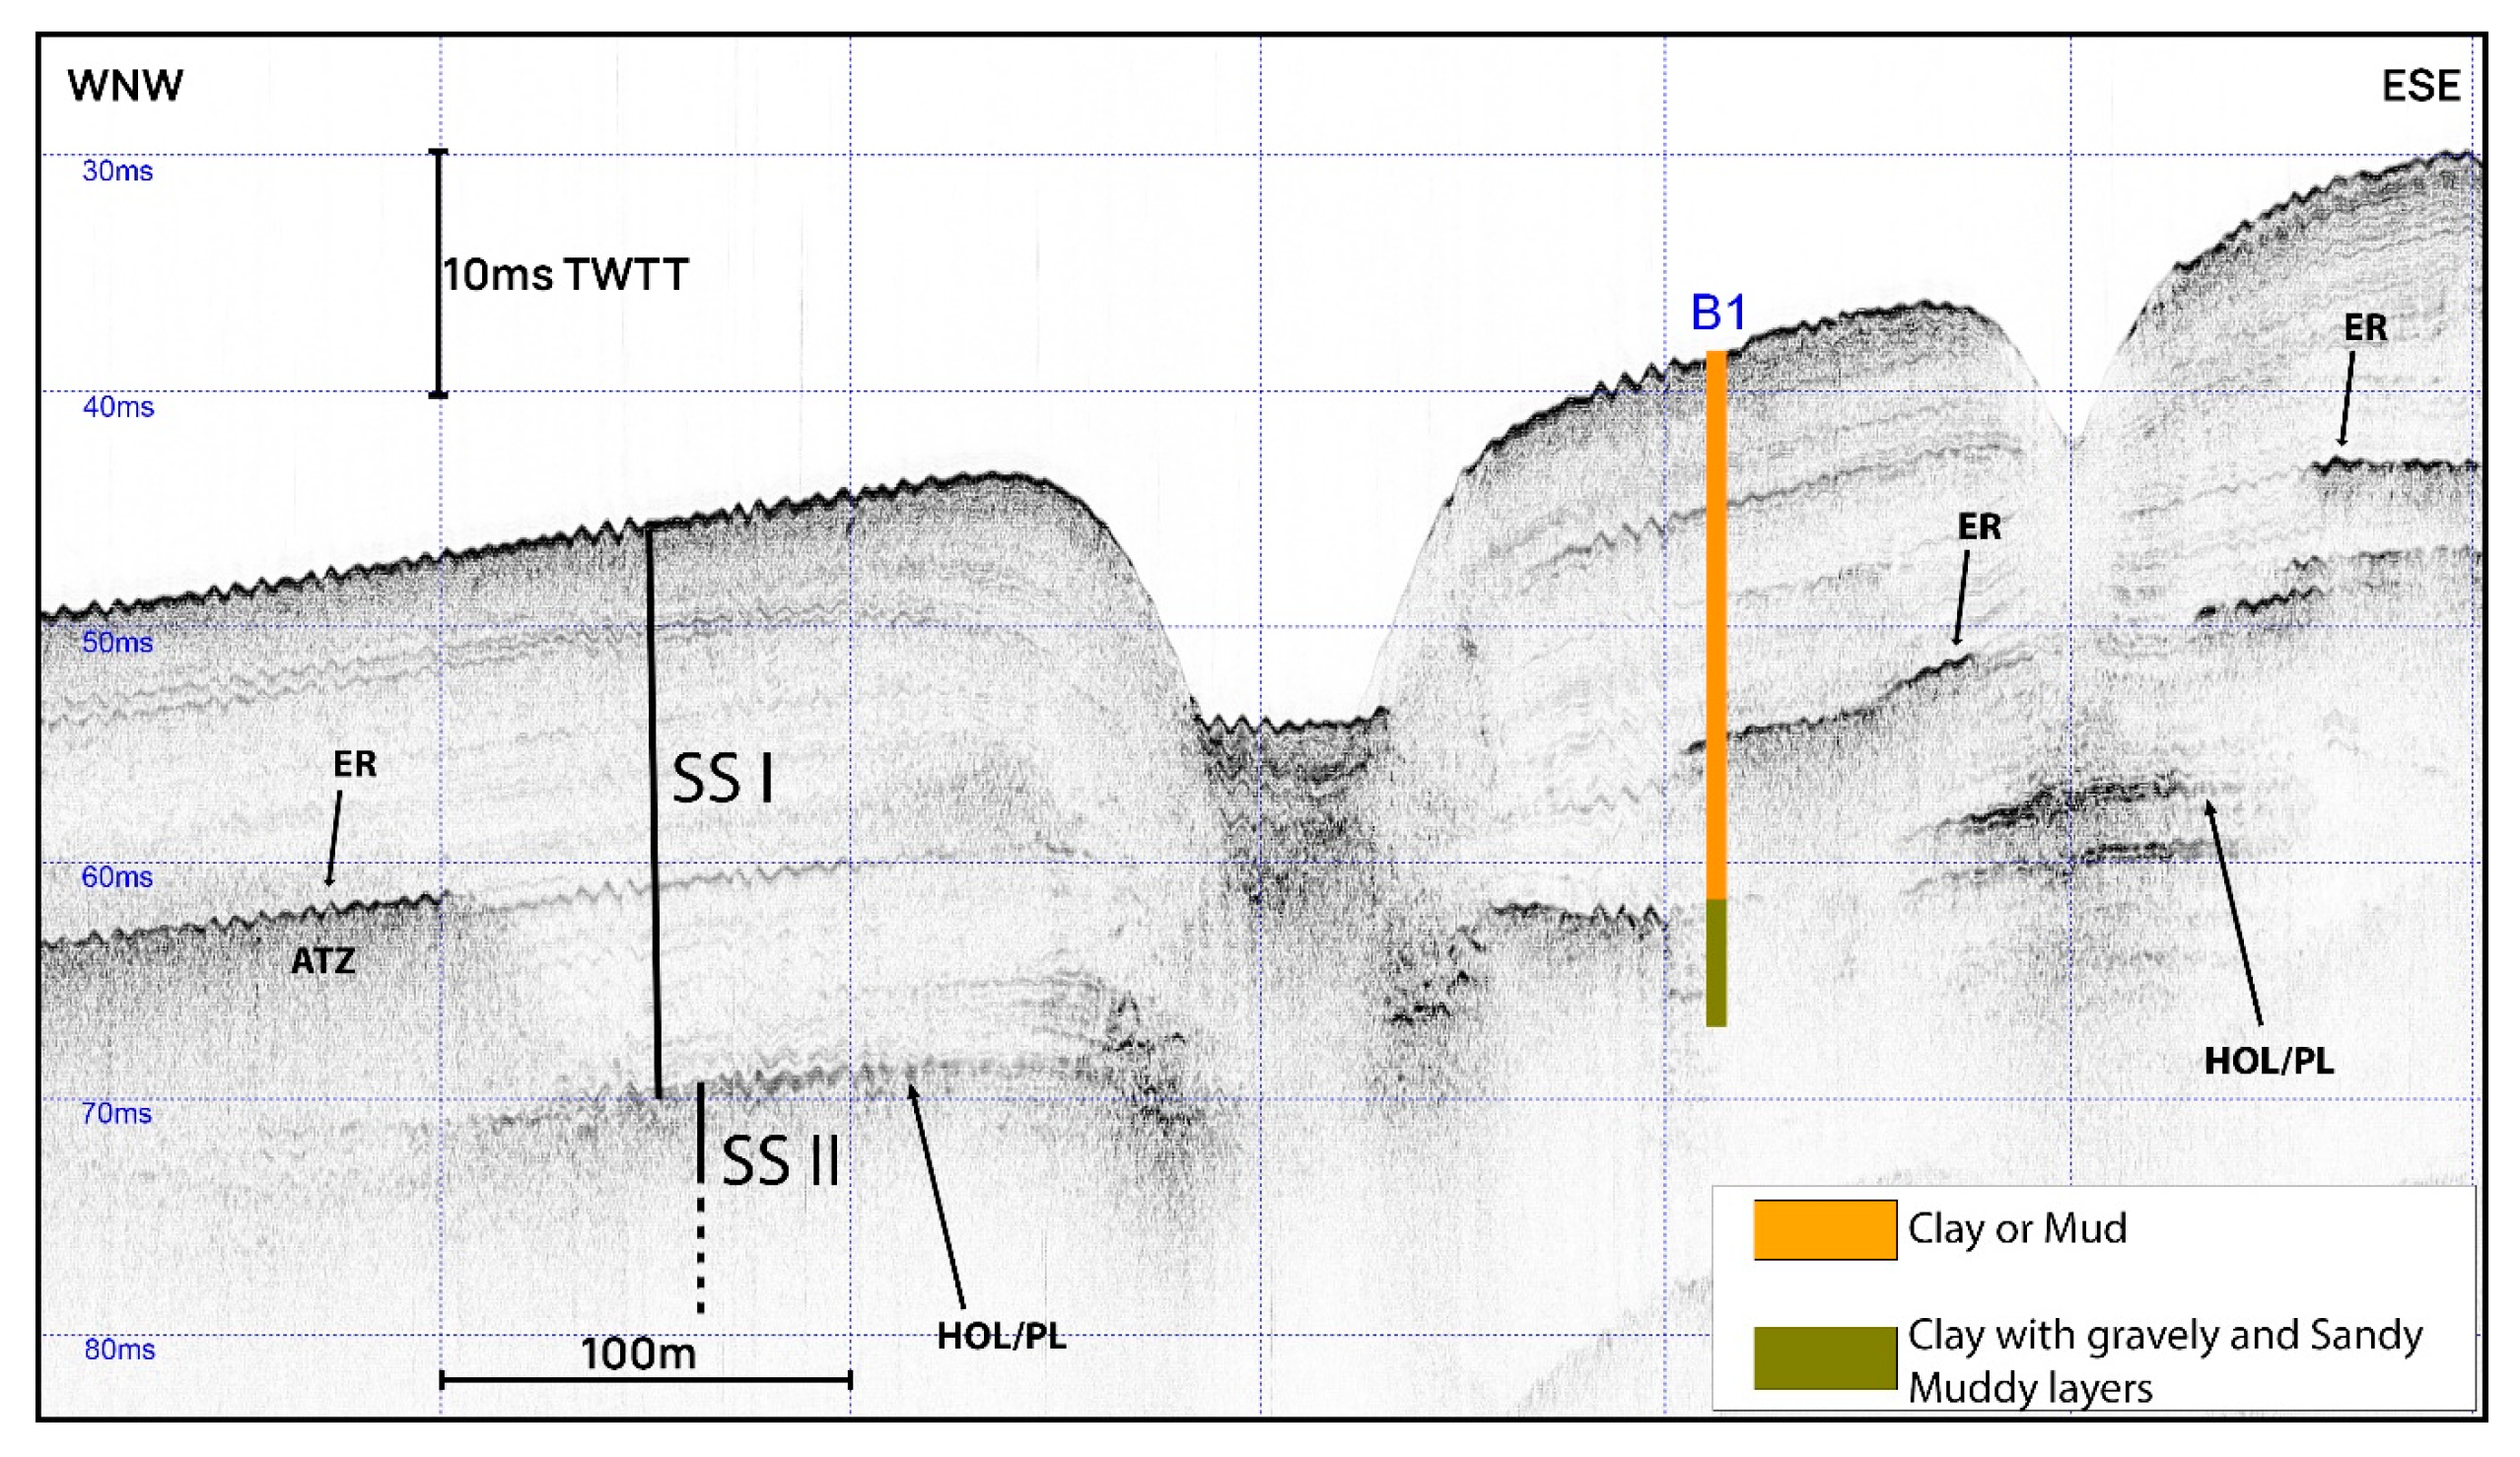
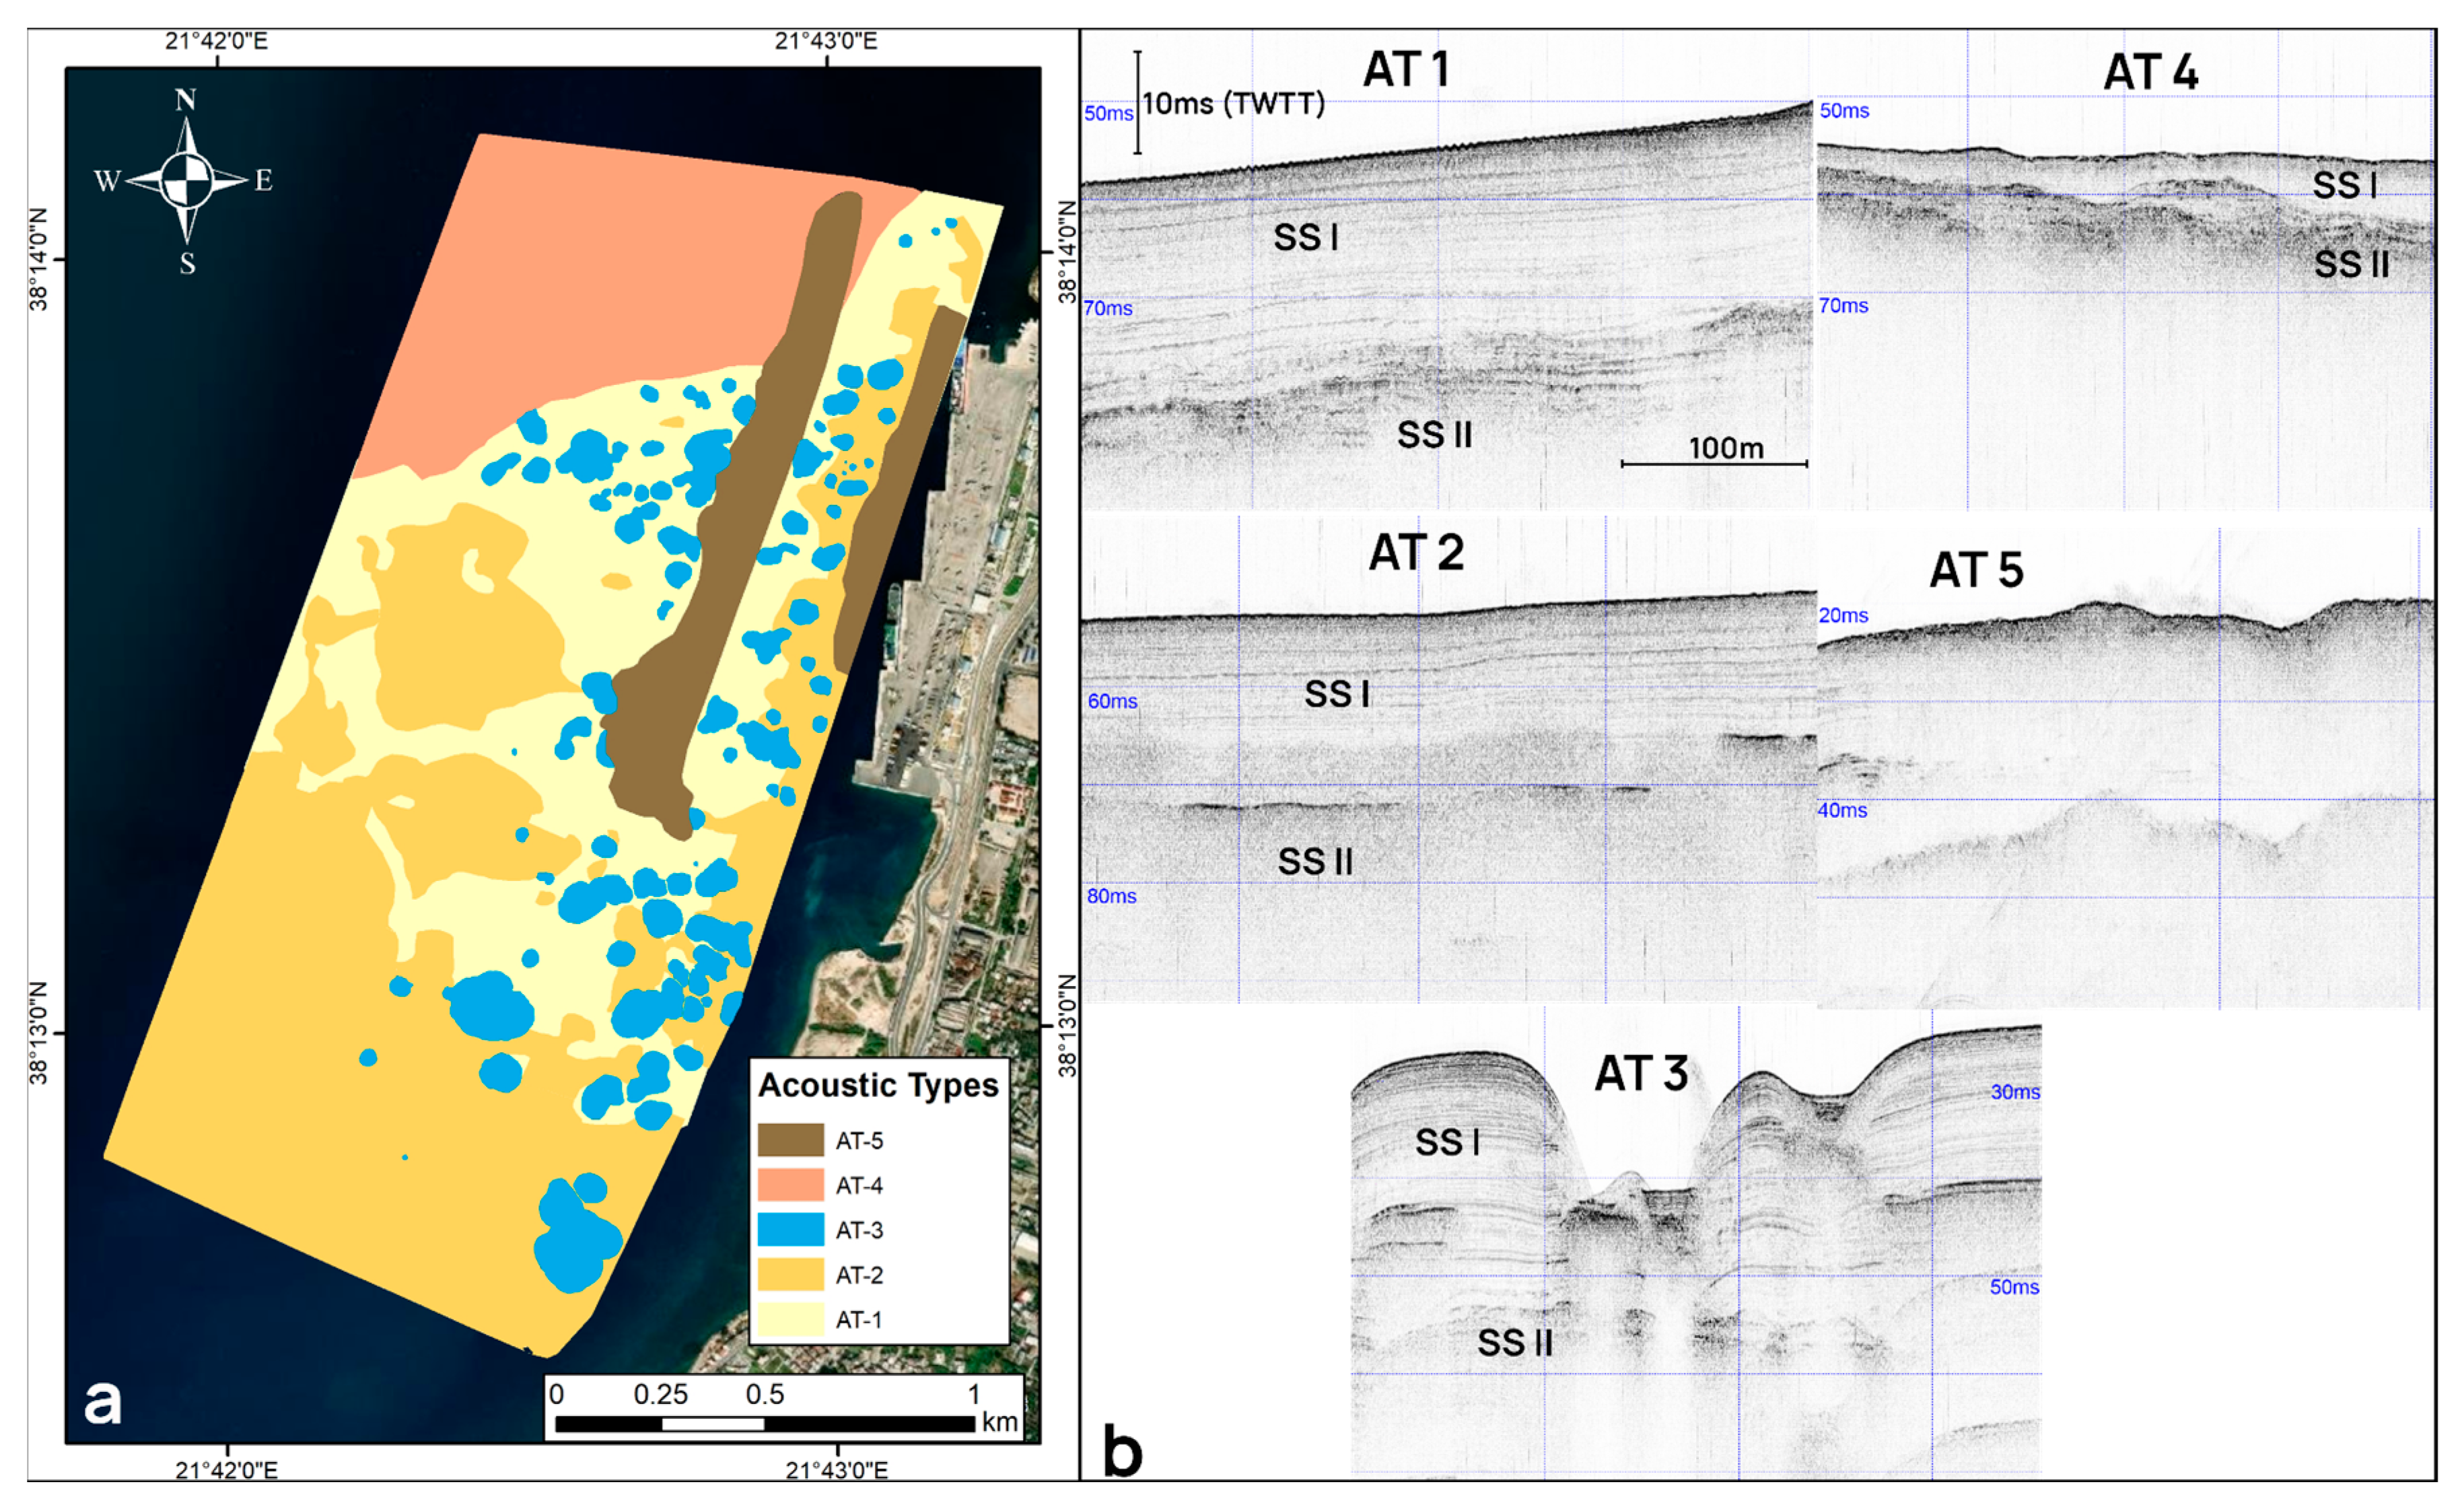
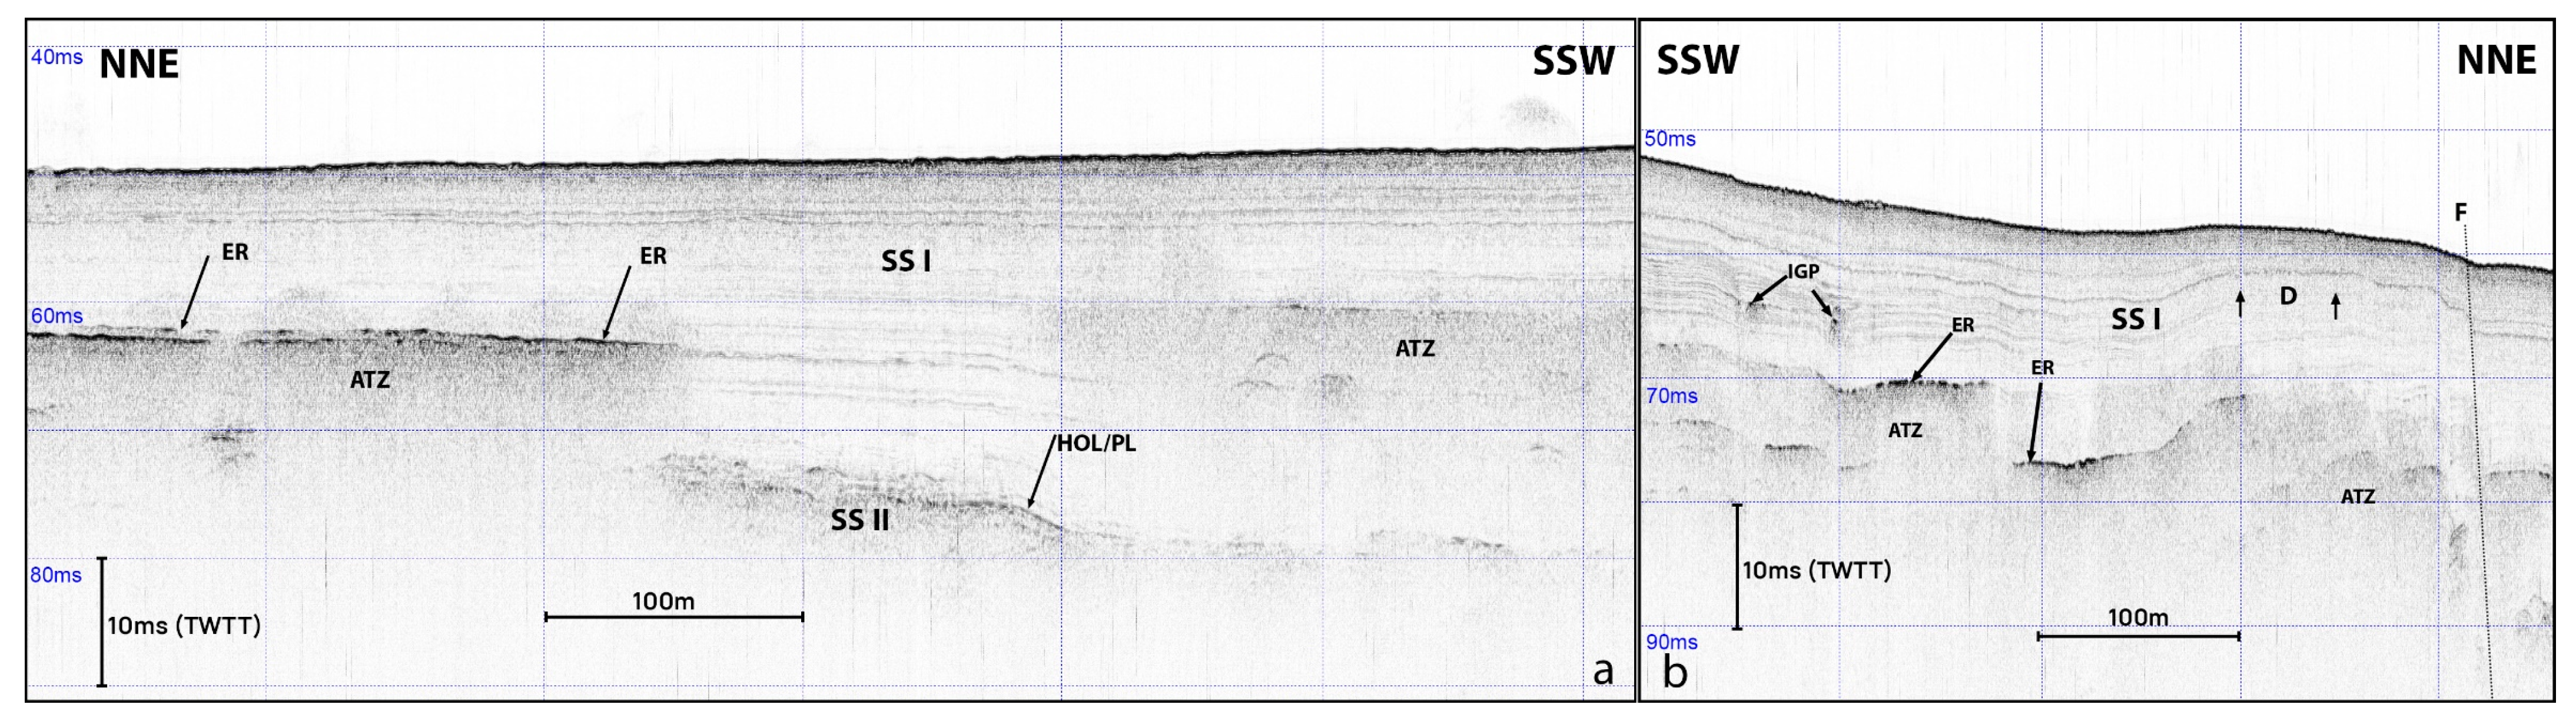
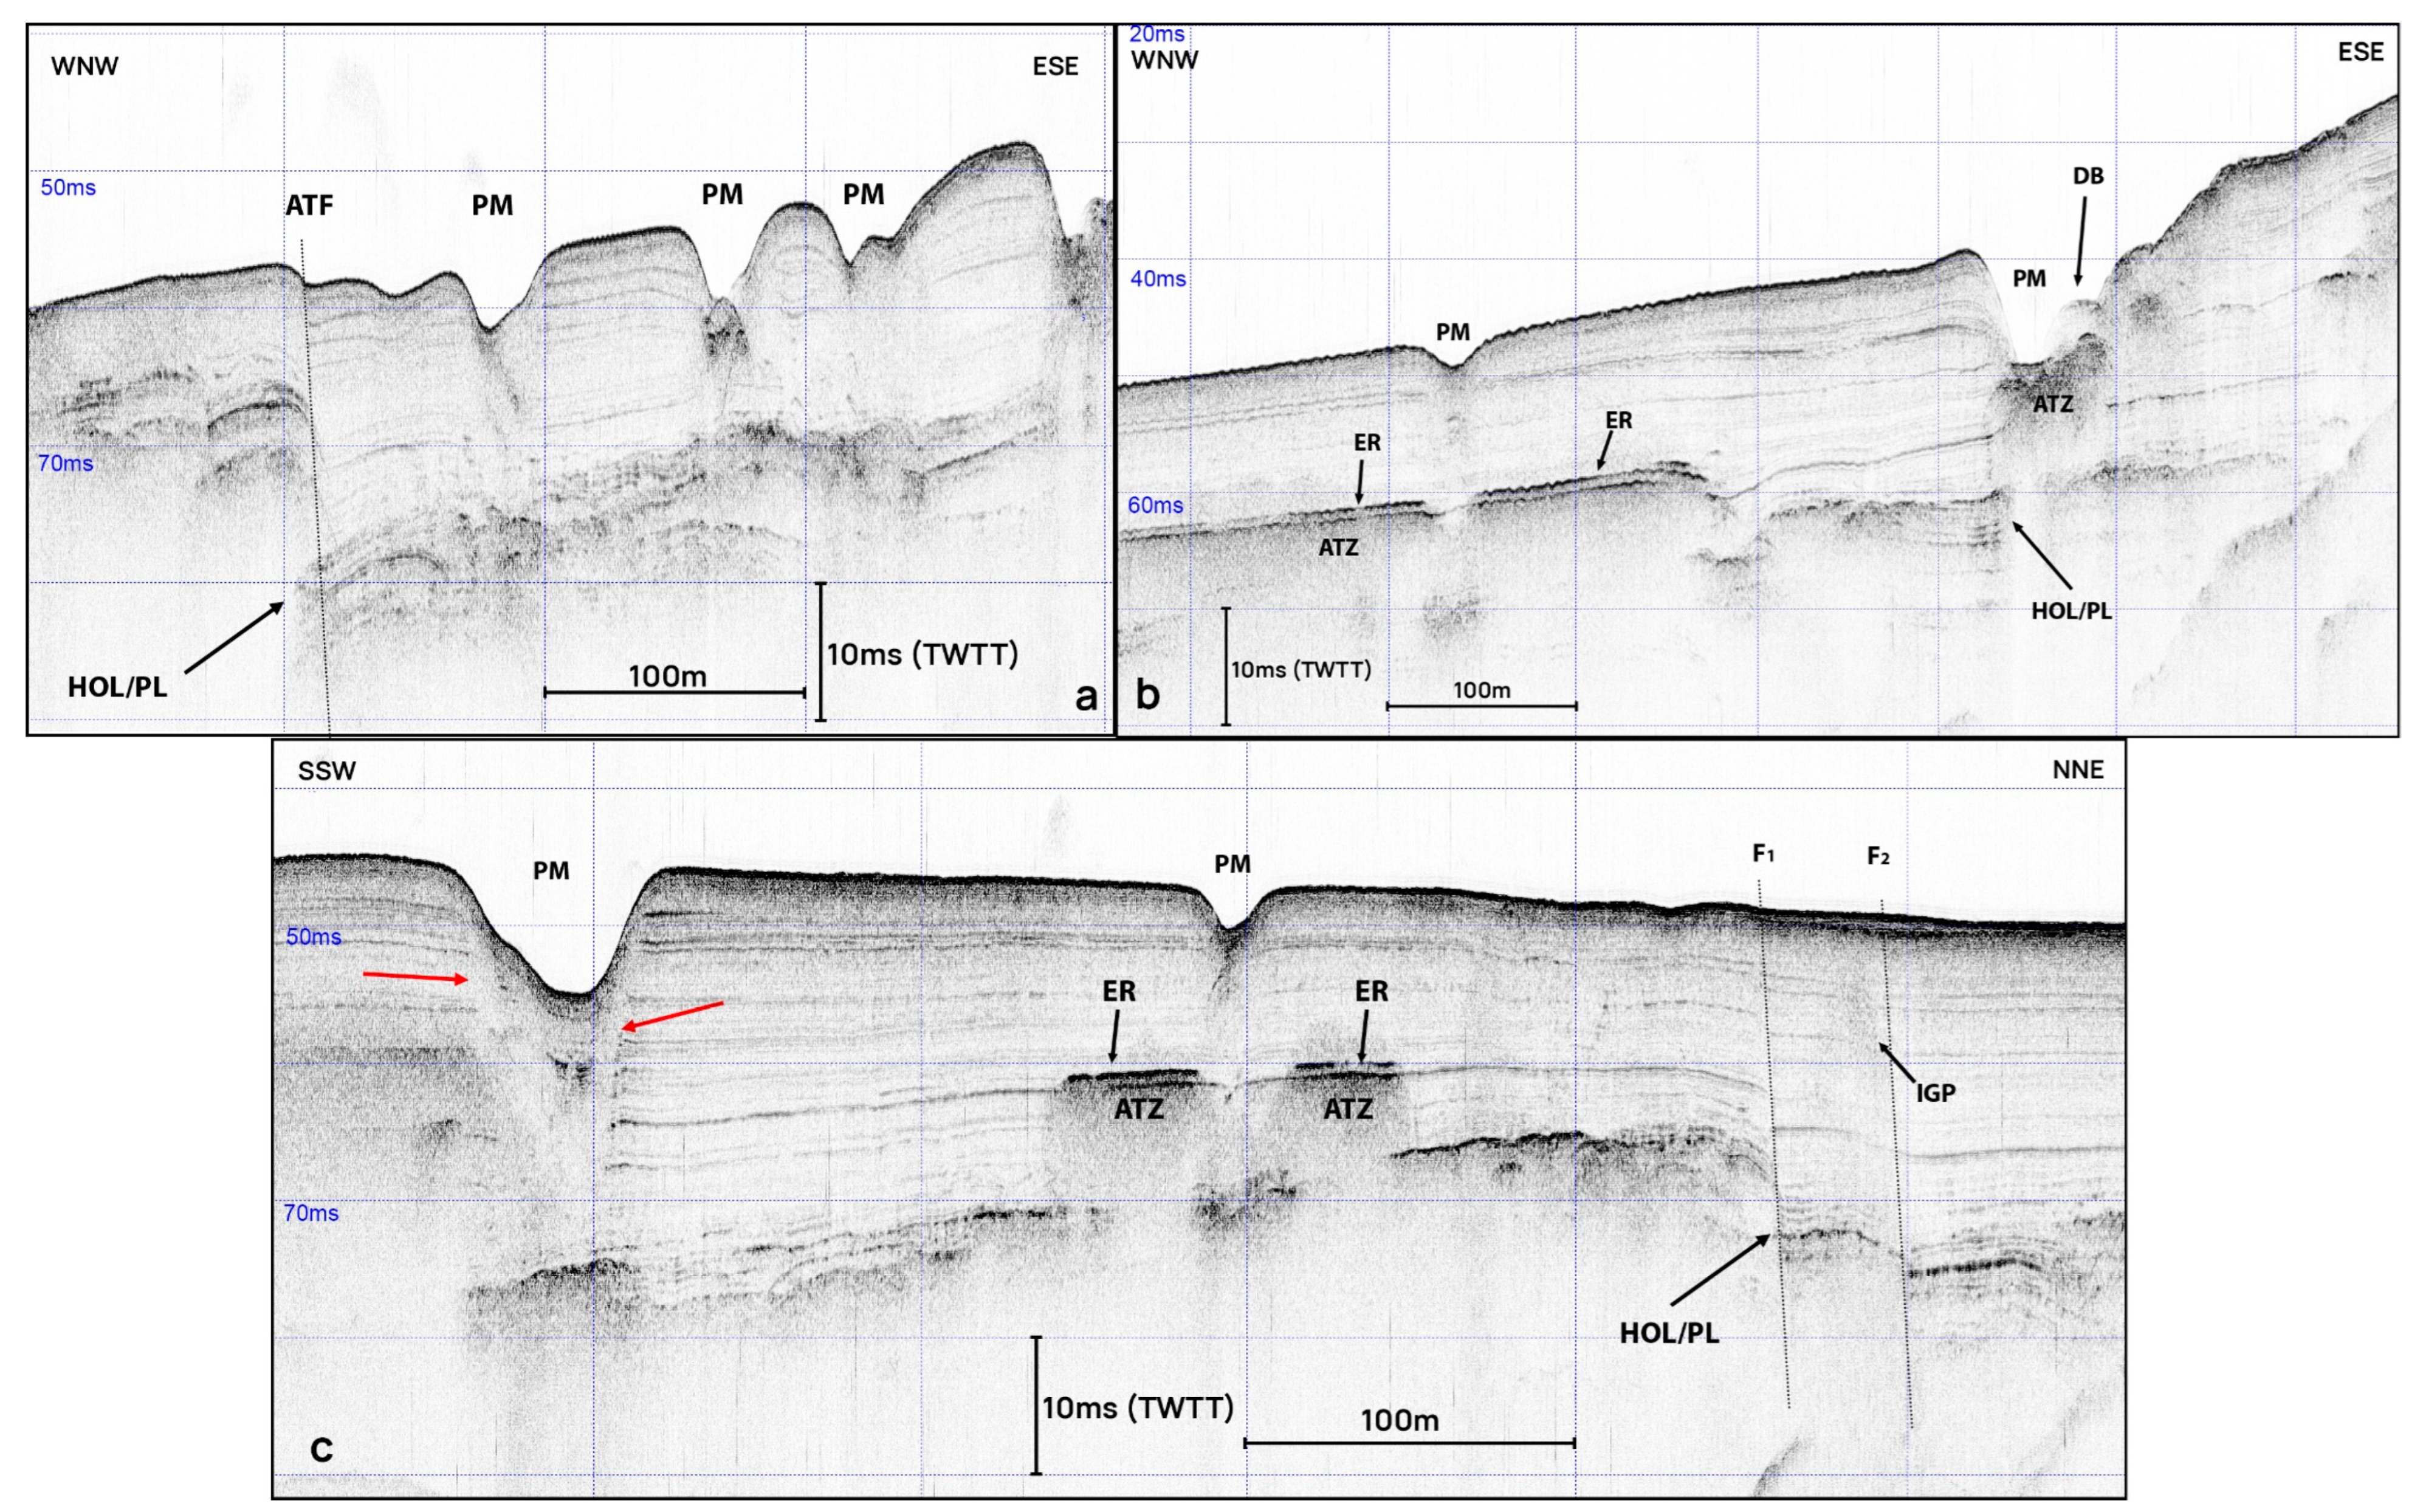
3.1.2. Seismostratigraphy
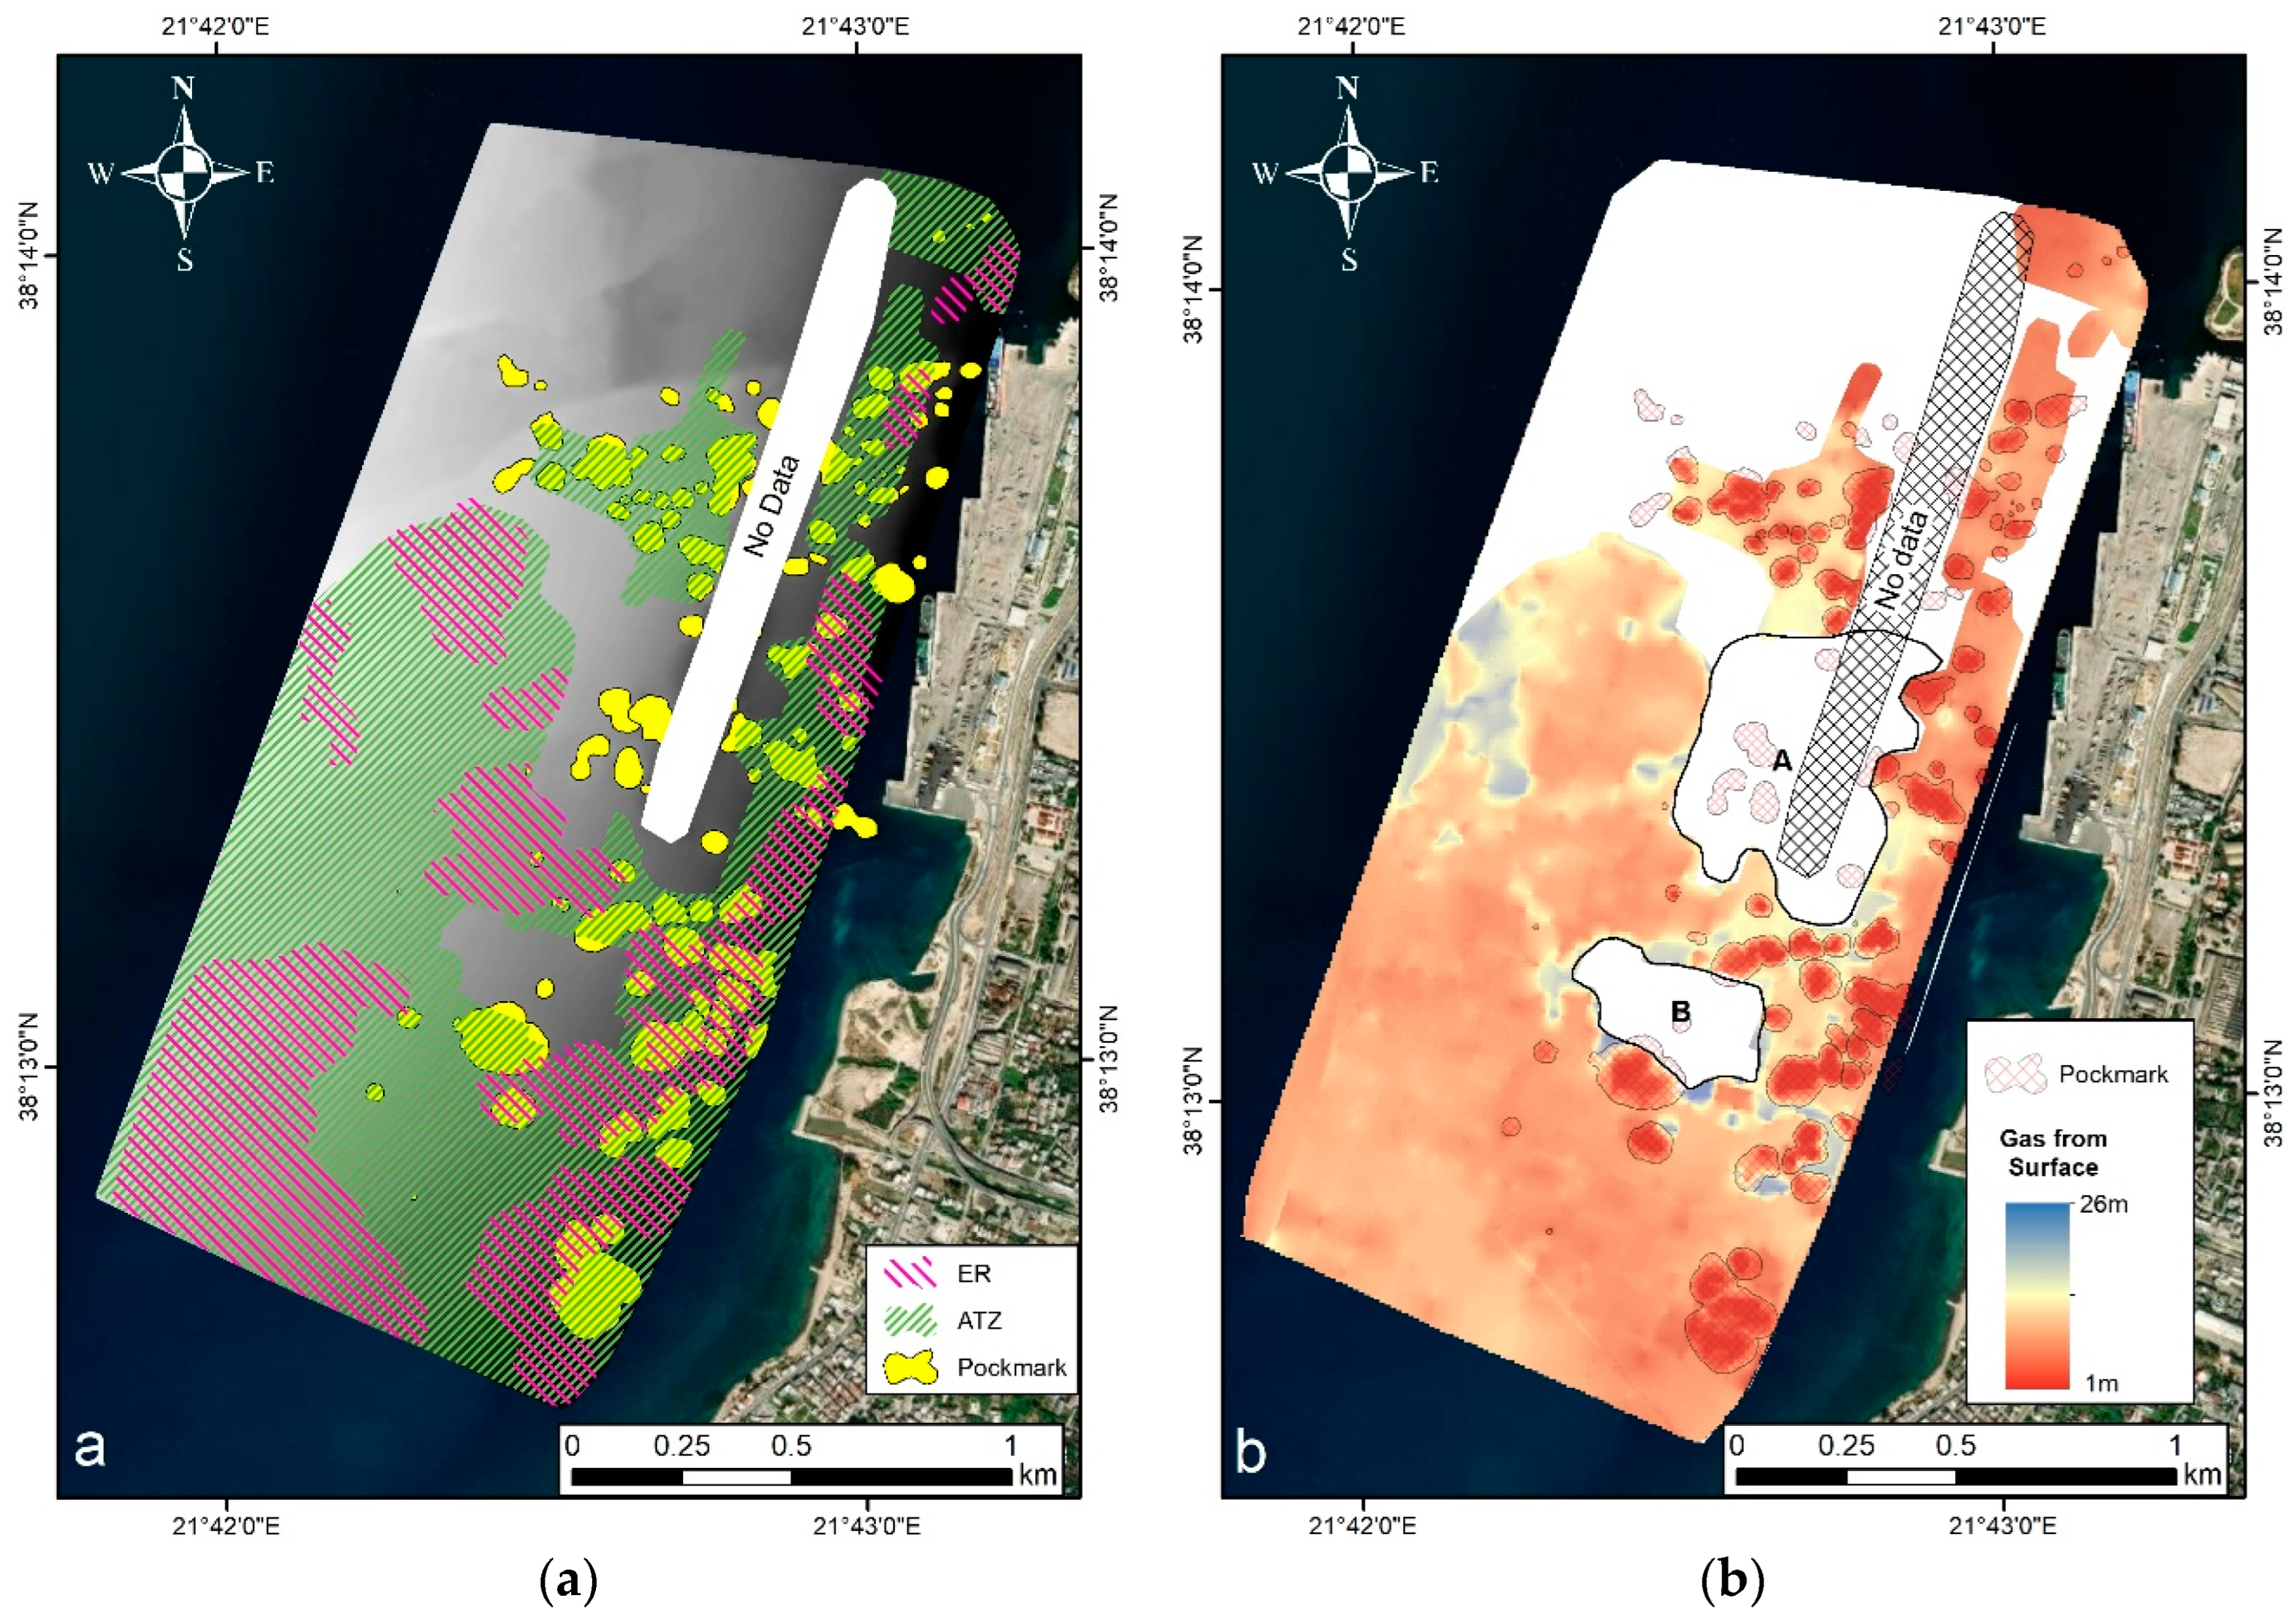
3.1.3. Gas in Marine Sediments
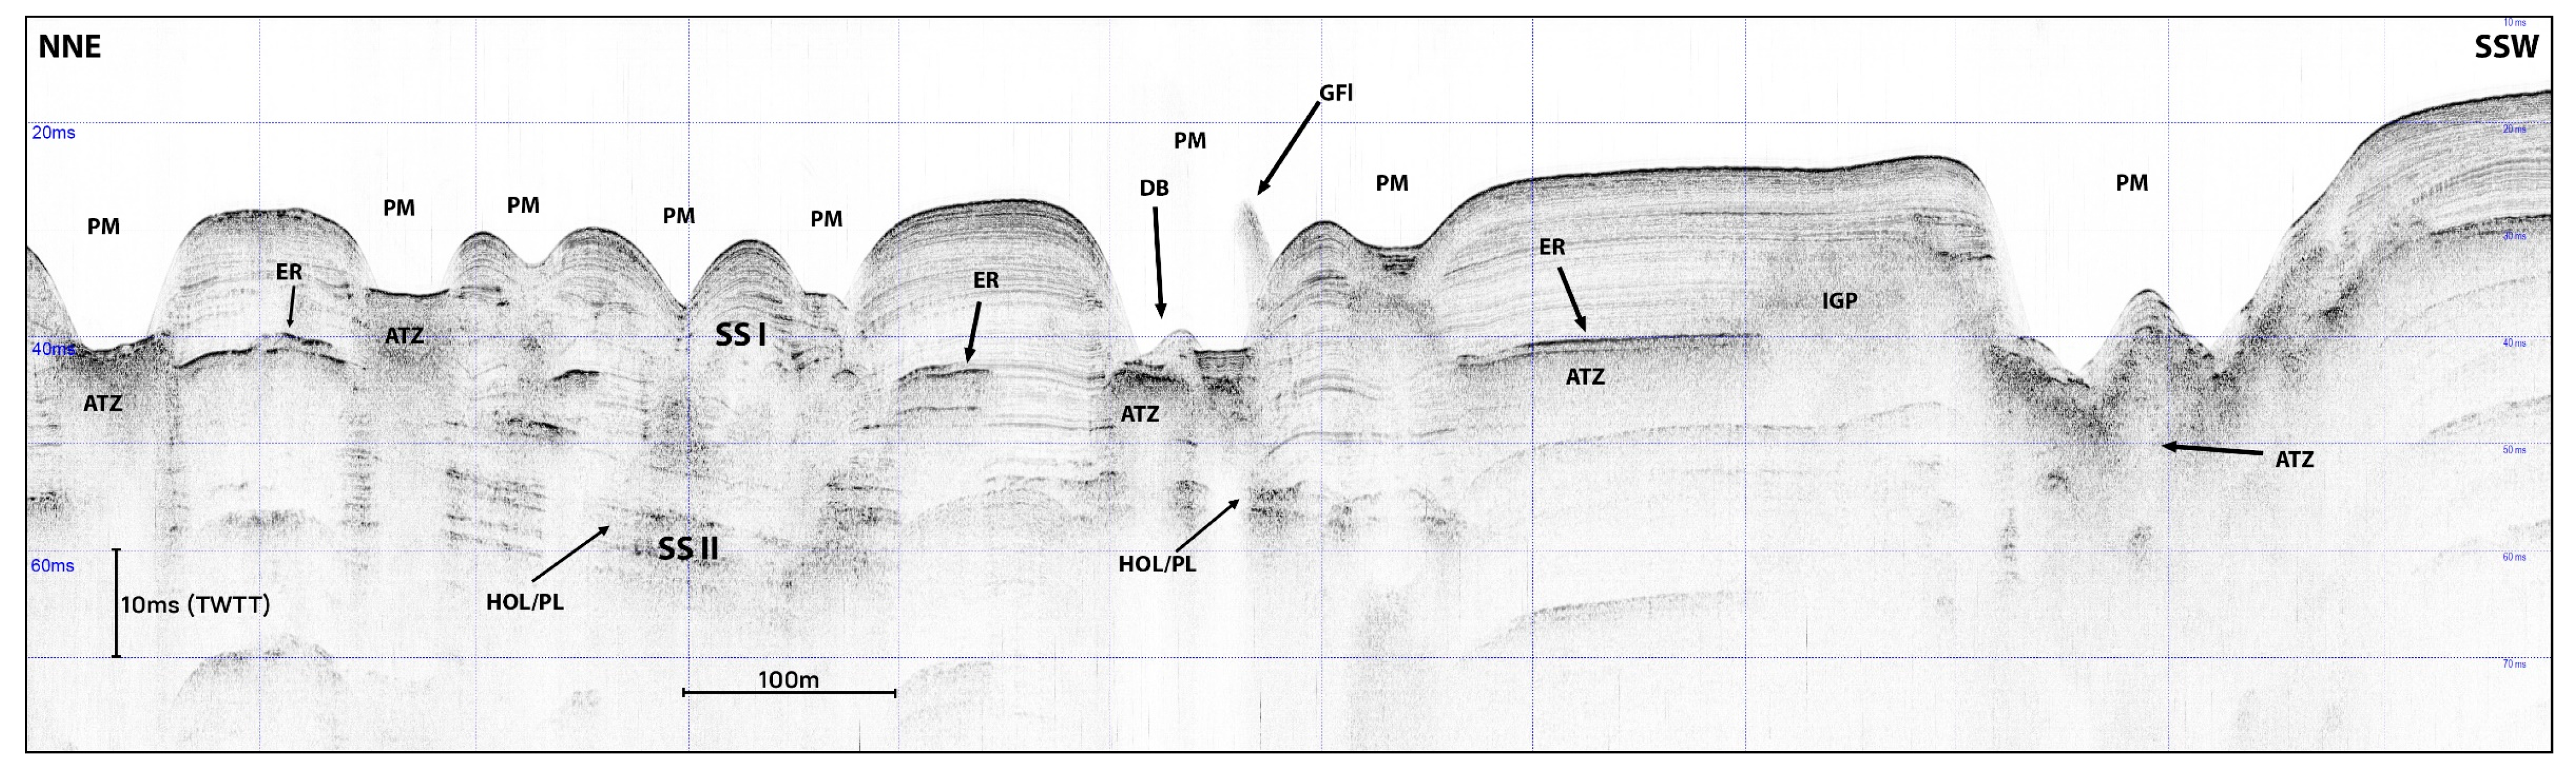
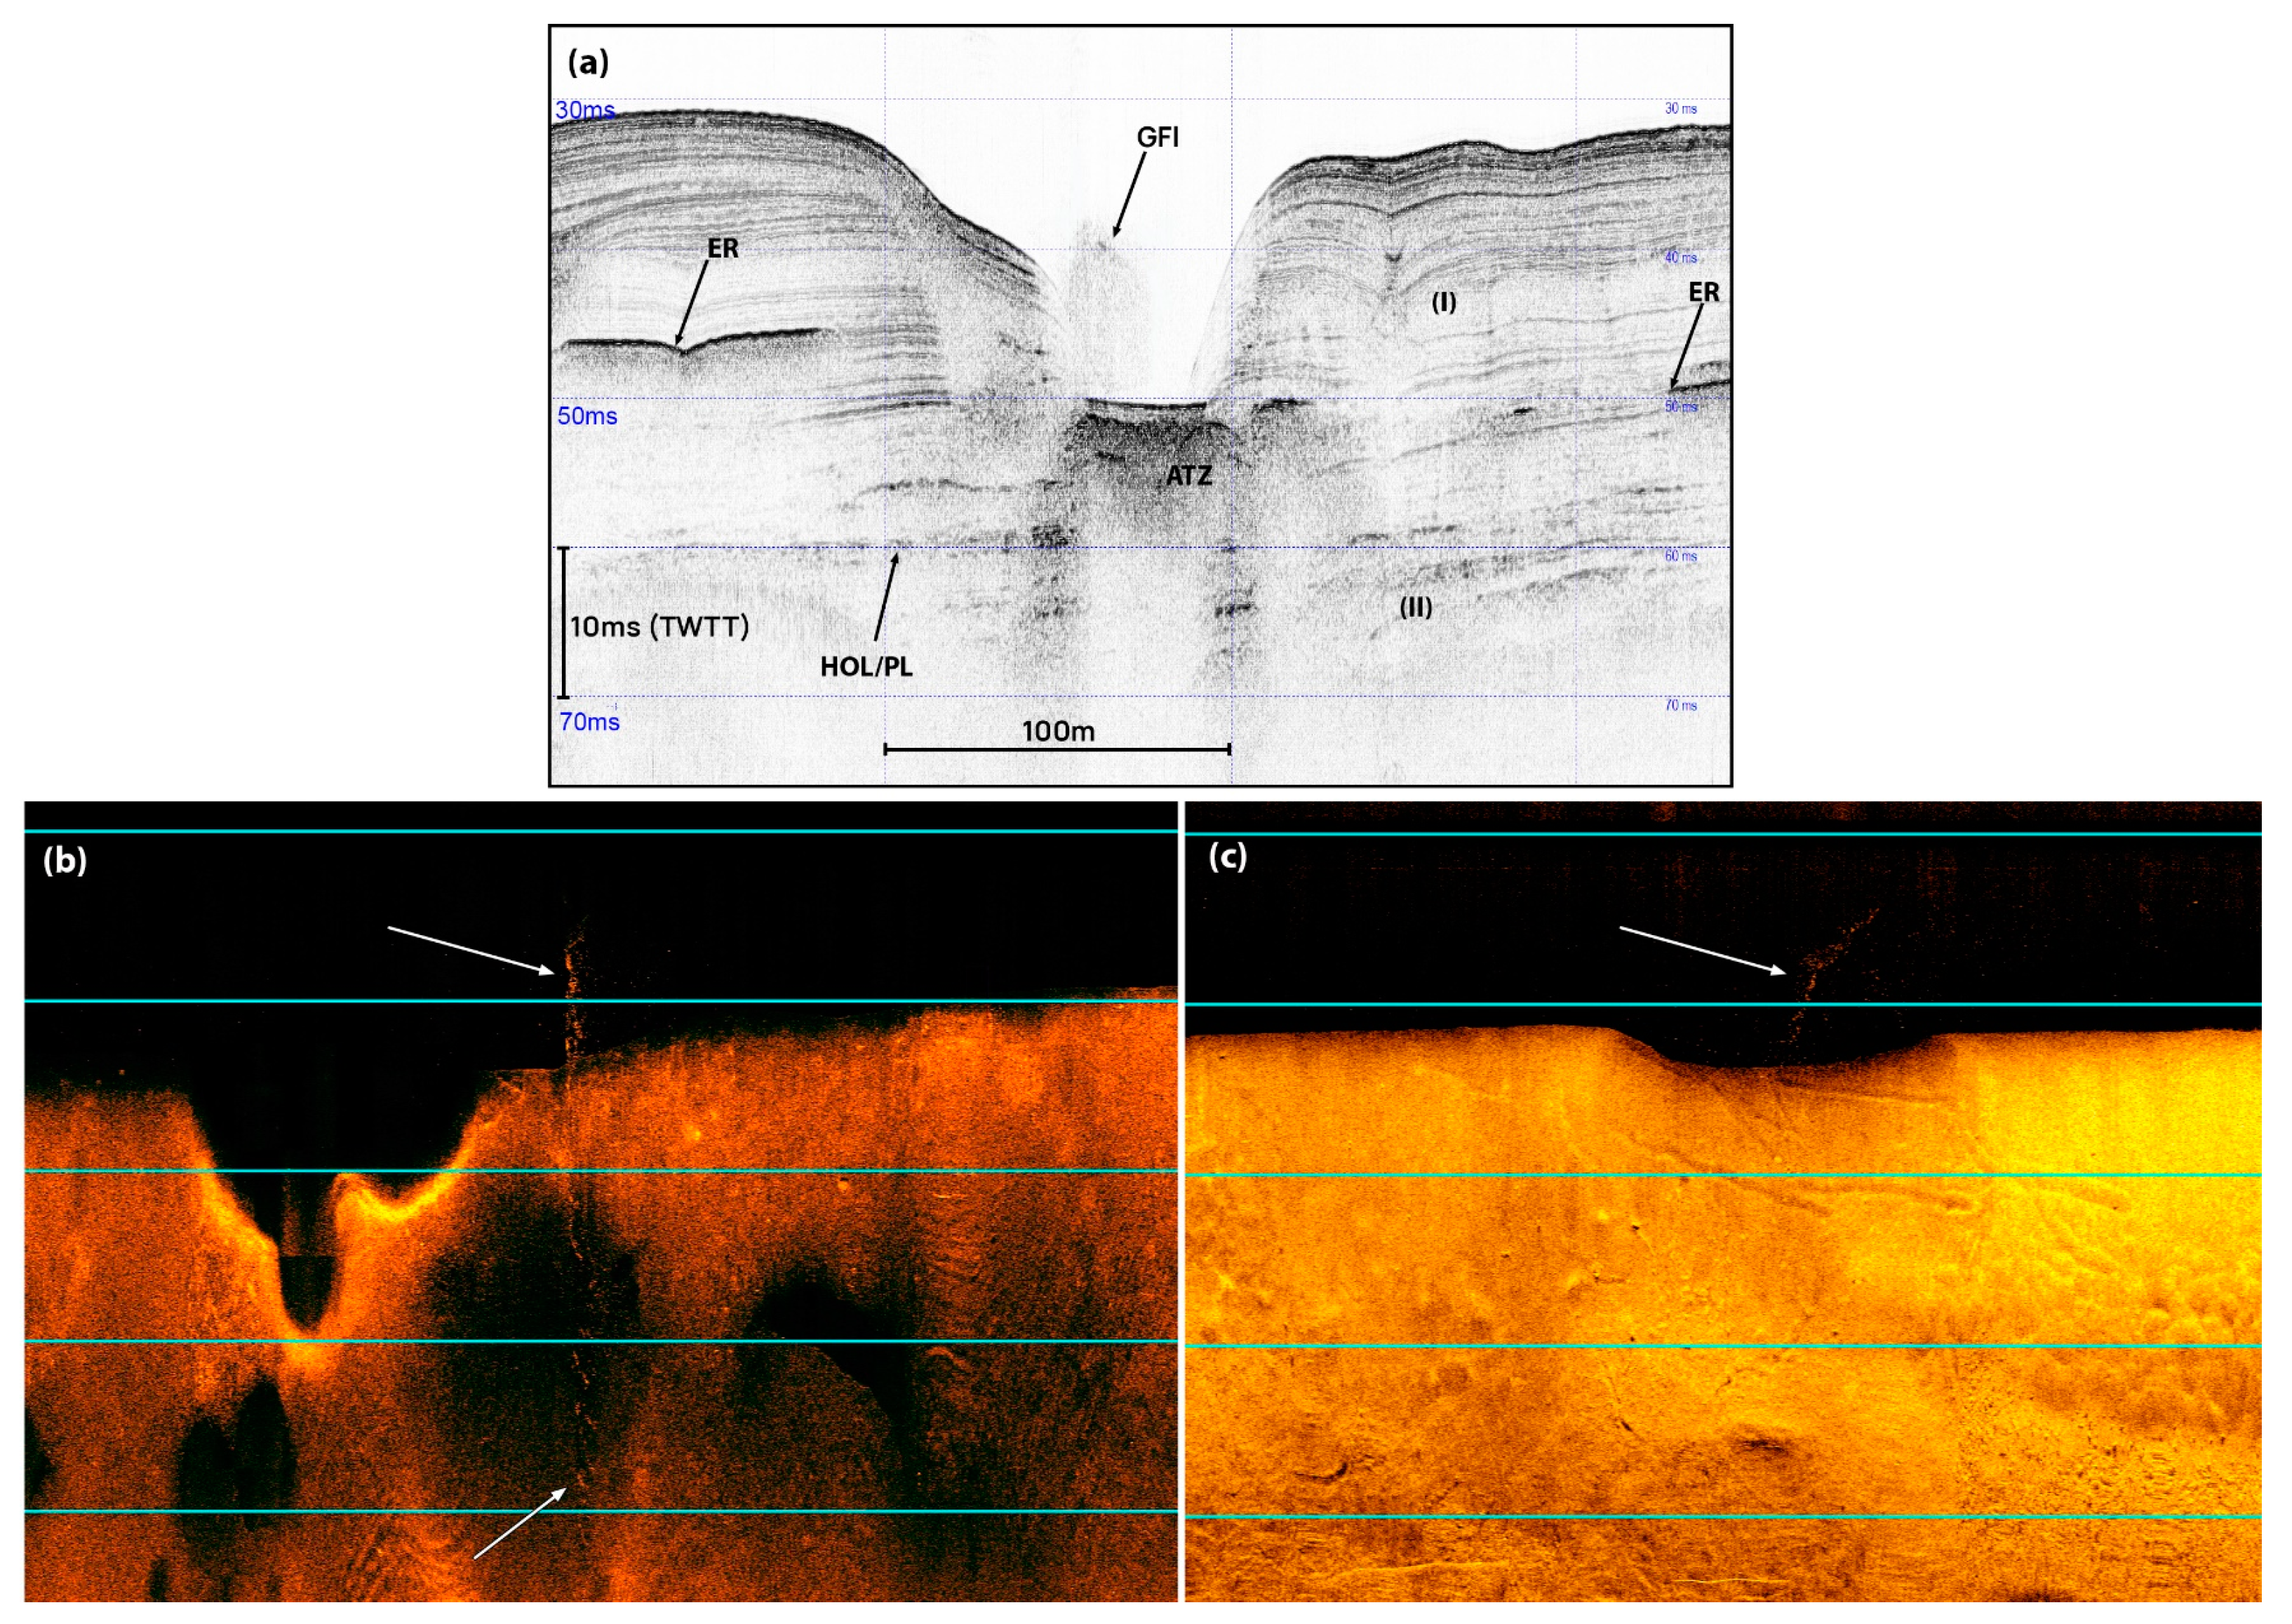
3.1.4. Pockmarks Venting
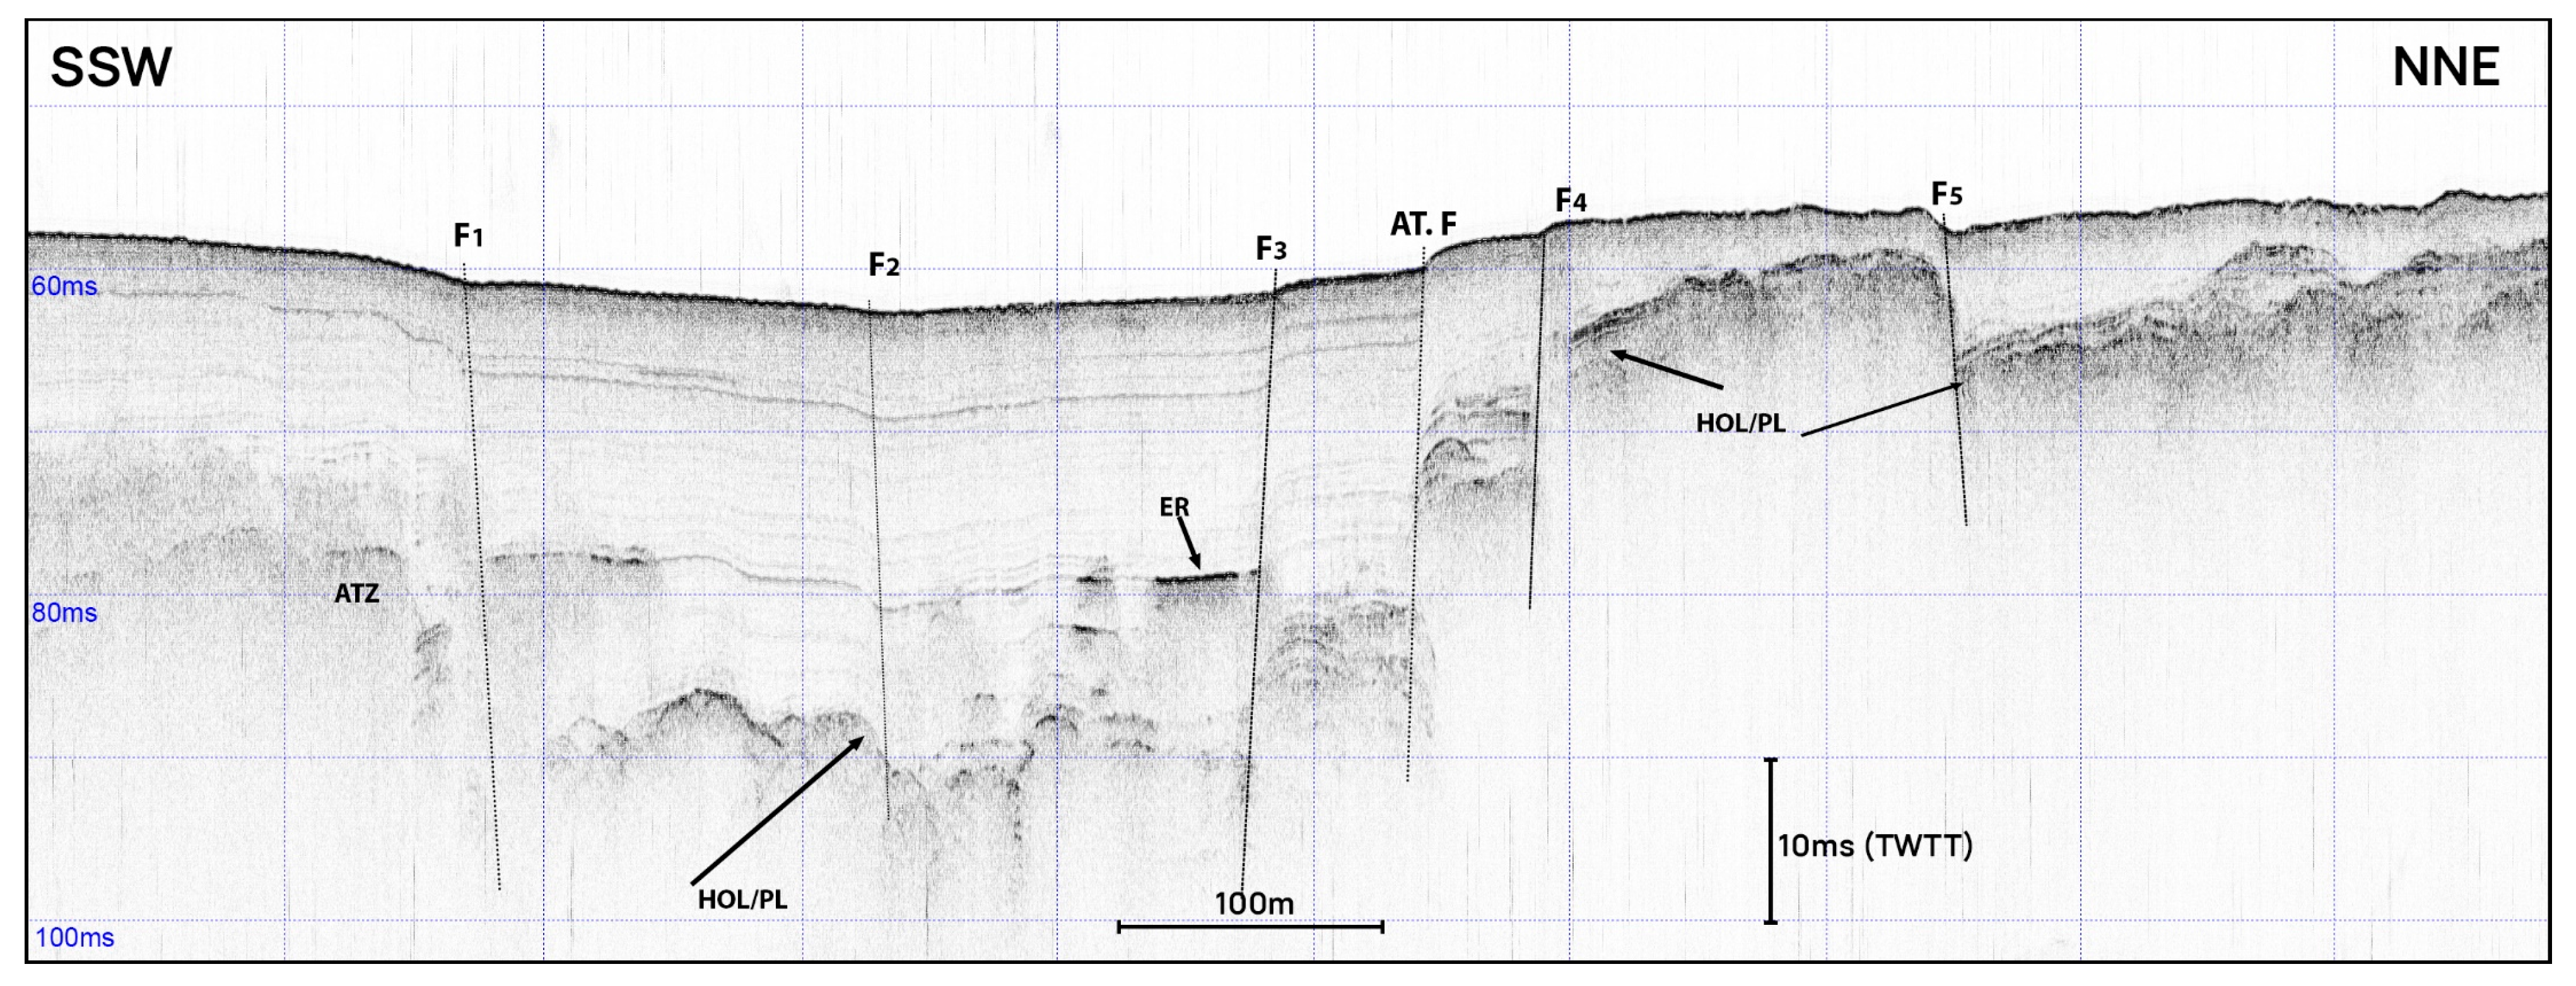
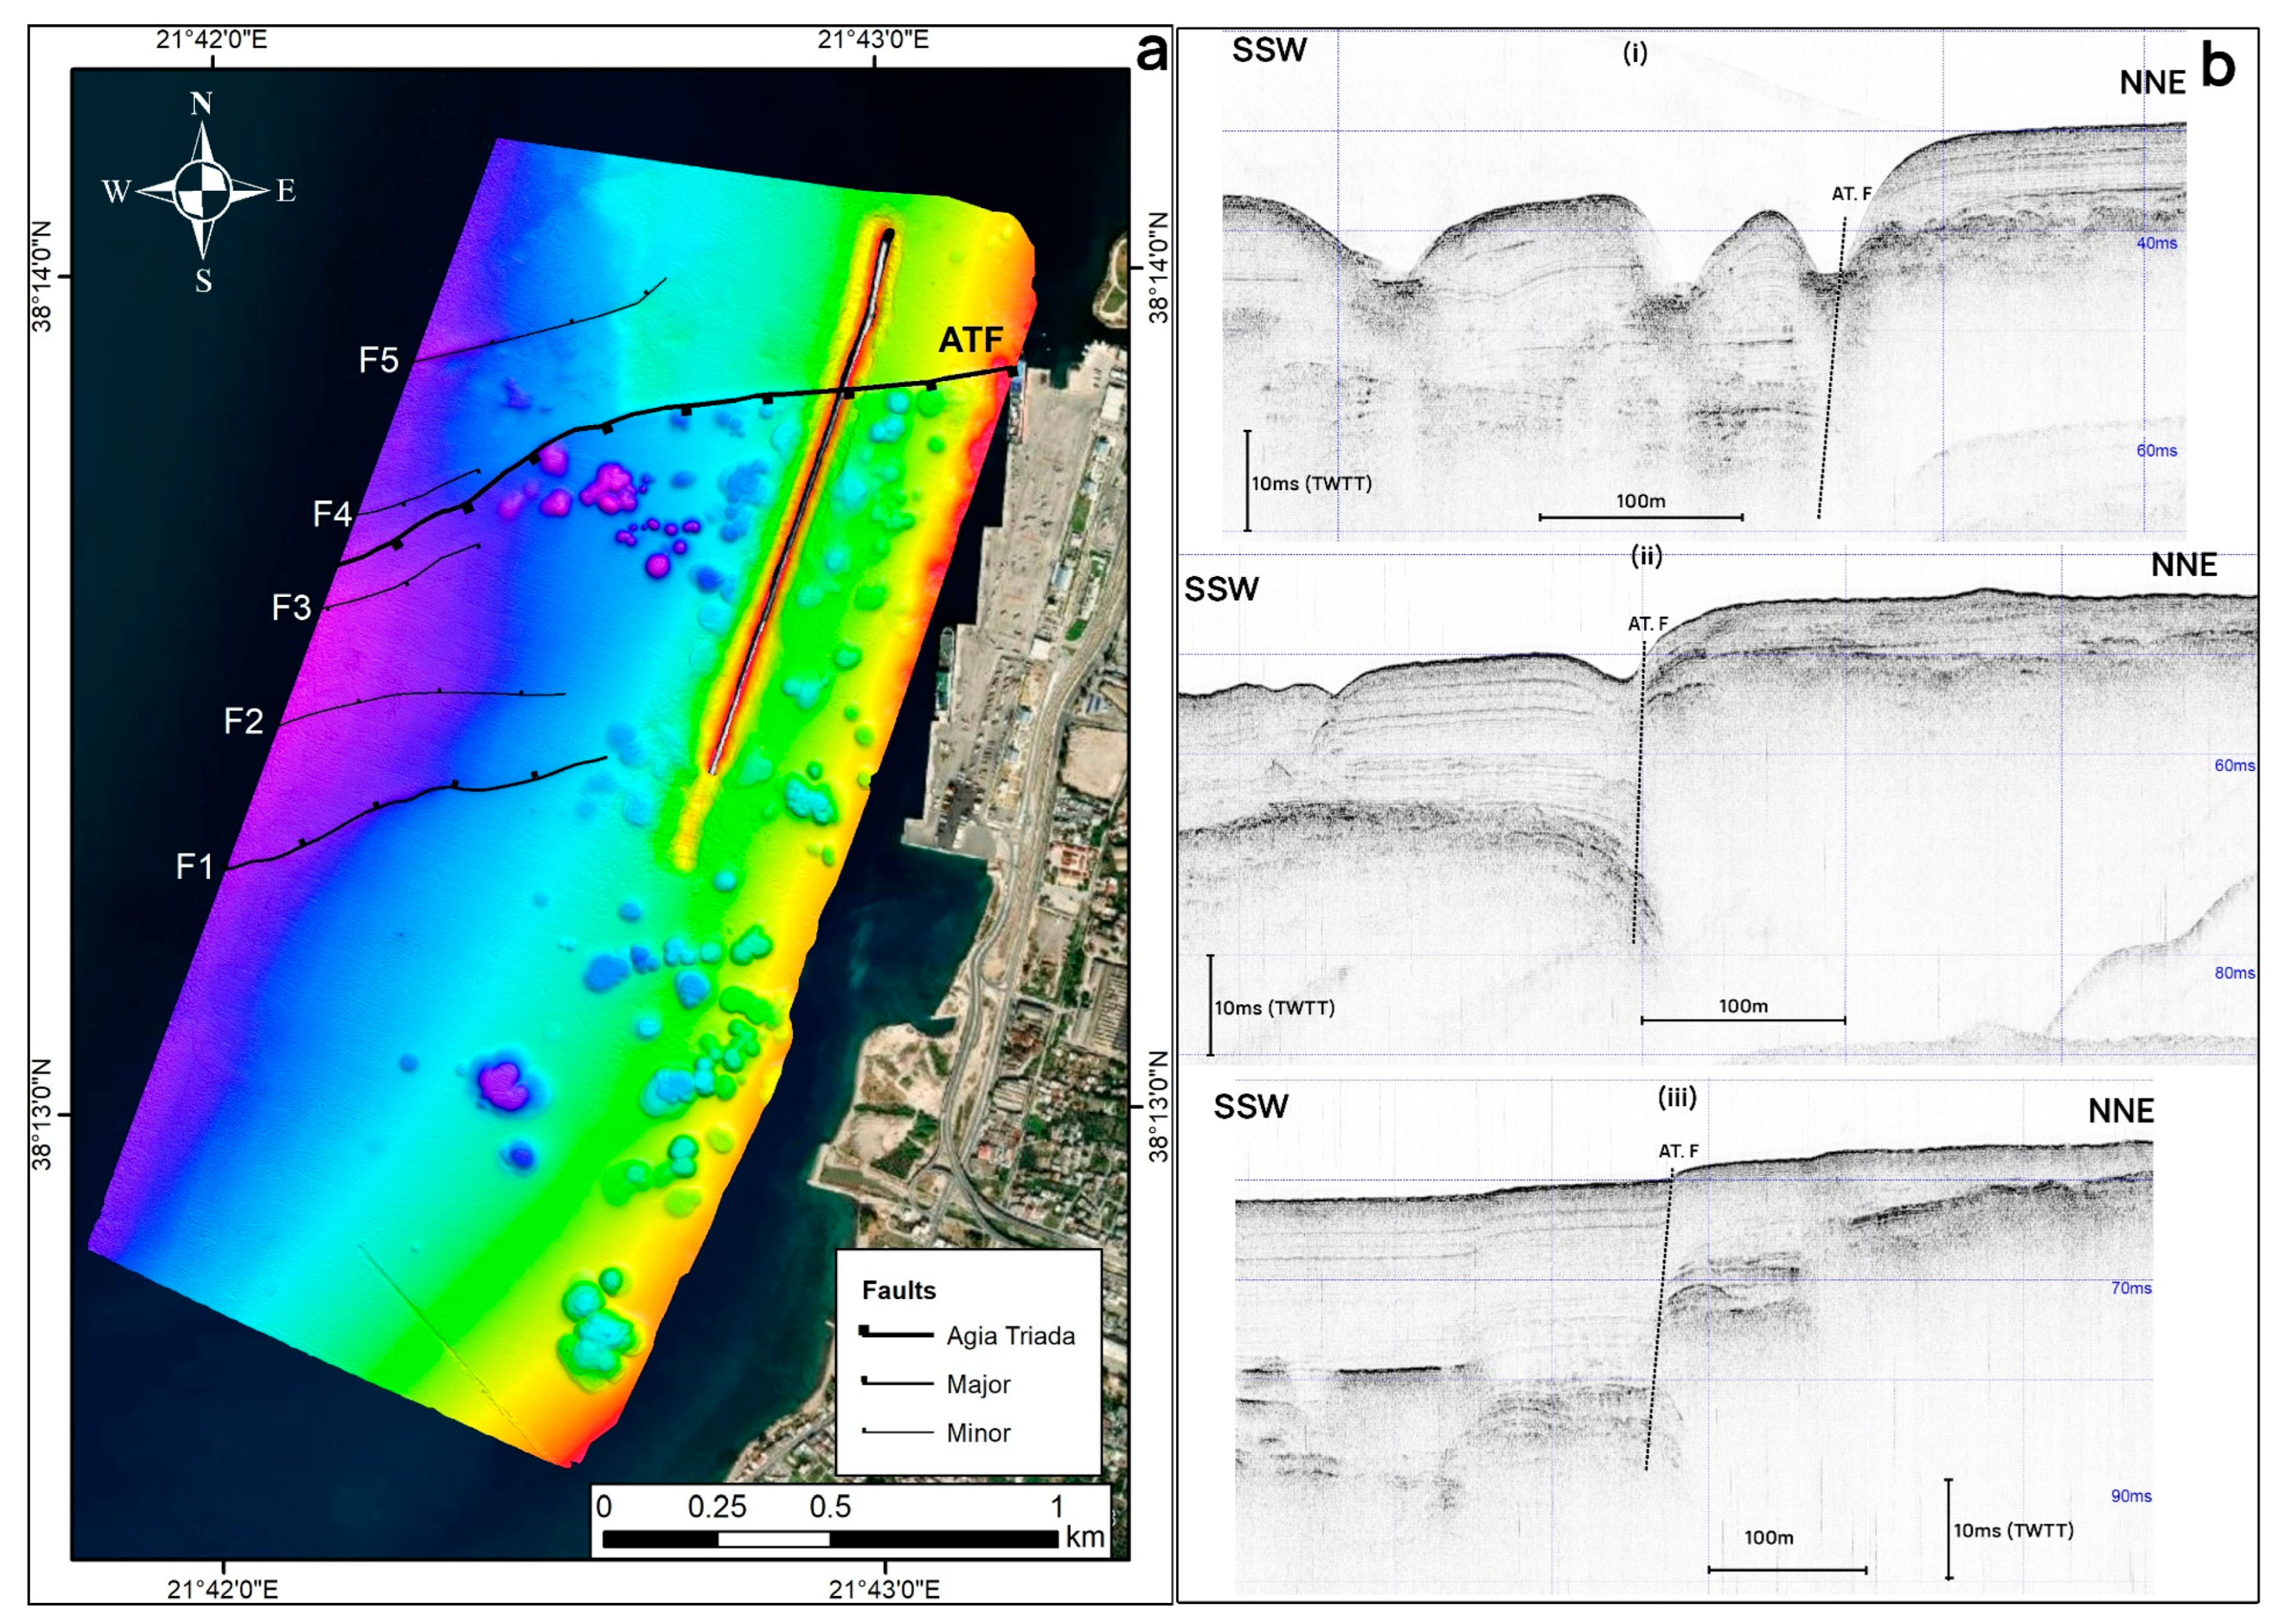
3.1.5. Active Faulting in the Pockmark Field
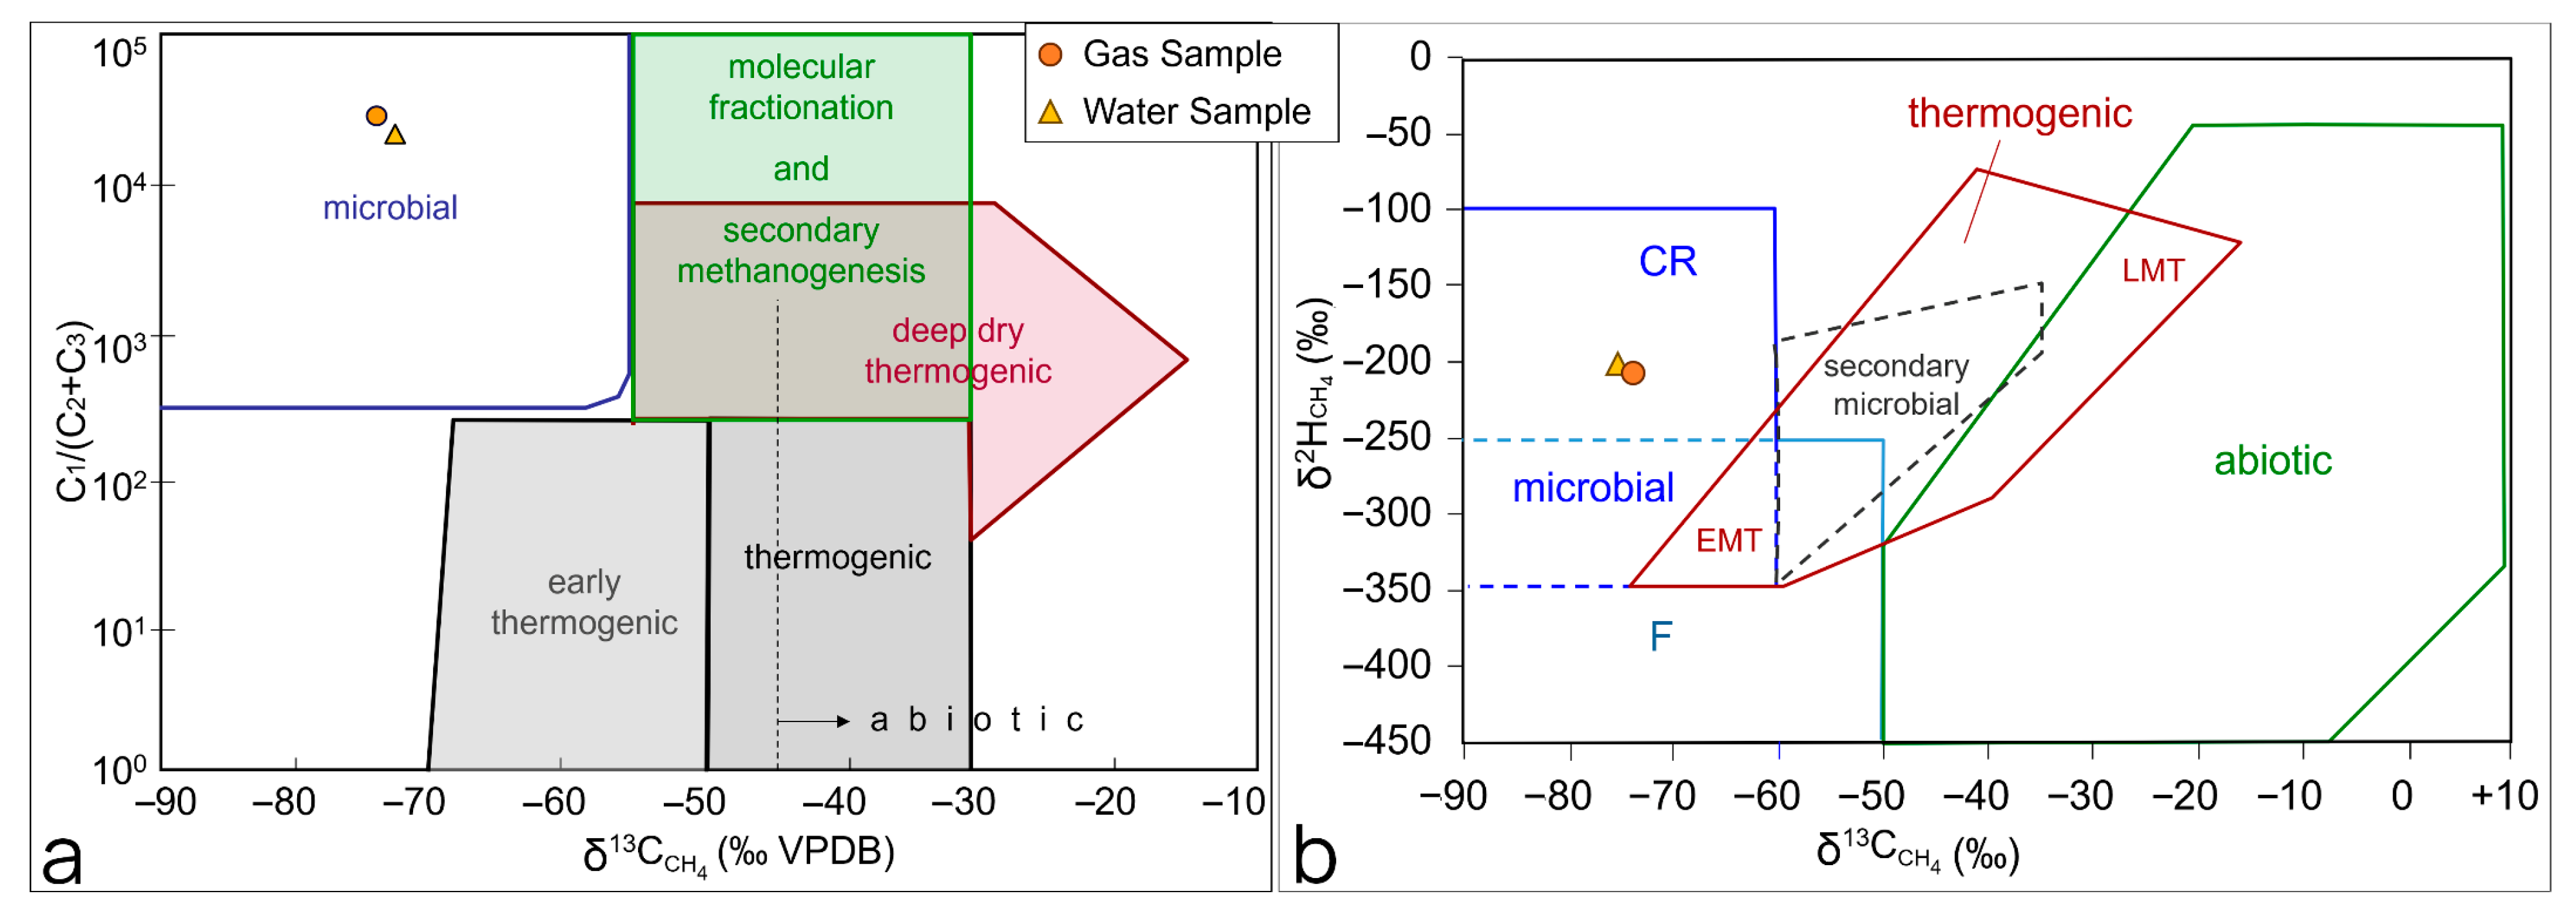
3.2. Methane Origin
4. Discussion
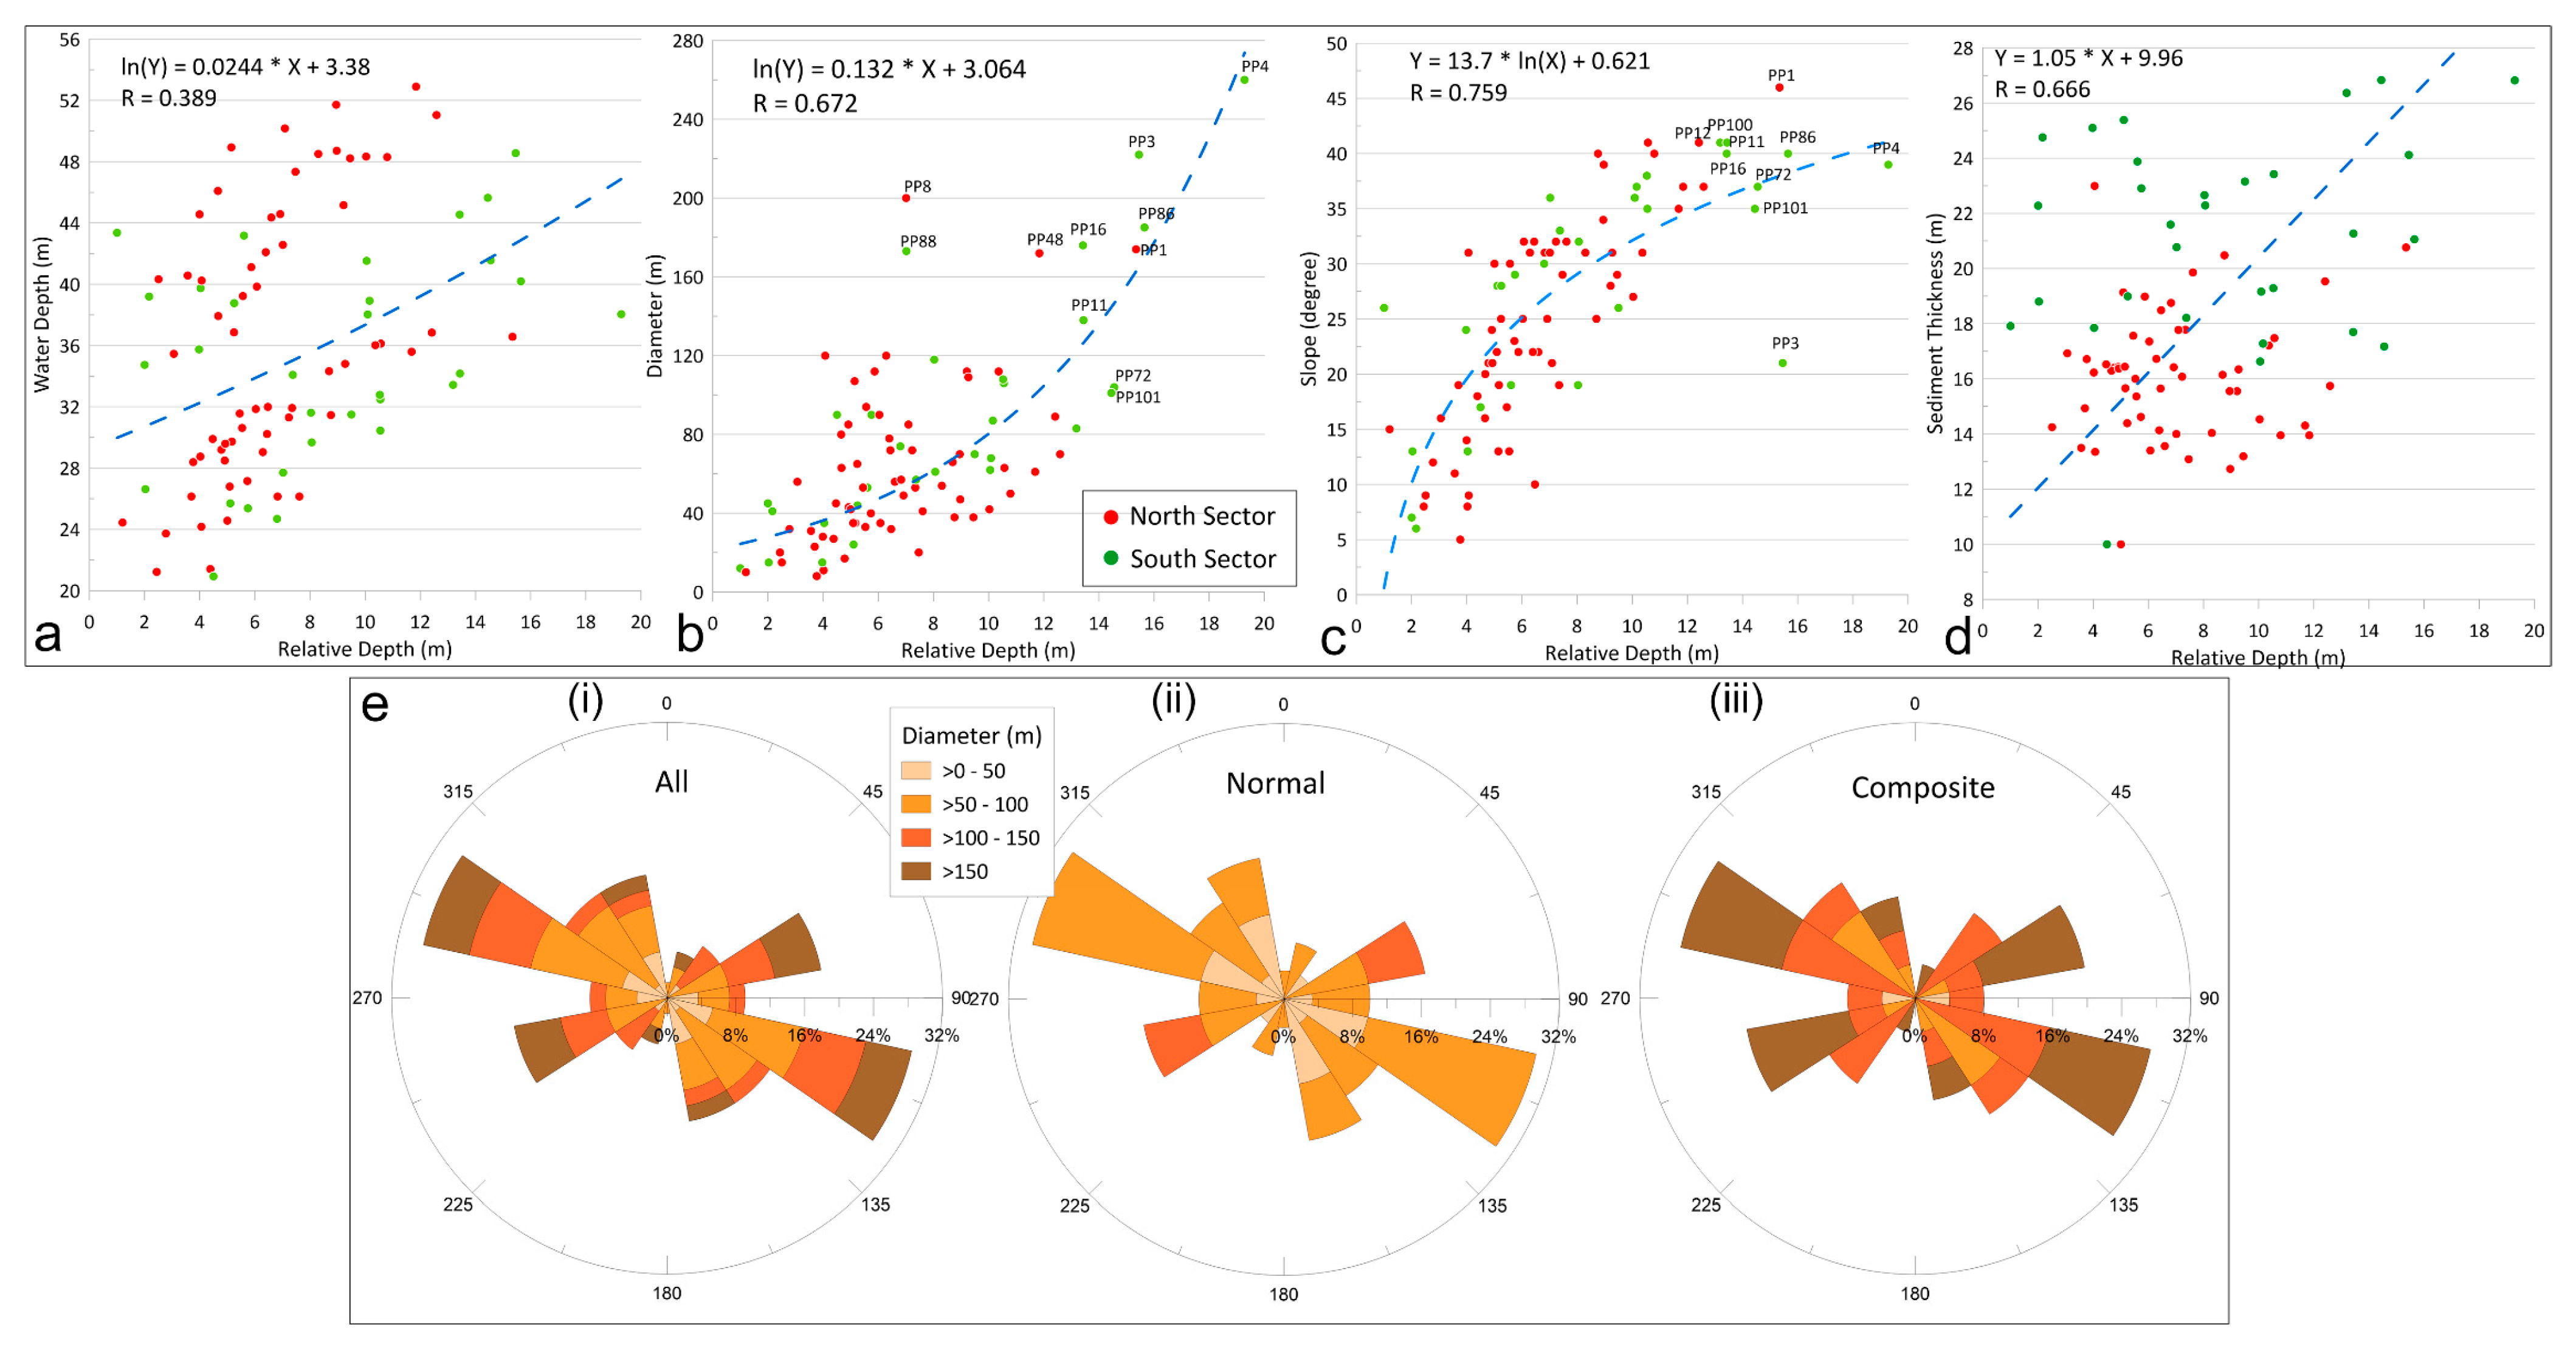
4.1. Pockmarks Spatial Distribution and Morphometry
4.2. Relation to Faults and Subsurface Characteristics
4.3. Pockmark Field Gas Origin
4.4. Pockmark Field Activation
5. Conclusions
- The main mechanisms for the development of the field are the local tectonism and the internal characteristics of the sedimentary layers.
- The local faulting appears to be the main contributor to the arrangement of the field, as it was shown to regulate the density, spatial distribution and geometry of the pockmark shapes in the field. All these morphometric characteristics are in line with the direction of the main active faults and the associated tectonic failures recorded in the region.
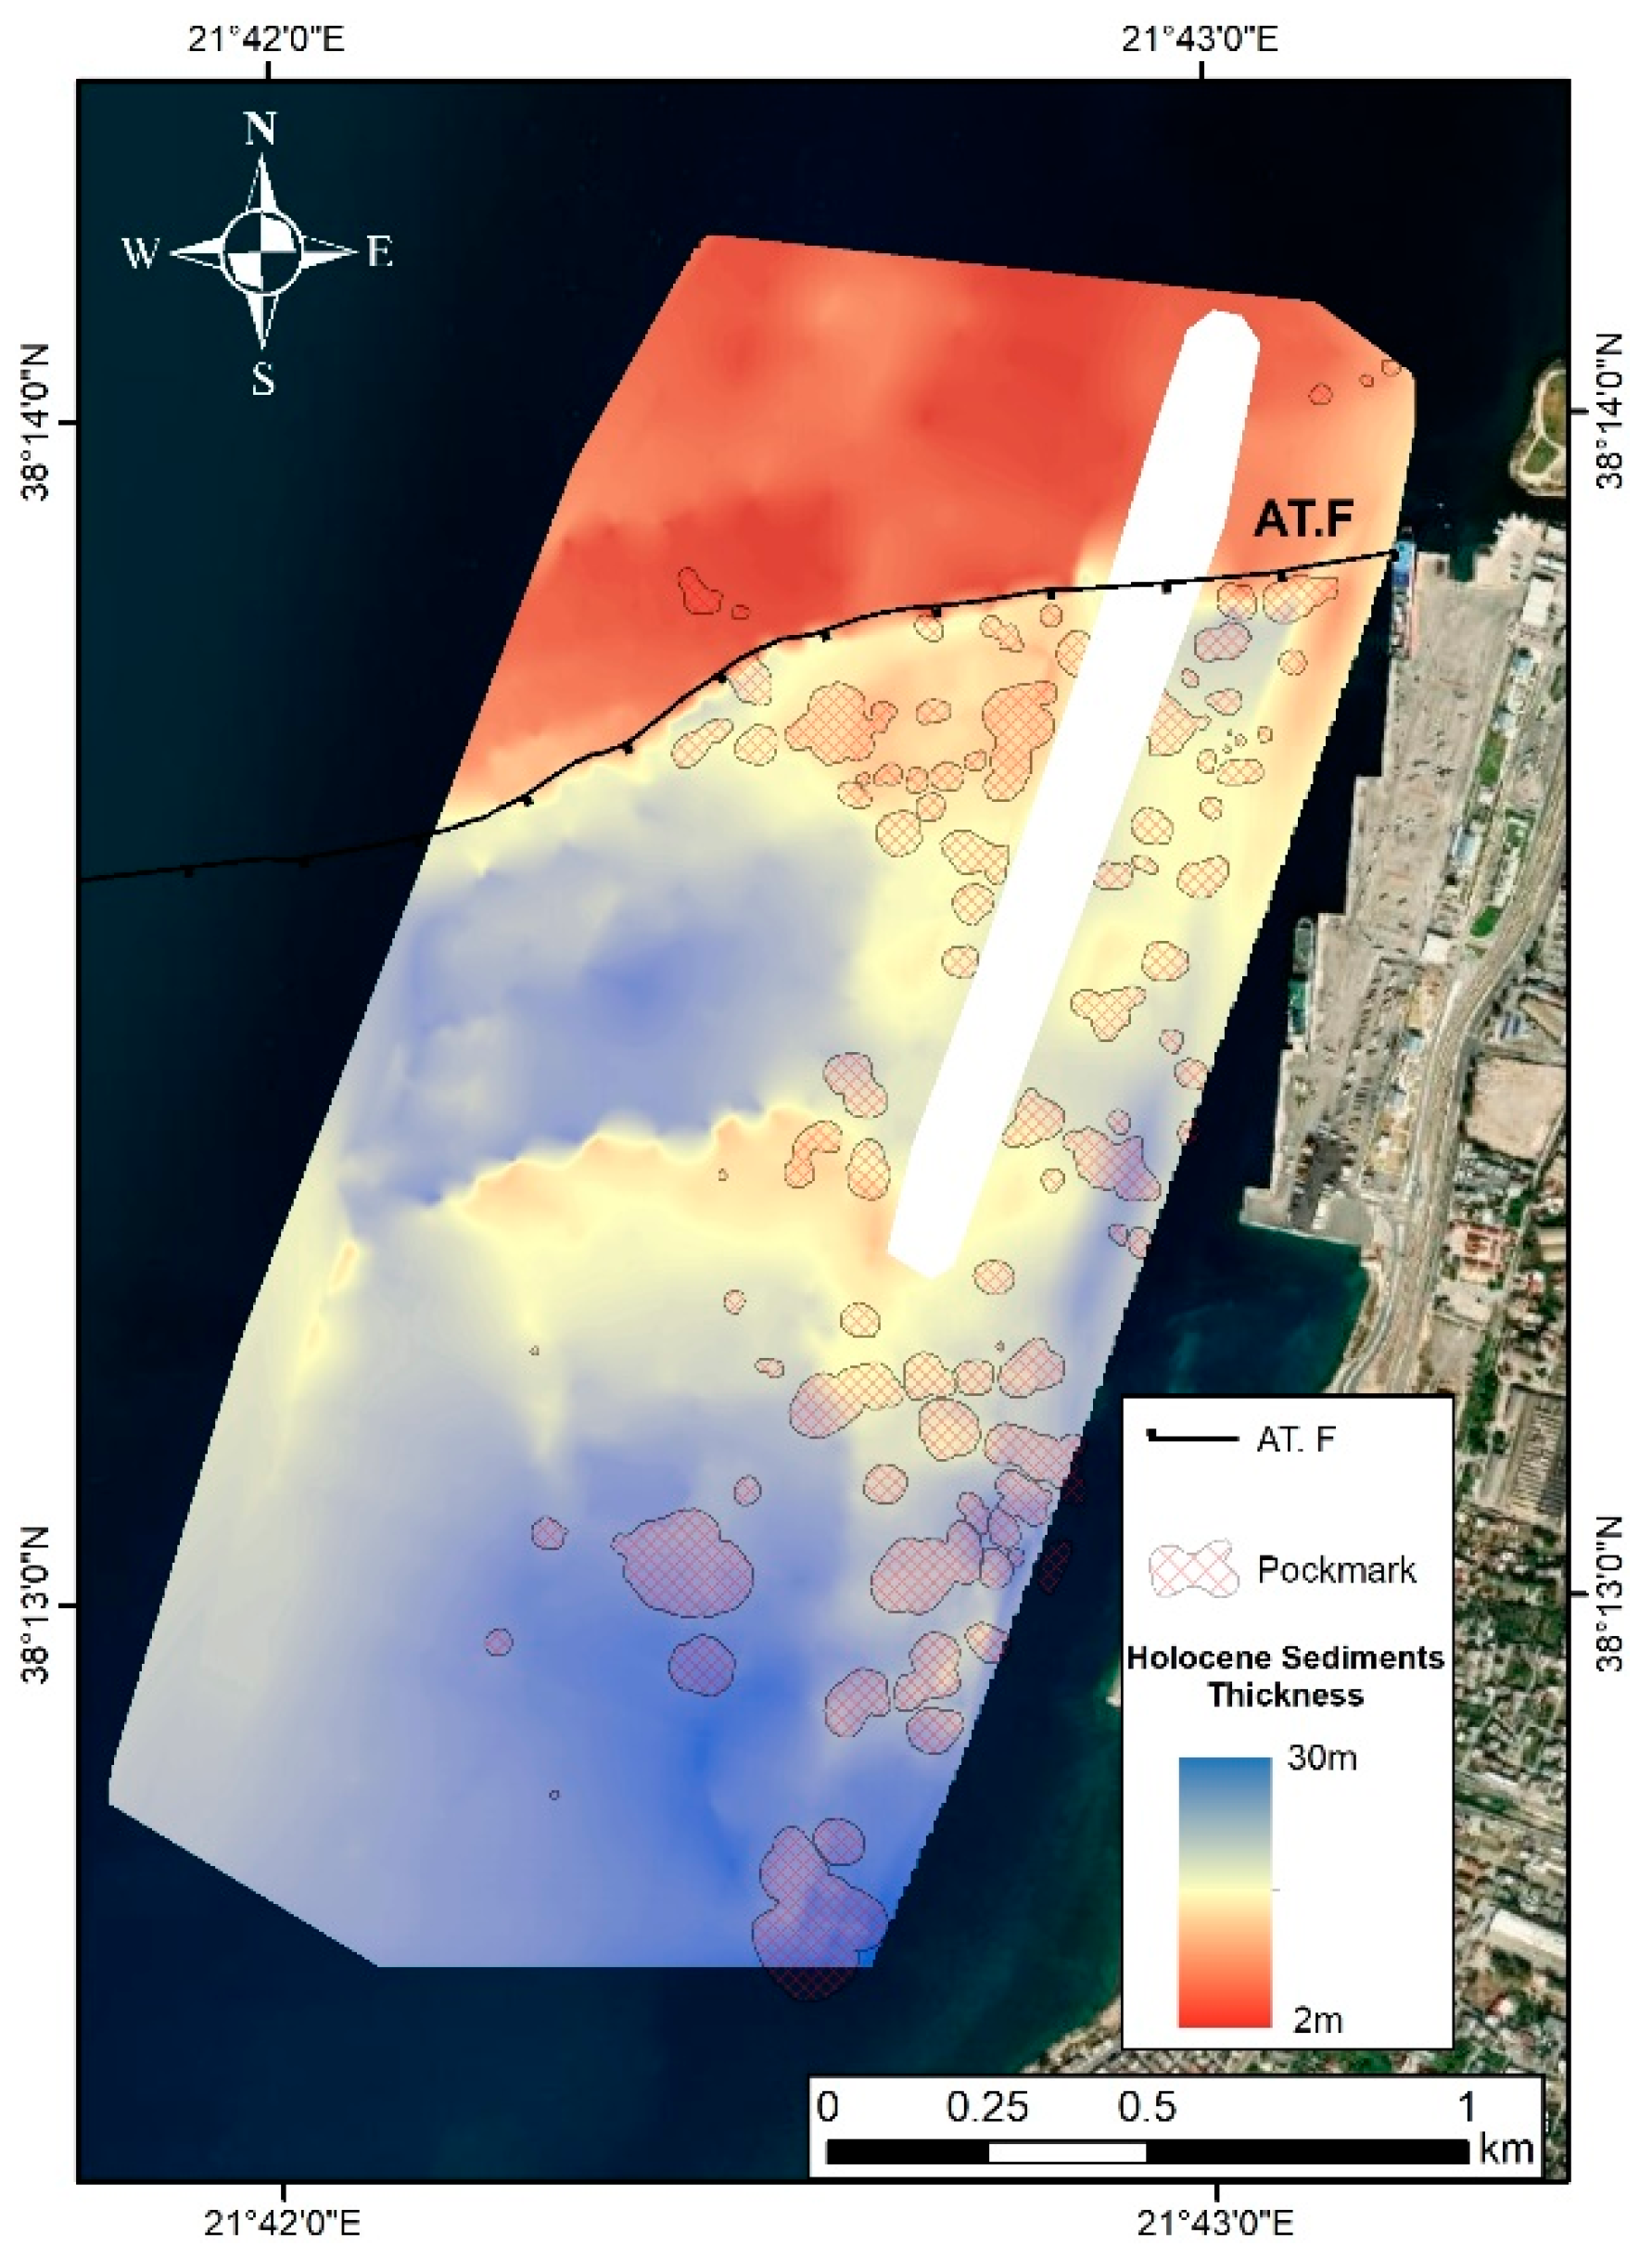
- The lithological parameters and the thickness of the upper sedimentary deposits in the examined area also contributed to the formation of the field. Thick, muddy deposits enhance the development of pockmarks in terms of quantity (high number of pockmarks) and sizes (large sizes) of pockmarks.
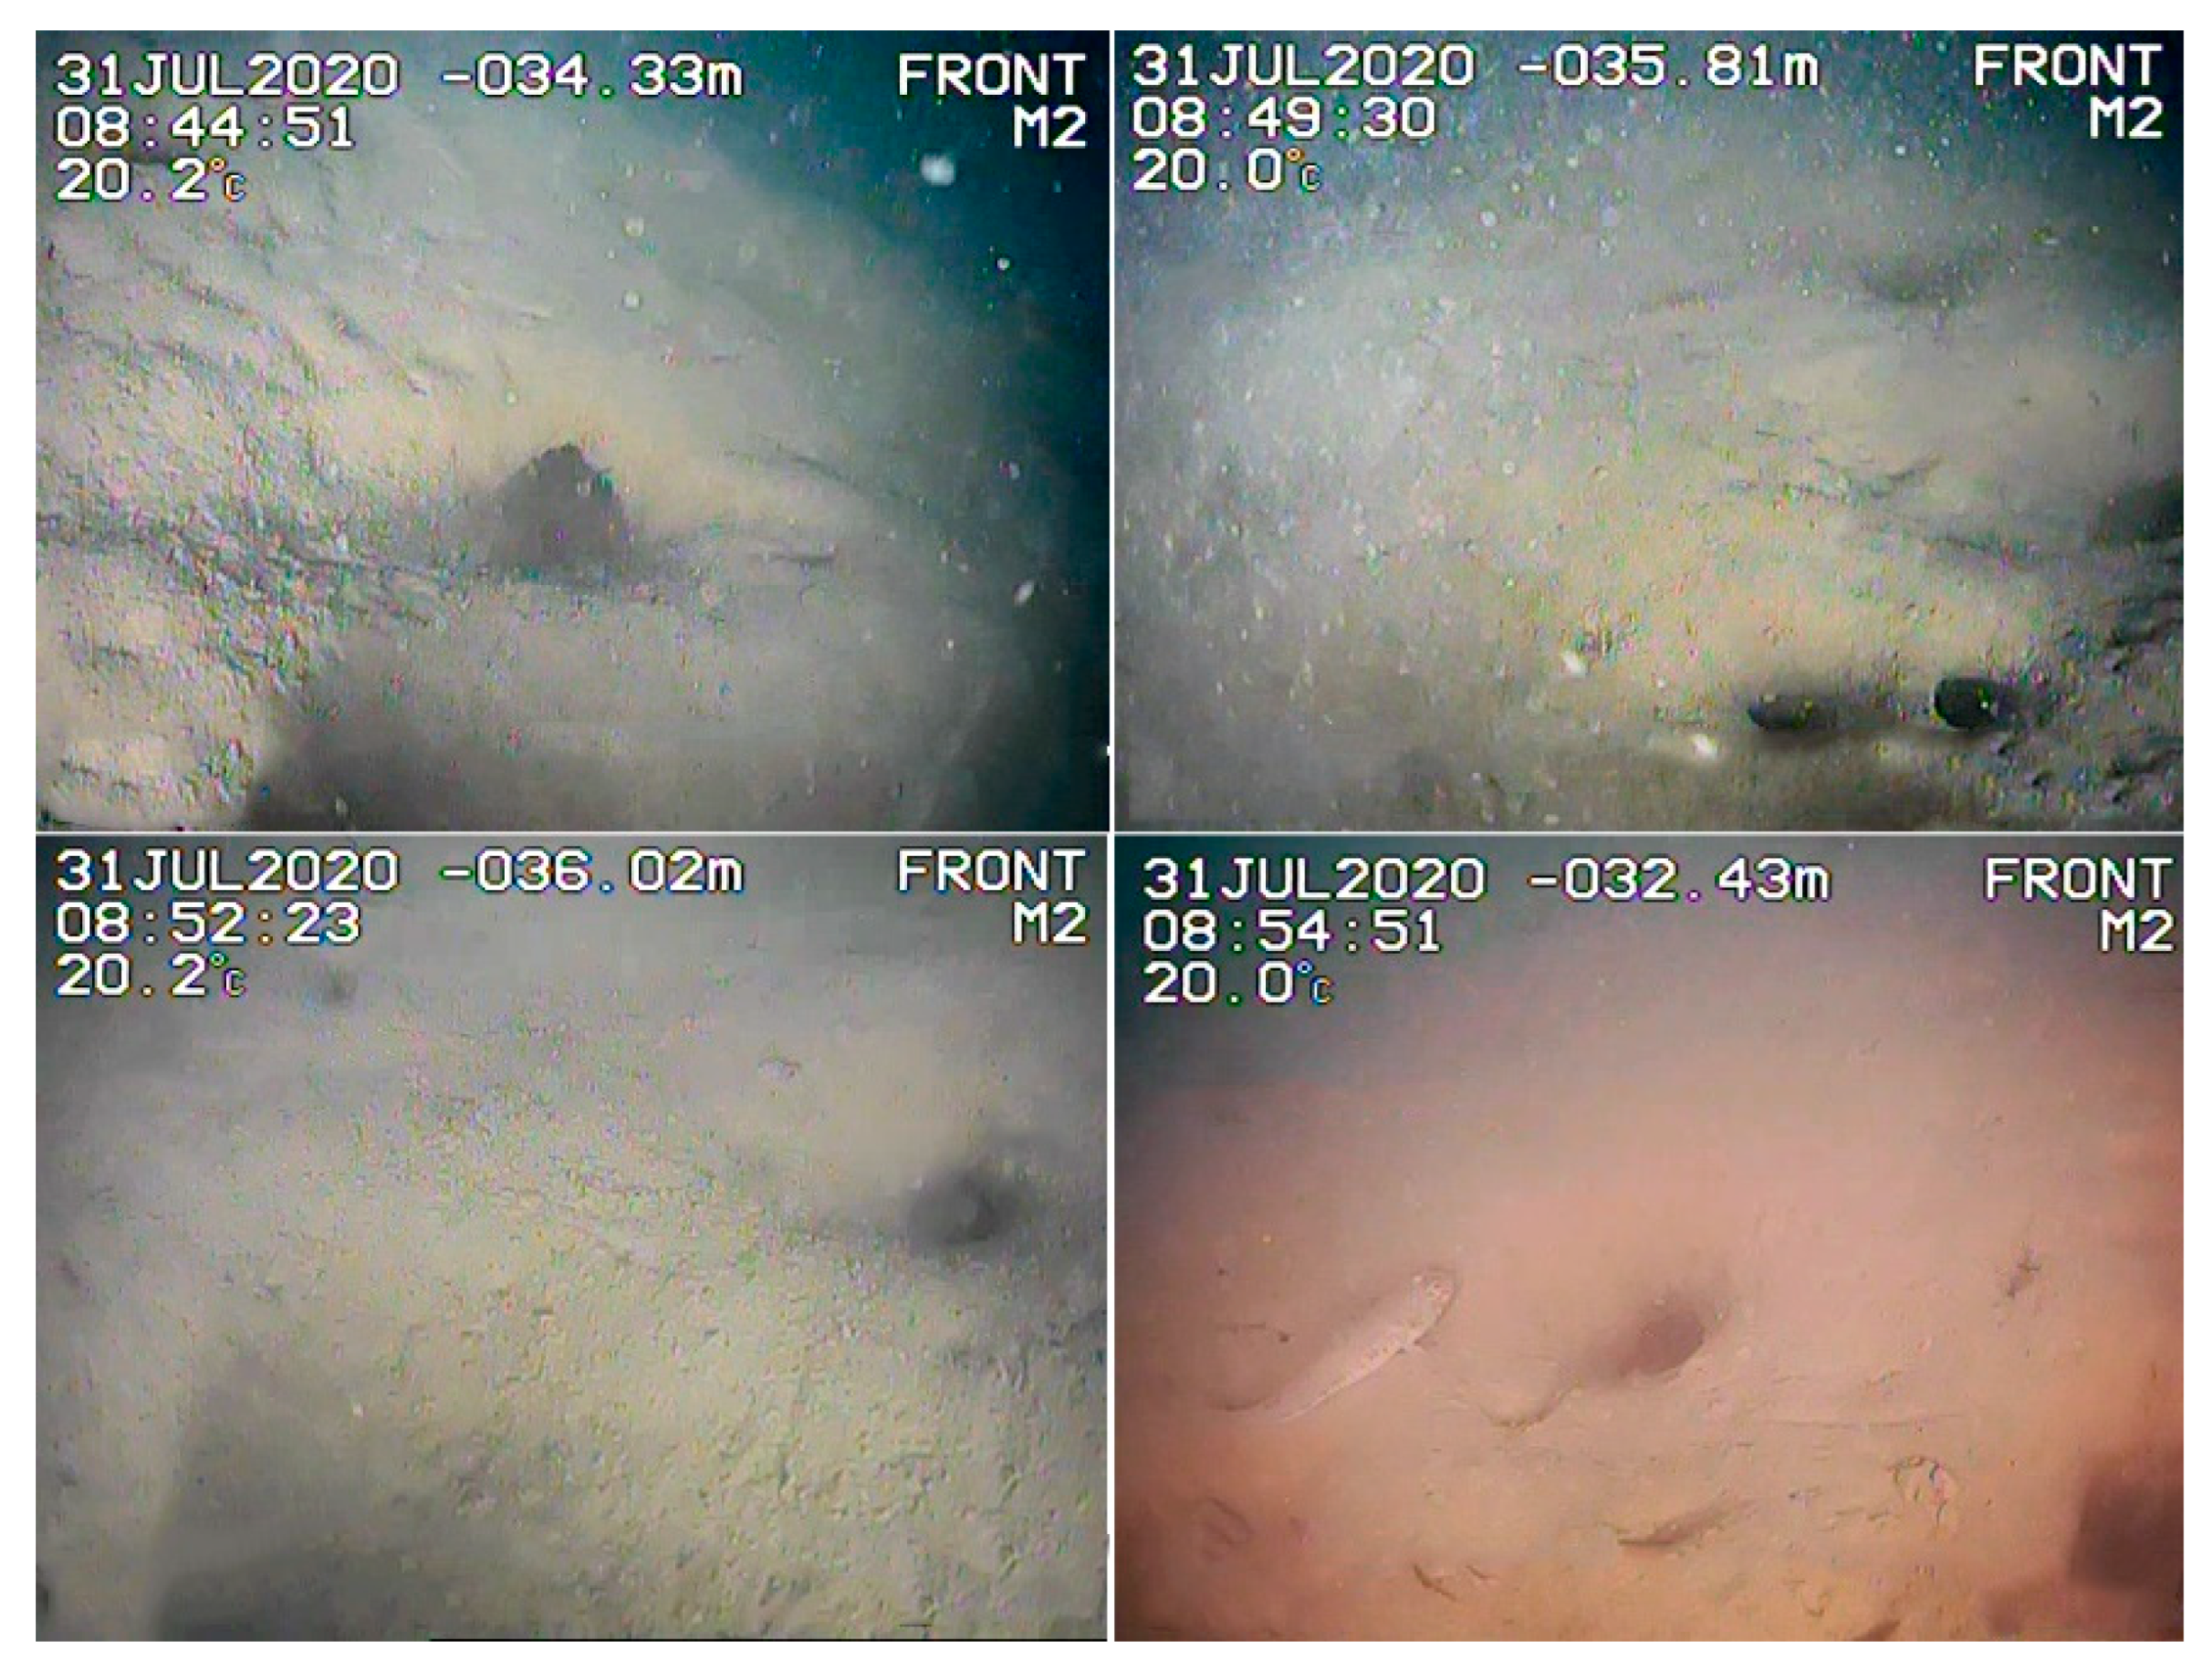
- Pockmarks recorded have steep sidewalls (up to 40°), suggesting recent activation. Steep slopes (at least >20°) seem to promote slumping events in the pockmarks. No acoustical or optical evidence of benthic ecosystems linked with gas seepages was recorded.
- The combined acoustic data sets detected, in detail, the migrated gas in marine sediments and the water column. The sediments provide evidence for the presence of gas by the recordings of Acoustic Turbidity Zones (ATZs), Enhanced Reflectors (ER) and, to a lesser extent, Intrasedimentary Gas Plumes (IGP). Evidence for the gas in the water column was revealed by the gas flare recordings.
- Geochemical analysis showed that CH4 is the dominant component of the released fluid, and its isotopic analysis showed a microbial origin, which is common in shallow marine environments.
- Although the source of the gas flare pockmarks changes through time, the fact that gas flares are always recorded above the field denotes an ongoing pockmark activity.
- Through time, local and regional, active tectonic processes and possibly recent anthropogenic activities (construction of the harbour) alter the migration paths of the escaping gas and cause modifications in the growth of the field. The field serves as a living underwater landscape, which has the potential to respond directly to seismic activity, even as a precursory response to earthquakes.
- This study showed that multidisciplinary surveying, incorporating marine geophysical and laboratory investigations, can illuminate aspects of a pockmark field in relation to configuration, structure, activity and triggering mechanisms.
Author Contributions
Funding
Institutional Review Board Statement
Informed Consent Statement
Data Availability Statement
Acknowledgments
Conflicts of Interest
References
- Hovland, M.; Judd, A.G. Seabed Pockmarks and Seepages: Impact on Geology, Biology and the Marine Environment; Graham & Trotman: London, UK, 1988. [Google Scholar]
- Harrington, P.K. Formation of Pockmarks by Pore-Water Escape. Geo-Mar. Lett. 1985, 5, 193–197. [Google Scholar] [CrossRef]
- Whiticar, M.J. Diagenetic Relationships of Methanogenesis, Nutrients, Acoustic Turbidity, Pockmarks and Freshwater Seepages in Eckernförde Bay. Mar. Geol. 2002, 182, 29–53. [Google Scholar] [CrossRef]
- Jordan, S.F.; O’Reilly, S.S.; Praeg, D.; Dove, D.; Facchin, L.; Romeo, R.; Szpak, M.; Monteys, X.; Murphy, B.T.; Scott, G.; et al. Geophysical and Geochemical Analysis of Shallow Gas and an Associated Pockmark Field in Bantry Bay, Co. Cork, Ireland. Estuar. Coast Shelf Sci. 2019, 225, 106232. [Google Scholar] [CrossRef]
- Krämer, K.; Holler, P.; Herbst, G.; Bratek, A.; Ahmerkamp, S.; Neumann, A.; Bartholomä, A.; Van Beusekom, J.E.E.; Holtappels, M.; Winter, C. Abrupt Emergence of a Large Pockmark Field in the German Bight, Southeastern North Sea. Sci. Rep. 2017, 7, 5150. [Google Scholar] [CrossRef] [PubMed]
- Vaular, E.N.; Barth, T.; Haflidason, H. The Geochemical Characteristics of the Hydrate-Bound Gases from the Nyegga Pockmark Field, Norwegian Sea. Org. Geochem. 2010, 41, 437–444. [Google Scholar] [CrossRef]
- Solheim, A.; Elverhøi, A. A Pockmark Field in the Central Barents Sea; Gas from a Petrogenic Source? Polar Res. 1985, 3, 11–19. [Google Scholar] [CrossRef]
- Gay, A.; Lopez, M.; Ondreas, H.; Charlou, J.L.; Sermondadaz, G.; Cochonat, P. Seafloor Facies Related to Upward Methane Flux within a Giant Pockmark of the Lower Congo Basin. Mar. Geol. 2006, 226, 81–95. [Google Scholar] [CrossRef]
- Roy, S.; Senger, K.; Hovland, M.; Römer, M.; Braathen, A. Geological Controls on Shallow Gas Distribution and Seafloor Seepage in an Arctic Fjord of Spitsbergen, Norway. Mar. Pet. Geol. 2019, 107, 237–254. [Google Scholar] [CrossRef]
- Micallef, A.; Averes, T.; Hoffmann, J.; Crutchley, G.; Mountjoy, J.J.; Person, M.; Cohen, D.; Woelz, S.; Bury, S.J.; Ahaneku, C.V.; et al. Multiple Drivers and Controls of Pockmark Formation across the Canterbury Margin, New Zealand. Basin Res. 2022, 34, 1374–1399. [Google Scholar] [CrossRef]
- Coughlan, M.; Roy, S.; O’Sullivan, C.; Clements, A.; O’Toole, R.; Plets, R. Geological Settings and Controls of Fluid Migration and Associated Seafloor Seepage Features in the North Irish Sea. Mar. Pet. Geol. 2021, 123, 104762. [Google Scholar] [CrossRef]
- Panieri, G.; Bünz, S.; Fornari, D.J.; Escartin, J.; Serov, P.; Jansson, P.; Torres, M.E.; Johnson, J.E.; Hong, W.L.; Sauer, S.; et al. An Integrated View of the Methane System in the Pockmarks at Vestnesa Ridge, 79° N. Mar. Geol. 2017, 390, 282–300. [Google Scholar] [CrossRef]
- de Prunelé, A.; Ruffine, L.; Riboulot, V.; Peters, C.A.; Croguennec, C.; Guyader, V.; Pape, T.; Bollinger, C.; Bayon, G.; Caprais, J.C.; et al. Focused Hydrocarbon-Migration in Shallow Sediments of a Pockmark Cluster in the Niger Delta (Off Nigeria). Geochem. Geophys. Geosyst. 2017, 18, 93–112. [Google Scholar] [CrossRef]
- King, L.H.; MacLean, B. Pockmarks on the Scotian Shelf. Bull. Geol. Soc. Am. 1970, 81, 3141–3148. [Google Scholar] [CrossRef]
- Roelofse, C.; Alves, T.M.; Gafeira, J. Structural Controls on Shallow Fluid Flow and Associated Pockmark Fields in the East Breaks Area, Northern Gulf of Mexico. Mar. Pet. Geol. 2020, 112, 104074. [Google Scholar] [CrossRef]
- Papatheodorou, G.; Hasiotis, T.; Ferentinos, G. Gas-Charged Sediments in the Aegean and Ionian Seas, Greece. Mar. Geol. 1993, 112, 171–184. [Google Scholar] [CrossRef]
- Serié, C.; Huuse, M.; Schødt, N.H.; Brooks, J.M.; Williams, A. Subsurface Fluid Flow in the Deep-Water Kwanza Basin, Offshore Angola. Basin Res. 2017, 29, 149–179. [Google Scholar] [CrossRef]
- Toker, M.; Tur, H. Shallow Seismic Characteristics and Distribution of Gas in Lacustrine Sediments at Lake Erçek, Eastern Anatolia, Turkey, from High-Resolution Seismic Data. Environ. Earth Sci. 2021, 80, 727. [Google Scholar] [CrossRef]
- Cojean, A.N.Y.; Kremer, K.; Bartosiewicz, M.; Fabbri, S.C.; Lehmann, M.F.; Wirth, S.B. Morphology, Formation, and Activity of Three Different Pockmark Systems in Peri-Alpine Lake Thun, Switzerland. Front. Water 2021, 3, 666641. [Google Scholar] [CrossRef]
- Wenau, S.; Spieß, V.; Pape, T.; Fekete, N. Controlling Mechanisms of Giant Deep Water Pockmarks in the Lower Congo Basin. Mar. Pet. Geol. 2017, 83, 140–157. [Google Scholar] [CrossRef]
- Lawal, M.A.; Bialik, O.M.; Lazar, M.; Waldmann, N.D.; Foubert, A.; Makovsky, Y. Modes of Gas Migration and Seepage on the Salt-Rooted Palmahim Disturbance, Southeastern Mediterranean. Mar. Pet. Geol. 2023, 153, 106256. [Google Scholar] [CrossRef]
- Hovland, M. Elongated Depressions Associated with Pockmarks in the Western Slope of the Norwegian Trench. Mar. Geol. 1983, 51, 35–46. [Google Scholar] [CrossRef]
- Acosta, J.; Munoz, A.; Herranz, P.; Palomo, C.; Ballesteros, M.; Vaquero, M.; Uchupi, E. Pockmarks in the Ibiza Channel and Western End of the Balearic Promontory (Western Mediterranean) Revealed by Multibeam Mapping. Geo-Mar. Lett. 2001, 21, 123–130. [Google Scholar] [CrossRef]
- Barrie, J.V.; Hill, P.R. Holocene Faulting on a Tectonic Margin: Georgia Basin, British Columbia, Canada. Geo-Mar. Lett. 2004, 24, 86–96. [Google Scholar] [CrossRef]
- Riedel, M.; Hähnel, L.; Bialas, J.; Bachmann, A.K.; Gaide, S.; Wintersteller, P.; Klaucke, I.; Bohrmann, G. Controls on Gas Emission Distribution on the Continental Slope of the Western Black Sea. Front. Earth Sci. 2021, 8, 601254. [Google Scholar] [CrossRef]
- Jia, X.; Chen, J.; Tong, S.; Azevedo, L.; Duan, M.; Xu, H.; Chen, S.; Yang, R.; Han, T. Research on the Characteristics of Fluid Escape near the Seabed in Bohai Bay. Geophys. Prospect. 2023. [Google Scholar] [CrossRef]
- Tasianas, A.; Bünz, S.; Bellwald, B.; Hammer, Ø.; Planke, S.; Lebedeva-Ivanova, N.; Krassakis, P. High-Resolution 3D Seismic Study of Pockmarks and Shallow Fluid Flow Systems at the Snøhvit Hydrocarbon Field in the SW Barents Sea. Mar. Geol. 2018, 403, 247–261. [Google Scholar] [CrossRef]
- Andrews, B.D.; Brothers, L.L.; Barnhardt, W.A. Automated Feature Extraction and Spatial Organization of Seafloor Pockmarks, Belfast Bay, Maine, USA. Geomorphology 2010, 124, 55–64. [Google Scholar] [CrossRef]
- Brothers, L.L.; Kelley, J.T.; Belknap, D.F.; Barnhardt, W.A.; Andrews, B.D.; Legere, C.; Hughes Clarke, J.E. Shallow Stratigraphic Control on Pockmark Distribution in North Temperate Estuaries. Mar. Geol. 2012, 329–331, 34–45. [Google Scholar] [CrossRef]
- Judd, A.G.; Hovland, M. Seabed Fluid Flow: The Impact of Geology, Biology and the Marine Environment; Cambridge University Press: Cambridge, UK, 2007; ISBN 9780521819503. [Google Scholar]
- Broster, B.E.; Legere, C.L. Seafloor Pockmarks and Gas Seepages, Northwestern Bay of Fundy, New Brunswick, Canada. Atl. Geol. 2018, 54, 1–20. [Google Scholar] [CrossRef]
- Field, M.E.; Jennings, A.E. Seafloor Gas Seeps Triggered by a Northern California Earthquake. Mar. Geol. 1987, 77, 39–51. [Google Scholar] [CrossRef]
- Kuşçu, I.; Okamura, M.; Matsuoka, H.; Gökaşan, E.; Awata, Y.; Tur, H.; Şimşek, M.; Keçer, M. Seafloor Gas Seeps and Sediment Failures Triggered by the August 17, 1999 Earthquake in the Eastern Part of the Gulf of İzmit, Sea of Marmara, NW Turkey. Mar. Geol. 2005, 215, 193–214. [Google Scholar] [CrossRef]
- Géli, L.; Henry, P.; Zitter, T.; Dupré, S.; Tryon, M.; Çaǧatay, M.N.; de Lépinay, B.M.; Le Pichon, X.; Şengör, A.M.C.; Görür, N.; et al. Gas Emissions and Active Tectonics within the Submerged Section of the North Anatolian Fault Zone in the Sea of Marmara. Earth Planet Sci. Lett. 2008, 274, 34–39. [Google Scholar] [CrossRef]
- Sarıtaş, H.; Çifçi, G.; Géli, L.; Thomas, Y.; Marsset, B.; Henry, P.; Grall, C.; Rochat, A. Gas Occurrence and Shallow Conduit Systems in the Western Sea of Marmara: A Review and New Acoustic Evidence. Geo-Mar. Lett. 2018, 38, 385–402. [Google Scholar] [CrossRef]
- Fischer, D.; Mogollón, J.M.; Strasser, M.; Pape, T.; Bohrmann, G.; Fekete, N.; Spiess, V.; Kasten, S. Subduction Zone Earthquake as Potential Trigger of Submarine Hydrocarbon Seepage. Nat. Geosci. 2013, 6, 647–651. [Google Scholar] [CrossRef]
- Römer, M.; Riedel, M.; Scherwath, M.; Heesemann, M.; Spence, G.D. Tidally Controlled Gas Bubble Emissions: A Comprehensive Study Using Long-Term Monitoring Data from the NEPTUNE Cabled Observatory Offshore Vancouver Island. Geochem. Geophys. Geosyst. 2016, 17, 3797–3814. [Google Scholar] [CrossRef]
- Lapham, L.; Wilson, R.; Riedel, M.; Paull, C.K.; Holmes, M.E. Temporal Variability of in Situ Methane Concentrations in Gas Hydrate-Bearing Sediments near Bullseye Vent, Northern Cascadia Margin. Geochem. Geophys. Geosyst. 2013, 14, 2445–2459. [Google Scholar] [CrossRef]
- Hasiotis, T.; Papatheodorou, G.; Kastanos, N.; Ferentinos, G. A Pockmark Field in the Patras Gulf (Greece) and Its Activation during the 14/7/93 Seismic Event. Mar. Geol. 1996, 130, 333–344. [Google Scholar] [CrossRef]
- Christodoulou, D.; Papatheodorou, G.; Fakiris, E.; Etiope, G.; Ferentinos, G. The Activation of the Patras Gulf, Western Greece, Pockmark Field Triggered by the Mw=6.4R June 8, 2008 Earthquake. In Proceedings of the 10th International Conference on Gas Geochemistry, Cluj-Napoca, Romania, 14–21 September 2009; p. 30. [Google Scholar]
- Christodoulou, D. Geophysical, Sedimentological Study—Remote Sensing on Pockmarks in Active Seismogenic Areas. Ph.D. Thesis, University of Patras, Patras, Greece, 2010. [Google Scholar]
- Papatheodorou, G.; Christodoulou, D.; Geraga, M.; Etiope, G.; Ferentinos, G. The Pockmark Field of the Gulf of Patras: An Ideal Natural Laboratory for Studying Seabed Fluid Flow. In Field Trips Guide Book “Sedimentology of Western and Central Greece from Triassic to Recent, Proceedings of the 25th IAS Meeting of Sedimentology, Patras, Greece, 4–7 September 2007; University of Patras: Patras, Greece, 2007; pp. 43–62. [Google Scholar]
- Ravasopoulos, J.; Papatheodorou, G.; Kapolos, J.; Geraga, M.; Koliadima, A.; Xenos, K. A Promising Methodology for the Detection of Pockmarks Activation in Nearshore Sediments. Instrum. Sci. Technol. 2002, 30, 139–155. [Google Scholar] [CrossRef]
- Hellenic Survey of Geology and Mineral Exploration Geological Map of Greece 1:500,000. Available online: https://gaia.igme.gr/portal/apps/webappviewer/index.html?id=61dc7b67790944a198d4dbdc876d1a3c (accessed on 5 August 2023).
- Kokkalas, S.; Xypolias, P.; Koukouvelas, I.; Doutsos, T. Postcollisional Contractional and Extensional Deformation in the Aegean Region; Geological Society of America: Patras, Greece, 2006; Volume 409. [Google Scholar]
- Institute of Geodynamics of the National Observatory of Athens. Available online: https://Bbnet.Gein.Noa.Gr/HL/Databases/Database (accessed on 5 August 2023).
- Doutsos, T.; Poulimenos, G. Geometry and Kinematics of Active Faults and Their Seismotectonic Significance in the Western Corinth-Patras Rift (Greece). J. Struct. Geol. 1992, 14, 689–699. [Google Scholar] [CrossRef]
- Flotté, N.; Sorel, D.; Müller, C.; Tensi, J. Along Strike Changes in the Structural Evolution over a Brittle Detachment Fault: Example of the Pleistocene Corinth-Patras Rift (Greece). Tectonophysics 2005, 403, 77–94. [Google Scholar] [CrossRef]
- Melis, N.S.; Brooks, M.; Pearce, R.G. A Microearthquake Study in the Gulf of Patras Region, Western Greece, and Its Seismotectonic Interpretation. Geophys. J. Int. 1989, 98, 515–524. [Google Scholar] [CrossRef]
- Ferentinos, G.; Brooks, M.; Doutsos, T. Quaternary Tectonics in the Gulf of Patras, Western Greece. J. Struct. Geol. 1985, 7, 713–717. [Google Scholar] [CrossRef]
- Chronis, G.; Piper, D.J.W.; Anagnostou, C. Late Quaternary Evolution of the Gulf of Patras, Greece: Tectonism, Deltaic Sedimentation and Sea-Level Change. Mar. Geol. 1991, 97, 191–209. [Google Scholar] [CrossRef]
- Haddad, A.; Ganas, A.; Kassaras, I.; Lupi, M. Seismicity and Geodynamics of Western Peloponnese and Central Ionian Islands: Insights from a Local Seismic Deployment. Tectonophysics 2020, 778, 228353. [Google Scholar] [CrossRef]
- Plicka, V.; Sokos, E.; Tselentis, G.-A.; Zahradník, J. The Patras Earthquake (14 July 1993): Relative Roles of Source, Path and Site Effects. J. Seismol. 1998, 2, 337–349. [Google Scholar] [CrossRef]
- Tselentis, G.-A. Fault Lengths During the Patras 1993 Earthquake Sequence as Estimated from the Pulse Width of Initial P Wave. Pure Appl. Geophys. 1998, 152, 75–89. [Google Scholar] [CrossRef]
- Marinaro, G.; Etiope, G.; Bue, N.L.; Favali, P.; Papatheodorou, G.; Christodoulou, D.; Furlan, F.; Gasparoni, F.; Ferentinos, G.; Masson, M.; et al. Monitoring of a Methane-Seeping Pockmark by Cabled Benthic Observatory (Patras Gulf, Greece). Geo-Mar. Lett. 2006, 26, 297–302. [Google Scholar] [CrossRef]
- Koukouvelas, I.K.; Kokkalas, S.; Xypolias, P. Surface Deformation during the Mw 6.4 (8 June 2008) Movri Mountain Earthquake in the Peloponnese, and Its Implications for the Seismotectonics of Western Greece. Int. Geol. Rev. 2010, 52, 249–268. [Google Scholar] [CrossRef]
- Christodoulou, D.; Papatheodorou, G.; Ferentinos, G.; Masson, M. Active Seepage in Two Contrasting Pockmark Fields in the Patras and Corinth Gulfs, Greece. Geo-Mar. Lett. 2003, 23, 194–199. [Google Scholar] [CrossRef]
- Milionis, N.; Kokoromitis, A. Technical Report of Evaluation of Geotechnical Survey Results (B2 Phase of Geotechnical Surveys); New Port of Patras: Patras, Greece, 2007. [Google Scholar]
- Booth, J.S.; Sangrey, D.A.; Fugate, J.K. A Nomogram for Interpreting Slope Stability of Fine-Grained Deposits in Modern and Ancient-Marine Environments. J. Sediment. Petrol. 1985, 55, 29–36. [Google Scholar] [CrossRef]
- Allen, J.R.L. Principles of Physical Sedimentology; Chapman & Hall: London, UK, 1985. [Google Scholar]
- Damuth, J.E. Echo Character of the Western Equatorial Atlantic Floor and Its Relationship to the Dispersal and Distribution of Terrigenous Sediments. Mar. Geol. 1975, 18, 17–45. [Google Scholar] [CrossRef]
- Kordella, S.; Christodoulou, D.; Fakiris, E.; Geraga, M.; Kokkalas, S.; Marinaro, G.; Iatrou, M.; Ferentinos, G.; Papatheodorou, G. Gas Seepage-Induced Features in the Hypoxic/Anoxic, Shallow, Marine Environment of Amfilochia Bay, Amvrakikos Gulf (Western Greece). Geosciences 2021, 11, 27. [Google Scholar] [CrossRef]
- Garcia-Gil, S.; Vilas, F.; Garcia-Garcia, A. Shallow Gas Features in Incised-Valley Fills (Ría de Vigo, NW Spain): A Case Study. Cont. Shelf Res. 2002, 22, 2303–2315. [Google Scholar] [CrossRef]
- Luo, D.; Cai, F.; Li, Q.; Yan, G.; Sun, Y.; Li, A.; Dong, G. Geophysical Evidence for Submarine Methane Seepage on the Western Slope of Okinawa Trough. Front. Earth Sci. 2022, 10, 985597. [Google Scholar] [CrossRef]
- Roy, S.; Hovland, M.; Braathen, A. Evidence of Fluid Seepage in Grønfjorden, Spitsbergen: Implications from an Integrated Acoustic Study of Seafloor Morphology, Marine Sediments and Tectonics. Mar. Geol. 2016, 380, 67–78. [Google Scholar] [CrossRef]
- Papatheodorou, G.; Geraga, M.; Christodoulou, D.; Fakiris, E.; Iatrou, M.; Georgiou, N.; Dimas, X.; Ferentinos, G. The Battle of Lepanto Search and Survey Mission (1971–1972) by Throckmorton, Edgerton and Yalouris: Following Their Traces Half a Century Later Using Marine Geophysics. Remote Sens. 2021, 13, 3292. [Google Scholar] [CrossRef]
- Koch, S.; Berndt, C.; Bialas, J.; Haeckel, M.; Crutchley, G.; Papenberg, C.; Klaeschen, D.; Greinert, J. Gas-Controlled Seafloor Doming. Geology 2015, 43, 571–574. [Google Scholar] [CrossRef]
- Greinert, J.; Artemov, Y.; Egorov, V.; De Batist, M.; McGinnis, D. 1300-m-High Rising Bubbles from Mud Volcanoes at 2080 m in the Black Sea: Hydroacoustic Characteristics and Temporal Variability. Earth Planet Sci. Lett. 2006, 244, 1–15. [Google Scholar] [CrossRef]
- Klaucke, I.; Sahling, H.; Weinrebe, W.; Blinova, V.; Bürk, D.; Lursmanashvili, N.; Bohrmann, G. Acoustic Investigation of Cold Seeps Offshore Georgia, Eastern Black Sea. Mar. Geol. 2006, 231, 51–67. [Google Scholar] [CrossRef]
- Etiope, G.; Christodoulou, D.; Kordella, S.; Marinaro, G.; Papatheodorou, G. Offshore and Onshore Seepage of Thermogenic Gas at Katakolo Bay (Western Greece). Chem. Geol. 2013, 339, 115–126. [Google Scholar] [CrossRef]
- De Beukelaer, S.M.; MacDonald, I.R.; Guinnasso, N.L.; Murray, J.A. Distinct Side-Scan Sonar, RADARSAT SAR, and Acoustic Profiler Signatures of Gas and Oil Seeps on the Gulf of Mexico Slope. Geo-Mar. Lett. 2003, 23, 177–186. [Google Scholar] [CrossRef]
- Obzhirov, A.; Shakirov, R.; Salyuk, A.; Suess, E.; Biebow, N.; Salomatin, A. Relations between Methane Venting, Geological Structure and Seismo-Tectonics in the Okhotsk Sea. Geo-Mar. Lett. 2004, 24, 135–139. [Google Scholar] [CrossRef]
- Kim, Y.J.; Cheong, S.; Chun, J.H.; Cukur, D.; Kim, S.P.; Kim, J.K.; Kim, B.Y. Identification of Shallow Gas by Seismic Data and AVO Processing: Example from the Southwestern Continental Shelf of the Ulleung Basin, East Sea, Korea. Mar. Pet. Geol. 2020, 117, 104346. [Google Scholar] [CrossRef]
- Guinasso, N.L.; Schink, D.R. A Simple Physiochemical Acoustic Model of Methane Bubbles Rising in the Sea. In Study of Naturally Occurring Hydrocarbons in the Gulf of Mexico; Texas A&M University, College of Geosciences: College Station, TX, USA, 1973. [Google Scholar]
- Rodes, N.; Betlem, P.; Senger, K.; Römer, M.; Hodson, A.; Liira, M.; Birchall, T.; Roy, S.; Noormets, R.; Smyrak-Sikora, A.; et al. Active Gas Seepage in Western Spitsbergen Fjords, Svalbard Archipelago: Spatial Extent and Geological Controls. Front. Earth Sci. 2023, 11, 1173477. [Google Scholar] [CrossRef]
- Parcharidis, I.; Kokkalas, S.; Fountoulis, I.; Foumelis, M. Detection and Monitoring of Active Faults in Urban Environments: Time Series Interferometry on the Cities of Patras and Pyrgos (Peloponnese, Greece). Remote Sens. 2009, 1, 676–696. [Google Scholar] [CrossRef]
- Koukis, G.; Sabatakakis, N.; Tsiambaos, G.; Katrivesis, N. Engineering Geological Approach to the Evaluation of Seismic Risk in Metropolitan Regions: Case Study of Patras, Greece. Bull. Eng. Geol. Environ. 2005, 64, 219–235. [Google Scholar] [CrossRef]
- Katrivesis, N. Engineering Geological Conditions in the Broader Area of Patras; University of Patras: Patras, Greece, 2005. [Google Scholar]
- Morley, C.K.; Nelson, R.A.; Patton, T.L.; Munn, S.G. Transfer Zones in the East African Rift System and Their Relevance to Hydrocarbon Exploration in Rifts1. Am. Assoc. Pet. Geol. Bull. 1990, 74, 1234–1253. [Google Scholar] [CrossRef]
- Milkov, A.V.; Etiope, G. Revised Genetic Diagrams for Natural Gases Based on a Global Dataset of >20,000 Samples. Org. Geochem. 2018, 125, 109–120. [Google Scholar] [CrossRef]
- Pilcher, R.; Argent, J. Mega-Pockmarks and Linear Pockmark Trains on the West African Continental Margin. Mar. Geol. 2007, 244, 15–32. [Google Scholar] [CrossRef]
- Moss, J.L.; Cartwright, J.; Moore, R. Evidence for Fluid Migration Following Pockmark Formation: Examples from the Nile Deep Sea Fan. Mar. Geol. 2012, 303–306, 1–13. [Google Scholar] [CrossRef]
- Audsley, A.; Bradwell, T.; Howe, J.A.; Baxter, J.M. Distribution and Classification of Pockmarks on the Seabed around Western Scotland. J. Maps 2019, 15, 807–817. [Google Scholar] [CrossRef]
- Hovland, M.; Gardner, J.V.; Judd, A.G. The Significance of Pockmarks to Understanding Fluid Flow Processes and Geohazards. Geofluids 2002, 2, 127–136. [Google Scholar] [CrossRef]
- Gafeira, J.; Long, D.; Diaz-Doce, D. Semi-Automated Characterisation of Seabed Pockmarks in the Central North Sea. Near Surf. Geophys. 2012, 10, 301–312. [Google Scholar] [CrossRef]
- Picard, K.; Radke, L.C.; Williams, D.K.; Nicholas, W.A.; Justy Siwabessy, P.; Howard, F.J.F.; Gafeira, J.; Przeslawski, R.; Huang, Z.; Nichol, S. Origin of High Density Seabed Pockmark Fields and Their Use in Inferring Bottom Currents. Geosciences 2018, 8, 195. [Google Scholar] [CrossRef]
- Hovland, M.; Vasshus, S.; Heggland, R. Pockmarks in the Norwegian Trench—Some New Observations. In Proceedings of the 4th Conference on Gas in Marine Sediments, Varna, Bulgaria, 28–30 September 1996. [Google Scholar]
- Hasiotis, T.; Papatheodorou, G.; Ferentinos, G. A String of Large and Deep Gas-Induced Depressions (Pockmarks) Offshore Killini Peninsula, Western Greece. Geo-Mar. Lett. 2002, 22, 142–149. [Google Scholar] [CrossRef]
- Gay, A.; Lopez, M.; Berndt, C.; Séranne, M. Geological Controls on Focused Fluid Flow Associated with Seafloor Seeps in the Lower Congo Basin. Mar. Geol. 2007, 244, 68–92. [Google Scholar] [CrossRef]
- Söderberg, P.; Flodén, T. Gas Seepages, Gas Eruptions and Degassing Structures in the Seafloor along the Strömma Tectonic Lineament in the Crystalline Stockholm Archipelago, East Sweden. Cont. Shelf Res. 1992, 12, 1157–1171. [Google Scholar] [CrossRef]
- Webb, K.E.; Hammer, Ø.; Lepland, A.; Gray, J.S. Pockmarks in the Inner Oslofjord, Norway. Geo-Mar. Lett. 2009, 29, 111–124. [Google Scholar] [CrossRef]
- Schattner, U.; Lazar, M.; Souza, L.A.P.; ten Brink, U.; Mahiques, M.M. Pockmark Asymmetry and Seafloor Currents in the Santos Basin Offshore Brazil. Geo-Mar. Lett. 2016, 36, 457–464. [Google Scholar] [CrossRef]
- Papatheodorou, G.; Kontopoulos, N. Determination of Sediment Transport Directions Using the “McLaren” Method. Examples from the Patras and Amvrakikos Gulfs, Greece. Bull. Geol. Soc. Greece 1998, 32, 145–155. [Google Scholar]
- Rogers, J.N.; Kelley, J.T.; Belknap, D.F.; Gontz, A.; Barnhardt, W.A. Shallow-Water Pockmark Formation in Temperate Estuaries: A Consideration of Origins in the Western Gulf of Maine with Special Focus on Belfast Bay. Mar. Geol. 2006, 225, 45–62. [Google Scholar] [CrossRef]
- Kelley, J.T.; Dickson, S.M.; Belknap, D.F.; Barnhardt, W.A.; Henderson, M. Giant Sea-Bed Pockmarks: Evidence for Gas Escape from Belfast Bay, Maine. Geology 1994, 22, 59–62. [Google Scholar] [CrossRef]
- Dupré, S.; Woodside, J.; Klaucke, I.; Mascle, J.; Foucher, J.P. Widespread Active Seepage Activity on the Nile Deep Sea Fan (Offshore Egypt) Revealed by High-Definition Geophysical Imagery. Mar. Geol. 2010, 275, 1–19. [Google Scholar] [CrossRef]
- Olu-Le Roy, K.; Sibuet, M.; Fiala-Médioni, A.; Gofas, S.; Salas, C.; Mariotti, A.; Foucher, J.-P.; Woodside, J. Cold Seep Communities in the Deep Eastern Mediterranean Sea: Composition, Symbiosis and Spatial Distribution on Mud Volcanoes. Deep. Sea Res. Part I Oceanogr. Res. Pap. 2004, 51, 1915–1936. [Google Scholar] [CrossRef]
- Sibuet, M.; Olu, K. Biogeography, Biodiversity and Fluid Dependence of Deep-Sea Cold-Seep Communities at Active and Passive Margins. Deep Sea Res. 2 Top Stud. Oceanogr. 1998, 45, 517–567. [Google Scholar] [CrossRef]
- Klaucke, I.; Masson, D.G.; Jörg Petersen, C.; Weinrebe, W.; Ranero, C.R. Multifrequency Geoacoustic Imaging of Fluid Escape Structures Offshore Costa Rica: Implications for the Quantification of Seep Processes. Geochem. Geophys. Geosyst. 2008, 9, Q04010. [Google Scholar] [CrossRef]
- Zitter, T.A.C.; Huguen, C.; Woodside, J.M. Geology of Mud Volcanoes in the Eastern Mediterranean from Combined Sidescan Sonar and Submersible Surveys. Deep Sea Res. 1 Oceanogr. Res. Pap. 2005, 52, 457–475. [Google Scholar] [CrossRef]
- Dando, P.R.; Austen, M.C.; Burke, R.A.; Kendall, M.A.; Kennicutt, M.C.; Judd, A.G.; Moore, D.C.; O’Hara, S.C.M.; Schmalijohann, R.; Southward, A.J. Ecology of a North Sea Pockmark with an Active Methane Seep. Mar. Ecol. Prog. Ser. 1991, 70, 49–63. [Google Scholar] [CrossRef]
- Webb, K.E.; Barnes, D.K.A.; Planke, S. Pockmarks: Refuges for Marine Benthic Biodiversity. Limnol. Oceanogr. 2009, 54, 1776–1788. [Google Scholar] [CrossRef]
- Baltzer, A.; Ehrhold, A.; Rigolet, C.; Souron, A.; Cordier, C.; Clouet, H.; Dubois, S.F. Geophysical Exploration of an Active Pockmark Field in the Bay of Concarneau, Southern Brittany, and Implications for Resident Suspension Feeders. Geo-Mar. Lett. 2014, 34, 215–230. [Google Scholar] [CrossRef]
- Webb, K.E.; Barnes, D.K.A.; Gray, J.S. Benthic Ecology of Pockmarks in the Inner Oslofjord, Norway. Mar. Ecol. Prog. Ser. 2009, 387, 15–25. [Google Scholar] [CrossRef]
- Zhang, K.; Guan, Y.; Song, H.; Fan, W.; Li, H.; Kuang, Y.; Geng, M. A Preliminary Study on Morphology and Genesis of Giant and Mega Pockmarks near Andu Seamount, Nansha Region (South China Sea). Mar. Geophys. Res. 2020, 41, 2. [Google Scholar] [CrossRef]
- Froelich, P.N.; Klinkhammer, G.P.; Bender, M.L.; Luedtke, N.A.; Heath, G.R.; Cullen, D.; Dauphin, P.; Hammond, D.; Hartman, B.; Maynard, V. Early Oxidation of Organic Matter in Pelagic Sediments of the Eastern Equatorial Atlantic: Suboxic Diagenesis. Geochim. Cosmochim. Acta 1979, 43, 1075–1090. [Google Scholar] [CrossRef]
- Capone, D.G.; Kiene, R.P. Comparison of Microbial Dynamics in Marine and Freshwater Sediments: Contrasts in Anaerobic Carbon Catabolism. Limnol. Oceanogr. 1988, 33, 725–749. [Google Scholar] [CrossRef]
- García-García, A.; Orange, D.L.; Miserocchi, S.; Correggiari, A.; Langone, L.; Lorenson, T.D.; Trincardi, F.; Nittrouer, C.A. What Controls the Distribution of Shallow Gas in the Western Adriatic Sea? Cont. Shelf Res. 2007, 27, 359–374. [Google Scholar] [CrossRef]
- Weschenfelder, J.; Klein, A.H.F.; Green, A.N.; Aliotta, S.; de Mahiques, M.M.; Ayres Neto, A.; Terra, L.C.; Corrêa, I.C.S.; Calliari, L.J.; Montoya, I.; et al. The Control of Palaeo-Topography in the Preservation of Shallow Gas Accumulation: Examples from Brazil, Argentina and South Africa. Estuar. Coast Shelf Sci. 2016, 172, 93–107. [Google Scholar] [CrossRef]
- Piper, D.J.W.; Stamatopoulos, L.; Poulimenos, G.; Doutsos, T.; Kontopoulos, N. Quaternary History of the Gulfs of Patras and Corinth, Greece. Z. Für Geomorphol. 1991, 34, 451–458. [Google Scholar] [CrossRef]
- Leifer, I.; MacDonald, I. Dynamics of the Gas Flux from Shallow Gas Hydrate Deposits: Interaction between Oily Hydrate Bubbles and the Oceanic Environment. Earth Planet Sci. Lett. 2003, 210, 411–424. [Google Scholar] [CrossRef]
- Greinert, J.; Lewis, K.B.; Bialas, J.; Pecher, I.A.; Rowden, A.; Bowden, D.A.; De Batist, M.; Linke, P. Methane Seepage along the Hikurangi Margin, New Zealand: Overview of Studies in 2006 and 2007 and New Evidence from Visual, Bathymetric and Hydroacoustic Investigations. Mar. Geol. 2010, 272, 6–25. [Google Scholar] [CrossRef]
- Kiratzi, A.; Louvari, E. Focal Mechanisms of Shallow Earthquakes in the Aegean Sea and the Surrounding Lands Determined by Waveform Modelling: A New Database. J. Geodyn. 2003, 36, 251–274. [Google Scholar] [CrossRef]
- Serpetsidaki, A.; Elias, P.; Ilieva, M.; Bernard, P.; Briole, P.; Deschamps, A.; Lambotte, S.; Lyon-Caen, H.; Sokos, E.; Tselentis, G.A. New Constraints from Seismology and Geodesy on the Mw = 6.4 2008 Movri (Greece) Earthquake: Evidence for a Growing Strike-Slip Fault System. Geophys. J. Int. 2014, 198, 1373–1386. [Google Scholar] [CrossRef]
- Tselentis, G.; Melis, N.; Sokos, E. Earthquake Sequence as It Was Recorded by the Patras Seismic Network. In Proceedings of the 7th Congress of the Geological Society of Greece, Thessaloniki, Greece, 25–27 May 1994; Bulletin of the Geological Society of Greece. pp. 159–165. [Google Scholar]


| Total | North Sector | South Sector | |
|---|---|---|---|
| Total Number | 92 (+23 buried) | 55 (+23 buried) | 31 |
| No of Unit Pockmarks | 9 | 4 | 3 |
| No of Normal Pockmarks | 54 | 35 | 15 |
| No of Composite Pockmarks | 29 | 16 | 13 |
| Diameter (m) min–max (mean) | 8–260 (72) | 8–200 (65) | 12–260 (90) |
| Perimeter (m) min–max (mean) | 25–806 (218) | 25–637 (207) | 38–806 (260) |
| Volume (m3) min–max (mean) | 165–360,682 (22,247) | 165–97,094 (15,102) | 181–360,682 (38,654) |
| Relative Depth (m) min–max (mean) | 1–19.3 (7.3) | 2.5–15.3 (7) | 1–19.3 (8.7) |
| Slope (degree) min–max (mean) | 5–46 (26) | 5–46 (26) | 6–41 (29) |
| Relative Depth—Diameter ratio min–max (mean) | 0.03–0.47 (0.13) | 0.03–0.47 (0.14) | 0.04–0.26 (0.11) |
| Circular | 37 | 23 | 8 |
| Elliptical | 55 | 32 | 23 |
| Sample | H2S | He | H2 | Ar | CO2 | N2 | CH4 | C2H6 | C3H8 | iC4 | nC4 | iC5 | nC5 | C6+ |
|---|---|---|---|---|---|---|---|---|---|---|---|---|---|---|
| Water | bdl | - | bdl | 0.23 | 6.22 | 9.55 | 83.99 | 0.0053 | bdl | bdl | bdl | bdl | bdl | bdl |
| Air | bdl | bdl | bdl | 0.08 | 1.9 | 5.54 | 92.48 | 0.0037 | bdl | bdl | bdl | bdl | bdl | 0.004 |
| Sample | δ13CCH4 (‰, VPDB) | δ2HCH4 (‰, VSMOW) |
|---|---|---|
| Water | −72.12 | −201.3 |
| Air | −73.93 | −210.9 |
Disclaimer/Publisher’s Note: The statements, opinions and data contained in all publications are solely those of the individual author(s) and contributor(s) and not of MDPI and/or the editor(s). MDPI and/or the editor(s) disclaim responsibility for any injury to people or property resulting from any ideas, methods, instructions or products referred to in the content. |
© 2023 by the authors. Licensee MDPI, Basel, Switzerland. This article is an open access article distributed under the terms and conditions of the Creative Commons Attribution (CC BY) license (https://creativecommons.org/licenses/by/4.0/).
Share and Cite
Christodoulou, D.; Papatheodorou, G.; Geraga, M.; Etiope, G.; Giannopoulos, N.; Kokkalas, S.; Dimas, X.; Fakiris, E.; Sergiou, S.; Georgiou, N.; et al. Geophysical and Geochemical Exploration of the Pockmark Field in the Gulf of Patras: New Insights on Formation, Growth and Activity. Appl. Sci. 2023, 13, 10449. https://doi.org/10.3390/app131810449
Christodoulou D, Papatheodorou G, Geraga M, Etiope G, Giannopoulos N, Kokkalas S, Dimas X, Fakiris E, Sergiou S, Georgiou N, et al. Geophysical and Geochemical Exploration of the Pockmark Field in the Gulf of Patras: New Insights on Formation, Growth and Activity. Applied Sciences. 2023; 13(18):10449. https://doi.org/10.3390/app131810449
Chicago/Turabian StyleChristodoulou, Dimitris, George Papatheodorou, Maria Geraga, Giuseppe Etiope, Nikos Giannopoulos, Sotiris Kokkalas, Xenophon Dimas, Elias Fakiris, Spyros Sergiou, Nikos Georgiou, and et al. 2023. "Geophysical and Geochemical Exploration of the Pockmark Field in the Gulf of Patras: New Insights on Formation, Growth and Activity" Applied Sciences 13, no. 18: 10449. https://doi.org/10.3390/app131810449