1. Introduction
Over the last decades, the computerization of almost all areas of social life has been progressing. Increasing the computing power of computers and speeding up the Internet significantly influenced the amount of data sent and archived by enterprises from many different industries. Faced with growing piles of data, humanity has been forced to ask itself questions about possible ways to use the collected information in the most useful way.
In response to such questions, more and more complex algorithms are being constructed to analyze large datasets. Only a few dozen years ago did the then technological state not allow for a full learning process to be carried out in a relatively short time for a human being. Therefore, algorithms such as neural networks have long lingered in the minds of mathematicians and computer scientists as a more theoretical than practical solution. At present, day by day, the computational capacity of modern computers is becoming more and more adequate for the needs of various types of intelligent algorithms.
Companies collect a wide variety of data. However, the subjects of our work are only textual data. Events occurring in the company are most often described in the language of people and thus use text not numbers, which are much easier to interpret and understand with a calculating machine, which is a computer.
Every modern company has a customer contact unit. All communication with the client, his requests, claims, ideas and comments, must be documented and archived by the company for possible later verification. In large corporations, the number of text events accumulated in this way can give many employees a headache. How to use large text datasets to save time and money? There is no single correct answer to this question.
The aim of the presented work is to demonstrate that text classification can effectively address numerous challenges associated with the management of extensive sets of textual data collected by enterprises from various industries. Currently, existing approaches to text-event classification often rely on human resources to assign events to their respective categories. Regardless of whether it is the customer, an employee or an external company responsible for event classification, this human involvement can introduce various issues, including additional costs, communication challenges and human errors. These problems, if left unaddressed, can lead to customer dissatisfaction. Therefore, the most effective solution is to automate the event-classification process to minimize or eliminate human involvement entirely.
Section 4 attempts to present a system capable of automatically classifying texts as an improvement to customer communication processes by categorizing the content sent by the customer.
The main objective of this work is to create an expert system that allows for the classification of text events from various industrial processes. The implementation of such an expert system for the automatic categorization of new events is a very complex issue. The construction of the system began with designing a process for classifying text events, and then its algorithmic and mathematical description was created. To achieve this goal, a universal system for the classification of text events was implemented, which for properly structured datasets from various industries is characterized by a satisfactory level of efficiency and quality of classification. The proposed software is a desktop system implemented with Java technology using a JavaFX library.
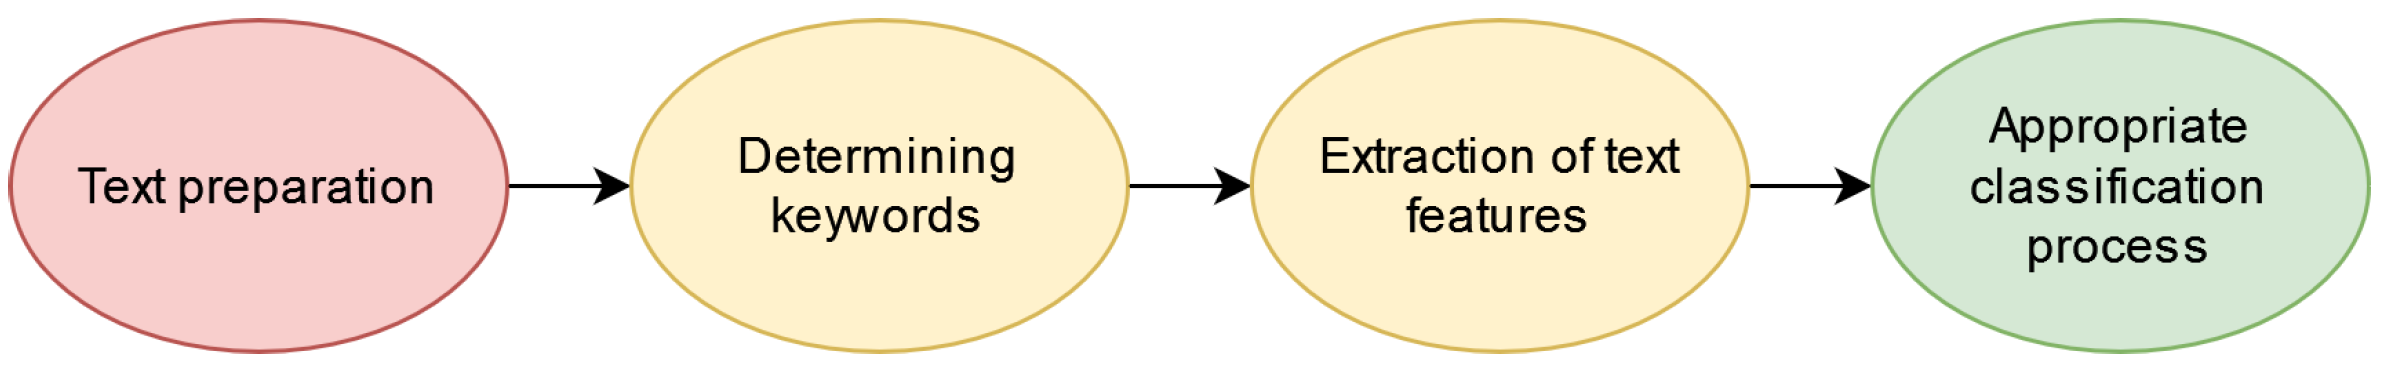
The proposed text-classification process consists of four main steps. The first of them is the preparation of each text by building its model, and the second stage is the determination of keywords for the examined set of texts. Then, all the developed features for each of the texts from the set should be extracted in order to be able to proceed to the proper classification. The described text classification method is based on the use of distance metrics and similarity measures for the purpose of comparing individual pairs of texts using the K-Nearest Neighbors algorithm.
The main contributions of this paper are as follows:
Designs a complex text-classification process using the K-Nearest Neighbors algorithm;
Proposes two novel mechanisms: the dynamic extension of stop list and weighted keywords, which address typical issues that arise when using conventional keywords and a fixed stop list;
Presents an expert system that allows for the automatic categorization of text events of various types, originating from various industrial processes.
This paper is structured as follows:
Section 2 contains a polemic on the issues of event classification in industry and shows the text classifier as a potential solution to some of the problems related to it.
Section 3 describes the entire text-classification process with a detailed explanation of the two proposed mechanisms: the dynamic extension of stop list and weighted keywords.
Section 4 describes the system architecture, data layer and logical layer, while
Section 5 deals with the analysis of text classification results, carried out by using the proposed system on selected datasets originating from various industries.
2. Problems of Event Classification in Industry
The vast majority of enterprises and organizations from various sectors of the economy keep records in which they describe all or at least the most important events occurring in the company’s history. Health care units, such as hospitals or clinics, keep medical records describing the course of the disease and treatment of their patients, police archive offices keep files of criminals and IT companies collect documentation of their projects and systems.
A very large part of the collected events is a record of the company’s communication with the client. Every thriving company is obliged to run a customer service office: to answer its requests and questions, solve problems and respond to possible ideas for cooperation.
Every act of communication with the customer must be archived. Depending on the form of communication, the documentation may include recordings of telephone conversations, the history of conversations in an email box and also notifications collected in the internal system intended for the service of supplicants. As already indicated in the introduction, the subjects of consideration in our work are only those events that are recorded in text form.
2.1. Customer Expectations
Research conducted in 2018 by the organization Statista Research Department [
1] showed that as many as 62% of Americans admitted that they had contacted at least one customer service office in the last month since the survey. According to another study commissioned and conducted by
Microsoft [
2], 54% of consumers worldwide say their expectations for customer service are higher than they were a year ago.
The cited results of the first study illustrate the huge scale of the documentation produced, which lingers on the shelves and disks of many American and international companies. However, it is only when the results of both studies are put together that one can see a picture showing not only the unimaginable number of documented events collected day by day by global companies, but also the ever-increasing demands of customers. After all, customers have always wanted, want and will want communication with the company to be faster, better and as less difficult as possible.
2.2. Currently Used Solutions
The scale of this phenomenon, due to the collection of a huge amount of text data, is very large. It is also worth considering how companies handle individual events and what the process is from the submission of an application, complaint or question by the client to the reaction of the company and formulation of the answer.
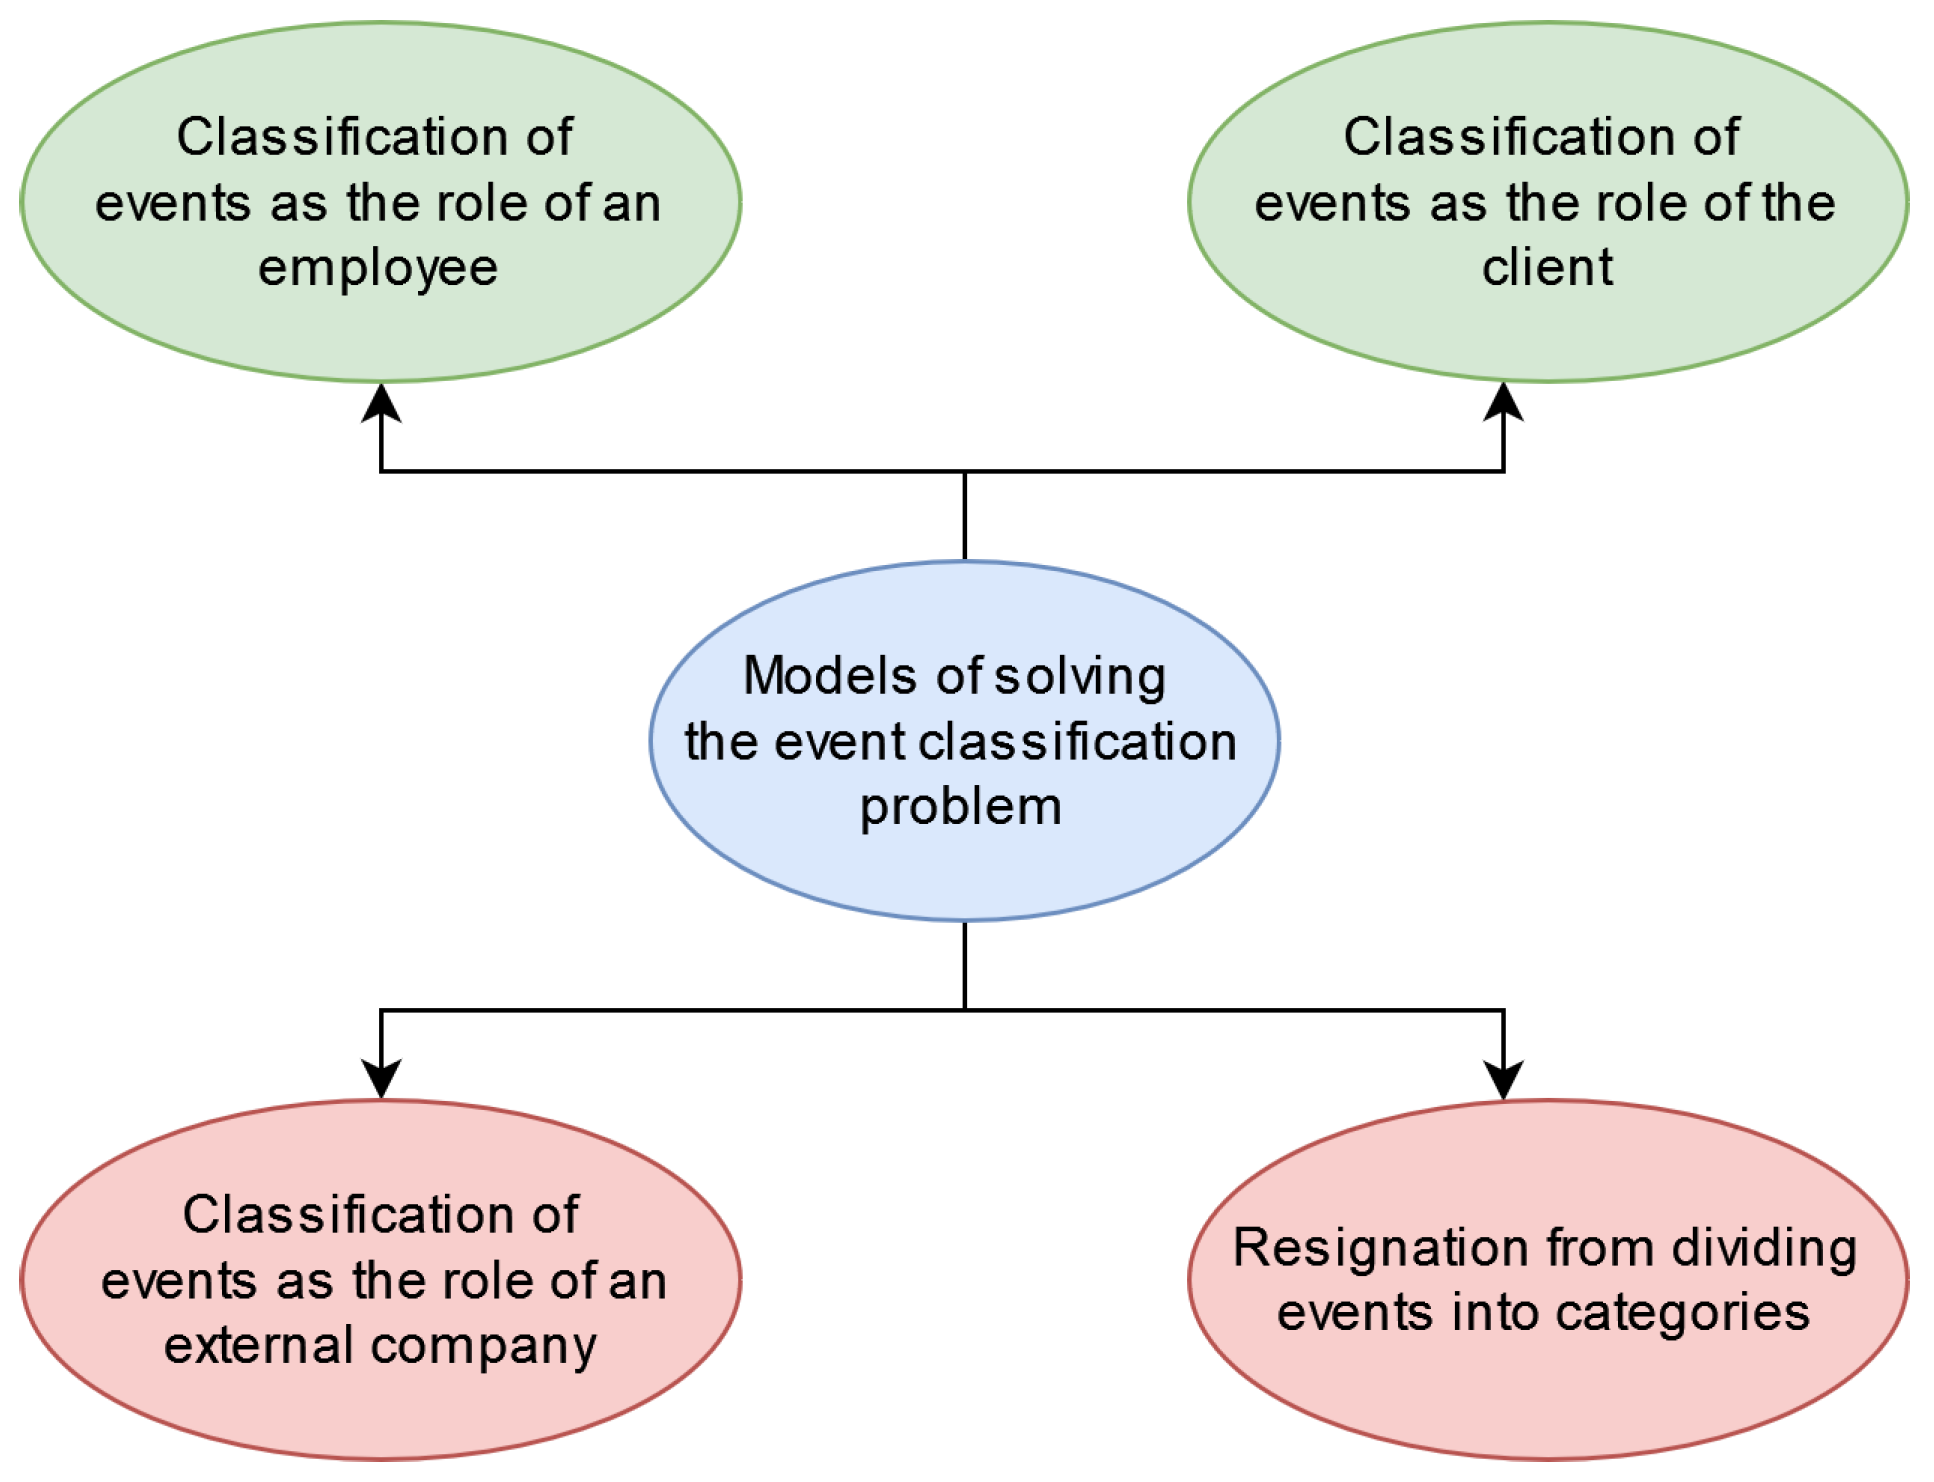
The first and probably the most important step in handling an event is classifying it to the appropriate type or category, deciding what the report is about and who should handle it. What, then, are the most popular models of event classification functioning in modern corporations? The most popular models of solving the event-classification problem that are used in modern enterprises are presented in
Figure 1.
In the model of the classification of events as an employee’s role, the responsibility for classifying an event lies with the company, more specifically with its employees. In this model, the customer informs the head office of the company’s customer service office about his event by using a clearly defined communication path through the organization (phone call, email, etc.). Then, a customer service employee analyzes the request and, sometimes consulting with colleagues, decides which branch or department of the company should deal with the specific request. Then, things can go in two ways:
The customer is informed by the company’s employee about where he should go with his case. He receives specific instructions and contact details for the selected unit, e.g., a phone number or email address.
A customer service employee transfers the case to specialists from the appropriate department who will deal with the application and then contact the supplicant themselves.
This model is by far the most popular solution that has dominated the market in various forms.
The model of the classification of events as the role of the client assumes that the responsibility for classifying the event is shifted to the client. While looking for the company’s contact details, the client comes across information whereby the only way to report their case is to fill out a form on the website. One of the fields in the form, right after the event description, is the mandatory selection of the problem category from the drop-down list. To submit an application, the customer must choose one of the categories. After selecting it, for many solutions of this type, a new form element appears with another mandatory item, forcing the client to select a subcategory, i.e., make another classification.
Then, the form completed by the customer is sent to the appropriate department of the company that handles events from the category selected by the customer. If the event has been correctly classified by the applicant, the employees of this department analyze the report in order to contact him later. Otherwise, it is the responsibility of the company unit to which the specific incident occurred to redirect the case to the appropriate place.
This solution is often chosen by smaller enterprises that cannot afford to maintain additional employees forming the customer service office. In this model, the event path is theoretically shorter than in the first model; in practice, due to the customer’s ignorance, the effect may be completely opposite.
In addition to the two most popular models of solving the problem of event classification, there are also others, such as:
Classification of events as the role of an external company—involves hiring an external company that performs the function of a customer service office and is responsible for classifying events and their delegation to the appropriate place.
Resignation from dividing events into categories—a solution designed for smaller companies, for which it is possible to form an expert unit that handles all or a significant majority of events.
2.3. Disadvantages of Currently Used Solutions
The presented-above currently used models of solutions have numerous disadvantages, such as follows:
Additional costs. In the first described model, the responsibility for classifying the event rests with the company. Depending on the structure and size of the company, selected employees must devote part of their time to analyzing and categorizing reports (in the case of smaller companies) or the company may separate a unit or employ several employees whose sole or main task will be to classify new incidents into appropriate “drawers” and directing them to the right place (this solution is most often implemented in larger companies).
In the first case, employees assigned to the role of a case analyzer lose the time they could spend on their main tasks. In the second case, the company has to fund extra jobs for the people responsible for this process. The conclusion is as follows: the employer will not avoid additional costs because both possibilities generate costs.
Customer dissatisfaction. While the second model of the solution, which assumes that the customer is responsible for classifying his problem, request or inquiry, does not force the company to allocate funds to maintain specialists dealing with the categorization of requests, it has weaknesses of a different kind.
In this model, the client is forced to specify the type of event he describes. It happens relatively often that the client does not understand what is hidden under the names of the categories, from which he has to choose the right one. As a result, reports go to the wrong sector of the company, whose employees are forced to analyze them and send them to the right place.
Communication problems. The above-mentioned solution models cause many potential interpersonal communication problems. Both communication with an external company that performs the tasks of the customer service office and communication between employees of the company can cause a number of misunderstandings, which translate into longer time taken to handle the event.
Human Errors. The company employee who deals with the classification of applications is only a human being, often guided by his own emotions, susceptible to fatigue and external factors. Even the best and most experienced employees make mistakes when categorizing events that result from human nature and are often unavoidable.
The currently used solutions have many shortcomings. At this point, the question arises: how to automate the classification process so that it does not imply the need for additional hands or nerves and customer dissatisfaction? The answer may be a system that will automatically classify events based on data archived by the company, containing a list of past events with the corresponding category.
The first solution that offers the possibility of the automatic classification of events has appeared on the market. An example of a system whose manufacturers boast of such operation is the Freshdesk [
3] application. Unfortunately, the company Freshworks, which is the contractor of the system, does not provide information about the effectiveness of the built-in classification mechanism, nor about the methods and algorithms used for this purpose.
2.4. Related Works
In recent years, a lot of research has been conducted in the field of text classification. The review of related works is divided into two parts. The first part focuses on the use of the K-Nearest Neighbors algorithm for text classification. The second part is an analysis of solutions using keyword-based text features similar to those extracted in the proposed classification process.
2.4.1. K-Nearest Neighbors Algorithm for Text Classification
K-Nearest Neighbors (KNN) is a supervised learning algorithm. KNN is one of the most popular classifiers used for text classification. Despite its simple design, the KNN algorithm classifier is still used in many modern studies and projects.
Research conducted by the authors of [
4] have shown that the K-Nearest Neighbors algorithm is effective for text datasets. In [
5], the authors conduct a comparison of different classifiers for text classification and define numerous advantages of the KNN classifier, such as its effectiveness with a large amount of data and robustness with noisy data.
KNN was featured in a survey focused on supervised machine learning techniques for automatic text classification [
6]. In this survey, it demonstrated a comparable classification performance to other state-of-the-art classifiers, including Support Vector Machine, AdaBoost and Naive Bayes. Additionally, the K-Nearest Neighbors algorithm underwent examination via a comparative analysis conducted by the authors of [
7], where it exhibited a similar classification performance to Linear Regression and Random Forest.
Of course, like other classifiers, KNN is not free of defects. Among the most frequently cited disadvantages of the KNN algorithm are the high computational costs and the difficulty in finding the optimal value of k [
4,
5,
8,
9].
The purpose of this paper is not to compare different classifiers but to compare different approaches to feature extraction based on the keywords. Therefore, it was decided to use one of the most popular classifiers, which undoubtedly is the K-Nearest Neighbors algorithm.
2.4.2. Features and Keyword Extraction
Various works illustrate many approaches to constructing a feature vector representing text. This section focuses on the solutions using feature vectors consisting of features based on keywords, because such features constitute the majority of features extracted from texts in the proposed classification process that is described in
Section 3.
The authors of [
10] decided to use the popular Term Frequency–Inverse Document Frequency (TF-IDF) method to extract features from texts. The TF-IDF method is not without flaws. This method for large text datasets generates feature vectors with a huge number of dimensions. To reduce the number of dimensions of the obtained vectors, the authors used two techniques: Latent Semantic Analysis (LSA) and Linear Discriminant Analysis (LDA). The big advantage of the solution proposed in this paper is the easily controllable number of dimensions in the feature vectors, which is completely dependent on the fixed number of keywords. The presented solution does not require any additional techniques to reduce the number of dimensions of the feature vector.
In [
11], the authors compared the TF-IDF and BM-25 methods. The results of the text classification obtained by both techniques are almost the same. The BM-25 method requires much more computation than TF-IDF and, like IDF, generates a very multidimensional feature vector that may contain features that are irrelevant during the classification process.
The authors of [
12], who also used the popular TF-IDF method, presented an interesting approach to reducing the dimensions of the feature vector. This approach assumes the removal of keywords for which the calculated TF-IDF value is lower than the assumed threshold. Performing such operations carries the risk that too few keywords will reach the threshold and the final feature vector will have too few dimensions to effectively classify texts. The classification process proposed in this paper effectively eliminates this problem by using a hyperparameter specifying the number of selected keywords.
In [
13], the authors proposed an improved TF-IDF algorithm. The authors noticed a disadvantage of the traditional TF-IDF algorithm, which does not take into account the distribution of information between feature items. For this reason, the authors modified the IDF formula to increase the weights of the feature items that frequently appear within a particular class while reducing the weight of the feature items that are evenly distributed across various classes. The same defect, repeated in many approaches to feature extraction by TF-IDF and related methods, was noticed by the authors of this paper. The solution to this problem is the proposed
weighted keywords method based on the TF algorithm, which is less computationally complex than the TF-IDF algorithm. Therefore, the presented method generates a more balanced, less dimensional feature vector.
3. Classification of Texts Algorithm for Industrial Processes
This section consists of a description of the text-classification process that was implemented in the
Text Events Categorizer system. The order of discussing the stages of the classification process is consistent with the actual order of performing individual activities and algorithms: (1) the preparation of texts; (2) determining the keywords; (3) the process of feature extraction; and (4) classification, using for example the K-Nearest Neighbors algorithm (
Figure 2).
3.1. Text Preparation
In order for a text written in a natural language in the form of a long string of characters to be classified, it must be properly prepared for this. For this purpose, a text model is built to represent it. The preparation of the proposed text model requires the following steps:
Extracting individual sentences from the text based on punctuation marks “.” (dots) found in the text;
To divide the resulting sentences into single words, using white space (spaces) and other punctuation marks.
The text model obtained in this way is no longer one long string of characters but a vector of sentences, which are vectors of words—short strings of characters, convenient for further analysis.
3.1.1. Removal of Redundant Words
Not all words in the text are meaningful. Every language contains a set of words that are very repetitive and do not add any logical value to the sentences and texts in which they are found. A set of such words for a particular language is called a stop list.
The next step in preparing the text model is to remove all the words that are in the stop list for the language in which the text was written. The created Text Events Categorizer system is written in English and designed to classify texts in that language. For this reason, it uses a stop list dedicated to the English language [
14].
3.1.2. Stemization of the Text
The final stage on the way to obtaining a fully prepared text model is stemming words. Stemization is the process of reducing words to their root, so these words that are semantically very similar, differ in inflection or come from the same word family are represented by the same string of characters, i.e., the root.
A text model prepared in this way, containing only potentially meaningful words that are the cores of their semantic families, enables the more-effective selection of keywords.
3.2. Determining Keywords
To determine a set of keywords for a given set of texts, the Term Frequency (TF) method was used, consisting of counting the number of occurrences of a given word in all texts.
To determine keywords using this method, we need to perform calculations on a set of all our texts from one category. The result of the calculation is a set of pairs—the word and the number of its occurrences in all documents. This set of pairs should be sorted by the number of occurrences in descending order and n first words selected. The selected n words become keywords.
The above operation is repeated
l times, where
l is the number of text categories in the analyzed set. The result is
l sets of keywords, each set representing a different category. The received keyword vectors have the following symbols:
This set of l keyword vectors has two obvious disadvantages:
It may happen that one of the words appears in the vectors for each category. This situation can lead to errors during later classification because a word marked as a keyword does not really carry any information.
Each keyword is equally important, no matter how many vectors it is repeated in. This situation is potentially problematic, because it is very important that a given word is a keyword not only in its category.
The following subsections contain the description of the proposed algorithms and solutions aimed at eliminating and preventing the above-mentioned problems.
3.2.1. Dynamic Extension of Stop List
Let there be a keyword
k satisfying the following conditions:
The above set of conditions means that the keyword k belongs to all the keyword vectors for each category. In such a situation, it does not carry any significance for the subsequent feature-extraction process, and thus also for the categorization itself.
Therefore, the word k is removed from all keyword vectors and dynamically appended to the stop list for the currently used dataset. As a result, the size of the keyword vectors (the number of words in the vector) is n − 1, where n is the initially assumed number of keywords. The next step is to fill in the missing space by adding the next keyword occupying the next position in the sorted set of pairs for each category.
The above algorithm is performed for each keyword that meets the condition (
2). The whole process ends when there are no more words in the keyword vectors that meet this condition, and the size of each vector is the expected value
n.
3.2.2. Weighted Keywords
Weighted keywords are an attempt to solve the second problem described in
Section 3.2. Weighted keywords are a set of pairs: a keyword and weight (a floating-point value). They consist of the same set of keywords determined earlier, which is enriched with a weight calculated in accordance with the developed formula:
where
—weight of
ith keyword,
l—number of categories and
—number of keyword categories (other than our own) in which the
ith keyword occurs.
An important conclusion from the analysis of the above formula is that keyword weights can only reach values in the range .
In order to better understand the formula, an example will be presented:
and
, and the designated keyword vectors have the following form:
The calculation of the weight values for the selected keywords from the above set is as follows. For the word “autumn”, the following value was obtained:
The word “autumn” appeared only in one “own” category, so it has the greatest possible weight. For the word “cat”:
The word “cat” appeared in one additional category (two in total). For the word “tail”:
The word “tail” appeared in all categories; therefore, it should be considered that it has no meaning, and its weight is equal to 0. If the dynamic extension of stop list algorithm was used before determining the keyword weights, the word “tail” should be replaced with a different one in each of the vectors.
The discussed example very well illustrates the effectiveness and sense of using both solutions discussed in the right order. After determining the keywords, we need to perform the process of removing repeated keywords in each vector of the dynamic extension of stop list in order to later calculate the weights for all the keywords obtained in this way. This sequence of actions aimed at determining keywords along with their weights was implemented in the Text Events Categorizer system.
3.3. Extraction of Text Features
After the text models are prepared and the keyword vectors are determined, it is time to extract the characteristics of the text. The text feature is the result of a function that, depending on its type, returns a number (a floating-point value) or a string of characters (text, string). The first type of feature will be called numeric features and the second will be called string features.
3.3.1. Numerical Text Features
The proposed numerical features are based on the occurrence of keywords. The functions of numerical features whose extraction was implemented in the Text Events Categorizer system are as follows:
The adopted designations:
—set of words that is the field of study of a given feature.
K—set of keywords consisting of l keyword vectors .
—number of occurrences of the elements of the set in the set . Regarding the meaning of the weighted keywords, it will be the sum of the products of the number of occurrences of individual elements of the set in the set and the corresponding weights.
—feature function value.
Understanding individual features depends on whether “normal” keywords or weighted keywords are used to extract the features; therefore, each feature has a basic nomenclature appropriate for the use of “normal” keywords and additional ones in parentheses, intended for the use of weighted keywords.
The feature describing the number of occurrences (the sum of the product of the weights and occurrences) of keywords from the
ith category occurring throughout the text is given by the formula
where
—the set of all words in the text.
In order to explain the complicated naming and interpretation of the above formula, which depend on the type of keywords, an example of calculating the value of the feature is presented as follows:
Let the set of keywords
have the following form:
and the set
being the field of study (the set of all the words in the text) is as follows:
At the beginning, the extraction variant using “normal” keywords is described. The occurrence of individual elements of set in the set is analyzed as below:
In this variant, the value of the
feature will simply be the sum of the keyword occurrences. After adding all the occurrences, we obtain
The next calculations were carried out by using the second, more complicated method of extracting numerical features by using
weighted keywords. Let the pairs of keywords from the
set and the weights calculated for them look like this:
In this case, in accordance with the previously presented description, the sum of products of the number of occurrences of individual elements of the
set in the
set and the corresponding weights should be calculated as
The feature describing the number of occurrences (the sum of the product of the weights and occurrences) of the keywords from
i-th category appearing in the first three sentences of the text is given by a similar formula as the feature
:
where
—set of words appearing in the first three sentences of the text.
The feature describing the ratio of the number of occurrences (the sum of the product of the weights and occurrences) of keywords from the
ith category occurring in the entire text to the total number of words occurring in the text (except for those on the stop list) is given by the formula
where
—the set of all the words in the text and
—the number of elements (words) of the set of all the words in the text.
3.3.2. Normalization of Numerical Text Features
The extracted numerical features reach very different floating-point values. In order to enable their effective interpretation in the proper classification process, all features should be normalized, bringing them to a specific, clearly defined space (range).
One of the most popular normalization methods used when building one’s own system is to project all the feature values into the range
. To perform this, divide the obtained values of a given feature for each of the training texts by the maximum value of this feature, achieved for one of these texts, according to the formula
where
—the value of the feature normalization function (normalized feature),
—the feature value before normalization and
—the maximum value reached by the feature.
3.3.3. Chain Features of the Text
Only one string feature is implemented in the Text Events Categorizer system. This feature will not use the keywords on which all the proposed numerical text features are based.
In addition to the notations introduced in the section on the numerical features of the text, an additional notation was adopted:
The feature that returns a string is the set of the five most common words in the entire text, separated by spaces, formally described as follows:
where
—the set of all words in the text, and the “+” operation means the concatenation of two strings of characters and adding a space (spacing, white space) between them.
3.3.4. Extracted Feature Vector as a Set of Numbers and Strings
The extracted feature vector consists of the values obtained by all four features described in the previous subsections (–). The first three features, which are numerical features, are extracted for each of the l sets of keywords, where l is the number of categories by which we classify the texts. The calculated value of each feature from to is thus described by one of the different floating-point values. In the case of the string feature , the situation is much less complicated. The value of the extracted feature is one string of characters.
From the above considerations, it is clear that the end result of the entire process of extracting text characteristics is a vector consisting of 1 elements, including:
Those from of floating-point values resulting from the extraction of numerical features (from to );
Those from the one string, which is the value of the extracted string feature .
The vectors of the characteristic features of the texts obtained in this way make up the next stage of classification. The last part of this section discusses how the extracted feature vector is interpreted and used in text classification by the K-Nearest Neighbors algorithm.
3.4. Appropriate Classification Process
The classification of texts is a process that involves comparing them with each other many times. However, in order for such a comparison to be possible, the texts must be properly prepared and modeled, and a full process of the extraction of their characteristics must be carried out. As a result of these steps, described in the previous subsections, we obtain vectors consisting of numbers and strings that represent each of the texts.
But how do we compare vectors consisting of different types of data? The answer is to perform a separate analysis for both types of data. The methods used to compare the calculated numerical and string features are described in the following subsections.
3.4.1. Distance Metrics
Selected distance metrics were used to compare the numerical elements of the text-feature vectors. Distance metrics are functions that take the coordinate vectors of two points as arguments. In the case of text classification, the points suspended in the
dimensional classification space (
l is the number of categories by which we classify texts) are texts, or more precisely, their vector representations [
15,
16].
Two distance metrics were implemented in the Text Events Categorizer system:
Euclidean Metric—to calculate the distance
between two points
, calculate the square root of the sum of squares of the differences in coordinate values with the same indices, according to the formula
Street metric (Manhattan, urban)—to calculate the distance
between two points
, calculate the sum of the absolute values of the differences in the coordinates of the points
x and
y according to the formula
At this point, it should be emphasized again that for distance calculations using metrics, only floating-point values are taken into account—the first of vector elements. Strings, i.e., ()th elements of the extracted feature vectors will be compared by using another method dedicated to strings, which is presented in the next part of this work.
3.4.2. Measures of Text Similarity
The last (1) elements of the text vectors are strings (text strings). To compare two strings, it was decided to use the measure of text similarity—the n-grams method:
The
n-grams method determines the similarity of text strings
,
based on the number of common
n-element substrings. It is described by the formula
where
N is the number of elements of the longer string
,
:
and
if the
n-element subsequence starting at the
i-th position in
occurs at least once in
; otherwise,
.
There are the following variants of the
n-grams [
17] method:
1-grams, or unigrams;
2-grams, or bigrams;
3-grams, or trigrams.
In the proposed solution, two of the above methods were implemented: the bigrams method and the trigrams method. The analysis of the above formulas shows that the values obtained by using the n-grams methods are in the range , where 0 means no similarity at all and 1 means full similarity.
3.4.3. Final Result of Text Comparison
There is a very significant difference in meaning between the values returned by the similarity measures and distance metrics.
The distance and similarity functions, in terms of understanding the values they return, are actually inverse functions. A distance value of zero means full similarity, and zero similarity means maximum distance. So, to obtain the final distance between the two texts
and
while completing their comparison, the following should be performed:
where
is the final distance between the texts,
and
are the vectors of the extracted numerical features of the texts,
and
are the strings constituting the last extracted feature,
is the distance between the numerical features of the texts and
is the calculated similarity between the string features of the texts.
The distance D obtained in this way expresses the degree of differentiation of the two texts. The higher the value of D, the more the compared texts differ from each other. However, when the distance D is close to 0, the texts can be considered very similar or almost identical.
3.4.4. K-NN Algorithm
K-Nearest Neighbors is a very simple classifier. The k-NN algorithm is sometimes said to be lazy. This is due to the fact that it does not create an internal representation of the training data and starts searching for a solution only when analyzing a specific pattern from the [
18,
19] test set.
The algorithm stores a set of all the training patterns (in this case, the patterns are text models), against which the distance of the test pattern (the text currently being classified) is calculated, which was defined in the previous subsection—Formula (
24).
The algorithm then selects
k training patterns, called neighbors, to which the currently classified pattern has the shortest distance (in other words, these are the training patterns to which the tested test pattern is most similar). The final result—the category to which the analyzed pattern will be assigned—is the most frequent category among the
K-Nearest Neighbors. In a situation where two or more categories have the same number of representatives, the winner is the category whereby one of the training texts was closest to the classified text [
19,
20,
21].
In the Text Events Categorizer system, the value of
k depends on the examined set of texts, and specifically on its size. The value of
k is calculated by using the formula proposed in [
22]:
where
N is the size of the set of the training texts.
The category determined in this way, by using the K-Nearest Neighbors algorithm, is the result of the entire classification process described in this section. At the same time, it is the application’s answer to the question: “Where does the text fit best?”, which in relation to the previous section of this work can be paraphrased as: “Who should take care of this event? Where should it go?”.
The next section of this work concerns the technical aspects of the Text Events Categorizer system. The results of the classification for exemplary collections of texts are discussed in
Section 5.
4. Technical Aspects of Text Events Categorizer Approach
The
Text Events Categorizer system is used to classify the text events of various types, originating from various industrial processes. The system implements the entire classification process, which was described in the previous section. The solution provides the user with a number of possibilities related to the creation, management and use of text datasets.
Figure 3 presents the use case diagram for the system.
The functioning of the system is based on many complex operations on large text datasets, which in the Text Events Categorizer are called datasets. The system should be able to create a dataset by defining the following properties: (1) names; (2) password to access and manage the dataset; and (3) a set of texts by attaching a file in .xlsx format, containing a set of text data with categories in a clearly defined form: the file should consist of two columns, the first of which contains the category of a given text and the second full of its content.
The
Teach dataset function initiates the preparation of the texts for classification; i.e., for each of the texts belonging to a given dataset, it performs all the activities described in
Section 3, except for the proper classification process, i.e., (1) text preparation, (2) the determination of keywords and (3) the extraction of text features. After this process, which is called
learning in the system, the dataset goes from
unlearned to
learned. The next two functions
perform test classification and
classify new text are possible only for datasets in the
trained state.
It is worth mentioning here that if the user uses add new records to the dataset option, after having been prepared for classification (training), it will return to the unlearned state and the learning process will have to be repeated.
Perform test classification—for the learned dataset, the system should provide the ability to perform a test classification of all texts. Such a process assumes the proper classification for each of the texts from a given dataset. For this purpose, for each of them, the system should perform the following series of steps: (1) exclude the text from the training set (remove it from the classification space), (2) carry out the proper classification process and (3) check the correctness of the classification.
Classify new text—the most important function for the
Text Events Categorizer system, which assumes that for a dataset in the
trained state, the system fully classifies the text entered by the user, and it goes through all the stages of the classification process described in
Section 3. The user then evaluates the correctness of the displayed category by choosing one of three answers to the question asked by the system:
Is this category correct?: (1)
yes; (2) no—in this case, the program asks the user to enter the correct category for the entered text; and (3)
I do not know. Depending on the user’s response, the system responds accordingly. If the answer is
yes or
no, i.e., learning about the correct category for the text, the text is appended to the set of texts, which remains in the
learned state. If the user selects
I do not know, the text will not be saved as a new record.
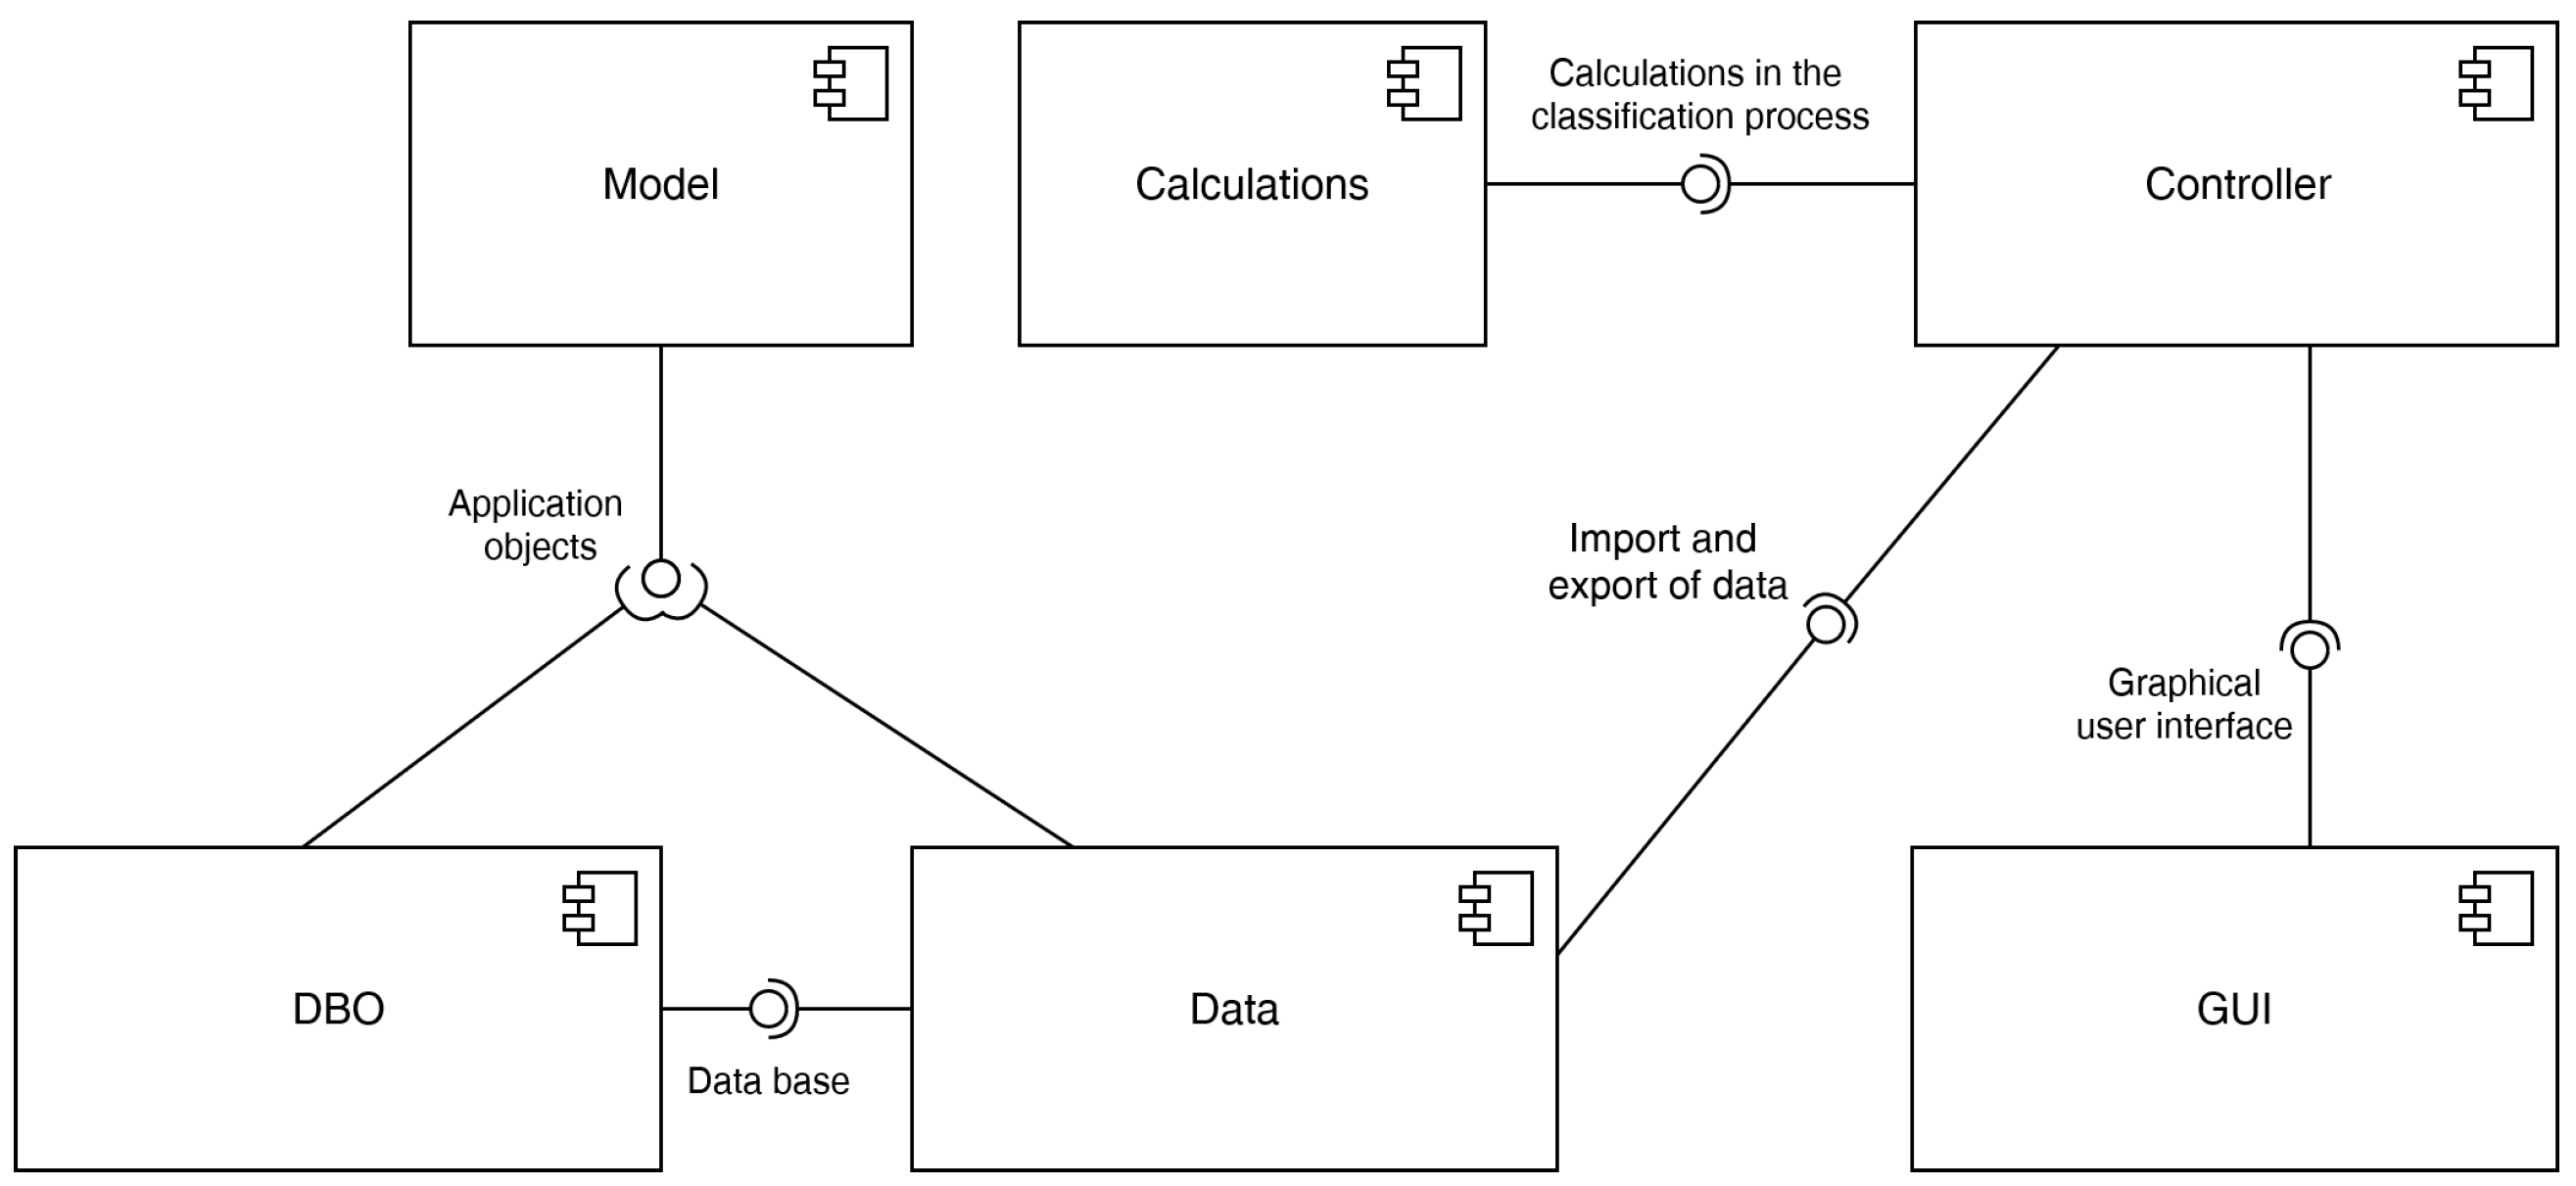
The architecture of the Text Events Categorizer system is presented in
Figure 4.
The dataset in the system’s database is represented by the following attributes: (1) id—the dataset identification number; (2) beingManagedNow—the flag specifying whether there is a user who currently manages a given dataset; (3) learned—the flag specifying the current state of the dataset; (4) name—the dataset name; (5) password—the dataset password; (6) records—the number of texts (records) in a given dataset; and (7) size—the memory size in bytes occupied by the dataset.
The single text representation in the database includes (1) id—the text identification number; (2) category—the category object to which a given text belongs, consisting of its identification number and name; (3) features—the array containing the extracted numeric features of a text when it is in the trained state (when the text is in the unlearned state, the features array is empty); (4) textFeatures—the array containing the extracted string features of the text (similarly, the textFeatures attribute also remains as an empty array as long as the text is in the unlearned state); and (5) sentences—the array of individual sentences of the text, represented by a table of the words occurring in them.
The classes responsible for the classification process are presented in
Figure 5.
One of the functions of the
Text Events Categorizer system is the
train dataset used to extract all the features from all the texts in the dataset. Performing a complete dataset training process allows one to classify text events from that dataset. The interaction overview diagram for the
train dataset function is shown in
Figure 6.
5. Analysis and Verification of Text Events Categorizer Approach—Classification Results
This section discusses the results of the classification performed on three selected datasets by using the Text Events Categorizer system. Firstly, the measures of the classification quality are defined, then the selected datasets are used to test if the system is working and finally the results of the experiments are presented and analyzed.
5.1. Classification Quality Measures and Selected Datasets
In order to assess the quality of the classification, the three most popular quality measures were used:
Measure of effectiveness (
accuracy):
Measure of precision (
precision):
Sensitivity measure (
recall):
The following notations were adopted in the above formulas:
TP (True Positive) is the number of texts correctly classified as a given category;
TN (True Negative) is the number of texts correctly classified as other than the examined category;
FP (False Positive) is the number of texts incorrectly classified as the examined category;
FN (False Negative) is the number of texts incorrectly classified as other than the examined category.
In order to conduct the classification tests by using the Text Events Categorizer system, it was decided to select three sets of text data, which were given the following designations along with names referring to the companies they come from:
set —Experian Informatic Solutions;
set —Bank Of America;
set —Reuters Articles.
The first two datasets
Experian Informatic Solutions and
Bank Of America come from the
Consumer Complaint Database [
23] and are closely related to the issues of work discussed in
Section 3. They contain reports from customers of the two above-mentioned American companies, which were sent to customer service offices. The sets
and
are therefore sets of text events, perfectly fitting into the problem described in
Section 2.
The last
Reuters Articles dataset consists of news articles from the
Reuters news agency [
24]. The set
is a completely different set in relation to the other two sets. Press articles are characterized by a completely different language and structure than reports received by customer service offices. The
set was chosen precisely because of its difference, which will allow us to verify the quality of classification for text data of a completely different type, coming from a market sector very distant from the activities of the companies from which the data constituting the
and
sets come from.
The dataset contains 4274 texts divided into three categories. Due to the long names of individual labels (category names), it was decided to introduce the following designations to represent each of them:
Category —credit-reporting company’s investigation;
Category —incorrect information on credit report;
Category —problem with a credit-reporting company’s investigation into an existing problem.
The number of texts for each of the three labels is listed in
Table 1.
The
dataset consists of 4318 texts divided into three categories. The structure of the
Bank Of America dataset is presented in
Table 2.
The largest set of texts is the
set, which includes 6290 press articles divided into four groups (
Table 3).
5.2. Course of Experiments
The experiments began by creating in Text Events Categorizer system for each of the text datasets described in the previous subsection, the corresponding datasets with the same names. The purpose of the experiments was twofold:
Checking the quality of the Text Events Categorizer system classification for the selected datasets;
Verifying that the proposed novel mechanisms of the dynamic extension of stop list and weighted keywords effectively solved the problems that occur with the use of conventional keywords and a fixed stop list. To this end, the impact of using the proposed solutions on the quality of the classification was tested.
The aim of this research was therefore not only to determine the quality of the classification for three sets of data but also to determine what impact the use of the proposed mechanisms in the feature-extraction process has on the quality of the classification (primarily on its effectiveness).
For this purpose, two series of experiments were planned, consisting of carrying out a test classification for each of the three sets of data for which the process of feature extraction was carried out:
During the experiments in Series 1, the Text Events Categorizer system was modified so that it does not use the mechanisms mentioned above. An additional modification needed to perform all the planned tests was the system’s calculation of the remaining classification quality measures, precision and sensitivity, and writing their values on the console screen. In all the experiments, the street metric was used to calculate the distance between the texts.
5.3. Obtained Results
The presentation of the results began with the most important and most intuitive measure of quality—effectiveness—and then moved on to the measure of precision and then to the values achieved by the measure of sensitivity.
5.3.1. Classification Efficiency
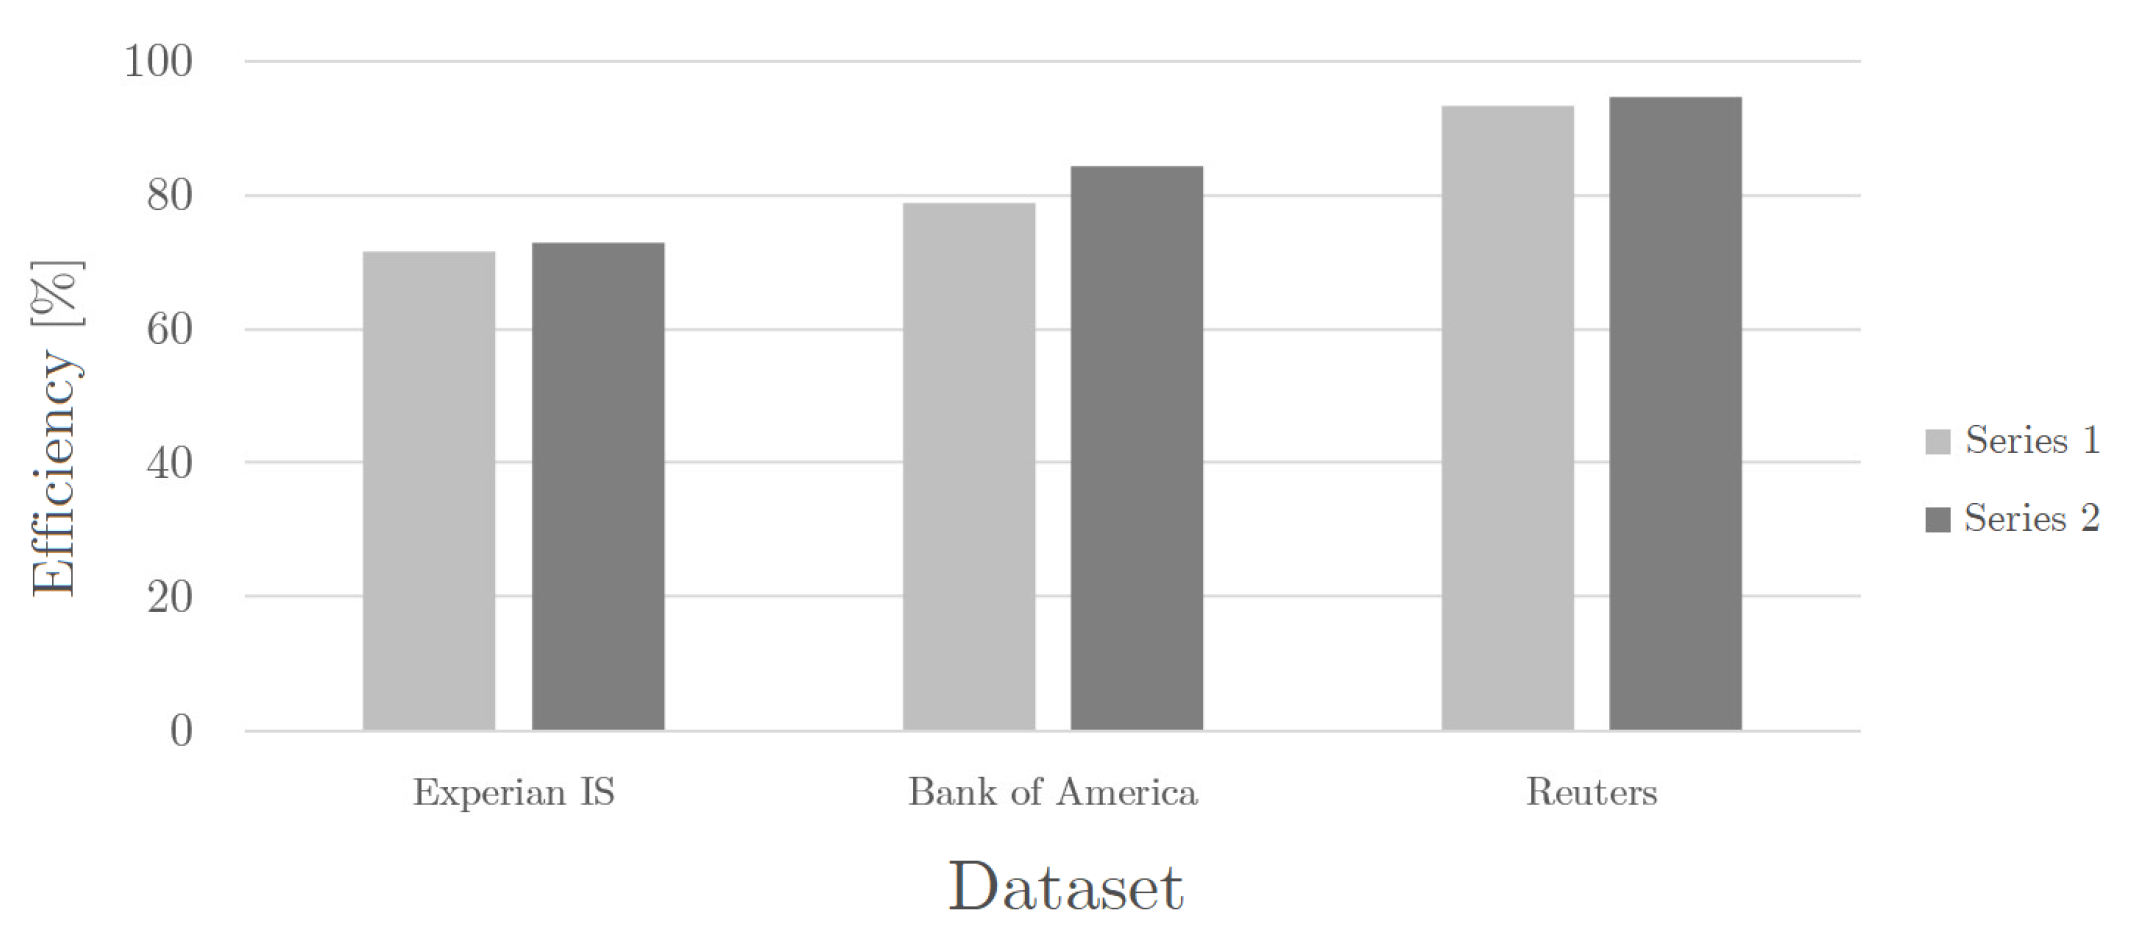
Table 4 and
Figure 7 demonstrate the efficiency of classification for each of the experiments performed. The data show that the lowest classification efficiency values were achieved in both series of experiments for the
dataset. The efficiency for the
set was higher than for the
set but much lower than the classification efficiency obtained for the
set, which significantly exceeded
for both sets of experiments.
5.3.2. Classification Accuracy
Table 5 and
Figure 8 present the results of the classification accuracy obtained for each category from each dataset for both series of experiments. As in the case of the efficiency results, the best results were obtained for the
dataset. The accuracy values obtained for the individual categories of the
and
sets are at a similar level, and in most cases they range between
and
. The exception is the experiment using
Series 1 for the category
from set
, for which the classification accuracy was calculated to be zero.
5.3.3. Classification Sensitivity
This subsection presents the calculated classification sensitivity values for each of the labels in the datasets studied (
Table 6 and
Figure 9) for both series of experiments performed. The calculated classification sensitivity values are definitely the highest for the
dataset. Worse results, although still higher than
for each category, were obtained for the
dataset. Definitely the lowest classification sensitivity results, not exceeding
, were obtained for categories
and
from the
dataset.
5.4. Discussion
This subsection discusses the results of the performed experiments, presented in two parts. The first one focuses on the results of the classification efficiency, and the second one focuses on the values achieved by the other two quality measures.
5.4.1. Classification Efficiency
Classification efficiency is by far the most important and also the most intuitive measure of classification quality. It informs us about the percentage of correctly classified texts.
The classification efficiency for all the experiments was above 70%, which is definitely a satisfactory result (
Table 4 and
Figure 7). The most difficult set of texts for classification turned out to be
, for which the worst classification efficiency was achieved, both in
Series 1 and
Series 2 (values slightly exceeding 70%). The middle place in the hierarchy of classification efficiency with a much better result (about 80% depending on the series) is occupied by the
set. The best efficiency values, significantly exceeding 90% in both test series, were obtained for the
set.
Based on the analysis of the obtained results, it can be seen how the structure of the set affects the effectiveness of classification. For this purpose, it is necessary to look at the names of the categories into which the texts from individual collections were classified.
All three labels for are very similar, each containing the expression credit report. After reading these three names, we may come to the conclusion that it is practically impossible for a person without proper banking knowledge and knowledge of Experian Informatic Solutions procedures and methods to correctly classify the texts in this collection on their own. Such a slight difference in meaning between the names of the categories translates into a very high syntactic similarity between the texts from different labels in this collection, thus making it very difficult to classify. Nevertheless, the Text Events Categorizer system coped quite well with the classification task set before it, achieving a high efficiency of over 70% (the analysis of the calculated precision and sensitivity values in the following subsections allows for a better interpretation of the obtained efficiency).
In the case of the set, the names of the categories are much more diverse. Despite the fact that they still all concern the banking sector, each of them represents a different part of it. Such a structure of the set implies less syntactic similarity between the texts representing different labels, which is the reason for the higher classification efficiency than in the case of .
The set is completely different from its predecessors. The text data in this collection are press releases, divided into thematic categories. In this case, the texts from individual categories are very different from each other, both in meaning and syntactically. Therefore, Reuters Articles are by far the easiest to classify and achieved the best performance results.
The
Figure 8 clearly shows that each of the experiments in
Series 2 yielded a higher classification efficiency value than the corresponding experiment in
Series 1. The difference between the calculated values ranges from
for the
set to less than 6% for the
set. For each set, the difference in the classification efficiency for the
Series 1 and
Series 2 experiments is therefore noticeable.
After considering the research results listed above for both series, a preliminary thesis should be put forward that the use of the proposed novel mechanisms in the extraction process, the dynamic extension of stop list and weighted keywords, has a positive impact on the efficiency of the classification for each of the analyzed datasets. However, the effectiveness is only one of the components used to assess the quality of the classification.
5.4.2. Accuracy and Sensitivity of Classification
The effectiveness of the classification is often not sufficient to objectively assess the quality of the classification carried out. To obtain a fuller picture of how effective the individual experiments were, we need to use other measures of classification quality—accuracy and sensitivity.
This part focuses on the values of the accuracy and sensitivity measures for the
dataset (
Table 5 and
Table 6 and
Figure 8 and
Figure 9), and we compare them with a relatively high and satisfactory classification efficiency:
in
Series 1 and
in
Series 2.
When we first look at the classification accuracy and sensitivity diagrams for the Experian Informatic Solutions dataset, we can easily see that one light gray bar is missing in both diagrams. It turns out that both the accuracy and sensitivity for the category for the Series 1 classification have a value of zero. Such values of accuracy and sensitivity measures mean that no text was classified in this category (neither correctly nor incorrectly), which shows that a high classification efficiency does not necessarily imply high quality. For the discussed experiment, the high efficiency of classification is mainly related to the large number of correct classifications of texts into the category, which is by far the largest group of texts in this set.
At this point, however, it should be noted that both the results of the sensitivity measure and measure of accuracy for the analogous experiment for the set in Series 2 is not zero, and in the discussed diagrams there is a set of dark gray bars unlike their brighter neighbors. It turns out that in the second iteration of the research, the Text Events Categorizer system managed to correctly classify a small part of the texts in the category. Such results again highlight the proposed solutions used in the Series 2 experiments as having a positive impact not only on efficiency but also on the overall quality of the classification.
However, to confirm the beneficial effect of using the
dynamic extension of stop list and
weighted keywords on the quality of the classification, it is necessary to compare the values achieved by the accuracy and sensitivity measures for each pair of experiments, conducted for all three examined sets. The necessary data can be found in
Table 5 and
Table 6 and in
Figure 8 and
Figure 9. After carefully analyzing this data, it should be noted that
The accuracy metric values are greater for the Series 2 experiments in most cases. The differences range from almost for the Mortgage category in the set in favor of the Series 2 study to less than for the Credit Card category and also in favor of the Series 1 experiment. Only in the case of two categories was a higher measure of accuracy obtained for the Series 1 experiments—in addition to the already-mentioned Credit Card category for the set, this was also the case for the money supply for the set.
The values of the sensitivity measure are higher for the studies from Series 1 in all cases, except for the category for the set. The record difference in favor of the experiment from the second iteration was obtained for the Credit Card label from the set—less than .
Taking into account the discussed results and summarizing the discussion of the presented research findings, a final conclusion can be drawn, confirming the noticeable and positive impact of using the proposed innovations in the feature-extraction process on the quality of the classification for all the selected datasets. However, it is important to note that, based on the relatively small number of detailed studies, it would be premature to conclude that the dynamic extension of stop list or weighted keywords will significantly improve the ranking for all the existing datasets. Nevertheless, the utilization of the novelties proposed in this paper is certainly worth considering in the context of designing similar systems or processes for text classification.
6. Conclusions
This paper presented the classification of texts as an issue that can solve many problems related to the use of very large sets of text data collected by enterprises from various industries. To achieve this purpose, we made an attempt to implement a universal system for the classification of text events, which for properly structured datasets from various industries will be characterized by a satisfactory level of efficiency and quality of classification. The obtained classification quality results are definitely satisfactory. The proposed system implementing the designed text-classification process, taking into account two fully original solutions, is an effective attempt to at least partially solve the problem posed in
Section 2.
The results of this research demonstrated that the quality of the classification for text events from selected industries, as offered by the Text Events Categorizer system, is indeed satisfactory. However, the most important conclusion drawn from the analysis of the obtained results is the positive impact of using the proposed novel mechanisms on the efficiency and quality of the classification. The demonstrated innovative solutions, namely the dynamic extension of stop list and weighted keywords, effectively mitigate the disadvantages of using a fixed stop list and classical keyword extraction approach, such as the TF method.
The future of text classification looks bright, but at the same time, it is very difficult to predict. It should be mentioned here that in addition to the K-Nearest Neighbors algorithm used and described in this paper, there are other methods of text classification based on, e.g., a Naive Bayesian classifier, decision trees or neural networks. Which of the listed solutions will become the dominant and most effective method for text classification, or maybe an even more interesting and effective classification method will emerge? The question posed in this way must wait for an answer, although it will not be easy.


