1. Introduction
The simulation model reproduces the real object or system while maintaining the correct functioning of the real object [
1]. The dynamic technological development in the field of computer science in recent years has resulted in the fact that many software programs dedicated to creating simulations in various fields of engineering are now available on the market. Many of them have found applications in production engineering. Simulations provide the opportunity to analyze digital models that can provide data to various departments of the enterprise. Simulation models are often used to design production systems, including extended lines or single cells [
2]. With their help, you can also analyze existing production processes and improve them. It is possible to perform many iterations, trials, and tests of different variants as well as to compare the results obtained to select the most appropriate and effective production strategy at a given moment [
3]. Simulation models of production processes are also part of digital manufacturing and digital factories [
4].
The development of simulation models at the stage of designing a new product and the simulation of the functioning of the production line or even the entire production system gives many benefits [
2]. The tests, carried out using a simulation model, are carried out digitally. This makes it possible to avoid interference with the real model [
5]. In simulation programs, it is possible to control time, so you can speed up and slow down the simulation. This allows for significant time savings during experiments. Simulation allows analyzing errors and facilitates work on their elimination [
6]. Thanks to this, it is possible to reduce production costs, shorten the production time, and improve the quality of the product.
The concept of Industry 4.0, which aims to digitize the production process with minimal human intervention, introduces concepts such as virtual and augmented reality, hybrid simulation, or digital twin [
7]. Currently, artificial intelligence or virtual reality is a typical supporting technique used in simulations [
8]. In recent years, a technology known as “digital twin” has emerged, which combines the data-driven real-time monitoring of real objects with scenario simulation. The purpose of using a digital twin is to improve the functionality and increase the efficiency of processes [
9]. The digital twin is not only limited to focusing on one entity but can also be applied to entire systems, thus creating a broad approach to the digitized factories of the future [
10,
11,
12].
The purpose of this work was to develop and verify a simulation model of an automated assembly line, which is part of the Smart Factory laboratory of the Poznań University of Technology. The development of such a simulation model was to allow for the analysis of various production scenarios, which are the basis for the work carried out in the laboratory. Testing various scenarios in a short time was completed to facilitate the selection of the best variant of the production scenario, given the criteria. The simulation model can be used both in the didactic area (during laboratory classes) and in the implementation of various research works. Selected production scenarios will be checked in the simulation model and improvements can be made to obtain, for example, the shortest possible assembly times for a given product.
2. Application of Simulation Models
2.1. The Use of Simulation
Simulation is a research method used in many branches of science and industry. There are many examples of computer simulations that have been used in various areas of human activity. Computer simulation is used, for example, in training specialist skills such as pilots [
13], machine or production operators [
14,
15], or high-voltage engineers [
16]. On the other hand, simulations of motion and systems of bodies allow for conducting complex experiments in the field of mechanics [
6]. Advanced algorithms allow the creation of weather simulation models based on data collected from various weather stations.
Methods of modeling engineering processes are used in issues related to logistics, starting from supply through production, order fulfillment, distribution, disposal, and storage. They are also used in the phases of the life cycle of technical systems, i.e., planning, implementation, or operation. Warehouse process modeling makes it possible to determine the capacity of warehouse facilities and their location. You can analyze transport systems, queuing receipts, and accepting loads.
Analytical methods using computer simulations are becoming more and more popular, because thanks to the rapid technological development in the field of computer science, they have more and more possibilities. Therefore, the use of modeling and simulation in manufacturing engineering is inevitable. They are used in production processes to analyze the entire process, but also to test the functioning of an object in a short time, which can be an operation, activity, station, warehouse condition, etc. [
5]. The modeling and simulation of manufacturing processes allow for checking the adopted guidelines before their implementation in the real model and also allow for the detection of imperfections that may occur in the future during operation [
9].
2.2. Simulation Environment
Currently, there are many programming environments available that allow you to build advanced simulation applications or a digital twin solution. Depending on the specific needs, context and purpose of the simulation, it is possible to use both open environments (e.g., Unity) and dedicated ones (FlexSim or Tecnomatix Plant Simulation). Due to the use of Tecnomatix Plant Simulation software in the work, it will be presented in more detail.
2.3. Tecnomatix Plant Simulation
Tecnomatix Plant Simulation is a discrete event simulation program [
17]. With its help, it is possible to create a digital twin for the real process [
18,
19]. Simulation software from Siemens is used to simulate production processes and systems as well as logistics systems. The program can be used at all stages related to the process and system, from planning and design, through simulation and verification, to implementation and management [
20]. Plant Simulation is a good tool for modeling complex digital models of various types of systems [
21]. The simulation program allows you to quickly test many experiments and scenarios without the participation of a real model and then analyze and optimize existing, real processes. Thanks to the simulation, it is possible to test many scenarios of the process that is in the design phase and then choose the best solution to implement a sustainable production process [
22]. It is possible to optimize the flow of material, facilitate the effective use of resources, and streamline logistics processes [
23].
Modeling takes place in a 2D and 3D environment. Plant Simulation uses a hierarchical structure in which even the most complex simulations can be easily edited and analyzed [
24]. Copied objects, thanks to their hierarchical structure, inherit properties from each other. This makes it possible to copy the finished simulation model to a new simulation [
25]. Tecnomatix Plant Simulation can be connected to a PLC [
26]. The developed simulation model can be combined with virtual reality using Go VR. This function allows you to connect to HMD or VR glasses [
27,
28].
The benefits that can be obtained thanks to the use of Plant Simulation software include [
23,
29,
30,
31]:
Quick design and optimization of the technological process;
Assembly planning and verification;
Verification of the use of robots and automated devices;
More efficient arrangement of machines and warehouses;
Better quality management;
Analysis and reduction in energy consumption;
Maximum use of production machines;
Faster achievement of positive results and definition of consequences;
Testing innovative strategies in a secure virtual environment;
Quick identification of the source of the problem in the production area;
Reducing the investment risk by using quick verification in the simulation.
Tecnomatix Plant Simulation supports product lifecycle management. The possibility of continuous analysis of processes, thanks to the use of simulation, allows for continuous improvement and thus contributes to the success of companies.
2.4. Application of the Program on Selected Examples
Tecnomatix Plant Simulation finds practical application in many areas of industry, but it is also often used in scientific studies. There are many research papers where the Plant Simulation program was used.
An example of the use of Plant Simulation can be the analysis of the machining process described in the work of Janisz, Mikulca and Górka [
32] The shaft machining process consisted of cutting, centering, turning and grinding. After the first simulation, it was confirmed that turning is the bottleneck. Then, various configurations of the arrangement of machines responsible for turning operations were simulated in order to obtain the assumed efficiency of the process. Thanks to the simulation, it was possible to quickly find the right machine placement to achieve the assumed capacity, but at the same time, the first two operations had more than half of the unused capacity buffer. Simulation gives the opportunity to find areas of cost reduction, efficiency improvement and can help in risk analysis.
Fedorko et al. in their work presented the application of the Tecnomatix Plant Simulation system to build a simulation model of an intersection with traffic lights [
33]. Such a simulation can help to better understand and analyze traffic, assess problems and propose the best solution for sustainable urban development. The program enables the creation of complex models, e.g., design and planning of industrial parks, where the simulation will help identify problems that could worsen the traffic situation in transport nodes. To sum up, Tecnomatix Plant Simulation allows for the creation of full-scale microscopic motion models. It is suitable for modeling and simulating traffic and allows the visualization of various road processes.
Tecnomatix has also found its application in the expansion of production in the production plant [
34]. The company has built a new room where production will be located. Using a simulation model, proposals for the arrangement of machines and workstations were prepared. The model can be modified many times, thanks to which various solutions for a new production are verified in a simple and effective way before starting the process. The program helped detect some problems that were not foreseen in the initial design. Thus, it can be concluded that simulation is a good tool at the stage of production planning.
Kovbasiuk, Balog and Židek in their work used Plant Simulation as a solution that can support the transition from manual to semi-automatic or automatic assembly [
35]. At the very beginning, it was determined which assembly tasks were suitable for automation, and then a semi-automatic station was designed in the program. As a result of the simulation, the time at the semi-automatic station is 35% shorter than with manual assembly. Such a stand can still provide flexibility in production. Thanks to the simulation in the program, it was shown that semi-automatic assembly can be profitable for a company that wants to implement it.
Tecnomatix Plant Simulation is software with a wide range of applications. The functions of the program enable the creation of complex simulation models, and the possibilities of the program are not limited only to the creation of models for production and logistics systems.
3. Automated Assembly Line
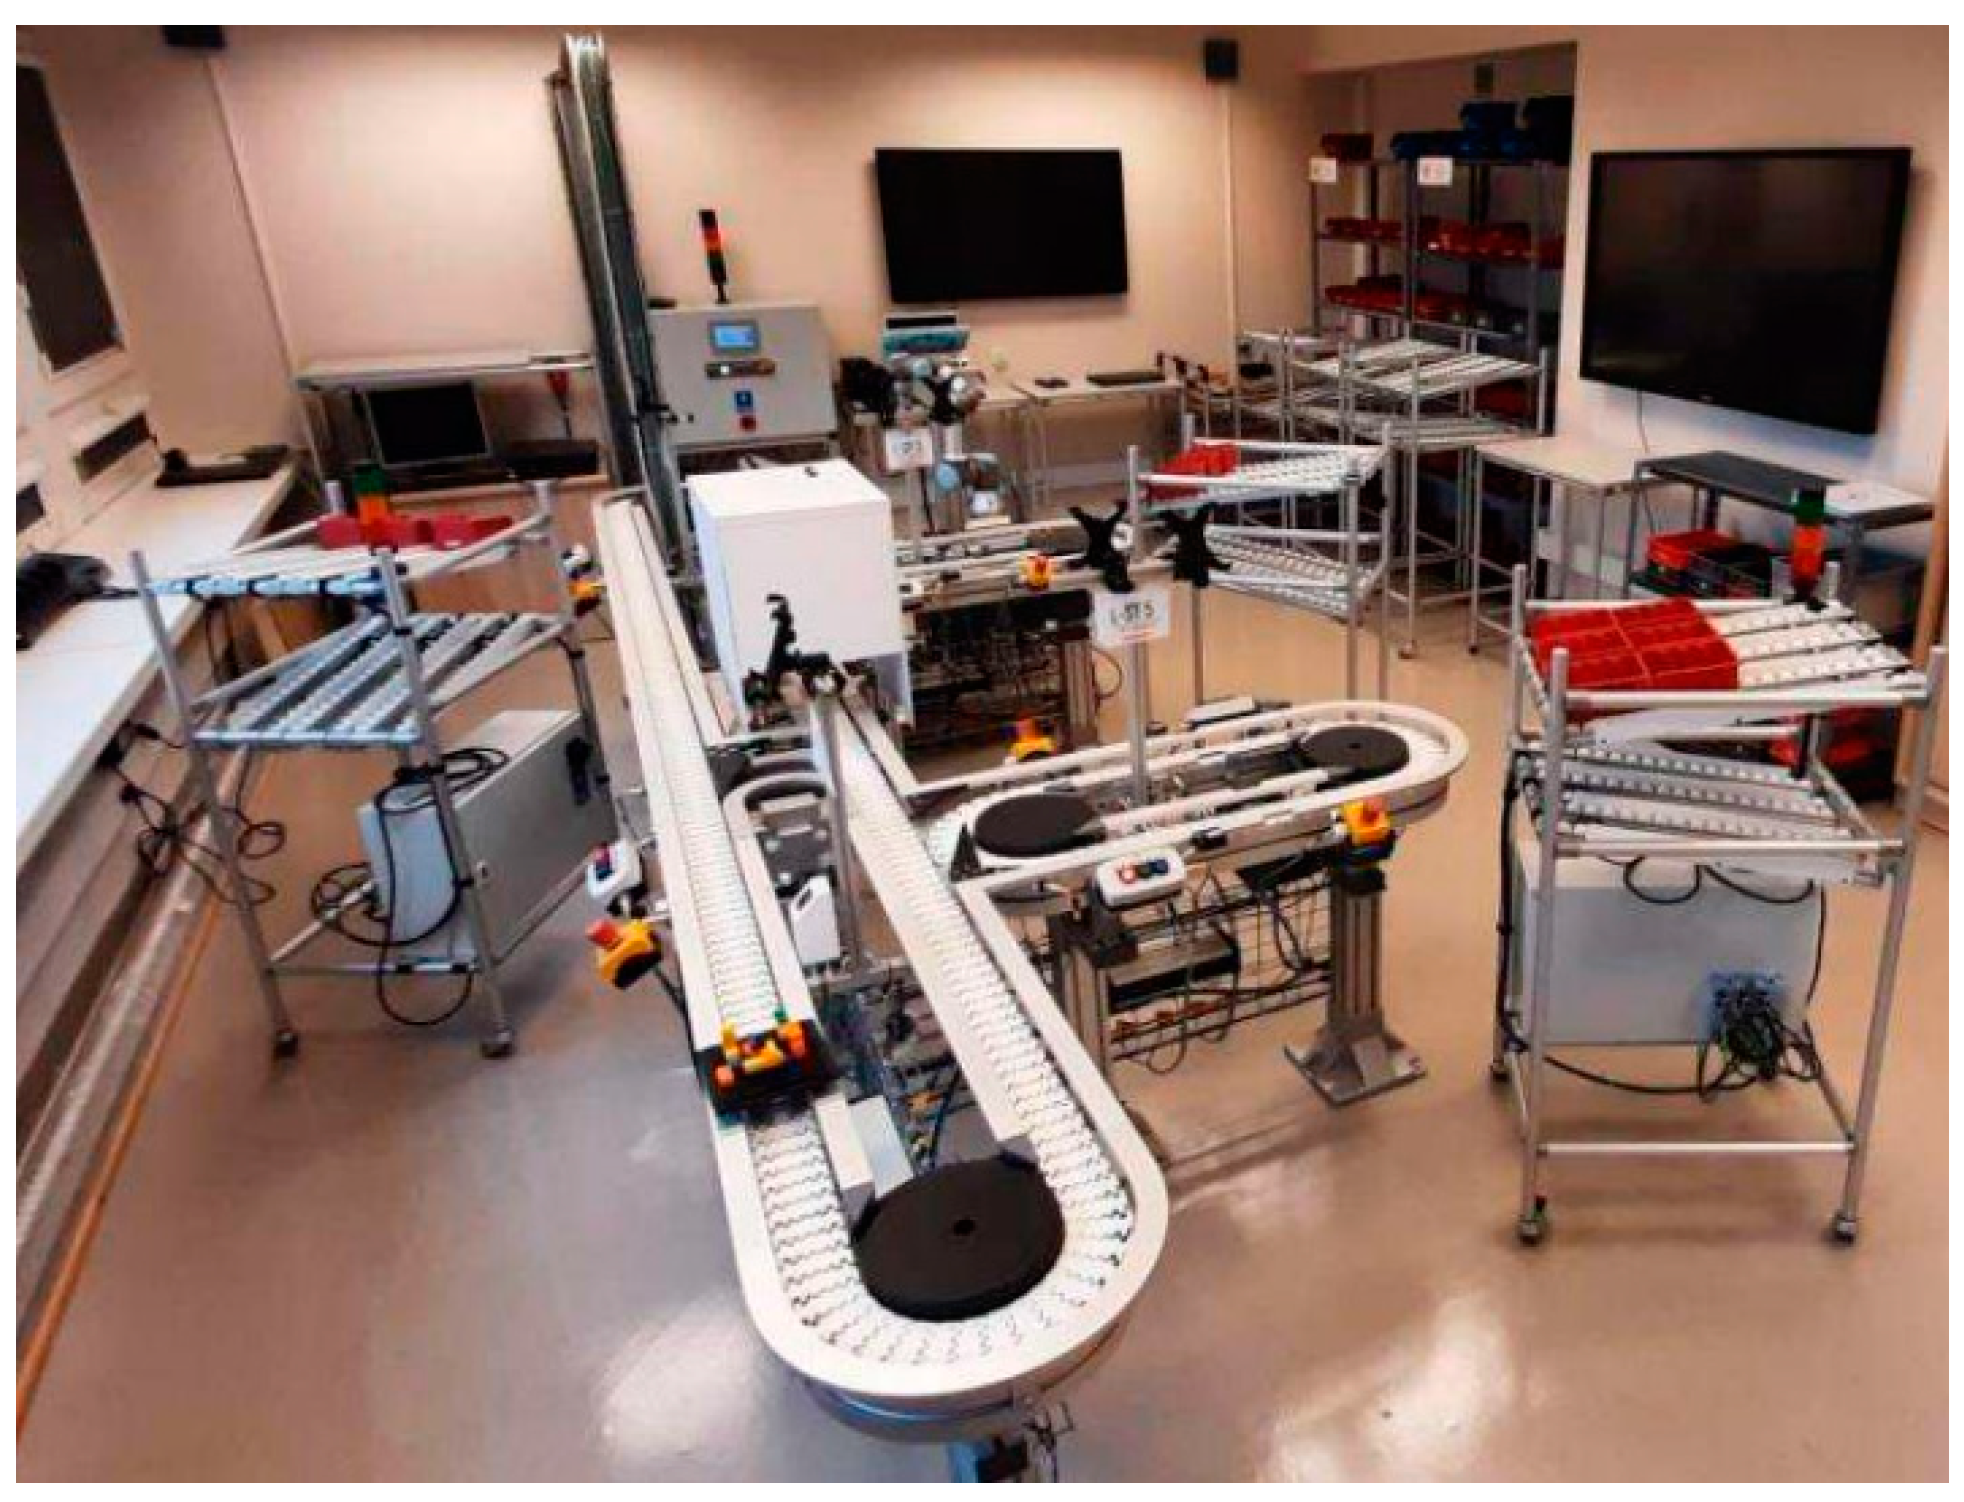
The Smart Factory laboratory has been developed at the Poznań University of Technology for several years. The equipment allows conducting both didactic and research works in which the basis is the preparation, commissioning, control, supervision and analysis of various scenarios of the production process. The laboratory equipment (
Figure 1), in addition to the assembly line with the controller, also consists of a warehouse for parts and finished products and workstation racks.
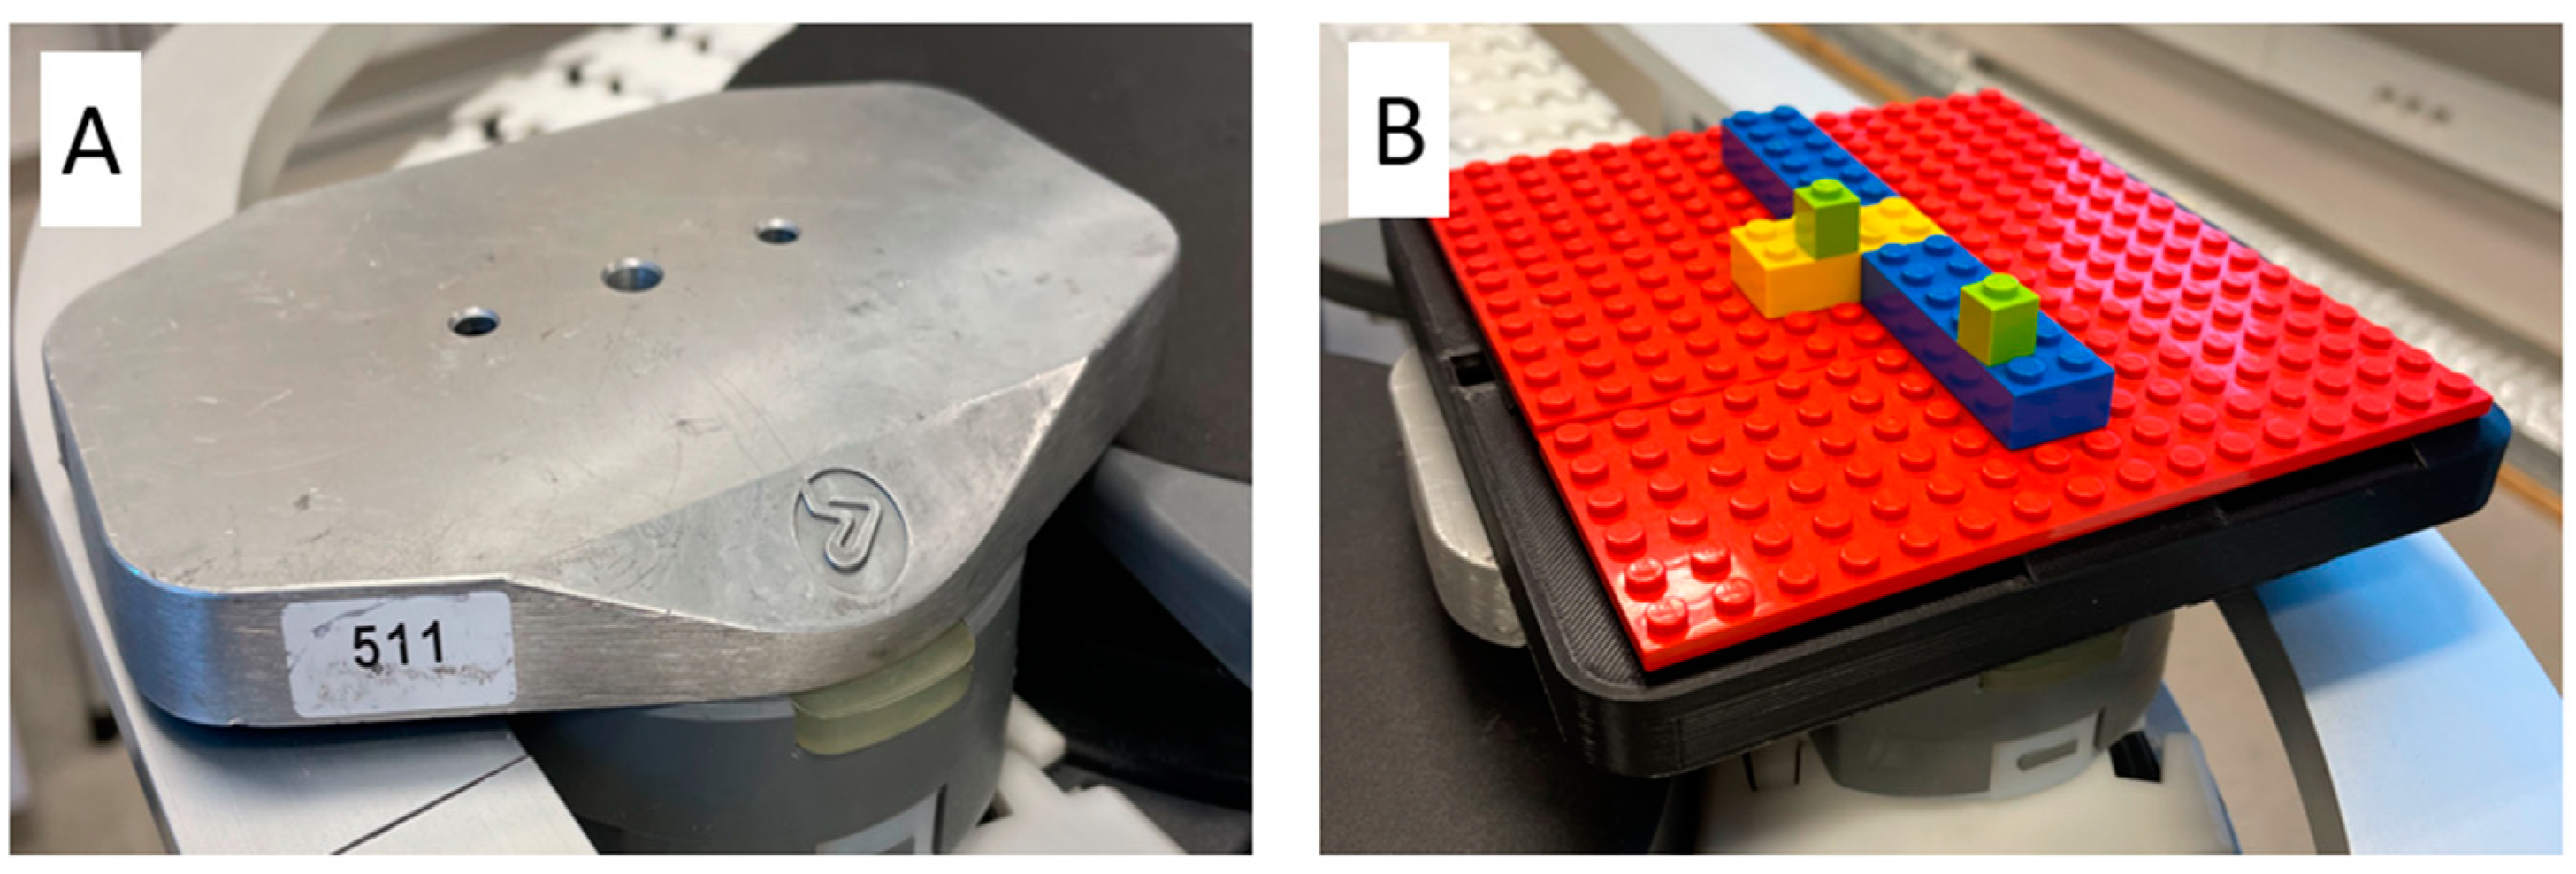
Each production scenario provides for the production of specific products that are assembled using an automated line that transports special pallets (
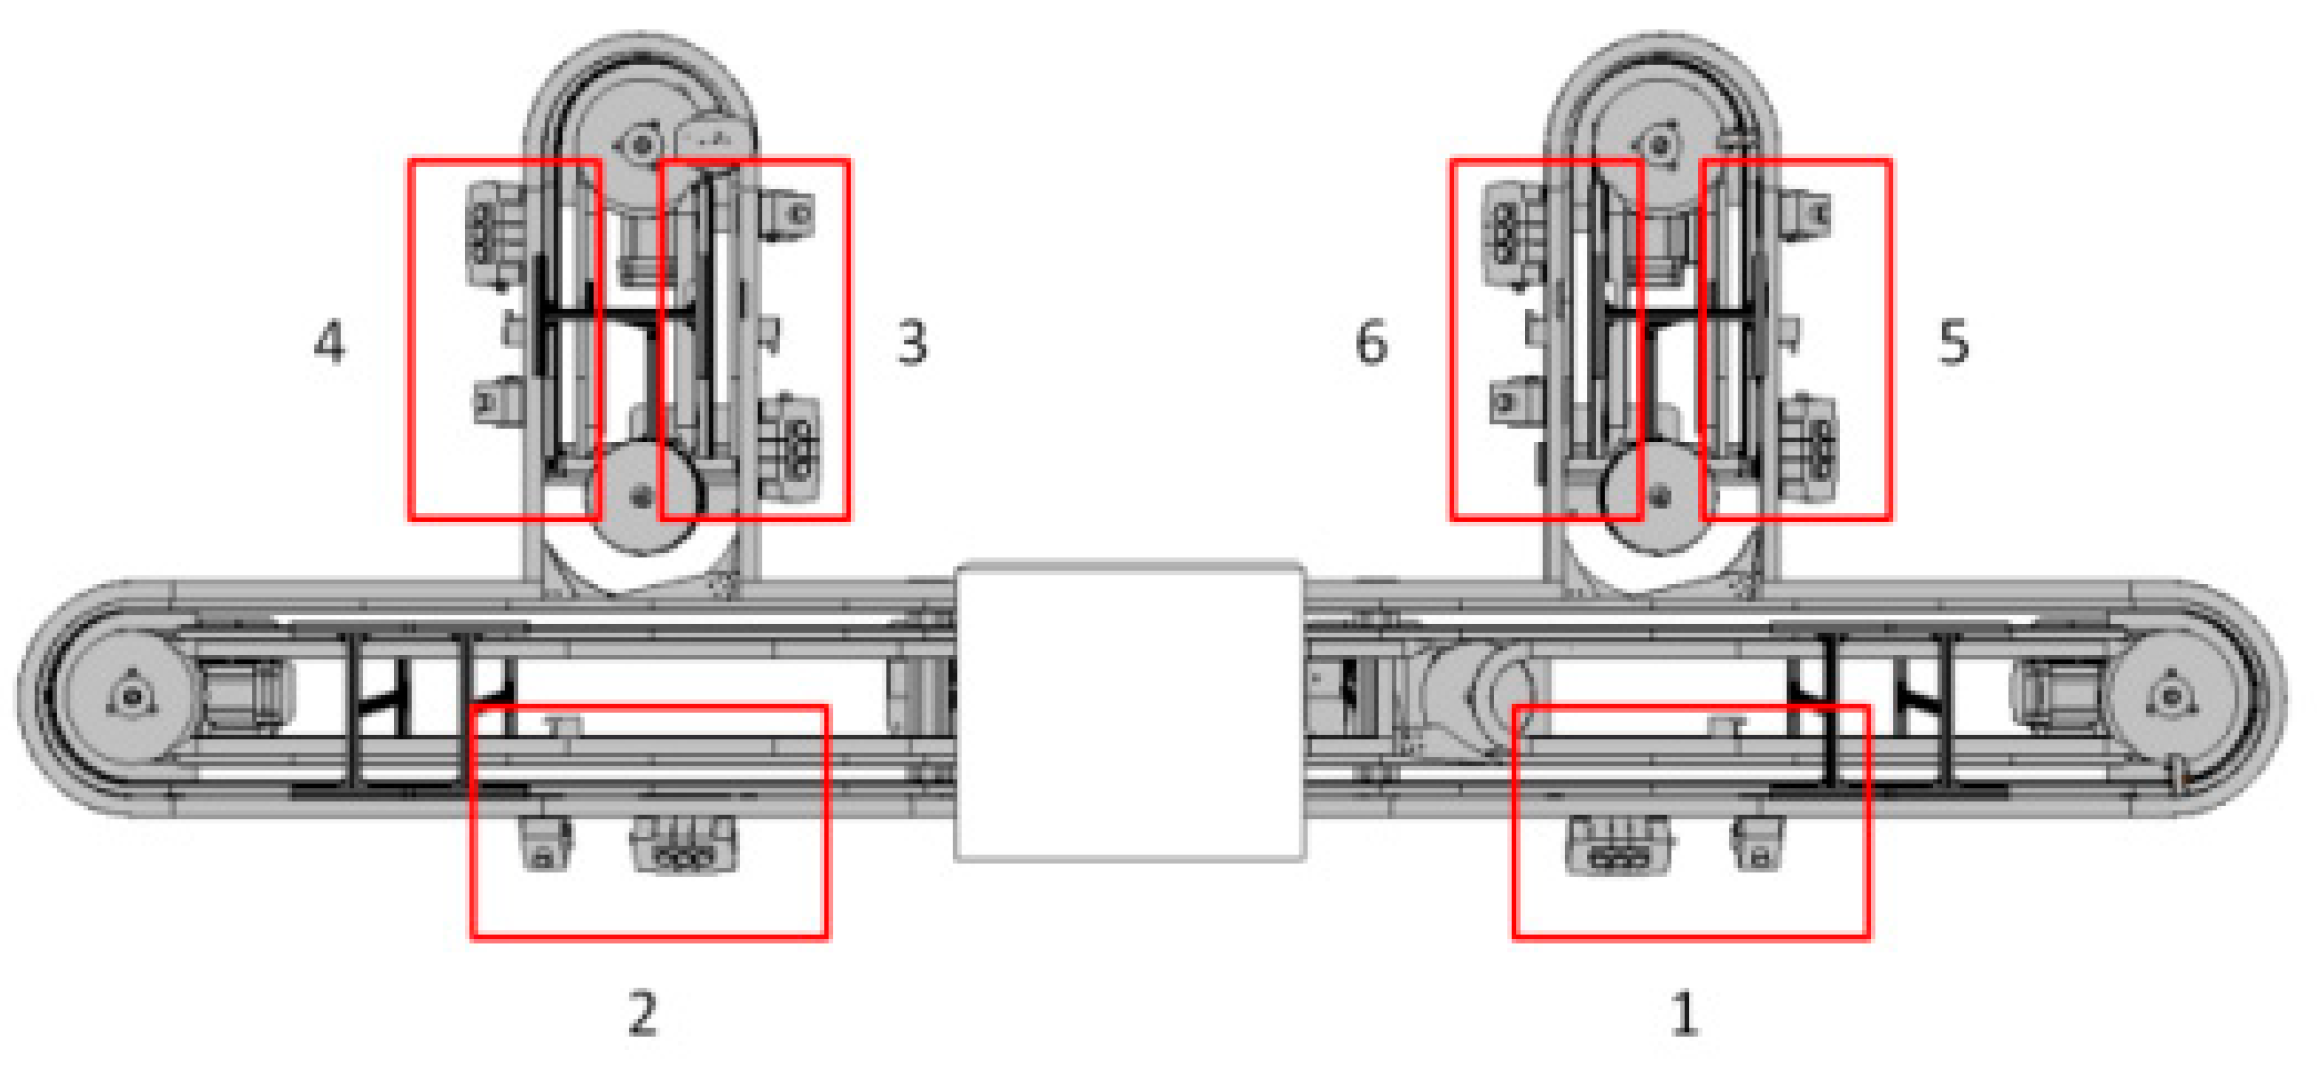
Figure 2). The assembly line consists of six operator stations where subsequent parts of the product are assembled. The pallets move along the line automatically, while the pallet release can be automatic (based on the parameters of the control program) or manual (control by the station operator). The arrangement of the assembly stations is shown in
Figure 3.
Products manufactured on the assembly line are made of various types of blocks, differing in size and color. The blocks at the stand are in cuvettes placed on the stand rack. The blocks are mounted on special trays, which in turn are mounted on pallets transported along the line. There can be six pallets on the line at the same time. Each pallet is assigned its own identification number, which is read by sensors located at each station, which allows for the implementation of a program prepared and stored in the controller’s memory.
Determining the route of pallets on the automated assembly line is completed using a line controller equipped with a control panel. In the panel, you can select through which stations and in what order a given pallet is to pass; however, the system limits the selection to nine stations. You can choose manual or automatic workstation operation mode.
In the automatic mode, it is possible to set the pallet’s standstill time at a given position. The pallet on the stand is locked with a mechanical lock. On the main screen of the controller panel, the current travel scenario and the status of the task are displayed.
4. Developing the Automated Assembly Line Model
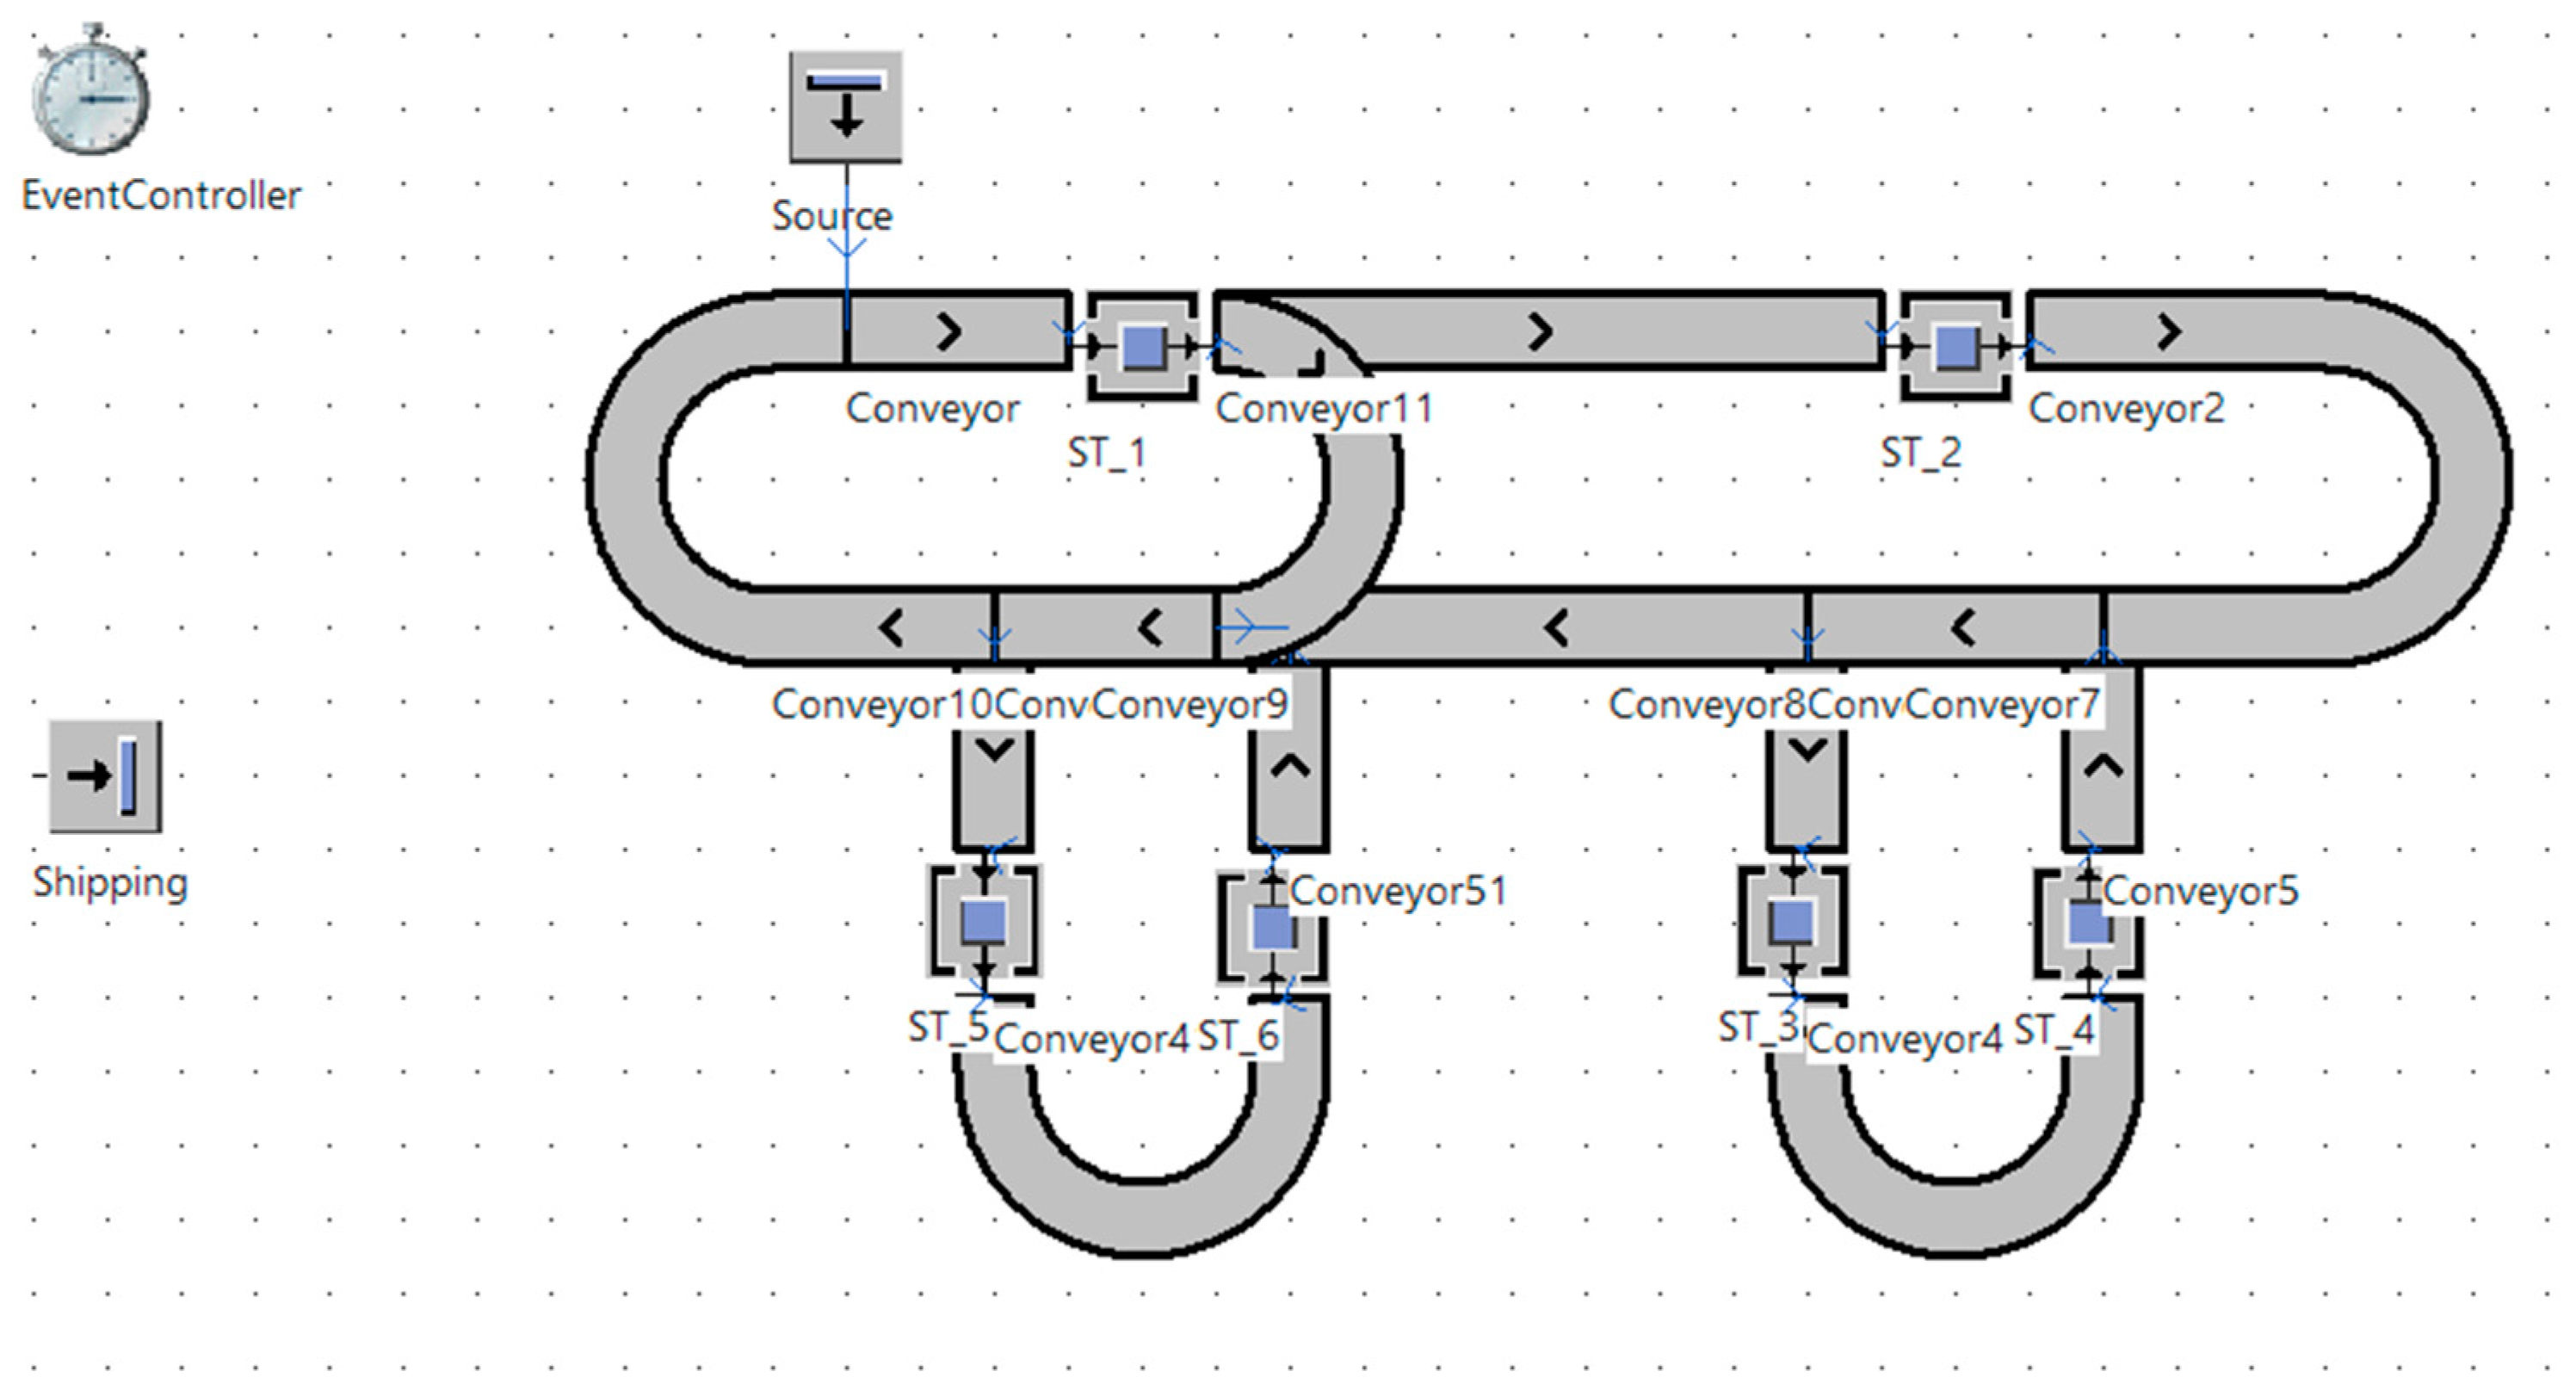
The design of the simulation model in Tecnomatix Plant Simulation began with the creation of a 2D model. Basic objects like EventController, Source and Drain have been inserted. Assembly stations (ST_1, ST_2, ST_3, ST_4, ST_5, ST_6) were mapped using the Station object and connected using the Conveyor object, which is responsible for the movement of products along the line. All objects have been connected to each other by Connector. In order to simplify the simulation model of the assembly line, the mapping of the vision system and the station with the cooperating robot was omitted. The predesigned appearance of the line is shown in
Figure 4.
In the next step, it was decided to reflect the time in which the product travels a given section of the conveyor. This is an important step from the point of view of correct model development. To remain clear, the simulation model does not represent the actual dimensions of the assembly line. The actual dimensions would make the model much smaller. Therefore, it was not possible to enter the speed of movement of the product, so the focus was on reflecting time. For this purpose, measurements of the time of the product’s passage through a given section of the real conveyor were made and then entered into the Conveyor edit window in the Time cell of each section of the simulation model. The program assigned the appropriate speed of movement of the product for the given time.
Then, the number of products that can move on the line at the same time was adjusted. Six objects have been defined in the simulation model, which simulates products transported on pallets.
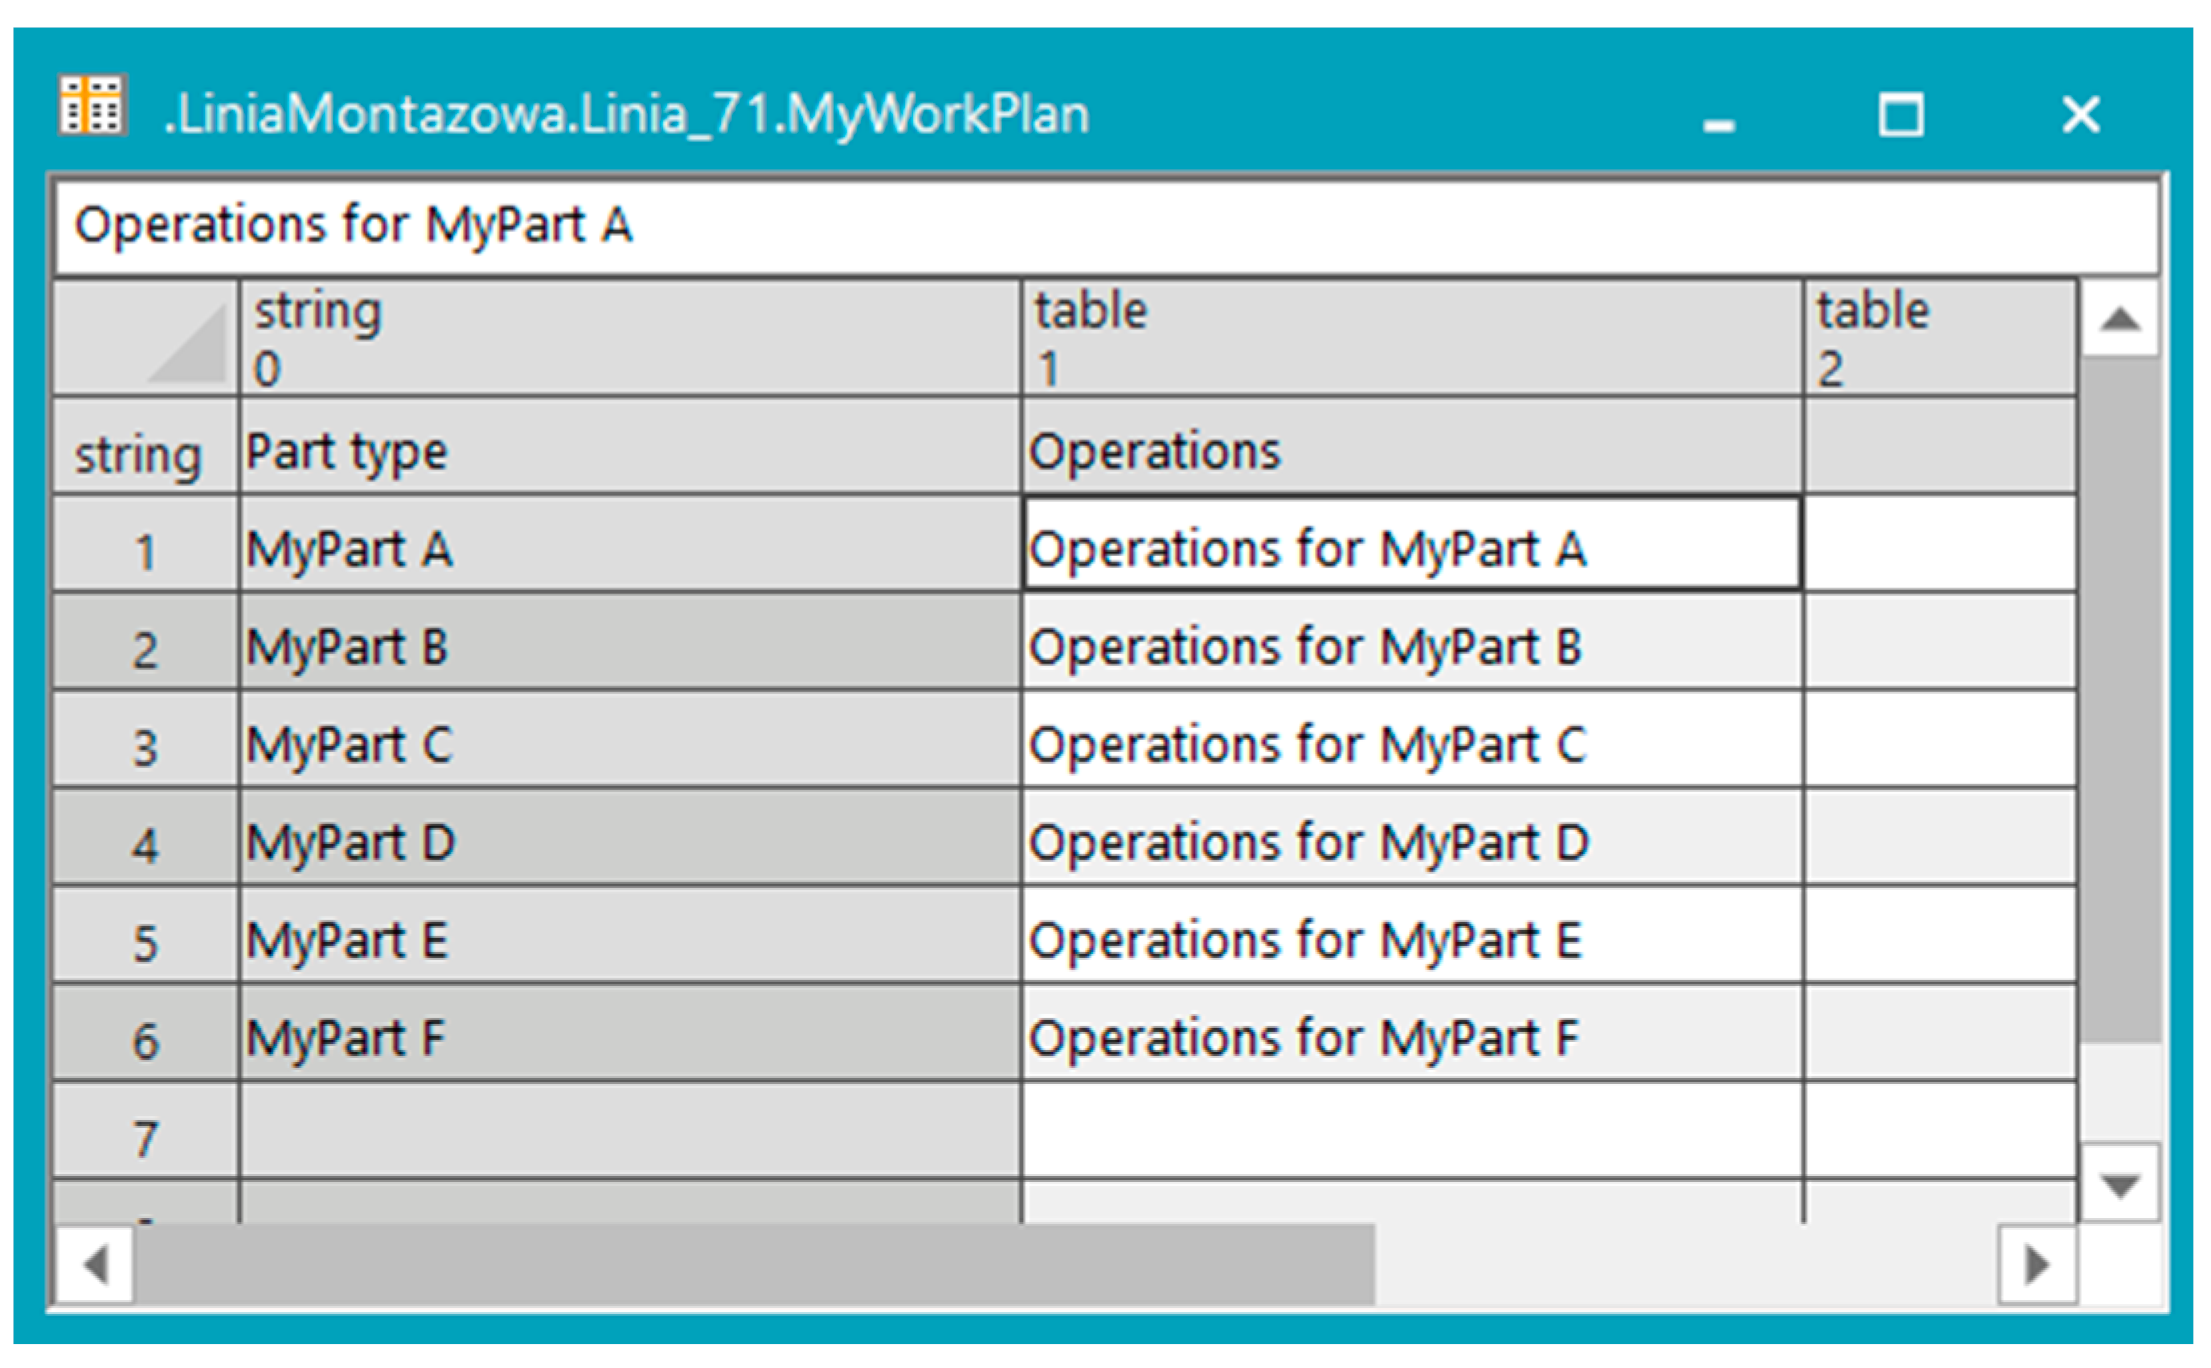
The next stage (one of the most difficult) was to develop a way to make it possible to arrange the order of the product’s passage through the stations and determine the time of the assembly operation. The first step was to develop the MyWorkPlan table, in which it is defined which stations a specific product is to pass through and the assembly time. For this purpose, a DataTable object was inserted and the name was changed to MyWorkPlan (
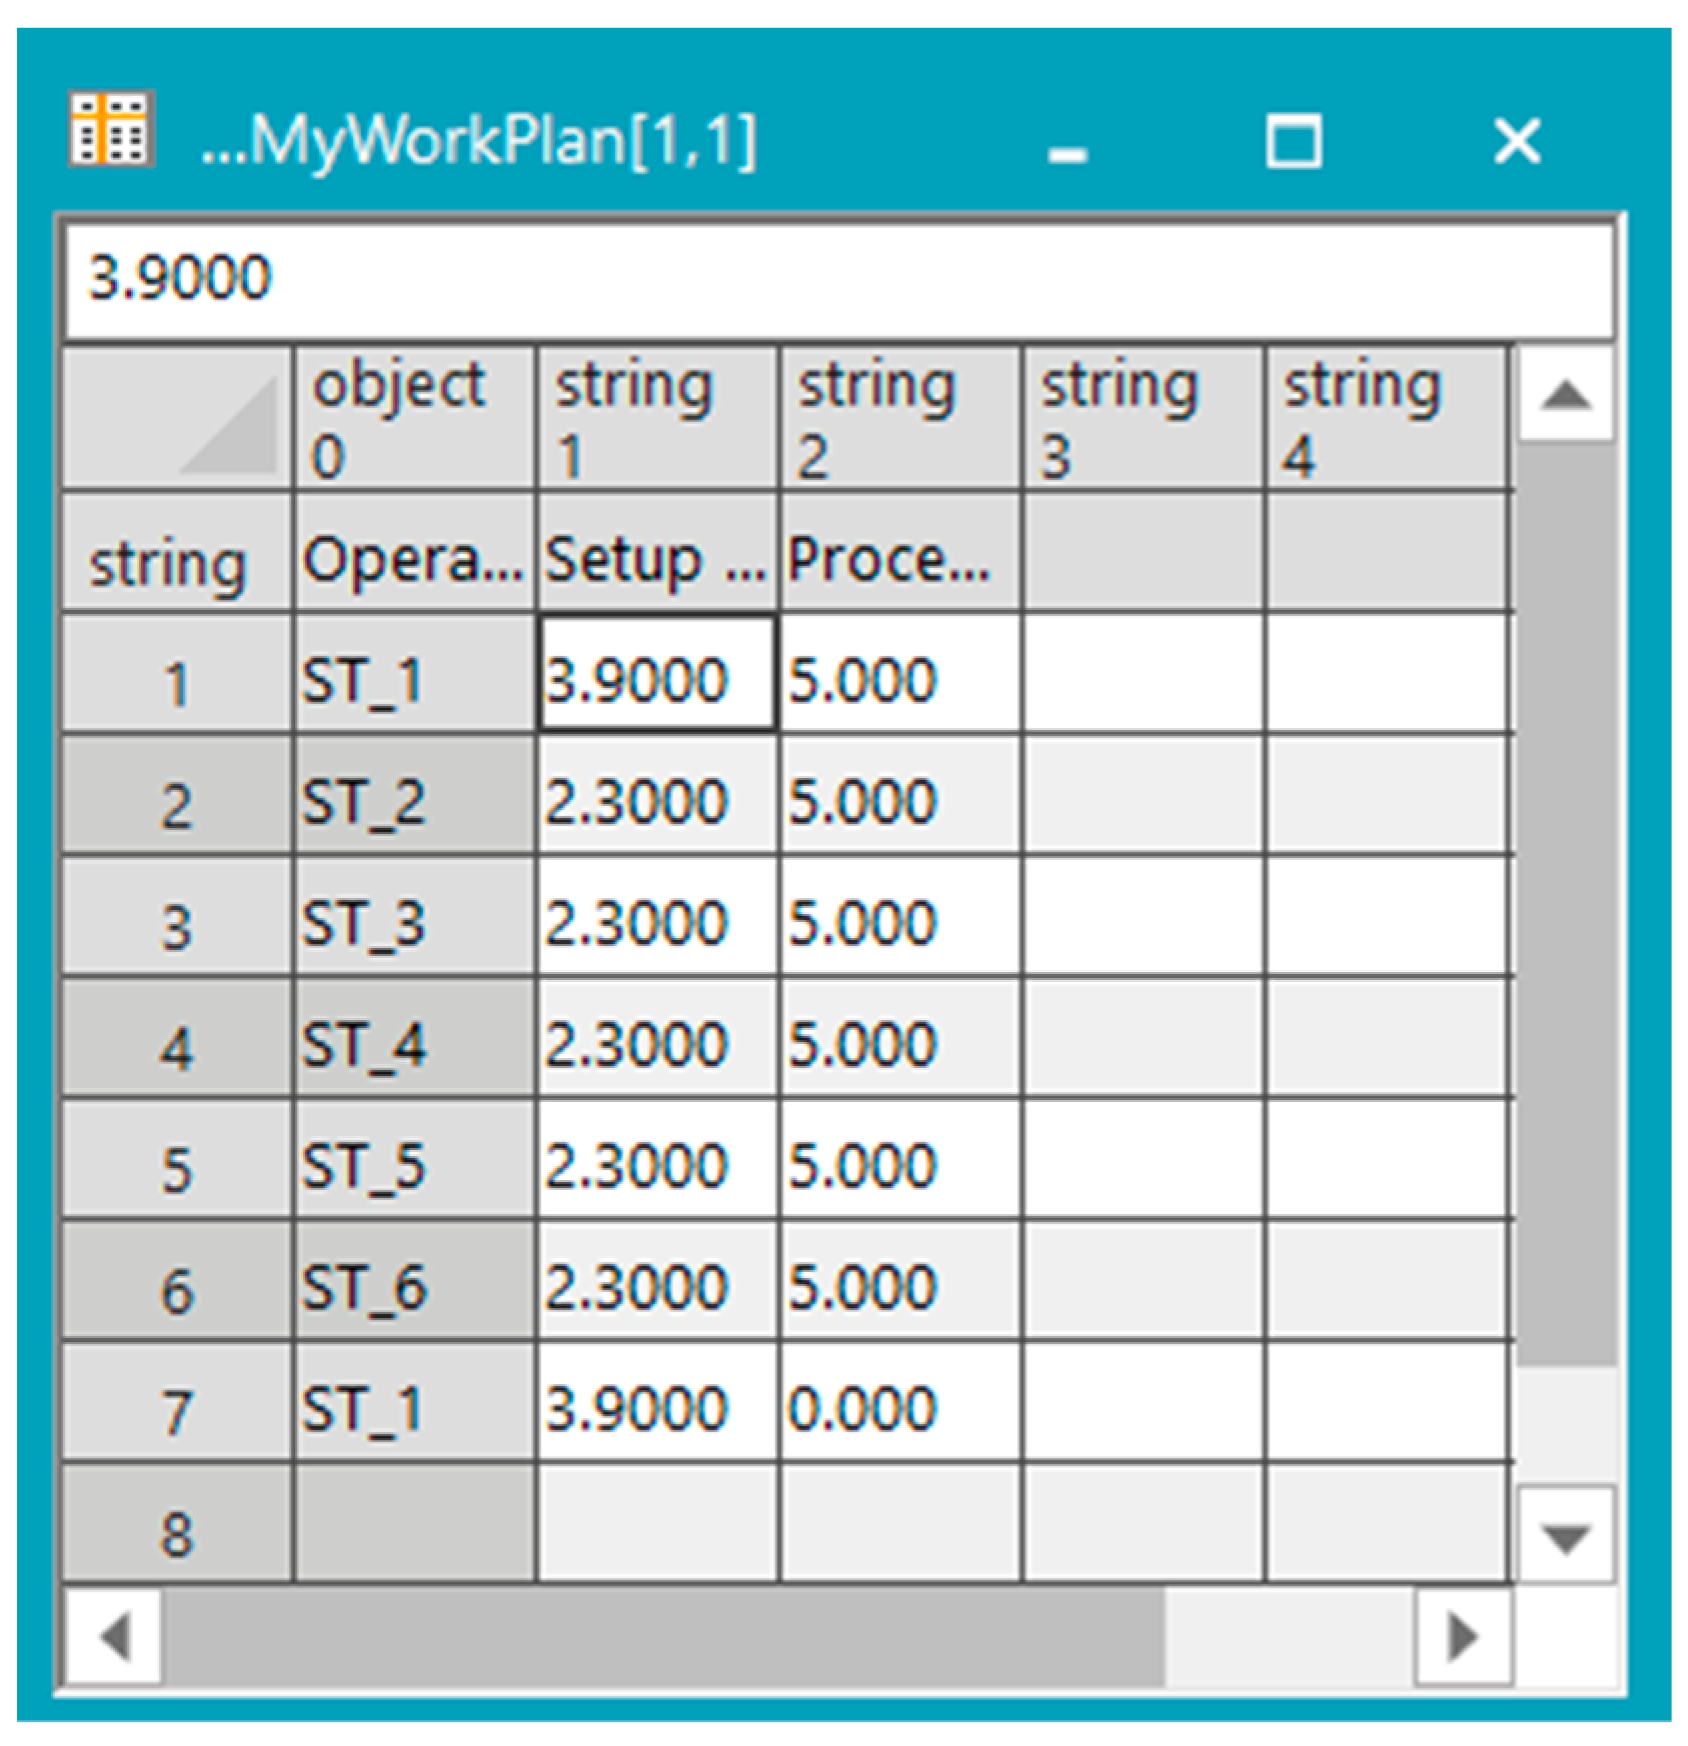
Figure 5), where parts (Part) are defined in the first column, and in the second column, by selecting individual Operations for MyPart A–F cells, you can go to the window where the plan and time are set (
Figure 6). The first column, Operation for MyPart, defines the stations in the order in which the product is to pass through them. The Setup time column contains the times that are needed in the real model of the assembly line to define the pallet and read the given travel scenario. For ST_1, the time is 3.90 s, for the remaining stations 2.30 s. In the last column, Processing time, you can enter the time needed to perform the assembly operation at the station.
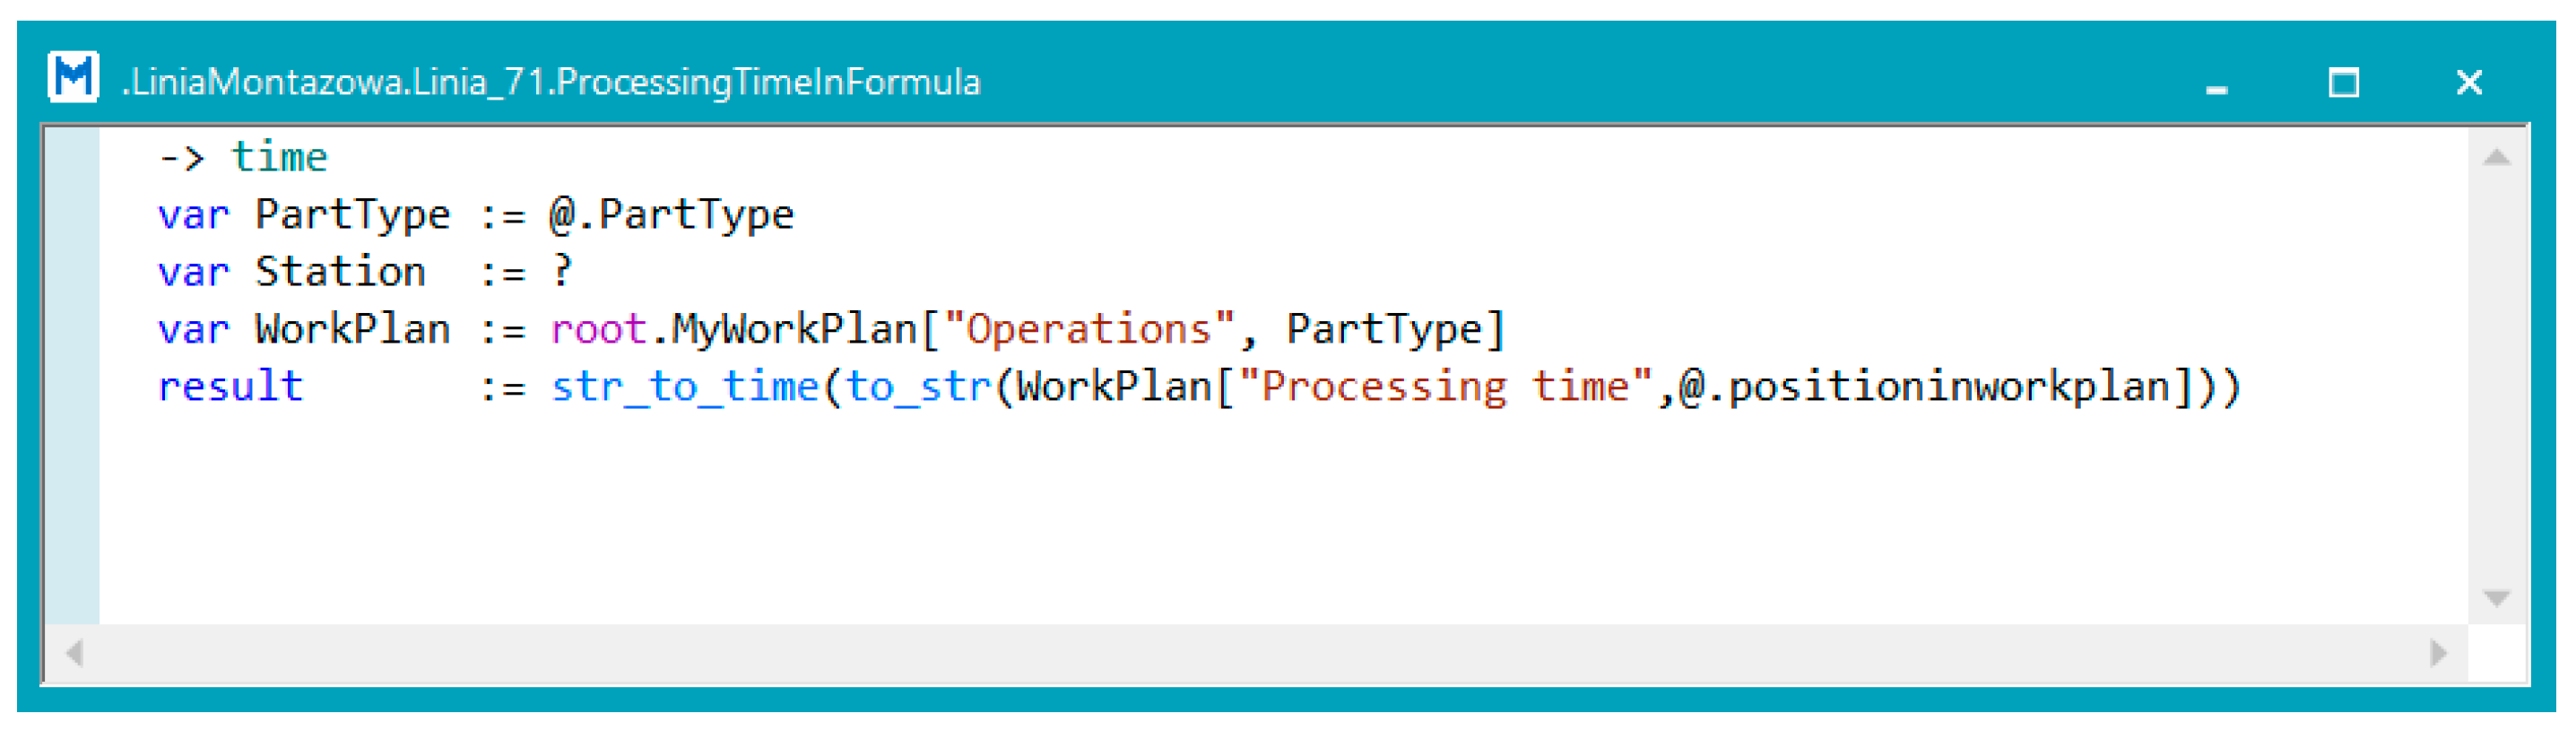
A script was then developed for stations to fetch times from MyWorkPlan. The Method object was used for this, thanks to which you can save scripts. The method was called ProcessingTimeInFormula (
Figure 7). Workstations, in order to download data from MyWorkPlan, must call the method developed above, which is why a method was assigned to each workstation.
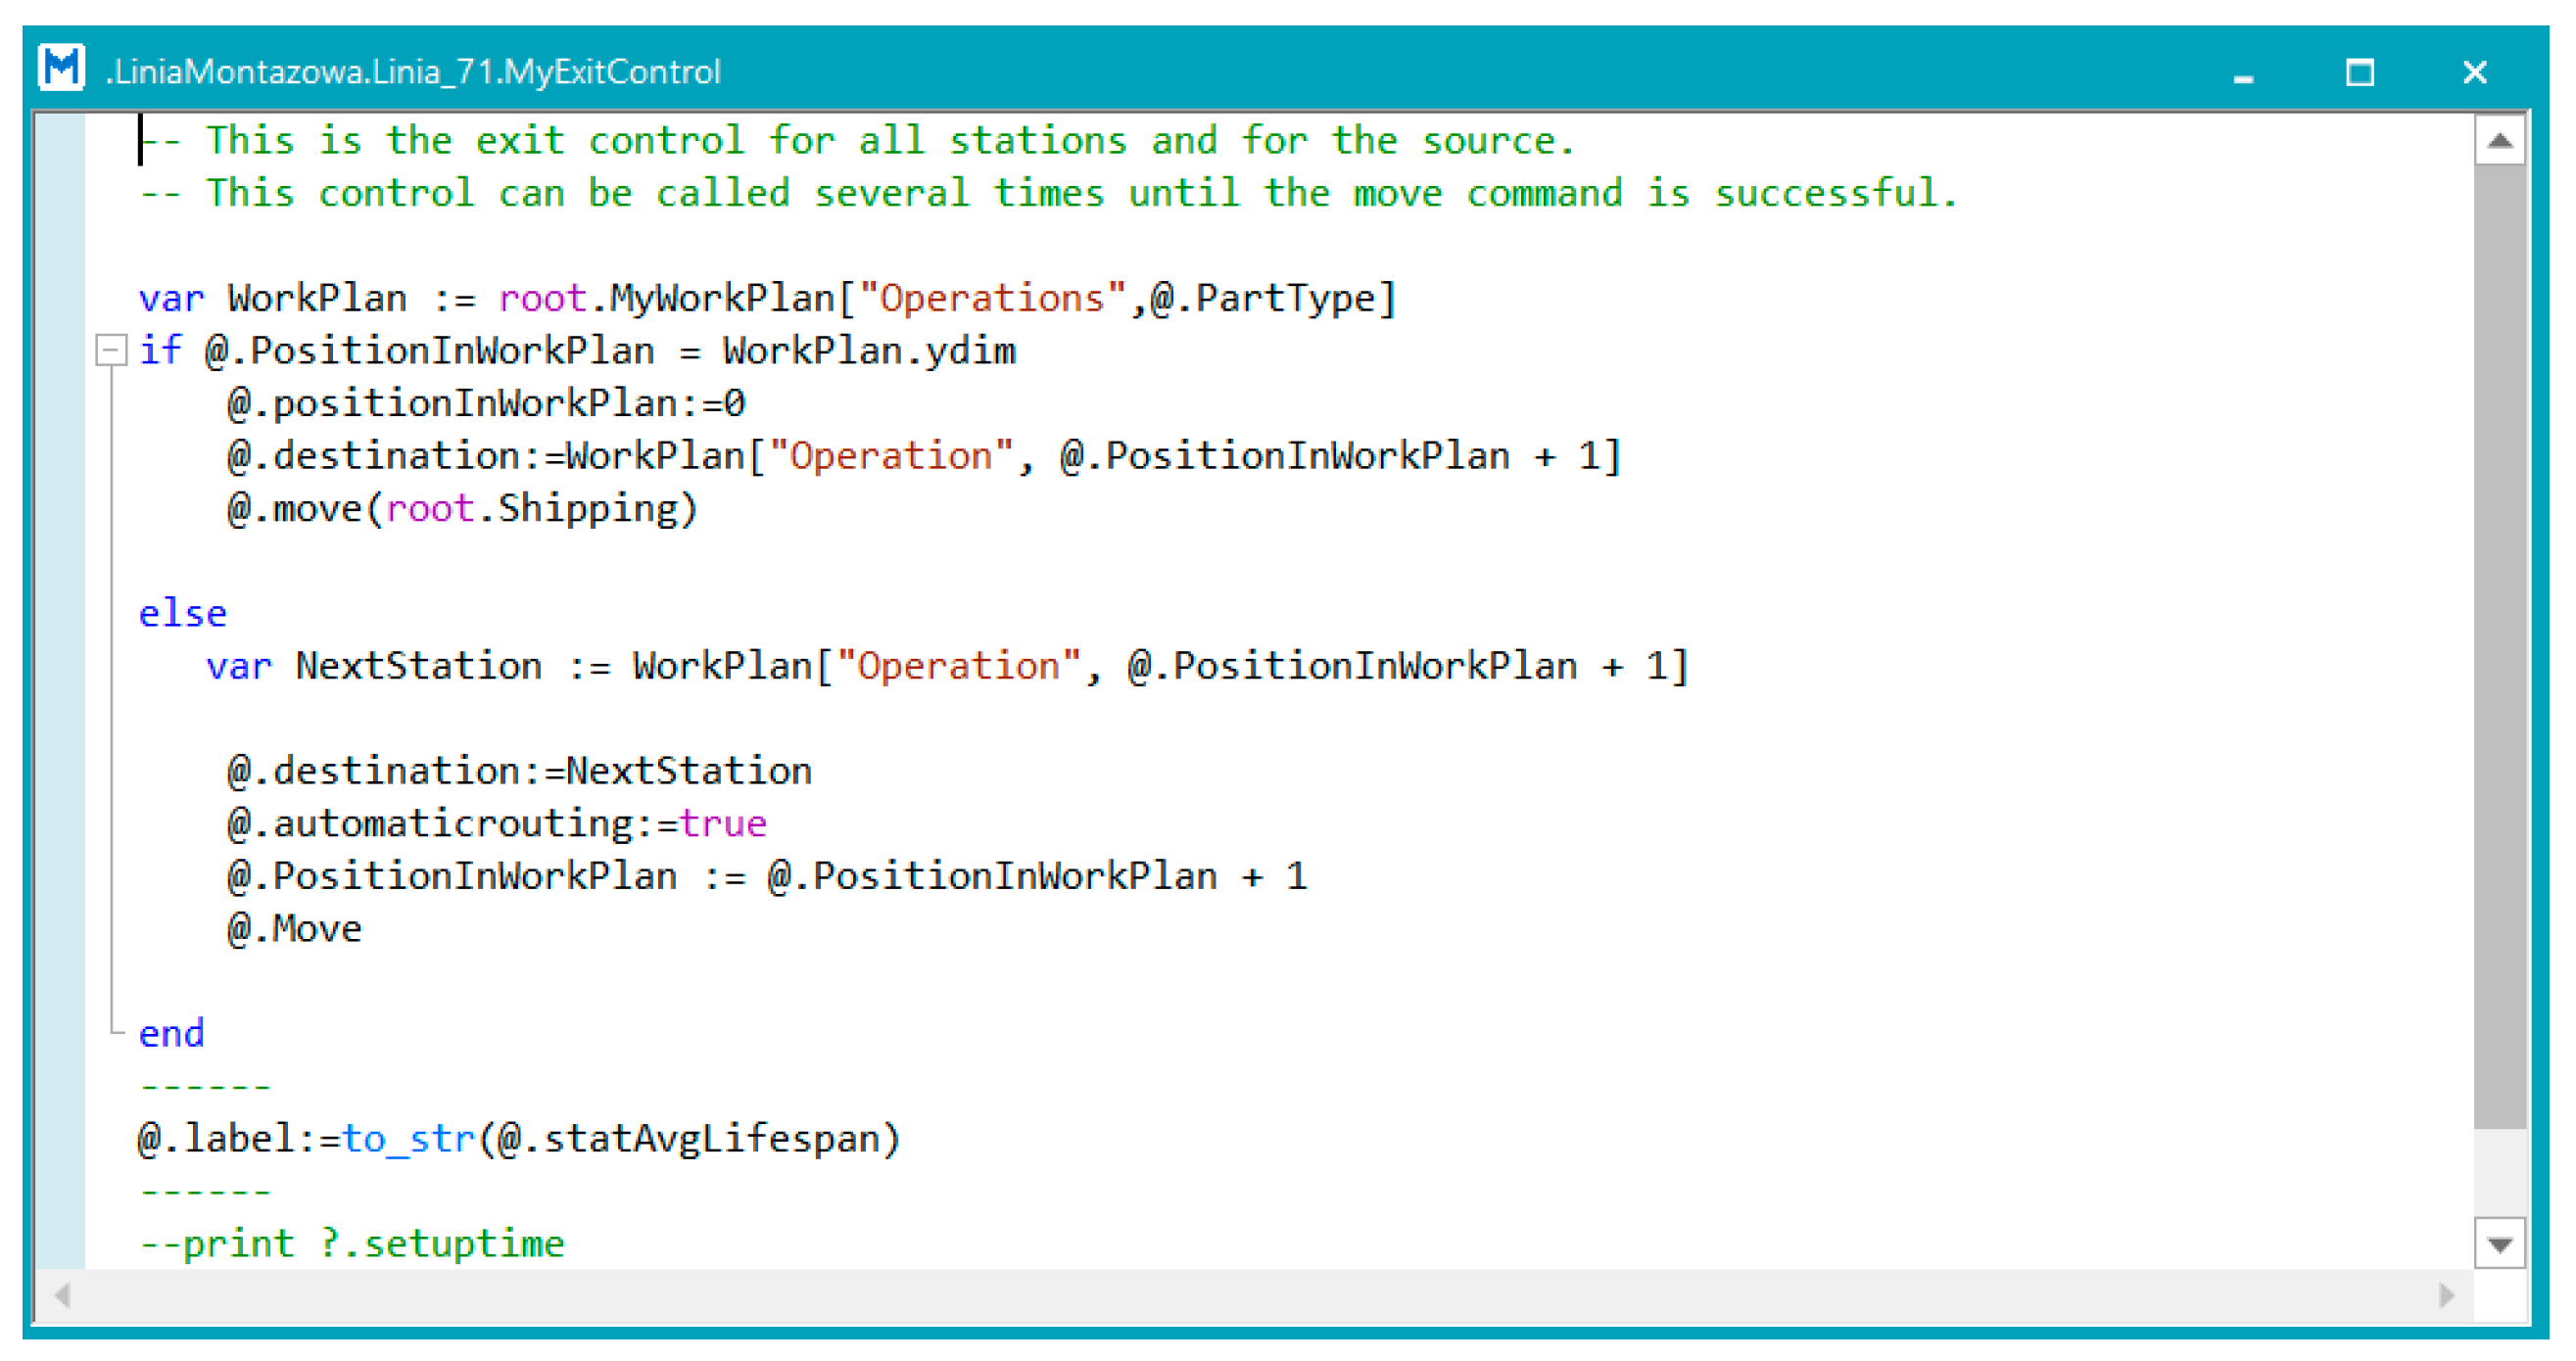
In the next step, a method was developed which was called MyExitControl (
Figure 8). Thanks to it, the correct passage of products through the line is possible. The method refers to MyWorkPlan, from where the positions are read. The product enters the line through the source and then passes through the stations in a predetermined order.
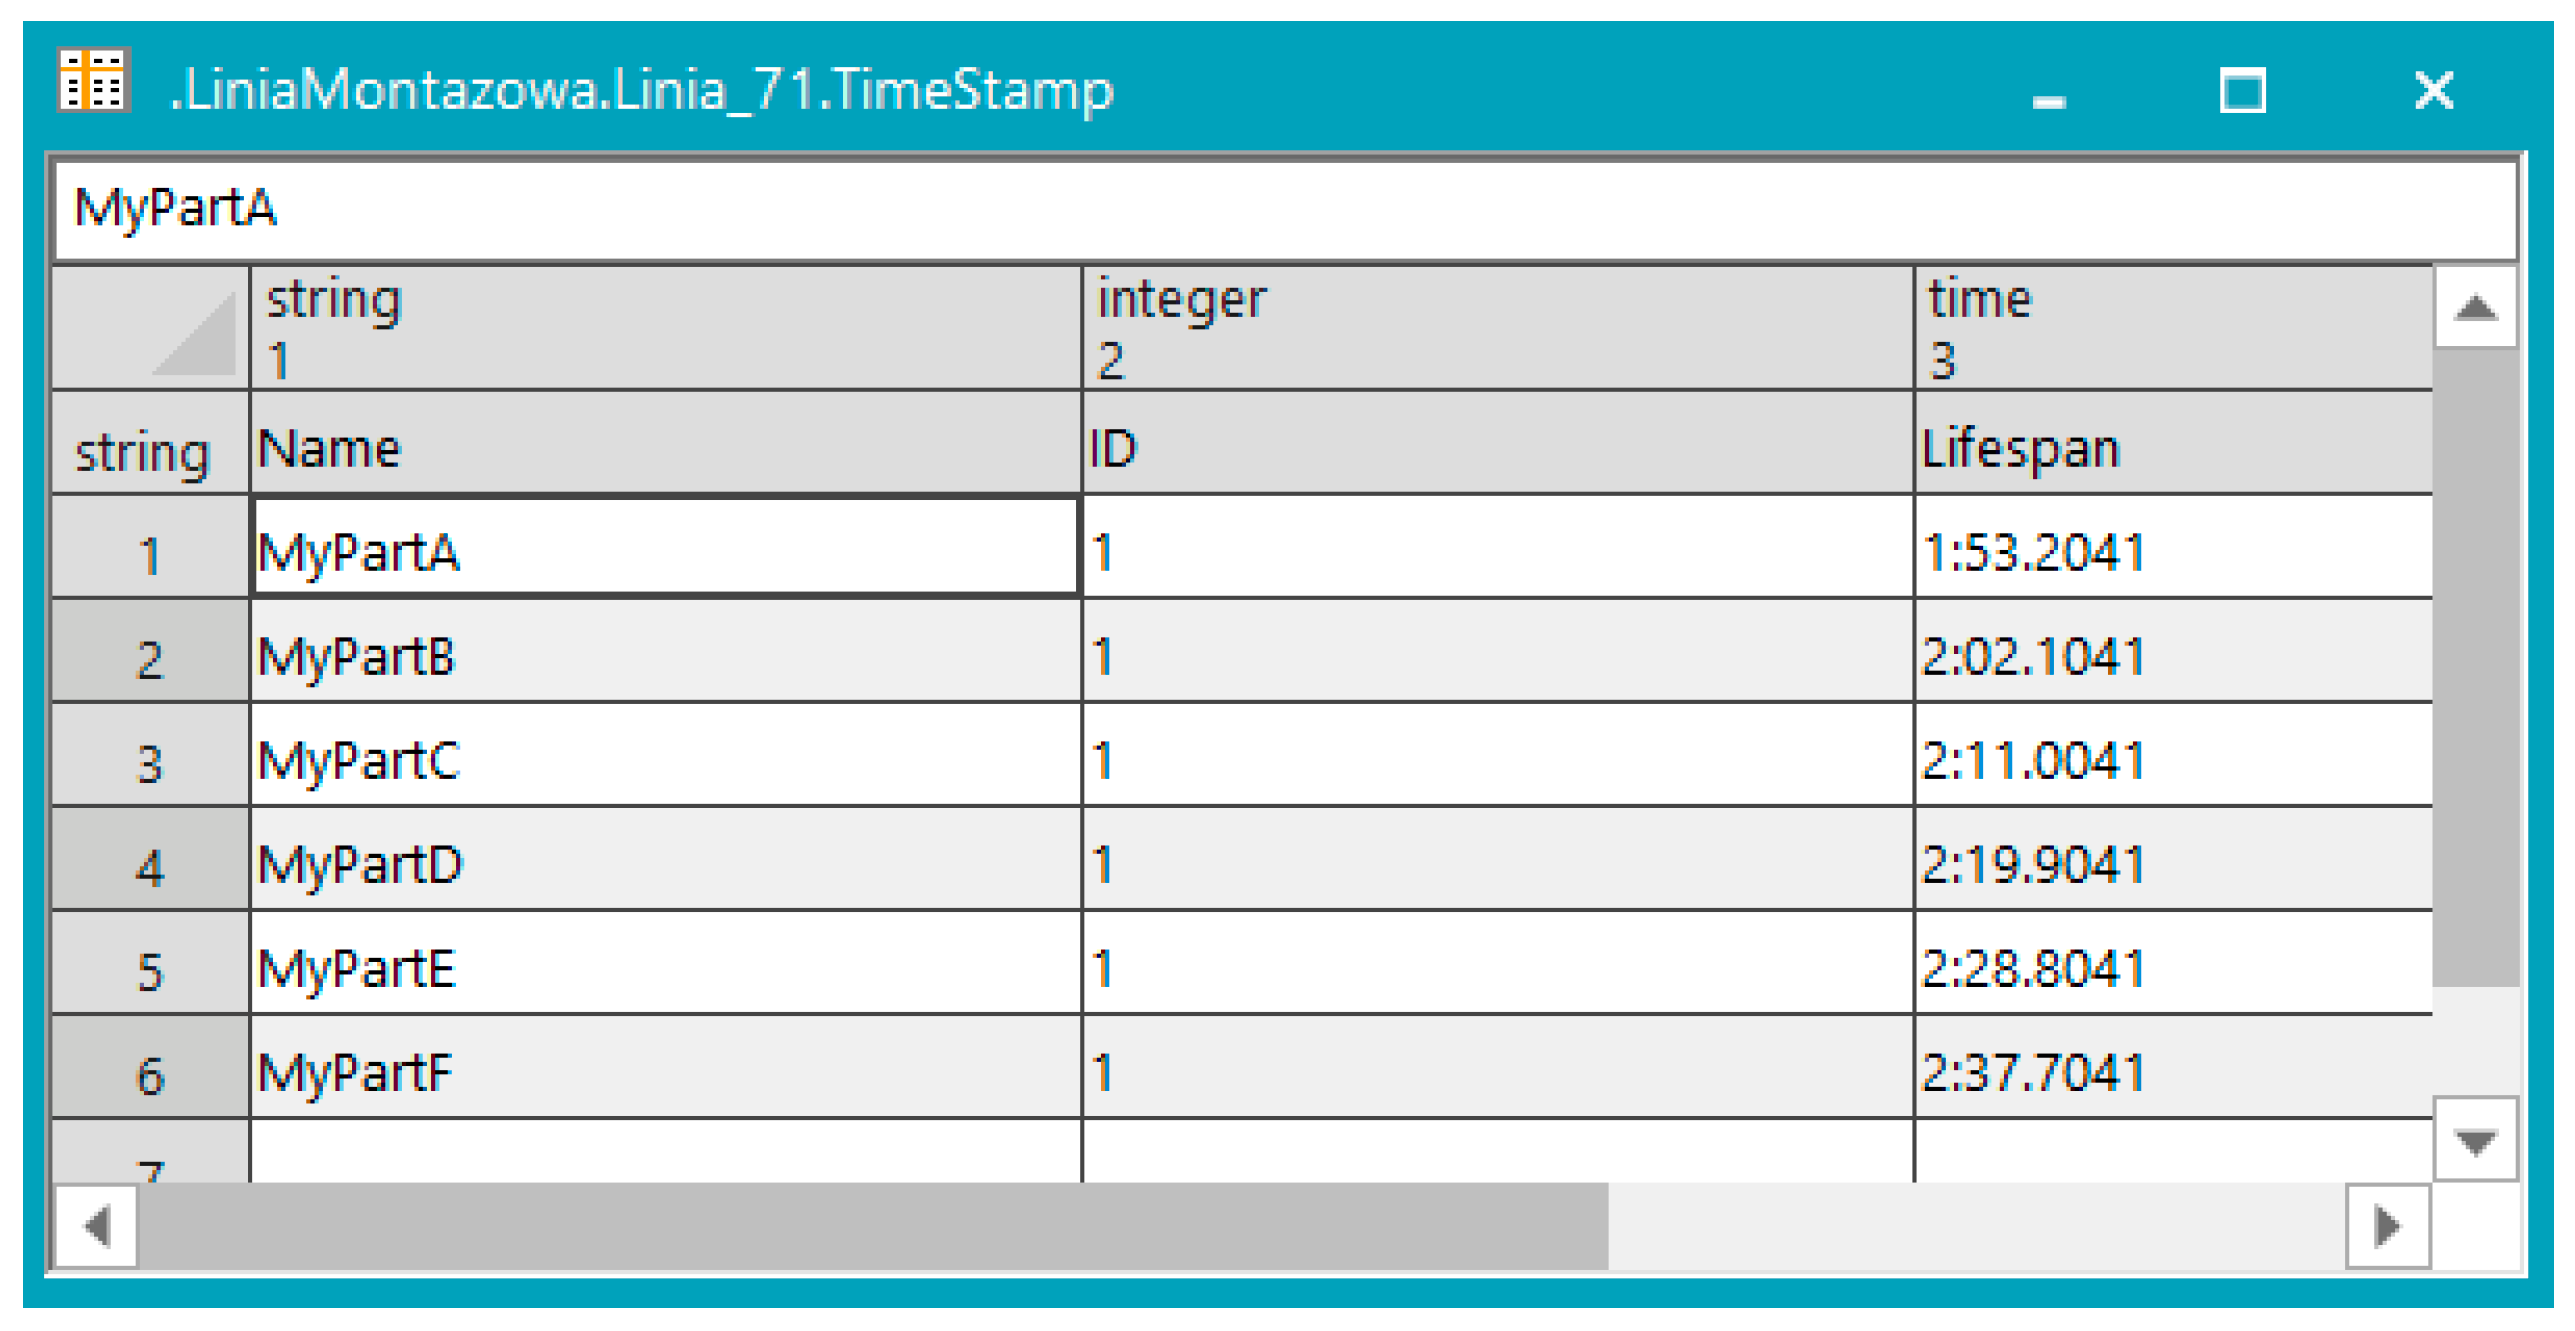
The EventController displays the duration of the entire simulation. In a simulation model, you need to track the simulation time of a single product. Therefore, another script was developed, which was called GetTimestamp, and a DataTable view, which was called TimeStamp, was inserted. The TimeStamp view (
Figure 9) displays the simulation time for each pallet.
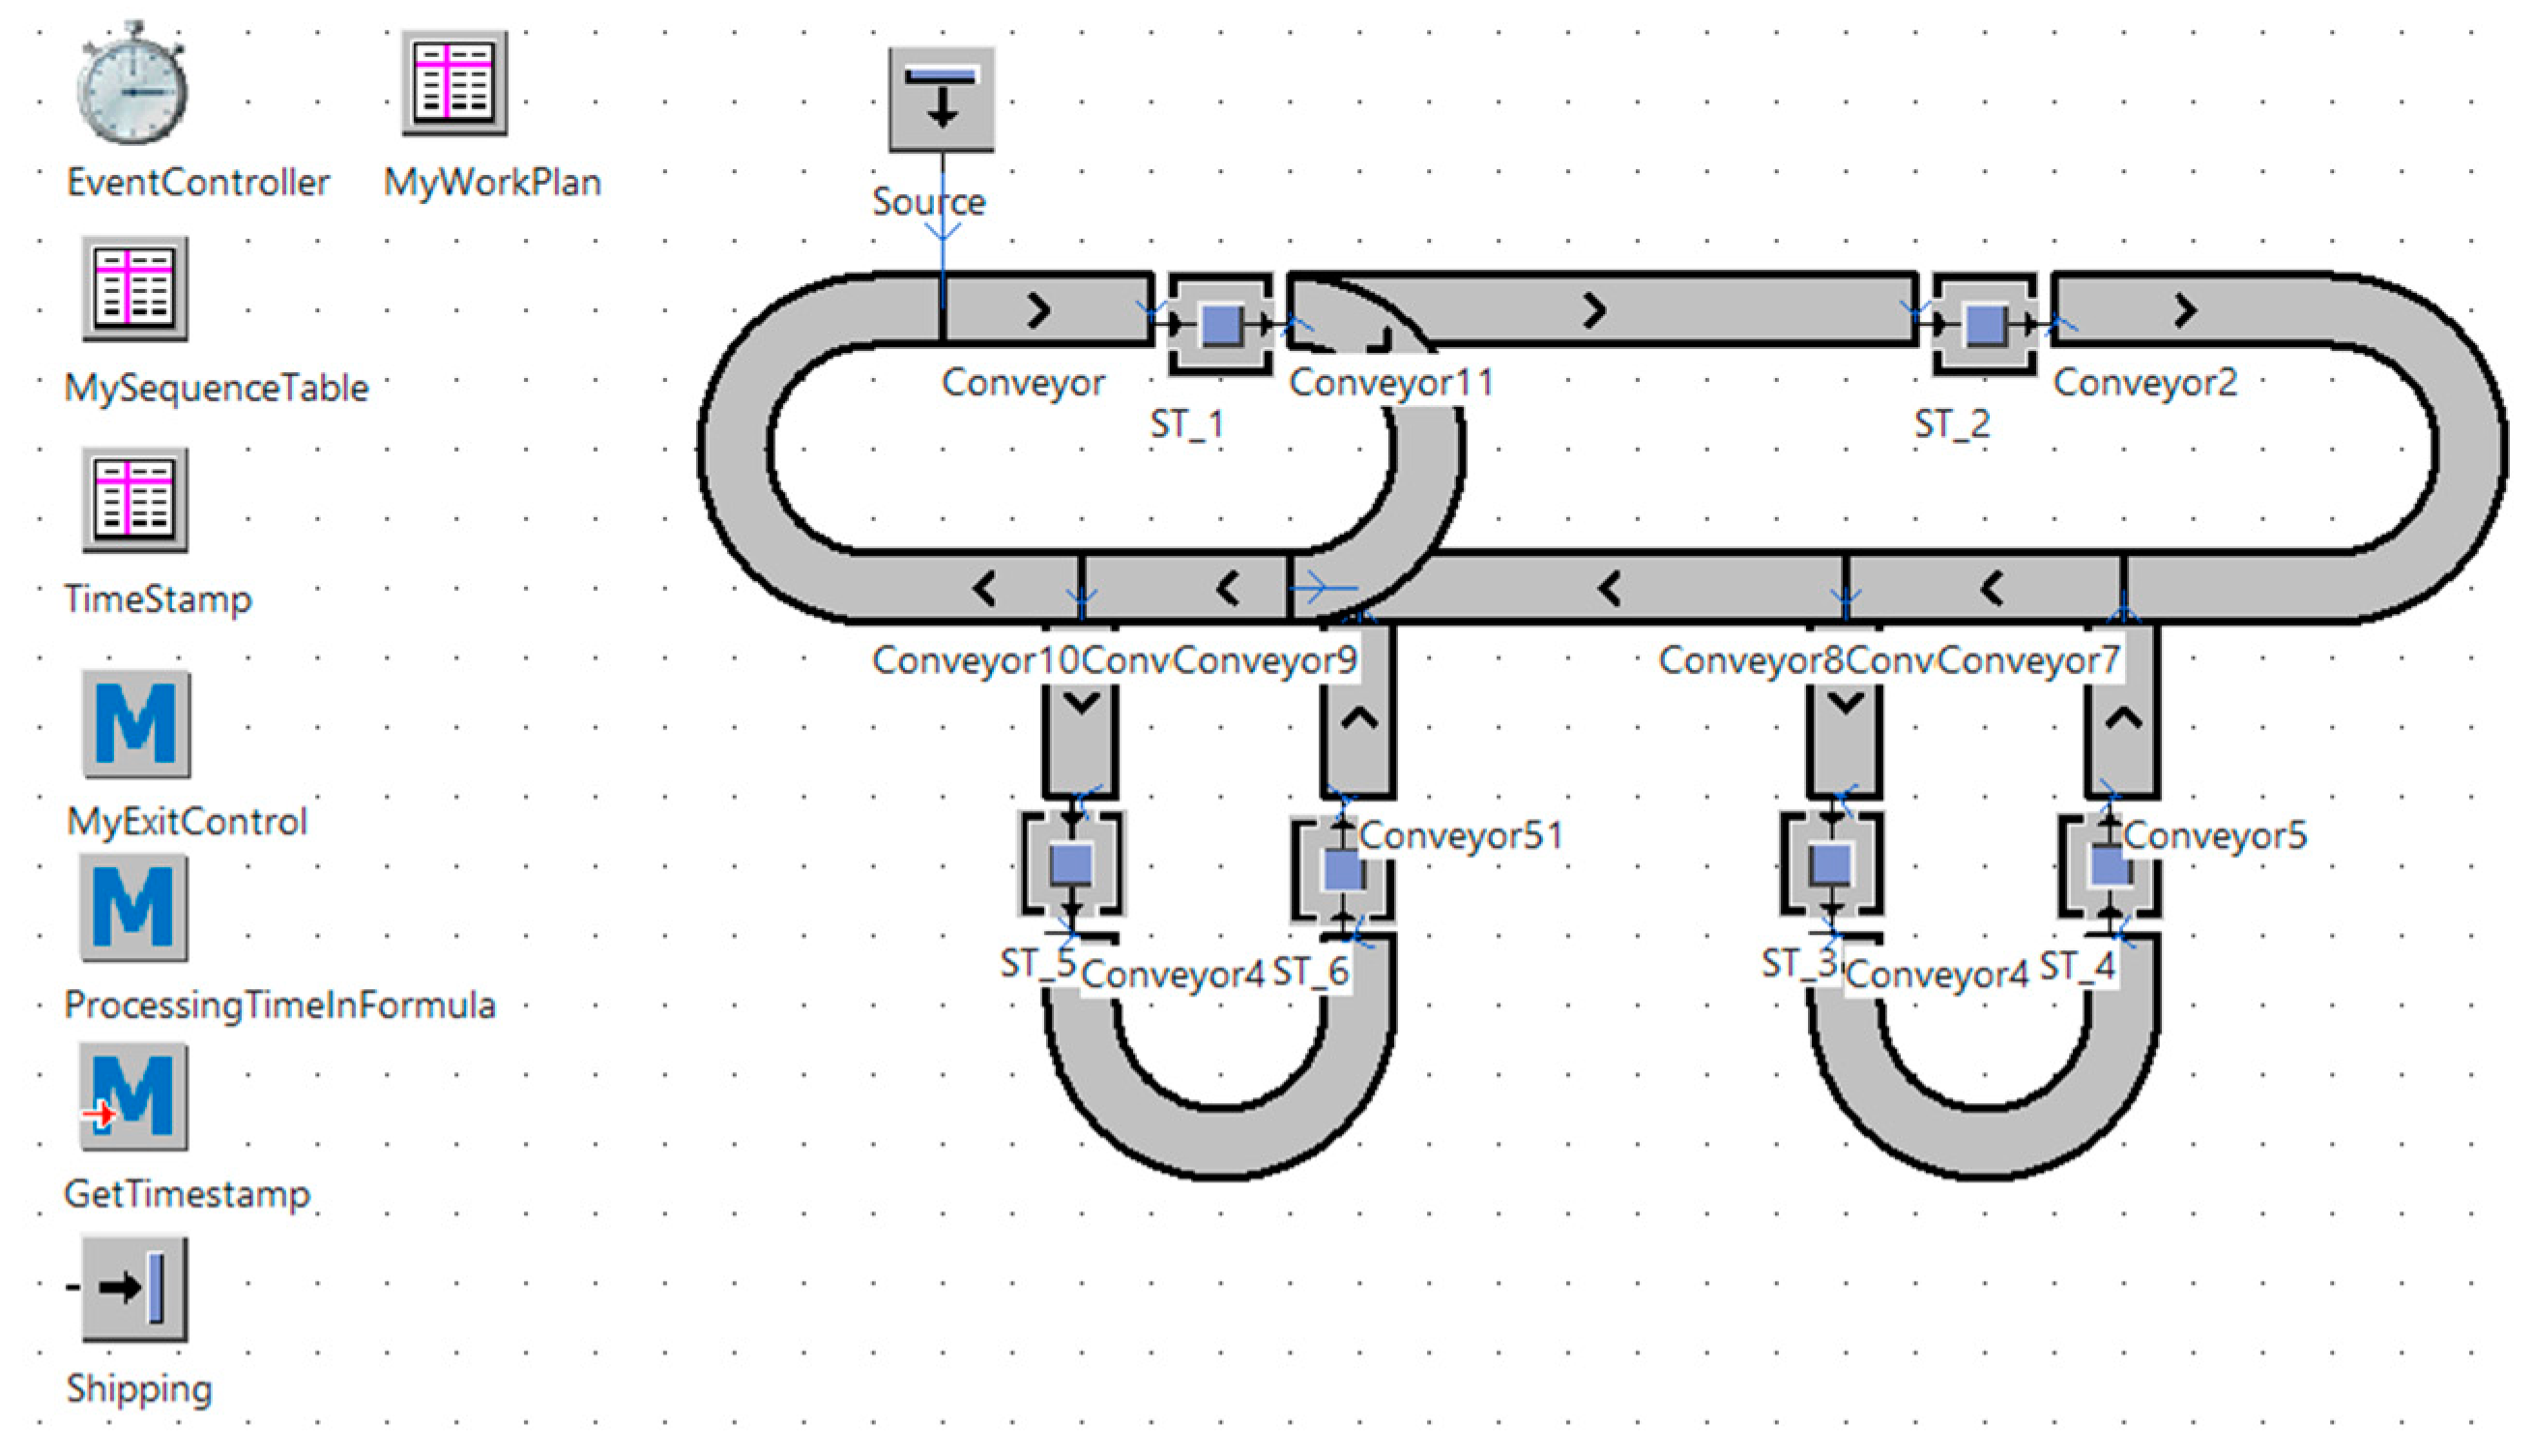
The designed simulation model of the automated assembly line from the Smart Factory laboratory of the Poznań University of Technology in a 2D view is presented in
Figure 10.
5. Verification of the Simulation Model
In order to verify the simulation model, first, the actual times of the pallets’ passage through the assembly line were measured according to the selected passage scenario. The assembly time at each station was 5 s. Each pallet passed through position 1, 2, 3, 4, 5, 6 and again 1 in turn. One pallet was added with each passage. In the first pass, there was one pallet, in the second pass, there were two pallets, and so on. Each measurement pass was performed three times. The final result is the average value of three measurements. During the research, a queue formed to the first station.
In order to further verify the simulation model, simulations were performed in the developed simulation model. The rules were the same as when measuring times with a real model. Also, as in the case of the real model, the times of arrival of the discus to each station were measured. From the obtained times of the simulation model, it was found that in the three measurement tests, the travel times were the same. This proves the readiness of the simulation model for further tests.
Then, a comparative analysis of the obtained results was carried out. The comparative analysis is to verify whether the simulation model has been developed correctly. In order for the simulation model to pass the verification correctly, it was assumed that the simulation time could not exceed more than 10% of the real time. In the comparative analysis between the real model of the automated assembly line and the simulation model, graphs will be used that were created on the basis of the average real-time measurement results of the model and the simulation model.
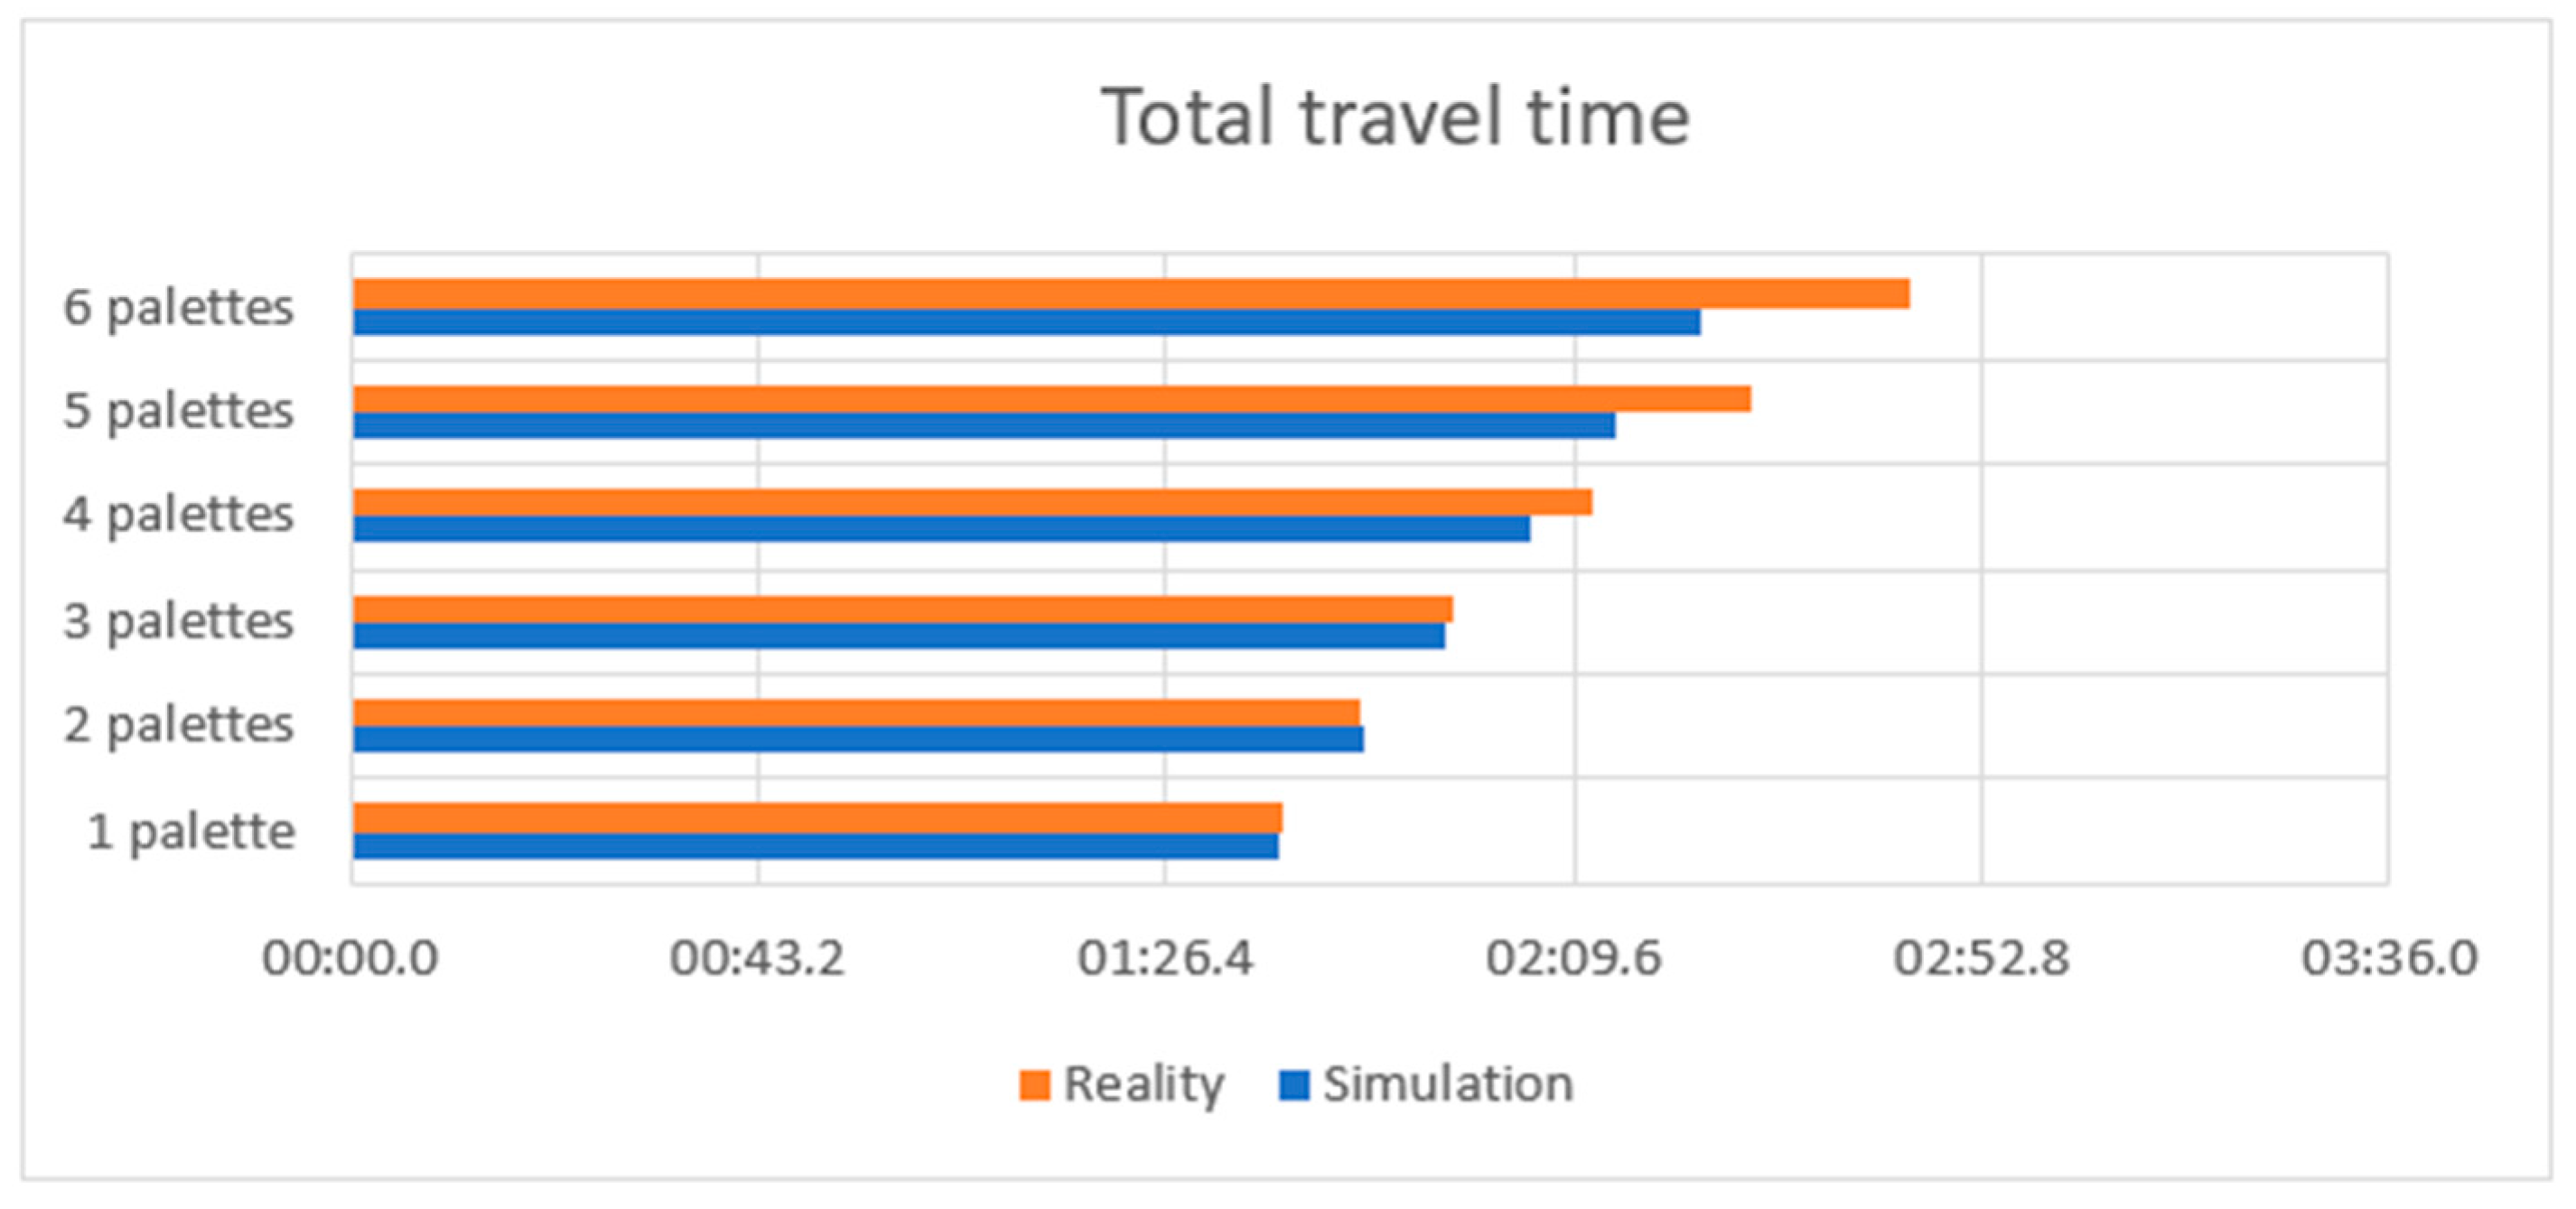
Analyzing the summary of total discus travel times (
Figure 11), it can be seen that the three discus travel times differ insignificantly (hundredths of second). It can therefore be concluded that the differences in the results are due to measurement errors. By adding a fourth pallet, the times start to differ more and more. As we delve deeper into the resulting discrepancies, more charts will be analyzed.
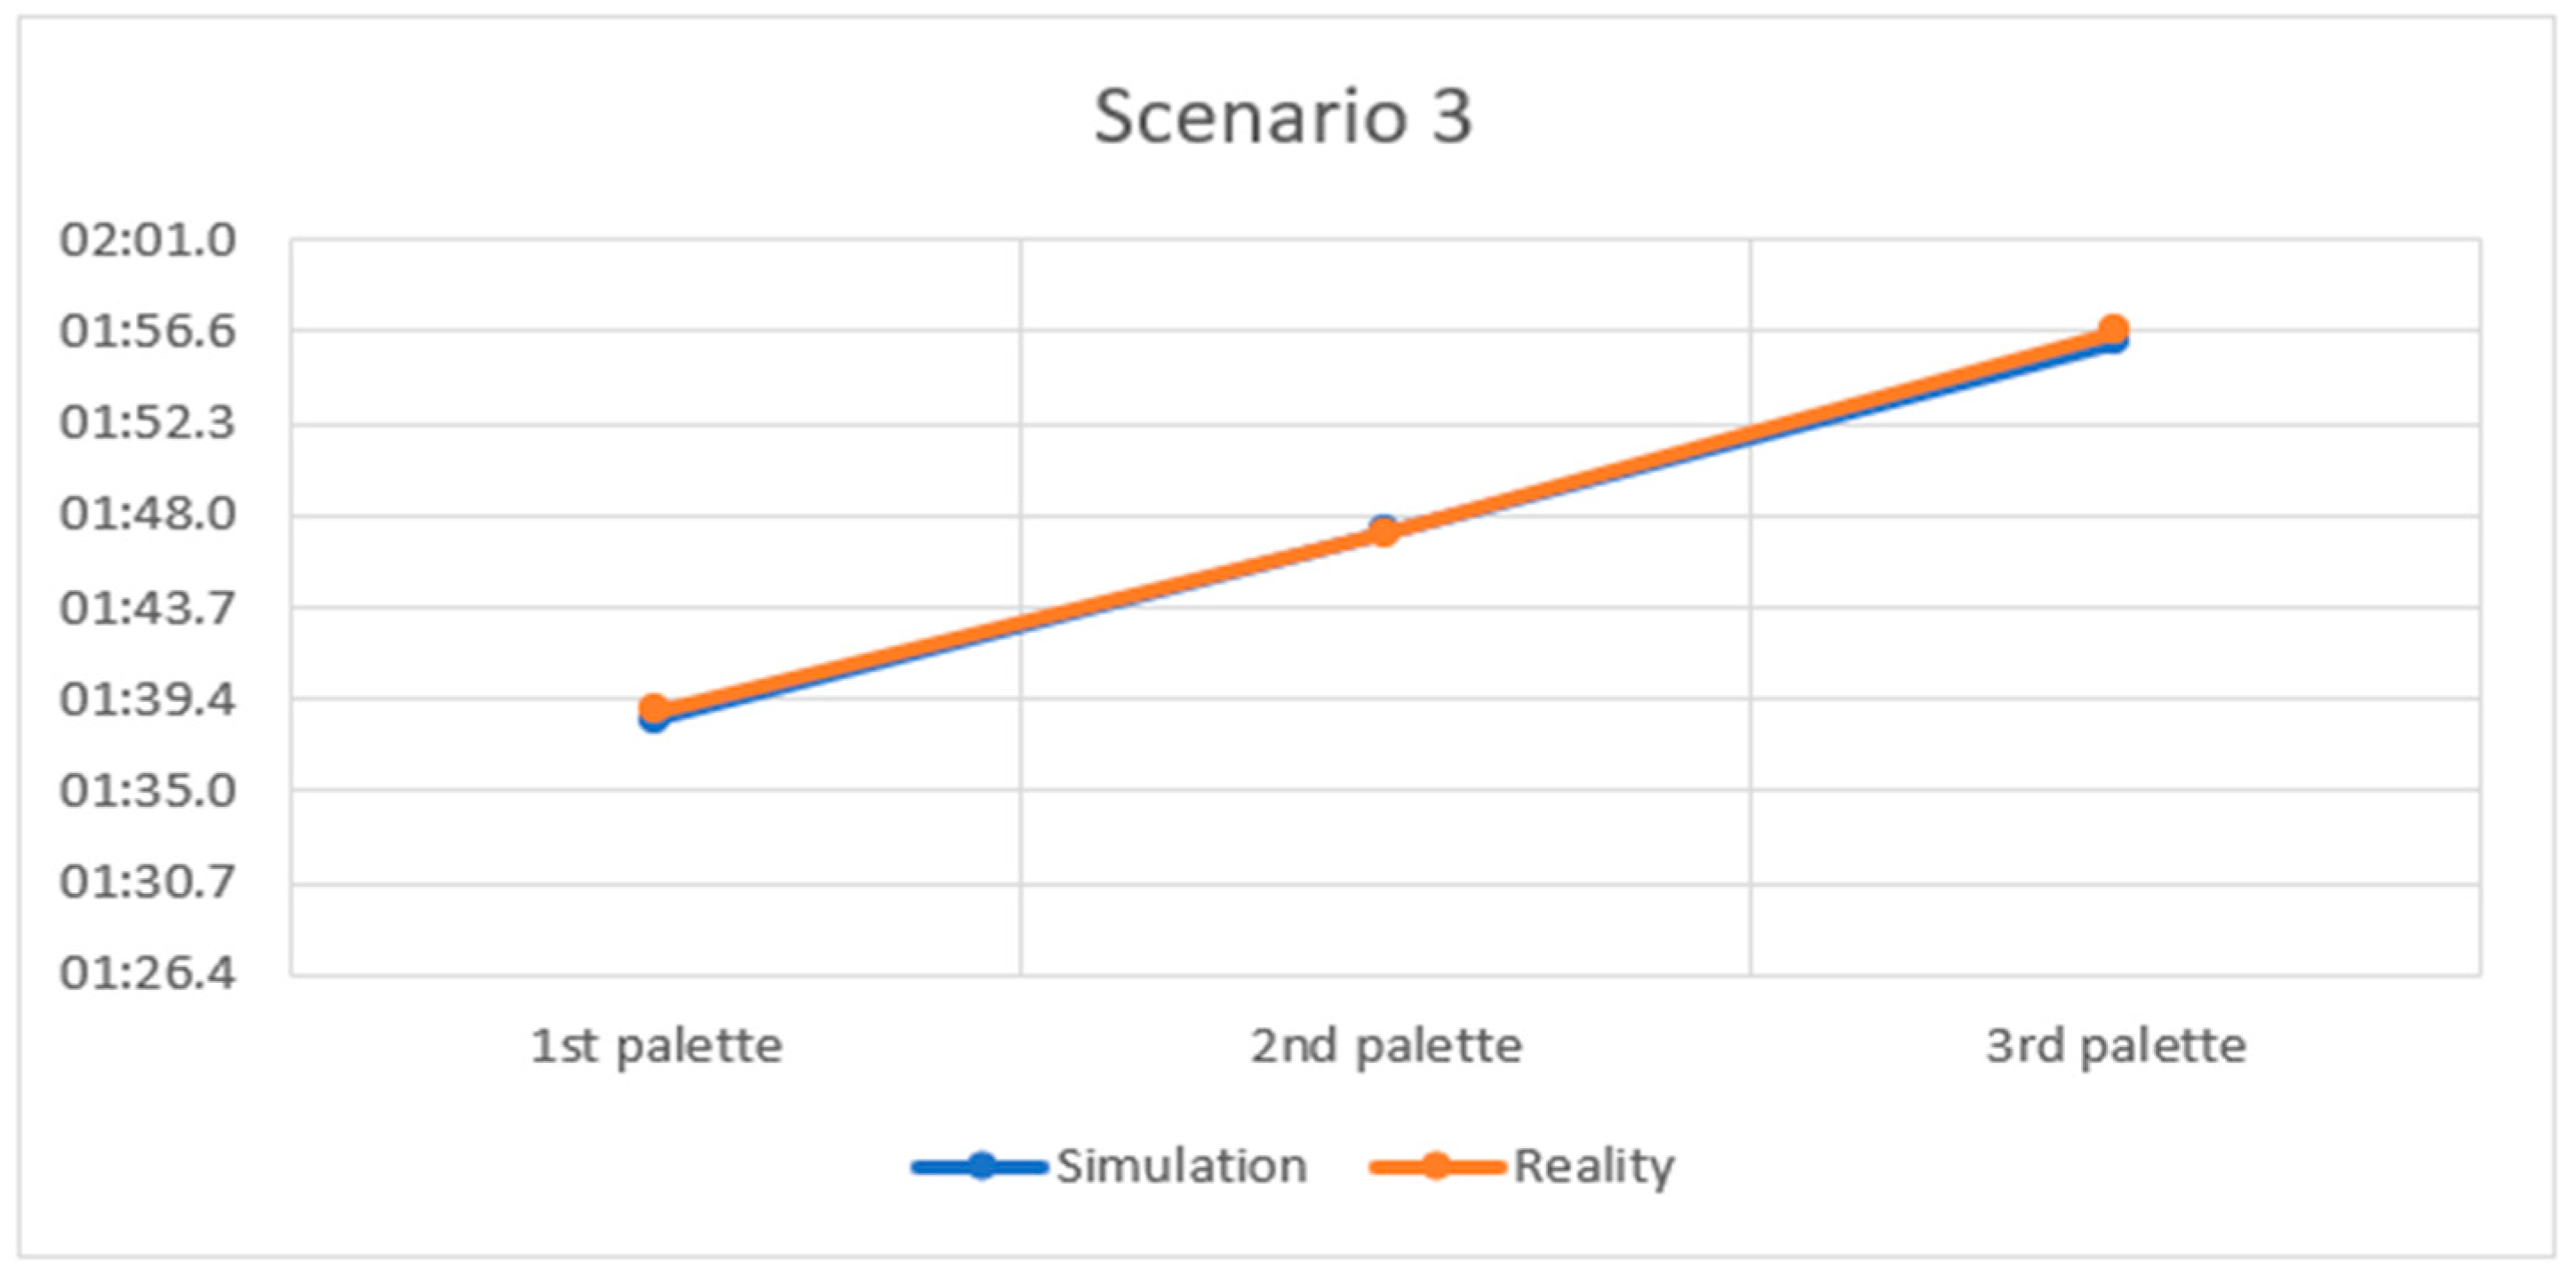
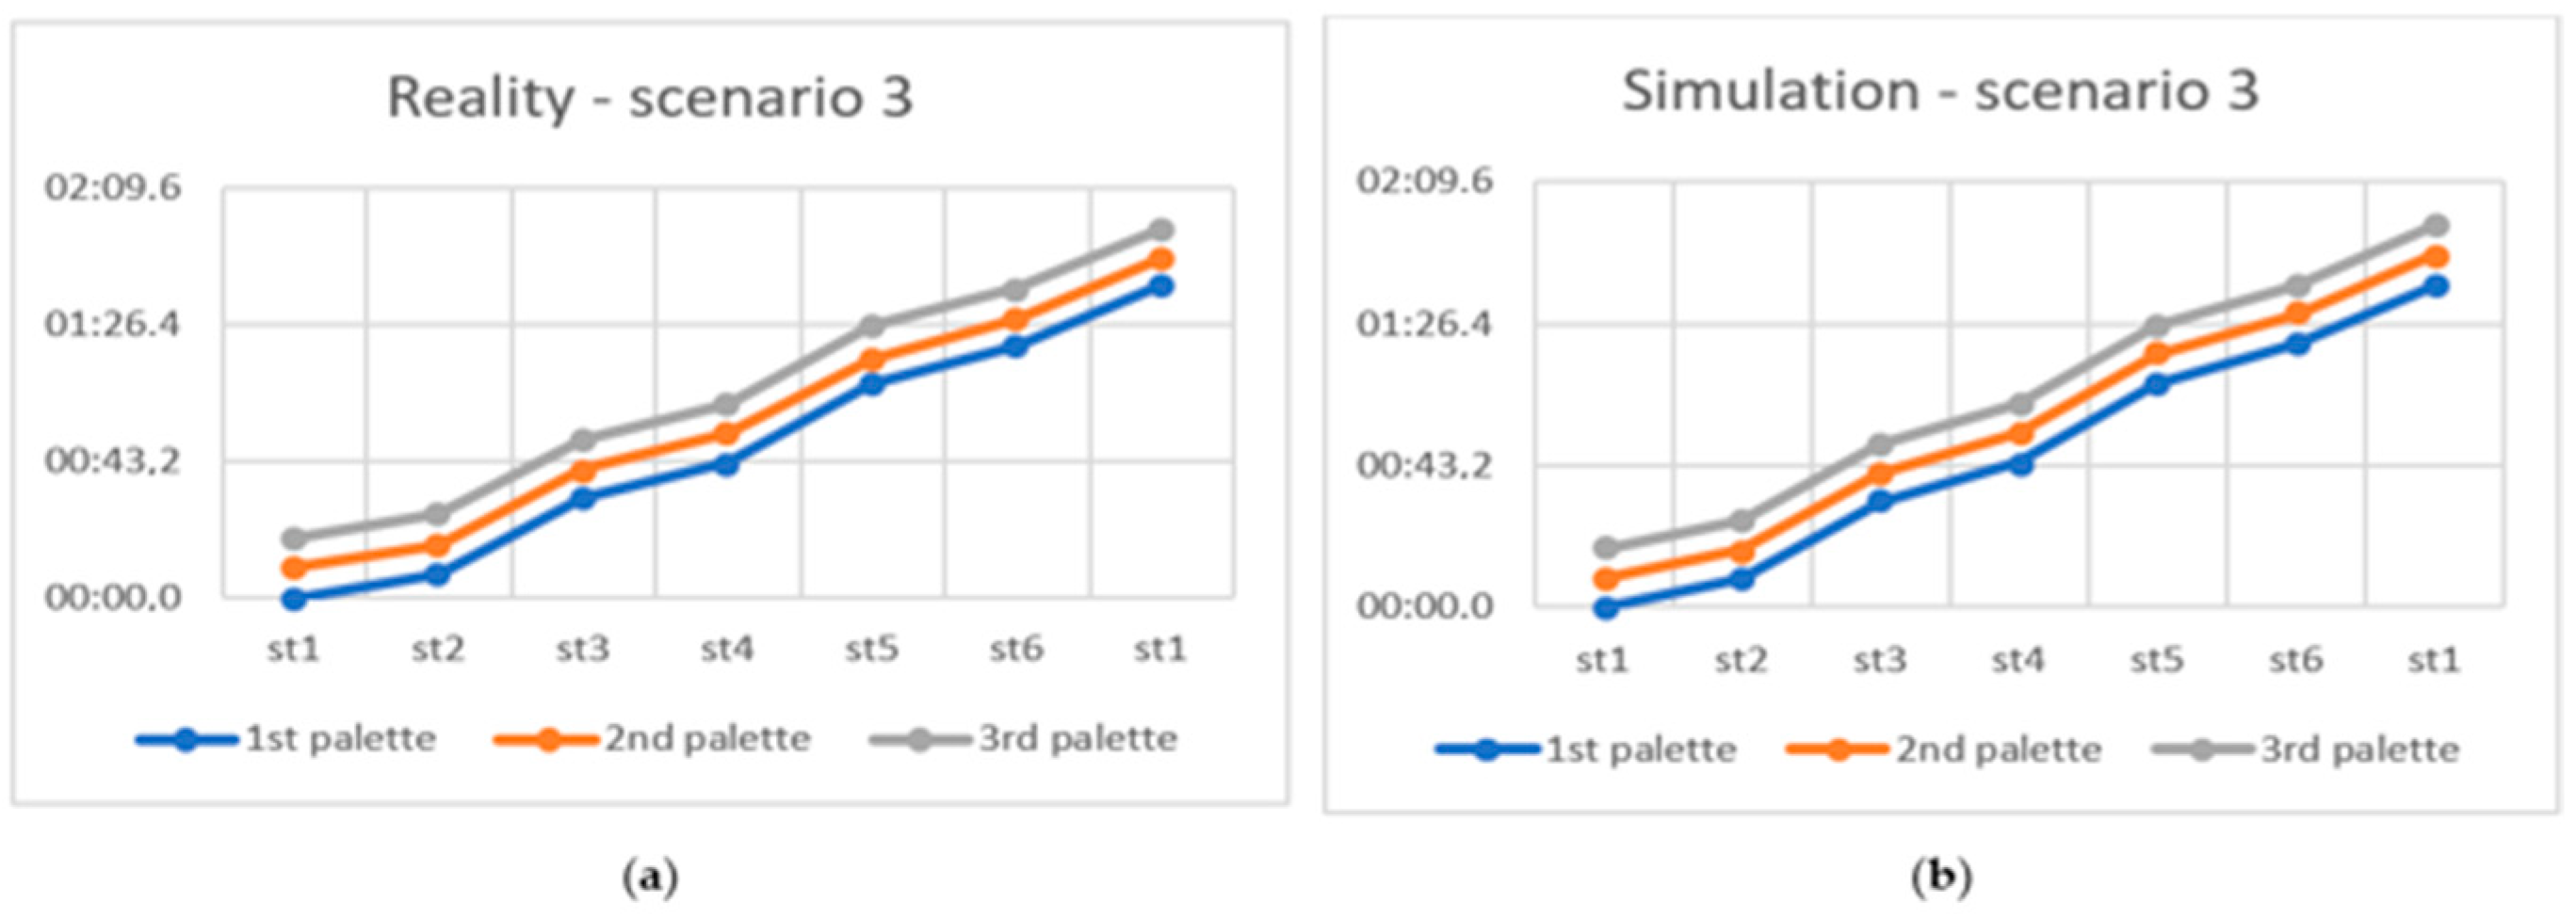
The graphs for scenarios 1 and 2 have been omitted because the discrepancy between real time and simulation is very small. The same situation is in scenario 3, where a graph for it has been developed to be sure (
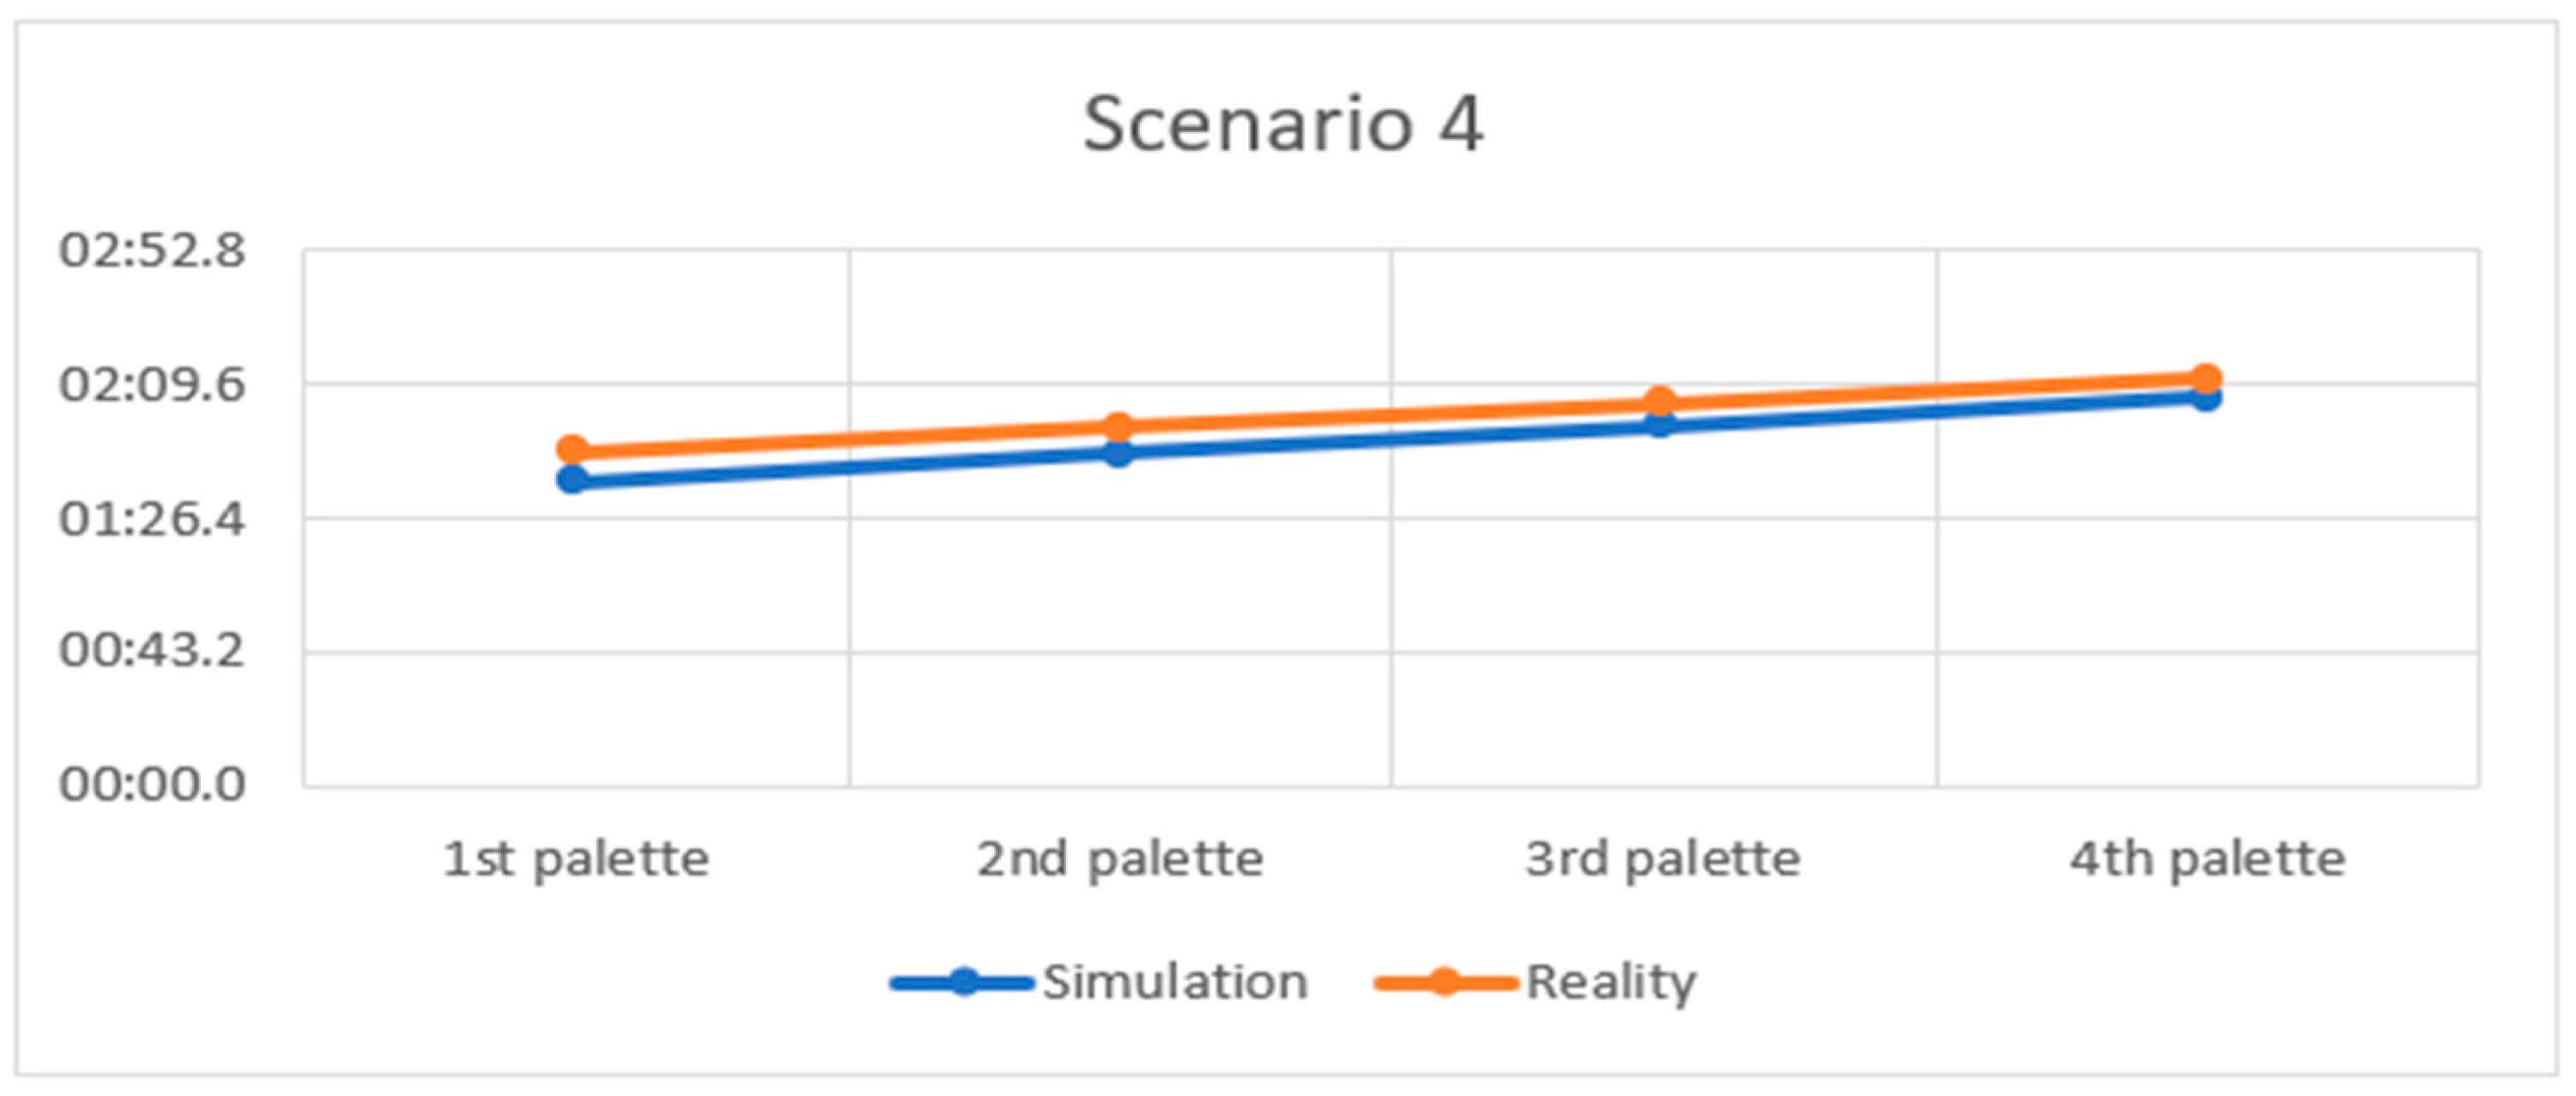
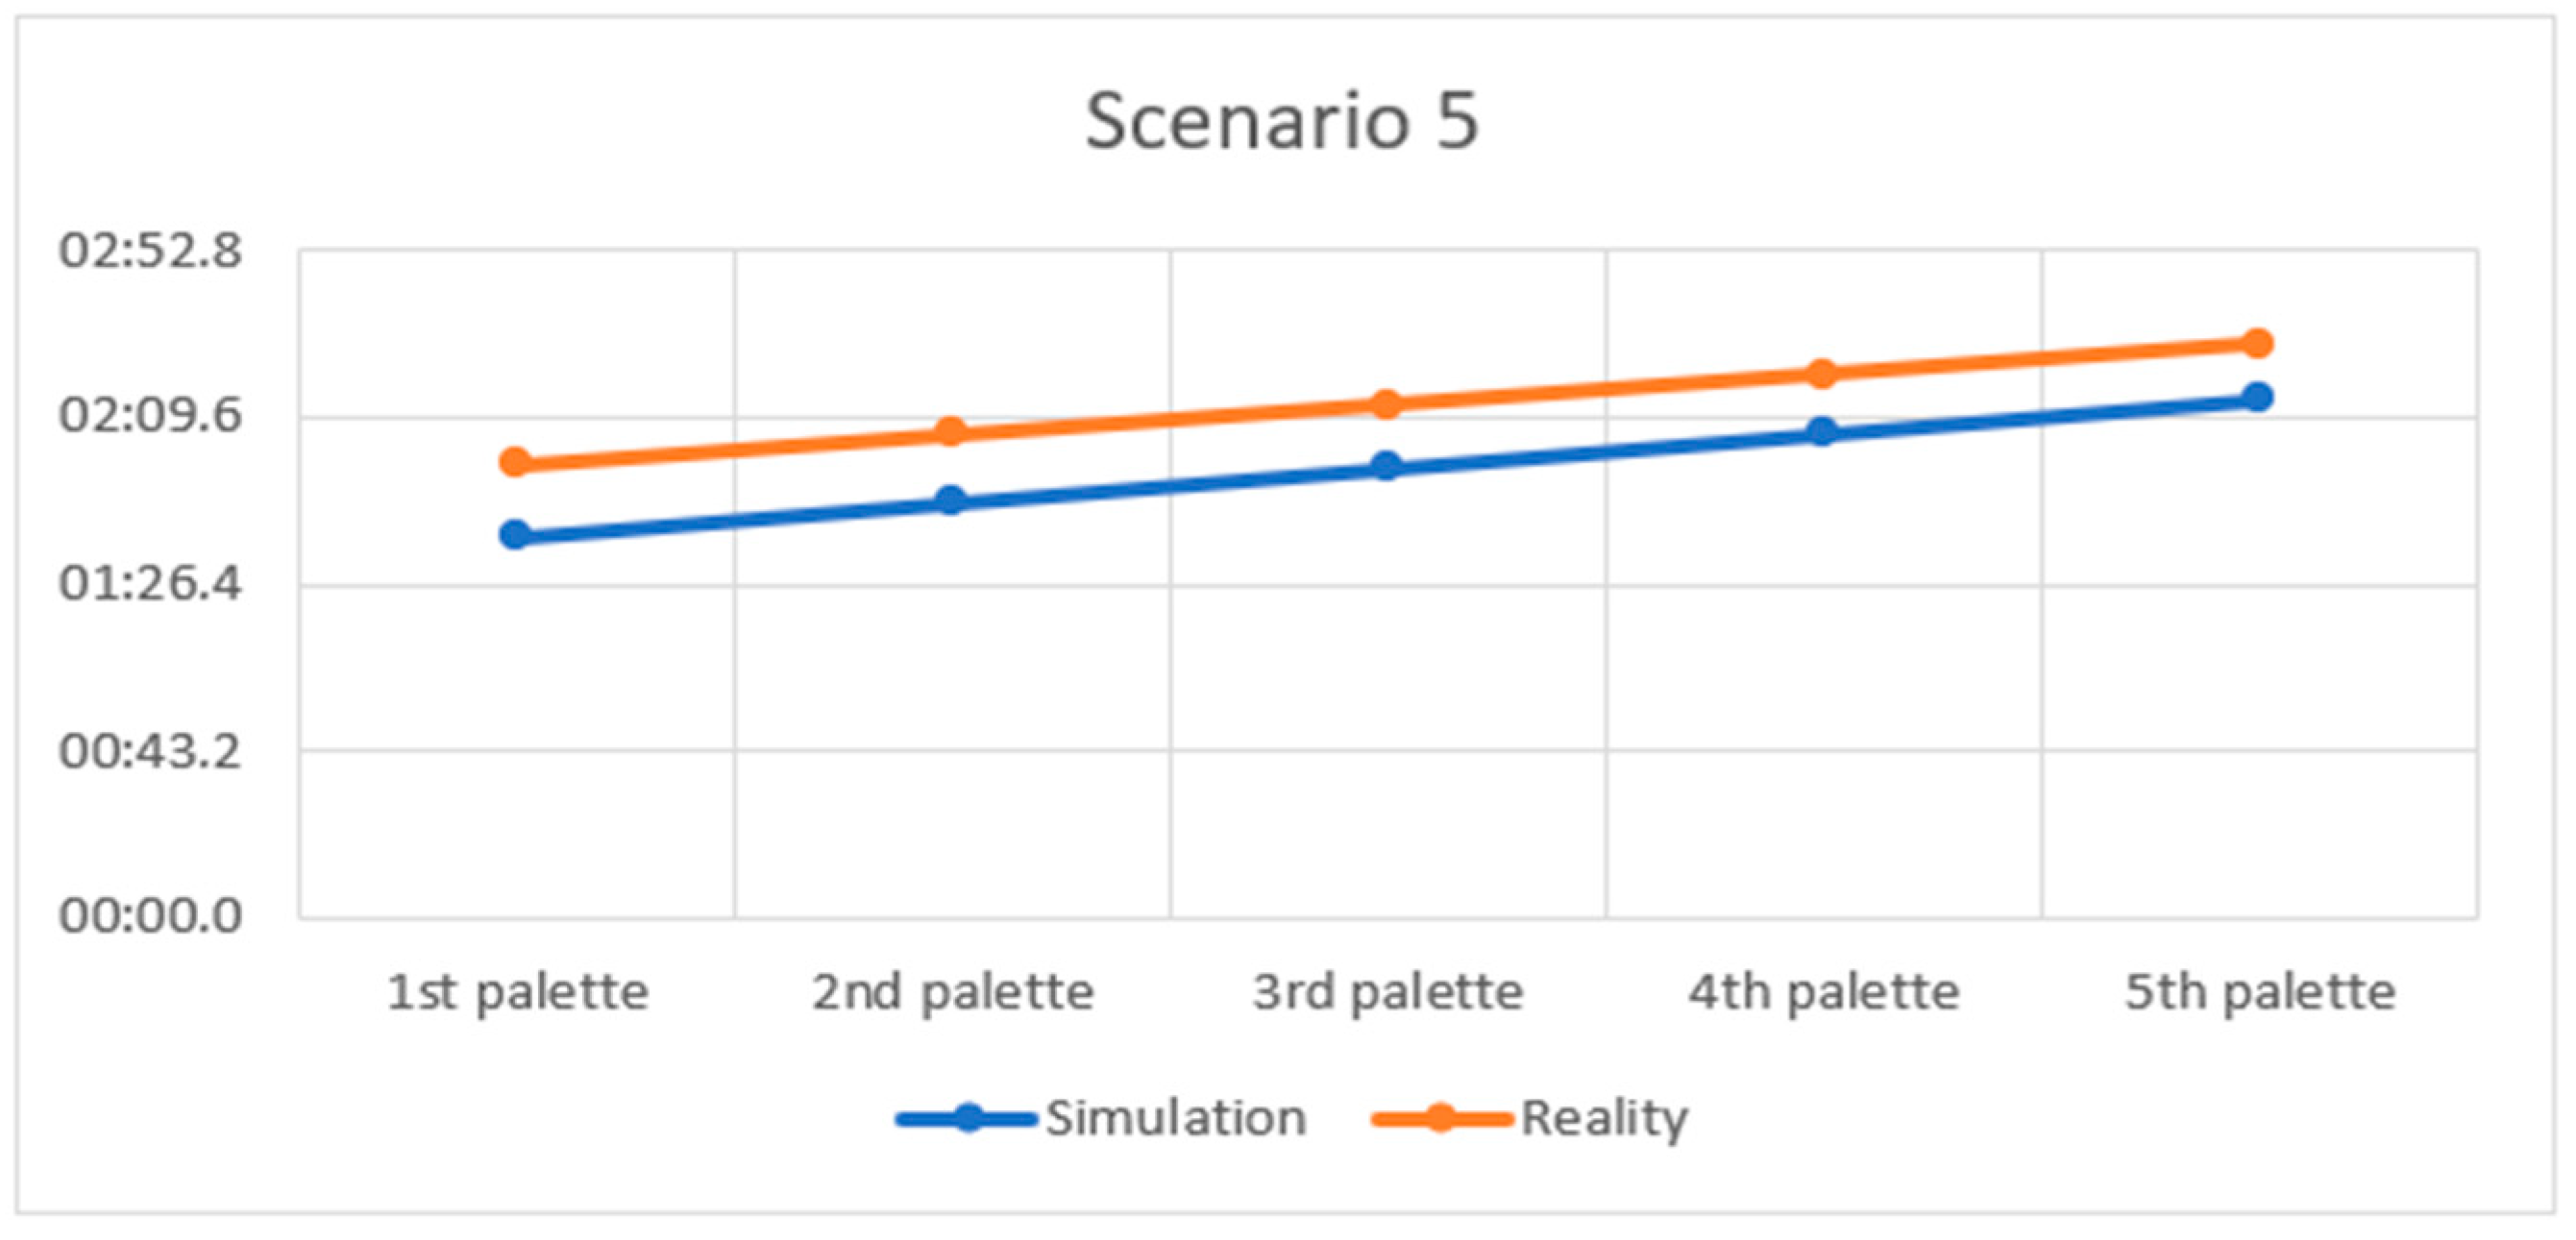
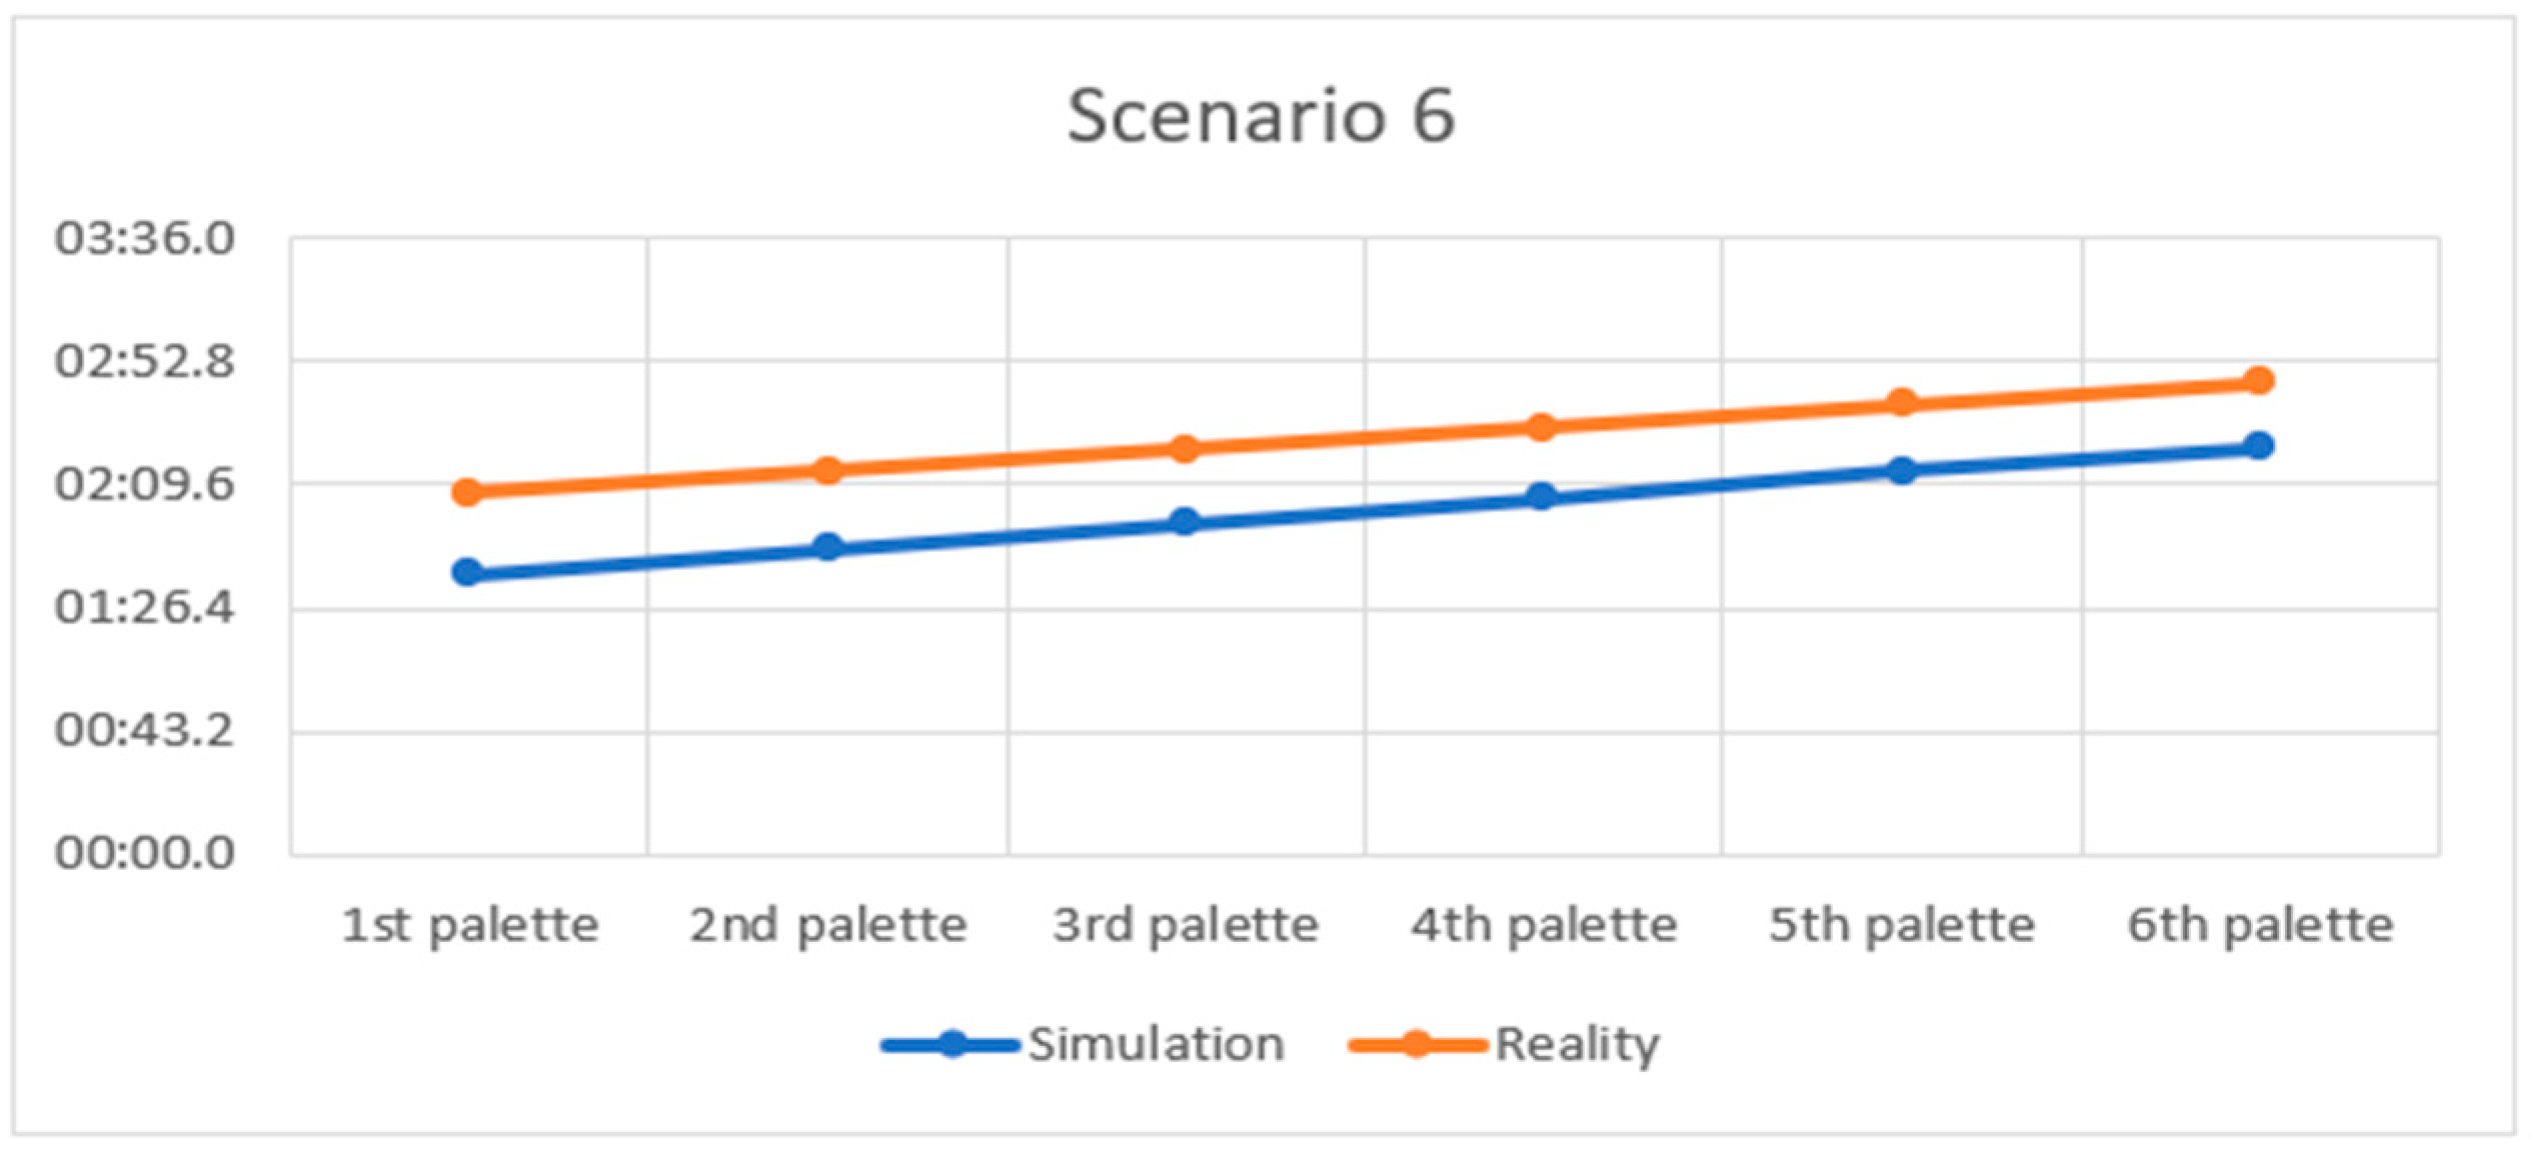
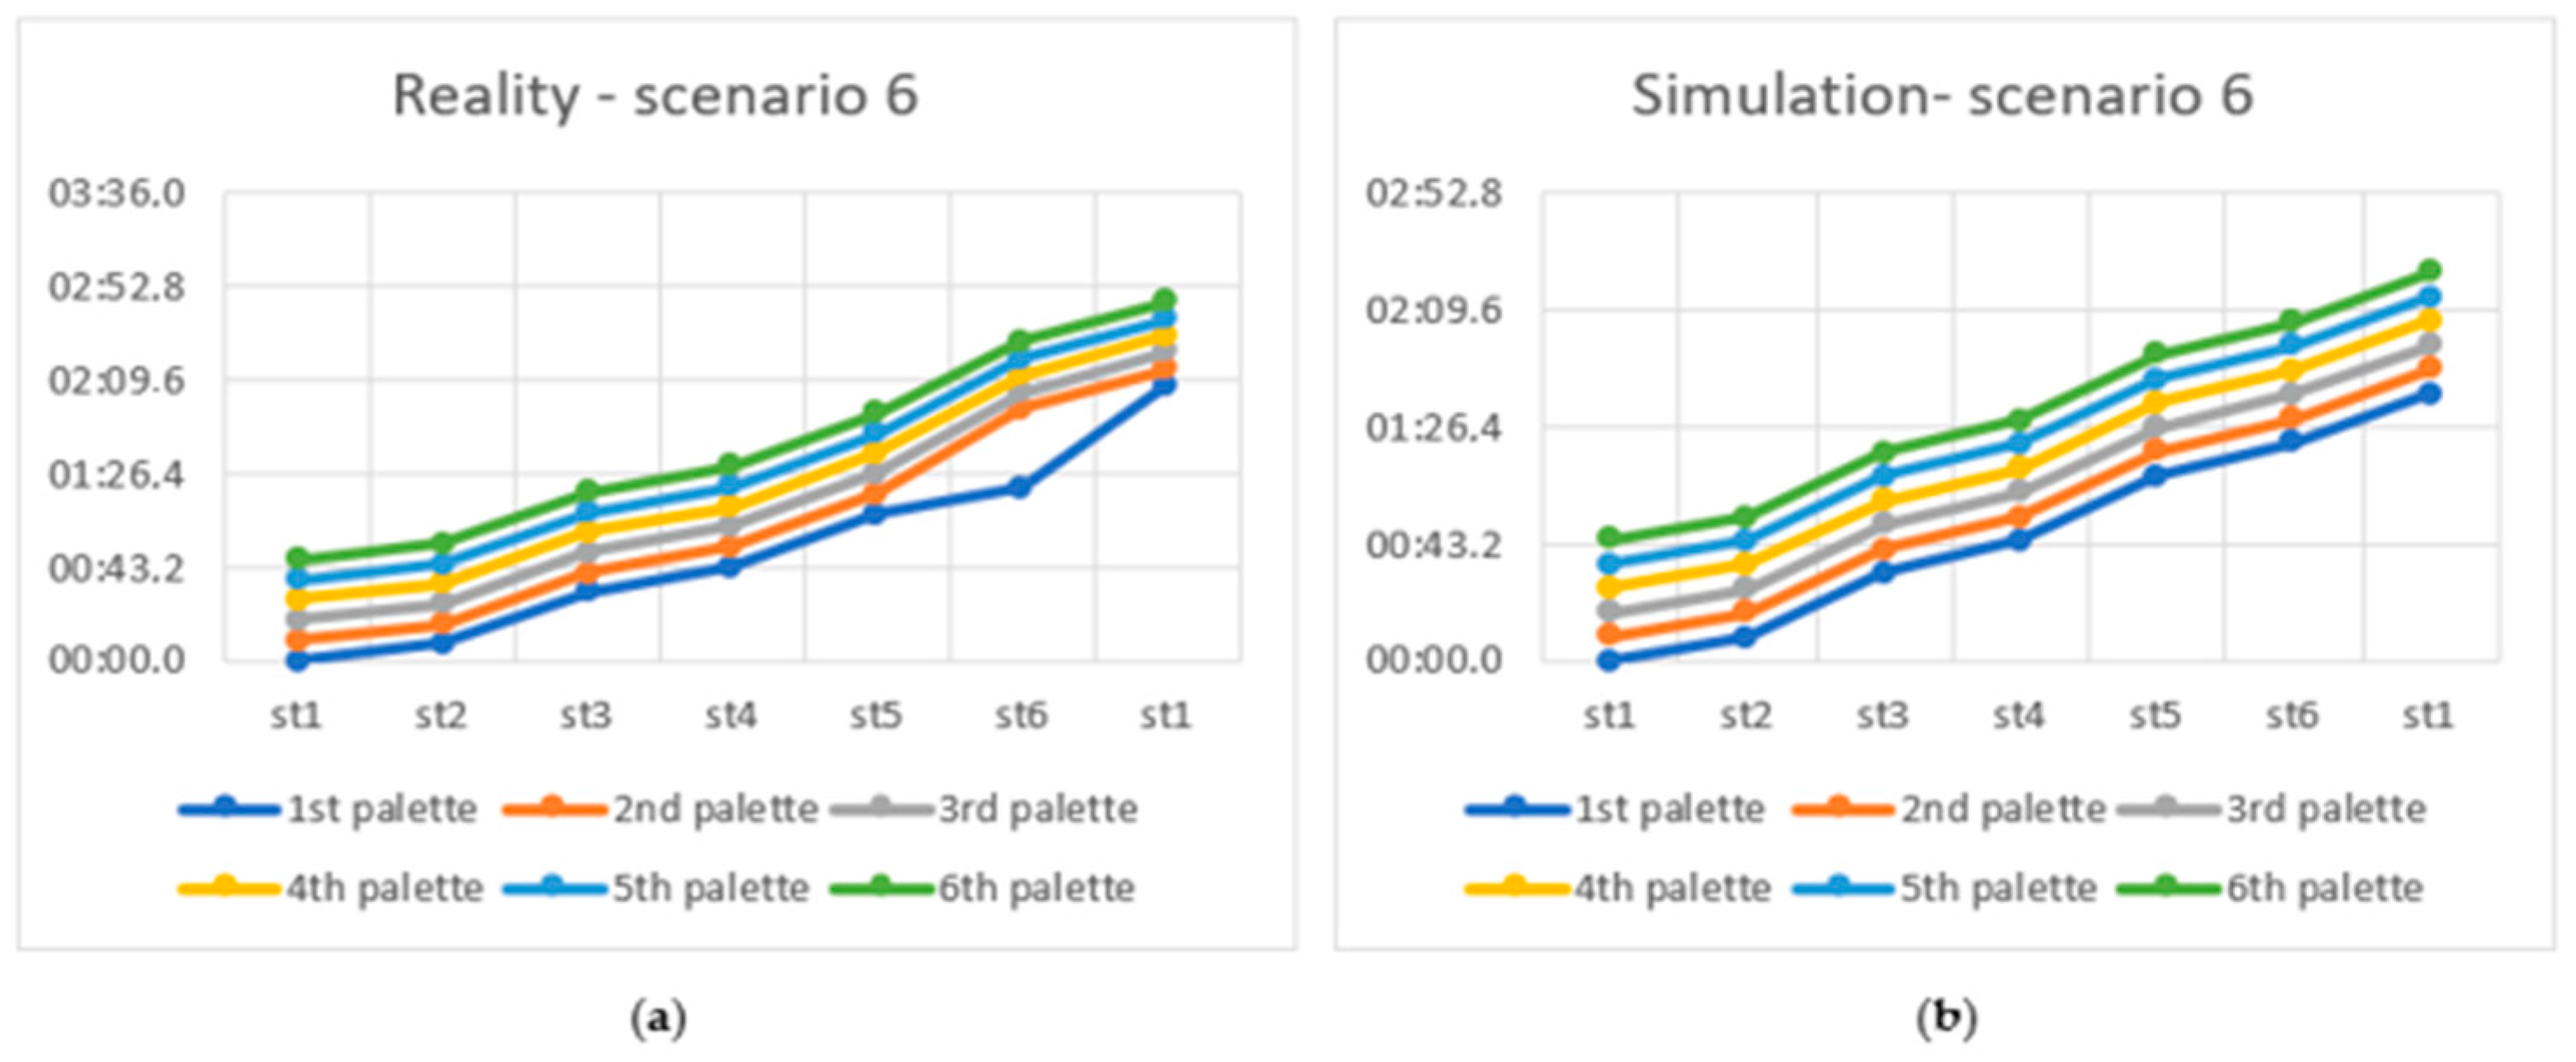
Figure 12). It also shows that the time discrepancies are very small. Analyzing scenarios 4, 5 and 6 (
Figure 13,
Figure 14 and
Figure 15), it can be seen that the time discrepancy is increasing. The difference is smaller in scenario 4 and the largest in scenario 6. It can also be seen that in scenarios 4, 5 and 6 the graphs narrow, which means that the time discrepancy of each successive pallet decreases. That is why charts for the time of arrival of each discus to the stands have been developed to check when the time discrepancy arises.
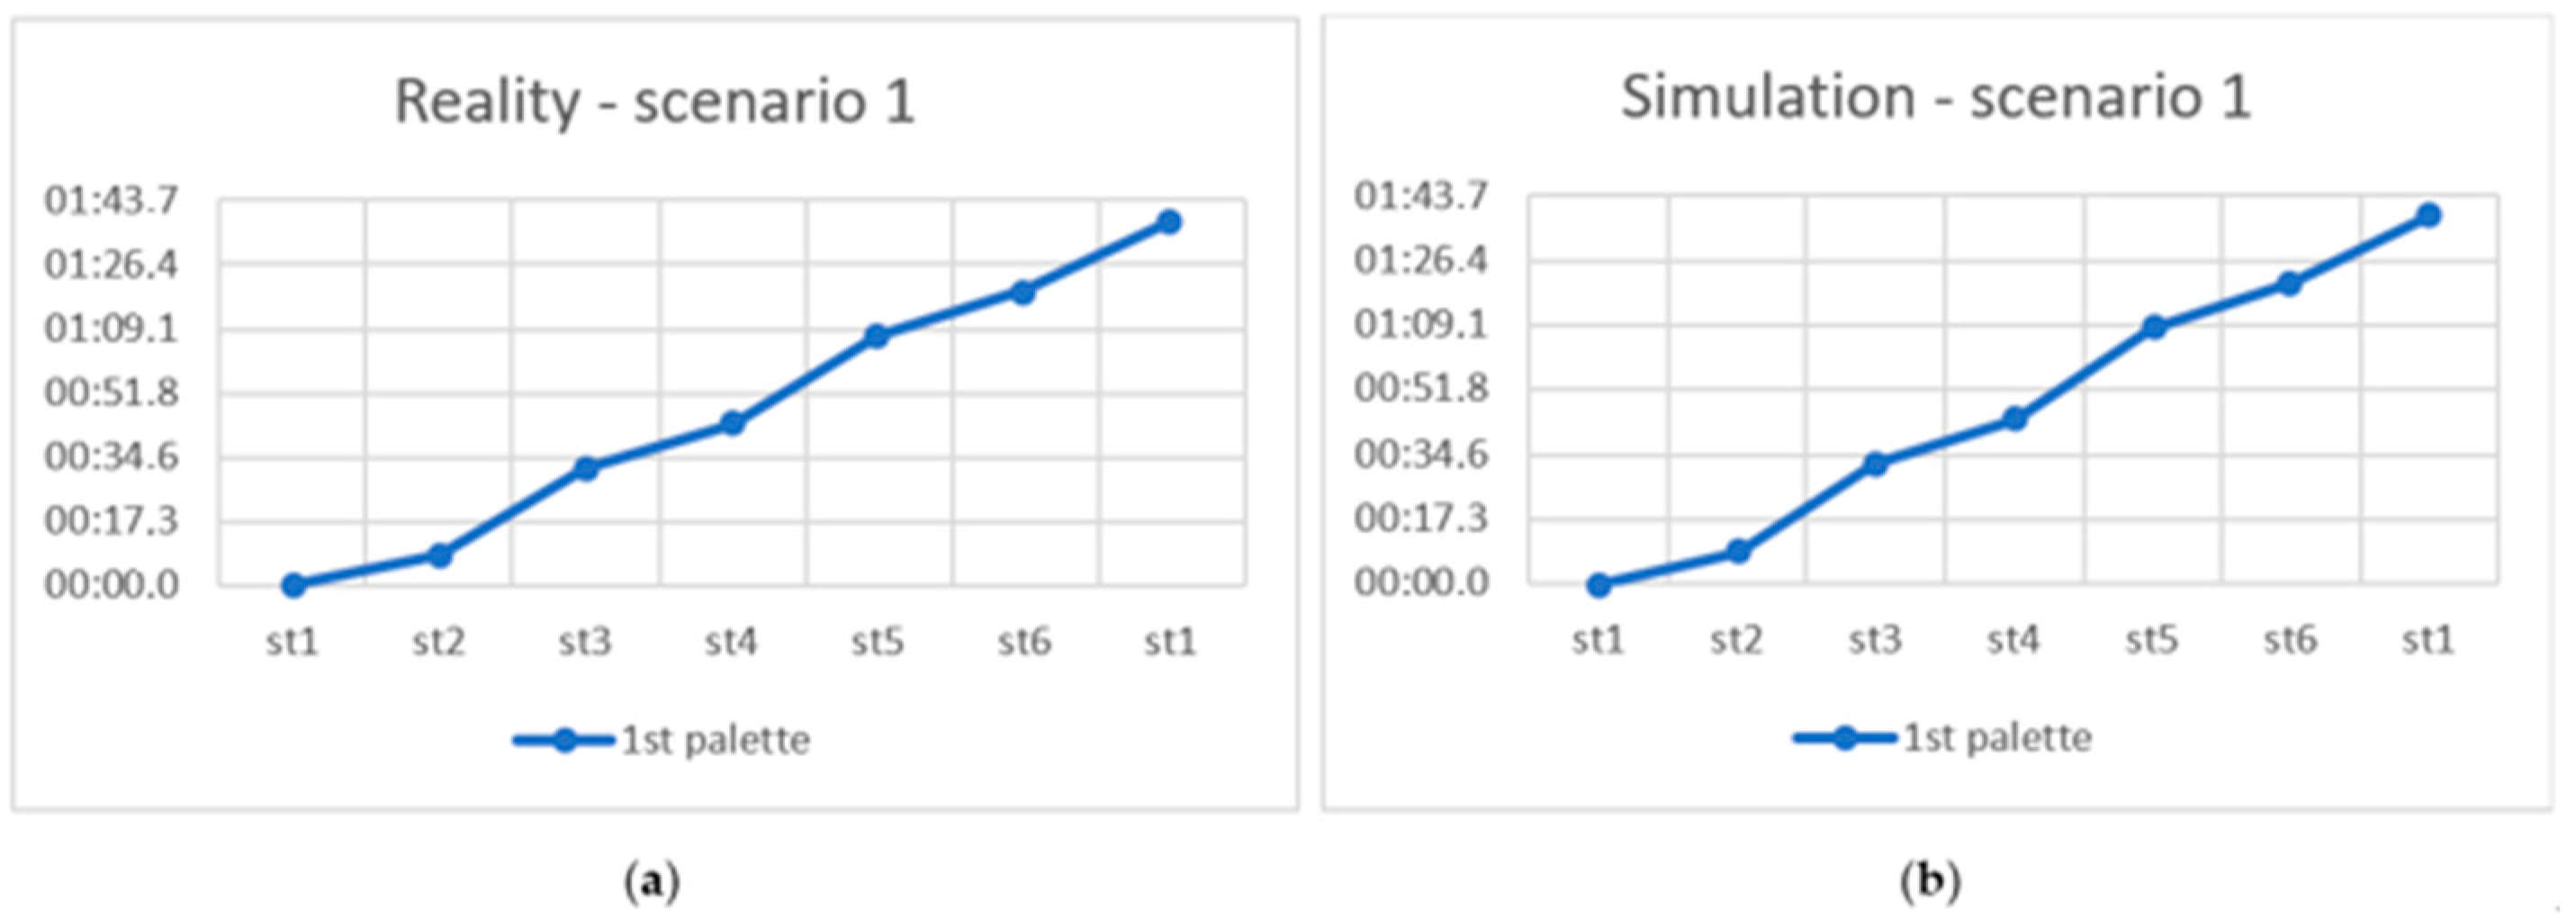
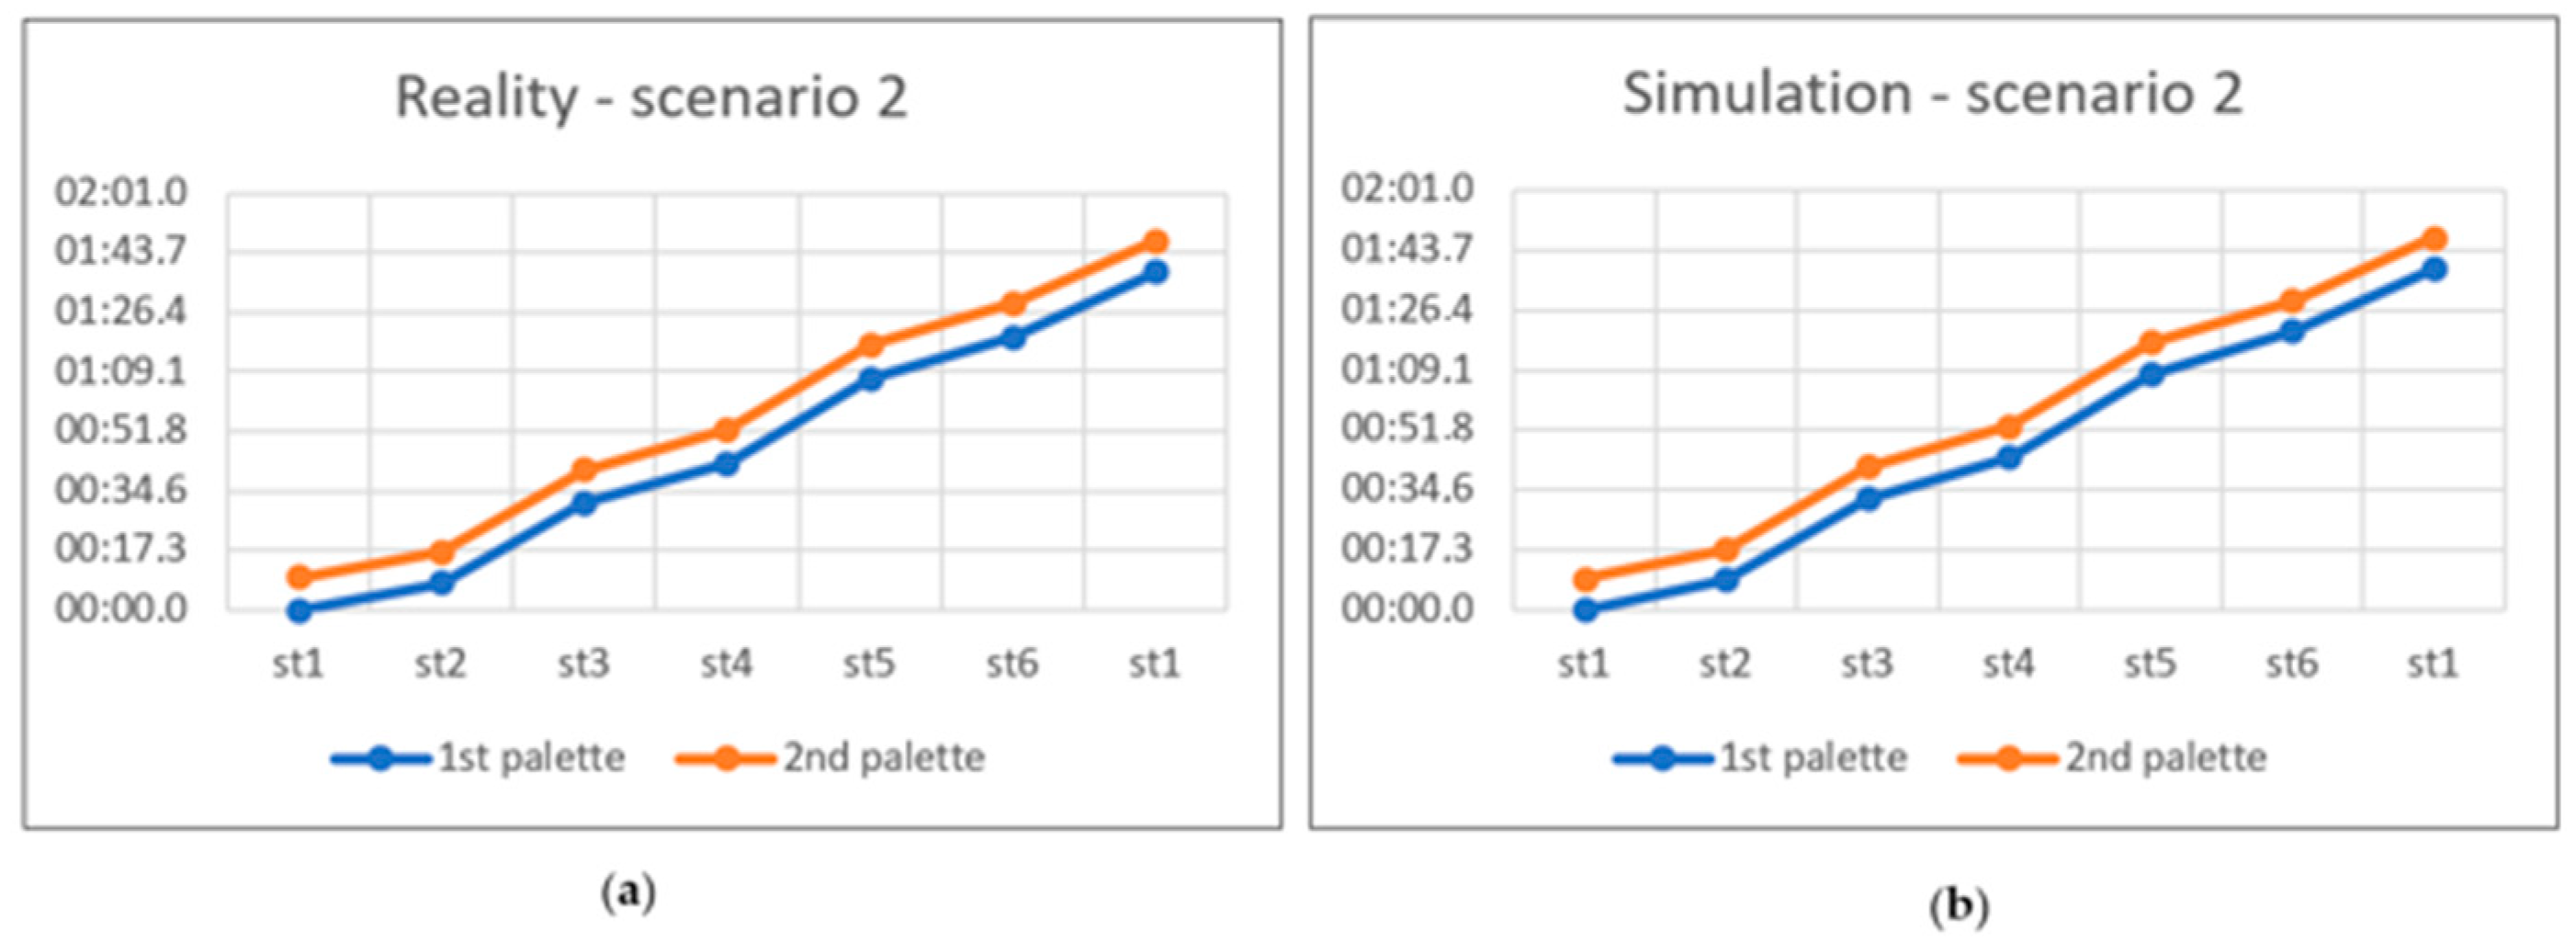
Observing the comparison of discus arrival time to individual stations in scenarios 1, 2 and 3 (
Figure 16,
Figure 17 and
Figure 18), it can be seen that the graphs between the simulation and reality are almost the same.
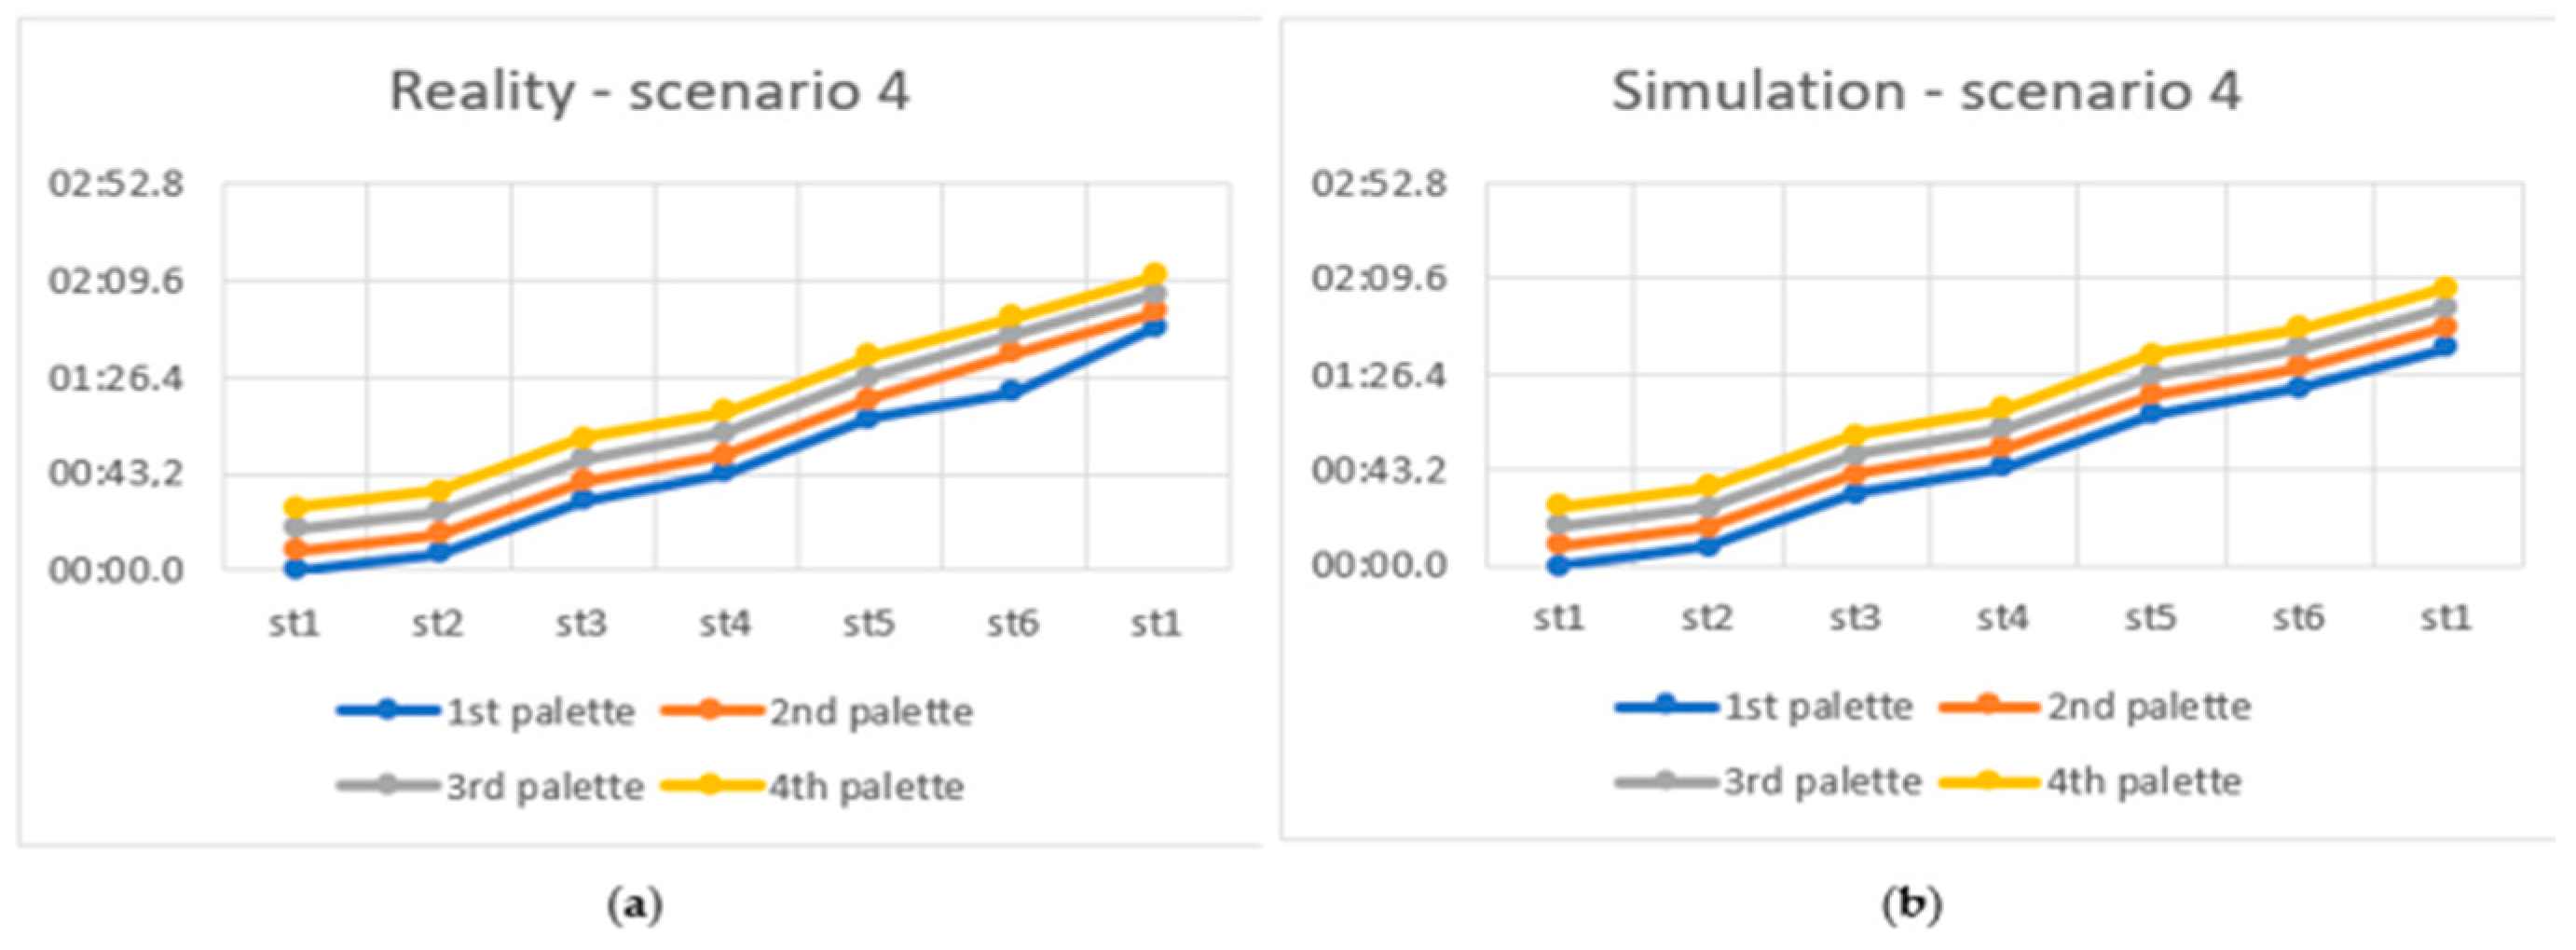
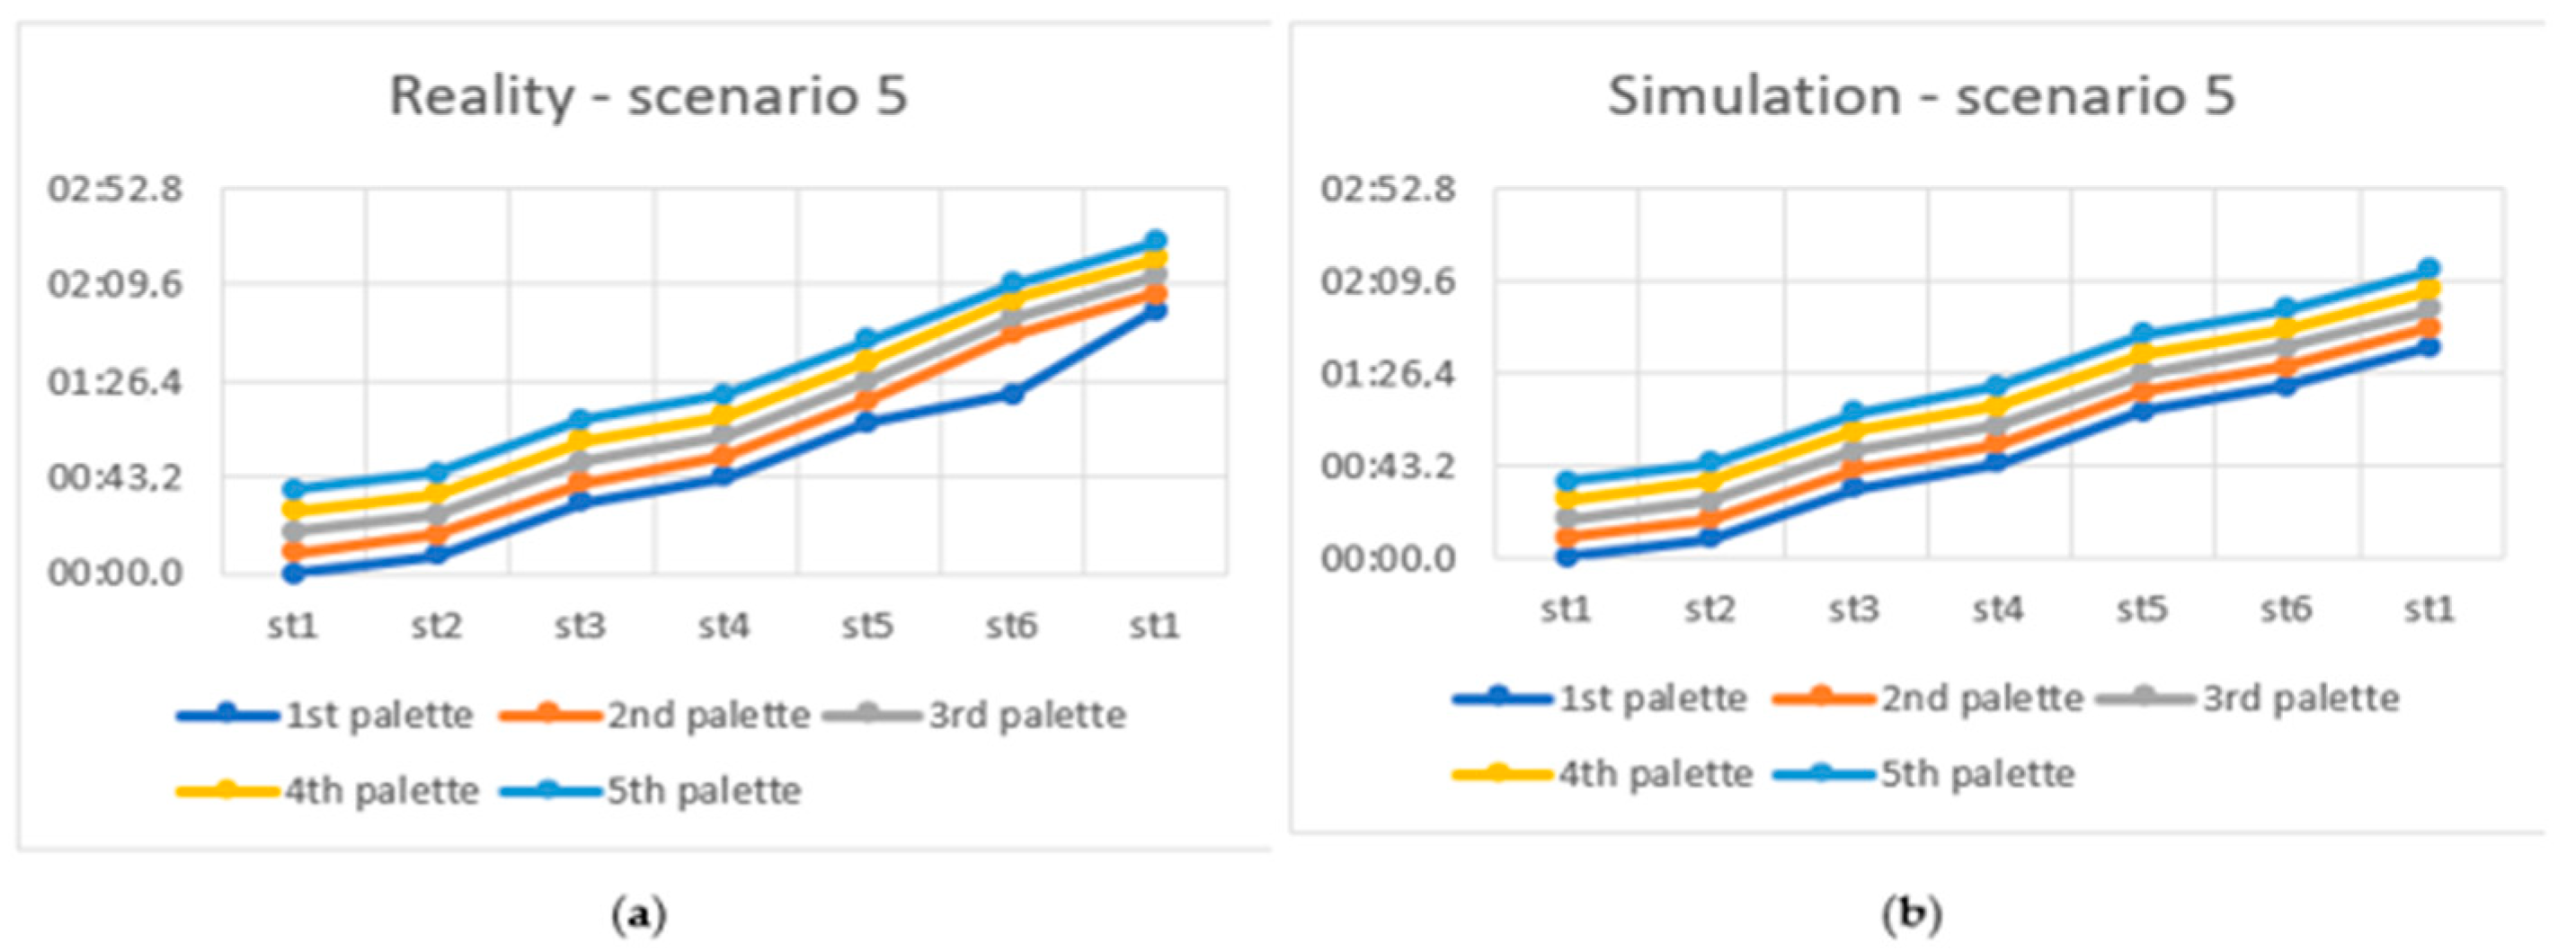
Analyzing the comparison of the time of arrival of each discus to stations in scenarios 4, 5 and 6 (
Figure 19,
Figure 20 and
Figure 21), it can be seen that the discrepancy arises at station six in the real model. This is due to the fact that in the real model, when there were more than three pallets, a queue formed in front of the sixth position. The controller did not release the first pallets from station six until all the pallets were on the small loop where stations five and six are located. This was to avoid discus collisions. In the simulation model, there is no risk of such a collision, so there Is no queue in front of stand six: hence the time discrepancy for scenarios 4, 5 and 6.
The simulation model should reflect real travel times. The time discrepancy between the total real time and the simulation (
Table 1) differs from the number of pallets. The total divergence time for four pallets is 6 s, while for five pallets, it is 14 s, and for six pallets, it is 22 s.
In order to correct the resulting discrepancy and not exceed the difference by more than 10% of real time, it was decided to develop a coefficient. It was called the coefficient of time variation
W(
t). It adds seconds to the simulation duration result. Its dependence on the number of discuses on the line is shown in
Table 2.
The coefficient was also divided into individual pallets depending on the scenario. The coefficient relationships for each tray are shown in
Table 3.
To facilitate the calculation and correction of the simulation results, an Excel file has been developed that will calculate the correct result. The user’s task is only to enter the simulation time of individual pallets (products) into the table.
Table 4 summarizes the calculated and corrected simulation times with the measured real times. The obtained simulation results slightly differ from real times. Deviations in time do not exceed more than 10% of the real time.
6. Conclusions
The aim of the work was to develop and verify a simulation model of an automated assembly line in the Smart Factory laboratory of the Poznań University of Technology. The Tecnomatix Plant Simulation program was used to develop the simulation model.
Simulation models have found application in many fields of science and life. The research method, which is simulation, brings many benefits. Therefore, it is more and more often chosen by companies as a research and optimization method. Using simulations, many experiments can be carried out in a short time without interfering with real processes or systems, thanks to which it is a safe optimization method. Simulation models help to implement the ideas of Industry 4.0; they are an element of augmented and virtual reality and the digital twin.
Tecnomatix Plant Simulation is one of the programs for developing simulation models. It is most often used to simulate production processes and systems as well as logistics systems. It is perfect for building complex simulation models. Before starting work in the Plant Simulation environment, you should familiarize yourself with the possibilities of the program and the basic objects and functions offered by the software in order to best represent the real model.
Verification of the model required determining the scenario of the passage of products. Just one selected scenario provided a lot of data about the real process and the simulation model. The developed simulation model for the route plan, where there are up to three pallets, works correctly with minor time deviations in the form of hundredths of a second, which may result from measurement errors in the real model. In the itinerary, where there are more than three discuses, time discrepancies start to grow. This is due to the fact that in the real model, a queue is created to station six in order to avoid a collision, and in the simulation model, this situation does not occur. The time difference between the simulation and the real model for the fifth scenario is within the assumed difference of 10% of real time. The sixth scenario exceeds the assumptions, so a coefficient was developed that corrects the resulting difference. Therefore, the simulation model does not exactly reproduce the real model, but after analyzing the simulation results, a solution was found that allows you to still use the simulation model.
Further work will focus on improving the representation of the real model so that the time correction factor does not have to be used. Work will also be focused on improving the view of the 3D model. The developed simulation model of the assembly line is a good base for further development in terms of model expansion, both programming and visual.


