Article

Personalized Advertising Design Based on Automatic Analysis of an Individual’s Appearance

by
Marco A. Moreno-Armendáriz
1,
Hiram Calvo
1,*,
José Faustinos
1 and
Carlos A. Duchanoy
1,2
1
Computational Cognitive Sciences Laboratory, Center for Computing Research, Instituto Politécnico Nacional, Mexico City 07738, Mexico
2
Gus Chat, Av. Paseo de la Reforma 26-Piso 19, Mexico City 06600, Mexico
*
Author to whom correspondence should be addressed.
Appl. Sci. 2023, 13(17), 9765; https://doi.org/10.3390/app13179765
Submission received: 4 July 2023 / Revised: 6 August 2023 / Accepted: 16 August 2023 / Published: 29 August 2023
(This article belongs to the Special Issue Deep Vision Algorithms and Applications)

Abstract

:

Featured Application

Human resources, security, customer service, and intelligent recommendations can benefit from deploying and applying systems such as the one proposed in this paper.

Abstract

Market segmentation is a crucial marketing strategy that involves identifying and defining distinct groups of buyers to target a company’s marketing efforts effectively. To achieve this, the use of data to estimate consumer preferences and behavior is both appropriate and adequate. Visual elements, such as color and shape, in advertising can effectively communicate the product or service being promoted and influence consumer perceptions of its quality. Similarly, a person’s outward appearance plays a pivotal role in nonverbal communication, significantly impacting human social interactions and providing insights into individuals’ emotional states. In this study, we introduce an innovative deep learning model capable of predicting one of the styles in the seven universal styles model. By employing various advanced deep learning techniques, our models automatically extract features from full-body images, enabling the identification of style-defining traits in clothing subjects. Among the models proposed, the XCEPTION-based approach achieved an impressive top accuracy of 98.27%, highlighting its efficacy in accurately predicting styles. Furthermore, we developed a personalized ad generator that enjoyed a high acceptance rate of 80.56% among surveyed users, demonstrating the power of data-driven approaches in generating engaging and relevant content. Overall, the utilization of data to estimate consumer preferences and style traits is appropriate and effective in enhancing marketing strategies, as evidenced by the success of our deep learning models and personalized ad generator. By leveraging data-driven insights, businesses can create targeted and compelling marketing campaigns, thereby increasing their overall success in reaching and resonating with their desired audience.

1. Introduction

Marketing plays a crucial role in leveraging machine learning for various business applications. Effective advertising communication is an essential tool in the strategic planning of any business involved in the trade of goods or services as it directly impacts revenue and precedes other areas, like customer service and sales planning.
In the digital age, modern marketing benefits from a vast amount of quantifiable data that can be leveraged in machine learning systems. While many small and medium-sized companies may be relatively new to marketing applications utilizing machine learning, trends indicate that this technology is highly favorable and its implementation is expected to increase [1].
In the past, mass advertising was the prevailing marketing standard. However, in recent times, people expect a more personalized approach, and a mass marketing strategy may no longer be as effective. Targeted ads offer flexibility, allowing businesses to tailor their advertisements to directly engage with specific segments by understanding their needs and desires [2].
An essential objective of marketing strategies is to understand the needs and preferences of potential customers, enabling the segmentation of a target market comprising individuals who are most likely to respond positively to advertising efforts [3]. This information can also be used to adapt the presentation of advertisements, aiming to elicit a favorable response. Several studies have been presented that contribute to understanding consumer behavior, technology adoption, and brand performance in the context of online shopping, e-banking, and social media platforms [4,5,6,7,8].
Psychological factors specific to individual customers are considered important segmentation variables. These factors, including personality, lifestyle, and appearance traits, stem from individuals’ preferences, interests, and needs. Marketers can leverage these traits to establish more effective communication through advertising [9]. This collection of features is often referred to as customer psychological traits or the psycho-cognitive spectrum [10]. Research has shown that psychological traits can be extracted from various sources, such as speech, body language, and physical appearance. In the context of physical appearance, the concept of “Style” arises. Style refers to identifiable patterns in an individual’s physical appearance that externalize and describe their psychological, sociological, economic, vocational, and behavioral environments [11,12].
While variables like demographics can be easily obtained and provide some information, their collective nature often makes them fall short in meeting business demands. In contrast, psychological traits offer valuable insights but are more challenging to obtain and measure. Due to the complexity involved in acquiring these traits, they are typically overlooked in advertising strategies [13].
The significance of the style concept in this study is noteworthy, as it captures psychological traits through observable components of a person’s appearance. Establishing a relationship between easily obtainable elements, such as photographs or videos, and the psychological traits necessary for market segmentation enables the proposal of a model that automates these processes, providing tools to achieve business goals.

Biases and Attributions for Personalized Recommendations

Personalized marketing involves using data and insights to tailor marketing messages and experiences to individual consumers. Biases and attributes can be combined to create more effective personalized marketing strategies. Here are some ways that biases and attributes can be used in personalized marketing.
Eliminating unintended bias. Personalized marketing can sometimes result in unintended discrimination due to underlying correlations in the data between protected attributes and other observed characteristics used by marketers. To avoid this, marketers can use bias-eliminating adapted trees (BEATs) to eliminate unintended bias in personalized policies [14].
Marketing attribution. Attribution models can be subject to correlation-based biases when analyzing the customer journey, causing it to look like one event caused another when it may not have. To avoid this, marketers should use effective attribution to reach the right consumer at the right time with the right message, leading to increased conversions and higher marketing ROI. Attribution data can also be used to understand the messaging and channels preferred by individual customers for more effective targeting throughout the customer journey [15] (https://www.marketingevolution.com/marketing-essentials/marketing-attribution (accessed on 18 August 2023)).
Personalized recommendations. Personalized recommendations can be based on a wide range of factors, including past purchases, browsing history, search queries, and demographics. For example, marketers can use personalized recommendations to suggest products or services that are likely to be of interest to individual customers [16,17].
Cognitive biases. Cognitive biases can be used in marketing to boost customer retention. For example, personalized marketing messages can be used to create a bond with the audience, and marketers can align with customer values by promoting charity, sustainability, and other noble causes. The reciprocity bias can also be used in loyalty programs that focus on building an emotional connection with customers [18].
It is important to note that personalized marketing can exacerbate existing inequalities and biases if personalization is based on sensitive data such as race, gender, or other protected attributes. Marketers should be aware of these considerations and guidelines to ensure that their personalized marketing strategies are ethical and inclusive [19]. By understanding biases and using them in a thoughtful and intentional way, marketers can create more impactful campaigns and improve their overall marketing success [20].
This study provides an in-depth analysis of the psychological traits of potential customers by assessing their apparent style based on full-body photographic samples. The predicted style is then used as a market segmentation variable to automatically generate personalized ads. To accomplish this, we establish a connection between each of the seven styles and well-known theories of color, geometry, and typography in advertising. As a result, we introduce a novel set of rules that can generate a unique ad for each user.

2. Style Model

2.1. Apparent Style

Style refers to identifiable patterns in an individual’s physical appearance that describe and externalize their psychological, sociological, economic, vocational, and behavioral environments [11,12].
Initially, studies in human behavior and social interaction focused primarily on verbal communication. However, in the early 1960s, a new field of analysis called nonverbal communication emerged. This interdisciplinary research, involving anthropologists, sociologists, psychologists, philosophers, semiotics specialists, and linguists, explores the body, style, and language. Some studies [21] have expanded the realm of semiology to encompass all phenomena that carry meaning and recognize the communicative value of clothing. These authors acknowledge the existence of a language of communication through style [22].
The style of clothing evolves from the interplay between an individual and their sociocultural environment [23]. This interaction gives rise to various accessories, and as social groups, individuals construct meanings associated with these garments. Anthropologically, clothing serves as a vessel of accumulated information [24].
The community interprets this code through a voluntary or unconscious process of recognition, allowing clothing to convey desired social meanings [25].
While style is understood to reflect intrinsic traits of each individual, the material aspect it encompasses should not be overlooked. The individual is constrained in various ways when expressing their style within the limitations imposed by their environment, be it adhering to dress conventions, such as uniforms or work attire, or simply having access to certain types of clothing.
Therefore, most models designed to evaluate style focus on specific instances, capturing a snapshot that reflects an individual’s features and considering only the elements of style present at that particular time. This evaluation assumes some level of stability and freedom of choice regarding the multiple garments an individual can wear at different times [26]. Furthermore, although it presents a limitation, the inherent intentionality of style allows for its evaluation in this manner. This particular aspect is commonly referred to as the style image or apparent style [23].

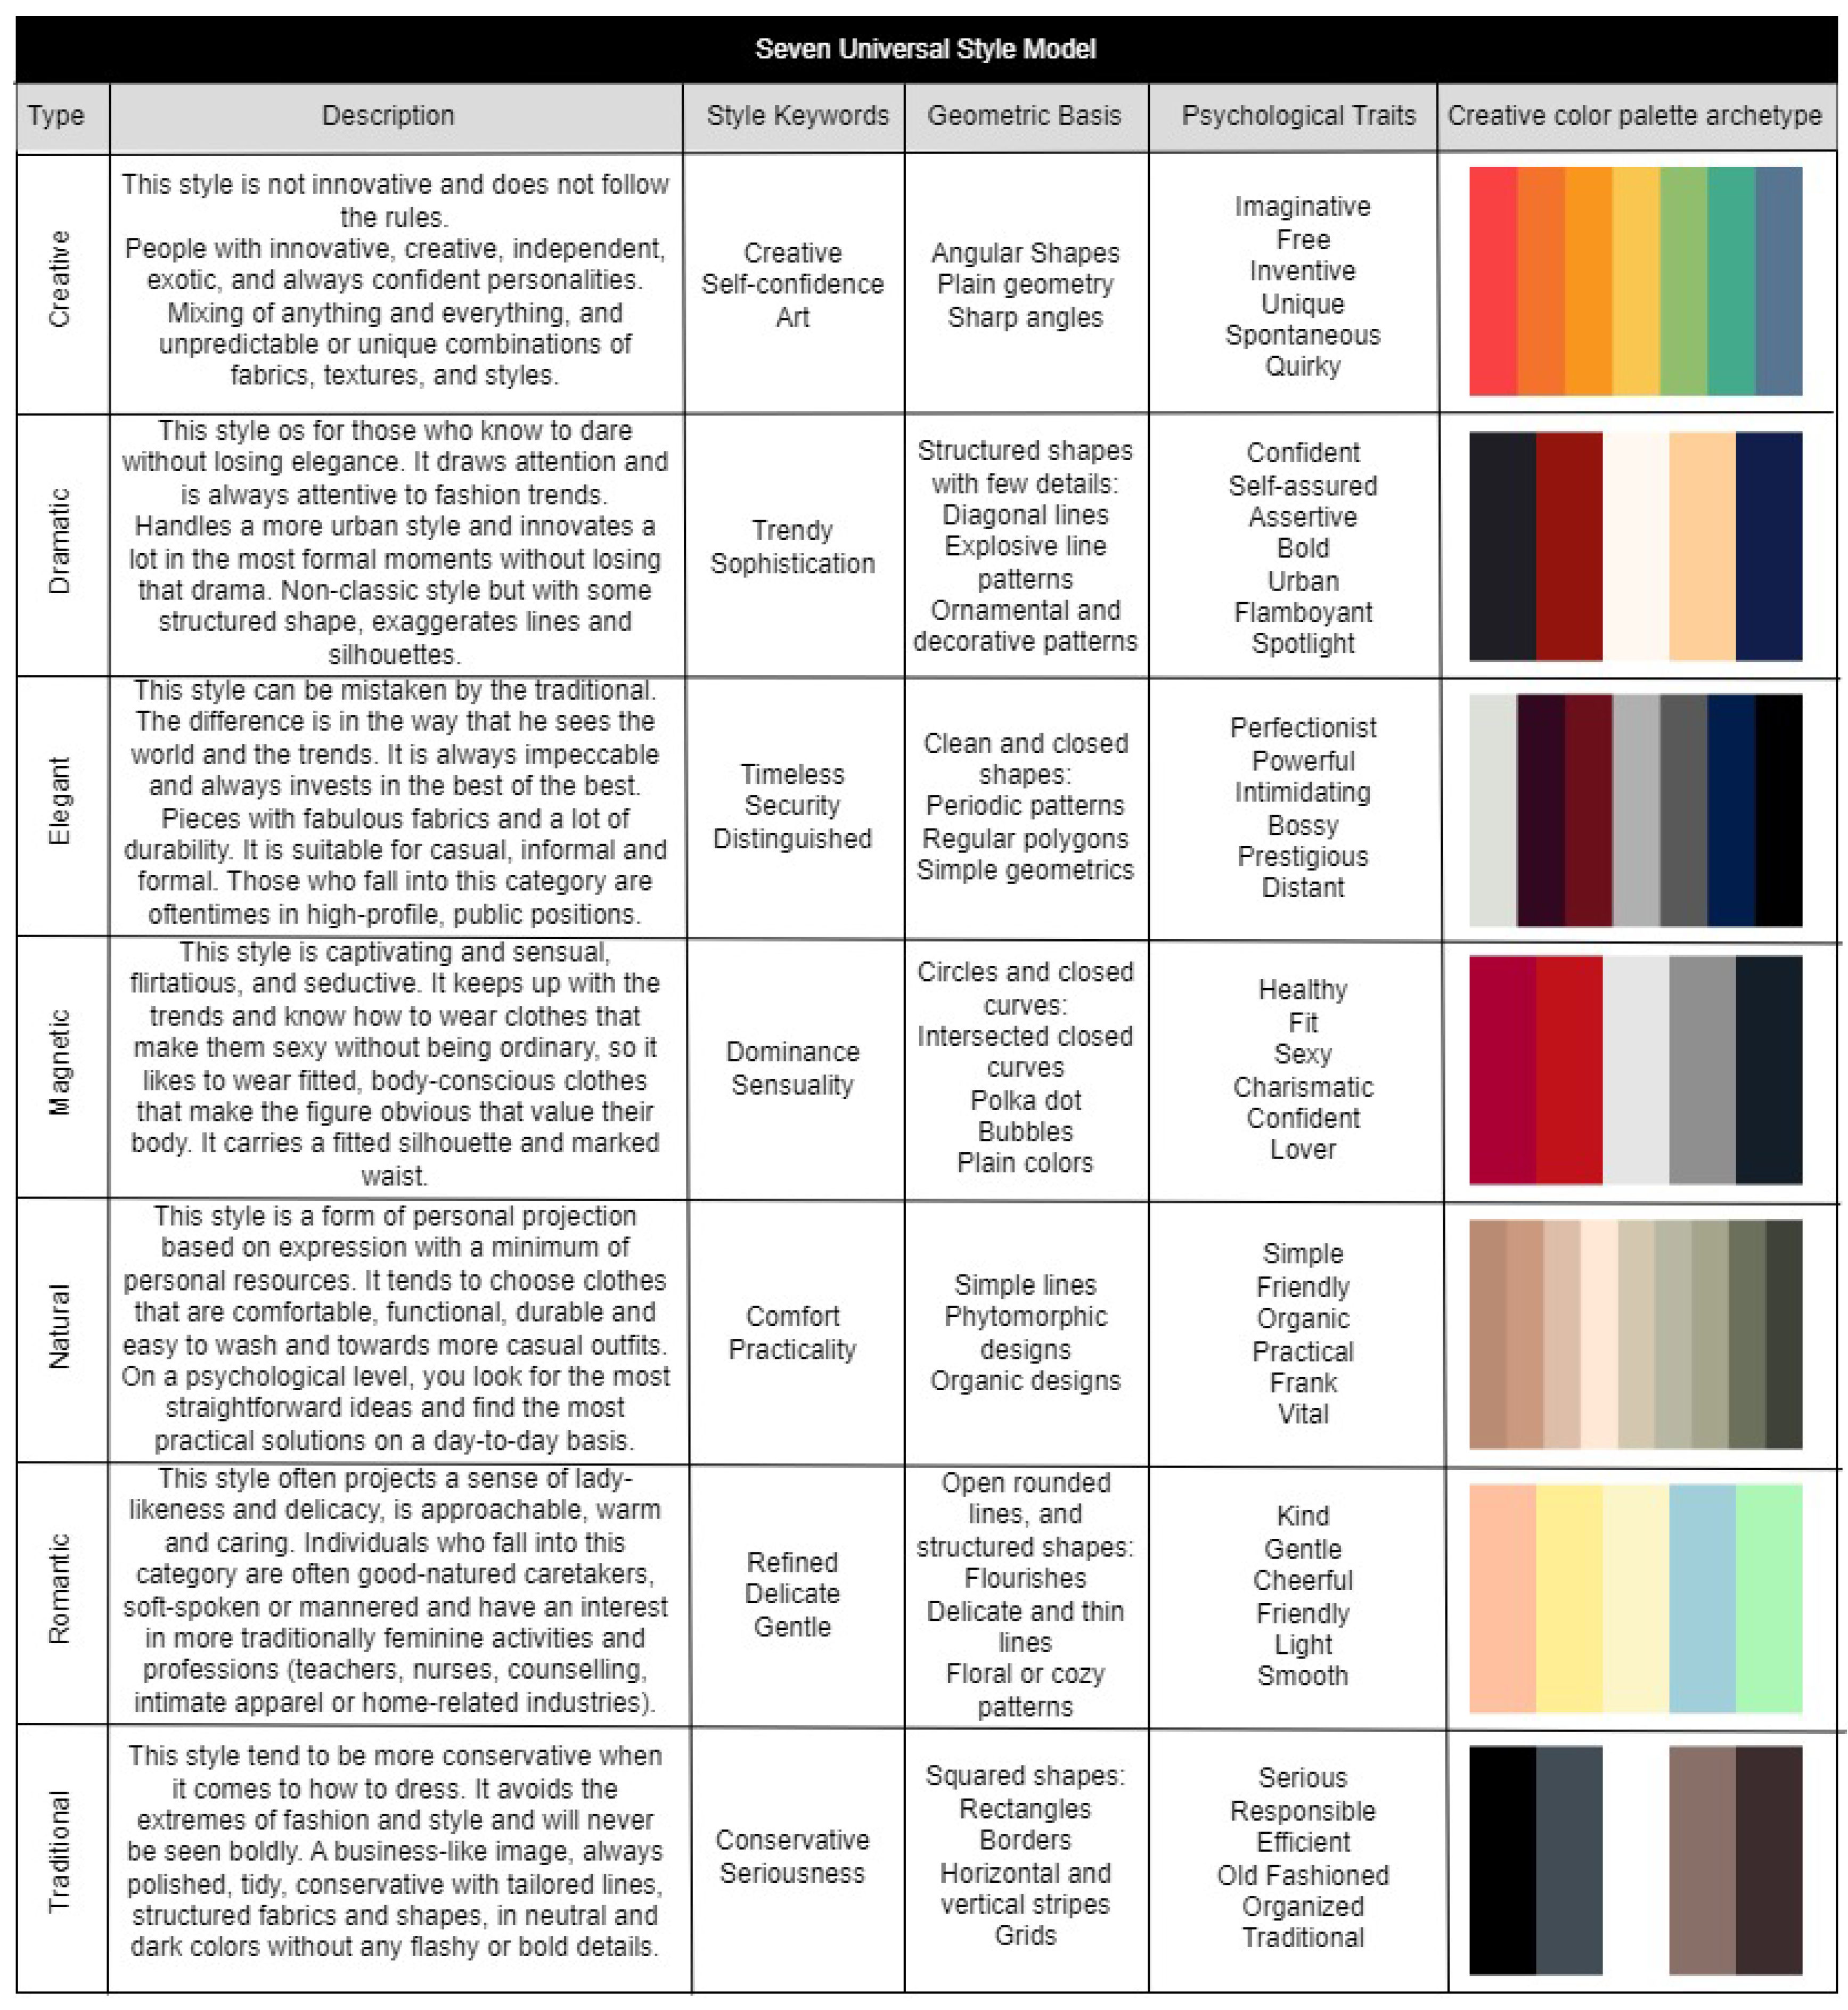
2.2. Seven Universal Styles Model

In her work [27], Alice Parsons presents a style evaluation model based on seven distinct types. This framework categorizes individuals’ clothing based on the messages they convey to others.
These concepts have undergone scrutiny by traditional social science disciplines [28] and represent one of the most widely accepted models for evaluating apparent style. The theoretical foundation has been instrumental in various communication professions, ensuring consistent information transmission and proving valuable when assessing the style of individuals or companies and their interactions [29].
Parsons outlines the seven universal styles in her research [27], providing descriptions that encompass the defining traits of each style, a set of keywords associated with the individual, chromatic and geometric guidelines for patterns and designs, and a collection of psychological traits typically associated with each style.
Figure 1 presents an overview of the seven universal styles model, providing a concise description of each style, including keywords, associated geometric structures, significant psychological characteristics, and a color palette archetype.

3. Related Work

For over 60 years, researchers have conducted numerous investigations on nonverbal communication, and new theoretical contributions continue to emerge in this field of study. Of particular interest for this work is the analysis of an individual’s relationship with society [28,30]. Some studies include the evaluation of style as part of the study of nonverbal communication [29,31,32,33,34,35,36].
Nonverbal communication encompasses various aspects, including body composition and height, as our society extensively recognizes physical attributes that distinguish physically attractive individuals from less attractive ones. Consequently, individuals who do not meet societal standards often employ accessories, such as clothing, cosmetics, hairstyles, and glasses, or, in extreme cases, resort to plastic surgery [37]. From this list, this work focuses on clothing style as one of the most common ways to influence others’ perceptions of an individual. As the famous saying goes, “As I see you, I treat you”. Numerous researchers have made valuable contributions to studying the relationship between a person’s clothing style and their environment. In [37], the authors discuss various aspects of dressing style as a form of communication, exploring dimensions such as credibility, likability, interpersonal attractiveness, and dominance [38,39,40]. Additionally, these investigations have sparked the interest of experts in developing artificial intelligence algorithms capable of inferring personality traits from various sources of information, such as text or images. Some of the works mentioned below, including their methodologies and results, serve as the foundation for the present research.
In [41], Liu et al. utilized nearly one million annotated images from diverse settings to train a novel deep model called FashionNet. This model outperforms previous models, like Where To Buy It (WTBI) [42] and the Dual Attribute-Aware Ranking Network (DARN) [43], making it highly useful for DeepFashion tasks. In [44], the authors collected images from street webcams and surveillance videos that contained subcategories of attributes such as garment color tones and clothing types. They proposed a novel double-path deep domain adaptation network, enhancing the performance of the convolutional neural network (CNN).
In [45], a small dataset of images labeled with garment names was used to train a CNN-like network. The authors then expanded their dataset by downloading numerous images from the Internet, even though the accompanying labels were not always accurate. Using their neural network, they were able to label up to 78% of these new images. Chen et al. in [46] introduced a divide-and-conquer methodology to reduce complexity when training deep network models for clothing classification. They employed transfer learning techniques and trained several deep networks, each providing a binary classification. This strategy resulted in a significant 18% improvement compared to previous architectures.
To contribute to clothing style recognition, Lui et al. [47] created a dataset consisting of four different views of the same clothing item and 264 descriptors that describe various aspects of the clothing. They also proposed a new deep network architecture based on VGG [48], achieving an accuracy of 80%. In an effort to improve clothing image annotation, the authors of [49] presented a novel methodology. First, a person’s pose is detected in an image, and subimages corresponding to different parts of the clothing are extracted. These subimages are then used to generate collections that focus on specific parts of the body, such as the left shoulder. Tags are extracted for each collection, and a tag refinement process is employed. Simultaneously, the subimages undergo a part-alignment process to relate them to specific body parts. Various descriptors, including color histograms, edges, and wavelet transforms, are extracted from each subimage and concatenated. Principal component analysis (PCA) is applied to these descriptors, resulting in a clothing image descriptor. This descriptor is then used in a visual indexing system that generates a list of tags, which is further refined to obtain the top-ranked tags. This methodology demonstrates a significant improvement compared to previous methods.
We incorporated the information provided into a literature review table to present a clearer overview of the related works and their methodologies.
By presenting the relevant literature in Table 1, we aim to provide a concise and organized overview of the related works and their contributions to clothing style recognition. This table highlights the diverse methodologies and datasets used in previous studies and underscores the novelty and significance of our approach in the context of personalized advertising based on dress style. Finally, to the best of our knowledge, no similar work has been conducted on personalized advertising based on dress style.

4. Methodology

Our proposed methodology, depicted in Figure 2, aims to generate personalized ads based on dress style. To achieve this, we followed several steps outlined below.
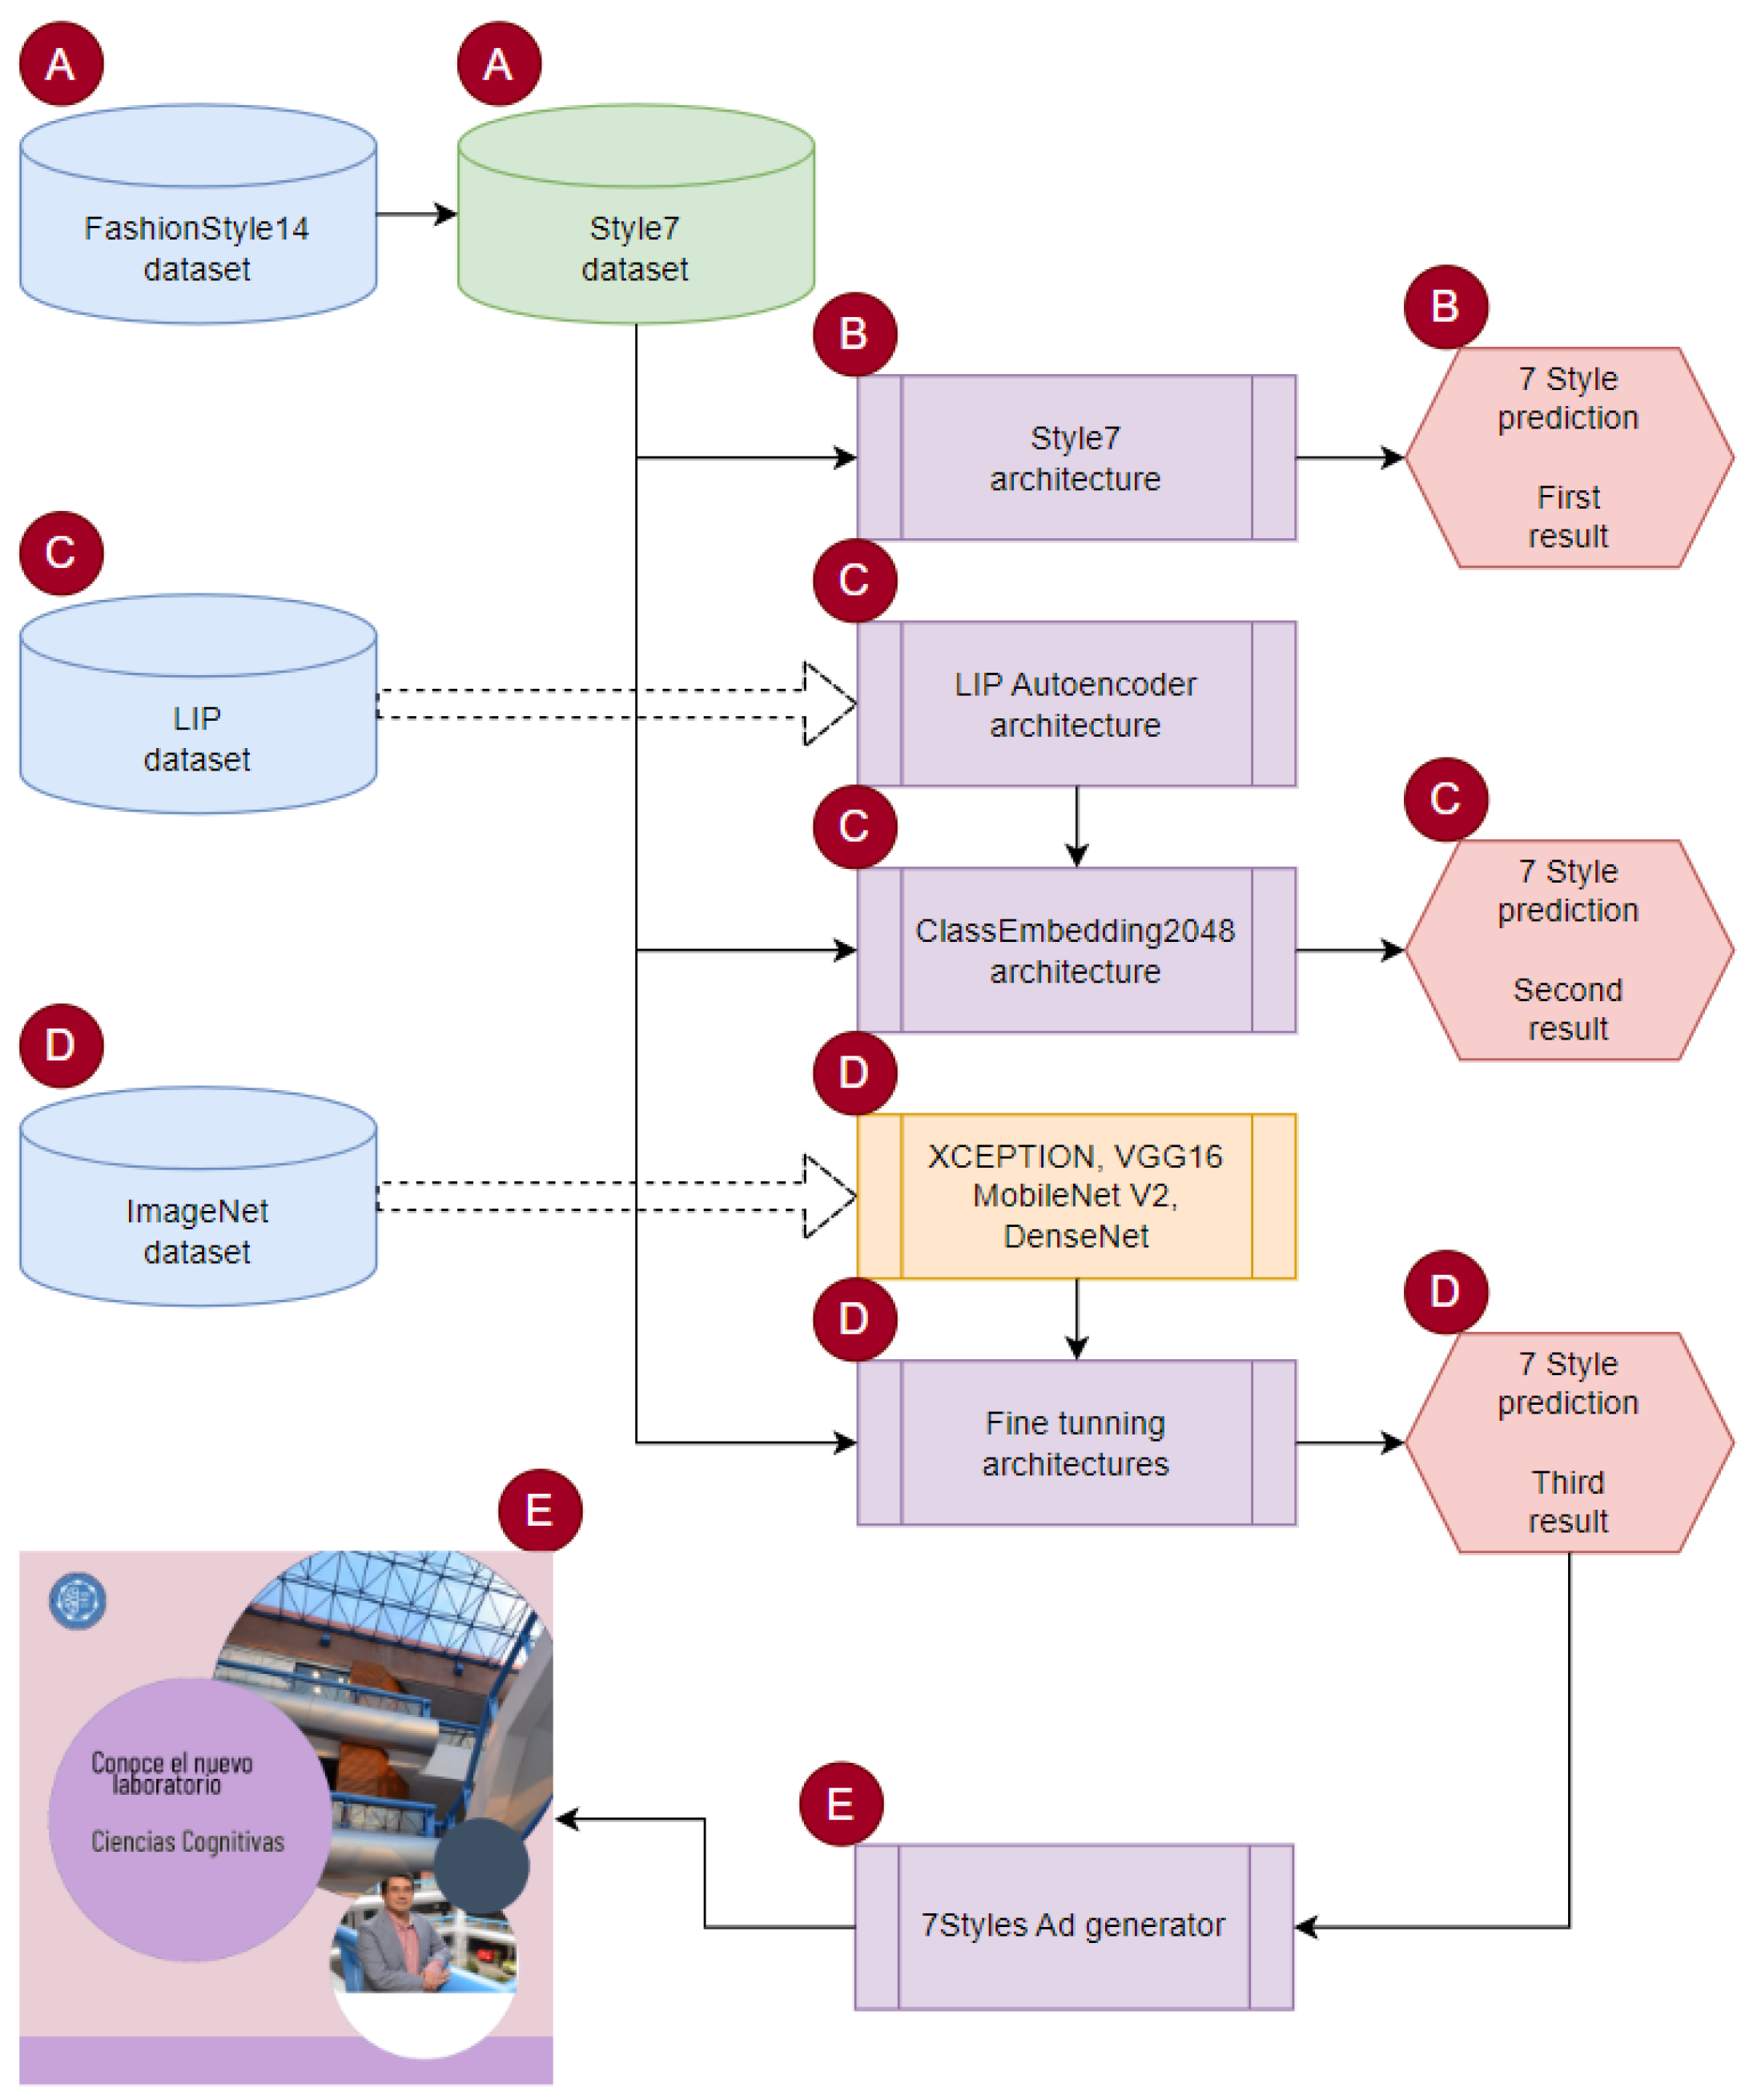
  • Dataset creation: We began by creating a dataset for the seven-style model. Rather than focusing on creating the largest possible dataset, we explored various deep learning approaches, as illustrated in Figure 1;
  • Deep learning approaches: We examined different deep learning approaches to predict the style of clothing. These approaches involved training supervised, semi-supervised, and transfer learning models using the created dataset. These models aim to accurately classify clothing into the seven universal styles;
  • Expert system design: Once the style was predicted, we designed an expert system that generates personalized ads based on the predicted style. The expert system takes into account the guidelines and characteristics associated with each style to create an ad that resonates with the individual’s preferences and interests.
Please note that, in Figure 1, red circles with letters indicate separate processes that we developed and divided into five parts, as outlined below:
A.
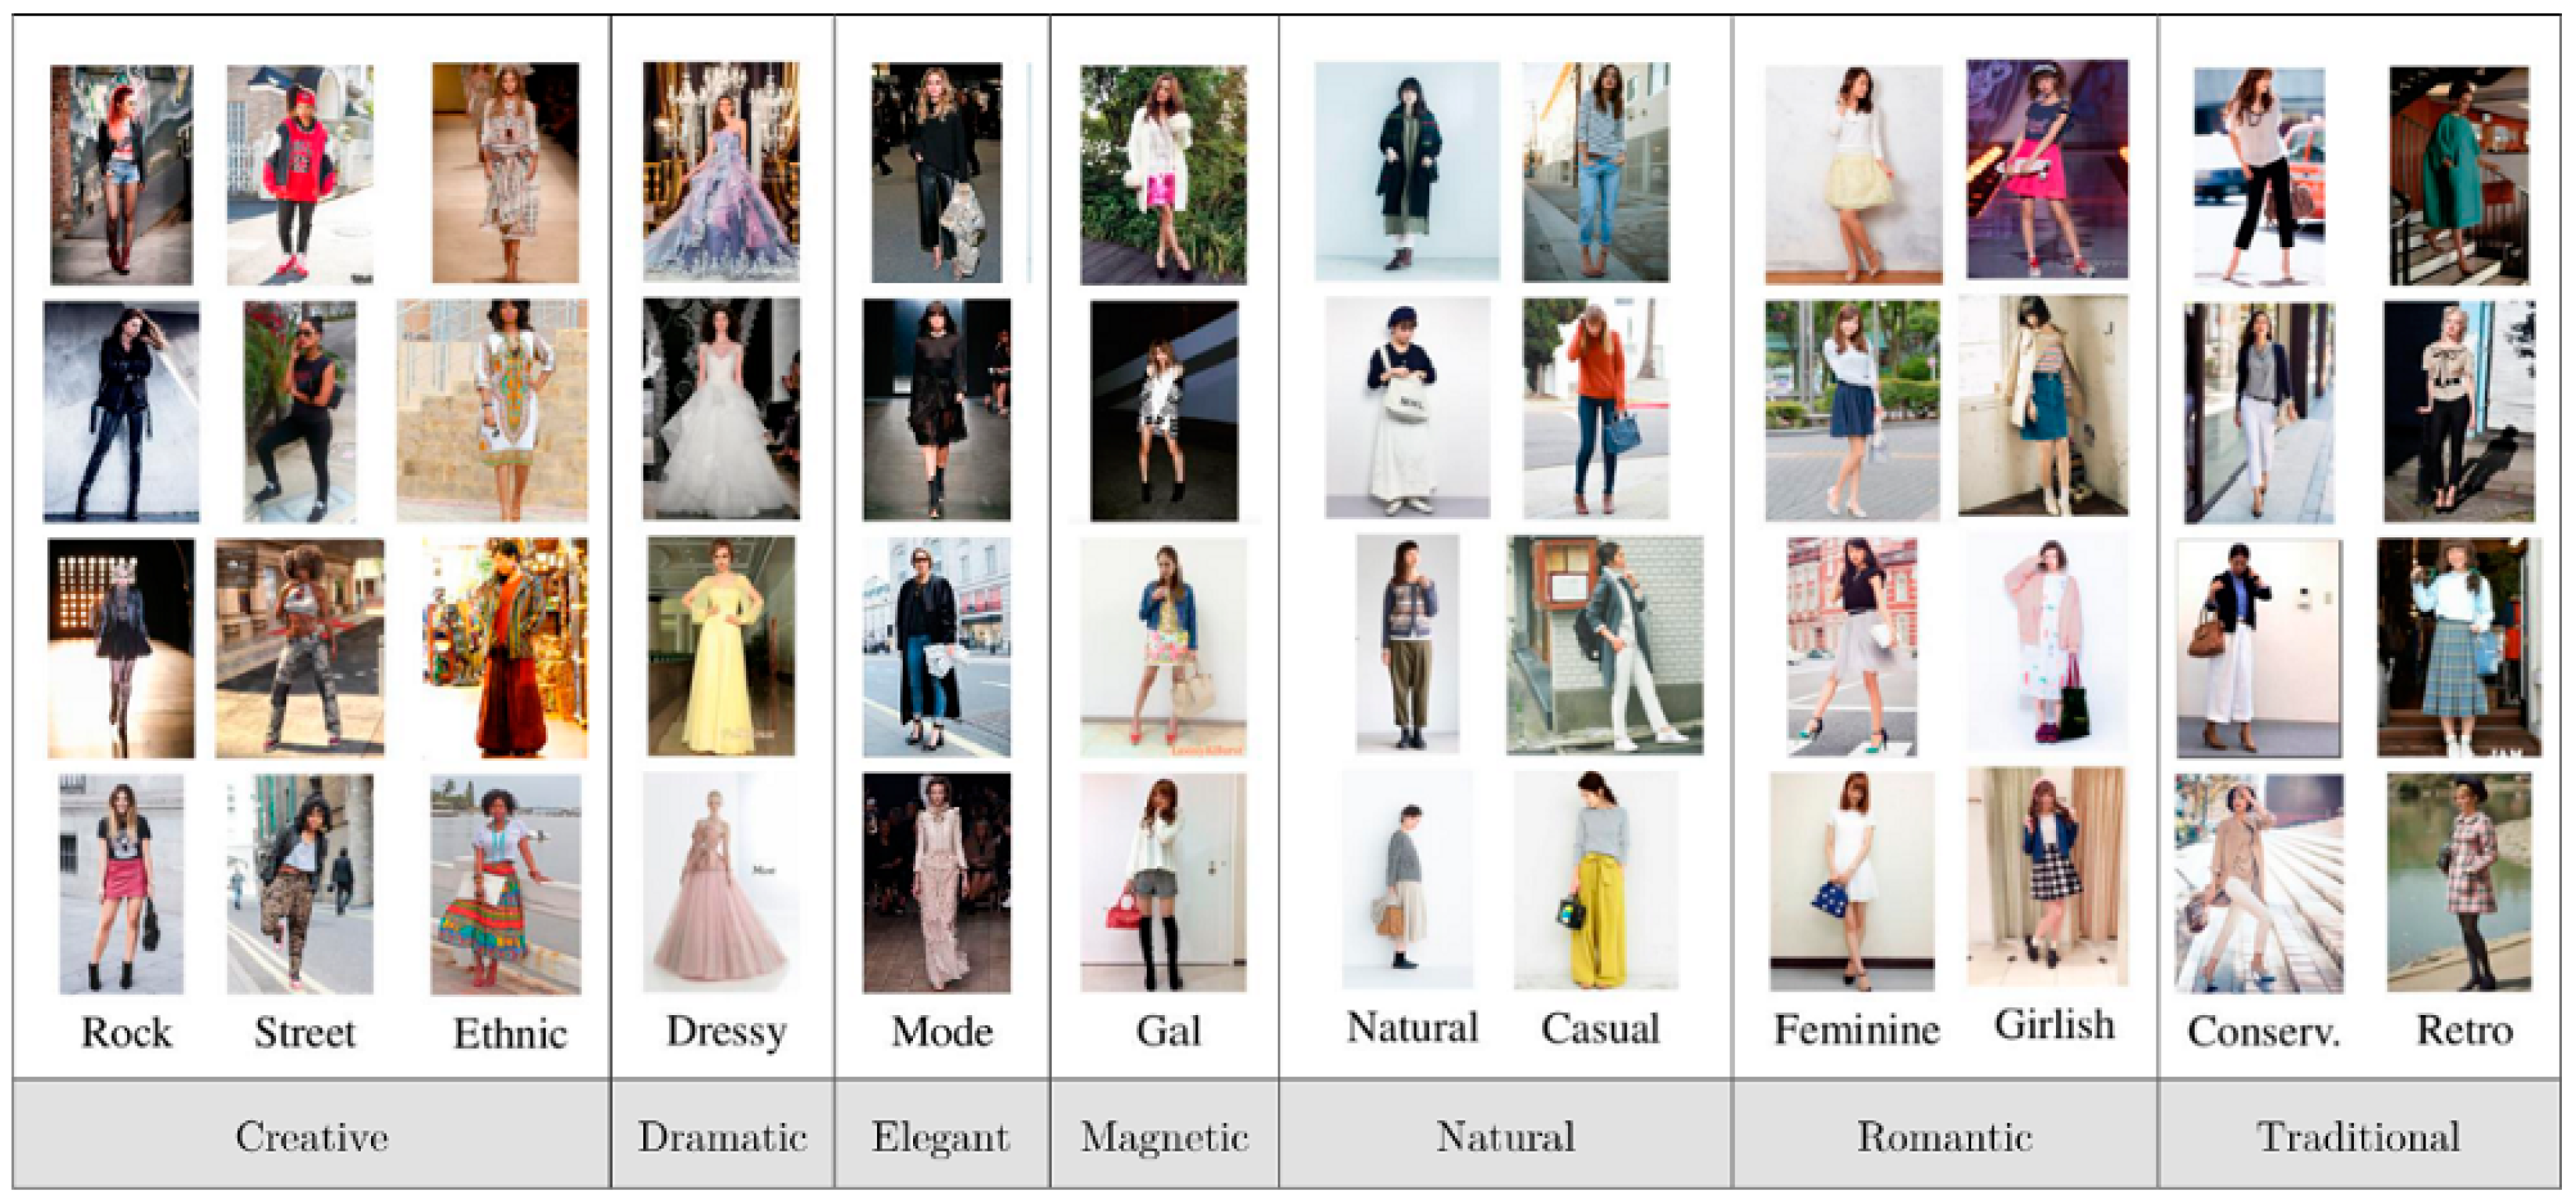
Creating the Style7 dataset: Using the FashionStyle14 dataset [50] as a basis, we generated a new set of images called the Style7 dataset;
B.
Supervised training: We trained the Style7 architecture using supervised learning techniques, obtaining the first prediction result;
C.
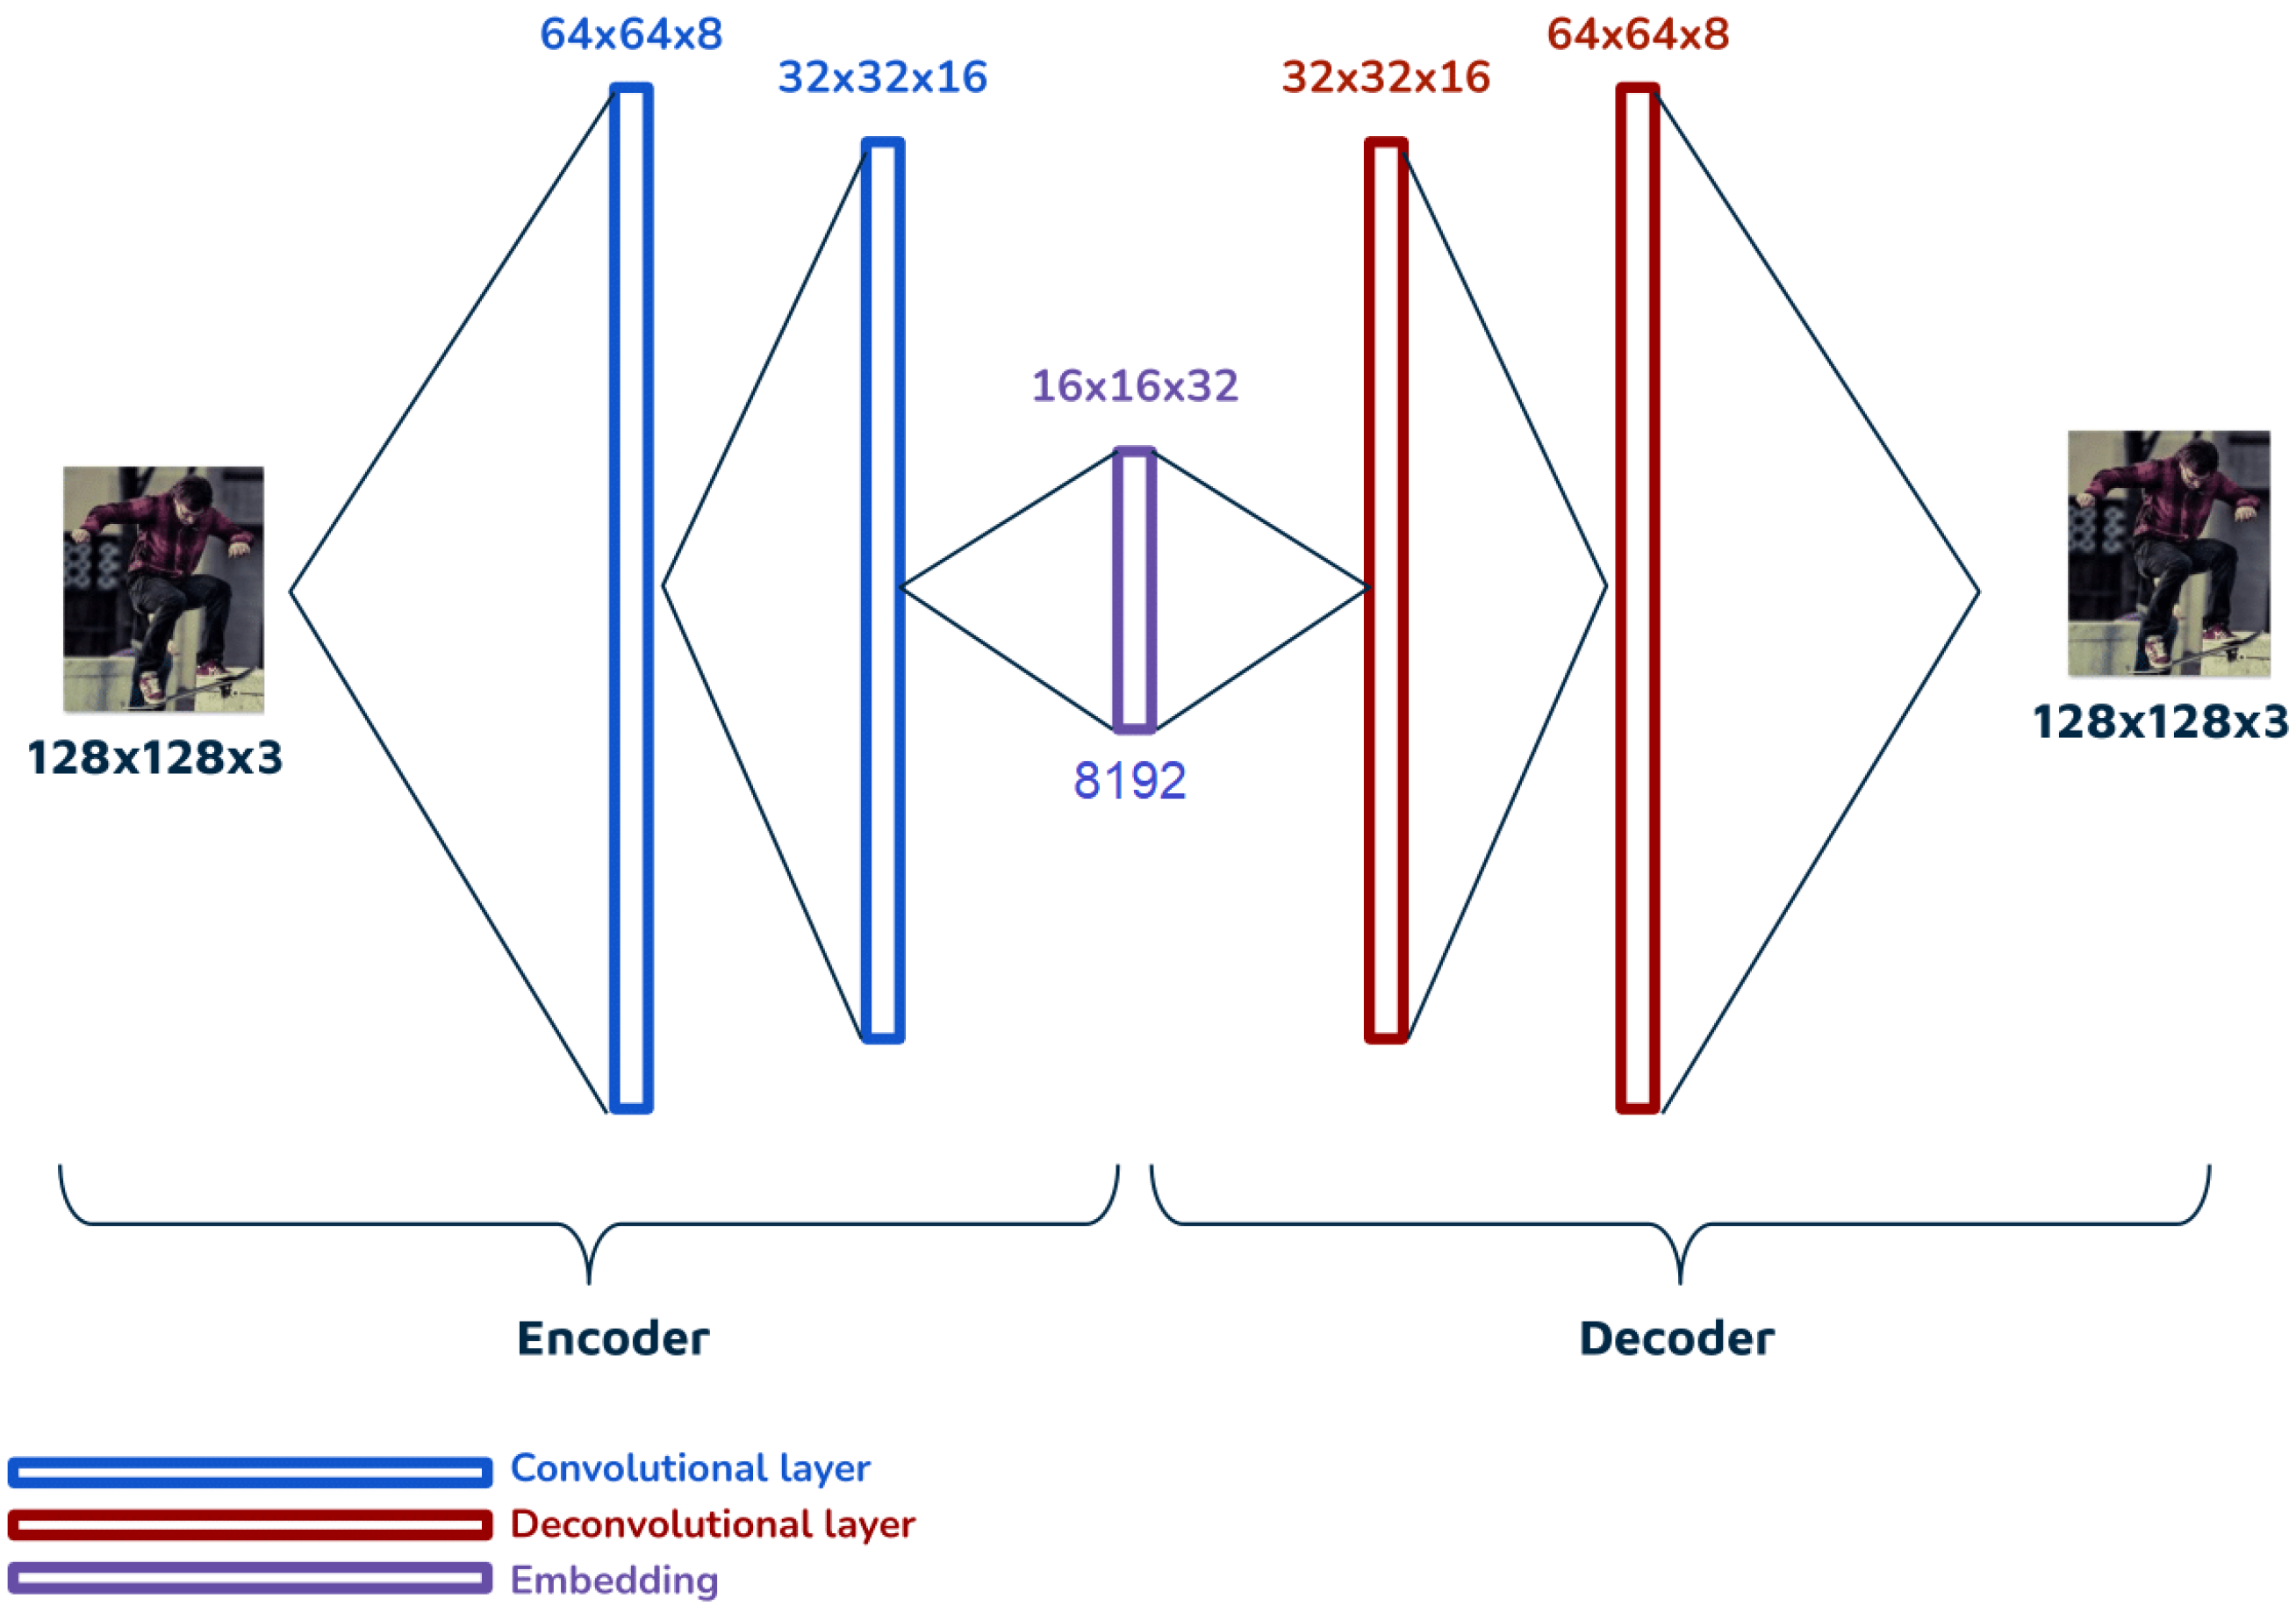
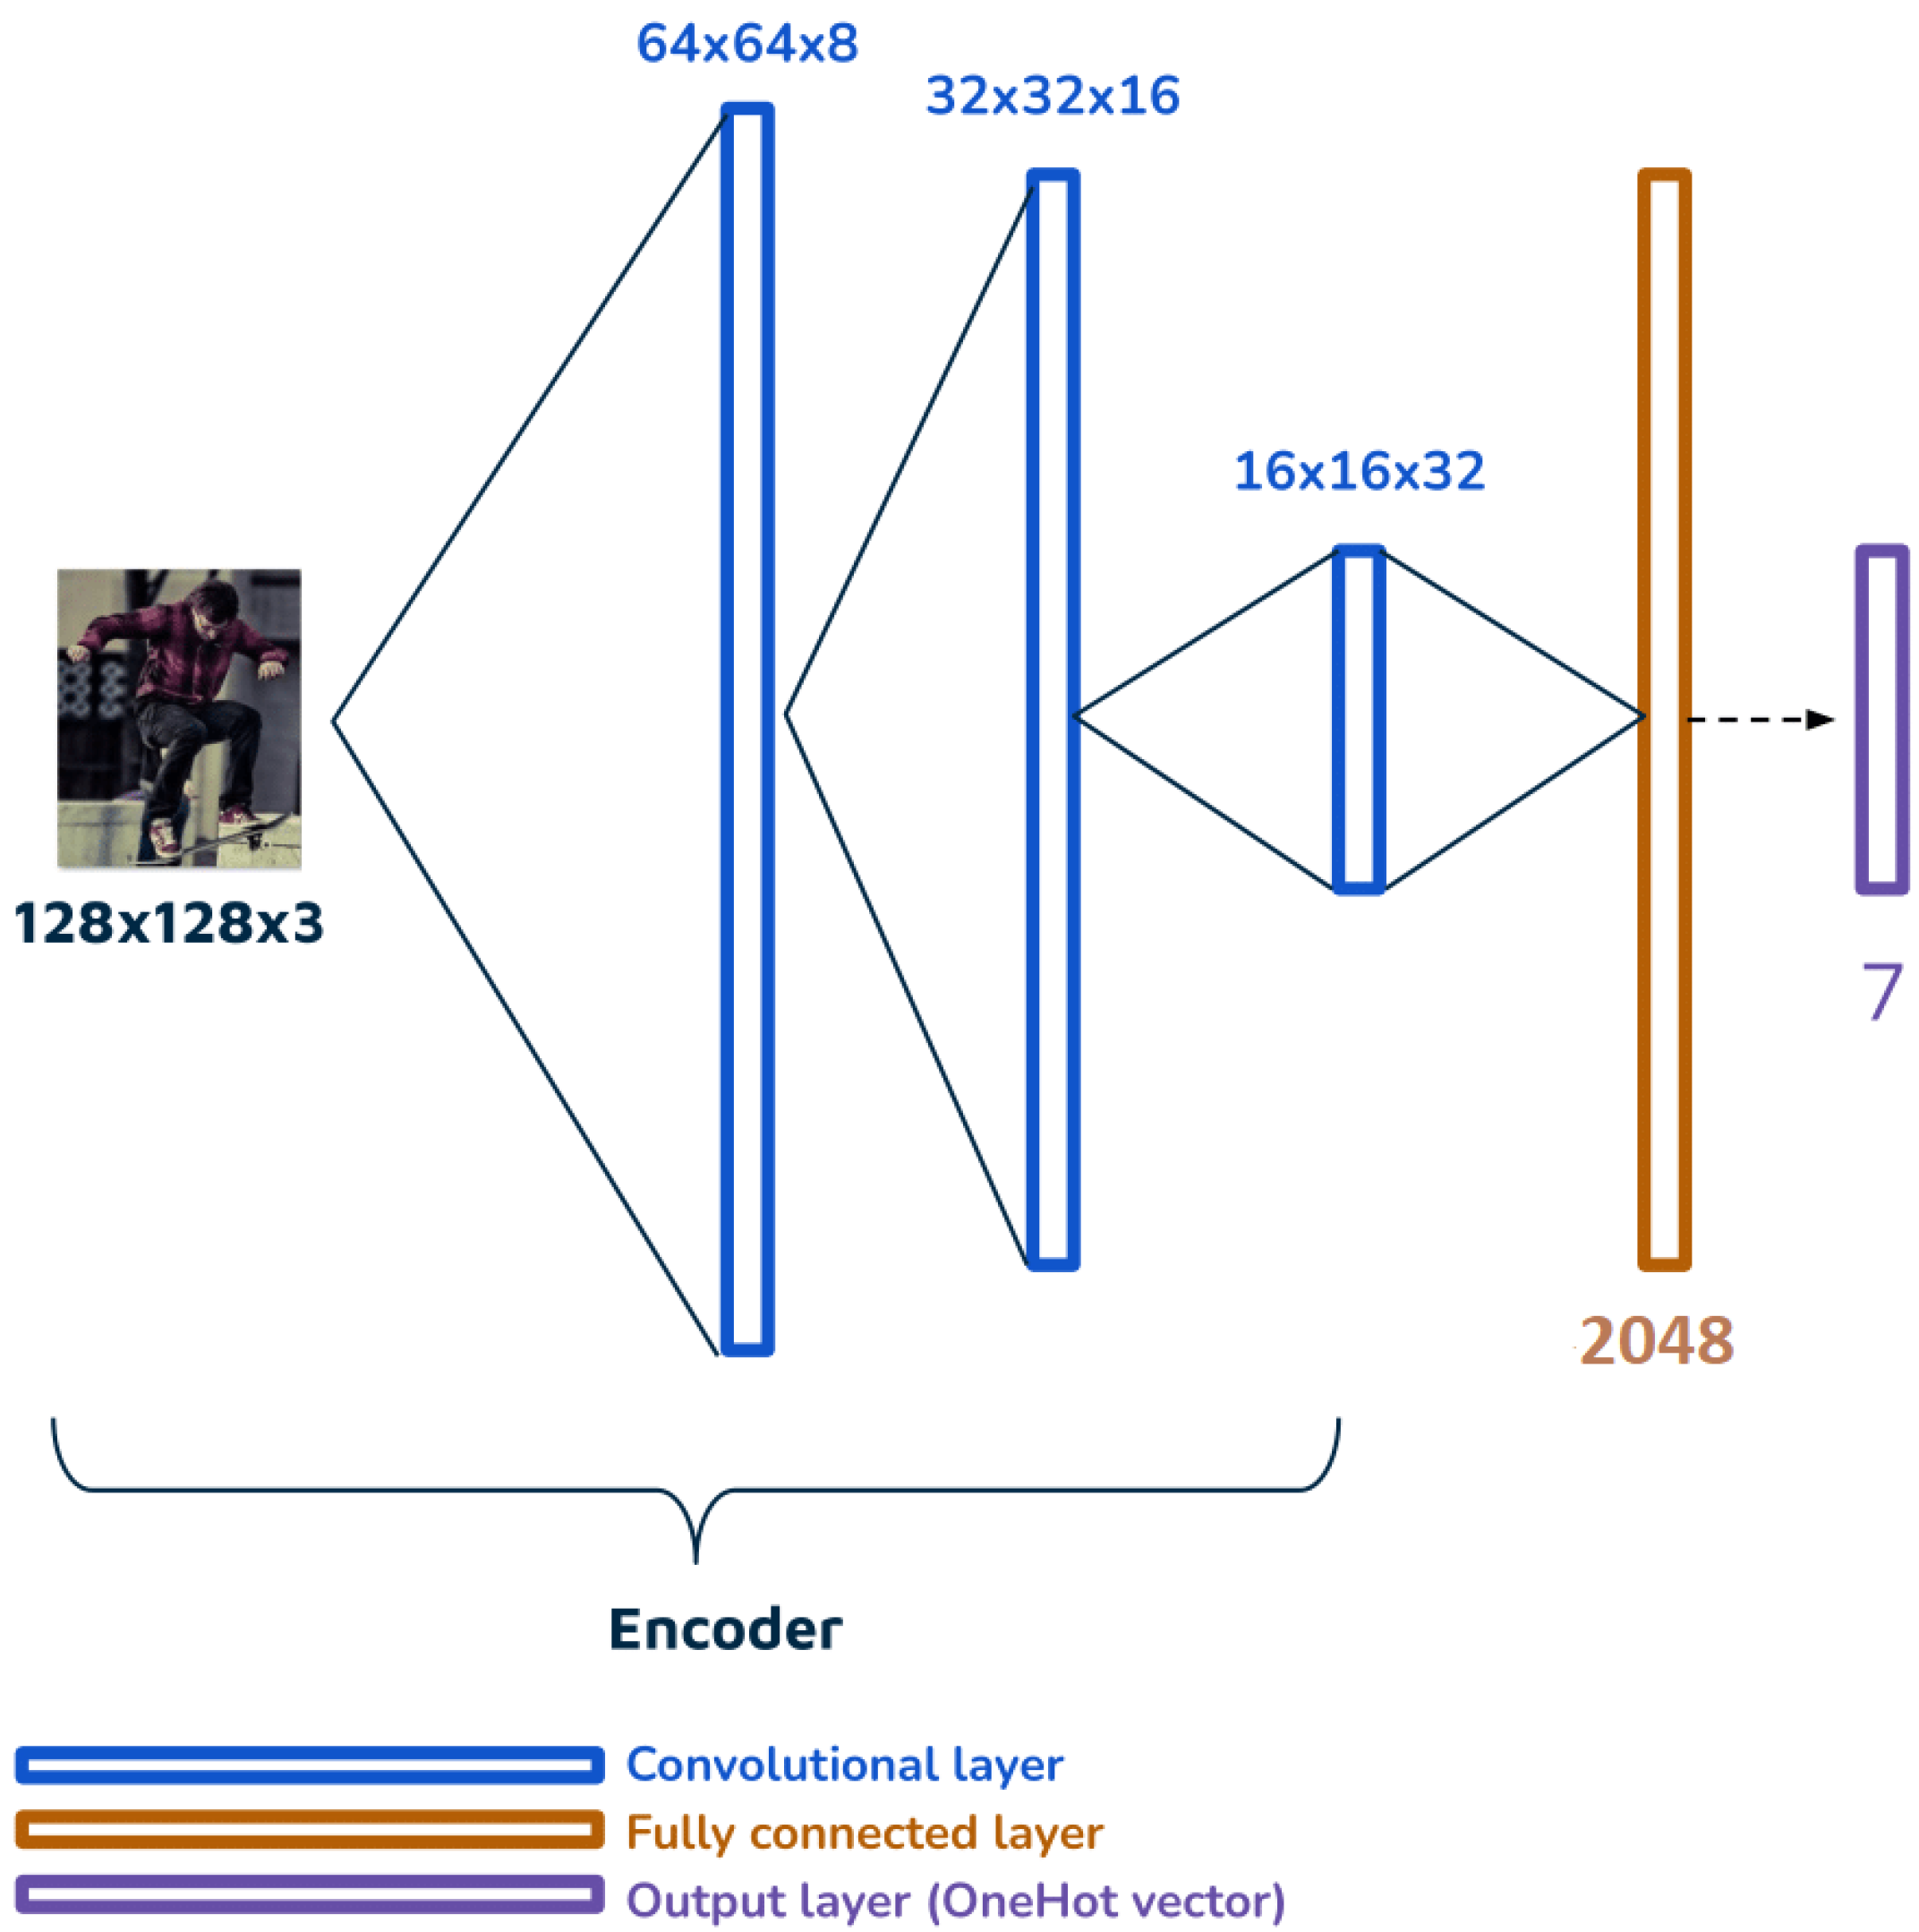
Semi-supervised approach: We employed a semi-supervised approach where we first trained the LIP autoencoder architecture using the LIP dataset [51]. Subsequently, we utilized the decoder component of this architecture, referred to as the ClassEmbedding2048 architecture. We fed the Style7 dataset into this model and obtained the second prediction result;
D.
Transfer learning: We adopted a transfer learning approach by selecting four pre-trained architectures, which were initially trained by their respective authors using the ImageNet dataset [52]. We fine-tuned these architectures using the Style7 dataset, resulting in the third prediction result;
E.
7Styles ad generator: A person’s style prediction and consumer photo could then be provided as input to the 7Styles ad generator, which generates a personalized ad tailored to the individual’s style.
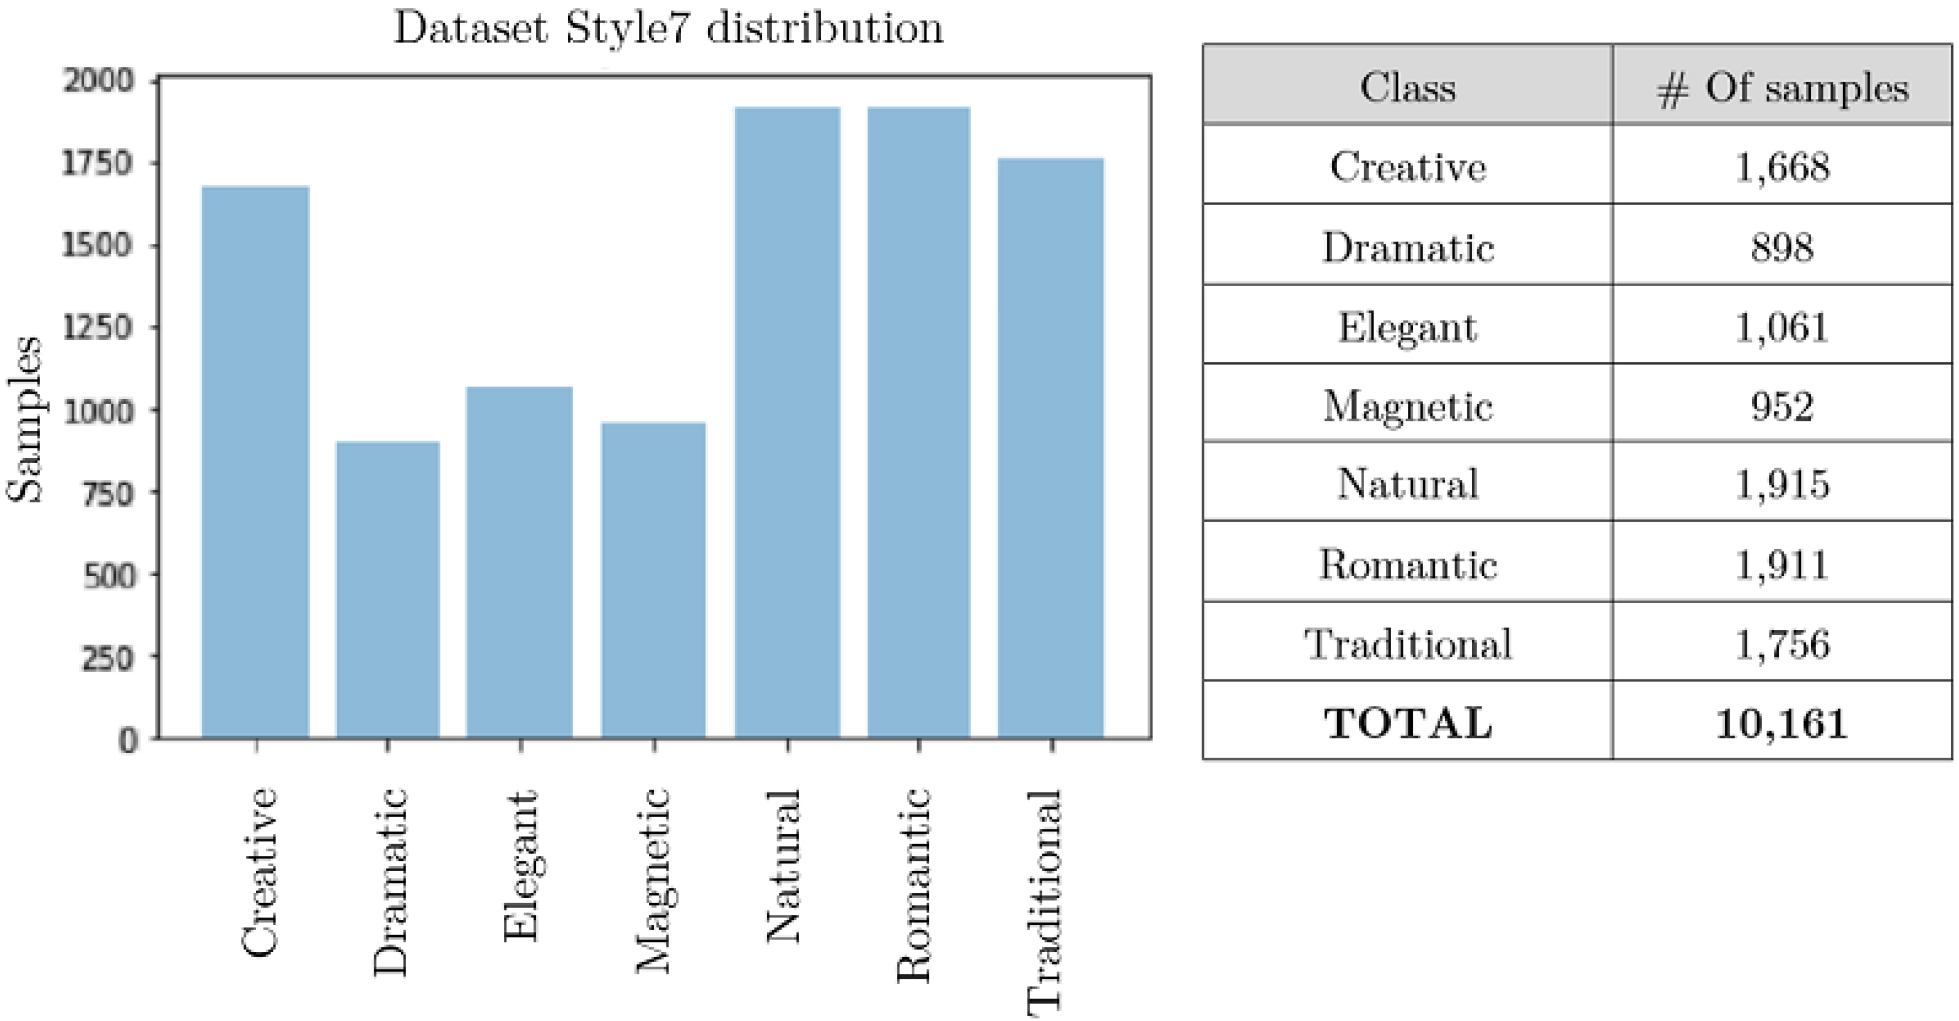
4.1. Style7 Dataset

Let us delve into the path marked by the red circle labeled A, as there is no existing dataset of images labeled according to the seven universal styles. In this section, we explain the process of constructing the Style7 dataset. Starting with the FashionStyle14 dataset [50], we worked on creating a new dataset that aligns with the seven universal styles.
As the original categories in FashionStyle14 are heavily influenced by Asian culture and do not fully correspond to the seven universal styles, we had to map each of the 14 classes in the original dataset to one of the seven universal styles.
Mapping certain specific classes to their corresponding universal styles was relatively straightforward, as their initial descriptions aligned directly with one of the seven styles. For example, classes like Natural, Casual, and Conservative fit neatly into their respective universal style categories.
However, for the remaining classes, a more nuanced approach was required. We matched these classes to the universal style with which they shared the most visual descriptors. This mapping process was validated through expert judgment and relied on traditional style assessment theory, making it applicable for the purposes of our work.
It is worth mentioning that the Fairy and Lolita classes presented a unique challenge, as they do not have direct aesthetic or visual equivalents in Western dressing styles. As a result, we made the decision to exclude these classes from the dataset, as it was not feasible to integrate them uniformly into any of the seven styles. Once this mapping assignment was complete, the previous classes became part of the new ones, as illustrated in Figure 3.
The resulting dataset comprised seven labeled classes, each representing one of the seven universal styles. The distribution of images within each class is depicted in Figure 4, and a minimum of 890 images was available for each class.

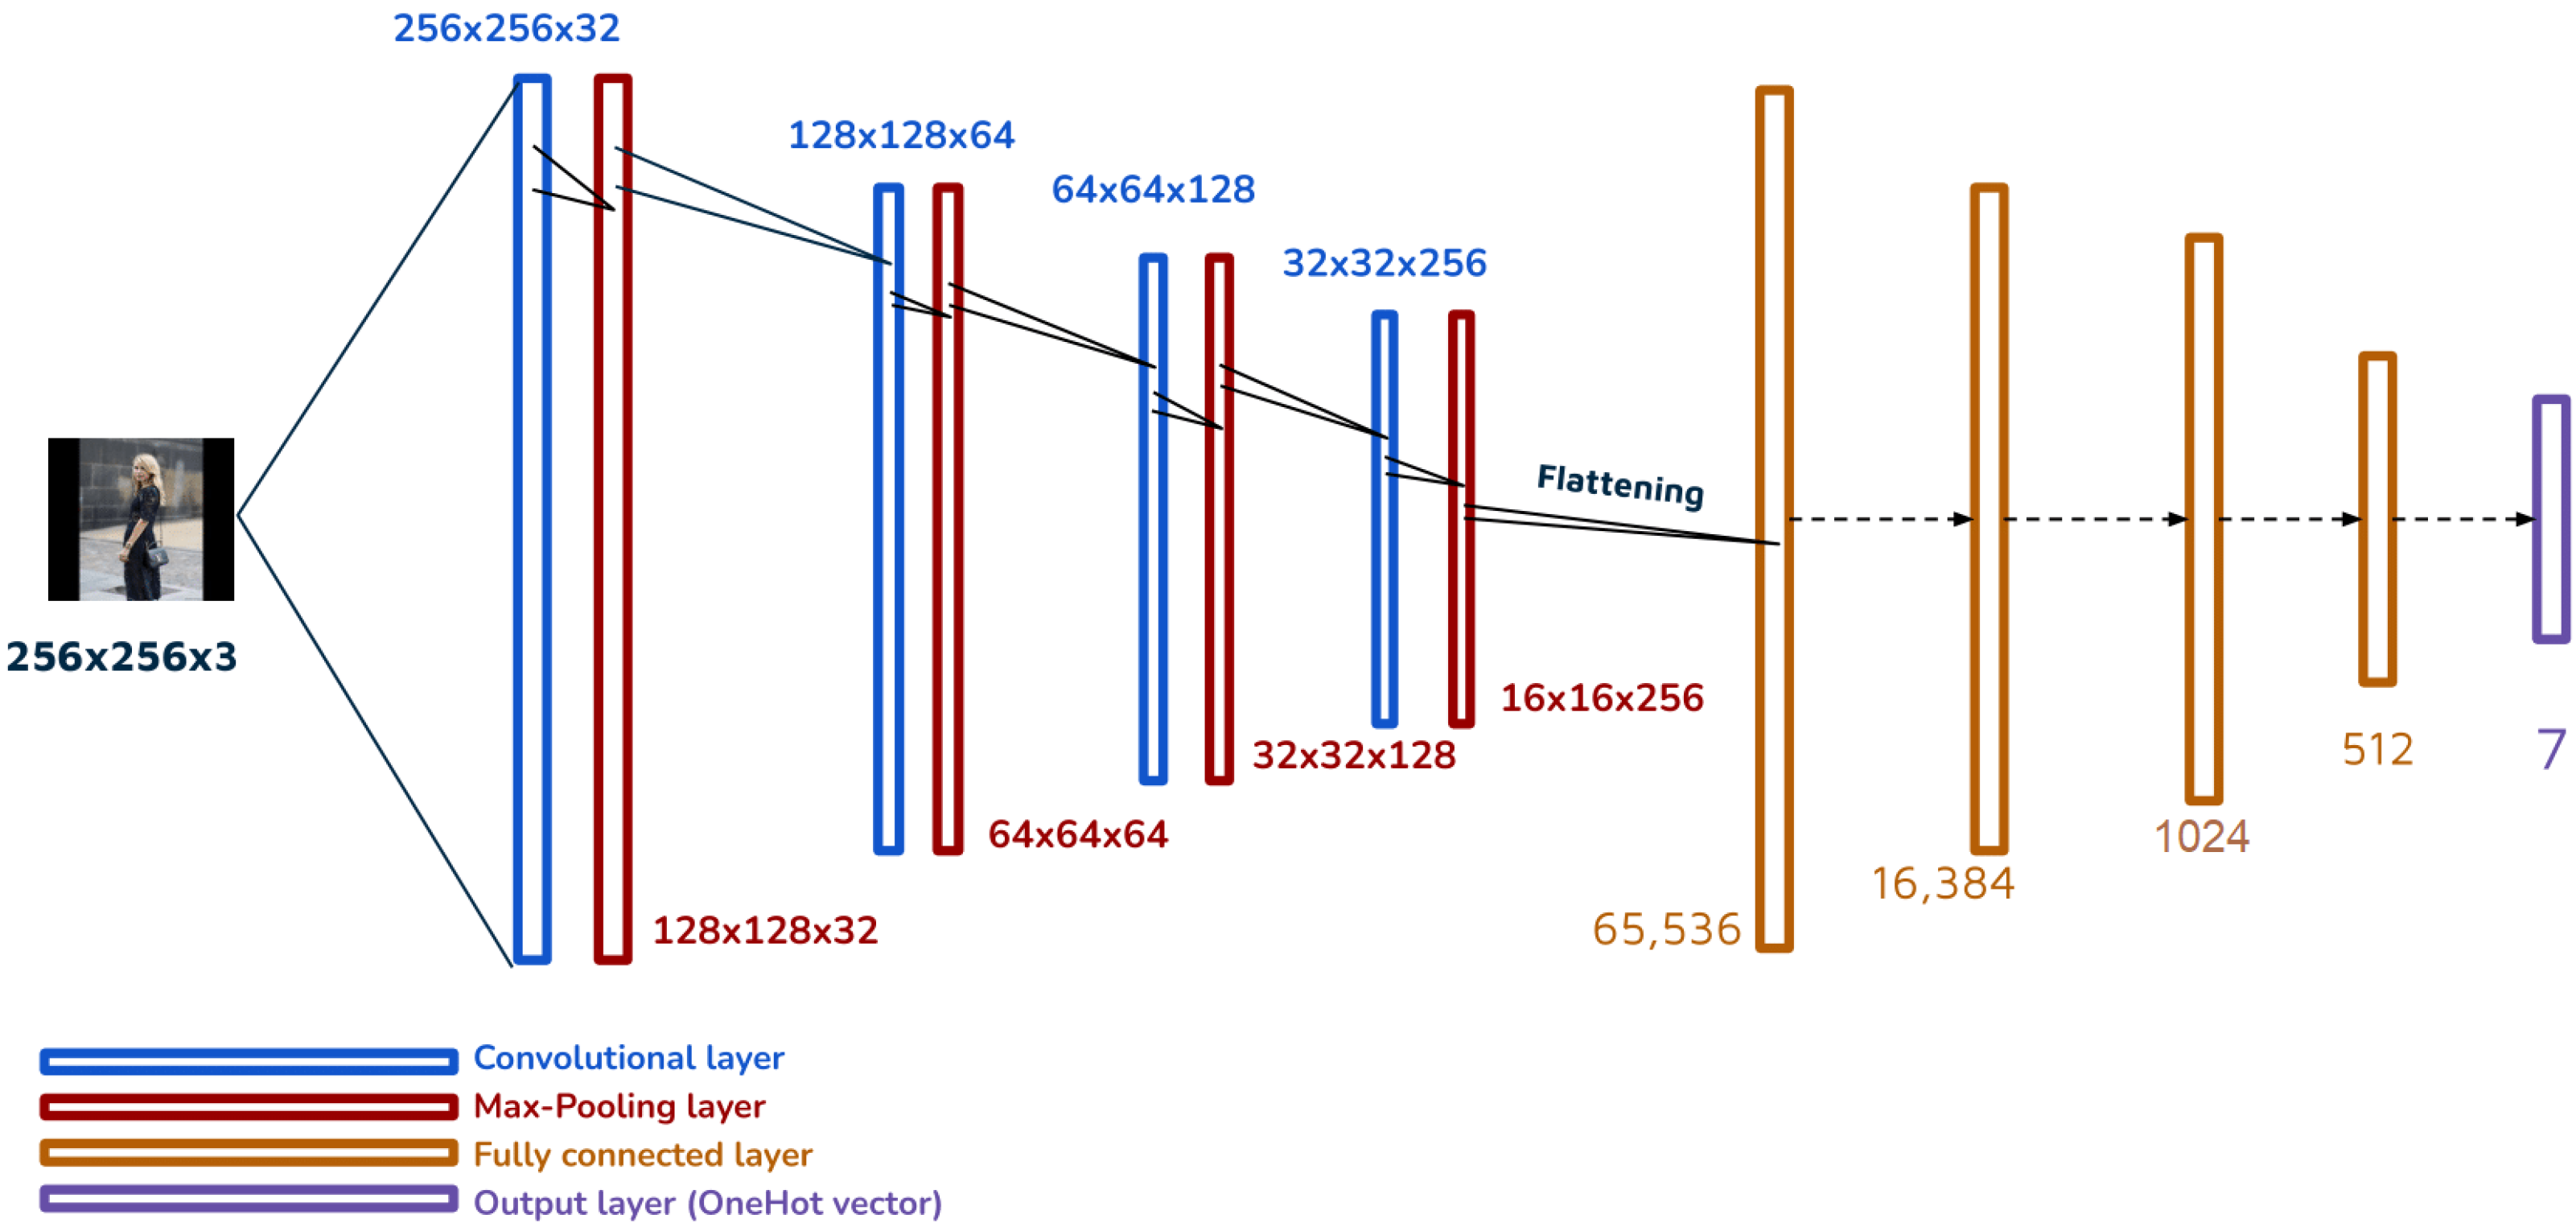
4.2. Supervised Model

The path marked by the red circle with the letter B represents the first model, which was designed as a convolutional neural network architecture with classifier layers. This model served as the foundation for subsequent models and was trained using supervised learning, evaluated as a multiclass classification problem. For each style, there are two possible results: 0 indicates the absence of the assessed style, while 1 indicates its presence. The goal is to determine if the images in the Style7 dataset contain sufficient information to identify the apparent style.
It is important to note that experimentation with this model involves ongoing optimization of several factors:
  • Hyperparameters: This includes fine-tuning parameters such as the activation function, optimizer settings, learning rate, batch size, and kernel size.
  • Architecture: The overall structure and design of the model must be carefully considered and refined.
  • Regularization techniques: Various techniques, such as normalization or dropout, may be applied to enhance the model’s generalization and prevent overfitting.

Style7 Architecture

The Style7 architecture, as illustrated in Figure 5, serves as the initial approach for the model. It is based on a four-pair convolution and max-pooling layer architecture, which extracts features and reduces the volume’s dimensions to 16 × 16 × 256 . This embedding is then flattened and propagated through a multilayer perceptron (MLP) classifier network with three fully connected layers. The output layer of this network consists of a seven-position one-hot encoded vector representing the seven universal styles.

4.3. Semi-Supervised Model

The path marked by the red circle with the letter C begins with the Look into Person (LIP) dataset [51]. This dataset aims to enhance the understanding of human bodies, encompassing images of people in challenging poses and with significant occlusions.
The architecture employed in this approach consists of two main components: an unsupervised trained architecture for feature extraction and a supervised trained classifier.

4.3.1. LIP Autoencoder Architecture

The LIP autoencoder was trained using the LIP dataset, as depicted in Figure 6. The objective of this training was to familiarize the network with images of people that may resemble those found in the labeled dataset used for classification. By employing this technique, the model learns to recognize patterns present in such photographs and represents these patterns in a lower-dimensional volume compared to the input image.

4.3.2. ClassEmbedding2048 Architecture

After successfully training the autoencoder, we added a fully connected layer to perform the classification task, utilizing the trained encoder as a feature extractor. The encoder layers remain fixed and unchanged, while only the fully connected layers are fine-tuned and trained in supervised mode using the Style7 dataset for apparent style classification. This modified architecture is referred to as ClassEmbedding2048. The specifications of the ClassEmbedding2048 model are illustrated in Figure 7.

4.4. Transfer Learning Model

The path marked by the red circle with the letter D begins with the ImageNet dataset. ImageNet is a large-scale image dataset organized according to the WordNet hierarchy. It provides high-quality and human-annotated images, offering tens of millions of cleanly labeled and sorted photos for multiclass classification tasks. Detailed documentation for ImageNet can be found in [52].
Given that ImageNet is specifically designed for multiclass classification, it has been widely used to train various architectures. For our proposed model, we considered the architectures listed in the TFkeras documentation [53], which was the chosen implementation tool for this task. It is important to note that not all architectures were fully trained. Instead, we planned to establish an initial evaluation methodology to assess partial performance and select the most representative architectures. Some architectures that were initially tested included XCEPTION, VGG16, MobileNetV2, and DenseNet. For a detailed description of these architectures, refer to [54]. These selected architectures used 128 × 128 × 3 images as input and generated a prediction for the seven universal styles.

4.5. 7Styles Ad Generator

Once the seven-style prediction is obtained, the final stage of our solution involves using the predicted style as a criterion for parameterizing the marketing visuals of an advertisement. The system incorporates case-based reasoning (CBR) [55] to generate personalized ads based on the predicted style.
We considered three marketing visuals: chromatic, geometric, and typographic. With seven possible outcomes for the style prediction, we established seven cases, each considering these three visual aspects. By leveraging these cases, we can generate tailored ads that align with the individual’s predicted style.
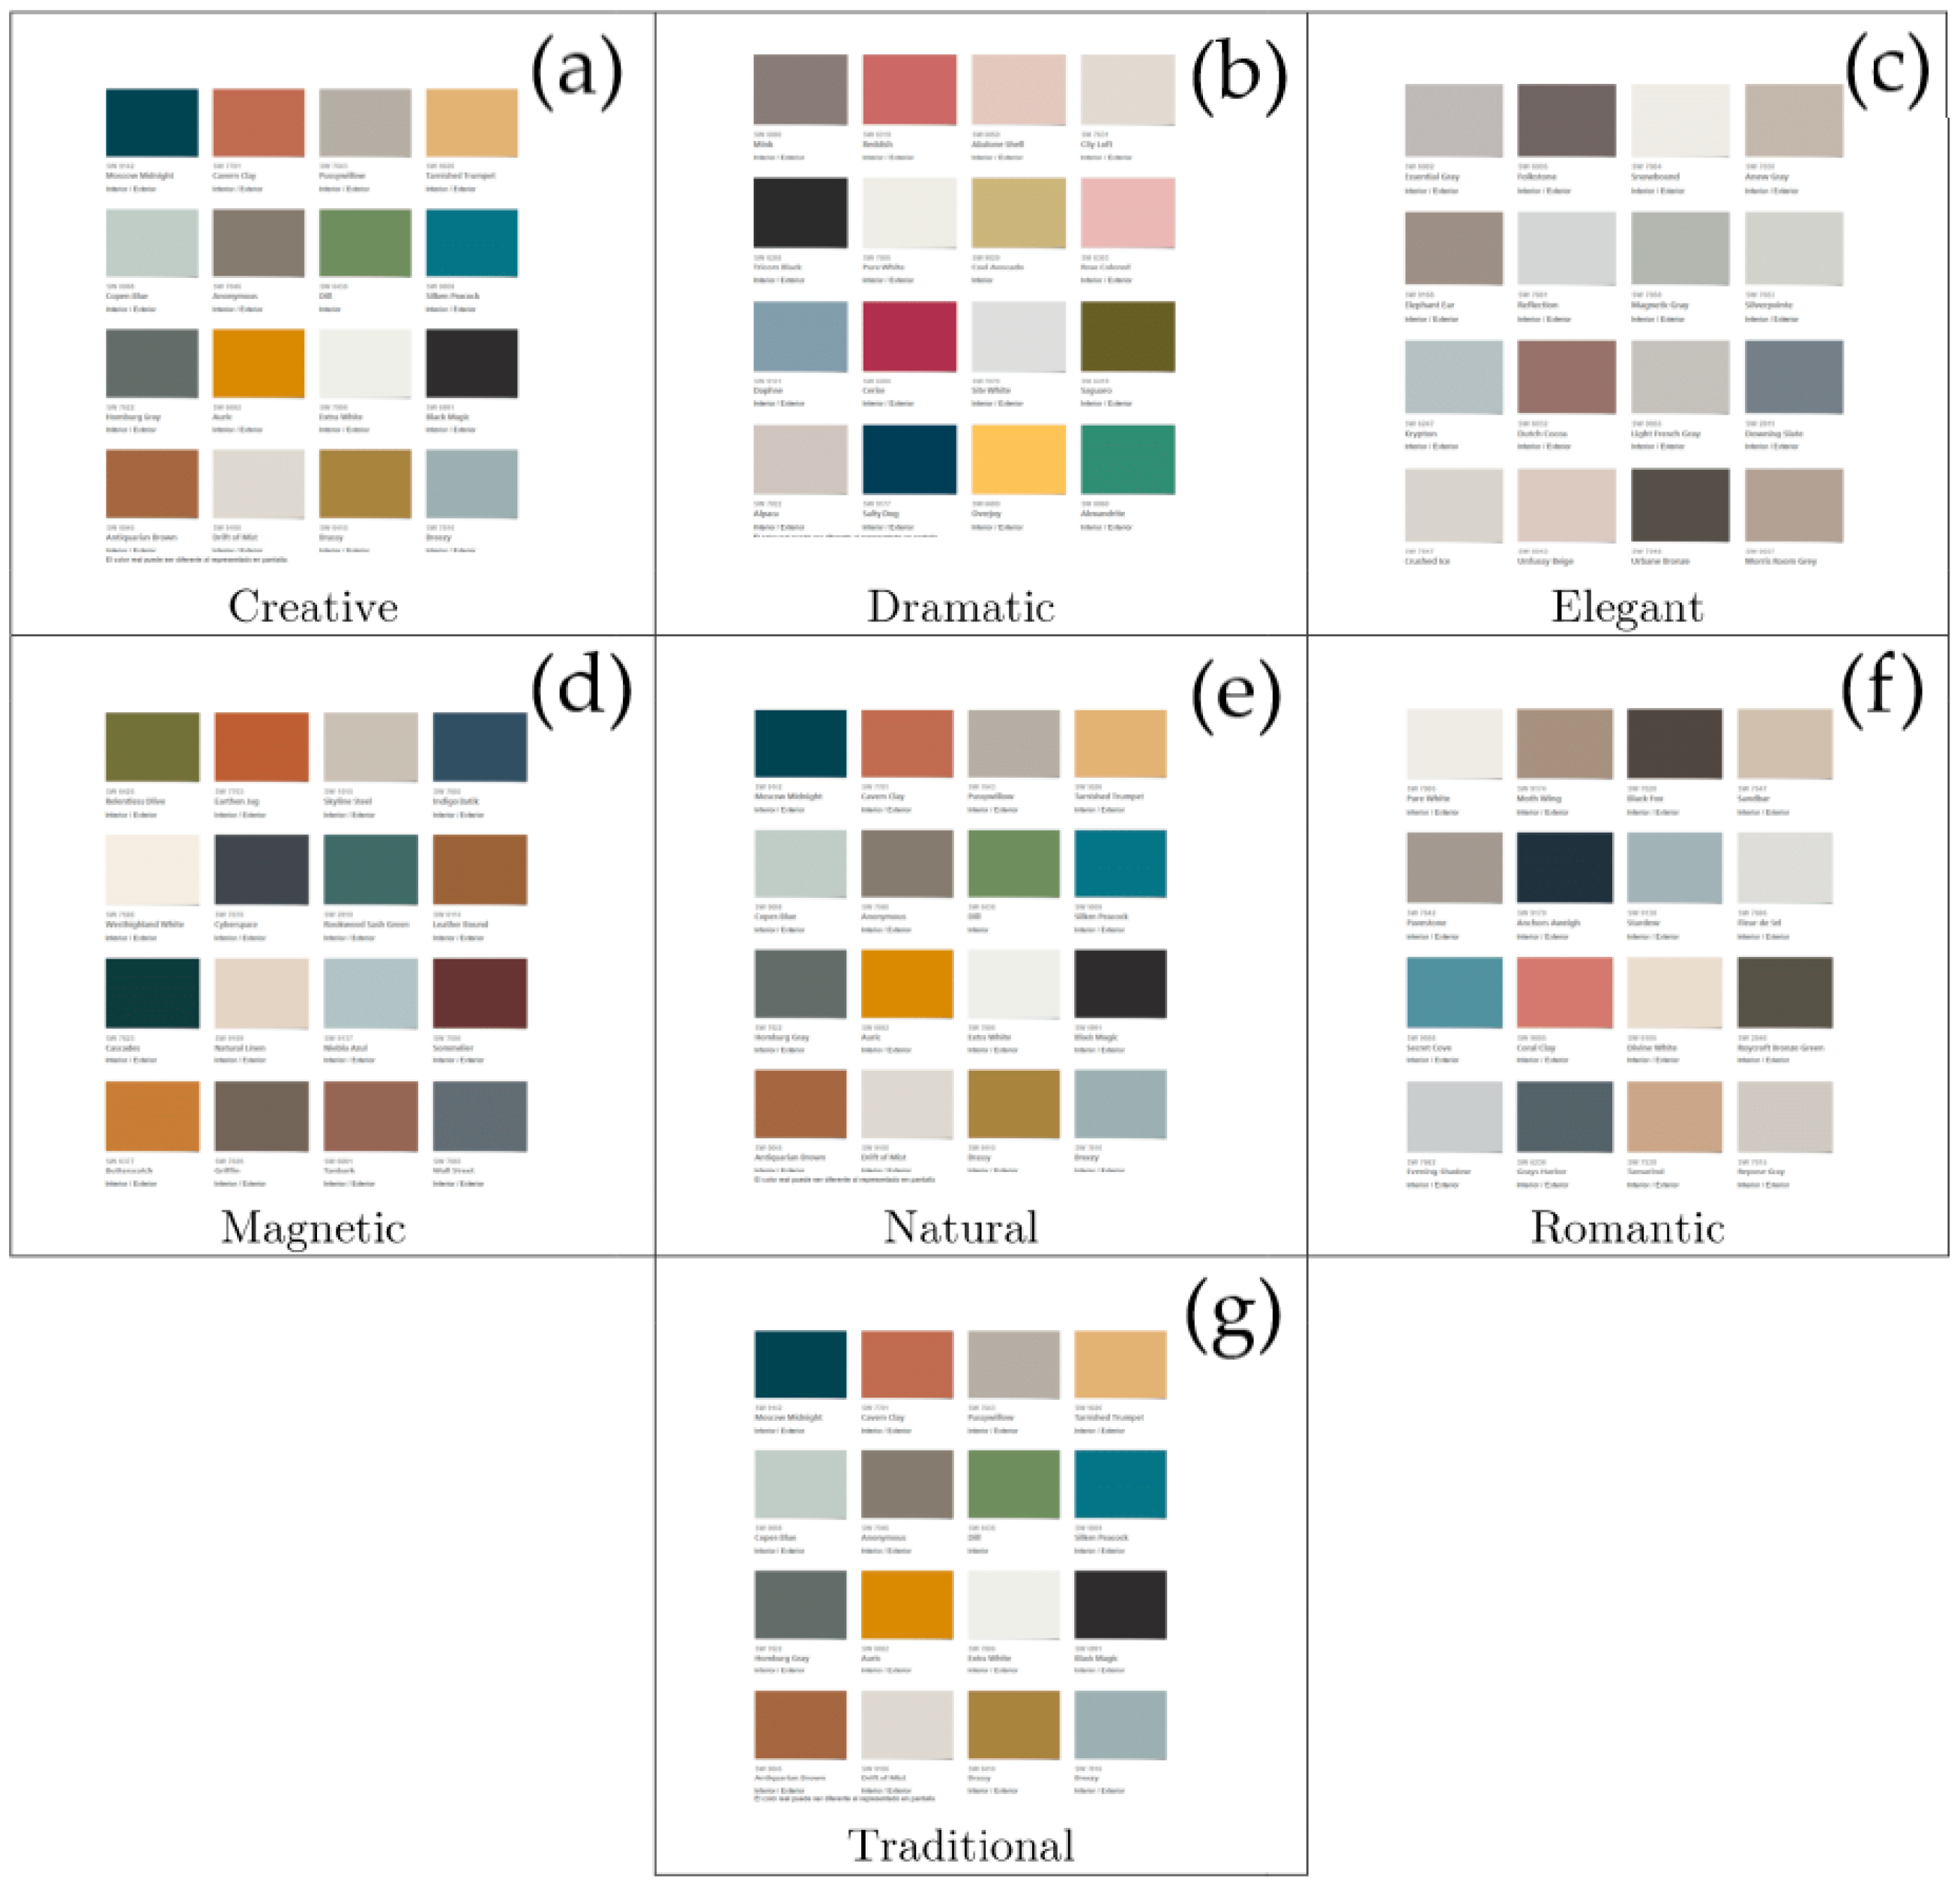
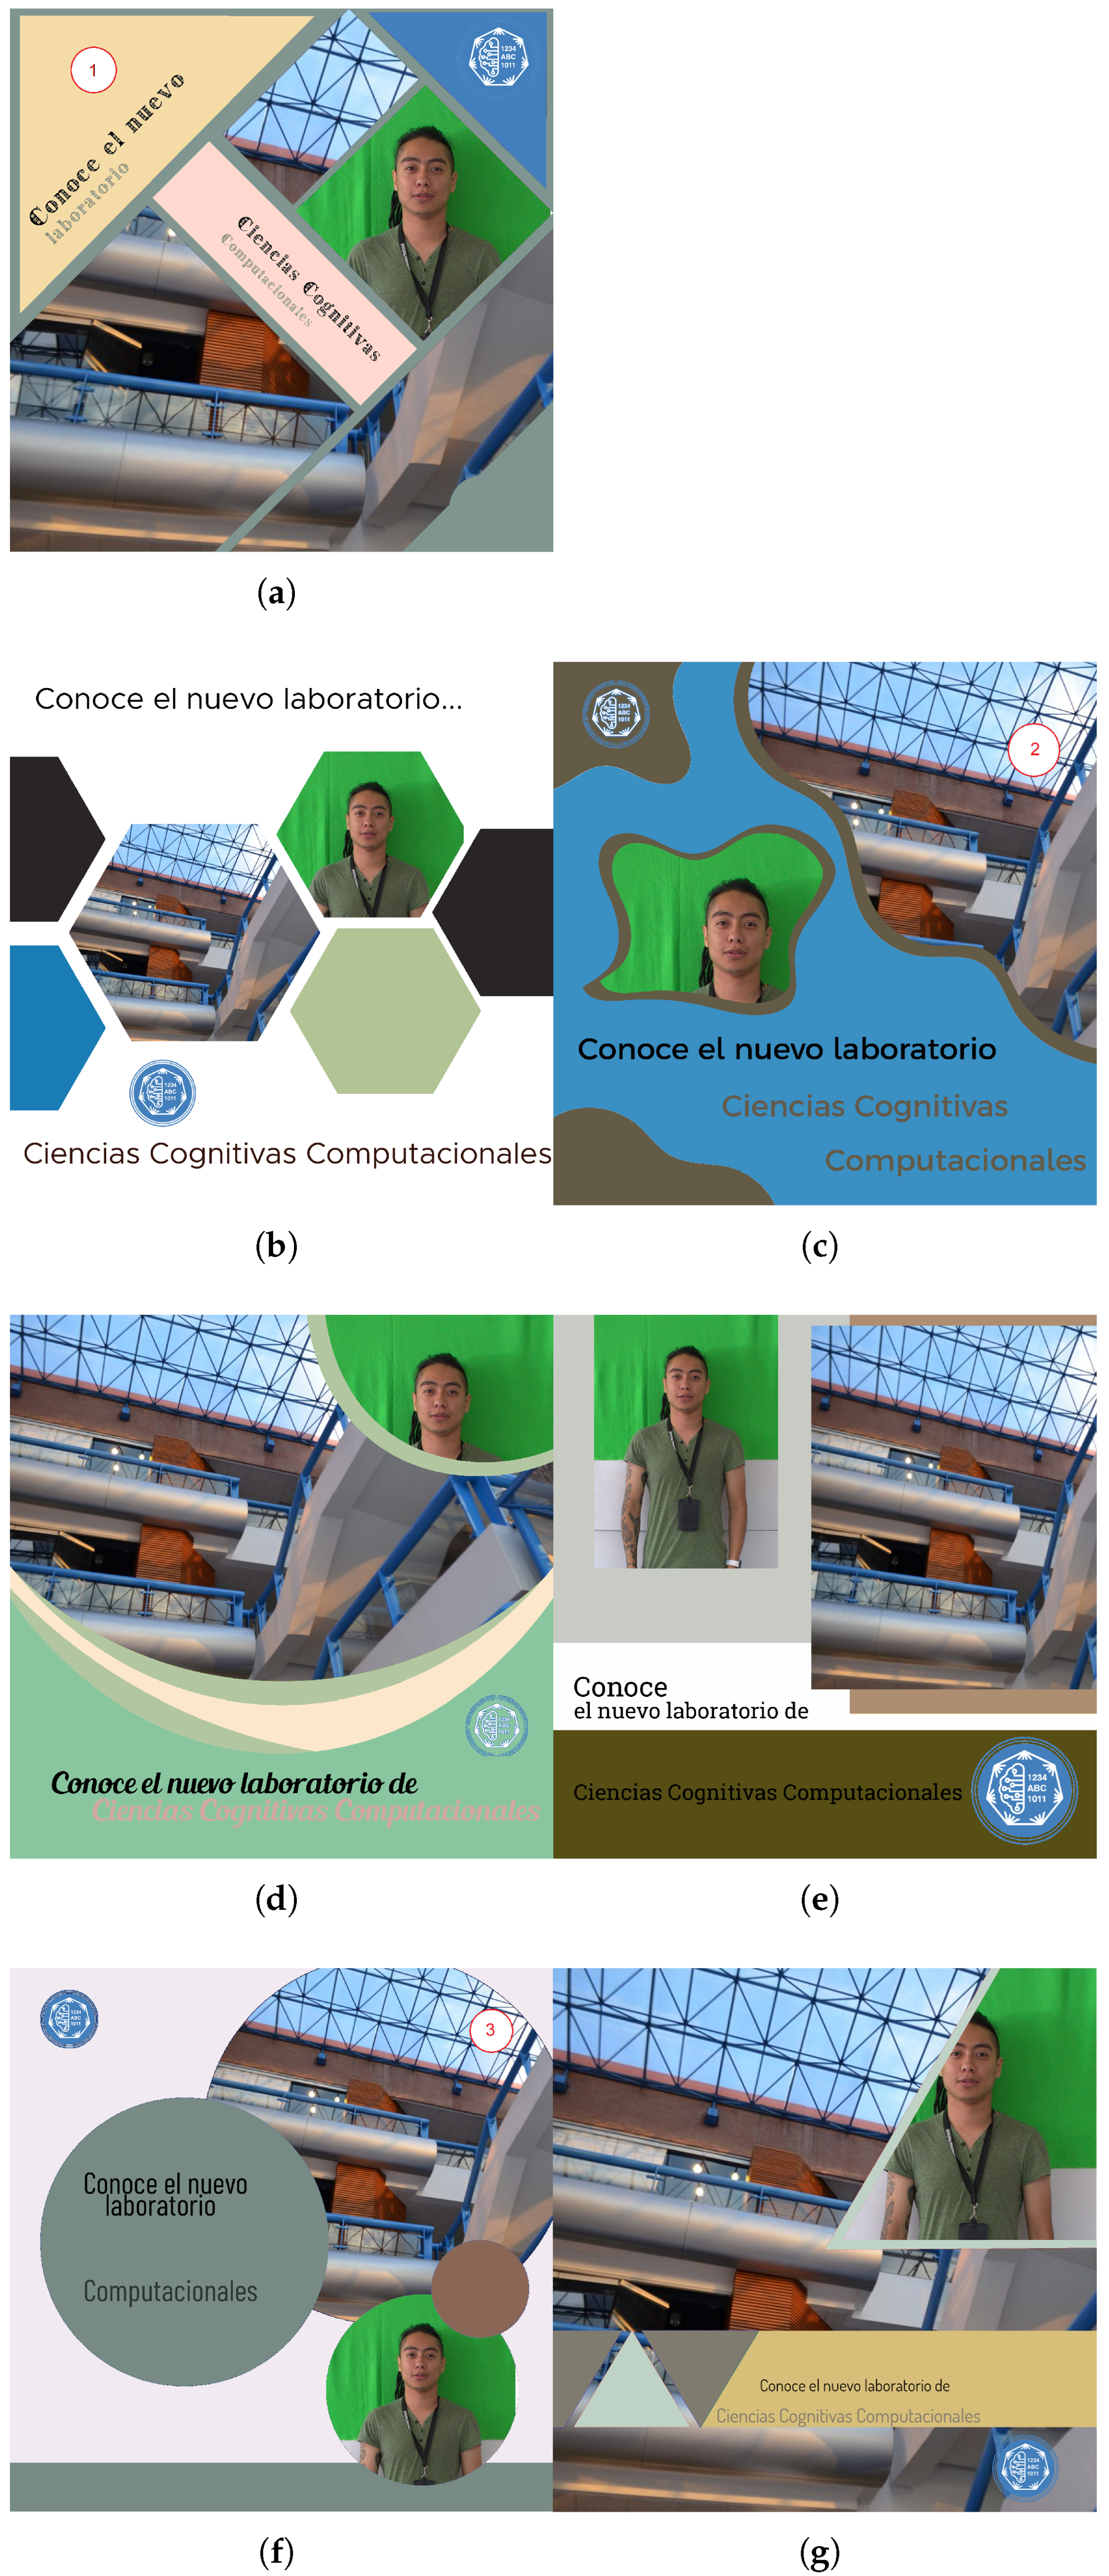
  • Design of chromatic rules: In the design of the chromatic rules, we employed the color theory of Sherwin-Williams (SW) [56,57]. We assigned an SW color palette to each of the seven styles, as depicted in Figure 8. To determine the appropriate color palette for a given style, we measured the distance between the SW palette and the corresponding palette in Figure 1 and selected the closest hues. This process enabled us to establish a chromatic base consisting of seven colors for the personalized ad;
  • Design of geometric rules: The design of the geometric rules involved determining the appropriate shapes and patterns for each style. This was achieved through a combination of visual analysis and expert judgment. By examining the characteristic shapes and patterns associated with each style, as described in Figure 1, we established rules that align with the visual representation of the style. These geometric rules served as guidelines for incorporating appropriate shapes and patterns into the personalized ad;
  • Derivation of typographic rules: The typographic rules were derived based on the theories proposed by Li [58] and Shaikh [59], complemented by the typeface classification presented by Perez in [60]. These authors establish connections between the psychological traits associated with specific font families and typographic styles. The summarized relationships between psychological traits and typographies are outlined in Table 2. By incorporating these typographic rules, we ensured that the typography used in the personalized ad aligned with the psychological traits associated with the predicted style of the individual. The selection of the case was based on the correspondence between the features presented in Figure 2 and those shown in Figure 1. Additionally, instances where the description of the geometric basis in the style corresponds to specific graphic traits of the typeface family were also considered. The relationships between the styles and typographic characteristics are outlined in Table 3. Using this information, we constructed a decision tree for each style, as illustrated in Figure 9. These decision trees serve as a guide for selecting the appropriate typographic style for each predicted style in the generation of personalized ads;
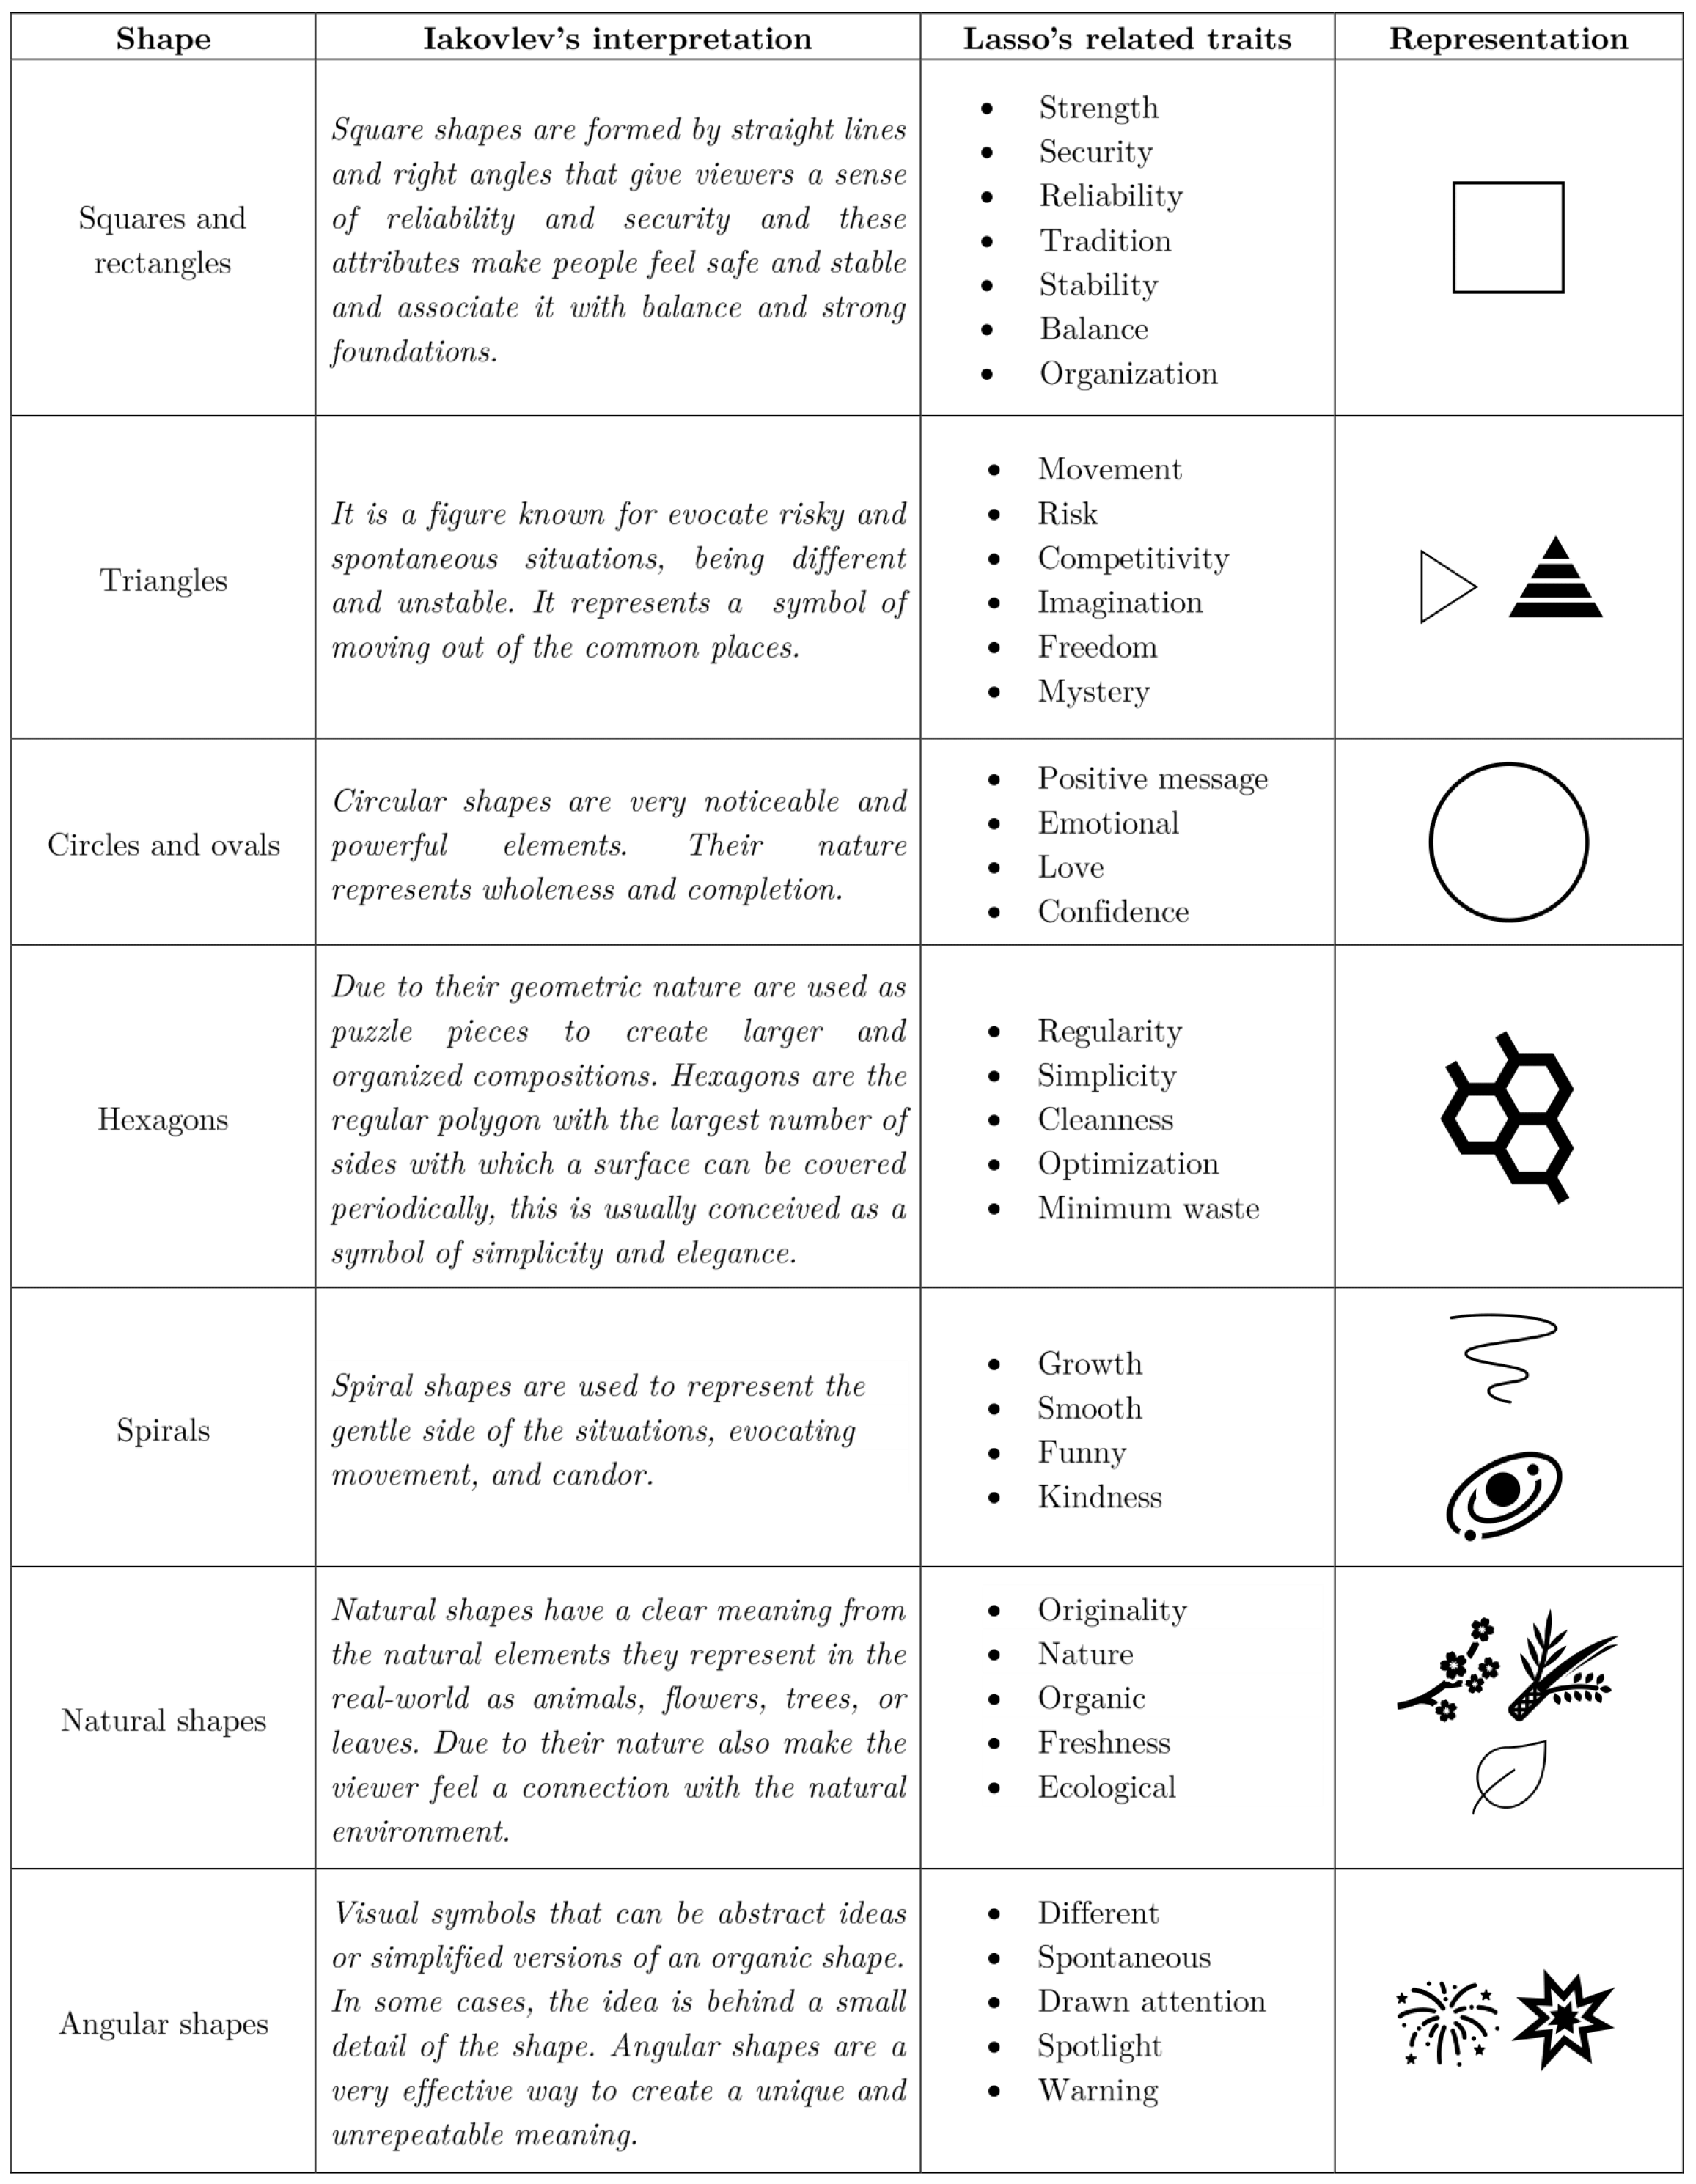
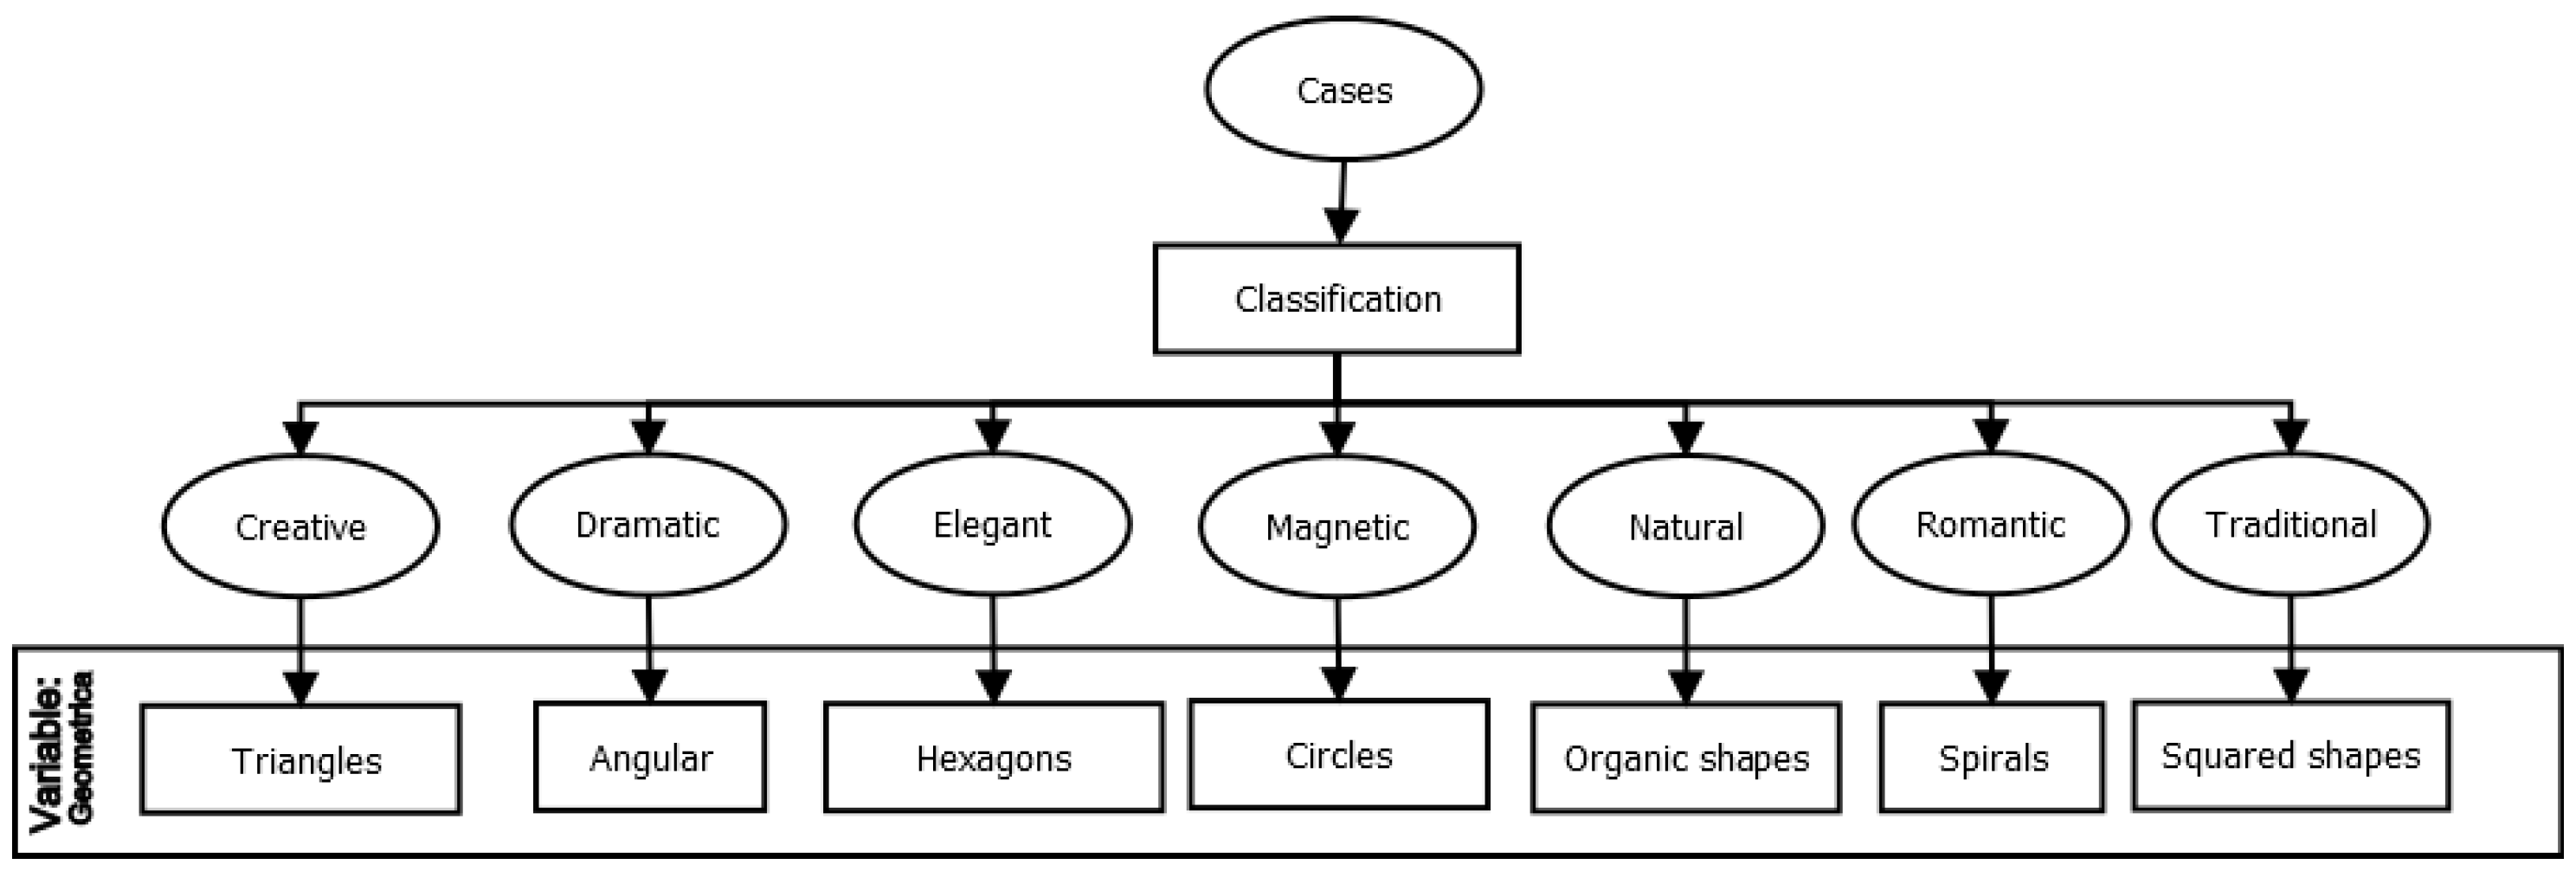
  • Derivation of geometric rules: The selection criteria for the geometric variables for the seven cases were based on the expert rules derived from the theories presented by Lasso [61] and Iakovlev [62]. These theories establish connections between psychological traits and certain shapes, which are summarized in Figure 10. By applying these expert rules, we can determine the appropriate shapes for each style in the generation of personalized ads. Continuing, we examined the correlations between the columns showing the geometric basis and psychological traits in Figure 1 and Figure 10, which were derived from the relationships presented in Table 4. By doing so, we obtained the decision tree illustrated in Figure 11. This decision tree serves as a reference for selecting the appropriate geometric variables for each predicted style in the generation of personalized ads.
With the completion of the design of all the components in our methodology, we now move on to presenting the experimental results.

5. Experiments

Below, we provide the training, testing, and evaluation results for the models described in the previous section. These results serve to assess the capabilities of each model. All experiments were implemented by coding the models in Python utilizing the TensorFlow version 2.0 and TFKeras version 1 frameworks.

5.1. Data Preprocessing

Data preprocessing involves adjusting the dimensions of an images to make them suitable for different neural network architectures. In this work, we were working with three-channel RGB images. The images were scaled to 256 pixels in their largest dimension and then filled to a final volume of 256 × 256 pixels in RGB. Subsequently, the dataset was serialized into .pickle extension files, ensuring greater portability and security in handling the data.

5.2. Supervised Model

The supervised models were tested with the Style7 dataset. To evaluate their performance, we used the mean accuracy as a binary classifier, and the categorical cross-entropy was used as the loss function (or error). All supervised models were trained on the Style7 dataset, which consists of 9161 training samples and 1000 testing samples.
The first model trained was the Style7 architecture. It required 400 training epochs and took 85 min for completion. The training metrics yielded the following results:
  • Train Loss: 0.841 (plot shown in Figure 12a);
  • Test loss: 1.611 (plot shown in Figure 12b);
  • Train accuracy: 67.33 (plot shown in Figure 12c);
  • Test accuracy: 51.04 (plot shown in Figure 12d).
Based on this evaluation, an interesting phenomenon was observed. It is noteworthy that the error function decreased significantly during both training and testing, and the accuracy during training reached high values. However, the test accuracy was considerably lower in comparison. This behavior is indicative of a phenomenon called overfitting, where the model performs well on the training data but fails to generalize effectively to unseen data.
Overfitting can occur when a model is trained to recognize specific patterns in the data but fails to generalize well to new data. This phenomenon is often associated with low bias and high variance in a model. To address this issue, variations in the hyperparameters and architecture were explored to mitigate overfitting and determine if the proposed architecture could effectively solve the given problem.

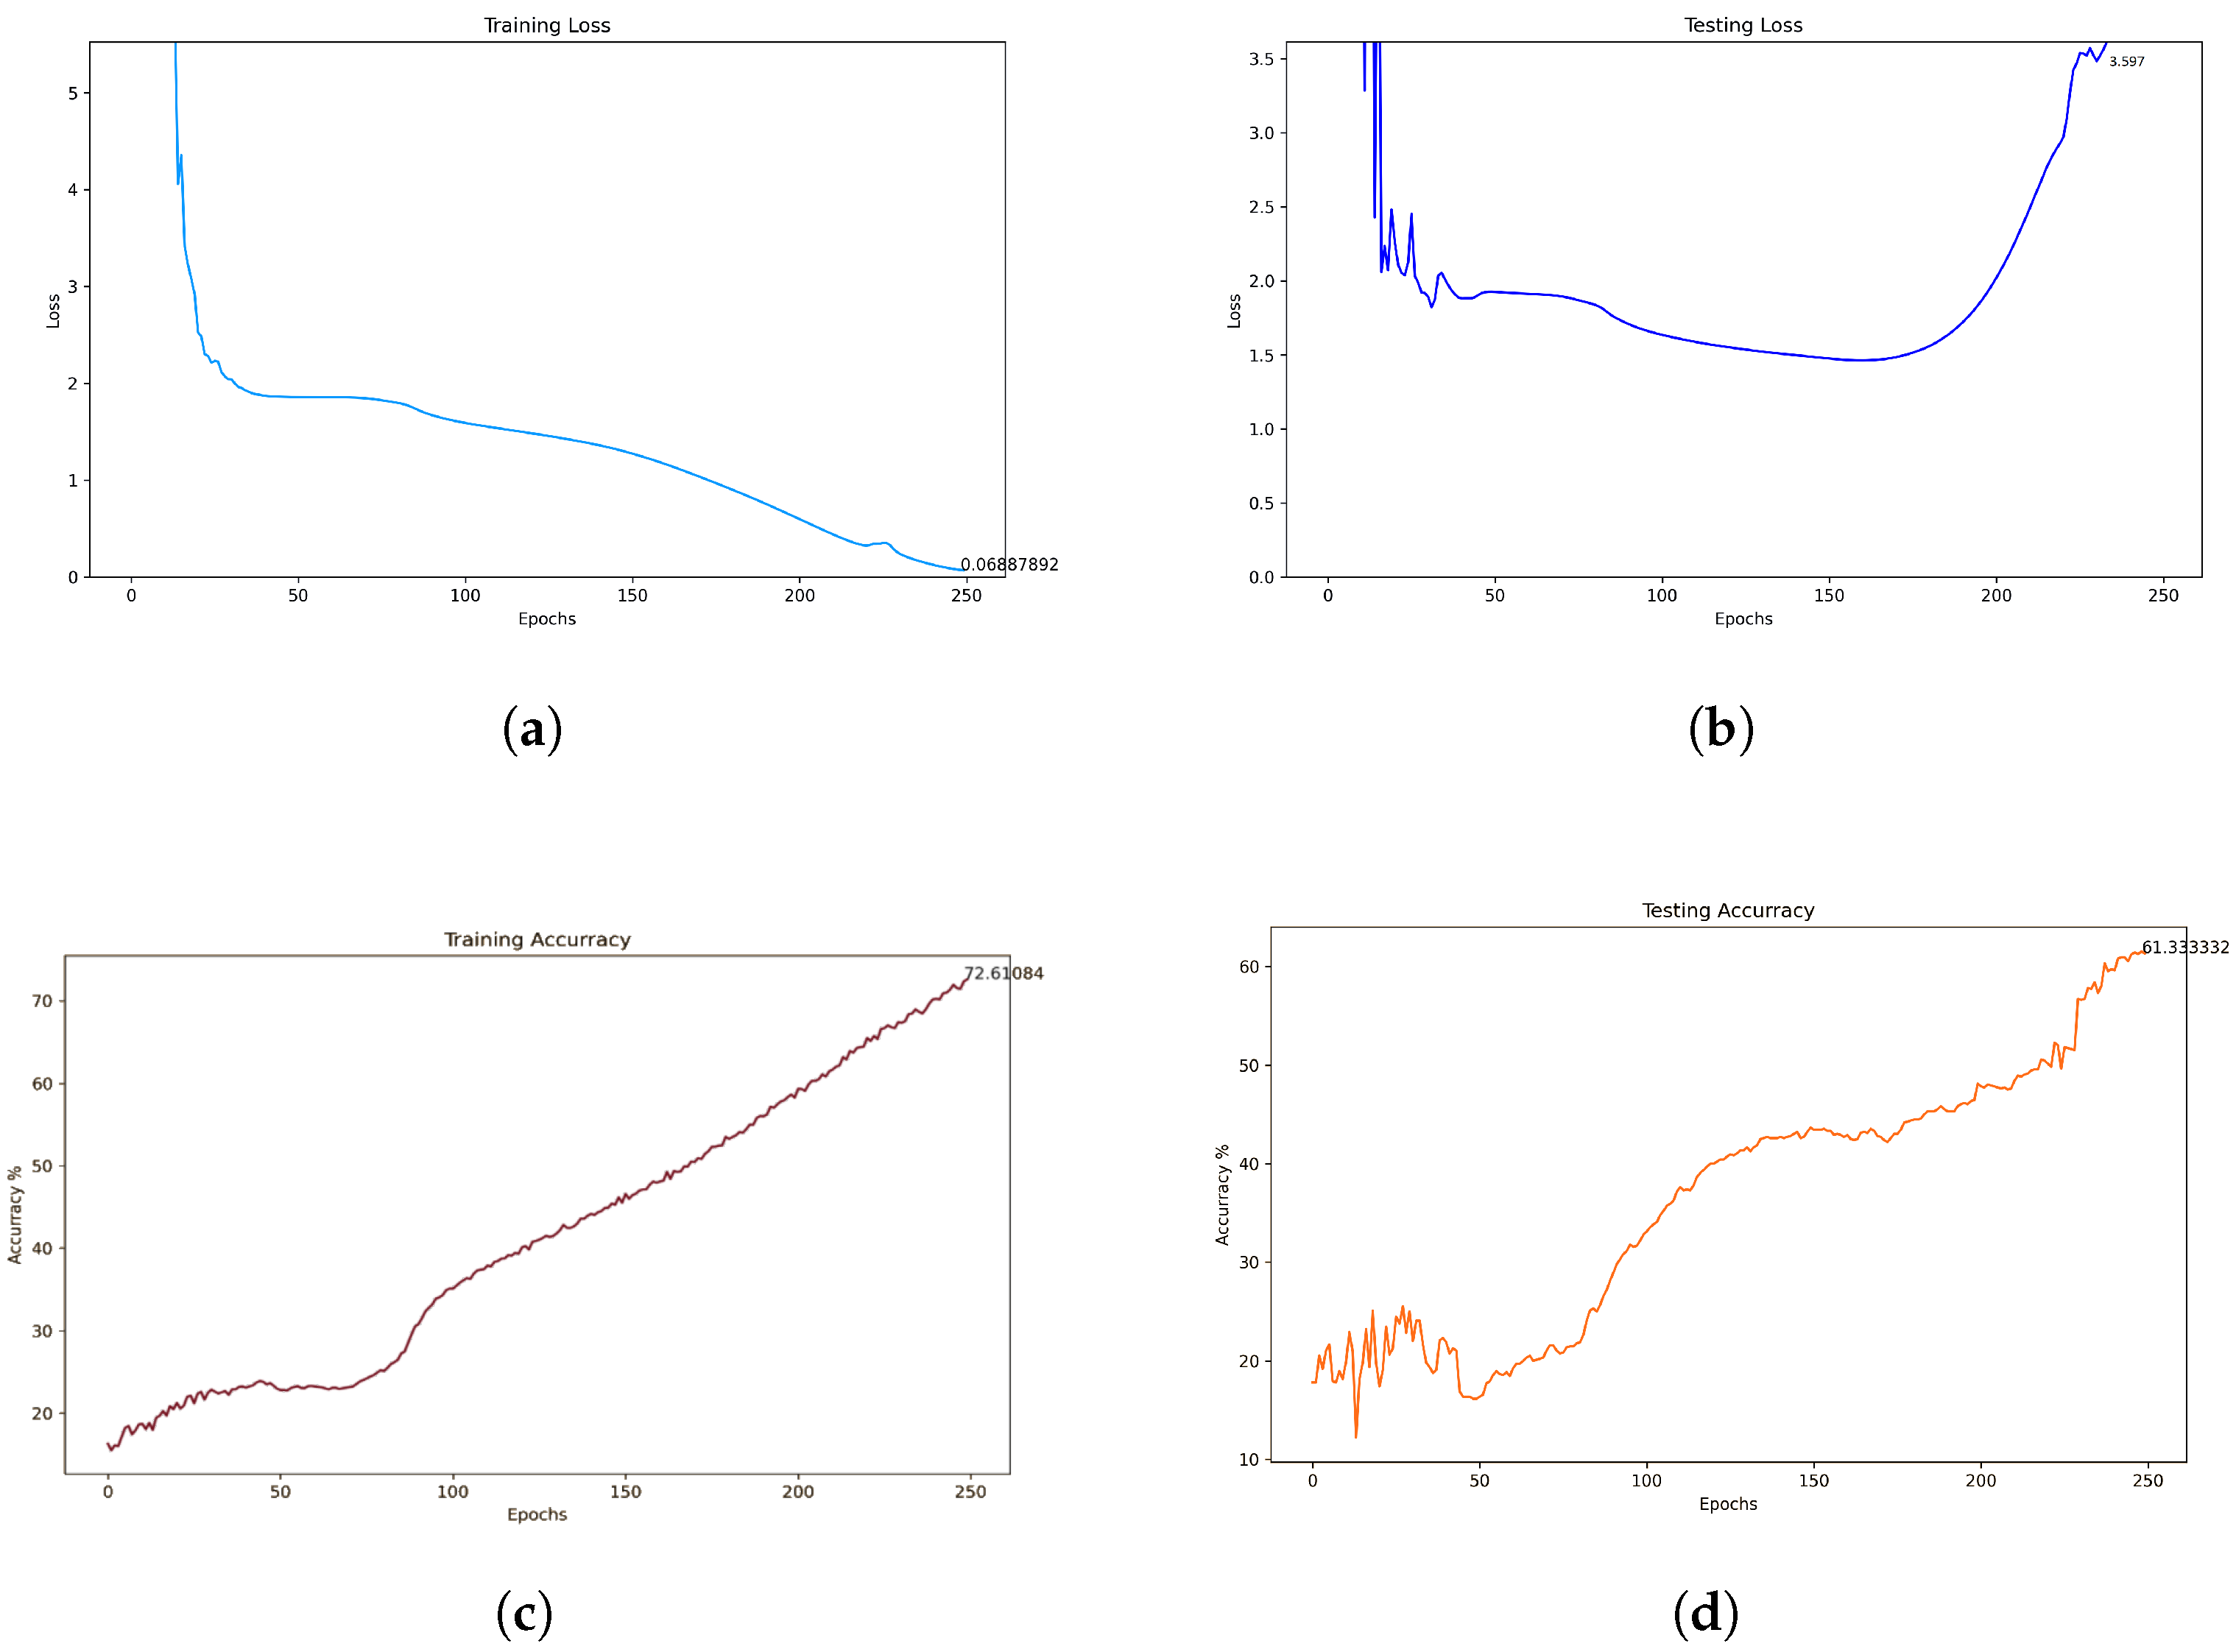
5.3. Custom Semi-Supervised Model

The semi-supervised approach was implemented using a two-phase training process involving both unsupervised and semi-supervised learning.

LIP Autoencoder Results

The first phase entailed training an autoencoder network using the LIP dataset described in Section 4.3. This training was performed in an unsupervised manner, meaning that the data were not labeled. The LIP dataset consists of 61,368 training samples and 10,000 test samples. After 500 training epochs, a test error value of 12.36 was achieved.
Figure 13 displays examples of the predictions made by the trained LIP autoencoder. The original input data are shown on the left side, while the corresponding predicted output is displayed on the right side.
The subsequent phase involved training the semi-supervised model. This phase utilized the trained layers from the LIP architecture up to the embedding layer and added a fully connected layer for classification. The parameters of the encoder layers remained fixed, and only the classification layers were trained in a supervised manner using the Style7 dataset. The complete model achieved an average accuracy of 61.33% after 250 training epochs, which took approximately 453 min to complete. This accuracy represents an improvement compared to the accuracy obtained with the fully supervised models.
  • Train loss: 0.0688 (plot shown in Figure 14a);
  • Test loss: 3.597 (plot shown in Figure 14b);
  • Train accuracy: 72.61 (plot shown in Figure 14c);
  • Test accuracy: 61.33 (plot shown in Figure 14d).

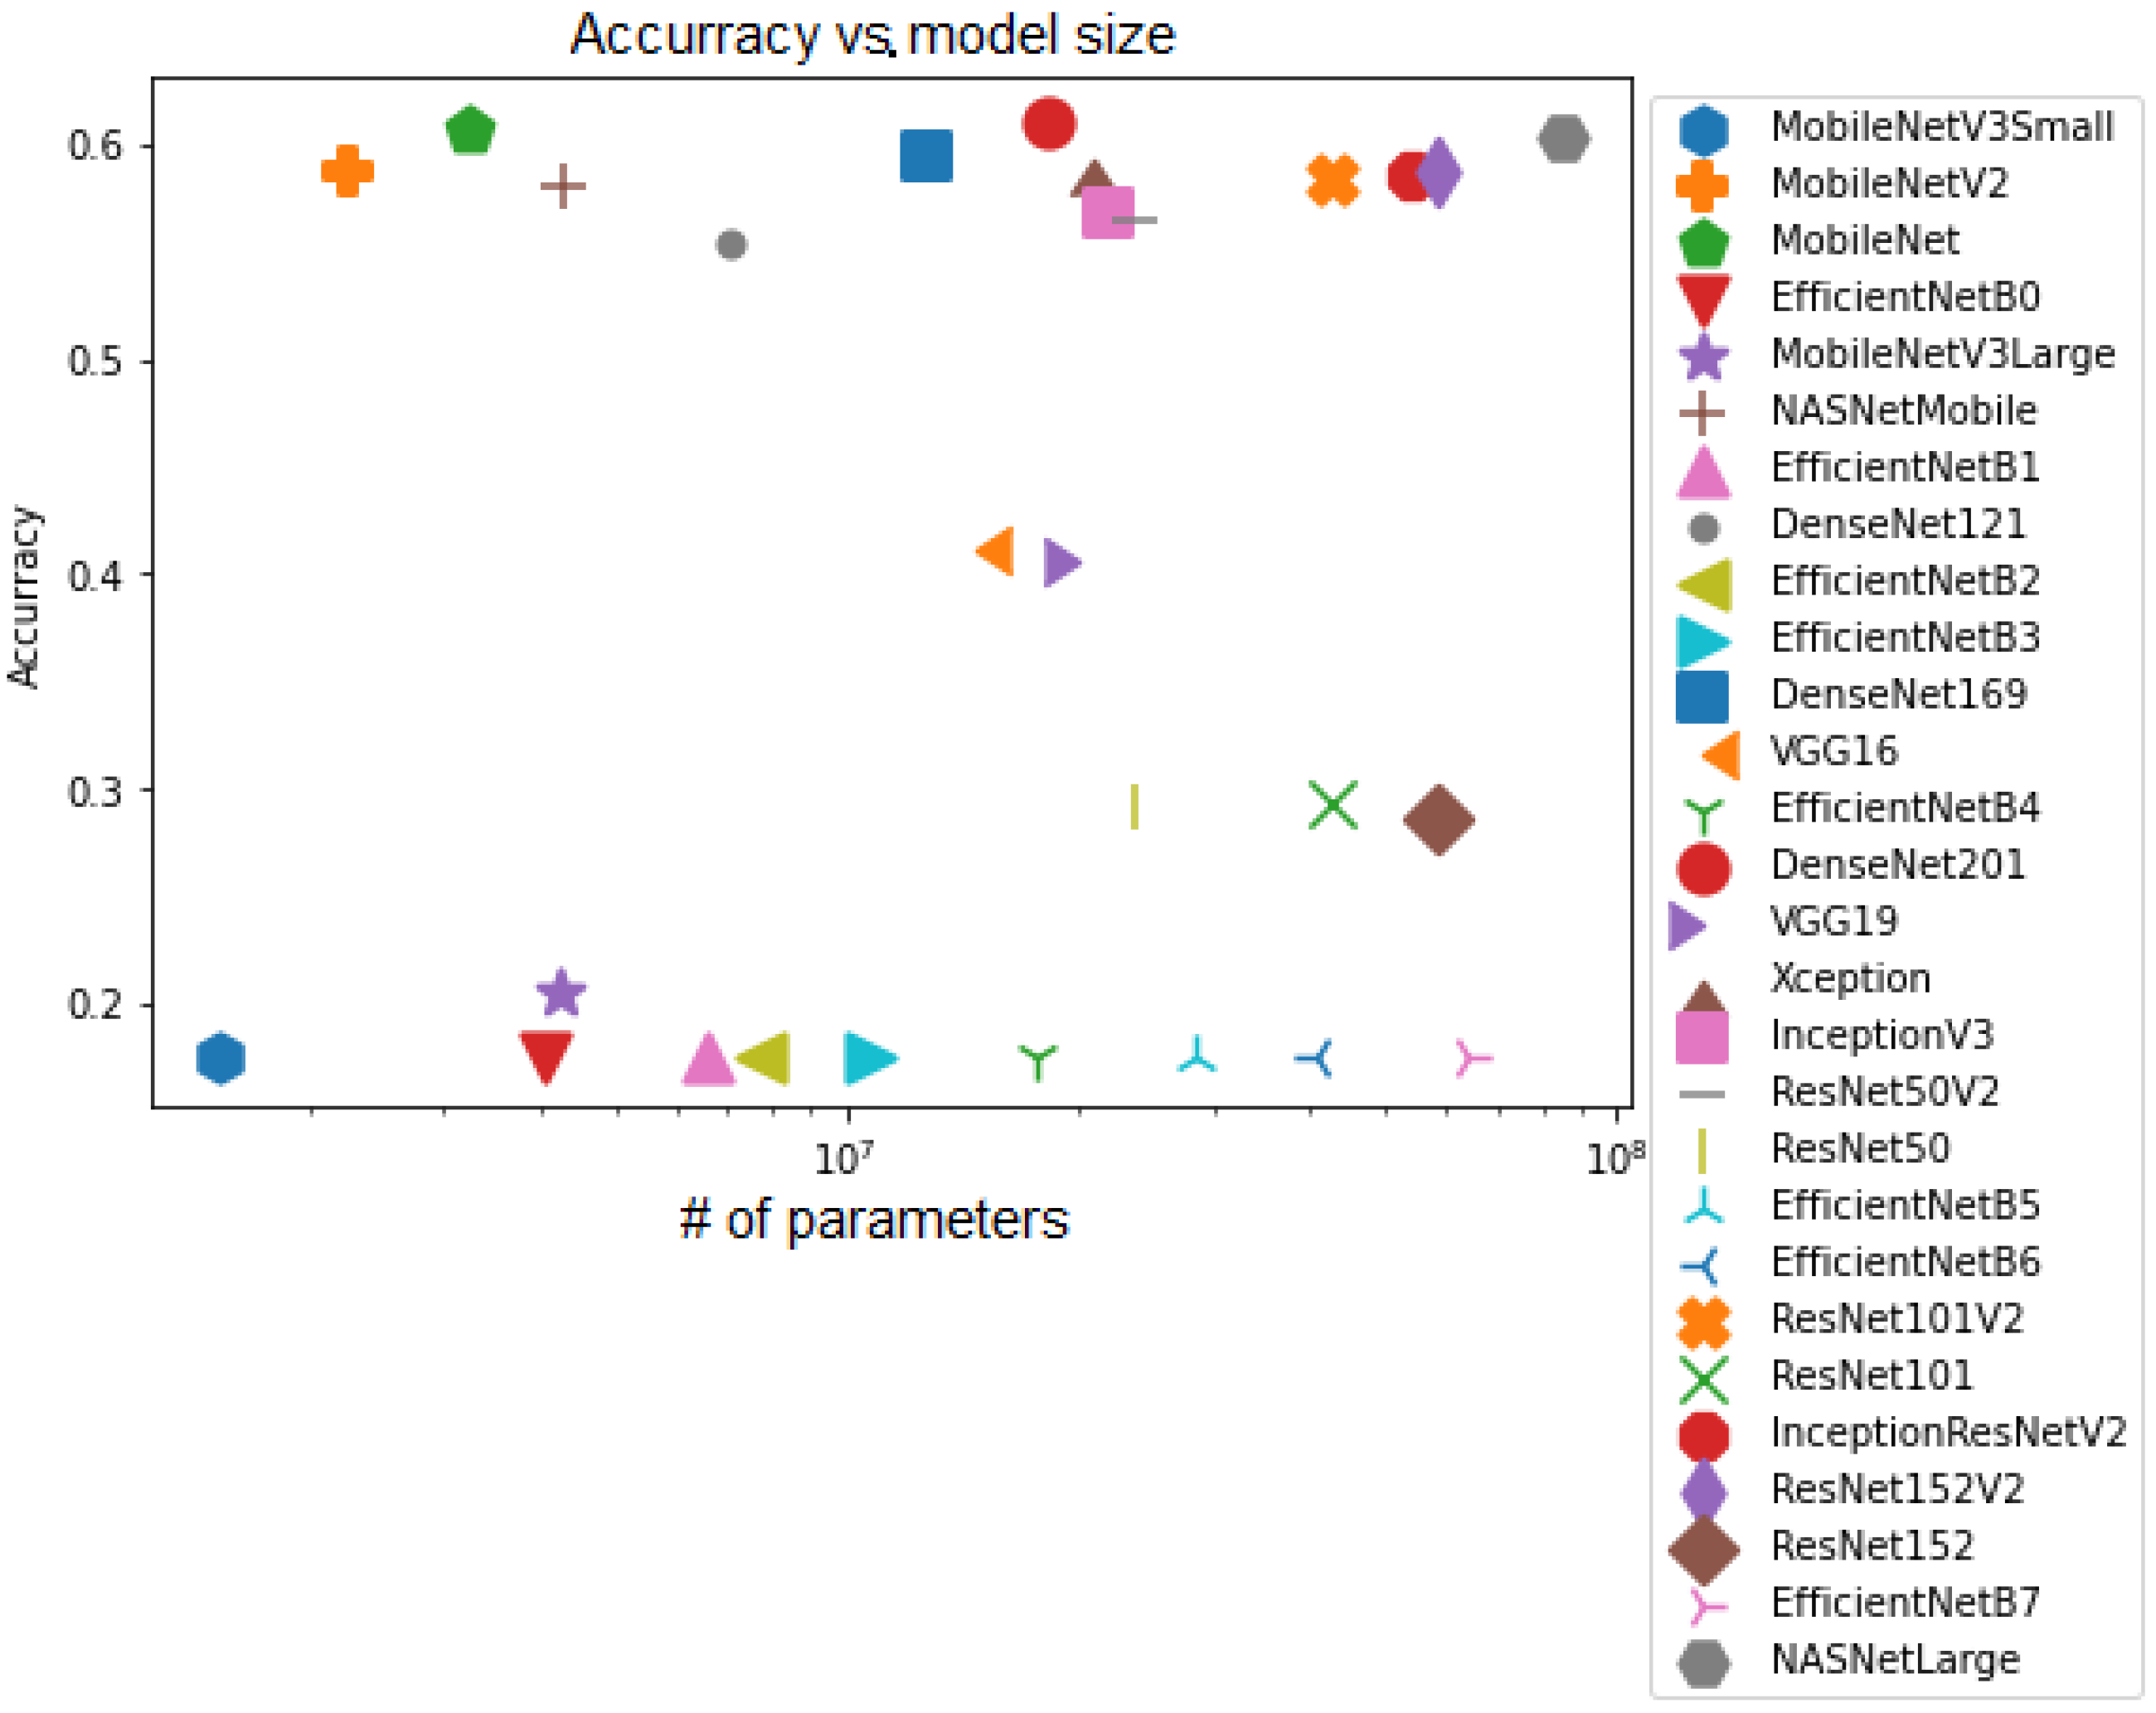
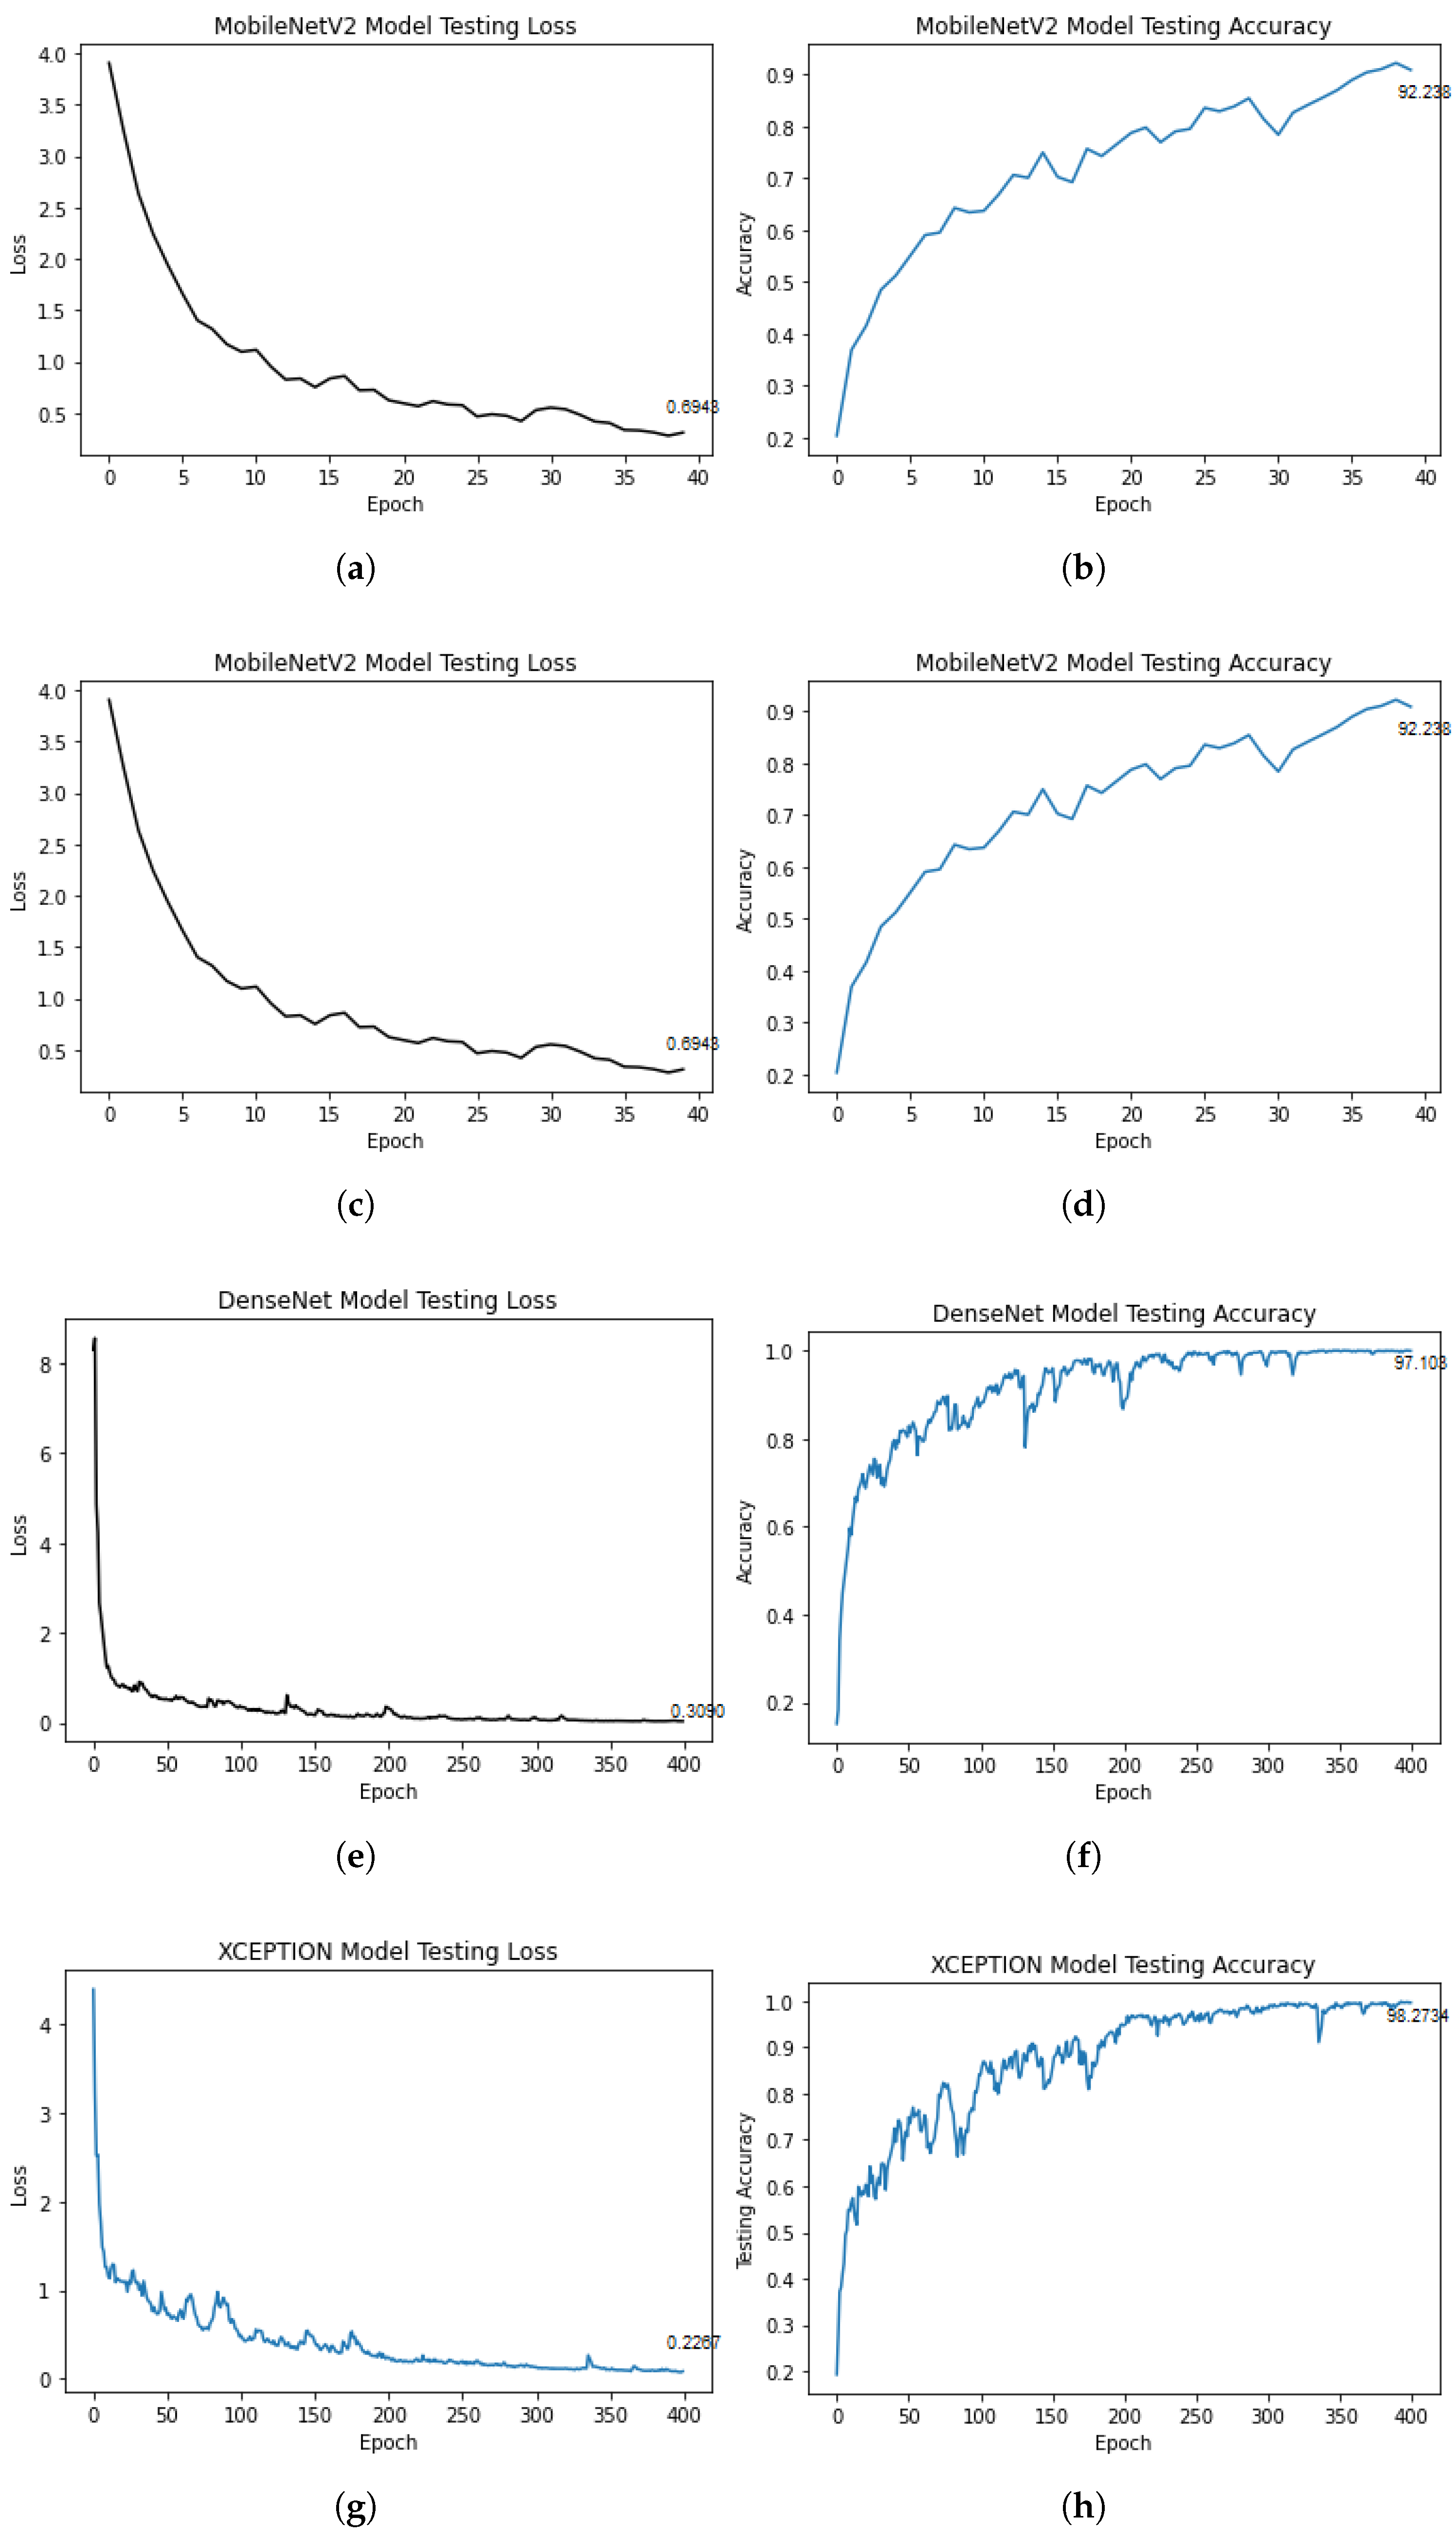
5.4. Transfer Learning Architectures

In an effort to evaluate the performance of the different architectures in a general manner, an experiment was conducted where each available architecture was trained for a limited number of epochs, and the average accuracy was measured after this initial training phase. The results of this experiment are depicted in Figure 15. The x-axis represents the scale of network size in terms of the number of parameters, while the y-axis represents the average accuracy achieved after training for 10 epochs. To optimize both the size of the architecture and the average accuracy, we aimed to determine the highest accuracy that could be achieved with the lowest number of parameters. Therefore, the global maximum would be located at the coordinate (0, 1).
Based on this experimentation, four architectures were chosen to undergo complete training: MobileNet v2 [63], Densenet121 [64], VGG16 [48], and XCEPTION [65]. These architectures were trained under the conditions specified in Table 5. The training curves for the loss and mean accuracy of the four models are depicted in Figure 16.
The accuracy results for the transfer learning training are presented in Table 6. Among the tested architectures, the model based on XCEPTION achieved the best performance in terms of error and accuracy while maintaining a reasonable training time. To validate the effectiveness of the automatic generation of personalized ads, we conducted an experiment involving 100 participants. This sample size was determined to be statistically valid according to the central limit theorem, which requires that data be sampled randomly, samples be independent of each other, and the sample size be sufficiently large but not exceed 10% of the population. Our study covered two schools with approximately 1200 students, making the selected sample size of 100 participants adequate. Please refer to Table 7.
The table provides a concise overview of the significant aspects of the study’s results. It highlights the sample size, which consisted of 100 participants, meeting the requirements for statistical validity based on the central limit theorem. Additionally, key demographic insights obtained from the socio-demographic survey are presented, indicating important characteristics of the participants.
The training of transfer learning models was conducted to support the automatic generation of personalized ads. Table 6 presents a summary of the training results for various architectures. Notably, the XCEPTION model achieved outstanding performance, with the lowest error rate of 0.2267 and the highest accuracy of 0.9827. This suggests that the XCEPTION-based approach holds promising potential for accurately predicting styles, thus enabling effective personalized advertising generation.
After training the architectures with the same parameters, it was evident that XCEPTION consistently achieved the highest average accuracy among all the transfer learning experiments. In comparison to the supervised and semi-supervised custom models, the transfer learning approach yielded considerably better results overall. To further analyze the outcomes, Table 8 presents the confusion matrix obtained from fine-tuning XCEPTION using the Style7 dataset. Each entry in the matrix represents the prediction–real class pair for each sample.
The evaluation metrics for each class were calculated using the definitions of the binary classification evaluation metrics, with each metric representing a specific class. To obtain an overall measure for the entire model, we combined the F1-scores of each class. The results for the confusion matrix and metrics are summarized in Table 9 and Table 10, respectively. In Table 9, it can be observed that there were very few false positives and false negatives across all classes. Additionally, Table 10 highlights that all metrics for all classes had values greater than 0.96 , indicating a high level of performance and accuracy.

5.4.1. Discussion of Style Characterizer Results

Table 11 provides a comparison of the metrics for the best-evaluated experiments across the supervised, semi-supervised, and transfer learning approaches.
Upon comparing the results of the supervised and semi-supervised models, we observed that they yielded similar outcomes. However, a notable difference was observed when evaluating the transfer learning models. The performance gap was particularly significant, with all pre-trained models achieving a mean accuracy evaluation of over 85.
It is worth emphasizing that this disparity arose due to the prior knowledge embedded in these pre-trained models. By being trained on massive datasets consisting of tens of millions of samples, like ImageNet, these models acquired the capability to identify and extract relevant features that contribute to more accurate style prediction.
The superior performance of the transfer learning models highlights the benefits of leveraging pre-existing knowledge and transferring it to new tasks. This approach allows the models to leverage the vast amount of information learned from ImageNet, leading to more robust and effective style characterization.
Overall, the results demonstrate the advantages of using pre-trained architectures, as they outperformed the models trained solely on the Style7 dataset. The wealth of prior knowledge embedded in the pre-trained models enabled them to excel in style prediction tasks.

5.4.2. Comparison with the State of the Art

While there is no existing work specifically addressing the characterization of photographs based on the seven universal styles, we can still present a comparison with a related task presented by Takagi in [50]. Takagi’s work focused on the classification of photographs similar to those used in our training process. This work is particularly relevant as it utilized transfer learning architectures that were also employed in our research. We compared the classes directly mapped to the following universal styles: dramatic, elegant, and magnetic. The comparison results are presented in Table 12.

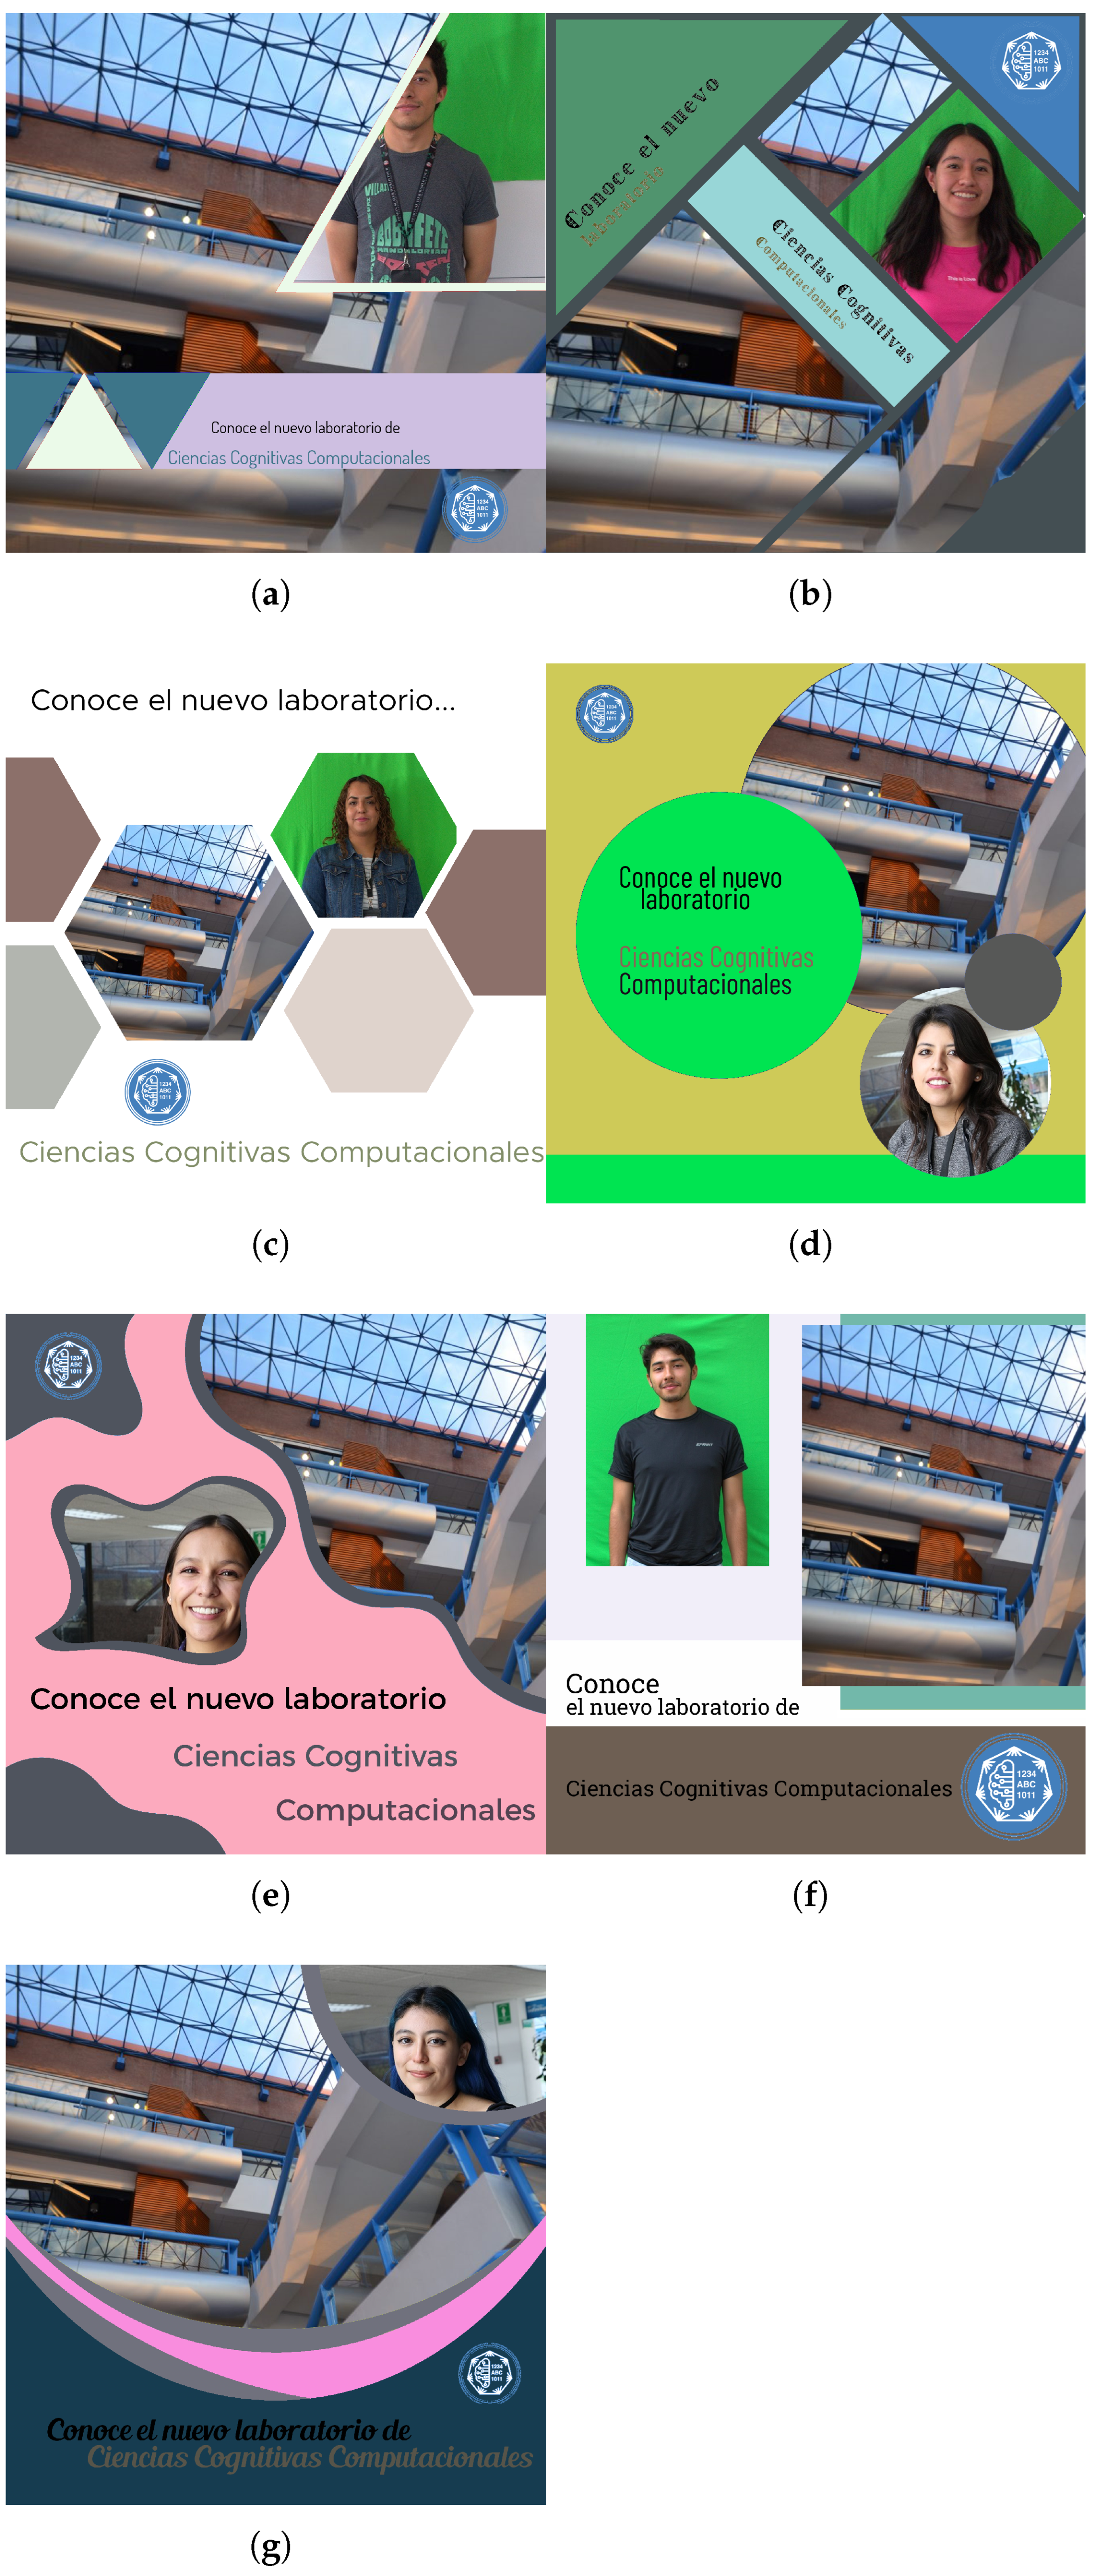
5.5. 7Styles Ad Generator

A set of advertisements, one for each universal style, is presented in Figure 17. These ads showcase the diversity of shapes, colors, and fonts that correspond to each style. The ads were generated by applying the rules described in Section 4.5.
To validate the effectiveness of our automatic generation of personalized ads, we conducted an experiment involving 100 participants. This number was statistically valid according to the central limit theorem, the three rules of which state that: (1) the data should be sampled randomly, (2) the samples should be independent of each other, and (3) the sample size should be sufficiently large but not exceed 10% of the population. Since our study covered just two schools with almost 1200 students, 100 samples were adequate.
Then, we conducted a socio-demographic survey, the full results of which are presented in Figure A1. We found that 96% were 18–25 years old, 92% had college as their level of education, 96% spent less than USD 500 shopping every month, 95% were unemployed since they were graduate students, 67% were male and 30% female, and 53% shopped online weekly and 29% monthly.
The experiment proceeded as follows:
  • We asked each participant to provide a full-body photo;
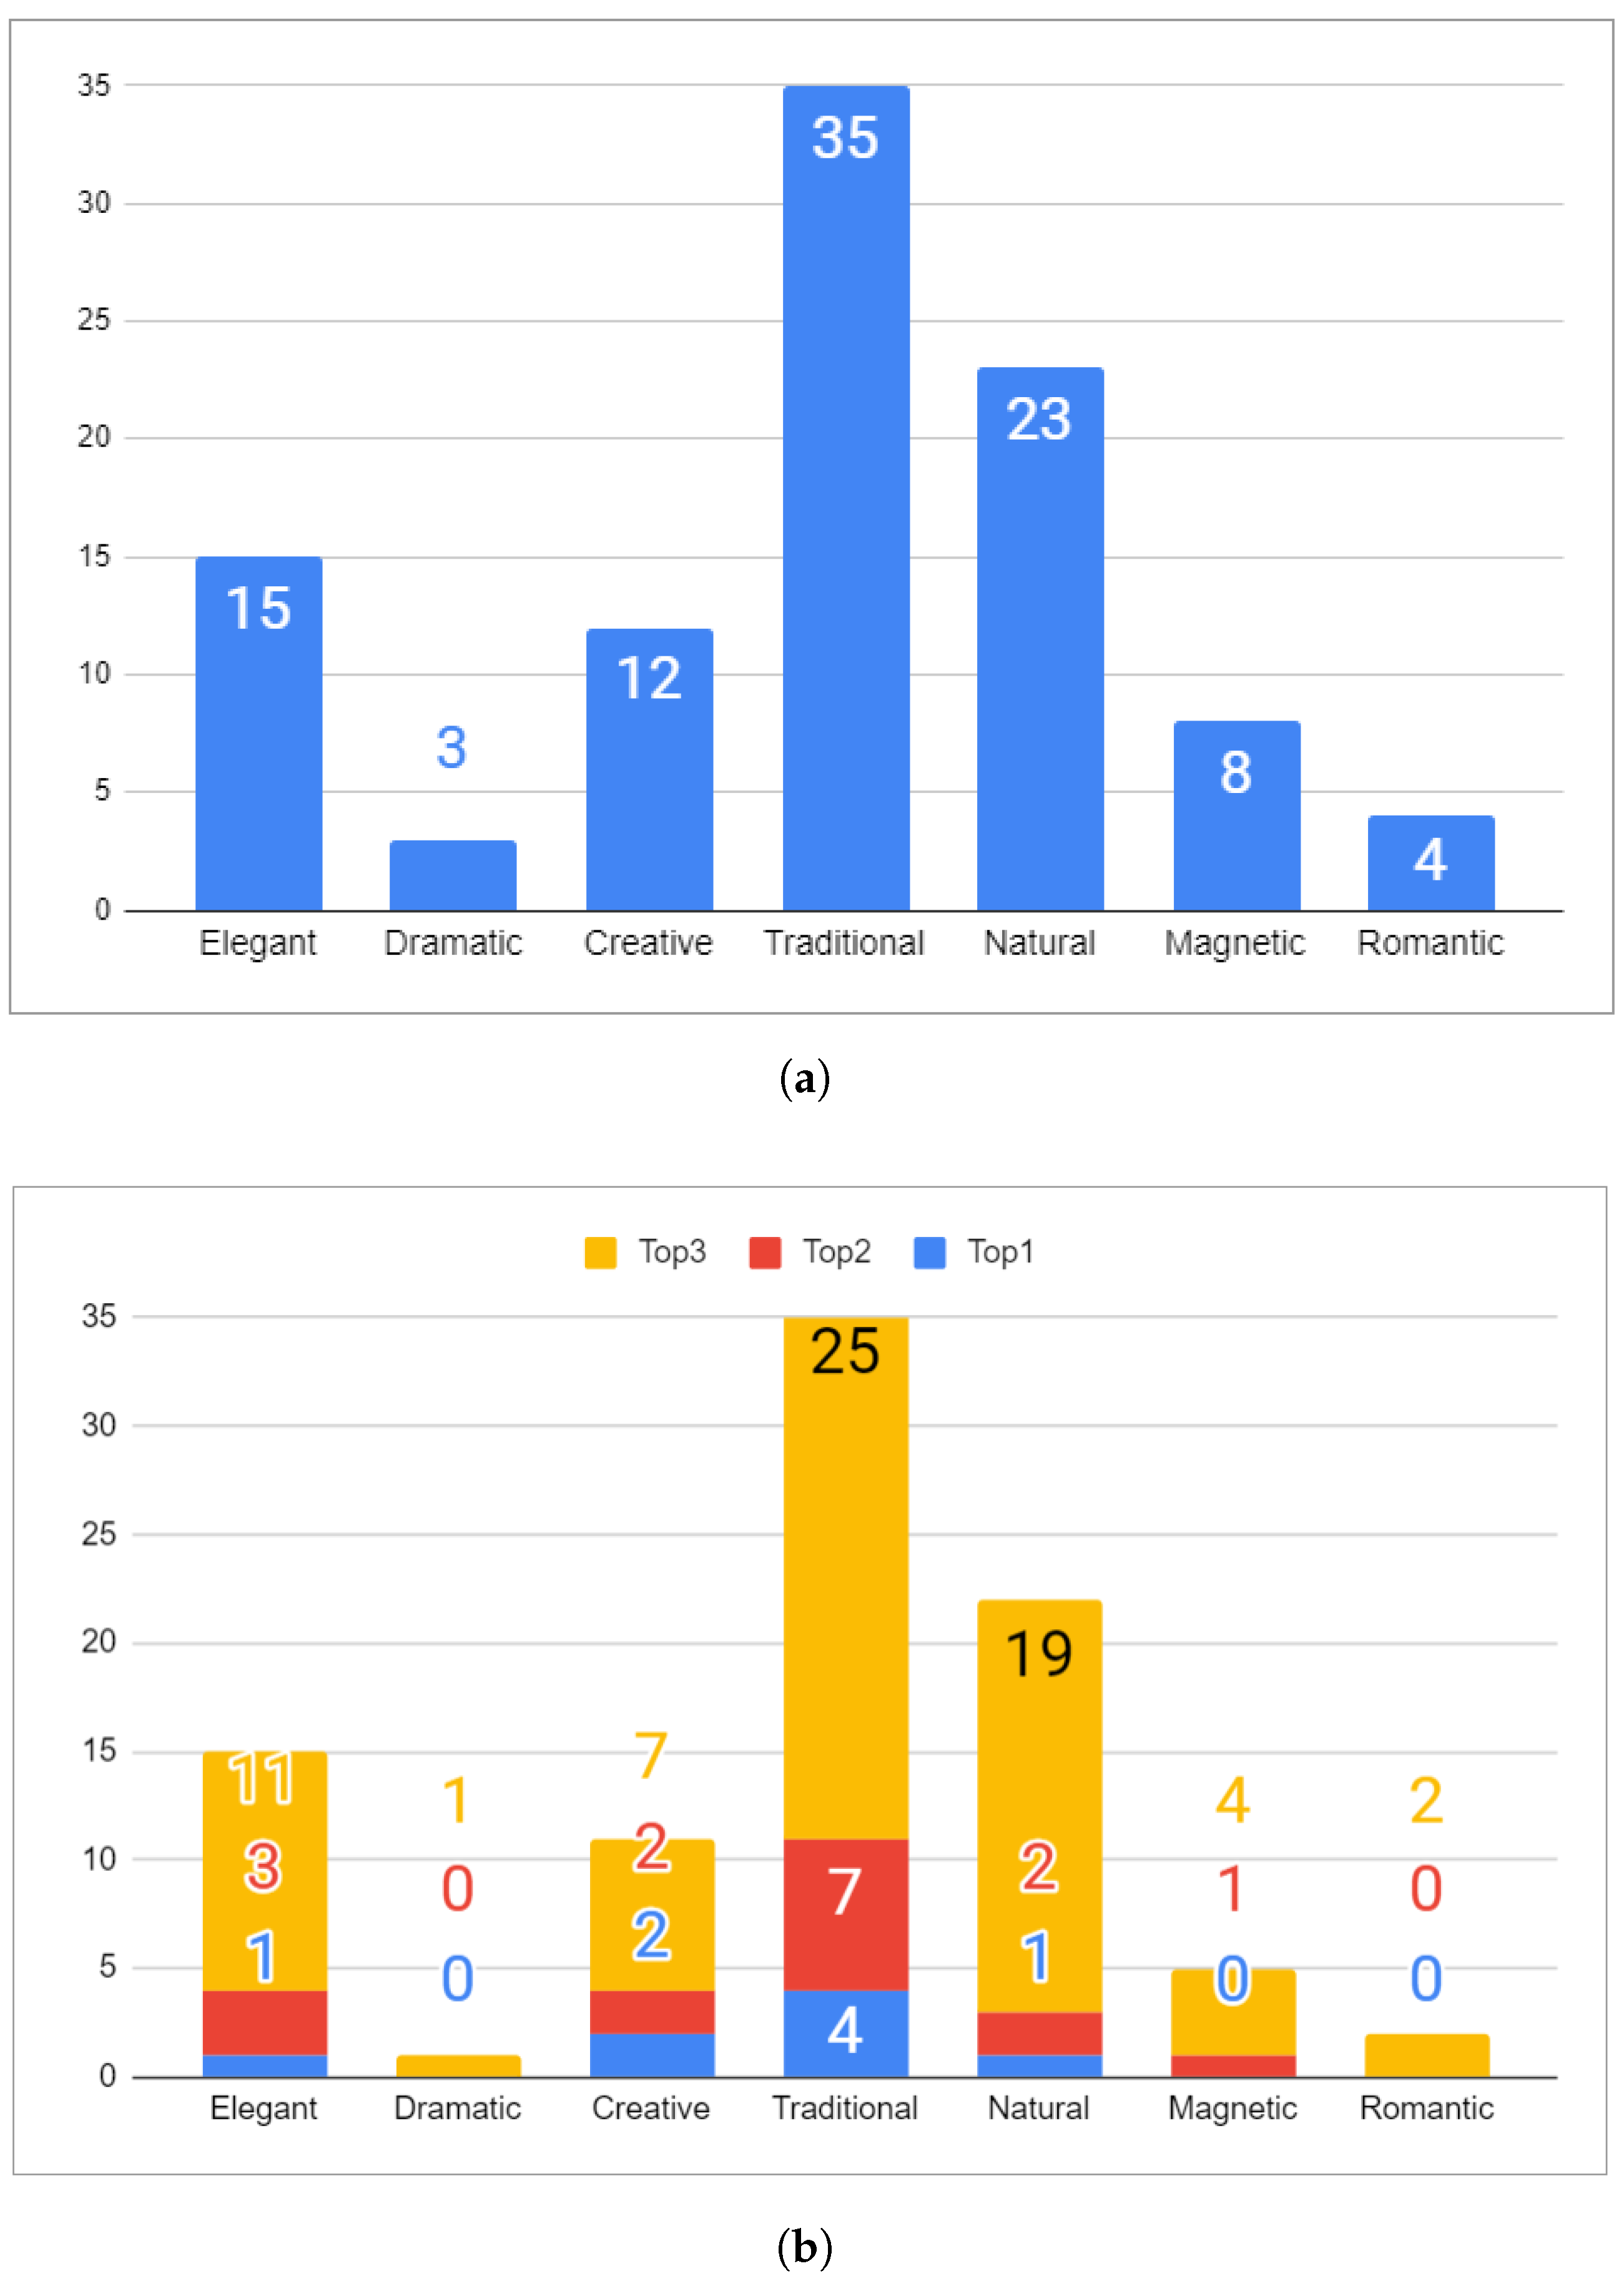
  • The participant’s dress style was determined using the seven-style model. Figure 18a shows the number of participants for each class;
  • We generated seven custom ads based on the participants’ predicted dress style;
  • The participant was shown the ads and asked to choose three they liked, ranking them from first to third. An example of the survey layout can be seen in Figure 19, and Figure 18b shows the complete results.
Based on the collected data and previous analysis, the results indicated that 79% of the participants selected the ad that matched their style as one of their top three choices (see Figure 18b). Notice that, in all the cases, the top three were the most frequently chosen; as an example (compare Figure 18a with Figure 18b), consider the first class, elegant, with 15 participants: 1 person chose its corresponding ad as the first option (top rank), 3 people chose it within the top two, and 13 people chose it within the top three, giving a total of 15 hits. The 79% success rate indicates an acceptable level of alignment between the generated ads and the participants’ perceived style preferences.

6. Final Discussion

Our main findings are listed below.
  • This study presents a model capable of evaluating the apparent style from a photograph, demonstrating that this process can be carried out by computational means. Certain methodologies make it possible to obtain information that can be important for industrial or commercial purposes based solely on the individual’s appearance;
  • The models trained in the present work can emulate the typically human task of evaluating apparent style. This information can be used to apply advantageous strategies for those who use it in a business environment;
  • We obtained results with better metric evaluations than those presented by the most similar work in the literature. Although not exactly equivalent, it provides a fair comparison due to the similarity of the tasks and presented solution approaches;
  • The proposed 7Styles ad generator could produce a wide variety of ad compositions. Furthermore, 79% of the people surveyed chose the ad corresponding to their style.

7. Conclusions

This research contributed to the development of an innovative deep learning model capable of predicting individuals’ dress styles based on full-body images. The model was integrated into a personalized ad generator that created unique and engaging advertisements tailored to each user’s style preferences. The research introduced a novel set of rules that establish a connection between predicted styles and well-known theories of color, geometry, and typography in advertising. The key contributions of this research are as follows:
  • Deep learning model for style prediction: The research introduced a novel deep learning model that achieved a high accuracy of 98.27% in predicting dress styles based on full-body images. This model surpassed traditional methods of market segmentation, which often rely on less granular demographic data. By leveraging advanced deep learning techniques, this model can enable businesses to understand their customers’ style preferences more accurately and effectively;
  • Personalized ad generator: The integration of the deep learning model into a personalized ad generator offers a groundbreaking approach to advertising. By generating custom ads based on each user’s predicted style, businesses can deliver highly relevant and engaging content, increasing the likelihood of positive customer responses and conversions;
  • Automated market segmentation: The research showcased the automation of market segmentation by using the predicted dress styles as a segmentation variable. This automation can streamline the process of tailoring marketing campaigns to specific customer segments, saving time and resources for businesses while enhancing the precision of their targeting efforts;
  • Data-driven insights for marketing strategies: By utilizing data to estimate consumer preferences and style traits, the research demonstrated the power of data-driven insights in enhancing marketing strategies. Businesses could make more informed decisions by understanding their customers’ psychological traits through observable appearance components, leading to improved customer engagement and satisfaction.
The results of this research have significant implications for both researchers and practitioners in the fields of marketing and machine learning.
For researchers:
  • The deep learning model and its high accuracy in predicting dress styles can contribute to the advancement of machine learning techniques in the domain of fashion and style analysis;
  • The study provides a foundation for further research in automating market segmentation and generating personalized marketing content using advanced deep learning methodologies;
For practitioners:
  • The personalized ad generator offers a valuable tool for businesses seeking to optimize their marketing efforts and create targeted campaigns that resonate with individual customers;
  • The research demonstrates the potential of data-driven insights in enhancing marketing strategies, encouraging businesses to adopt more personalized and effective approaches to advertising.
The results obtained in this study surpass those of the most similar work in the literature, highlighting the effectiveness and potential of the proposed methodology. Although direct comparisons may not have been possible due to variations in specific tasks, the similarities in the tasks and solution approaches allowed for a fair assessment of the advancements achieved.
The automation of apparent style assessment and the generation of personalized ads have significant implications for various fields. Industries such as fashion, retail, marketing, and advertising can leverage the proposed methodology to enhance human resources management, improve security systems, deliver personalized customer service, and produce intelligent recommendation systems.

Author Contributions

Conceptualization and methodology, M.A.M.-A., H.C., J.F. and C.A.D.; investigation and resources, M.A.M.-A., H.C., J.F. and C.A.D.; software, visualization, and data curation, J.F. and C.A.D.; validation, M.A.M.-A., H.C. and C.A.D.; formal analysis, M.A.M.-A. and H.C.; writing—original draft preparation, J.F.; writing—review and editing, M.A.M.-A. and H.C.; supervision, project administration, and funding acquisition, M.A.M.-A. All authors have read and agreed to the published version of the manuscript.

Funding

This work was possible thanks to the support from the Mexican government (CONAHCYT) under grant APN2017-5241 and the Instituto Politecnico Nacional through SIP-IPN research grants SIP-2259, SIP-20231198, and SIP 20230140 (IPN-COFAA and IPN-EDI).

Institutional Review Board Statement

Not applicable.

Informed Consent Statement

Not applicable.

Data Availability Statement

The data presented in this study are available upon reasonable request from the corresponding author.

Conflicts of Interest

The authors declare no conflict of interest.

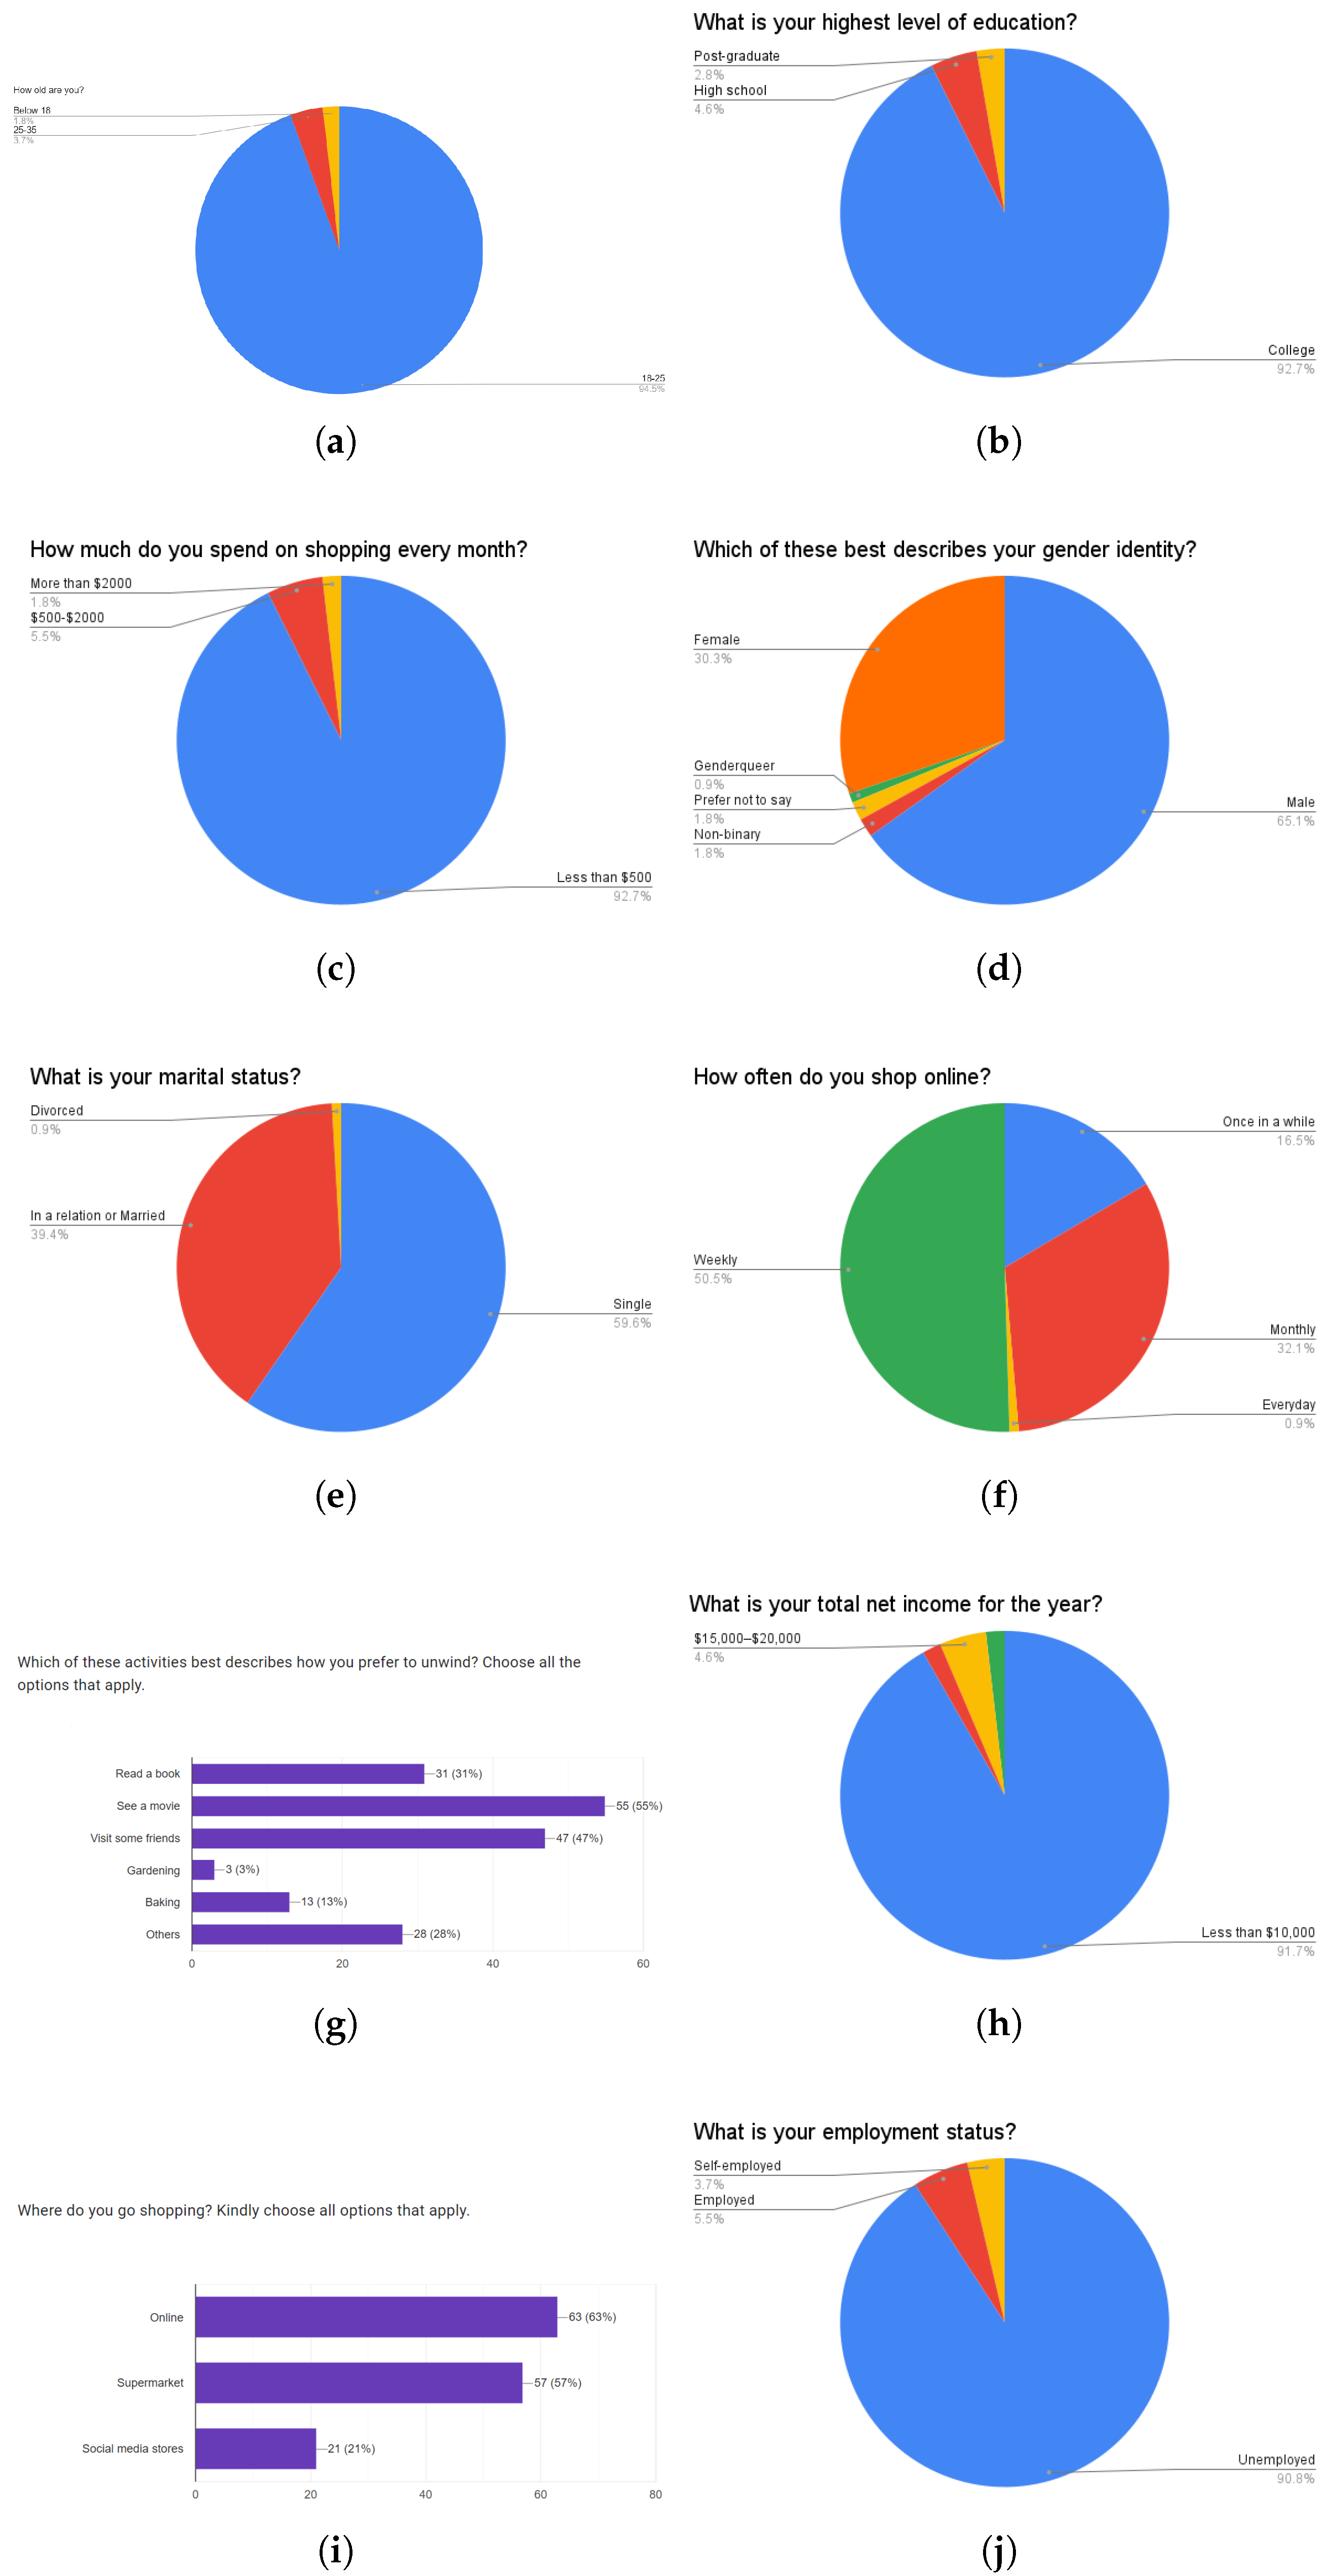
Appendix A. Socio-Demographic Survey Results

Figure A1. Survey.
Figure A1. Survey.
Applsci 13 09765 g0a1

References

  1. Faggella, D. Artificial Intelligence in Marketing and Advertising—5 Examples of Real Traction. 2018. Available online: https://www.techemergence.com/artificial-intelligence-in-marketing-and-advertising-5-examples-of-real-traction/ (accessed on 18 August 2023).
  2. Burrage, A. Targeted Marketing vs. Mass Marketing. 2020. Available online: https://www.wearetrident.co.uk/targeted-marketing-vs-mass-marketing/ (accessed on 16 August 2023).
  3. Camilleri, M.A. Understanding customer needs and wants. In Tourism, Hospitality; Event Management; Springer: Berlin/Heidelberg, Germany, 2017; pp. 29–50. [Google Scholar] [CrossRef]
  4. Kimiagari, S.; Baei, F. Promoting e-banking actual usage: Mix of technology acceptance model and technology-organisation-environment framework. Enterp. Inf. Syst. 2022, 16, 1894356. [Google Scholar] [CrossRef]
  5. Malafe, N.S.A.; Kimiagari, S.; Balef, E.K. Investigating the Variables Affecting Brand Performance in the SOR Framework. In Academy of Marketing Science Annual Conference-World Marketing Congress; Springer: Berlin/Heidelberg, Germany, 2021; pp. 303–317. [Google Scholar]
  6. Kimiagari, S.; Balef, E.K.; Malafe, N.S.A. Study of the Factors Affecting the Intention to Adopt and Recommend Technology to Others: Based on the Unified Theory of Acceptance and Use of Technology (UTAUT). In Academy of Marketing Science Annual Conference-World Marketing Congress; Springer: Berlin/Heidelberg, Germany, 2021; pp. 321–334. [Google Scholar]
  7. Kimiagari, S.; Baei, F. Extending Intention to Use Electronic Services Based on the Human–Technology Interaction Approach and Social Cognition Theory: Emerging Market Case. IEEE Trans. Eng. Manag. 2022, 1–20. [Google Scholar] [CrossRef]
  8. Kimiagari, S.; Malafe, N.S.A. The role of cognitive and affective responses in the relationship between internal and external stimuli on online impulse buying behavior. J. Retail. Consum. Serv. 2021, 61, 102567. [Google Scholar] [CrossRef]
  9. Dawar, N.; Parker, P. Marketing universals: Consumers’ use of brand name, price, physical appearance, and retailer reputation as signals of product quality. J. Mark. 1994, 58, 81–95. [Google Scholar]
  10. Mittal, B.; Baker, J. The Services Marketing System and Customer Psychology; Wiley Subscription Services, Inc.: Hoboken, NJ, USA, 1998. [Google Scholar]
  11. Gustafson, S.B.; Mumford, M.D. Personal style and person-environment fit: A pattern approach. J. Vocat. Behav. 1995, 46, 163–188. [Google Scholar] [CrossRef]
  12. Jackson, D.N.; Messick, S. Content and style in personality assessment. Psychol. Bull. 1958, 55, 243. [Google Scholar] [CrossRef]
  13. Callow, M.; Schiffman, L.G. Sociocultural meanings in visually standardized print ads. Eur. J. Mark. 2004, 38, 1113–1128. [Google Scholar] [CrossRef]
  14. Ascarza, E.; Israeli, A. Eliminating unintended bias in personalized policies using bias-eliminating adapted trees (BEAT). Proc. Natl. Acad. Sci. USA 2022, 119, e2115293119. [Google Scholar] [CrossRef]
  15. Buhalis, D.; Volchek, K. Bridging marketing theory and big data analytics: The taxonomy of marketing attribution. Int. J. Inf. Manag. 2021, 56, 102253. [Google Scholar] [CrossRef]
  16. Machanavajjhala, A.; Korolova, A.; Sarma, A.D. Personalized social recommendations-accurate or private? arXiv 2011, arXiv:1105.4254. [Google Scholar]
  17. Zhu, Z.; Wang, J.; Caverlee, J. Measuring and mitigating item under-recommendation bias in personalized ranking systems. In Proceedings of the 43rd International ACM SIGIR Conference on Research and Development in Information Retrieval, Virtual Event, 25–30 July 2020; pp. 449–458. [Google Scholar]
  18. Theocharous, G.; Healey, J.; Mahadevan, S.; Saad, M. Personalizing with human cognitive biases. In Proceedings of the Adjunct Publication of the 27th Conference on User Modeling, Adaptation and Personalization, Larnaca, Cyprus, 9–12 June 2019; pp. 13–17. [Google Scholar]
  19. Martin, K.D.; Murphy, P.E. The role of data privacy in marketing. J. Acad. Mark. Sci. 2017, 45, 135–155. [Google Scholar] [CrossRef]
  20. Cartwright, S.; Liu, H.; Raddats, C. Strategic use of social media within business-to-business (B2B) marketing: A systematic literature review. Ind. Mark. Manag. 2021, 97, 35–58. [Google Scholar] [CrossRef]
  21. Eco, U. Tratado de Semiótica General, 3rd ed.; Penguin Random House: Barcelona, Spain, 2018. [Google Scholar]
  22. Barthes, R.; Ward, M.; Howard, R. The Fashion System; Hill and Wang: New York, NY, USA, 1983. [Google Scholar]
  23. Rodríguez-Jaime, J. Social cognition study: Clothing and its link as an analysis element of nonverbal communication. Vivat Acad. 2018, 157, 85. [Google Scholar] [CrossRef]
  24. Volli, U. Semiótica de la Publicidad; Gius Laterza and Figli Spa: Rome, Italy, 2012. [Google Scholar]
  25. Kaiser, S. The Social Psychology of Clothing: Symbolic Appearances in Context; Fairchild: New York, NY, USA, 1997. [Google Scholar]
  26. Polaino-Lorente, A.; Armentia, A.; Cabanyes, J. Fundamentos de Psicología de la Personalidad; Colección Textos del Instituto de Ciencias para la Familia; RIALP: Madrid, España, 2003. [Google Scholar]
  27. Parsons, A.; Parente, D.; Martin, G. Universal Style: Dress for Who You Are and What You Want; Parente & Parsons: Online, 1991. [Google Scholar]
  28. Aguilar, D. La Tipología del Estilo Como Herramienta Clave Para Mejorar las Relaciones Humanas a Partir los Procesos de Reclutamiento de Personal. Ph.D. Thesis, Colegio de Consultores en Imagen Pública, Mexico City, Mexico, 2015. [Google Scholar]
  29. Migueles, L.C.; Gordillo, P.C. El hombre vestido: Una visión sociológica, psicológica y comunicativa sobre la moda. In El Hombre Vestido: Una Visión Sociológica, Psicológica y Comunicativa Sobre la Moda; University of Granada: Granada, Spain, 2014. [Google Scholar]
  30. Kwon, J.; Ogawa, K.i.; Ono, E.; Miyake, Y. Detection of nonverbal synchronization through phase difference in human communication. PLoS ONE 2015, 10, e0133881. [Google Scholar] [CrossRef] [PubMed]
  31. Marín Dueñas, P.P. Hand up. Analysis of non-verbal communication in the campaign for the general secretary of PSOE (spanish socialist workers’ party). Encuentros 2014, 12, 91–104. [Google Scholar]
  32. Entwistle, J. El Cuerpo y la Moda: Una Visión Sociológica; Contextos/Context; Paidós: Barcelona, España, 2002. [Google Scholar]
  33. Elkan, D. The psychology of colour: Why winners wear red. New Sci. 2009, 203, 42–45. [Google Scholar] [CrossRef]
  34. Frank, M.; Gilovich, T. The Dark Side of Self- and Social Perception: Black Uniforms and Aggression in Professional Sports. J. Personal. Soc. Psychol. 1988, 54, 74–85. [Google Scholar] [CrossRef]
  35. Hill, R.A.; Barton, R.A. Red enhances human performance in contests. Nature 2005, 435, 293. [Google Scholar] [CrossRef]
  36. Stephen, I.D.; Oldham, F.H.; Perrett, D.I.; Barton, R.A. Redness enhances perceived aggression, dominance and attractiveness in men’s faces. Evol. Psychol. 2012, 10, 147470491201000312. [Google Scholar] [CrossRef]
  37. Eaves, M.H.; Leathers, D. Successful Nonverbal Communication: Principles and Applications; Routledge: Oxfordshire, UK, 2017. [Google Scholar]
  38. Molloy, J.T. John T. Molloy’s New Dress for Success; Warner Books: New York, NY, USA, 1988. [Google Scholar]
  39. Rasicot, J. Jury Selection, Body Language & the Visual Trial; AB Publications: Minneapolis, MN, USA, 1983. [Google Scholar]
  40. Smith, L.J.; Malandro, L.A. Courtroom Communication Strategies; Kluwer Law Book Publishers: Alphen aan den Rijn, The Netherlands, 1985. [Google Scholar]
  41. Liu, Z.; Luo, P.; Qiu, S.; Wang, X.; Tang, X. Deepfashion: Powering robust clothes recognition and retrieval with rich annotations. In Proceedings of the IEEE Conference on Computer Vision and Pattern Recognition, Las Vegas, NV, USA, 27–30 June 2016; pp. 1096–1104. [Google Scholar]
  42. Hadi Kiapour, M.; Han, X.; Lazebnik, S.; Berg, A.C.; Berg, T.L. Where to buy it: Matching street clothing photos in online shops. In Proceedings of the IEEE International Conference on Computer Vision, Santiago, Chile, 7–13 December 2015; pp. 3343–3351. [Google Scholar]
  43. Huang, J.; Feris, R.S.; Chen, Q.; Yan, S. Cross-domain image retrieval with a dual attribute-aware ranking network. In Proceedings of the IEEE International Conference on Computer Vision, Santiago, Chile, 7–13 December 2015; pp. 1062–1070. [Google Scholar]
  44. Chen, Q.; Huang, J.; Feris, R.; Brown, L.M.; Dong, J.; Yan, S. Deep domain adaptation for describing people based on fine-grained clothing attributes. In Proceedings of the IEEE Conference on Computer Vision and Pattern Recognition, Boston, MA, USA, 7–12 June 2015; pp. 5315–5324. [Google Scholar]
  45. Xiao, T.; Xia, T.; Yang, Y.; Huang, C.; Wang, X. Learning from massive noisy labeled data for image classification. In Proceedings of the IEEE Conference on Computer Vision and Pattern Recognition, Boston, MA, USA, 7–12 June 2015; pp. 2691–2699. [Google Scholar]
  46. Chen, J.C.; Liu, C.F. Deep net architectures for visual-based clothing image recognition on large database. Soft Comput. 2017, 21, 2923–2939. [Google Scholar] [CrossRef]
  47. Liu, K.H.; Chen, T.Y.; Chen, C.S. Mvc: A dataset for view-invariant clothing retrieval and attribute prediction. In Proceedings of the 2016 ACM on International Conference on Multimedia Retrieval, New York, NY, USA, 6–9 June 2016; pp. 313–316. [Google Scholar]
  48. Simonyan, K.; Zisserman, A. Very deep convolutional networks for large-scale image recognition. arXiv 2014, arXiv:1409.1556. [Google Scholar]
  49. Sun, G.L.; Wu, X.; Peng, Q. Part-based clothing image annotation by visual neighbor retrieval. Neurocomputing 2016, 213, 115–124. [Google Scholar] [CrossRef]
  50. Takagi, M.; Simo-Serra, E.; Iizuka, S.; Ishikawa, H. What makes a style: Experimental analysis of fashion prediction. In Proceedings of the IEEE International Conference on Computer Vision Workshops, Honolulu, HI, USA, 21–26 July 2017; pp. 2247–2253. [Google Scholar]
  51. Gong, K.; Liang, X.; Zhang, D.; Shen, X.; Lin, L. Look into person: Self-supervised structure-sensitive learning and a new benchmark for human parsing. In Proceedings of the IEEE Conference on Computer Vision and Pattern Recognition, Honolulu, HI, USA, 21–26 July 2017; pp. 932–940. [Google Scholar]
  52. Deng, J.; Dong, W.; Socher, R.; Li, L.J.; Li, K.; Fei-Fei, L. ImageNet: A Large-Scale Hierarchical Image Database. In Proceedings of the 2009 IEEE Conference on Computer Vision and Pattern Recognition, Miami, FL, USA, 20–25 June 2009. [Google Scholar]
  53. Chollet, F.; Zhu, Q.S.; Rahman, F.; Gardener, T.; Lee, T.; Qian, C.; Marmiesse, G.; Jin, H.; Zabluda, O.; Marks, S.; et al. Keras. 2015. Available online: https://github.com/fchollet/keras (accessed on 23 August 2023).
  54. Chollet, F.; Zhu, Q.S.; Rahman, F.; Gardener, T.; Lee, T.; Qian, C.; Marmiesse, G.; Jin, H.; Zabluda, O.; Marks, S.; et al. Keras Applications. 2015. Available online: https://keras.io/api/applications/ (accessed on 23 August 2023).
  55. Badaró, S.; Ibañez, L.J.; Agüero, M.J. Sistemas expertos: Fundamentos, metodologías y aplicaciones. Cienc. Tecnol. 2013, 349–364. Available online: https://dialnet.unirioja.es/servlet/articulo?codigo=4843871 (accessed on 23 August 2023). [CrossRef]
  56. Sherwin-Williams. STIR Connects Color and Cutting-Edge Design—Sherwin-Williams. 2015. Available online: https://www.sherwin-williams.com/architects-specifiers-designers/inspiration/stir (accessed on 18 August 2023).
  57. Sherwin-Williams. Colorsnap Color ID | Paint Color Collections | Sherwin-Williams. 2019. Available online: https://www.sherwin-williams.com/visualizer#/active/color-collections (accessed on 22 August 2023).
  58. Li, Y.; Suen, C.Y. Typeface personality traits and their design characteristics. In Proceedings of the 9th IAPR International Workshop on Document Analysis Systems, Boston, MA, USA, 9–11 June 2010; pp. 231–238. [Google Scholar]
  59. Shaikh, A.D.; Chaparro, B.S.; Fox, D. Perception of fonts: Perceived personality traits and uses. In Perception of Fonts: Perceived Personality Traits and Uses; Usability News: Cardiff, UK, 2006. [Google Scholar]
  60. Perez, P. Las Tipografías y su Personalidad ¿Qué Transmite Cada Una? 2020. Available online: https://paoperez.com/tipografias-personalidad-transmite/ (accessed on 16 August 2023).
  61. Lasso, G. The Meaning Behind Shapes. 2007. Available online: https://medium.com/@glasso_14980/the-meaning-behind-shapes-10bb9db82c1b (accessed on 9 August 2023).
  62. Iakovlev, Y. Shape Psychology in Graphic Design. 2015. Available online: https://www.zekagraphic.com/shape-psychology-in-graphic-design/ (accessed on 14 August 2023).
  63. Howard, A.G.; Zhu, M.; Chen, B.; Kalenichenko, D.; Wang, W.; Weyand, T.; Andreetto, M.; Adam, H. MobileNets: Efficient Convolutional Neural Networks for Mobile Vision Applications. arXiv 2017, arXiv:1704.04861. [Google Scholar]
  64. Huang, G.; Liu, Z.; van der Maaten, L.; Weinberger, K.Q. Densely Connected Convolutional Networks. arXiv 2018, arXiv:1608.06993. [Google Scholar]
  65. Chollet, F. Xception: Deep Learning with Depthwise Separable Convolutions. arXiv 2017, arXiv:1610.02357. [Google Scholar]
Figure 1. Seven universal styles model.
Applsci 13 09765 g001
Figure 2. Proposed methodology: in green is our dataset and in purple are our designs.
Applsci 13 09765 g002
Figure 3. Assignation to Style7 dataset classes.
Applsci 13 09765 g003
Figure 4. Class distribution histogram for Style7 dataset.
Applsci 13 09765 g004
Figure 5. Model of Style7 architecture.
Applsci 13 09765 g005
Figure 6. Model of LIP architecture.
Applsci 13 09765 g006
Figure 7. Model of ClassEmbedding2048 architecture.
Applsci 13 09765 g007
Figure 8. Sherwin-Williams ID color palettes for the seven-style model.: (a) Creative, (b) Dramatic, (c) Elegant, (d) Magnetic, (e) Natural, (f) Romantic, (g) Traditional.
Applsci 13 09765 g008
Figure 9. Derivation tree for typographic rules.
Applsci 13 09765 g009
Figure 10. Shape models of Iakovlev and Lasso.
Applsci 13 09765 g010
Figure 11. Derivation tree for geometric rules.
Applsci 13 09765 g011
Figure 12. Style7 learning curves: (a) Training loss, (b) Testing loss, (c) Training accurancy, (d) Testing accurancy.
Applsci 13 09765 g012
Figure 13. LIP autoencoder prediction examples.
Applsci 13 09765 g013
Figure 14. Class Embedding2048 Learning curves: (a) Training loss, (b) Testing loss, (c) Training accurancy, (d) Testing accurancy.
Applsci 13 09765 g014
Figure 15. Transfer learning architectures: pilot test.
Applsci 13 09765 g015
Figure 16. Testing curves: (a) MobilenetV2 testing loss, (b) MobilenetV2 testing accuracy, (c) MobilenetV2 testing loss, (d) MobilenetV2 testing accuracy, (e) DenseNet testing loss, (f) DenseNet testing accuracy, (g) XCEPTION testing loss, (h) XCEPTION testing accuracy.
Applsci 13 09765 g016
Figure 17. Examples of generated-ads: (a) Creative, (b) Dramatic, (c) Elegant, (d) Magnetic, (e) Natural, (f) Traditional, (g) Romantic.
Applsci 13 09765 g017
Figure 18. Statistics: (a) Number of participants per style, (b) Top one, two, and three hits per style.
Applsci 13 09765 g018
Figure 19. Examples of the top3-ads: (a) Top 1, (b) No selected, (c) Top 2, (d) No selected, (e) No selected, (f) Top 3, (g) No selected.
Applsci 13 09765 g019
Table 1. Literature review: related works on clothing style recognition.
ReferenceMethodologyDatasetFindings/Results
Parsons [27]Style evaluation model based on seven distinct types-Framework for categorizing clothing styles based on conveyed messages
Various disciplines [28,29]Thorough scrutiny of the seven universal styles-Widely accepted model for evaluating apparent style
Liu et al. [41]Utilized FashionNet with nearly one million annotated imagesImages from diverse settingsImproved performance for deep fashion tasks
Chen et al. [44]Introduced a double-path deep domain adaptation networkStreet webcams and surveillance video imagesEnhanced performance of convolutional neural network (CNN)
Xiao et al. [45]Trained CNN-like network with small dataset, expanded dataset with Internet imagesSmall dataset, additional Internet imagesNeural network labeled up to 78% of new images
Chen et al. [46]Employed transfer learning and divide-and-conquer methodologyClothing classification datasetSignificant 18% improvement compared to previous architectures
Liu et al. [47]Created dataset with different views and 264 descriptorsDataset with different views of clothingAchieved 80% accuracy in clothing style recognition
Sun et al. [49]Proposed a methodology for clothing image annotationClothing images with detected posesSignificant improvement in clothing image annotation
Present studyIntroduced deep learning model for style prediction and personalized ad generatorImages of participants in different stylesAchieved a top accuracy of 98.27% for style prediction and 80.56% acceptance rate for personalized ads
Table 2. Psychological traits of typographic families.
Typographic FamilyPsychological Traits
SerifTraditional, elegant, serious, respectable, formal, refined, and authoritative
RoundedClose, imaginative, dynamic, smooth, relaxed, and unique
GeometricStable, dynamic, versatile, serious, playful, deliberate, and elegant
CondensedNarrower, forceful, rigid, sophisticated, modern, and serious
ModernAdaptative, modern, and professional
DecorativeDifferentiated, transgressive and original, lacking care, and personal
ScriptCursive, calligraphic, and approachable
Table 3. Relation between typography and styles.
StyleTypographic FamilyCommon Psychological TraitsCommon Geometric Basis
TraditionalSerifTraditional, serious, respectable, and formalHorizontal and vertical stripes
CreativeRoundedImaginative, relaxed, and uniqueAngular shapes
ElegantGeometricElegant, serious, deliberate, and stableClose shapes, simple geometries
MagneticCondensedNarrower, forceful, and sophisticatedFitted shapes
NaturalModernAdaptive and practicalSimple lines
DramaticDisplayDifferentiated, transgressive, and flamboyantOrnamental and decorative
RomanticScriptCursive, calligraphic, and approachableFlourishes, delicate
Table 4. Relation between geometry and styles.
StyleShape FamilyCommon Psychological TraitsCommon Geometric Basis
TraditionalSquaresTradition, organizationHorizontal and vertical stripes
CreativeTriangleRisk, spontaneous, freedom, imaginationAngular shapes, sharp points
ElegantHexagonsOptimization, perfectionismRegular designs, polygons, geometries
MagneticCircles and ovalsPositive message (fit), loveCircles and closed curves
NaturalNatural shapesOrganic, vitalOrganic design, phytomorphic
DramaticAngular shapesSpotlight, drawing attentionDiagonal and explosive lines
RomanticSpiralsKind, lightDelicate, open, rounded lines
Table 5. Transfer learning model hyperparameters.
Inputs
Dataset:Style7Training samples:9161
Input dimensions: 128 × 128 × 3 (RGB)Testing samples:1000
Normalized dataset:NoTotal samples:10,161
Hyperparameters
Optimizer:AdamLearning rate:0.01
Loss function:Categorical cross-entropyNormalized weights:No
Training epochs:400Softmax at output:No
Regularization:NoOutput format:One-hot
Output size:7
Table 6. Transfer learning models: training summary.
ArchitectureParametersDepthTraining TimeErrorAccuracy
MobileNetV23,538,984880:38:150.69430.9223
DenseNet2120,242,9842016:35:370.30900.9710
VGG16138,357,544233:15:040.39430.8939
XCEPTION22,910,1801263:50:490.22670.9827
Table 7. Summary of results and significance.
AspectSignificance
Sample size100 participants
Central limit theoremSatisfied criteria for statistical validity (p < 0.05)
Demographic insights96% aged 18–25, 92% with college education, 95% unemployed (graduate students), etc.
Transfer learning modelsXCEPTION model achieved top accuracy of 0.9827 (p < 0.001)
Overall findingsPromising potential for effective personalized Ad generation
Table 8. XCEPTION experiment confusion matrix using the Style7 dataset.
Predicted class
CreativeDramaticElegantMagneticNaturalRomanticTraditional
True classCreative180101200
Dramatic09000010
Elegant00782001
Magnetic00060000
Natural040220200
Romantic000101510
Traditional003000221
Table 9. XCEPTION experiment confusion matrices using the Style7 dataset.
True PositiveFalse PositiveFalse NegativeTrue Negative
Creative18004816
Dramatic9051904
Elegant7833916
Magnetic6060934
Natural20226790
Romantic15111847
Traditional22113775
Table 10. XCEPTION experiment evaluation metrics using the Style7 dataset.
AccuracyPrecisionRecallSpecificityF1Weighted F1
Creative0.9961.0000.9781.0000.9890.982
Dramatic0.9940.9470.9890.9940.968
Elegant0.9940.9630.9630.9970.963
Magnetic0.9940.9091.0000.9940.952
Natural0.9920.9900.9710.9970.981
Romantic0.9980.9930.9930.9990.993
Traditional0.9960.9950.9870.9990.991
Table 11. Comparison of the metrics of the best-performing experiments.
ArchitectureMean AccuracyWeighted F1
Style755.93%0.572
ClassEmbedding204861.33%0.623
XCEPTION98.27%0.982
Table 12. Comparison with the state of the art in terms of validation accuracy.
StudyModelDramaticElegantMagnetic
M. Takagi [50]ResNet0.910.720.74
VGG190.790.620.50
XCEPTION0.790.610.50
Inception V30.730.550.39
VGG160.780.580.45
Present studyXCEPTION0.9940.9940.994
Disclaimer/Publisher’s Note: The statements, opinions and data contained in all publications are solely those of the individual author(s) and contributor(s) and not of MDPI and/or the editor(s). MDPI and/or the editor(s) disclaim responsibility for any injury to people or property resulting from any ideas, methods, instructions or products referred to in the content.

