Article

Multi-Objective Optimization of Square Corrugation Multilayer Nested Structures

1
State Key Laboratory of Automotive Simulation and Control, Jilin University, Changchun 130025, China
2
Key Laboratory of High Efficiency and Clean Mechanical Manufacture (Ministry of Education), School of Mechanical Engineering, Shandong University, Jinan 250100, China
3
School of Traffic and Transportation Engineering, Central South University, Changsha 410000, China
4
School of Electrical Information, Changchun Guanghua University, Changchun 130022, China
*
Author to whom correspondence should be addressed.
Appl. Sci. 2023, 13(17), 9750; https://doi.org/10.3390/app13179750
Submission received: 29 May 2023 / Revised: 22 August 2023 / Accepted: 23 August 2023 / Published: 29 August 2023
(This article belongs to the Special Issue New Insights into Vehicle Structural Strength and Dynamics)

Abstract

:
Thin-walled structures, when used for high-speed railways, can effectively mitigate the irreversible destruction when a malfunction occurs. Nested thin-walled tubes, as energy-absorbing structures, possess excellent specific energy absorption (SEA) and crushing force efficiency (CFE). This paper conducts multi-objective optimization by focusing on a square corrugation nested structure with a double octagon inner wall, namely SCOD, to ameliorate the crashworthiness of the nested structure. The finite element model of the SCOD is constructed and validated by test data. A set of experimental design points with good spatial distribution are obtained using the optimal Latin hypercube (LHC) method. The polynomial response surface (PRS) method was applied to establish the fitting relationship between design variables and optimization objectives, and validation is accomplished. The DCNSGA-III algorithm is employed for optimization, resulting in a Pareto alternative solution set with good population diversity and convergence. In addition, to observe the optimized performance, a set of optimal solutions considering a single objective value is derived, and a comprehensive optimal solution is obtained by applying the minimum distance selection method (TMDSM). Finally, the proposed optimized system is analyzed and validated. According to the alternative reference solutions, the initial peak force (IPCF) reduces by 53.75% and CFE increases by 8.7%. This paper provides some reference for the optimization design in practical engineering.

1. Introduction

Rail vehicle safety is a continuous and crucial problem that concerns people with the development of railway technology. For the protection of rail vehicle safety, scientists currently focus on two main aspects, namely active safety protection and passive safety protection, to conduct research [1,2,3].
For the aspect of active safety protection, track life prediction and fault diagnosis can effectively and timely maintain railways, thereby preventing railway accidents [4,5]. In the study of Ngamkhanong et al., the prediction model was established by Artificial Neural Networks (ANNs) to estimate the buckling temperature of complex tracks [6]. A risk analysis method based on fault tree analysis (FTA) was developed by Dindar et al., and this model provides an idea for predicting the risk of railway derailment [7]. In addition, measures such as brake control and warning systems can also improve the active safety protection performance of trains [8,9,10]. However, it is necessary to investigate passive safety protection, which can mitigate collision force and damage suffered during secondary accidents.
For the aspect of passive safety protection, installing guardrails [11], anti-climbing devices [12], couplers [13], and energy-absorbing devices [14,15] can effectively enhance the crashworthiness of the train. Thin-walled energy absorption tubes as energy-absorbing devices are extensively applied to the transportation industry due to extraordinary crashworthiness characteristics [16,17,18]. The thin-walled tubes which are equipped in the front impact zone will first suffer crushing; the reasonable structural design of thin-walled structures can make the crushing process more stable and controllable, thereby protecting the safety of passengers in the survival space. The corrugation configuration was proposed, and researchers confirmed that corrugation tubes have good potential for crashworthiness [19]. Experimental studies have shown that the maximum plastic moment at the corrugation groove can first guide the occurrence of collapse to diminish the peak force [20,21], and corrugation tubes with appropriate amplitude possess ordered progressive mode which contributes to more uniform load fluctuations [22]. Adding rib plates into thin-walled tubes can generate a stable folding pattern and increase the number of corner elements [23,24]. Wang et al. found that the interaction between the foam blocks and the reinforced rib can ameliorate the crash resistance performance [25]. In addition, rib plates can affect significantly the energy absorption capacity and deformation mode [23,26]. Another method is to set up multi-layer structures or subunits within thin-walled tubes [27,28]. The deformation mode usually develops toward a better mode due to the mutual constraints between the inner and outer layers [29,30]. Zhu et al. found that the number of nested layers should not be excessive; otherwise, the comprehensive crushing performance will decrease [31]. Tran et al. indicated that the deformation mode is more controllable due to the resistance effect of the outer tube [32]. The research of Yang et al. showed that the increase in ripple and number of layers will form a more stable and plastic hinge [33]. In addition, optimizing structural parameters based on structural design to obtain the most reasonable parameter scheme is crucial for improving vehicle crashworthiness.
For the aspect of structural parameter optimization, non-dominated sorting genetic algorithm II (NSGA-II) became one of the frequently used optimization methods in various fields due to its convenience and adaptability [21,33,34]. However, as the number of optimization objectives increases, low-dimensional multi-objective optimization algorithms similar to NSGA-II will lose effectiveness, and the NSGA-III algorithm used to solve high-dimensional problems can be applied [3]. In addition, other optimization methods, such as multi-objective particle swarm optimization (MOPSO) and Artificial Neural Networks (ANN), are commonly used for crashworthiness structural optimization. Albak adopted MOPSO to conduct multi-objective optimization for optimal structures selected by the decision-making method [35]. Qiu et al. utilized the MOPSO algorithm to optimize the front rail and multi-cell tube to enhance the crashworthiness of the vehicle [36]. Pirmohammad et al. conducted bi-objective optimization based on the shape of the cross-section by using the ANN algorithm and selected the optimal structure according to the rank results of the technique for ordering preferences by similarity to the ideal solution (TOPSIS) method [37]. However, the general evolutionary algorithm ignores the diversity of the population while pursuing the constraint of satisfaction, resulting in the population being too concentrated in a feasible or infeasible region. Jiao et al. developed a DCNSGA-III by combining dynamic-constrained many-objective optimization problems (CMaOPs) and NSGA-III [38]. This method can enable the population to span large and infeasible regions, and the proposed environment selection operator can select higher-quality solutions. In addition, few researchers have applied this approach to multi-optimization for energy-absorbing structures. Therefore, this paper intends to combine DCNSGA-III to obtain more convergent and diverse non-dominated solutions.
In summary, a nested structure is proposed inspired by the three elements: corrugation, rib plate, and multi-layer structure. In addition, the octagonal wall can absorb more membrane energy with the multi-corner advantage according to previous researchers. The study of Li et al. indicates that square tubes have better deformation resistance potential compared to circular tubes [39]. In this paper, a square corrugation nested tube with a double octagon inner structure (SCOD) is proposed. Distinguishing from previous studies, this research mainly includes three aspects: (1) proposing a novel nested energy-absorbing tube, namely SCOD; (2) developing a multi-objective optimization procedure combining DCNSGA-III algorithm with TMDSM to obtain alternative solutions with better performance; and (3) verifying the effectiveness of the optimization approach proposed and making an evaluation of it.
In this paper, the pattern of organization is described as follows. Section 2 introduces the primordial parameters and finite element modeling of SCOD. Section 3 reveals the methodology and optimization framework. In Section 4, the results of optimization are obtained. In Section 5, discussions and analyses were conducted on the optimization plan. Finally, Section 6 summarizes the entire work.

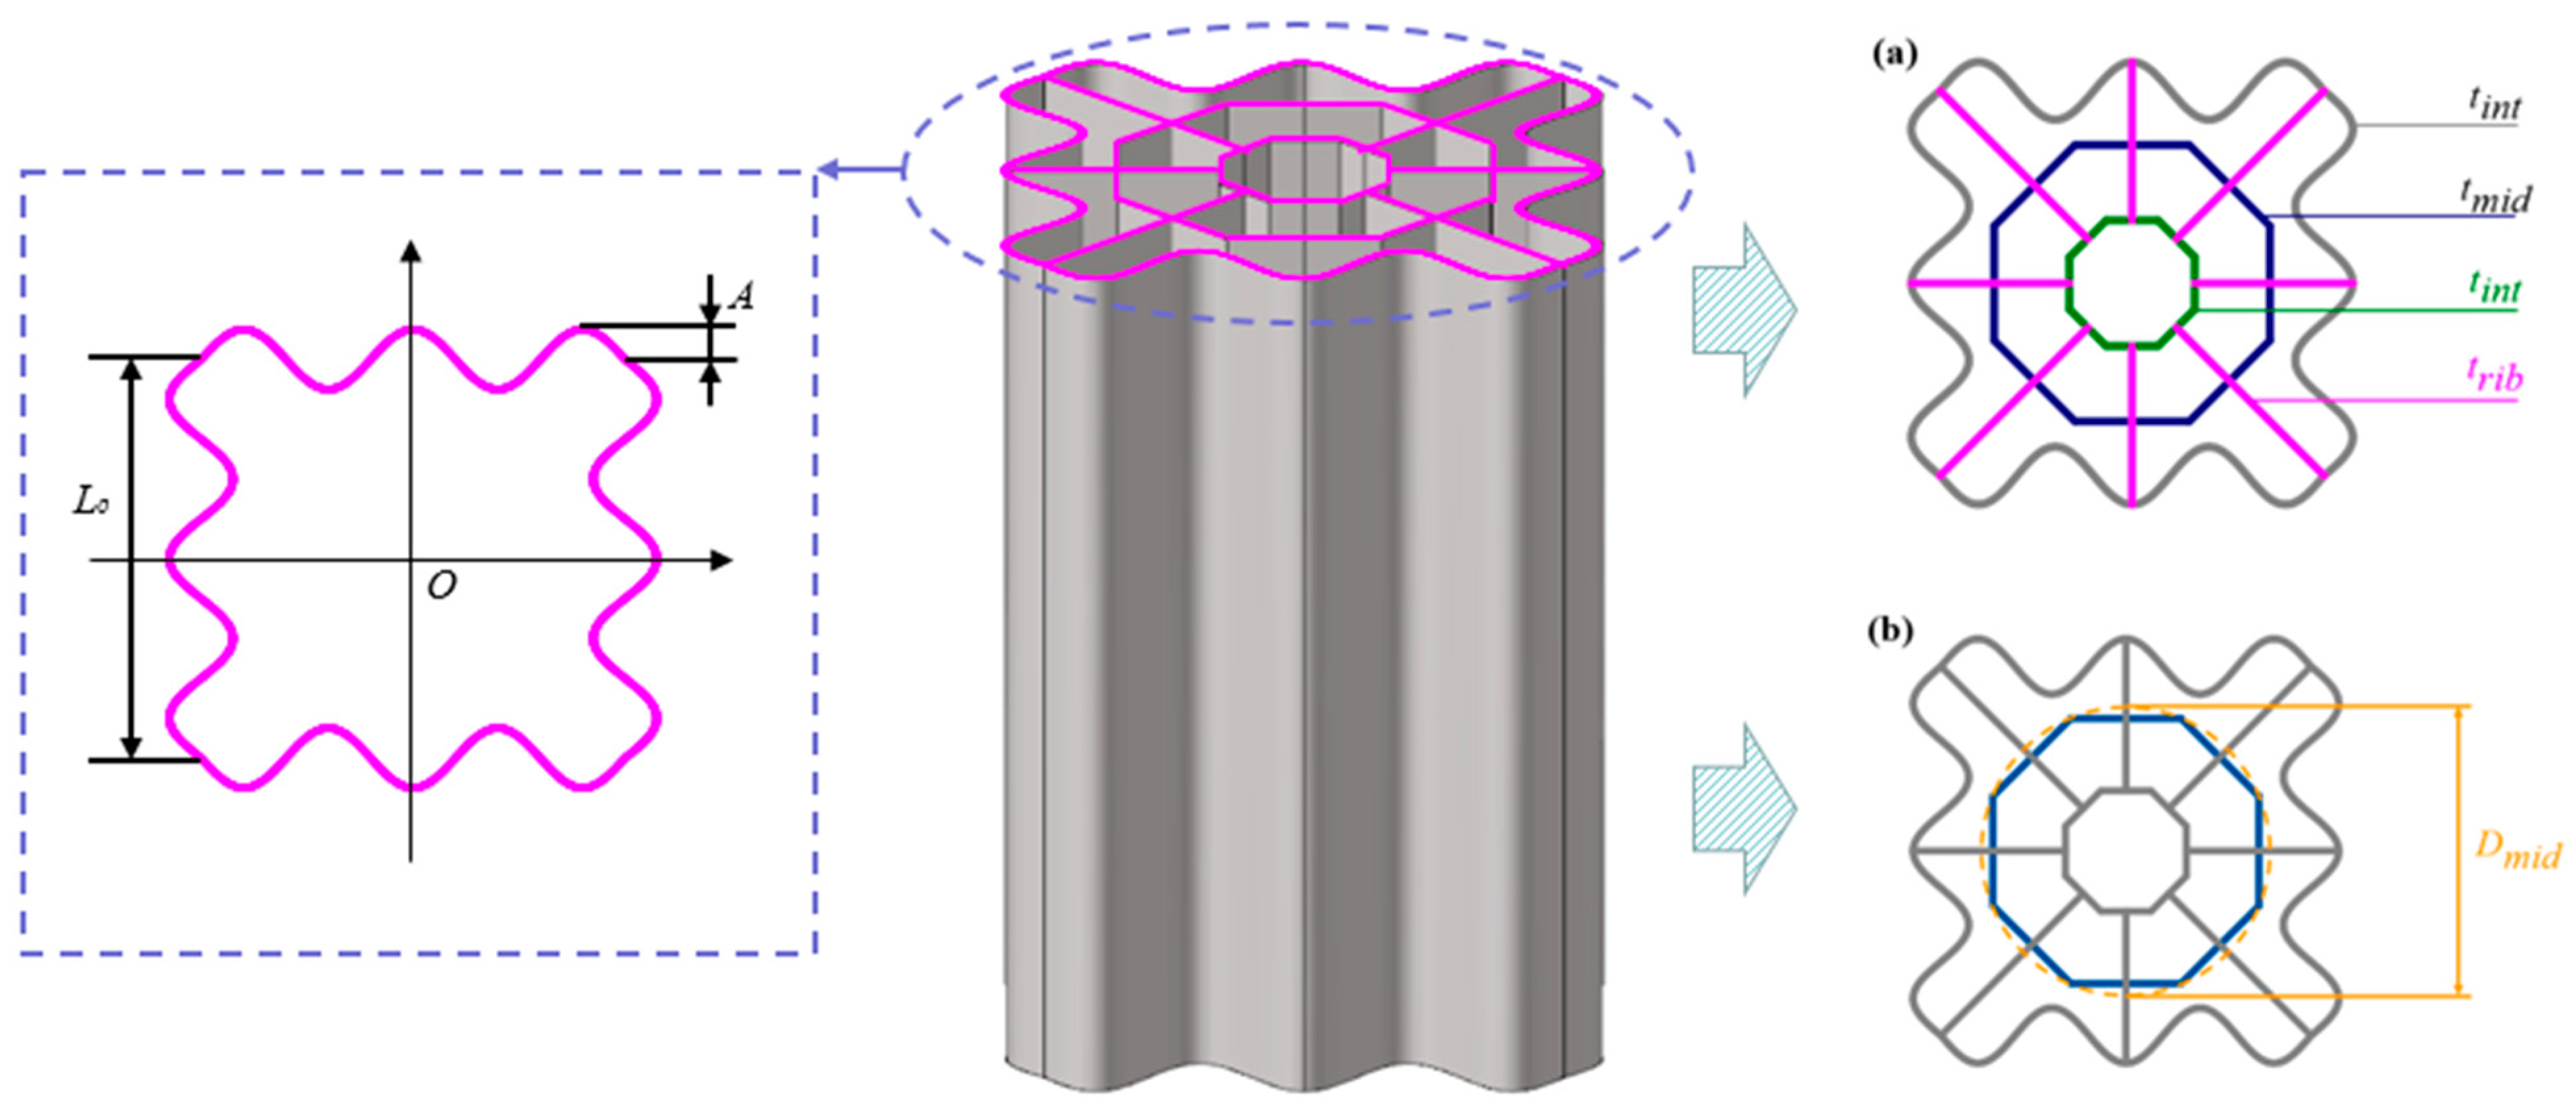
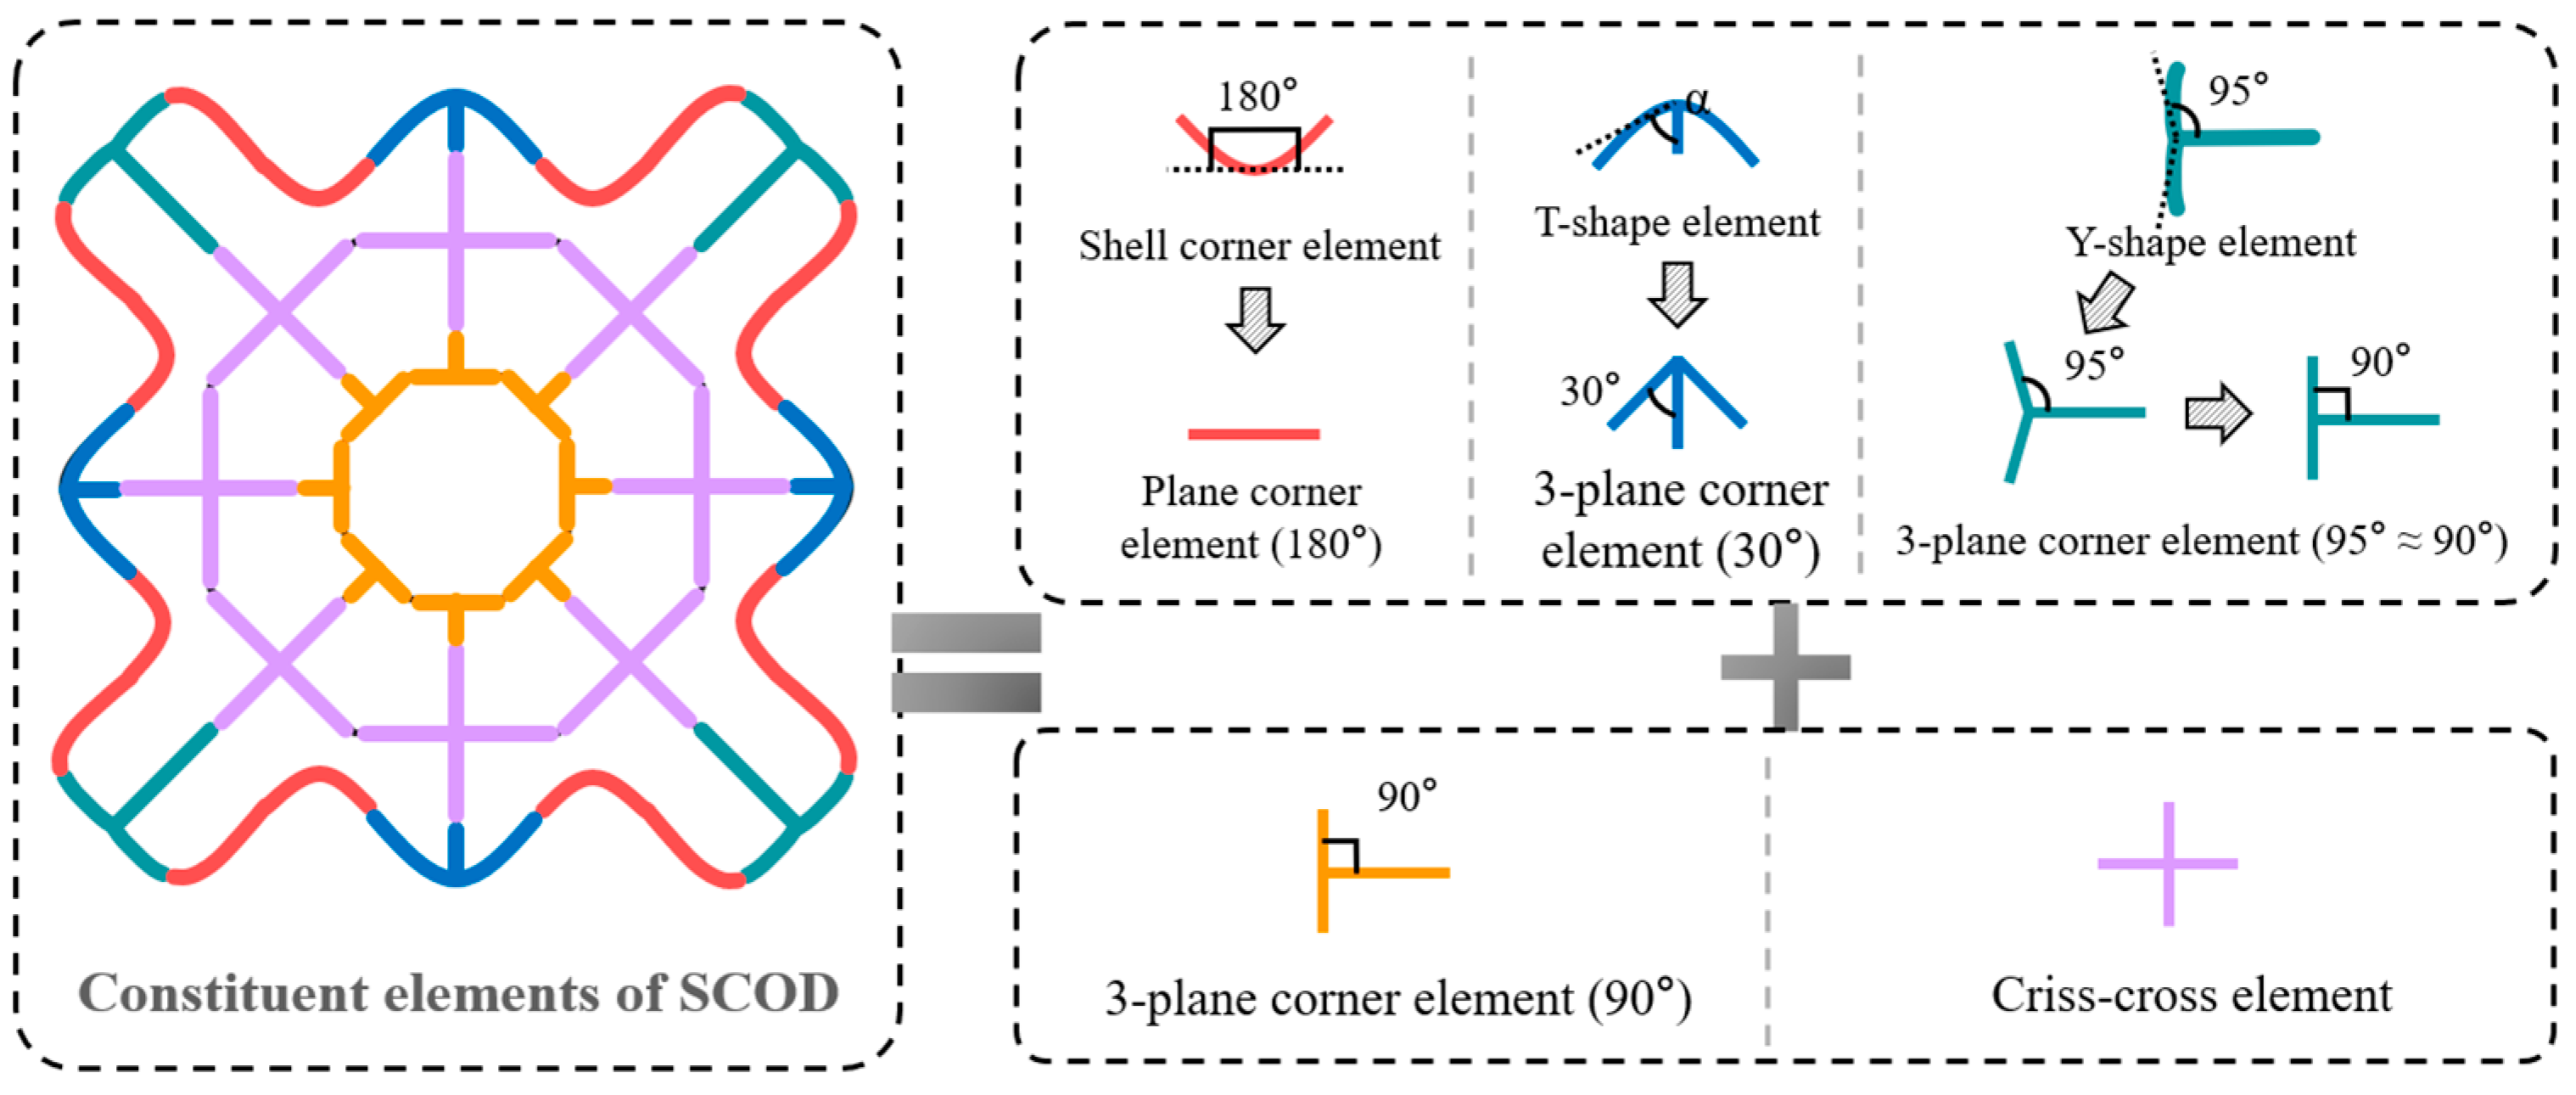
2. The Nested Structure with a Double Octagonal Inner Wall

2.1. The Geometric Parameter of the SCOD Tube

The square corrugation nested tube with a double octagonal inner wall (SCOD) is shown in Figure 1. The SCOD can be divided into four sections, including the outer corrugation wall, the mid-octagon wall, the inner octagon wall, and rib plates. The four different colored lines correspond to the four thickness parameters of the sections.
The design of the outer corrugation wall is based on a square shape with a side length of 40 mm. The corrugation on the four side lines is a cosine curve which can be represented in the Cartesian coordinate system as follows:
y   = A cos 5 L 0 π x + L 0 2 , x [ - L 0 2 , L 0 2 ]
where L0 denotes the length of the side; the parameter A denotes the amplitude of the cosine curve. The initial thickness t of all sections is designed to be 1 mm. To ensure adequate compression distance, the height of the nested tubes is set to 100 mm [40].
Two octagonal sub-thin-walled structures, namely the mid-wall and inner wall, are embedded within the corrugated outer wall. The mid-wall is circumscribed from a circular shape with a diameter of 22√2 mm; The inner wall is circumscribed from a circular shape with a diameter of 10√2 mm. For the design of the size of octagonal sub-thin-walled structures, we refer readers to the study of Albak [35].

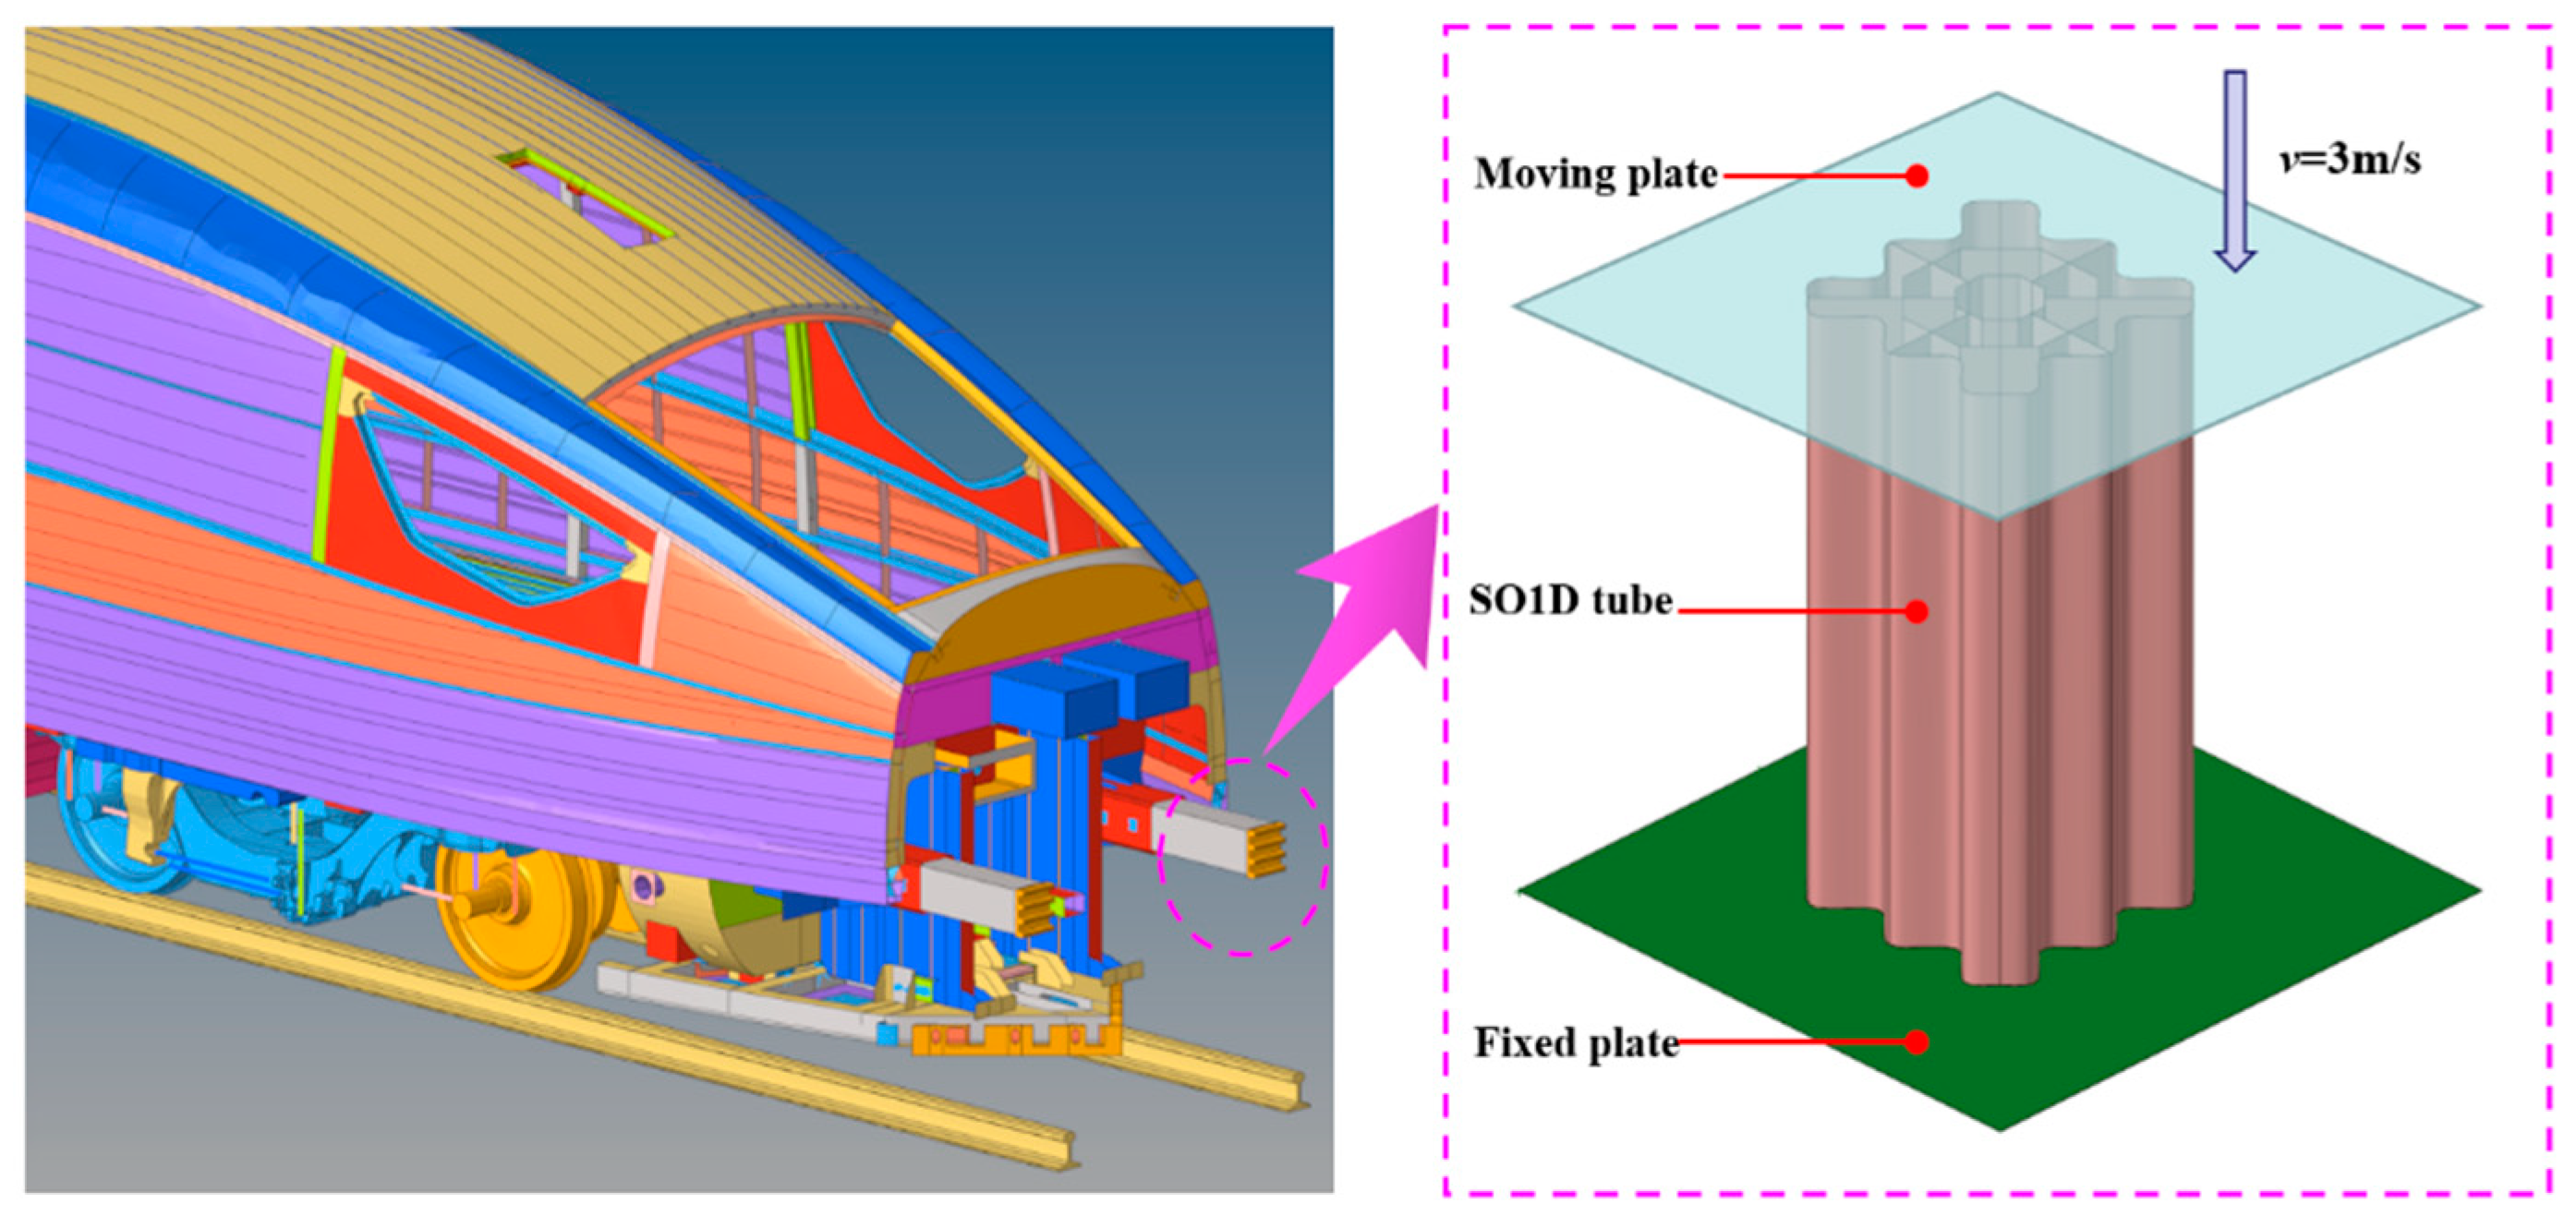
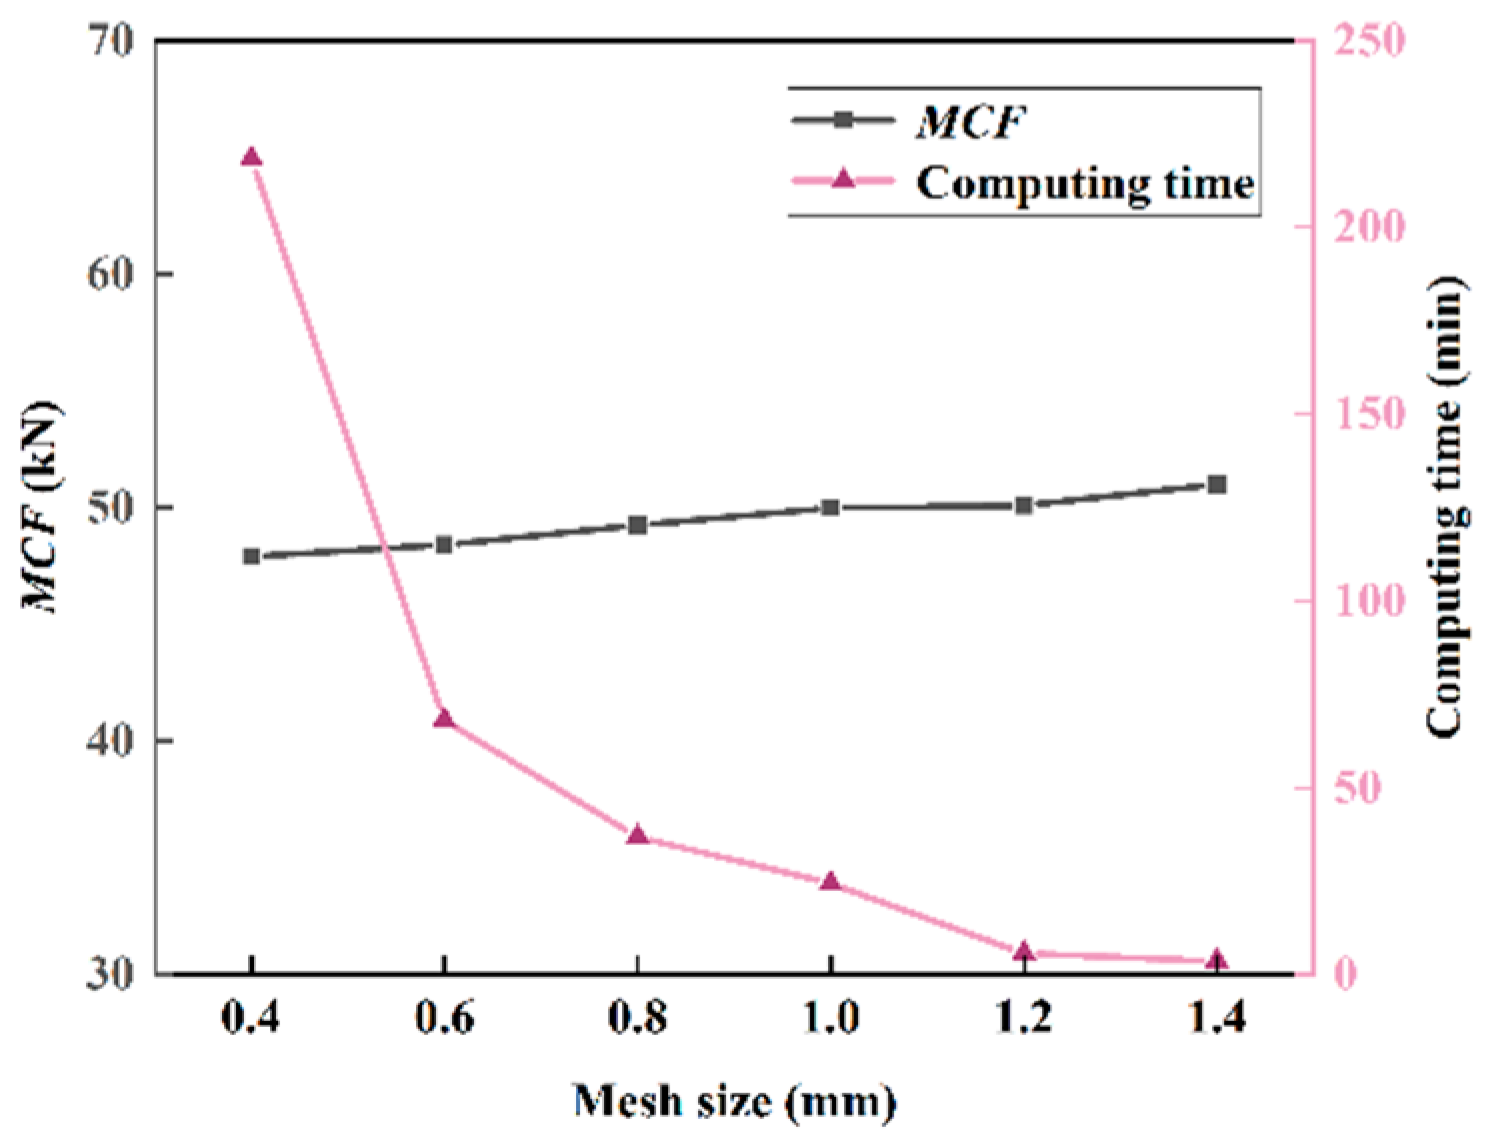
2.2. The Establish of the FE Model

The finite element (FE) method has been proven to have sufficient precision and is often utilized for the crashworthiness analysis of tubes [41]. In this paper, the characteristic is analyzed by using the nonlinear explicit FE analysis program LS_DYNA. The simulation model of SCOD is shown in Figure 2.
From Figure 2, the simulation construction of SCOD can be divided into three components: motional plate, SCOD tube, and stationary plate. To save computational costs, the moving plate imposes a load at a constant speed of 3 m/s [39]. The fixed plate is restricted to six degrees of freedom, and the SCOD tube is placed in the fixed plate. When the moving plate moves at a constant speed, the fixed plate limits the longitudinal displacement of the SCOD in the longitudinal direction to ensure successful crushing. To guarantee that the tube is not crushed and that the endergonic particularity of the model can be observed, the tube is compressed by 60% of its original length, and loading is stopped.
The Belytschko–Tsay shell element with one center integration point and five through-thickness integration points is employed to establish the FE model of SCOD. The convergence analysis of mesh is obtained in Figure 3. As shown in the analysis results, the variation of MCF has a slight change with the increase in mesh size, but the solving time is greatly reduced. To ensure sufficient accuracy and computational efficiency, we decided to adopt the mesh with the size of 1 mm × 1 mm to construct numerical models. Because the plate hardly deforms during the collision which can be regarded as a rigid body, both of the plates are simulated with MAT_RIGID (Mat_20), and all nodes will maintain a constant relative displacement in this condition. The SCOD tubes are simulated with MAT_PIECEWISE_LINEAR_PLASTICITY (Mat_24) which is a model that reflects the elastic–plastic mechanical properties of materials. This type of material has an arbitrary stress–strain curve, and any strain rate dependence can be defined. In addition, the strain rate can be explained by the Cowper-Symonds model. The “AUTOMATIC_NODE_TO_SURFACE” is applied to define the contact between SCOD and the plate, and the dynamic and static friction coefficients are both 0.3. And the “AUTOMATIC_SINGLE_SURFACE” contact algorithm is employed to define the self-contact of the SCOD to avoid the occurrence of a pressure breakdown phenomenon. The dynamic and static friction coefficients of self-contact are both 0.3 as well. The material of the SCOD tube is aluminum alloy AA6061O, and the constitutive model and material characterization are shown in Table 1.

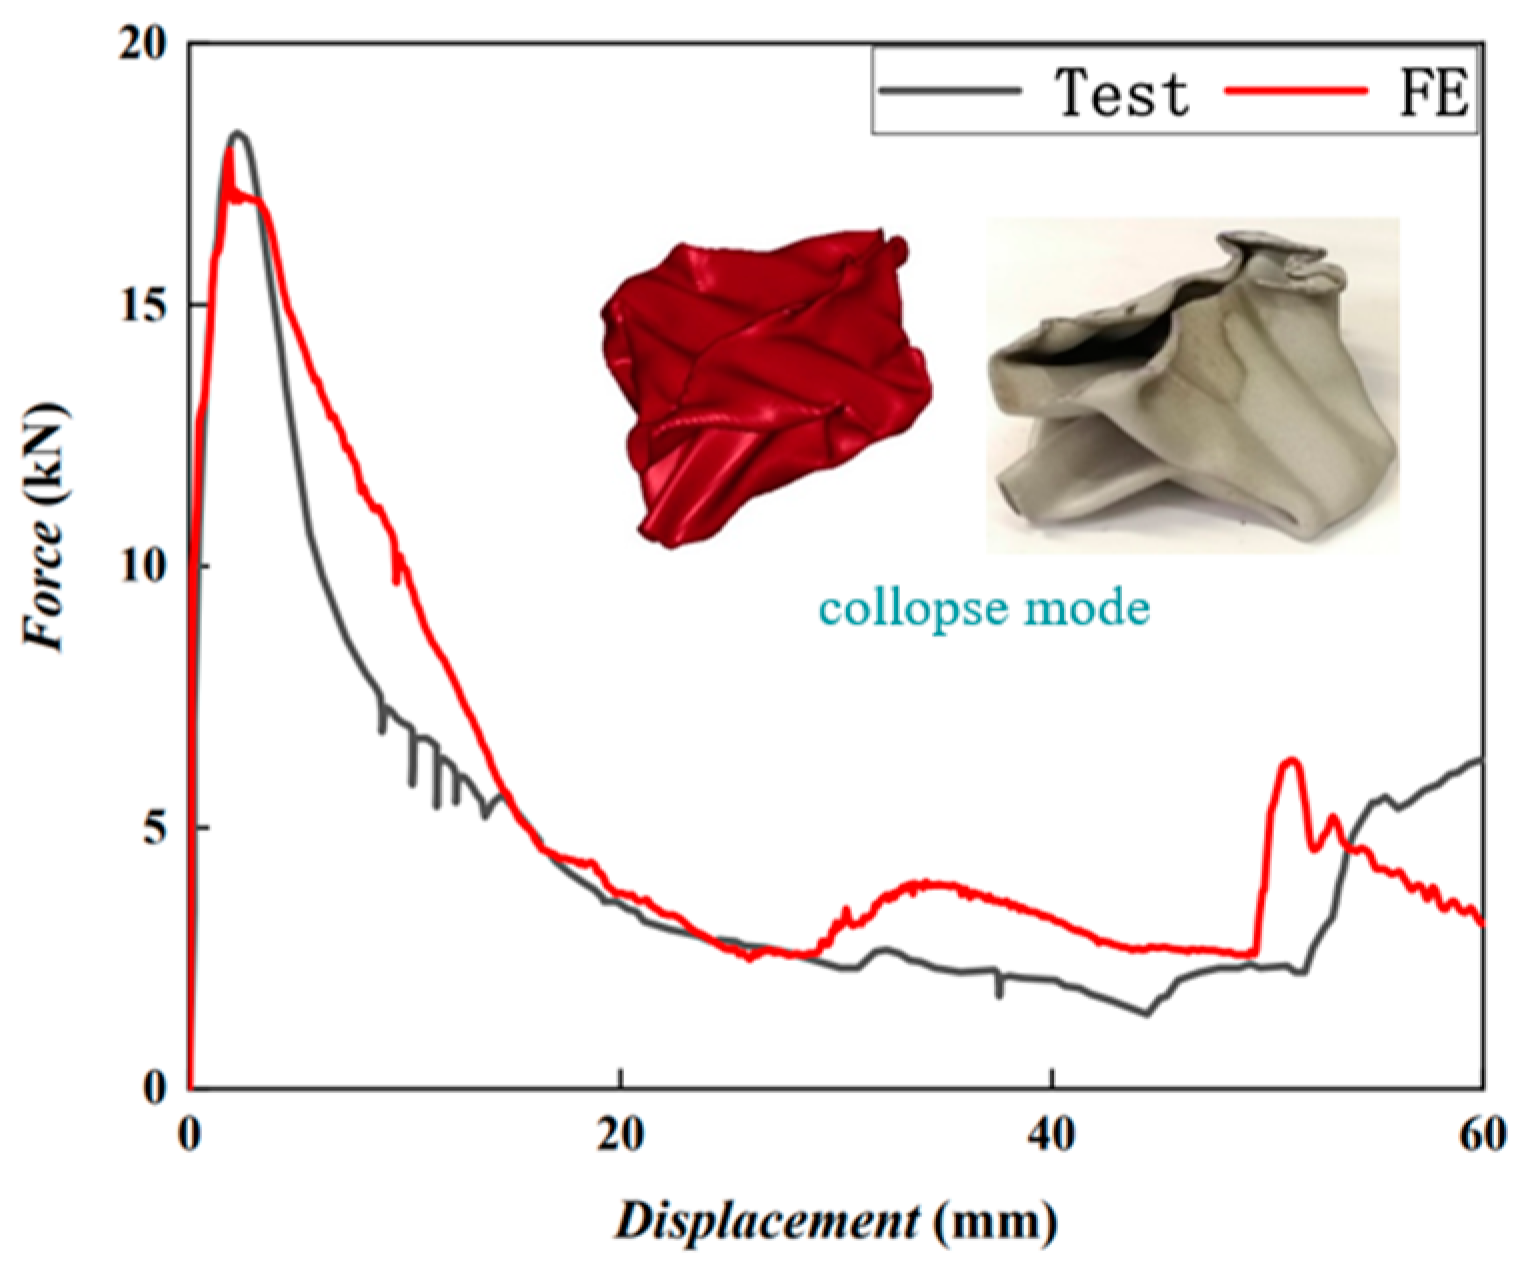
2.3. The Verification of the FE Model

2.3.1. The Experiment Test Based on SC

From Figure 1, it can be easily seen that the SCOD is formed based on the primary cosine outline; therefore, in this study, the square corrugation square tube, namely SC, will be utilized to check the exactitude of the FE simulation. The SC used for verification has a normal side length with 40 mm and an amplitude with 3 mm, which is the same as the geometric parameters of SCOD. The SC was compressed under quasi-static compression by using the test machine MTS Landmark, and the loading speed was set as 2 mm/min. The quasi-static compression test is shown in Figure 4.
The tubes used to test and FE simulation have the same height and thickness, which are 40 mm and 100 mm, respectively. Furthermore, the test and numerical tube have identical material properties. To ensure the consistency of experimental conditions, SC was compressed to 60% of the initial distance in both the testing machine and the finite element numerical simulation. In addition, the collapse modes and force–displacement of SC under an experiment test and FE simulation are compared in Figure 5.
From Figure 5, the tendency of force change over time of SC under test and numerical simulation coincide in principle, and the deformation modes are accordant. In addition, the crashworthiness indexes obtained by experiment and FE modeling are displayed in Table 2.
From Table 2, the IPCF of the test and FE model are 18.34 kN and 17.95 kN, respectively, which are in reasonable agreement. It is obvious that the error between the test and FE modeling is less than 2.5%, which also indicates that the FE numerical simulation has adequate accuracy.

2.3.2. The Mathematical Model Based on SCOD

Based on the Simplified Super Folding Element (SSFE) theory, a mathematical model is proposed to predict the mean crushing force (MCF) of SCOD [42,43,44]. During the collision, the energy balance equation of SCOD can be obtained as shown in Equation (2):
F m 2 H k = E b + E m
where Fm is MCF; Eb and Em are the bending energy and membrane energy, which are primary forms of energy dissipation; 2H represents the wavelengths of the fold; and k is the effective compression factor, which is 0.7 in this paper [45].
A.
The prediction of Eb.
The bending energy can be calculated as follows [46]:
E b = 2 π M 0 L c
where Lc is the perimeter of the cross-section, and M0 is the full plastic bending moment per unit length, which can be obtained as Equation (4):
M 0 = 1 4 σ 0 t 2
where t is the thickness of the wall and σ0 is the flow stress of the structural material:
σ 0 = 0.92 σ u
B.
The prediction of Em.
According to SSFE, the SCOD can be divided into several constituent elements in order to analyze theoretically the Em,, and then the constituent elements will be simplified [40,46]. The constituent elements of SCOD are defined as five types, including the shell corner element, T-shape element, Y-shape element, 3-plane corner element, and criss-cross element. The specific situation is shown in Figure 6.
As shown as Figure 6, the shell corner element can be simplified as a plane corner element (180°) [47]:
E m c o r n e r   e l e m e n t = 4 M 0 H 2 t t a n ( θ / 2 ) ( tan θ / 2 + 0.05 / t a n ( θ / 2 ) ) / 1.1 = 4.4 M 0 H 2 t
where θ = 180°.
The T-shape element is equivalent to the three-plane corner element (30°) [35], which can be obtained by Equation (7):
E m T s h a p e   e l e m e n t = 4 M 0 H 2 t t a n ( α ) tan α + 0.05 / t a n ( α ) / 1.1 + 2 t a n ( α 2 ) = 5.31 M 0 H 2 t
The Y-shape element can be regarded as the three-plane corner element with the α = 90° [47,48], which can be obtained by Equation (8):
E m Y s h p a e   e l e m e n t = 4 M 0 H 2 t t a n ( α ) tan α + 0.05 / t a n ( α ) / 1.1 + 2 t a n ( α 2 ) = 12.4 M 0 H 2 t
The Em of the criss-cross element is [42]:
E m c r i s s c r o s s = 16 M 0 H 2 t
As mentioned above, the total membrane energy can be summarized as:
E m S C O D = N c _ e · 4.4 M 0 H 2 t + N T s e · 5.31 M 0 H 2 t + N Y s e · 12.4 M 0 H 2 t + 8 12.4 M 0 H 2 t + 8 16 M 0 H 2 t
C.
The prediction of MCF.
By uniting Equations (2), (3) and (10), the predicted MCF of the SCOD can be expressed as:
F m S C O D = 2 π M 0 L c + E m S C O D 2 H
In addition, parameter H can be calculated by:
H = F m H
By calculating Formulas (11) and (12), FmSCOD can be solved, and the results predicted by the mathematical model are compared with the FE model, as shown in Table 3.
In terms of Table 3, the relative error between the FE model and the mathematical model is 2.24%, which indicates that FE modeling satisfies the accuracy requirements and can be employed in further study.

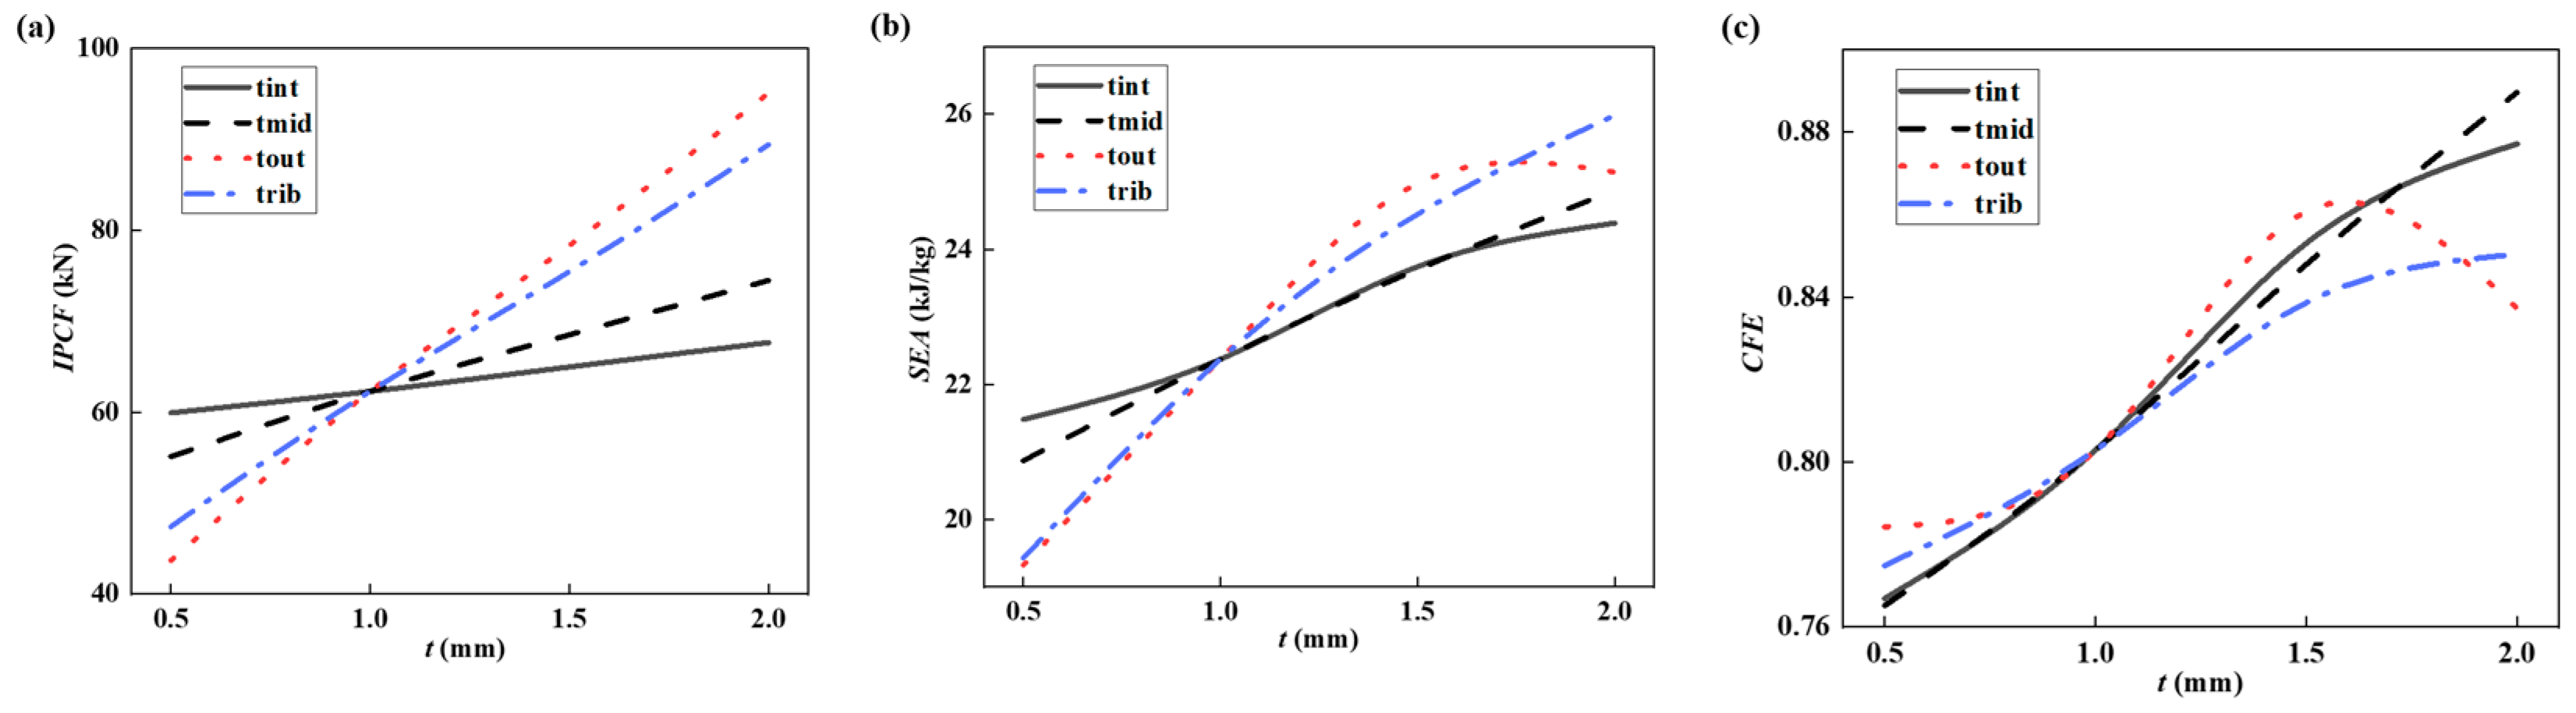
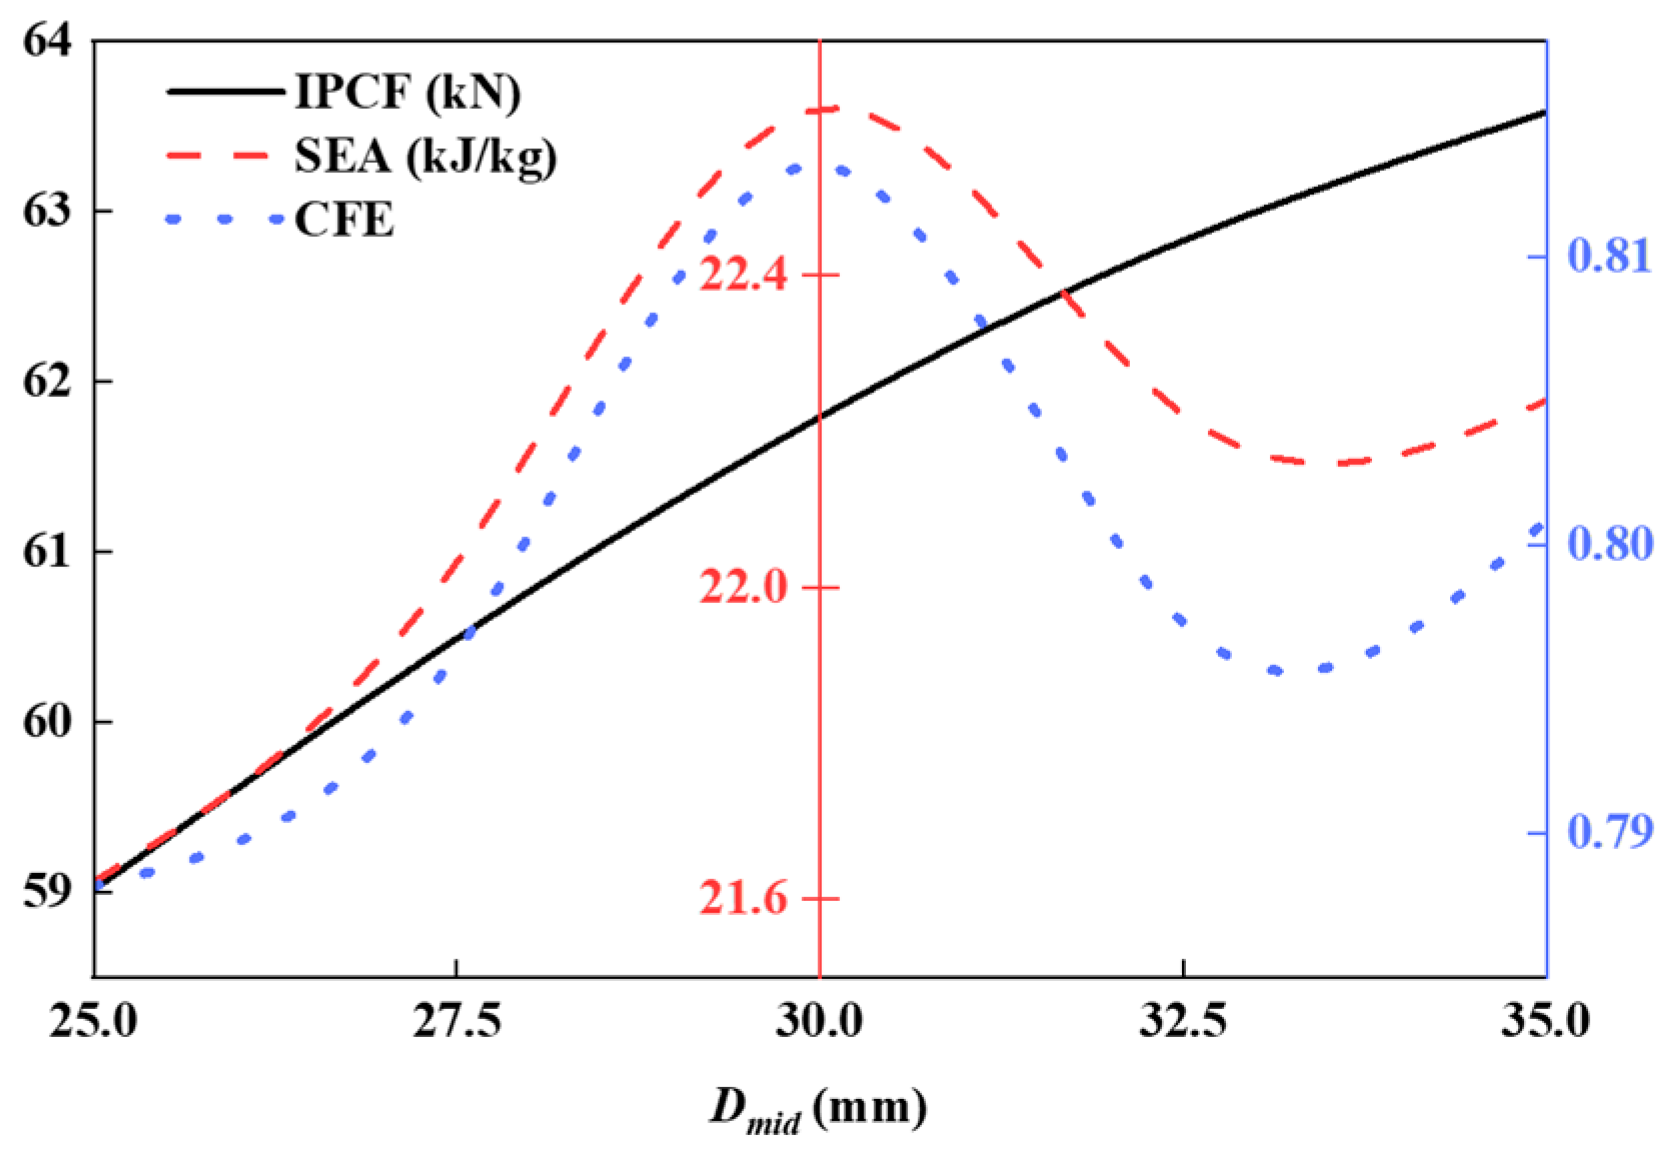
2.4. The Sensitivity Analysis of SCOD

To investigate the effect of structural parameters of SCOD on energy-absorbing performance, the sensitivity analyses are conducted in this section, which is shown in Figure 7 and Figure 8.
According to Figure 7, with the increase in thickness tint, tmid, tout, and trib, the three crashworthiness indicators, namely IPCF, SEA, and CFE, all show an upward trend. It can be concluded that the wall thickness of the SCOD and IPCF basically exhibit a linear function relationship. Among the four parameters related to thickness, tout has the greatest impact on peak force, while tint has the smallest impact. For the sensitivity on SEA, as the thickness of the outer wall increases, the values will sacrifice slowly. In addition, when the thickness varies within the range of 1.5~2.0 mm, CFE exhibits the most drastic change.
As shown in Figure 8, IPCF always rises monotonically. When Dmid changes within the range of 25~35 mm, both the SEA and CFE values first increase and then decrease, and the peak appears around Dmid = 30 mm.

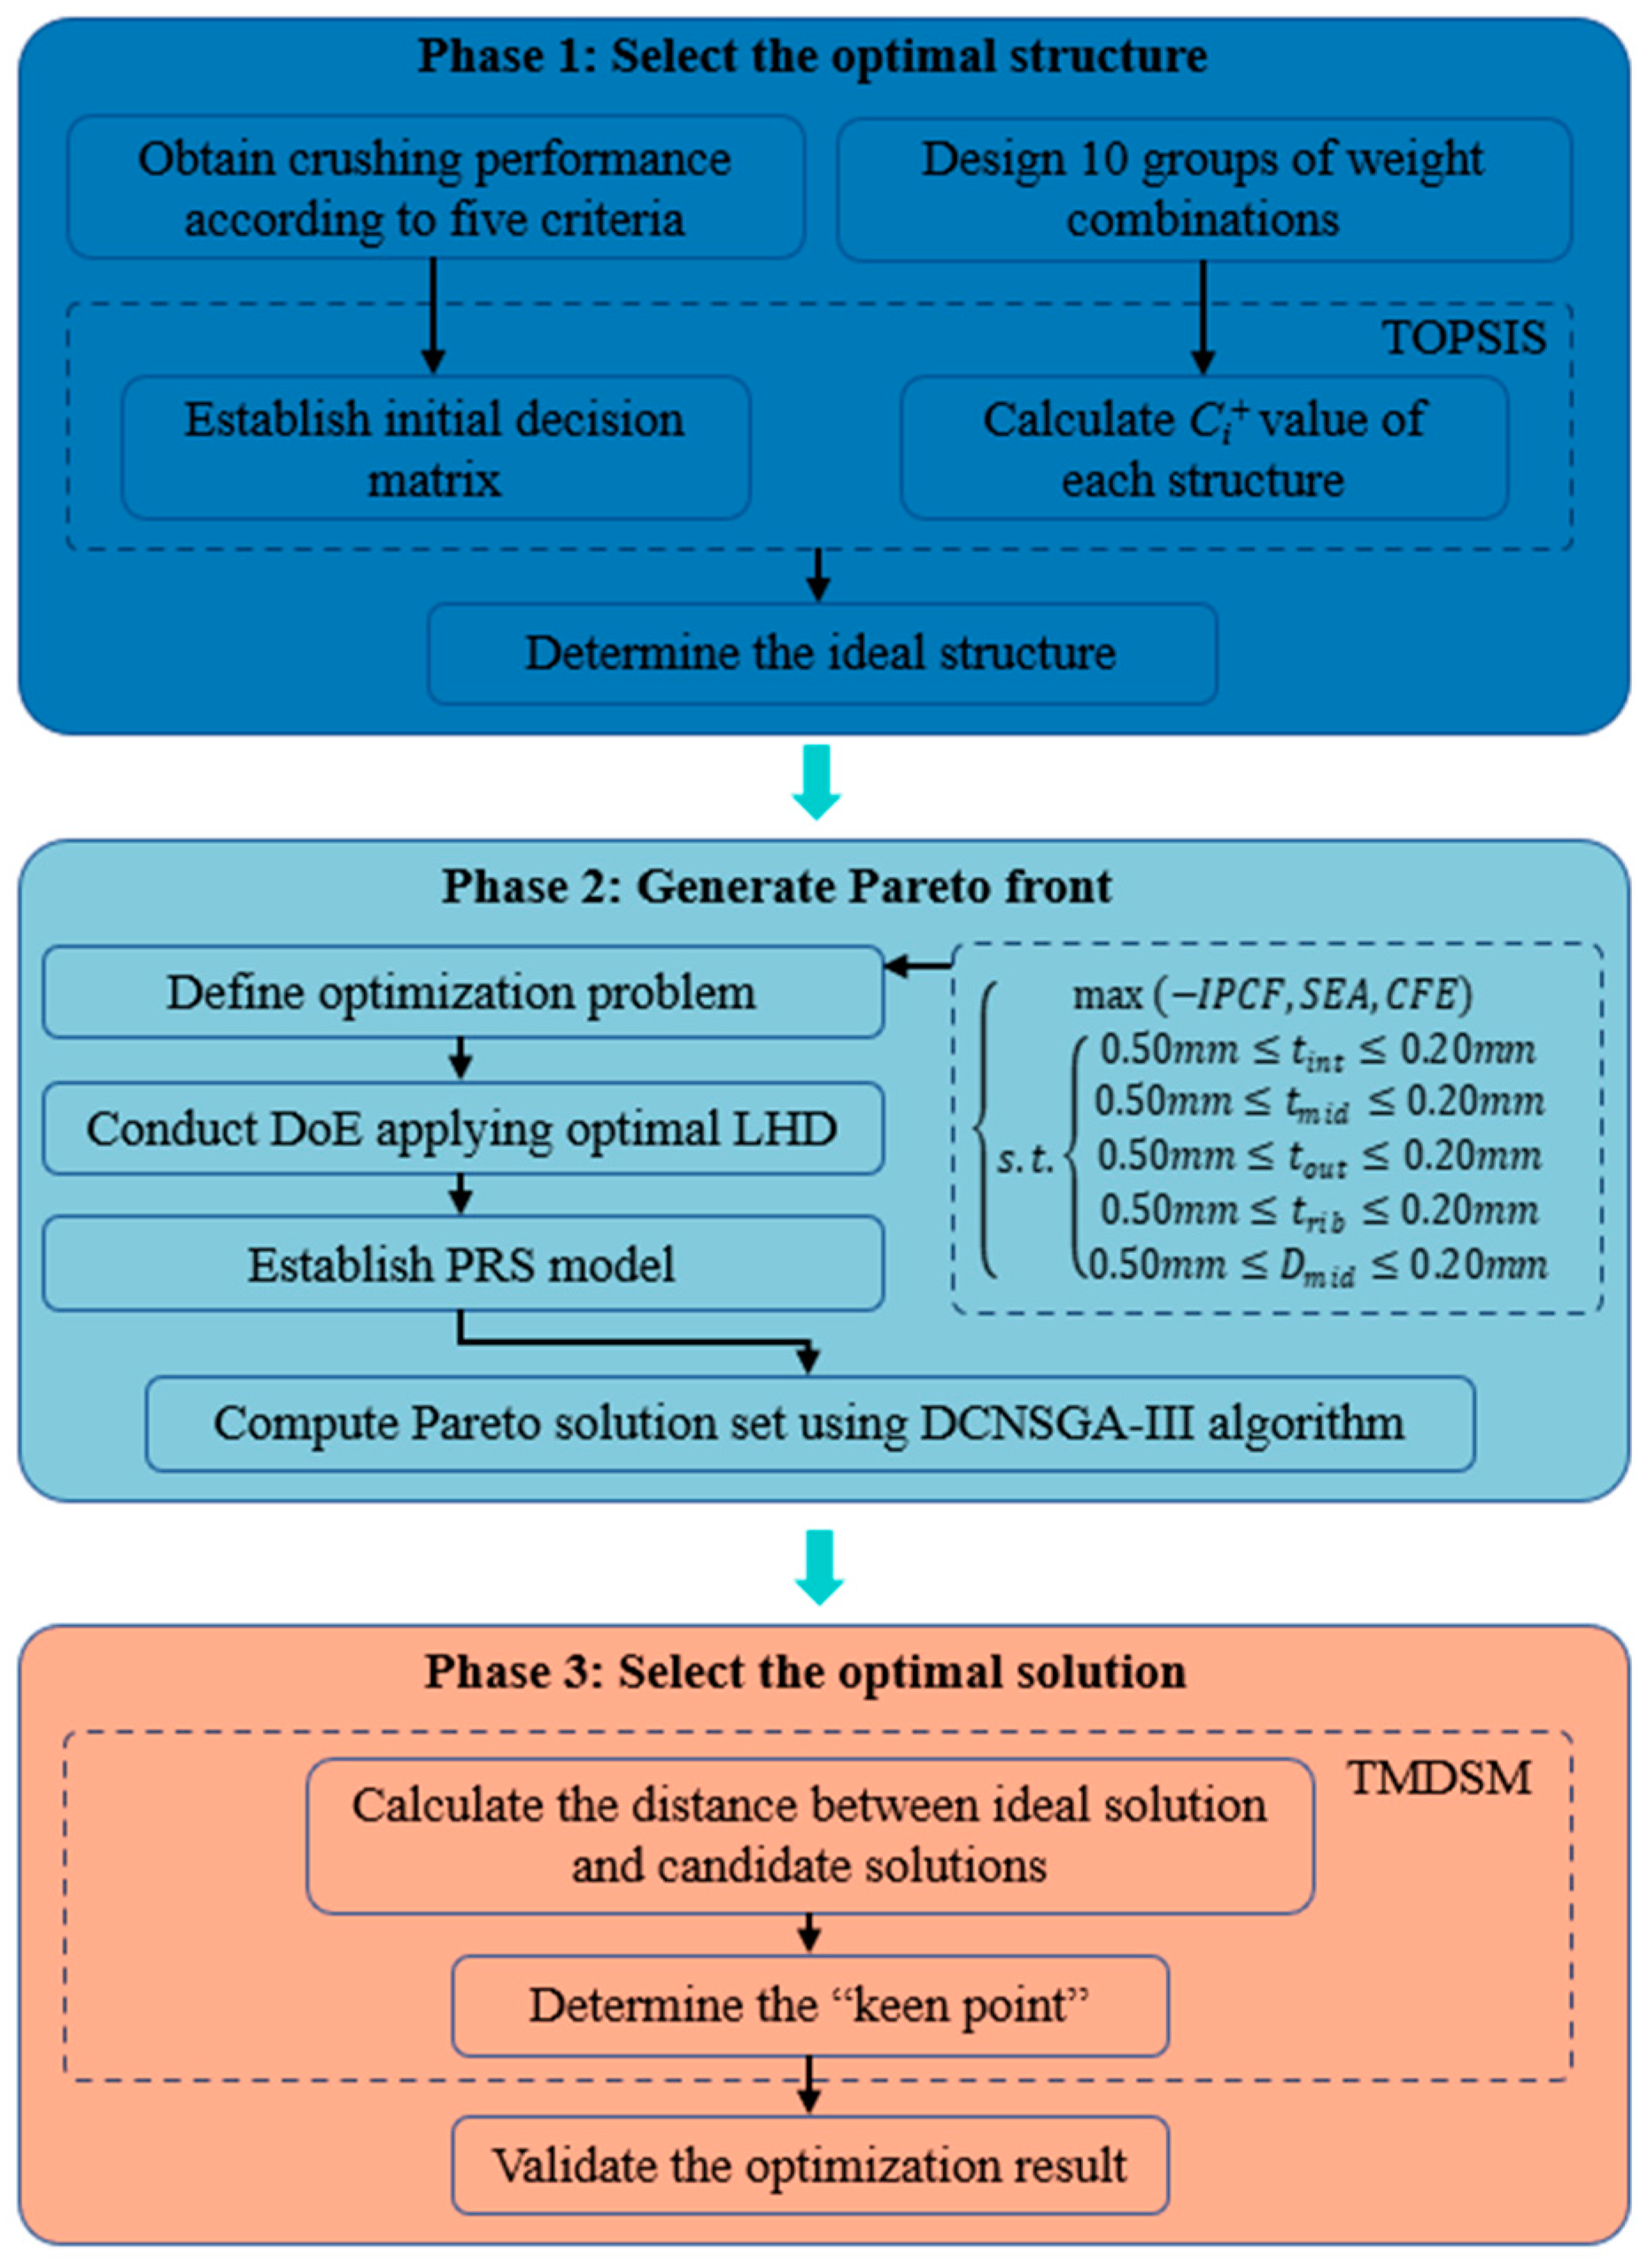
3. The Methodology of Multi-Objective Optimization

3.1. The Surrogate Model

3.1.1. Design of Experiments (DoE)

Establishing a surrogate model is regarded as an efficient method to handle complex multi-objective optimization problems (MOOPs), which can save cost and calculation time, and it has been applied extensively in the multi-objective optimization of endergonic tubes [49,50]. The DoE method is a primary and indispensable step to establish an accurate surrogate model, which is also an approach to reflect integral design space by training minimum points [51]. According to existing studies, the DoE generally consists of a Latin hypercube design (LHD) [48], optimal LHD [52], full factorial design, orthogonal arrays, central composite design, and Modified Extensible Lattice Sequence (MELS) [28]. During optimization, the optimal LHD approach is adopted to conduct DoE. This method not only reserves excellent projective properties but also ameliorates the space-filling properties by combining novel indexes combining the Kullback–Leibler information [53,54]. It has been concluded that the optimal LHC method maintains robustness as the criteria vary and is adequate to the requirement of changes in design parameters [55].

3.1.2. The Establish of Surrogate Model

The MOOP of crashworthiness requires extensive FE simulation or experiments. To conserve costs, proxy models are developed and used to express the response correlation between design variables and optimization goals regarded [56,57]. The commonly used approaches to establish a surrogate model include the polynomial response surface (PRS) [58], kriging [51] and radial basis function (RBF) [21]. As a useful method, the PRS has been proven to be credible and efficient when dealing with small group issues with noise data and a non-massive DoE sample scale [55]. Therefore, the PRS establishes a surrogate model in this paper. The core idea of the PRS is fabricating nonlinear polynomials by fitting simple points to express approximately objective responses in the entire design space. The polynomial usually is expressed as follows:
y x = α T · f x = j = 1 M α j · f j x  
where αj (j = 1, 2, …, M) in vector α represents the j-th unknown coefficient of the j-th basis function fj(x). M represents the quantity of basis functions; c represents the coefficients of each basis function by using the multiple regression method of least squares.
In addition to satisfying the requirements of the polynomial degree, four criteria for evaluating the precision of the fitting results, maximum value (MAX), mean relative error (MRE), root mean square error (RMSE) and the square value (R2) are proposed [52]. The formula for the four indicators is depicted as follows:
M A X = m a x ( y 1 y 1 ^ , y 2 y 2 ^ , , y n y n ^ ) 1 n 1 i = 1 n ( y i y i ^ )
M R E = i = 1 n | y i y i ^ | n × 1 n 1 i = 1 n ( y i y i ^ )
R M S E = 1 n i = 1 n ( y i y i ^ ) 2
R 2 = 1 i = 1 n ( y i y i ^ ) 2 i = 1 n ( y i y i ¯ ) 2

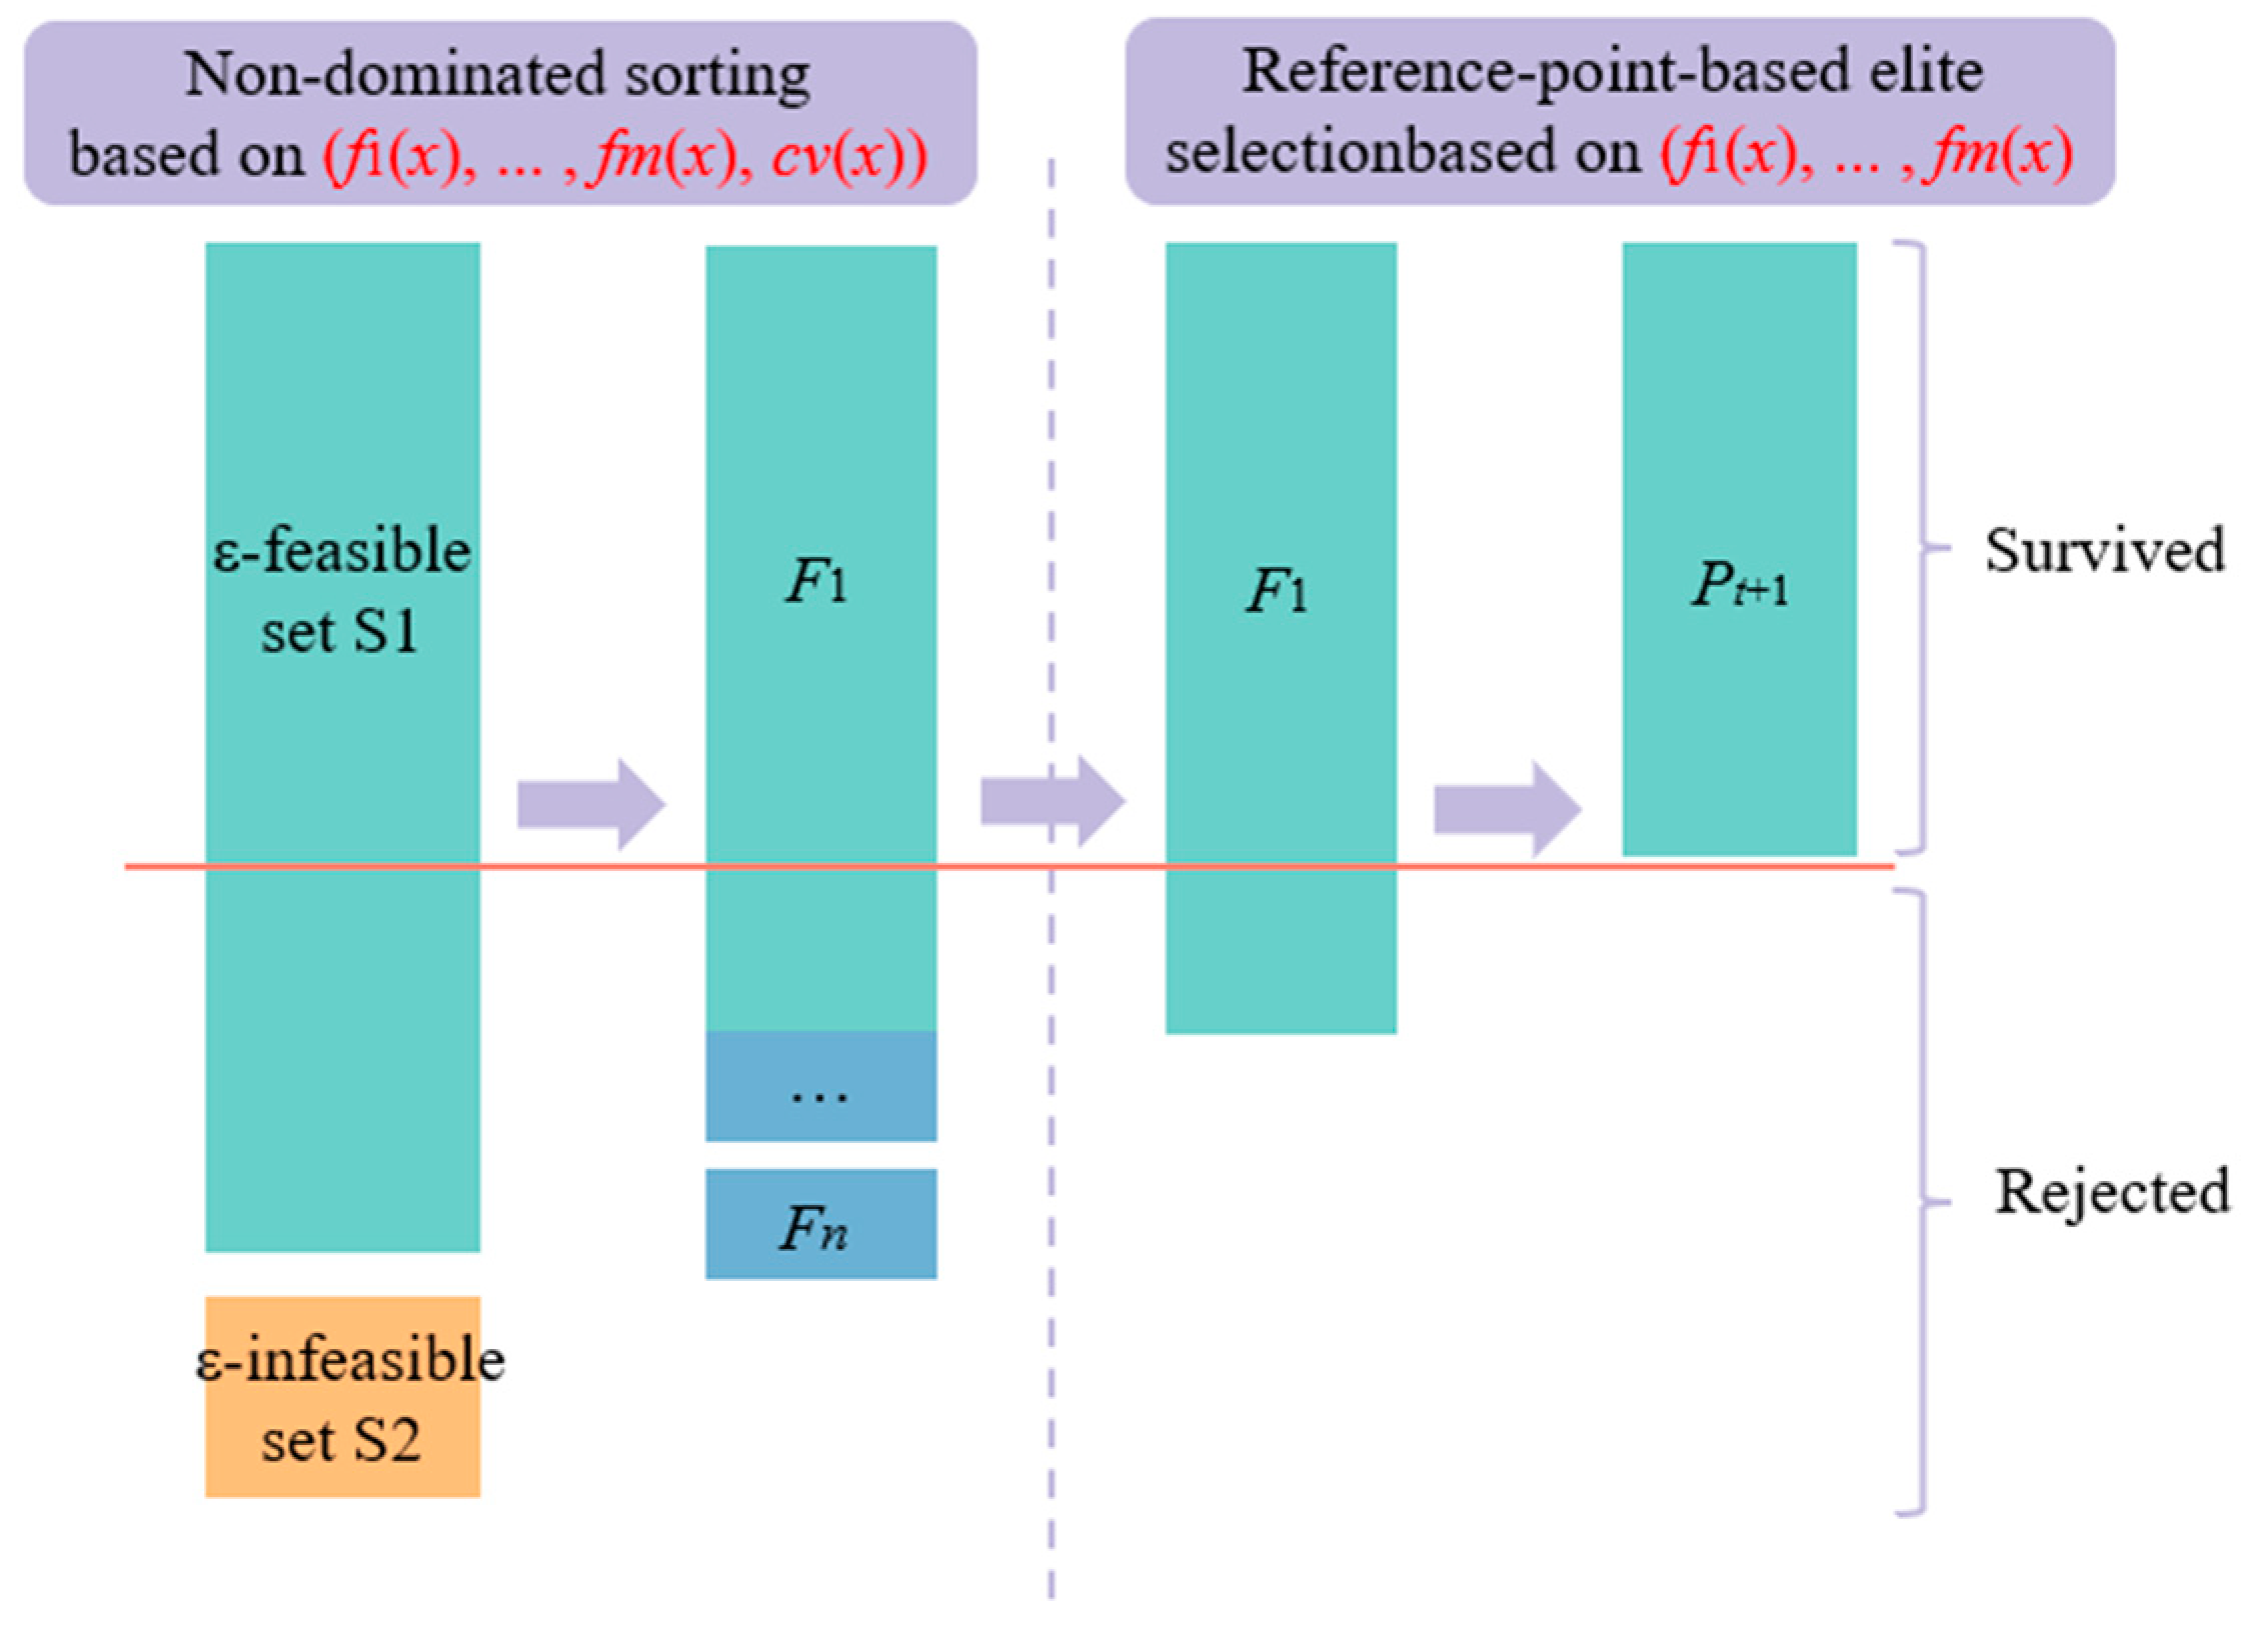
3.2. The DCNSGA-III Algorithm

According to Jiao et al. [38], the DCNSGA-III method is proposed, which is created by employing reference-point-based NSGA-III to resolve constrained multi-objective optimization problems (CMaOPs). The NSGA-III method is advantageous to handle constraints and optimize objectives concurrently, which can make a CMaOP dynamic [59]. The DCNSGA-III method performs great competitiveness compared with other sophisticated CMaOEAs and is competent for solving CMaOPs. The general process of DCNSGA-III is described as follows.
A.
Generate CMaOP framework.
The DCNSGA-III, which integrates widely used NSGA-III and a problem conversion means, is applied to resolve CMaOP. Algorithm 1 displays the trunk of how the DCNSGA-III solves the CMaOP.
Algorithm 1: The DCNSGA-III to solve the framework of CMaOP
1 Search incipient population P0;
2Form the incipient relaxed constrained margin δ = δ(0), and make the iteration state t = 0;
3while the termination requirement is not satisfied do
4 Shrink the boundary: δ = δ(t + 1);
5 Renew population δ-feasibility, t = t + 1;
6 Obtain the offspring population Ot in terms of Algorithm 2;
7 Renew the parent population Pt+1 in terms of Algorithm 3;
8end
9return non-dominated solutions.
At the beginning of the framework, the population P0 is generated randomly by DCNSGA-III from unitary search space X. The non-constraint degree of every solution is computed subsequently, and the maximal non-constraint degree is regarded as the incipient constraint bounds δ. Thus, any solution in population P0 is δ-feasible. In subsequent iterations, the constraint bounds will decrease over the evolution of the population. In addition, a modified mating and environment selection mechanism is utilized to obtain highly qualified δ-feasible solutions.
B.
Select mating parents.
It is inevitable that δ-infeasible solutions are generated. In this connection, a binary tournament selection is employed to generate the offspring operator, which picks two individuals from Pt. To be specific, the tournament selection intends to select an δ-feasible solution instead of an δ-infeasible solution or an δ-infeasible with a minor non-constraint level instead of an δ-infeasible with a major non-constraint level so that more δ-feasible offspring solutions are obtained. Algorithm 2 describes the main procedure of tournament selection.
Applsci 13 09750 i001
C.
Update the parent population
For t generation, the coalition of parent and offspring population is classified into two sets, the δ-feasible set S1 = {xUtg(x) ≤ δ(t)} and δ-infeasible set S2 = {xUtgj(x) > δj(t), j ∈ {1, …, q}}. This process is discussed in Algorithm 3.
Applsci 13 09750 i002
To screen for more feasible solutions, the following two scenarios were considered:
Case 1. When │S1│ ≥ N, the non-dominated ranking and prime selection based on the reference point will proceed to choose N solutions from S1, and then, the N solutions will be appended to Pt + 1.
Case 2. When │S1│ < N, there are still blank elements in Pt + 1, after the solutions S1 are introduced. The N-S1 rest of the solutions are selected from δ-infeasible set S2. Therefore, the solutions in S2 are sorted in terms of the non-constraint level, and we append the top N − │S1│ solutions inside the ranked S2 into Pt + 1.
D.
Non-dominated ranking based on reference point method.
When the case │S1│ ≥ N occurs, non-dominated ranking based on a reference point will proceed as the environmental selection. Figure 9 displays the environmental selection of DCNSGA-III, which contains two parts: (1) the non-dominated ranking aims to obtain non-dominated solutions inside the δ-feasible set S1 to approach its PF; (2) the prime selection based on a reference point aims to retain the population multiplicity through providing a group of reference points with good spatial distribution characteristics.
As shown in Figure 9, the first section is that the non-dominated ranking given m + 1 objectives: (f1(x), …, fm(x), cv(x)) is employed to classify into different non-dominated levels (F1, F2, …) and select prime solutions which have higher objective values and lower non-constraint levels. This approach helps to optimize goals and handle constraints simultaneously.
In the second section, an interception approach is employed to intercept the optimal N solutions. The optimal k levels are determined, and k denotes the maximum which satisfies │F1F2 ∪…∪ Fk│ < N. The k + 1 solutions │F1F2 ∪…∪ FkFk + 1│ − N are determined in terms of the admixture of solutions and the pre-defined reference points, which is depicted in Algorithm 4. In addition, the non-constraint objective will not be referred for the normalization of targets and the associated employment. The phenomenon is because infeasible solutions which have lower non-constraint levels are selected during the non-dominated ranking. The purpose of the selection based on a reference point is to pick solutions that are close to the basis edge so that all reference points maintain the great distributed feature of solutions. Otherwise, the solution will erratically distribute within the target space.
E.
Evaluate computational complicacy.
It can be observed that the DCNSGA-III method does not requires a very large amount of calculation. The additional complicacy of computational time is reflected in the non-dominated ranking in O((m + 1) N2), and m denotes the targets quantity. Since the complicacy of the original NSGA-III is O(mN2), the extra complicacy of the computational time this approach brings is tolerable.
Applsci 13 09750 i003

3.3. The Minimum Distance Selection Method (TMDSM)

Through the above optimization method, the Pareto optimal front is obtained so that the designer can consult and make a determination according to the amount of candidate solutions. For all that, sifting the most satisfactory individual solution is essential to evaluate the final optimization result [60]. The most commonly used methods for determining the optimal solution include the weight decision-making method and the minimum distance selection method (TMDSM). The former assigns weights to the optimization objectives based on their relative importance and determines the optimal solution. However, considering different actual operating conditions and preferences, it is difficult to determine appropriate weights [61]. In this paper, TMDSM, which searches the “keen point” by calculating the distance between the ideal solution and each candidate solution, is applied to conduct the selection of the optimal solution. The formulation below exhibits the principle of TMDSM:
min D = τ = 1 K ( f c τ min f τ x ) 2
where D is the distance between the ideal solution and the “keen point”. And K denotes the quantity of the objective elements; f represents τ-th objective value corresponding to the c-th Pareto solution.

3.4. The Framework of the Optimization Process

In the previous study, the TOPSIS method combining multiple operating conditions is employed to determine the ideal structures from 20 nested structures proposed in order to consider comprehensively the preference of experts for various performances. To obtain the most satisfactory alternative, the DCNSGA-III method is referred to handle the multi-objective optimization issue. Therefore, the entire process combines the theories of multi-attribute decision-making (MADM) and multi-objective optimization, which can be accomplished by the following frame shown in Figure 10.
As shown in Figure 10, the optimization is roughly divided into three phases:
Phase 1: The final scores of the crashworthiness criteria of each structure proposed are recorded through numerical simulation. And then, the TOPSIS based on 10 groups of weight is applied to determine the ideal structure.
Phase 2: The optimization problem is defined, and the optimal LHC is selected to conduct DoE. The surrogate model is constructed by using PRS and the DCNSGA-III method is used to acquire the candidate Pareto solution.
Phase 3: The TMDSM is utilized to solve the ideal solution in the set of alternative solutions. Finally, the results of optimization are verified to assess the exactitude of the surrogate model and the effect of the optimization model.

4. The Optimization Results of SCOD

4.1. The Determination of the Optimization Problem

To successfully establish an optimization model, it is the priority to determine the optimization problem [37,62]. In the study of Albak, the thickness of the inner wall, middle wall, outer wall and ribs of nested tubes are selected as the design variables [35]. However, to explore the enhancement of the size of the inside structure, the circumscribed diameter of the middle wall of SCOD, namely Dmid, is quantified, as shown in Figure 1b. Therefore, the geometric parameters which include the thickness of the inner wall tint, the thickness of the middle wall tmid, the thickness of the outer wall tout and the cross-section size of the middle wall Dmid are determined as design variables. According to previous studies, the tint, tmid, tout, trib and Dmid generated a high sensitivity impact on the crashworthiness with the range of 0.5 to 2.0 mm and 25 to 35 mm, respectively. Hence, the same interval is selected as the range of variation in this study.
In the field of practical engineering, higher SEA and CFE values and lower IPCF values are the orientation commonly pursued [29,63]. However, the increase in SEA values typically accompanies an increase in IPCF, and a higher IPCF is not acceptable. In addition, the CFE represents the performance of energy absorbing, which is also a significant criterion. Hence, the SEA, CFE and IPCF are taken as optimization objectives. The mathematical model of the optimization problem can be represented as the following equation:
m a x ( I P C F ,   S E A ,   C F E ) s . t .   0.50 mm t i n t 0.20 mm 0.50 mm t m i d 0.20 mm 0.50 mm t o u t 0.20 mm 0.50 mm t r i b 0.20 mm 0.50 mm D m i d 0.20 mm

4.2. The Design of the Experiment (DoE)

In this section, an optimal LHC is used to contact for DoE, which has been proven to be an effective method for estimating the overall average [64,65]. A total of 60 simple points are obtained by using the optimal LHC method, and all of the points are established by FE modeling. The 60 groups of SEA, CFE and IPCF values of DoE are displayed in Table A1.

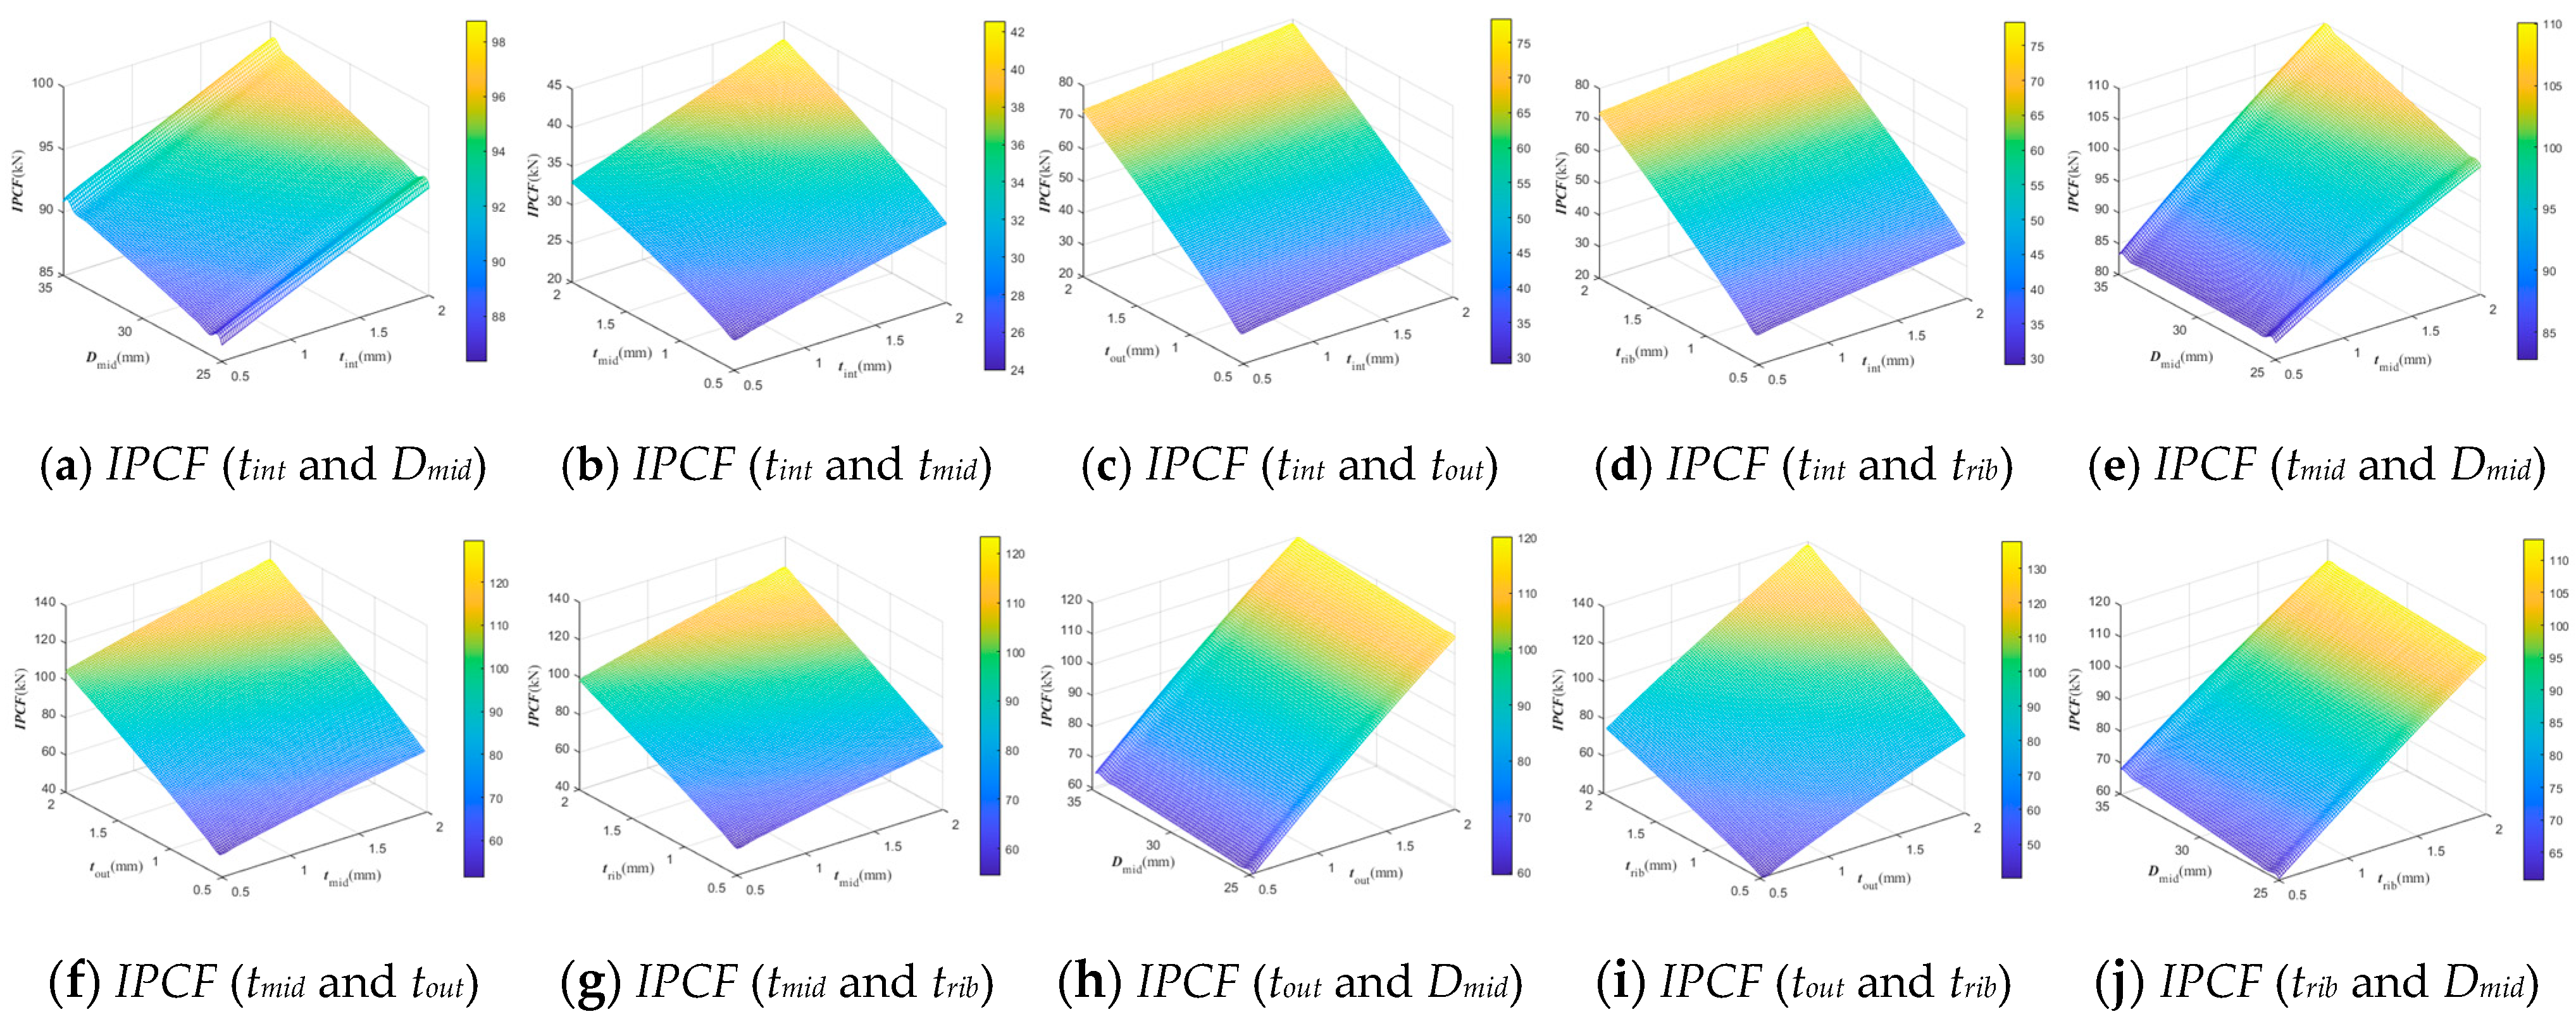
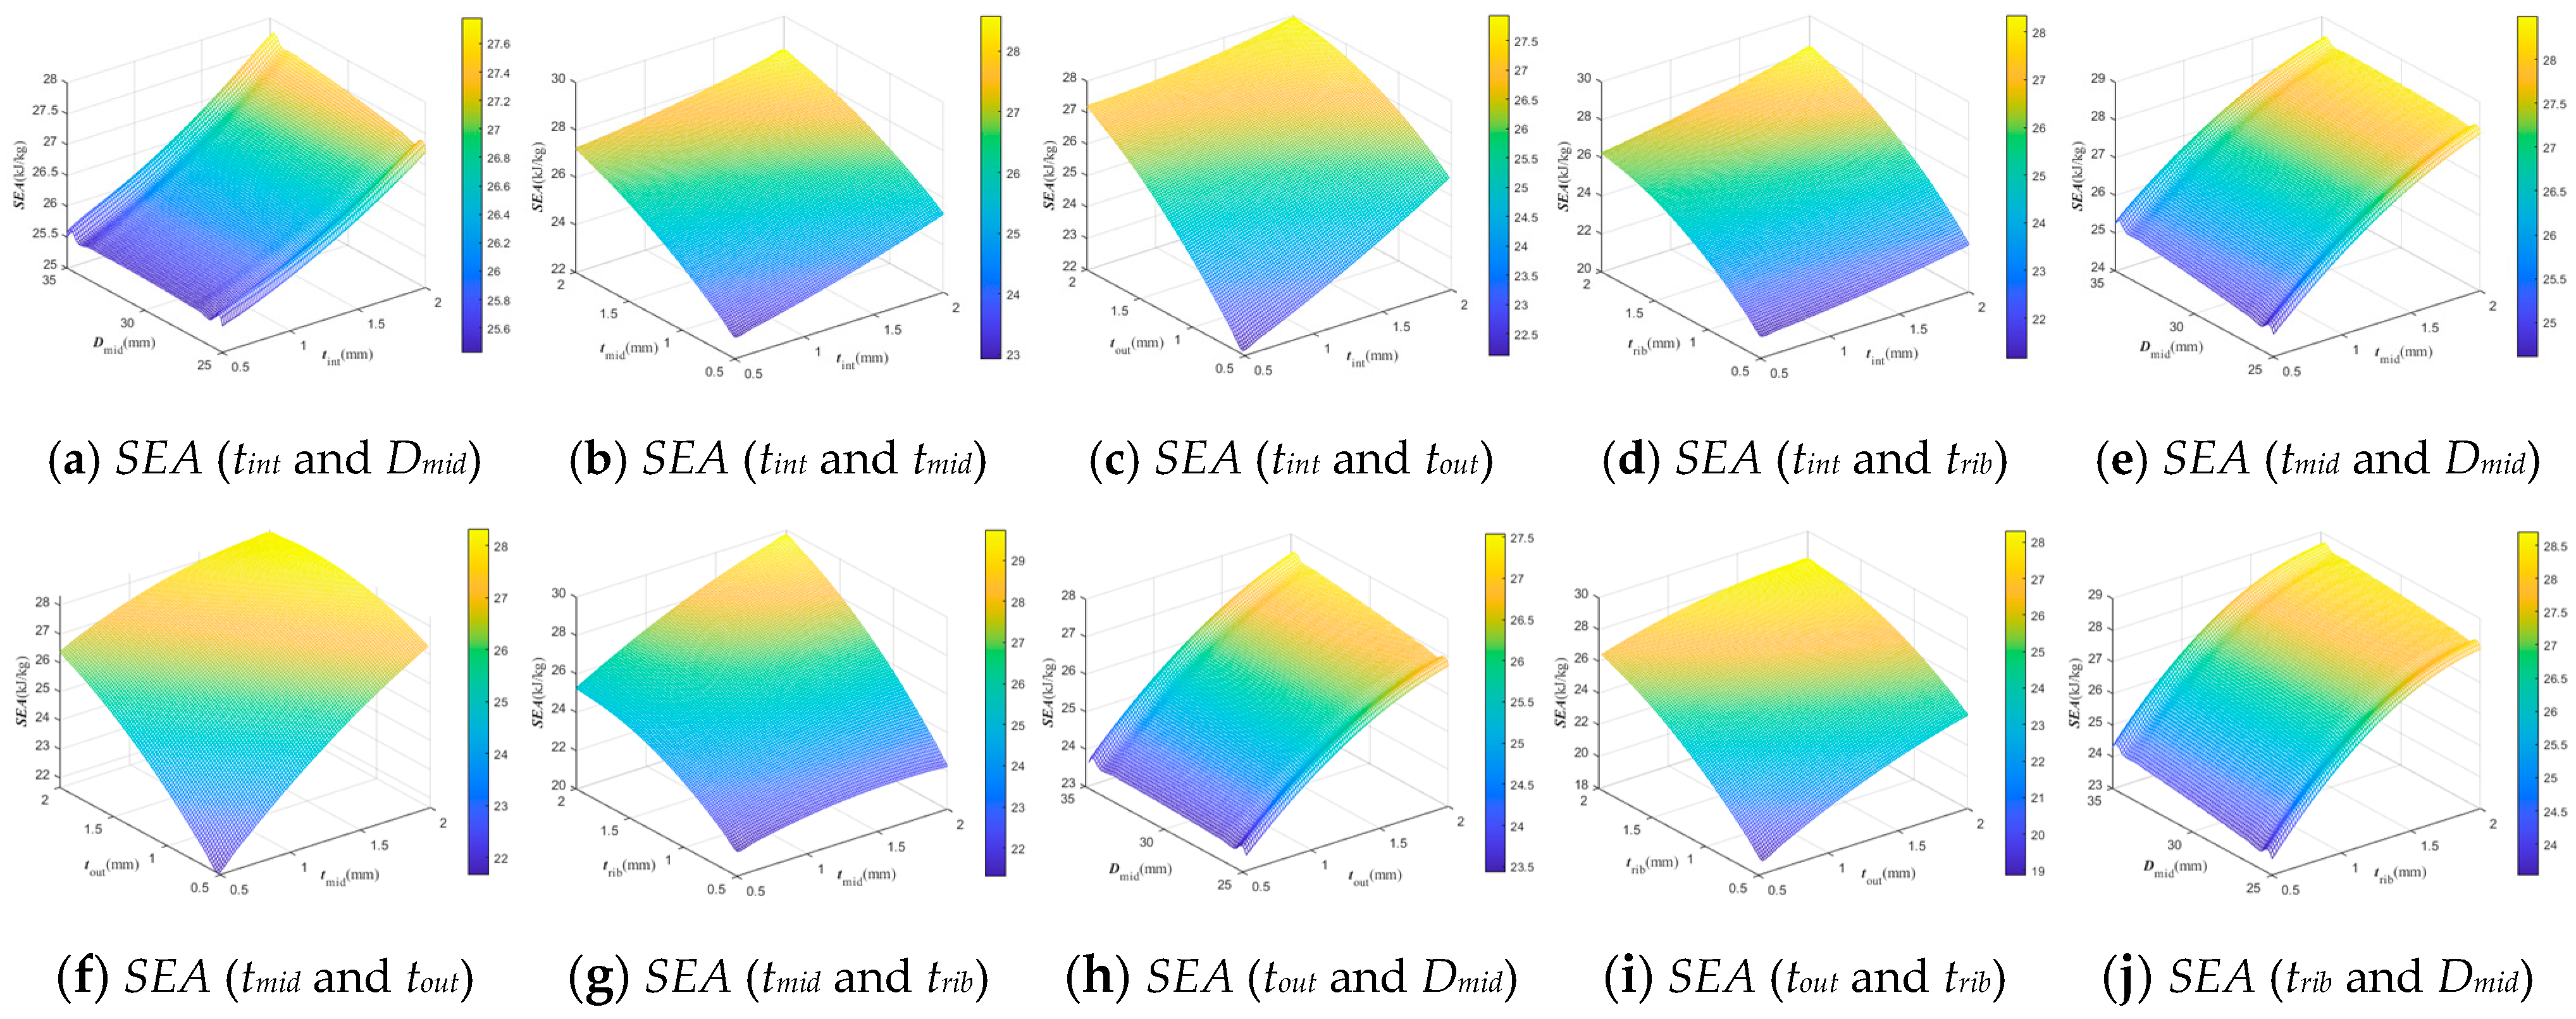
4.3. The Construction of the Surrogate Model

It has been proven that the polynomial response surface (PRS) method has such bodacious effectiveness and rationality that PRS has been widely applied in multi-objective optimization design studies of thin-walled structures [36]. In this study, the nonlinear quintic polynomial is used to perform the fitting relationship between the obtained parameter variables of the sample points, i.e., tint, tmid, tout, trib and Dmid, and the optimization objectives, i.e., IPCF, SEA and CFE. The established RS values, which reflect the corresponding relationship between each two parameter variables and a target value, are shown in Figure A1, Figure A2 and Figure A3. In addition, error analysis is applied to verify the assessment of the surrogate model in this study. To assure reasonable accuracy, four commonly used key indicators, including MAX, MRE, RMSE and R2 are computed, which are shown in Table 4.
As shown in Table 4, all the final scores of the four criteria satisfy the tolerance value of error. It should be noted that the lower MAX, MRE and RMSE are and the higher R2 is, the better the fitting effect and the higher the accuracy. In general, the value of R2 should not be more than 1 and should not be less than 0.88. It can be concluded that the proxy model has satisfactory exactitude.

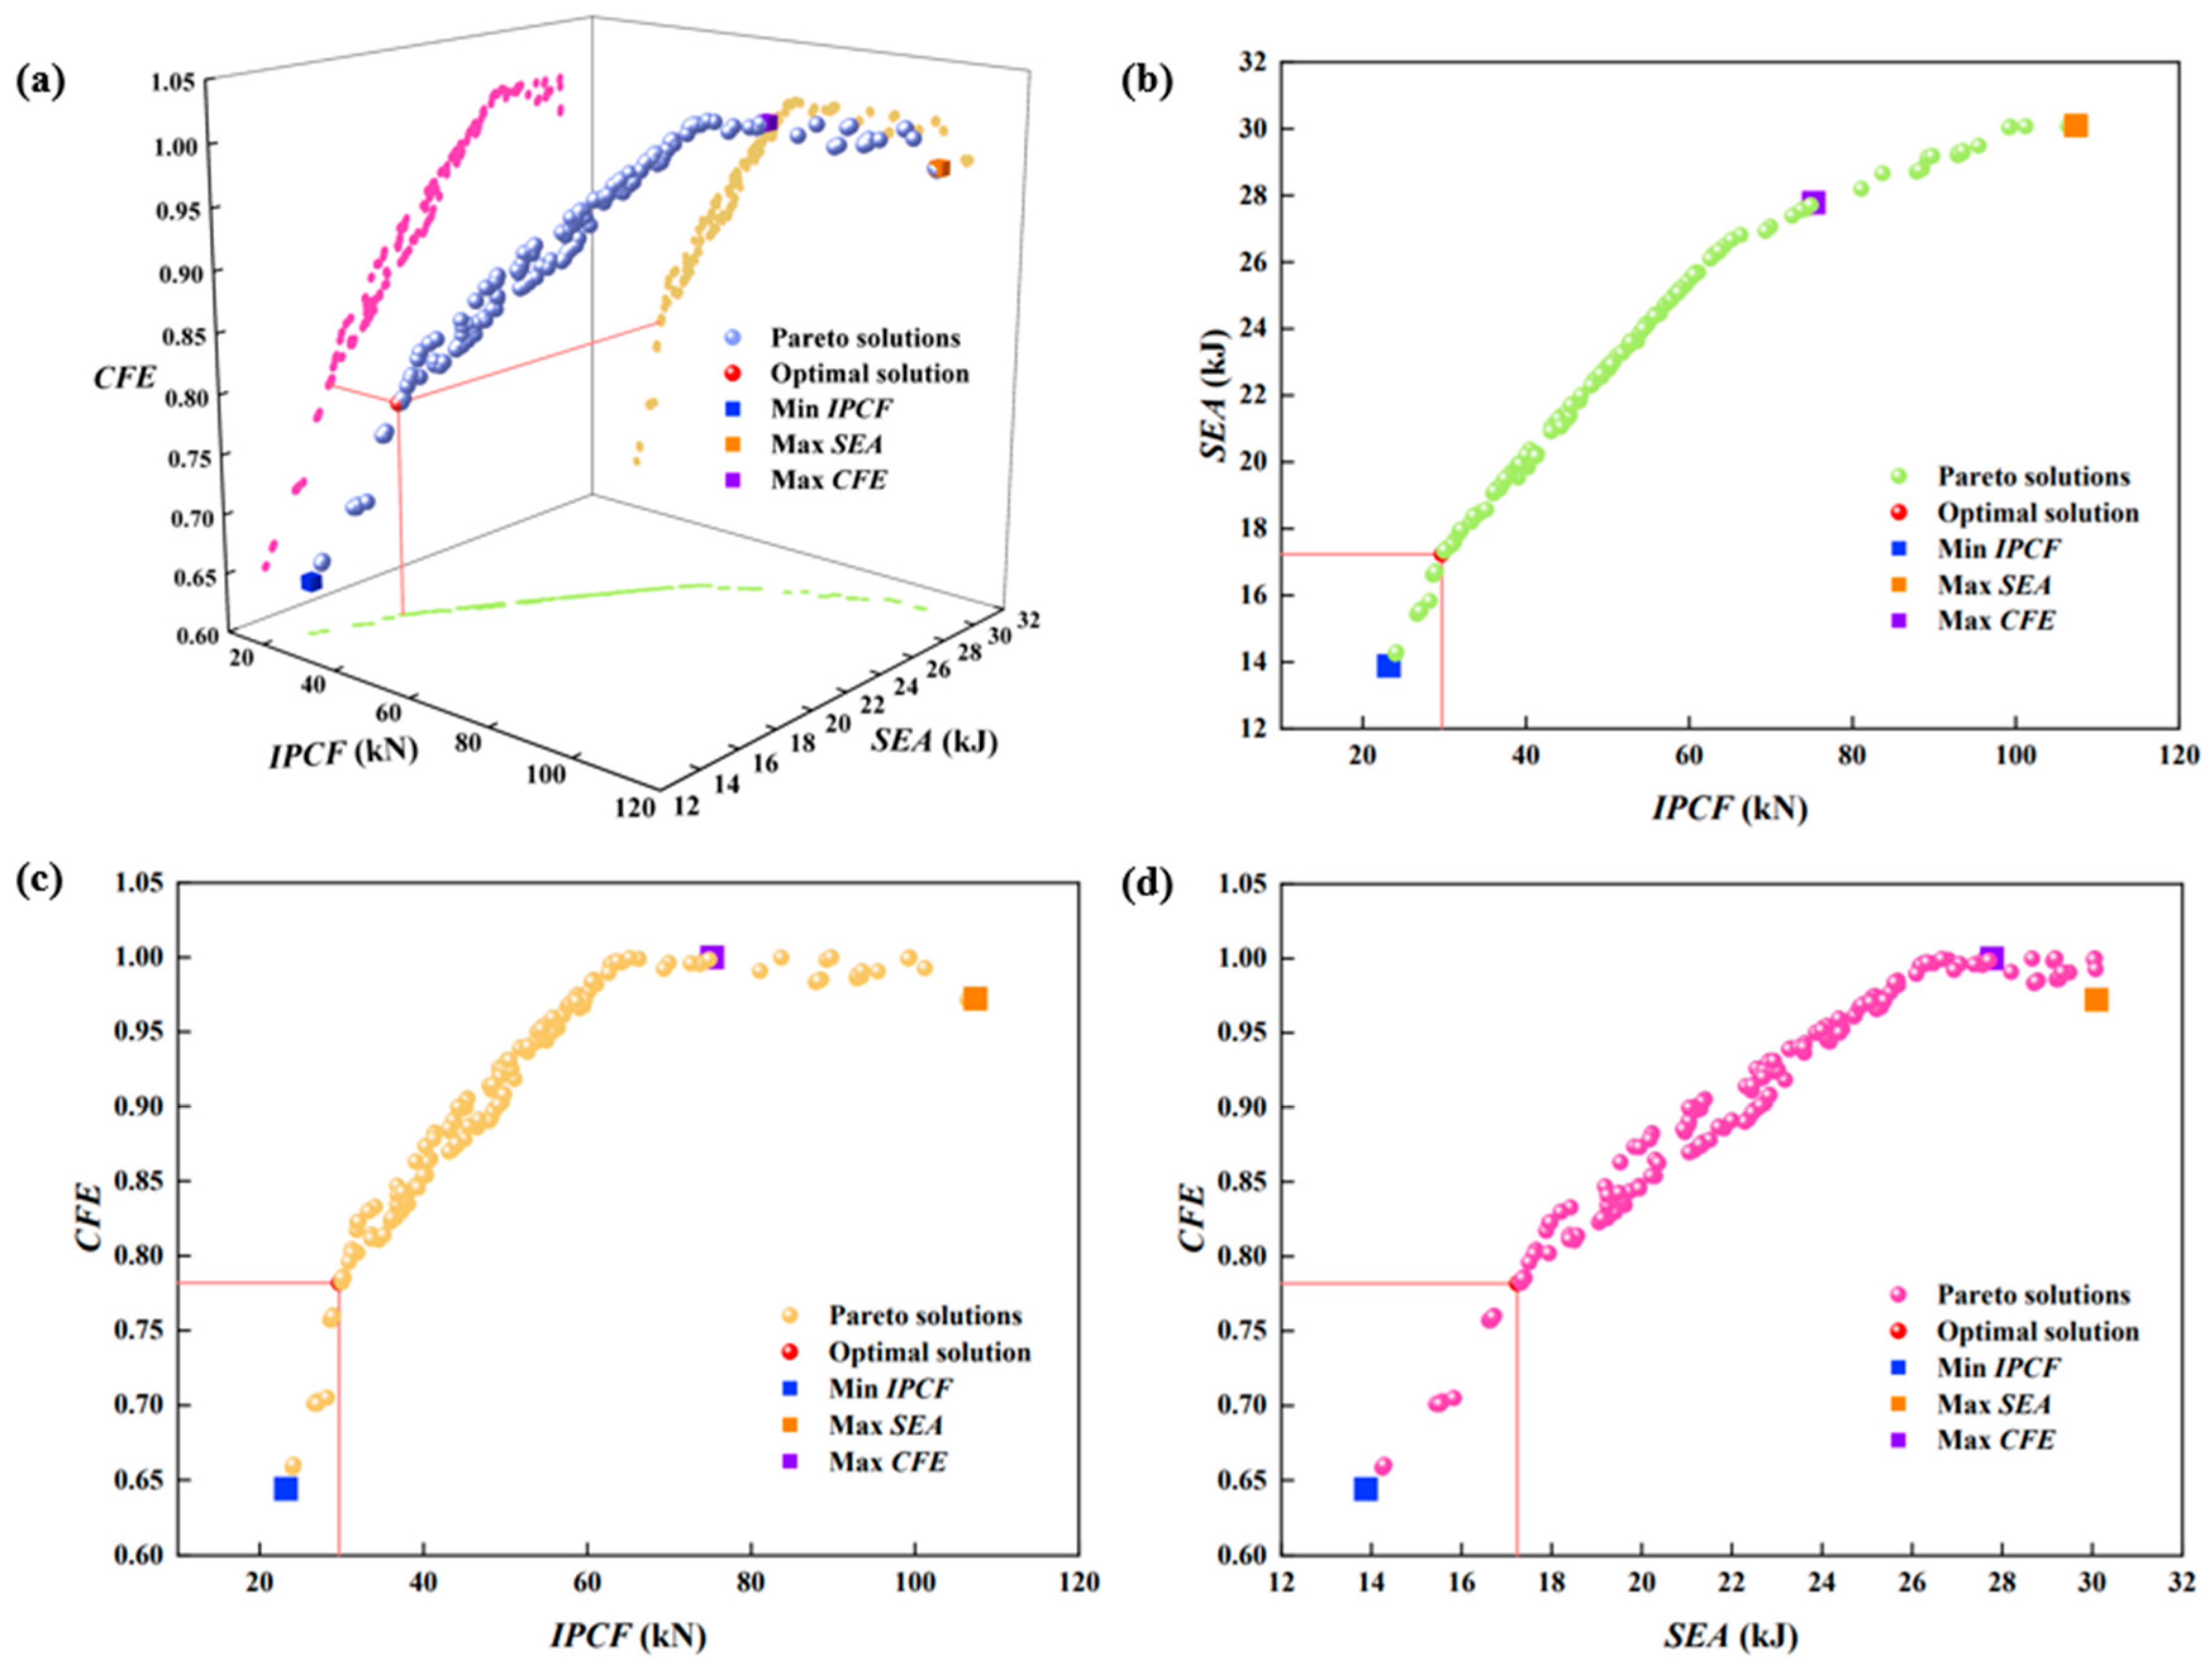
4.4. The Pareto Solution of Multi-Objective Optimization

A group of Pareto solutions of multi-objective optimization with better convergence, diversity and non-constraint degree is obtained by using the DCNSGA-III algorithm. It should be noticed that SEA and CFE are benefit indicators and IPCF is a cost indicator. In engineering practice, the structure with a larger SEA and CFE and smaller IPCF are preferentially considered. The 3D graphic of Pareto solutions corresponding to objective values is shown in Figure 11, which delivers the relationships of objective values.
In Figure 11, the Pareto solutions obtained by the DCNSGA-III algorithm can be observed in the 3D space and the projections are also marked in planes that reflect the relationships between every two target values. As the value of IPCF increases, the SEA also increases. The changes between IPCF and CFE reflect the same trend. It is worth noting that as the SEA value increases, the CFE also increases, indicating that while reducing the cost indicator, the benefit indicator will also be sacrificed. In addition to considering the optimal solution obtained through TMDSM, the other three optimal single performance solutions generated by referencing a single target value are also marked in the figure. As shown in Figure 11, the optimal solution is consistently located in the lower left quarter in each plane. It can be expressed by the fact that the optimal solution searched by TMDSM prefers to possess smaller IPCF values and the highest possible SEA and CFE values. In addition, the other three single best performance values are all located at the extreme positions of the Pareto alternative solution set. It can be seen that the alternative solutions implement the brightest endergonic performance and highest IPCF, which confirms that this optimization algorithm achieves satisfactory diversity and convergence of the population. Due to the conflicting objectives and indicators, it is necessary to balance the relationship between the three in practical engineering. The set of optimal solutions obtained by the methods used in this paper only provides some reference significance for engineers.

5. Discussion

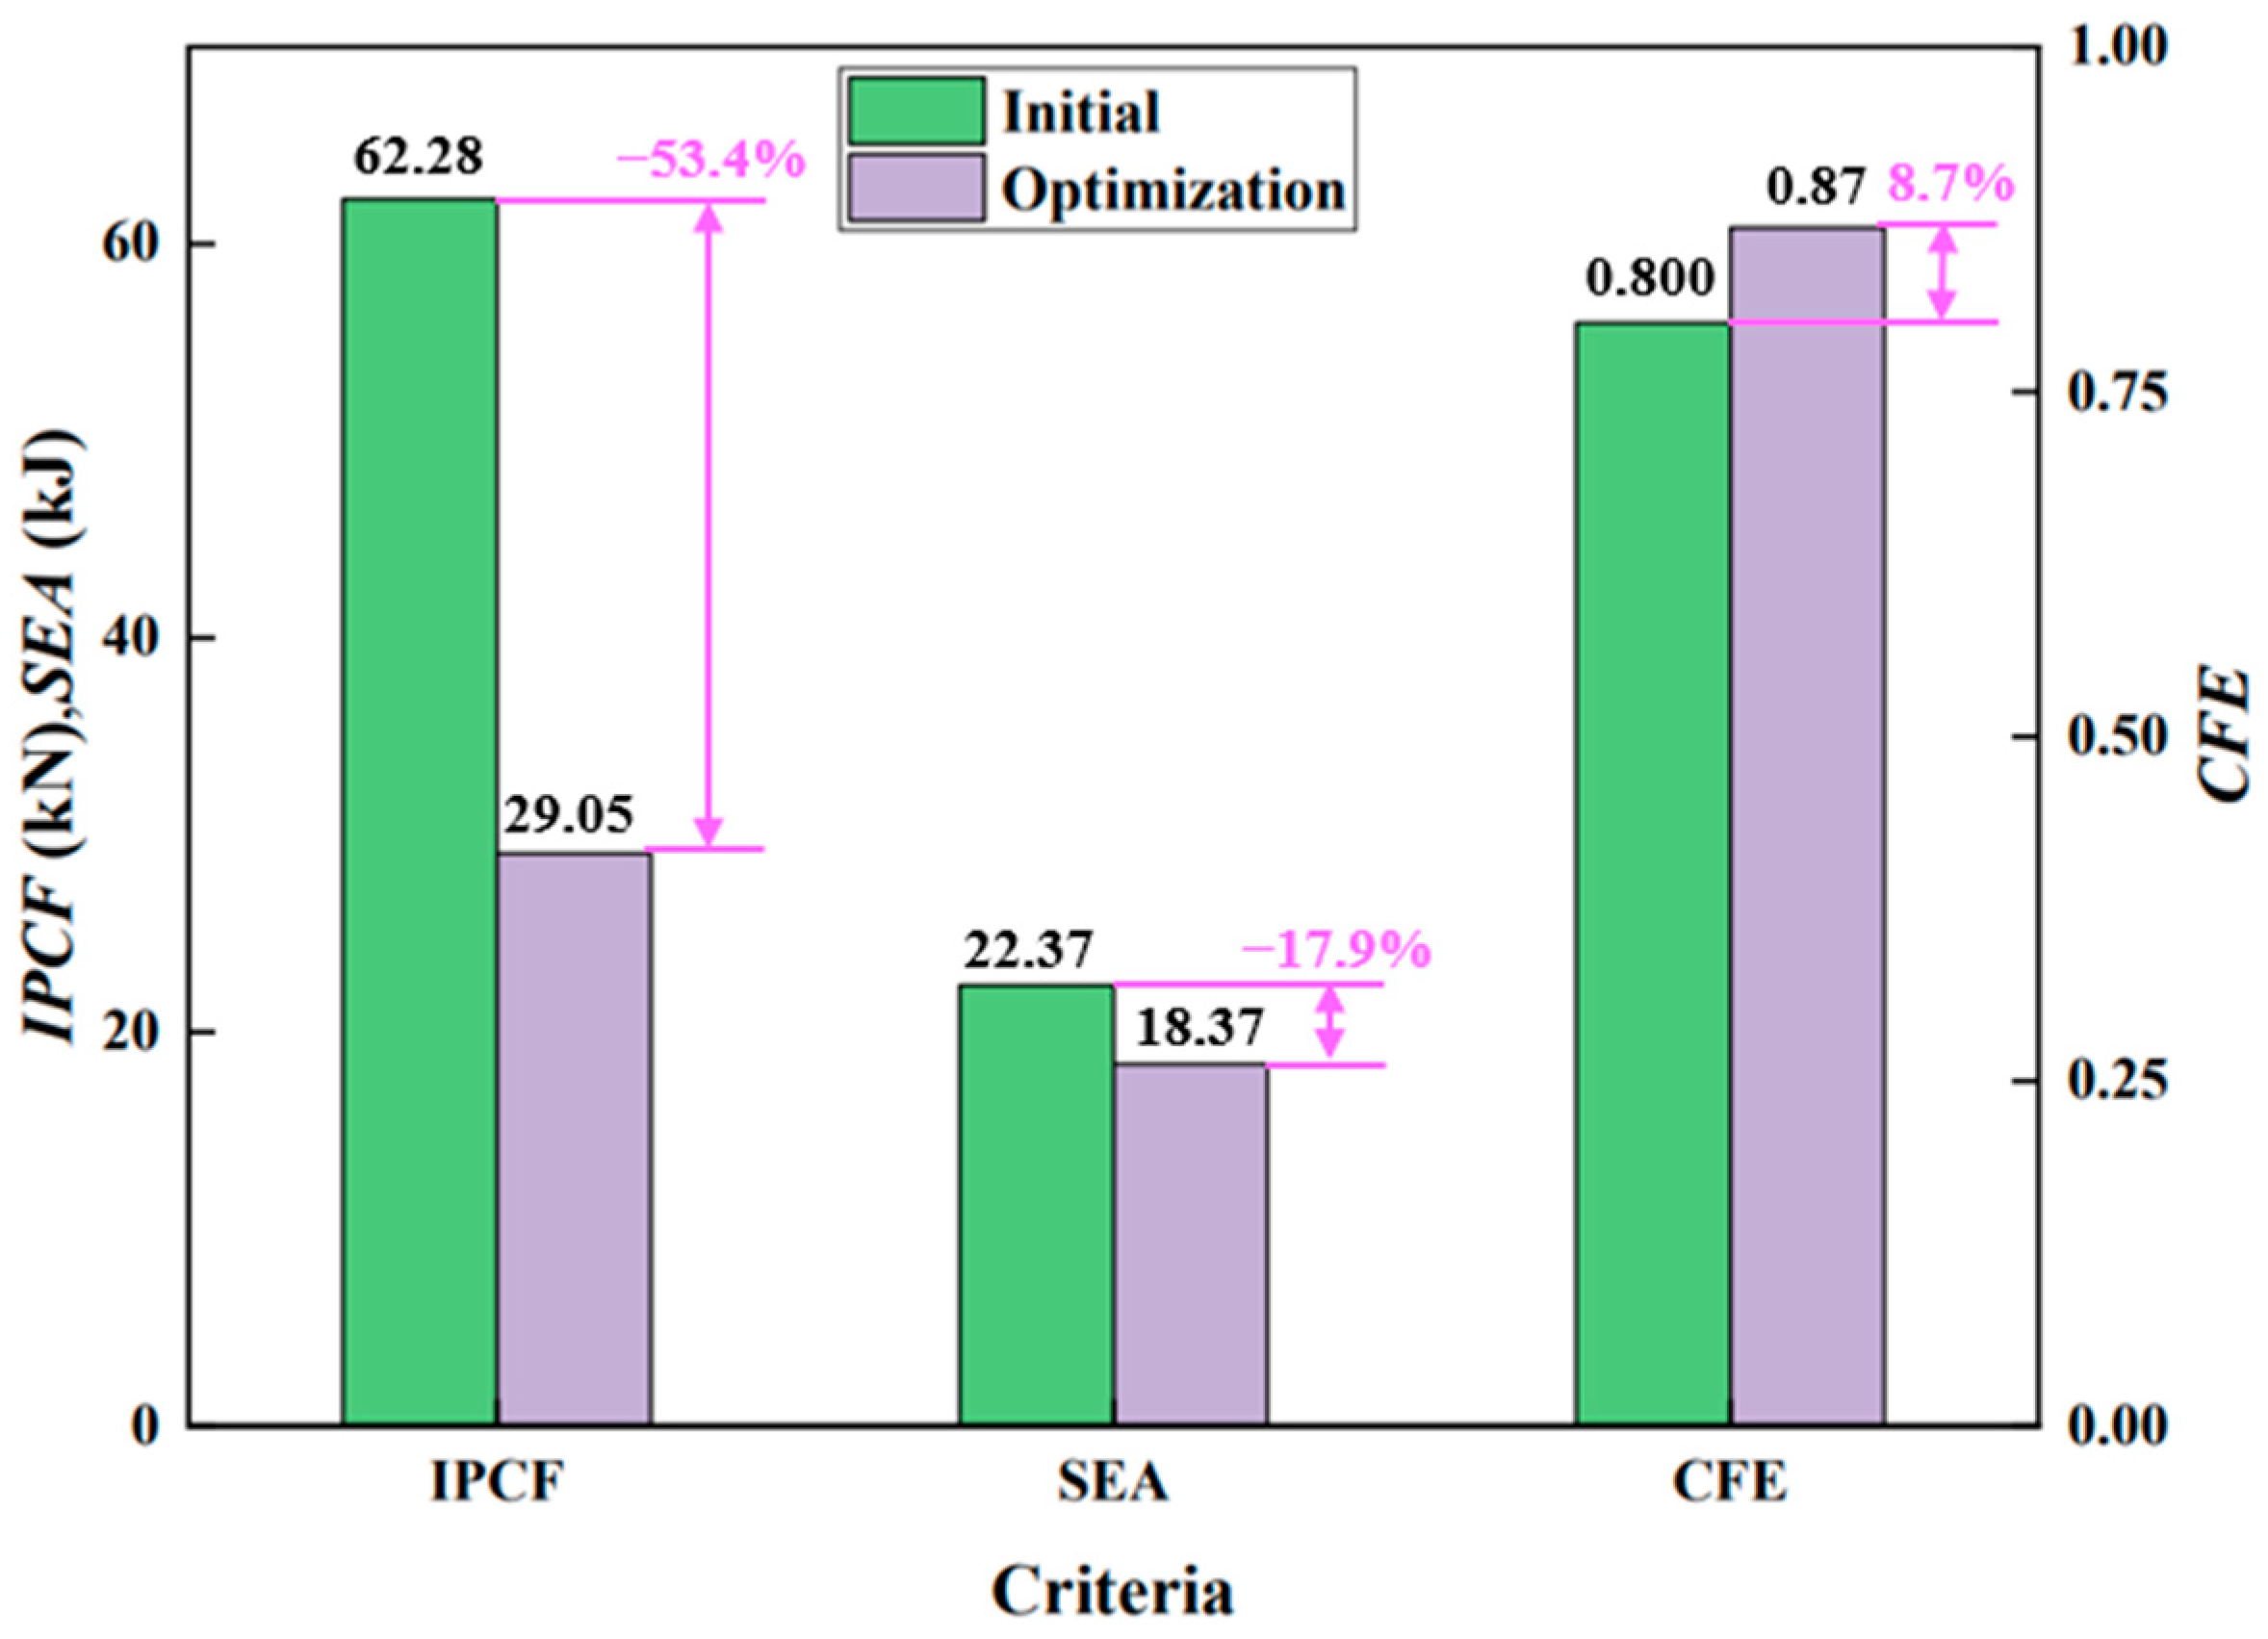
5.1. The Validation of Optimization Results

To verify the solutions selected are reasonable and reliable, it is effective to demonstrate that the errors between optimization results and the FE model are acceptable. In this section, the numerical model of the obtained optimal solution is reconstructed according to the parameter design variables of Pareto solutions. Table 5 exhibits the alternative solution objective values of Pareto solutions and numerical simulation in order to estimate the proposed optimization system.
As shown in Table 5, the relative error between the optimization results and the numerical simulation is within 12%, and the max error occurs in CFE. The comparison dates show that the developed optimization model is reasonable and meets the accuracy requirements.

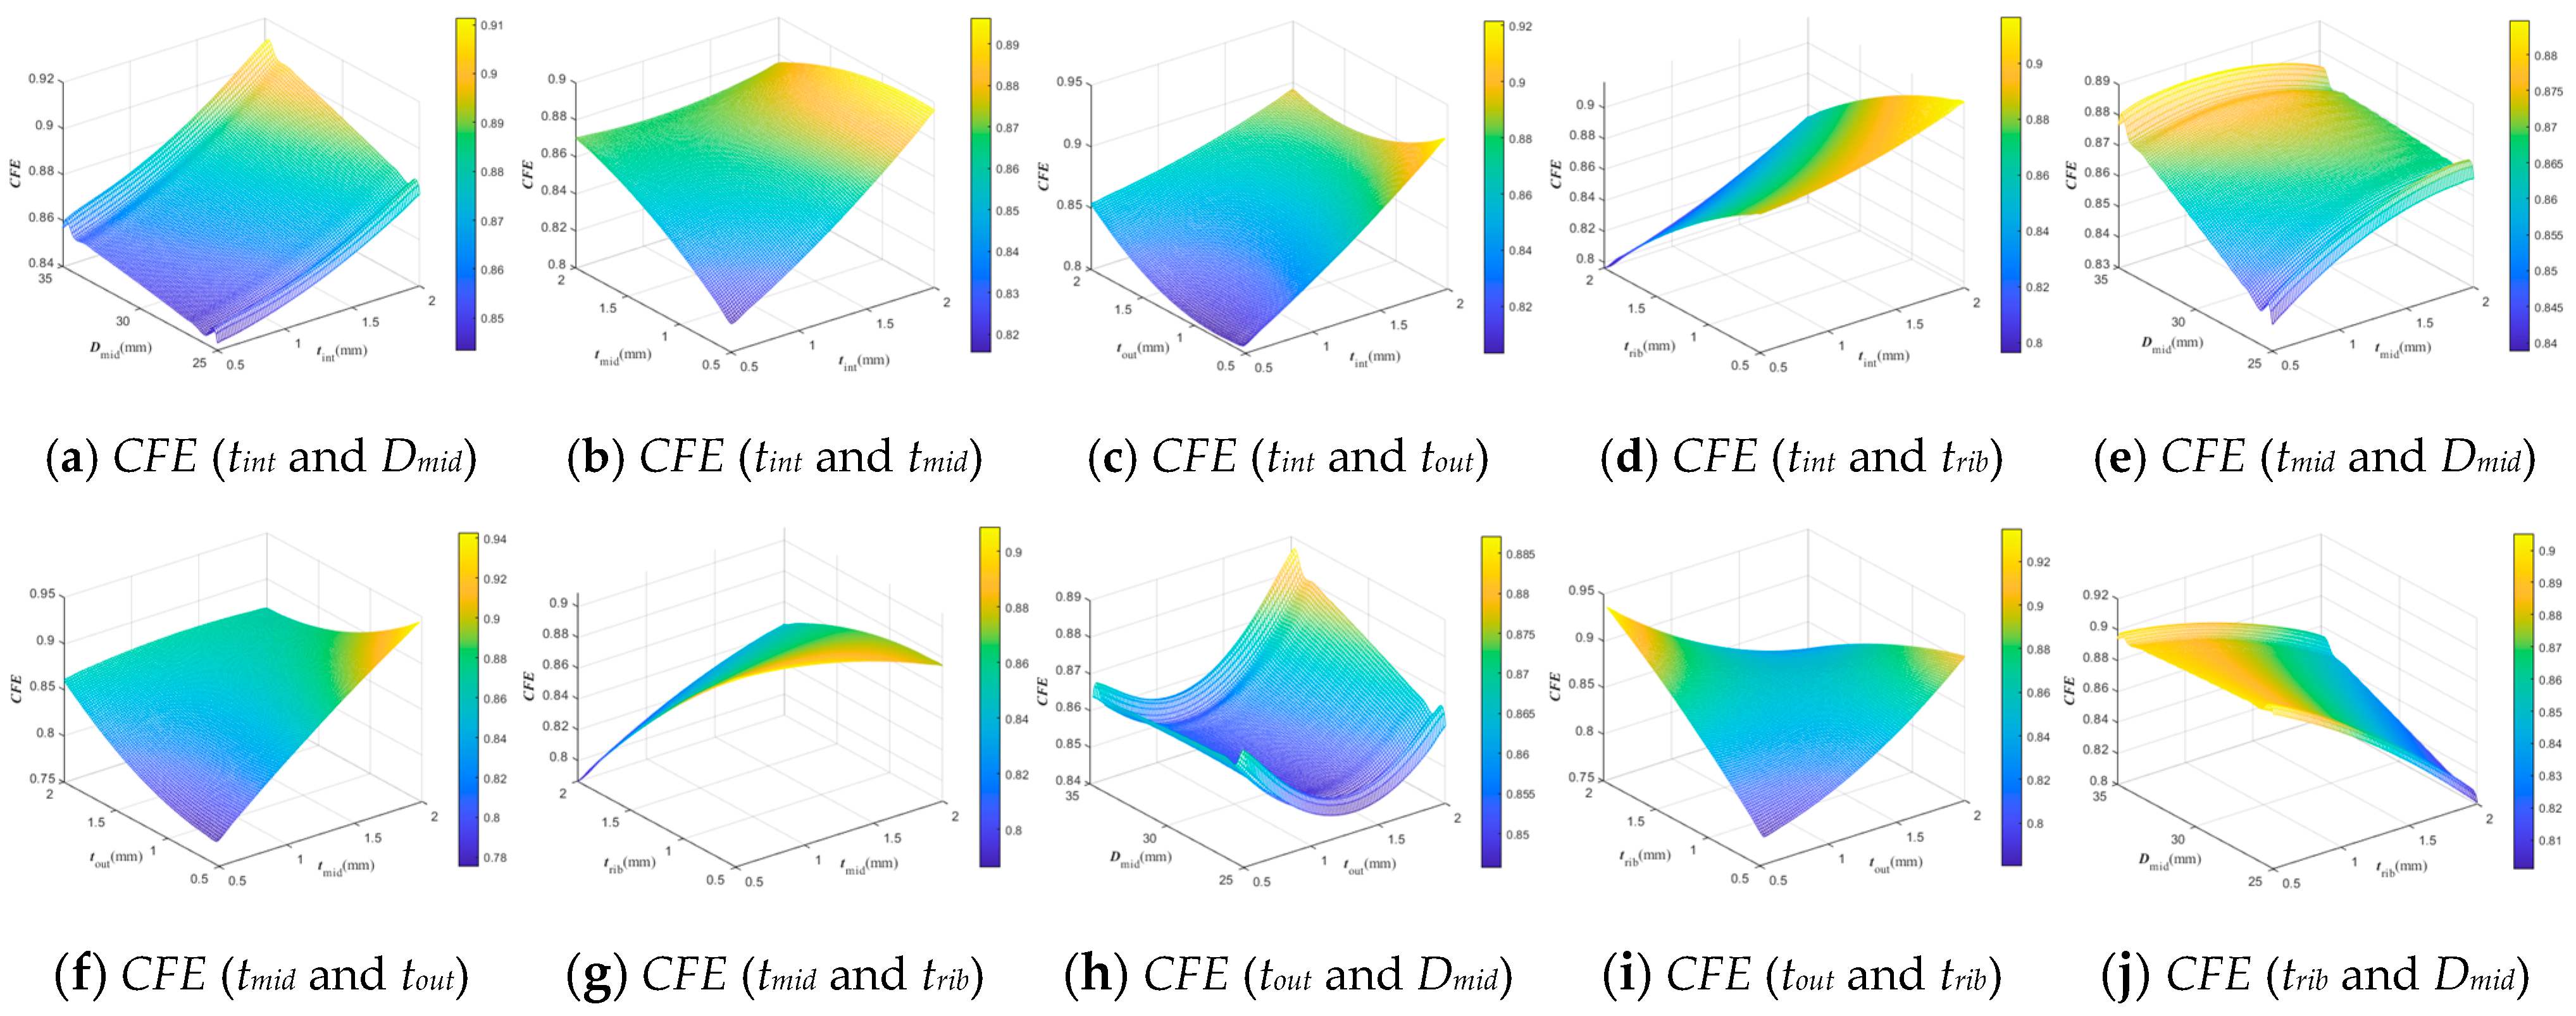
5.2. The Discussion of Optimization Results

In addition, the initial pattern is introduced to compare with the optimal solutions to evaluate the effectiveness of the optimization system. After optimization, the IPCF value decreases by 53.36% and the CFE value improves by 8.68% while the SEA value decreases by 17.88%, which is shown in Figure 12. Although the SEA value has been greatly weakened, the increase in IPCF value and CFE value has compensated for this. It is obvious that tremendous room for amelioration exists in IPCF for SCOD. To sum up, the final result evidences that the optimization method combining the DCNSGA-III algorithm and TMDSM can be designed for specific projects, making it convenient for engineers to refer to.

6. Conclusions

This study conducts multi-objective optimization of multi-layer nested thin-walled corrugated pipes, namely SCOD, combing the DCNSGA-III algorithm and TMDSM. The DCNSGA-III algorithm is applied to solve the non-dominated Pareto alternative to the design of optimization. The optimal design point is searched by utilizing TMDSM from the alternatives to determine the definitive combination of structural parameters.
The FE model of the SCOD is established based on the basic parameters, and validation is completed. Referring to the error of experiment and simulation results, the accuracy of the FE model is proved as reasonable and effective. In the early stage of optimization work, the design of experimental points is completed using the optimal LHD method, and then variables and target values are fitted according to the obtained experimental point data by utilizing PRS. By computing the four measurements, the surrogate model is validated. An optimal with comprehensive consideration of multiple objectives is obtained by retrieving from the Pareto front. The ultimate optimization result indicates that the IPCF reduces by 53.4% and the CFE increases by 8.7% after optimization. It can be concluded that the optimization method combining the DCNSGA-III algorithm and TMDSM used is effective.
In the future investigation, we will focus on three aspects: (1) developing further experiments and providing more adequate test data to support the validation; (2) applying fuzzy methods and other theories to solve the problem of weight uncertainty to find a more suitable Pareto solution set; (3) studying the impact of ripple amplitude and number on structural crashworthiness and optimize for them.

Author Contributions

Methodology, H.Z., T.L. and Z.H.; software, D.Y. and L.W.; validation, H.Z., Z.H. and Y.Z.; formal analysis, D.Y.; writing—review and editing, H.Z., Z.H. and Y.Z. All authors have read and agreed to the published version of the manuscript.

Funding

This research was Supported by the Foundation of State Key Laboratory of Automotive Simulation and Control [No. 20210236].

Institutional Review Board Statement

Not applicable.

Informed Consent Statement

Not applicable.

Data Availability Statement

The study did not report any data.

Conflicts of Interest

The authors declare no conflict of interest.

Appendix A

Figure A1. Second-order interaction response surface of CFE.
Applsci 13 09750 g0a1
Figure A2. Second-order interaction response surface of IPCF.
Applsci 13 09750 g0a2
Figure A3. Second-order interaction response surface of SEA.
Applsci 13 09750 g0a3
Table A1. The 60 groups of SEA, CFE and IPCF values of DoE.
No.tinttmidtouttribDmidIPCF (kN)SEA (kJ)CFE
10.6530.8810.6531.59327.8858.586845421.193218040.782614165
21.5931.8221.4921.46625.6885.9194412216.156107430.628983506
31.6190.9070.5250.98329.7546.2826995921.701094380.866691667
41.0341.9240.781.21226.1967.0994186424.203044340.88419663
51.3141.5171.0851.0593577.66350555 24.48207631 0.85696551
60.5510.7541.5681.08528.2277.89289093 23.87391076 0.79700563
70.780.8311.391.41534.8384.99373627 24.65070090 0.81567804
81.5420.9831.721.23734.6697.21710205 26.84166619 0.88668316
91.5171.0590.51.84730.0865.23165894 23.06232295 0.87299951
101.1861.1611.2371.31430.2582.10932922 24.60627686 0.82806999
111.0851.2881.3640.95825.1772.99485016 24.13321877 0.85316121
121.4921.2371.288227.71106.20410156 27.67901446 0.86784737
131.6440.51.3141.03430.9370.09825897 23.51739861 0.82531042
140.8811.0850.6021.56833.8162.30578232 22.54512732 0.83663219
151.1611.2121.7461.97533.14122.19077301 28.60797149 0.87888028
161.6951.6190.8310.75426.3656.82844925 21.63289296 0.83891925
171.7970.5510.9321.69527.5474.16440582 23.61493297 0.82344431
181.0080.6020.8810.83127.0347.46133041 19.72502649 0.75072193
191.1360.5761.8731.54230.42102.79691315 25.71772349 0.81509915
201.2370.6780.8050.80534.3248.95460510 20.17285200 0.76640964
211.110.5251.0081.82231.2776.22654724 22.58756087 0.77859680
221.8980.8051.5421.79731.44107.14806366 27.26390038 0.86083020
231.7461.7710.7031.7227.283.47353363 21.78154234 0.73973917
241.2630.781.9240.7827.3781.18247223 23.70013979 0.83406470
250.9320.7031.6190.67832.6366.60689545 22.51851537 0.83245015
260.9071.6690.7291.87329.4182.8129196219.566305640.665503958
271.9751.0340.9580.70333.6459.4154167222.033565690.827748697
280.9581.3640.6270.60228.0541.0273895318.981921680.790898343
291.7710.7291.1610.88125.5161.0739326522.47664525 0.83919475
301.0590.6271.3391.61925.8587.2209854124.14410145 0.77064779
311.4411.5680.9831.94933.98100.775192326.90492000 0.87137996
321.720.9321.8221.49226.53109.147544926.94120844 0.83619032
330.8051.4411.1861.7462592.1364288326.15691225 0.83742913
341.2121.4921.8470.62733.3185.2830429124.69711154 0.88691756
351.41521.111.36430.7692.3214950627.07020183 0.90570654
360.7541.3141.0340.55132.9754.3420753520.03192217 0.76660751
371.4661.111.2630.529.5858.48676321.18228986 0.81440263
381.8471.4151.6950.72926.0281.4726791424.87379190 0.89698179
390.8311.7970.5761.1132.1258.7095527722.89472230 0.87864541
400.6021.6441.2121.66933.4798.0264053326.07631989 0.83622852
410.5761.0081.4151.92429.92102.779602126.28088244 0.80803277
421.3641.1360.6781.3925.3462.2381324823.41673627 0.84423196
4321.2631.1361.28828.982.0931396526.34920334 0.90810149
440.7031.391.6690.52528.7370.2133789122.83575216 0.84386887
451.3391.9491.4660.65328.3977.5657501223.67024308 0.86393435
460.5250.6530.8561.00831.6151.0912284919.44927919 0.71204341
470.6271.3391.8981.26331.95105.043090826.82023108 0.85247459
481.8221.5930.5511.33932.867.7976074218.23823219 0.67373307
490.7291.9751.4410.93232.2985.9091491724.88916179 0.86841285
501.6690.8560.9071.51734.4973.701255824.300869320.862368361
511.9490.9581.9490.85630.5991.1053543124.173375950.842698407
521.9241.721.5170.90732.4691.3817672725.664057370.890494034
531.391.54221.18629.24110.408996625.866340320.833959711
541.5681.7460.7540.57631.7854.238632220.532228440.818566565
550.51.4661.0591.13628.5669.3497695923.345029020.819309729
561.2881.8731.7971.44134.15120.644973827.353925930.859222077
570.9831.8471.5931.89829.07121.115455628.526308890.87472431
580.8561.1861.9751.64426.69117.10105927.048643590.822575551
591.8731.6951.6441.77131.1124.560646129.00633810.891892921
600.6781.8981.7711.16126.8698.9219055223.625672260.78182648

References

  1. Jensen, L.W.; Schmidt, M.; Nielsen, O.A. Determination of Infrastructure Capacity in Railway Networks without the Need for a Fixed Timetable. Transp. Res. Part C Emerg. Technol. 2020, 119, 102751. [Google Scholar] [CrossRef]
  2. Hou, L.; Peng, Y.; Sun, D. Hybrid Framework for Safety Design of Human–Rail Vehicle Transportation System Using Stochastic Approach and Optimization. IEEE Trans. Ind. Inform. 2023, 19, 6599–6612. [Google Scholar] [CrossRef]
  3. Zhang, H.; Peng, Y.; Hou, L.; Wang, D.; Tian, G.; Li, Z. Multistage Impact Energy Distribution for Whole Vehicles in High-Speed Train Collisions: Modeling and Solution Methodology. IEEE Trans. Ind. Inform. 2020, 16, 2486–2499. [Google Scholar] [CrossRef]
  4. De Melo, A.L.O.; Kaewunruen, S.; Papaelias, M. Hybrid Approach to Predict the Track Deterioration in a Railway In-Service: A Conceptual Design. IOP Conf. Ser. Mater. Sci. Eng. 2019, 603, 032083. [Google Scholar] [CrossRef]
  5. Li, D.; Kaewunruen, S.; You, R. Remaining Fatigue Life Predictions of Railway Prestressed Concrete Sleepers Considering Time-Dependent Surface Abrasion. Sustainability 2022, 14, 11237. [Google Scholar] [CrossRef]
  6. Ngamkhanong, C.; Kaewunruen, S. Prediction of Thermal-Induced Buckling Failures of Ballasted Railway Tracks Using Artificial Neural Network (ANN). Int. J. Struct. Stab. Dyn. 2022, 22, 2250049. [Google Scholar] [CrossRef]
  7. Dindar, S.; Kaewunruen, S.; An, M.; Gigante-Barrera, Á. Derailment-Based Fault Tree Analysis on Risk Management of Railway Turnout Systems. IOP Conf. Ser. Mater. Sci. Eng. 2017, 245, 042020. [Google Scholar] [CrossRef]
  8. Dindar, S.; Kaewunruen, S.; An, M. A Hierarchical Bayesian-Based Model for Hazard Analysis of Climate Effect on Failures of Railway Turnout Components. Reliab. Eng. Syst. Saf. 2022, 218, 108130. [Google Scholar] [CrossRef]
  9. Wang, J.; Liu, H.; Tang, T.; Luo, X.; Chai, M. A Space-Time Interval Based Protection Method for Virtual Coupling. In Proceedings of the 2022 China Automation Congress (CAC), Xiamen, China, 25 November 2022; IEEE: Manhattan, NY, USA, 2022; pp. 4906–4911. [Google Scholar]
  10. Li, S.; Cai, B.; Liu, J.; Wang, J. Collision Risk Analysis Based Train Collision Early Warning Strategy. Accid. Anal. Prev. 2018, 112, 94–104. [Google Scholar] [CrossRef]
  11. Yang, C.; Guo, W.; Xiao, X.; Xu, P.; Yao, S. Structural Design and Optimization of a Guardrail for the Train-to-Train Collision Test Platform. Mech. Based Des. Struct. Mach. 2023, 1–29. [Google Scholar] [CrossRef]
  12. Wei, W.; Zhang, F.; Xing, Y.; Wang, H.; Liu, R. The Offset Crashworthiness and Parameter Optimization of C-Shaped Frame for Rail Vehicle Anti-Climbing Device. Metals 2023, 13, 501. [Google Scholar] [CrossRef]
  13. Yadav, O.P.; Vyas, N.S. The Influence of AAR Coupler Features on Estimation of In-Train Forces. Railw. Eng. Sci. 2023, 31, 233–251. [Google Scholar] [CrossRef]
  14. Peng, Y.; Li, T.; Bao, C.; Zhang, J.; Xie, G.; Zhang, H. Performance Analysis and Multi-Objective Optimization of Bionic Dendritic Furcal Energy-Absorbing Structures for Trains. Int. J. Mech. Sci. 2023, 246, 108145. [Google Scholar] [CrossRef]
  15. Peng, Y.; Li, T.; Hou, L.; Wang, K.; Xie, G.; Zhang, H. Bio-Inspired Cellular Thin-Walled Structures under Impact Loading: Modeling and Multi-Stage Cooperative Optimization Algorithm. Mech. Adv. Mater. Struct. 2023, 1–18. [Google Scholar] [CrossRef]
  16. Lin, Y.; Min, J.; Li, Y.; Lin, J. A Thin-Walled Structure with Tailored Properties for Axial Crushing. Int. J. Mech. Sci. 2019, 157–158, 119–135. [Google Scholar] [CrossRef]
  17. Alghamdi, A.A.A. Collapsible Impact Energy Absorbers: An Overview. Thin-Walled Struct. 2001, 39, 189–213. [Google Scholar] [CrossRef]
  18. Sun, G.; Deng, M.; Zheng, G.; Li, Q. Design for Cost Performance of Crashworthy Structures Made of High Strength Steel. Thin-Walled Struct. 2019, 138, 458–472. [Google Scholar] [CrossRef]
  19. Singace, A.A.; El-Sobky, H. Behaviour of Axially Crushed Corrugated Tubes. Int. J. Mech. Sci. 1997, 39, 249–268. [Google Scholar] [CrossRef]
  20. Liu, Z.; Hao, W.; Xie, J.; Lu, J.; Huang, R.; Wang, Z. Axial-Impact Buckling Modes and Energy Absorption Properties of Thin-Walled Corrugated Tubes with Sinusoidal Patterns. Thin-Walled Struct. 2015, 94, 410–423. [Google Scholar] [CrossRef]
  21. Wu, S.; Li, G.; Sun, G.; Wu, X.; Li, Q. Crashworthiness Analysis and Optimization of Sinusoidal Corrugation Tube. Thin-Walled Struct. 2016, 105, 121–134. [Google Scholar] [CrossRef]
  22. Li, Z.; Yao, S.; Ma, W.; Xu, P.; Che, Q. Energy-Absorption Characteristics of a Circumferentially Corrugated Square Tube with a Cosine Profile. Thin-Walled Struct. 2019, 135, 385–399. [Google Scholar] [CrossRef]
  23. Hu, J.; Xu, P.; Fan, Z.; Li, Y.; Tan, X. Axial Compression Response of Multi-Cell Tube Reinforced by Parallel Leaf Veins Inspired Secondary Ribs. Thin-Walled Struct. 2023, 185, 110557. [Google Scholar] [CrossRef]
  24. Zhang, X.; Zhang, H. Axial Crushing of Circular Multi-Cell Columns. Int. J. Impact Eng. 2014, 65, 110–125. [Google Scholar] [CrossRef]
  25. Wang, S.; Zhang, M.; Pei, W.; Yu, F.; Jiang, Y. Energy-Absorbing Mechanism and Crashworthiness Performance of Thin-Walled Tubes Diagonally Filled with Rib-Reinforced Foam Blocks under Axial Crushing. Compos. Struct. 2022, 299, 116149. [Google Scholar] [CrossRef]
  26. Liang, H.; Hao, W.; Sun, H.; Pu, Y.; Zhao, Y.; Ma, F. On Design of Novel Bionic Bamboo Tubes for Multiple Compression Load Cases. Int. J. Mech. Sci. 2022, 218, 107067. [Google Scholar] [CrossRef]
  27. Shi, Y.-Q.; Qin, R.-X.; Chen, B.-Z. Crashworthiness Design and Analysis for Novel Multi-Corner Square Columns under Axial Loading. Mech. Adv. Mater. Struct. 2022, 29, 5843–5859. [Google Scholar] [CrossRef]
  28. Ma, W.; Xie, S.; Li, Z.; Feng, Z.; Jing, K. Crushing Behaviors of Horse-Hoof-Wall Inspired Corrugated Tubes under Multiple Loading Conditions. Mech. Adv. Mater. Struct. 2022, 29, 3263–3280. [Google Scholar] [CrossRef]
  29. Deng, X.; Liu, W. Experimental and Numerical Investigation of a Novel Sandwich Sinusoidal Lateral Corrugated Tubular Structure under Axial Compression. Int. J. Mech. Sci. 2019, 151, 274–287. [Google Scholar] [CrossRef]
  30. Deng, X.; Liu, W. Multi-Objective Optimization of Thin-Walled Sandwich Tubes with Lateral Corrugated Tubes in the Middle for Energy Absorption. Thin-Walled Struct. 2019, 137, 303–317. [Google Scholar] [CrossRef]
  31. Zhu, H.; Yao, S.; Li, Z.; Liu, J.; Xu, P.; Liu, M. Crashworthiness Analysis of Multilayered Hexagonal Tubes under Axial and Oblique Loads. Mech. Adv. Mater. Struct. 2023, 30, 3608–3629. [Google Scholar] [CrossRef]
  32. Tran, T.; Le, D.; Baroutaji, A. Theoretical and Numerical Crush Analysis of Multi-Stage Nested Aluminium Alloy Tubular Structures under Axial Impact Loading. Eng. Struct. 2019, 182, 39–50. [Google Scholar] [CrossRef]
  33. Yang, M.; Han, B.; Su, P.; Zhang, Q.; Zhang, Q.; Zhao, Z.; Ni, C.; Lu, T.J. Crashworthiness of Hierarchical Truncated Conical Shells with Corrugated Cores. Int. J. Mech. Sci. 2021, 193, 106171. [Google Scholar] [CrossRef]
  34. Xie, G.; Wang, K.; Wu, X.; Wang, J.; Li, T.; Peng, Y.; Zhang, H. A Hybrid Multi-Stage Decision-Making Method with Probabilistic Interval-Valued Hesitant Fuzzy Set for 3D Printed Composite Material Selection. Eng. Appl. Artif. Intell. 2023, 123, 106483. [Google Scholar] [CrossRef]
  35. Albak, E.İ. Crashworthiness Design and Optimization of Nested Structures with a Circumferentially Corrugated Circular Outer Wall and Inner Ribs. Thin-Walled Struct. 2021, 167, 108219. [Google Scholar] [CrossRef]
  36. Qiu, N.; Gao, Y.; Fang, J.; Sun, G.; Li, Q.; Kim, N.H. Crashworthiness Optimization with Uncertainty from Surrogate Model and Numerical Error. Thin-Walled Struct. 2018, 129, 457–472. [Google Scholar] [CrossRef]
  37. Pirmohammad, S.; Esmaeili Marzdashti, S. Crashworthiness Optimization of Combined Straight-Tapered Tubes Using Genetic Algorithm and Neural Networks. Thin-Walled Struct. 2018, 127, 318–332. [Google Scholar] [CrossRef]
  38. Jiao, R.; Zeng, S.; Li, C.; Yang, S.; Ong, Y.-S. Handling Constrained Many-Objective Optimization Problems via Problem Transformation. IEEE Trans. Cybern. 2021, 51, 4834–4847. [Google Scholar] [CrossRef]
  39. Li, Z.; Ma, W.; Xu, P.; Yao, S. Crushing Behavior of Circumferentially Corrugated Square Tube with Different Cross Inner Ribs. Thin-Walled Struct. 2019, 144, 106370. [Google Scholar] [CrossRef]
  40. Zhang, Y.; Xu, X.; Wang, J.; Chen, T.; Wang, C.H. Crushing Analysis for Novel Bio-Inspired Hierarchical Circular Structures Subjected to Axial Load. Int. J. Mech. Sci. 2018, 140, 407–431. [Google Scholar] [CrossRef]
  41. Reddy, T.J.; Narayanamurthy, V.; Rao, Y.V.D. Evolution of a New Geometric Profile for an Ideal Tube Inversion for Crash Energy Absorption. Int. J. Mech. Sci. 2019, 155, 125–142. [Google Scholar] [CrossRef]
  42. Tran, T.; Hou, S.; Han, X.; Nguyen, N.; Chau, M. Theoretical Prediction and Crashworthiness Optimization of Multi-Cell Square Tubes under Oblique Impact Loading. Int. J. Mech. Sci. 2014, 89, 177–193. [Google Scholar] [CrossRef]
  43. Tran, T.; Hou, S.; Han, X.; Tan, W.; Nguyen, N. Theoretical Prediction and Crashworthiness Optimization of Multi-Cell Triangular Tubes. Thin-Walled Struct. 2014, 82, 183–195. [Google Scholar] [CrossRef]
  44. Yan, J.; Yao, S.; Xu, P.; Peng, Y.; Shao, H.; Zhao, S. Theoretical Prediction and Numerical Studies of Expanding Circular Tubes as Energy Absorbers. Int. J. Mech. Sci. 2016, 105, 206–214. [Google Scholar] [CrossRef]
  45. Li, Z.; Ma, W.; Hou, L.; Xu, P.; Yao, S. Crashworthiness Analysis of Corrugations Reinforced Multi-Cell Square Tubes. Thin-Walled Struct. 2020, 150, 106708. [Google Scholar] [CrossRef]
  46. Chen, T.; Zhang, Y.; Lin, J.; Lu, Y. Theoretical Analysis and Crashworthiness Optimization of Hybrid Multi-Cell Structures. Thin-Walled Struct. 2019, 142, 116–131. [Google Scholar] [CrossRef]
  47. Zhang, X.; Zhang, H. Numerical and Theoretical Studies on Energy Absorption of Three-Panel Angle Elements. Int. J. Impact Eng. 2012, 46, 23–40. [Google Scholar] [CrossRef]
  48. Albak, E.İ. Crashworthiness Design for Multi-Cell Circumferentially Corrugated Thin-Walled Tubes with Sub-Sections under Multiple Loading Conditions. Thin-Walled Struct. 2021, 164, 107886. [Google Scholar] [CrossRef]
  49. Srinivasan, A.; Turner, C.J.; Kelkar, A.; Castanier, M.P.; Rizzo, D. Selection of Surrogate Models with Metafeatures; SAE Technical Paper 2022-01-0365; SAE: Warrendale, PA, USA, 2022. [Google Scholar]
  50. Pang, Y.; Wang, Y.; Sun, W.; Song, X. OTL-PEM: An Optimization-Based Two-Layer Pointwise Ensemble of Surrogate Models. J. Mech. Des. 2022, 144, 051702. [Google Scholar] [CrossRef]
  51. Deng, X.; Liu, W.; Jin, L. On the Crashworthiness Analysis and Design of a Lateral Corrugated Tube with a Sinusoidal Cross-Section. Int. J. Mech. Sci. 2018, 141, 330–340. [Google Scholar] [CrossRef]
  52. Deng, X.; Qin, S.; Huang, J. Energy Absorption Characteristics of Axially Varying Thickness Lateral Corrugated Tubes under Axial Impact Loading. Thin-Walled Struct. 2021, 163, 107721. [Google Scholar] [CrossRef]
  53. Koehler, J.R.; Owen, A.B. 9 Computer experiments. Handb. Stat. 1996, 13, 261–308. [Google Scholar] [CrossRef]
  54. Jourdan, A.; Franco, J. Optimal Latin Hypercube Designs for the Kullback–Leibler Criterion. AStA Adv. Stat. Anal. 2010, 94, 341–351. [Google Scholar] [CrossRef]
  55. Peng, Y.; Zhou, J.; Hou, L.; Wang, K.; Chen, C.; Zhang, H. A Hybrid MCDM-Based Optimization Method for Cutting-Type Energy-Absorbing Structures of Subway Vehicles. Struct. Multidiscip. Optim. 2022, 65, 228. [Google Scholar] [CrossRef]
  56. Aye, C.M.; Pholdee, N.; Yildiz, A.R.; Bureerat, S.; Sait, S.M. Multi-Surrogate-Assisted Metaheuristics for Crashworthiness Optimisation. Int. J. Veh. Des. 2019, 80, 223. [Google Scholar] [CrossRef]
  57. Altin, M.; Acar, E.; Güler, M. Crashworthiness Optimization of Hierarchical Hexagonal Honeycombs under Out-of-Plane Impact. Proc. Inst. Mech. Eng. Part C J. Mech. Eng. Sci. 2021, 235, 963–974. [Google Scholar] [CrossRef]
  58. Hou, S.; Li, Q.; Long, S.; Yang, X.; Li, W. Multiobjective Optimization of Multi-Cell Sections for the Crashworthiness Design. Int. J. Impact Eng. 2008, 35, 1355–1367. [Google Scholar] [CrossRef]
  59. Zhu, Q.; Lin, Q.; Li, J.; Coello Coello, C.A.; Ming, Z.; Chen, J.; Zhang, J. An Elite Gene Guided Reproduction Operator for Many-Objective Optimization. IEEE Trans. Cybern. 2021, 51, 765–778. [Google Scholar] [CrossRef]
  60. Duan, S.; Tao, Y.; Han, X.; Yang, X.; Hou, S.; Hu, Z. Investigation on Structure Optimization of Crashworthiness of Fiber Reinforced Polymers Materials. Compos. Part B Eng. 2014, 60, 471–478. [Google Scholar] [CrossRef]
  61. Sun, G.; Li, G.; Zhou, S.; Li, H.; Hou, S.; Li, Q. Crashworthiness Design of Vehicle by Using Multiobjective Robust Optimization. Struct. Multidiscip. Optim. 2011, 44, 99–110. [Google Scholar] [CrossRef]
  62. Chen, Y.; Bai, Z.; Zhang, L.; Wang, Y.; Sun, G.; Cao, L. Crashworthiness Analysis of Octagonal Multi-Cell Tube with Functionally Graded Thickness under Multiple Loading Angles. Thin-Walled Struct. 2017, 110, 133–139. [Google Scholar] [CrossRef]
  63. Hussein, R.D.; Ruan, D.; Lu, G.; Guillow, S.; Yoon, J.W. Crushing Response of Square Aluminium Tubes Filled with Polyurethane Foam and Aluminium Honeycomb. Thin-Walled Struct. 2017, 110, 140–154. [Google Scholar] [CrossRef]
  64. Li, G.; Yang, J.; Wu, Z.; Zhang, W.; Okolo, P.; Zhang, D. A Sequential Optimal Latin Hypercube Design Method Using an Efficient Recursive Permutation Evolution Algorithm. Eng. Optim. 2022, 1–20. [Google Scholar] [CrossRef]
  65. Huang, Z.; Zhang, H.; Wang, D.; Yu, H.; Wang, L.; Yu, D.; Peng, Y. Preference-Based Multi-Attribute Decision-Making Method with Spherical-Z Fuzzy Sets for Green Product Design. Eng. Appl. Artif. Intell. 2023, 126, 106767. [Google Scholar] [CrossRef]
Figure 1. The parameter and structural configuration of SCOD: (a) the sketch for thickness parameters; (b) the sketch for dimension of middle wall.
Applsci 13 09750 g001
Figure 2. The simulation model of SCOD.
Applsci 13 09750 g002
Figure 3. The result of mesh convergence analysis.
Applsci 13 09750 g003
Figure 4. The schematic diagram of experiment and finite element simulation: (a) the test tube is placed in the test machine; (b) the test and FE model tubes; (c) FE Simulation of SC.
Applsci 13 09750 g004
Figure 5. The force–displacement curves and collapse modes of SC under experiment test and FE simulation.
Applsci 13 09750 g005
Figure 6. The constituent elements of SCOD and simplified elements.
Applsci 13 09750 g006
Figure 7. The sensitivity analyses of thickness t on crashworthiness: (a) effect of t on IPCF; (b) effect of t on SEA; (c) effect of t on CFE.
Applsci 13 09750 g007
Figure 8. The sensitivity analysis of Dmid on crashworthiness.
Applsci 13 09750 g008
Figure 9. Diagrammatic sketch of environmental selection of DCNSGA-III.
Applsci 13 09750 g009
Figure 10. Schematic diagram of the entire optimization process.
Applsci 13 09750 g010
Figure 11. The Pareto front in 3D space and its projection in 2D planes: (a) the Pareto solutions are reflected in 3D space; (b) the Pareto solutions are reflected in the plane of IPCF-SEA; (c) the Pareto solutions are reflected in the plane of IPCF-CFE; (d) the Pareto solutions are reflected in the plane of SEA-CFE.
Applsci 13 09750 g011
Figure 12. The parametric comparison between initial and optimized structures.
Applsci 13 09750 g012
Table 1. Material properties of AA6061O.
PropertiesValues
Densityρ = 2700 kg/m3
Young’s modulusE = 69.79 GPa
Yield stressσy = 54 MPa
Ultimate stressσu = 163.46 MPa
Poisson’s ratioυ = 0.33
Table 2. The comparative result between the experiment test and FE modeling.
Tube IPCF (kN)MCF (kN)EA (kJ)SEA (kJ/kg)
SCTest18.345.700.346.14
FE17.955.600.346.08
Error2.17%1.78%1.19%0.98%
Table 3. The comparison of SCOD between theoretical prediction and FE model.
NameMethodMCF Value (kN)Error
SCODFE50.002.24%
TH51.12
Table 4. Tolerance and scores of error criteria.
TargetMAXMRERMSER2
IPCF0.033260.0164870.019470.99579
SEA0.167930.077330.087290.91303
CFE0.174810.086940.102080.88035
Tolerance0.30.20.20.88
Table 5. Comparison of optimization results and FE model.
tint
(mm)
tmid
(mm)
tout
(mm)
trib
(mm)
Dmid
(mm)
IPCF
(kN)
SEA
(kJ)
CFE
Optimal solution1.9900.5230.5000.50025.00029.67817.2380.781
FE values29.05018.3710.869
Error2.12%6.57%11.20%
Disclaimer/Publisher’s Note: The statements, opinions and data contained in all publications are solely those of the individual author(s) and contributor(s) and not of MDPI and/or the editor(s). MDPI and/or the editor(s) disclaim responsibility for any injury to people or property resulting from any ideas, methods, instructions or products referred to in the content.

