Article

Low-Frequency Vibrations of Saccharides Using Terahertz Time-Domain Spectroscopy and Ab-Initio Simulations

by
Andreea Aura Paraipan
1,
Nicole Luchetti
2,3,
Adriano Mosca Conte
4,
Olivia Pulci
5 and
Mauro Missori
4,6,*
1
Énergie, Matériaux et Télécommunications, Institut National de la Recherche Scientifique (INRS), 1650 Boulevard Lionel Boulet, Varennes, QC J3X 1S2, Canada
2
Department of Engineering, Campus Bio-Medico University of Rome, Via Álvaro del Portillo 21, 00128 Rome, Italy
3
Center for Life Nano- & Neuro-Science, Italian Institute of Technology, Viale Regina Elena 291, 00161 Rome, Italy
4
Institute of Complex Systems, National Research Council (CNR-ISC), Piazzale Aldo Moro 5, 00185 Rome, Italy
5
ETSF, Department of Physics, Tor Vergata University of Rome, Via della Ricerca Scientifica 1, 00133 Rome, Italy
6
Department of Physics, Sapienza University of Rome, Piazzale Aldo Moro 5, 00185 Rome, Italy
*
Author to whom correspondence should be addressed.
Appl. Sci. 2023, 13(17), 9719; https://doi.org/10.3390/app13179719
Submission received: 31 July 2023 / Revised: 22 August 2023 / Accepted: 24 August 2023 / Published: 28 August 2023
(This article belongs to the Special Issue State-of-the-Art Terahertz Science and Technology II)

Abstract

:
The vibrational properties of molecular crystals in the terahertz range are controlled by the interplay of intermolecular and intramolecular interactions. The resulting delocalized normal modes span a substantial number of atoms within the unit cell of the molecular crystals and cannot be easily attributed to a specific stretching or bending mode. Several compounds were studied to understand the nature of normal modes. However, a systematic analysis of saccharides is still missing. This study investigates the terahertz vibrational properties of various saccharides, including glucose, galactose, lactose, cellobiose, and cellulose. The terahertz spectra were measured using terahertz time-domain spectroscopy. The samples were carefully characterized, and the residual Fabry–Perot oscillations were removed to obtain the absorption coefficient and refractive index of the saccharides. Density functional theory simulations were used to obtain theoretical terahertz spectra, considering hydrogen bonding interactions with an enhanced version of the van der Waals non-local density functional. The results revealed differences in low-energy vibrational modes frequencies, influenced by molecular structure properties, hydrogen bonding networks, and water content. Librations and internal vibrations were identified as dominant dynamics in the saccharides, with significant mixing between intermolecular and intramolecular vibrations. This comprehensive analysis sheds light on the vibrational behavior of saccharides in the terahertz range.

1. Introduction

Terahertz (THz) spectroscopy stands as an established instrument for investigating molecular dynamics, with a special focus on biomolecules [1,2,3,4,5,6]. The central part of the THz spectral region extends from 0.3 THz to 3 THz (wavenumbers 10–100 cm 1 ) and corresponds loosely to photon energies between 1 and 12 meV [1,2], equal to the energy of large-scale molecular vibrations that are mediated by intermolecular bonds [4]. Covalent, ionic, or metallic bonds and, in some situations, even hydrogen bonds (H-bonds), take on the role of shaping the intramolecular arrangement of a molecule’s constituent atoms. The intermolecular forces that hold biomolecules together in the crystal lattice are typically H-bonds or weaker forces such as van der Waals, dipole–dipole, or dispersion forces. The complicated interplay between intramolecular and intermolecular forces is responsible for low-frequency vibrations of molecular crystals and creates the shape of the THz absorption spectrum. At higher frequencies, the spectra are determined primarily by intramolecular forces [2,7].
The THz vibrational modes are delocalized over a large number of atoms within the molecular crystal’s unit cell and are impossible to simply assign to a particular stretch or bend mode, as is possible for infrared spectroscopy, in particular above 1500 cm 1 . This is not a disadvantage but represents one of the strengths of THz spectroscopy, which is able to provide information on the low-frequency collective motion of highly flexible organic molecules and distinguish, for example, among structural isomers [2]. In order to identify and analyze the low-frequency vibrational modes, ab initio simulations based on density functional theory (DFT) calculations are extremely useful. They were utilized to gain insights into the THz spectra of biological molecules. Moreover, these methods find frequent applications in the prediction of vibrational spectra for individual molecules, dimers, and clusters, and their usage is also on the rise for solid-state systems [4,6,7]. However, when dealing with solid-state systems, a significant challenge persists due to the intricate nature of performing periodic DFT modeling on extensive structures such as macromolecules and molecular crystals [8,9]. In addition, it was shown that THz spectroscopy allows us to certify molecular structure and intermolecular H-bonds interactions within compounds, thus, offering a foundational basis for exploring emerging pharmaceutical cocrystal fields at the micro-molecular level [10].
The presence of H-bonds and weaker forces allows biomolecules to be stable and highly flexible in their natural environments [11]. This plays a significant role in biochemical reactions at the basis of life. Saccharides are carbohydrates or sugars that are major products of the photosynthesis of green plants. They are an essential structural component of living cells and function as the main source of energy that fuels various biochemical processes needed to maintain the life of animals and plants. Additionally, they play a relevant role in industrial applications, and they are used in the production of paper, food sectors, pharmaceuticals, and regenerative medicine [12].
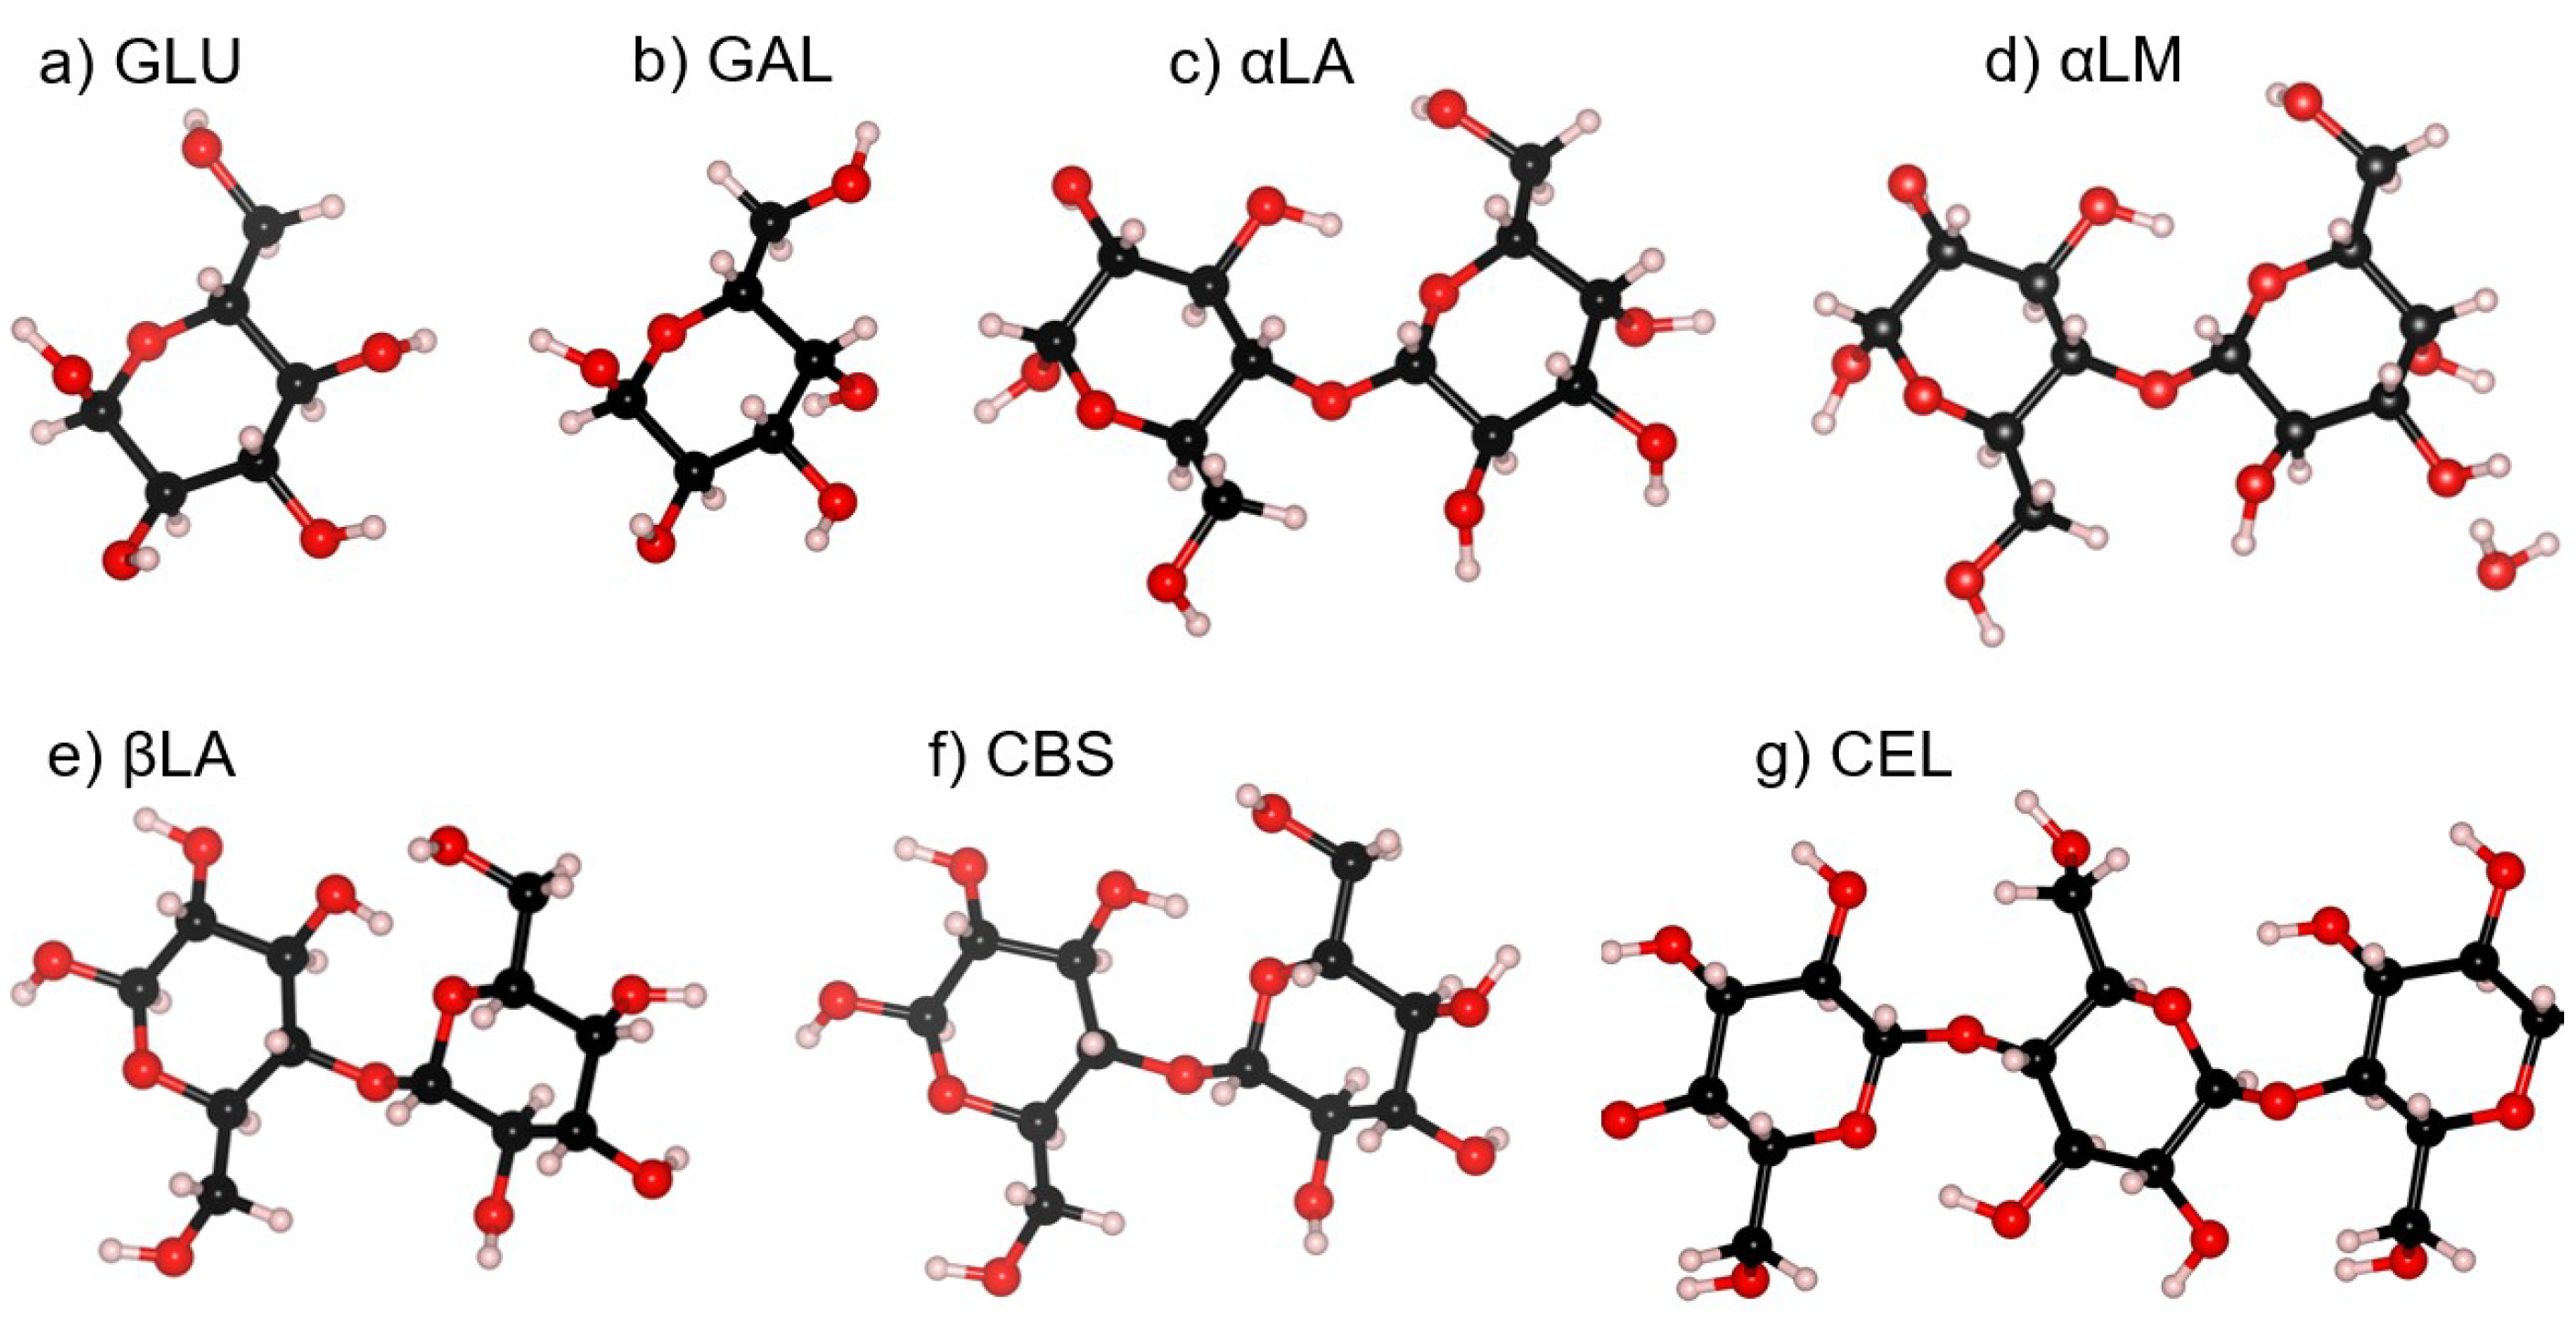
Saccharides may be classified according to the number of monomeric units that comprise them. The compounds studied in this article are: (i) the monosaccharide glucose and galactose, both with C 6 H 12 O 6 molecular structure but with a difference in the direction of the hydroxyl group in the carbon number 4, C(4), of the carbon skeleton; (ii) the disaccharide lactose, made of galactose and glucose units, and cellobiose, made of two glucose units, both bound together by a glycosidic linkage and with the general formula C 12 H 22 O 11 ; (iii) the polysaccharide cellulose, an unbranched chain of D-glucose units linked also in this case by glycosidic linkages with (C 6 H 10 O 5 ) n formula ( n 100). Their chemical structures are reported in Figure 1.
Saccharides have been investigated since the beginning of THz spectroscopy [11,13]. The crystallized form of α -lactose monohydrate (the nomenclature given in [14] is adopted) has become a sort of “gold standard” for THz spectroscopy due to its wide availability, low cost, and the typical absorption spectrum with two strong and narrow peaks at 0.53 and 1.37 THz [6,15,16,17,18,19,20]. Another lactose polymorph, β -lactose, was studied in the frequency range of approximately 0.2–2 THz in a mixture with the α -form to quantitatively evaluate the anomer content in a non-destructive way. [17]. The influence of water content in the lactose molecular crystal THz spectra was also studied recently, reporting complex phase transformations as a function of temperature [6].
Using temperature-dependent THz spectroscopy, the temperature-induced molecular decomposition of α -lactose monohydrate was studied [21], and the reaction rates and Arrhenius activation energy of the thermoactivated solid-state reaction were determined [22]. In a recent study, the temperature dependence of the vibrational spectra and the resonance parameters of α -lactose monohydrate and other saccharides, including galactose and glucose monohydrate, was investigated. Anharmonicity in the vibrational modes appears as coupling between resonances and the creation of wide asymmetric bands, revealing a temperature-dependent square relationship for resonance eigenfrequencies in saccharides [23,24].
Anhydrous and monohydrate glucose spectra were experimentally investigated in the frequency range 0.3–3.7 THz [20] and compared to solid-state DFT simulations [25]. A 6 cm 1 (0.18 THz) overestimation of the predicted vibrational frequencies was observed for anhydrous glucose and interpreted as vibrational anharmonicity effects. In another study, the THz spectral transformation of monohydrate glucose under dehydration was measured in the range 0.8–2.2 THz [26].
The THz absorption spectrum and refractive index of galactose were measured in the frequency range of 0.2–3 THz. Simulations using the Gaussian 03 package were conducted on isolated galactose molecules, and the predicted vibrational frequencies partially matched the experimental ones. The authors suggested that the non-predicted resonances might be due to interactions between galactose molecules. In a subsequent study, the absorption spectrum of galactose was measured in the range of 0.5–4 THz. The structural analyses and normal mode calculations were performed by using solid-state and gas-phase DFT simulations. The results demonstrated good agreement between experimental spectra and simulations, with differences within 0.2 THz [27].
The THz absorption spectrum of cellobiose was measured in the 0.5–3.8 THz interval [28]. The cellulose THz spectrum was first investigated with the main goal to determine the crystallinity of the sample [29]. It was later studied in more detail in single freely standing paper sheets made of cotton cellulose, mainly in the I β phase, in the 0.2–3.5 THz range [30]. By eliminating the Fabry–Perot (FP) interference effects from the transmittance data, the complex refractive index was numerically extracted [31]. The cellulose spectrum consists of two main peaks at approximately 2.1 and 3.1 THz superimposed to the background due to the amorphous phase. A more recent study was focused on distinguishing the THz spectra of cellulose I allomorph (I α and I β ), which exhibits differences in its crystal structure [32].
None of these studies focused on the measurement of the attenuation (or absorbing) coefficient ( α ) or the molar attenuation coefficient ( ϵ ) of the compounds according to the Lambert–Beer law A = log T = ϵ d c = α d , where T is the transmittance, c is the concentration, and d the thickness of the sample. Furthermore, the THz refractive index of the saccharides was rarely measured, although this measurement is easy for systems based on THz time-domain spectroscopy (THz-TDS), which allows the detection of the amplitude and phase of the coherent THz radiation [2,33]. The coherence of the THz radiation poses a crucial challenge when extracting optical parameters from the transmission data in THz-TDS, leading to FP interference effects due to the multiple reflections within planar samples. Several authors in the past have proposed different numerical methods to eliminate FP effects in the spectral data [31,34,35,36,37,38]. However, in all the previous described studies on the THz spectra of saccharides, although flat and parallel-faced samples were used, no mathematical techniques for the elimination of FP effects were employed.
In this work, we used THz-TDS to measure the transmission spectra of the previously cited seven saccharides in their solid state from 0.3 to 3.3 THz. The samples were carefully prepared as pellets made of saccharides and polyethylene (PET) powders. We eliminated the FP effects and estimated the volume fraction of air within the pellets in order to obtain a quantitative estimation of the absorption coefficient (in cm 1 ) and the refractive index as a function of the frequency. The DFT simulations were carried out by using a state-of-the-art method for the calculation of H-bonding interactions, which drives the collective motion of organic molecules. Simulation results provided the frequency of the vibrational modes and allowed us to characterize them in terms of intermolecular translations, intermolecular librations, and intramolecular vibrations.

2. Materials and Methods

2.1. Samples

We used for our experiments the following saccharides samples from Merck (Rahway, NJ, USA) (the abbreviations that will be used for the compounds from here on are indicated in brackets): anhydrous (96%) α -D-Glucose (GLU), pharmaceutical secondary standard D-galactose (GAL), analytical standard α -lactose monohydrate ( α LM), pharmaceutical secondary standard anhydrous α -lactose ( α LA), pharmaceutical secondary standard anhydrous β -lactose ( β LA), analytical standard β -cellobiose (CBS), and Avicel® PH-101 microcrystalline cellulose I β (CEL). Ultra-high molecular weight, surface-modified, 40–48 μ m particle size polyethylene (PET) was purchased from Sigma-Aldrich (St. Louis, MO, USA). All compounds were used without further purification.

2.2. Design of the Experiment (DOE)

The spectroscopic measurements were carried out on pellets prepared by mixing specific amounts of saccharides with PET powder at a mass ratio to obtain the highest optical absorbance within the dynamic range ( D R ) of the THz-TDS set-up [2]. The highest absorbance ( α d ) m a x that can be measured by the THz-TDS set-up is computed by using Equation (1) [2]:
( α d ) m a x = 2 ln D R 4 n ( n + 1 ) 2 .
where n is the refractive index of the sample. The graphs of D R and ( α d ) m a x as a function of the frequency are shown in the Supplementary Materials. To estimate the mass ratios of saccharides to PET in the pellets that give the highest absorbance, the absorption coefficient of the main THz peaks of the saccharides investigated in this work, α s M , together with their refractive indexes in the THz range, were obtained from the preliminary THz-TDS experiments.
The absorption coefficient of the pellets ( α p M ) corresponding to the main saccharide peaks can be expressed as
α p M = α s M ν s + α P E T M ( 1 ν s )
where ν s is the volume fraction of saccharides, and α P E T M is the absorption coefficient of PET at the frequency of the main saccharide peaks. Thus, the maximum thickness of the pellets is given by
d m a x = ( α d ) m a x α p M .
In practice, to avoid having a THz signal transmitted through the pellets at the same level as the noise floor of the THz-TDS set-up, a pellet thickness of d = d m a x / 3 was chosen. Then, the masses of saccharides (m s ) and PET (m P E T ) in the pellets can be calculated as follows:
m s = ρ s V p ν s
and
m P E T = ρ P E T V p ( 1 ν s )
where V p = π r 2 d is the total volume of the pellet with radius r (6.5 mm in our case) and the chosen thickness d, and ρ s and ρ P E T are the mass densities of the saccharides and PET, respectively (values used in the calculations are shown in the Supplementary Materials). The calculated values of the saccharides and PET mass ratios varied from approximately 1:10 to approximately 1:5.

2.3. Pellets Preparation

Seven pellets were prepared using the masses of powders obtained by the procedure described in the previous section. In addition, one pellet made of PET powder only was prepared. The powders were weighted by using an analytical scale SARTORIUS Analytic A200S (Göttingen, Germany) with a sensitivity of 0.1 mg. After weighing, each saccharide was carefully mixed with PET. The mixed powder was then transferred into the 13 mm diameter pellet die (Perkin Elmer, Waltham, MA, USA). Then, the pellet die was inserted into a manual hydraulic press and was connected to a rotary vacuum pump EDWARDS E2M2 (London, UK) with a maximum displacement of 2.8 m 3 /h and ultimate vacuum without gas-ballast of 2.5 × 10 4 mbar. The vacuum pump was turned on for five minutes without applying pressure to the pellet die. Then, maintaining the rotary vacuum pump on, the pellet die was subjected to a slow growing pressure up to approximately 369 MPa, and then left at this pressure for 10 min.
Subsequently, in order to improve the homogeneity of the pellets, the pellet die was disconnected from the vacuum pump and removed from the hydraulic press and heated at approximately 80 °C, placing it in a FALC TD thermoblock for 15 min. Since the melting temperature of the PET is approximately 110 °C and the saccharides do not undergo any structural change at this temperature (for example, α LM undergoes a transition to β LA at temperatures above 93.5 °C [39]), it is expected that the unique effect of heating is the softening of the PET particles. This allows a better filling of the voids within the powder particles, giving a decrease in the scattering of the THz radiation [2]. The pellet die was then removed from the thermoblock and quickly placed again in the hydraulic press. Then, the pressing process was repeated at approximately 737 MPa for 10 min. By using this procedure, very homogeneous cylindrical pellets with a whitish appearance were obtained. Their thicknesses were measured by a thickness gauge with 0.01 mm accuracy ranged from 1.28 to 3.39 mm. The measured pellet masses are slightly lower (usually less than 10 mg) than the sum of the masses of saccharides and PET powders used in their preparation. This loss of mass is most likely caused by the transfer process of powders into the pellet die.

2.4. THz Time-Domain Spectroscopy Set-Up

The THz spectra were captured via transmission mode at a temperature of around 300 K, utilizing a Menlo Systems (Planegg, Germany) TERA K15 THz-TDS system. This setup featured photoconductive antennae stimulated by a femtosecond fiber-coupled laser (Menlo Systems T-Light). The femtosecond laser emitted light at a wavelength of 1560 nm, with a repetition frequency of 100 MHz and an optical pulse duration of roughly 90 fs. The THz radiation emitted by the photoconductive antenna underwent collection and focusing through a pair of polymethylpentene (TPX) lenses, each with a 50 mm focal length. The radiation transmitted through the sample pellets was then gathered and directed onto the detector antenna, employing another identical pair of TPX lenses with a 50 mm focal length.
For all measurements, the delay line scan range covered 200 ps, resulting in a spectral resolution of 5 GHz. The data points were recorded at intervals of 33.3 fs, with a scanning rate of approximately 4 Hz. Each spectrum was derived from an average of 2163 scans, each spanning roughly 0.23 s. This means that the acquisition time for each sample or reference was 500 s. The system’s spectral range extended from 0.3 to 4.4 THz. The frequency-dependent dynamic range ( D R ) measured approximately 85 dB at 0.35 THz and approximately 22 dB at 3.5 THz (refer to Supplementary Materials, Figures S1 and S2).
The pellets were positioned within the transmission lines, and their two flat parallel surfaces were set perpendicular to the THz beam line axis, all within a sample holder. The sample holder was a plate of 14.5 × 14.5 cm 2 and with a thickness of 0.6 cm with 16 circular pellet slots and an opening of 12 mm in diameter, realized in polylactic acid (PLA) by using a 3D printer ANYCUBIC i3 MEGA (Shenzhen, China). The sample holder was affixed to a bidirectional translation stage designed for mapping purposes, enabling movement within the xy plane perpendicular to the THz beam. This configuration facilitated automated sequential measurements of all samples. Movements along the x and y directions were synchronized with THz measurements by using a self-made program in a LabVIEW (NI, Austin, TX, USA) environment. For each pellet, three transmission measurements were performed in different spots separated by 2 mm. The spectral measurements were performed out of the THz focus (approximately 7 mm away from the THz nominal focus) so that the THz pulse could probe a large area, thus, minimizing the pellets’ heterogeneity-related effects. The THz beam profile was carefully characterized before measurements by means of knife-edge measurements [40,41] at the sample position in order to know its size and assure its complete transmission through the pellets. The measured THz spot was approximately 7 mm in diameter.
Since water vapor, due to environmental humidity, absorbs THz radiation at frequencies corresponding to the molecular rotational transitions [42], the THz set-up was placed into a closed compartment purged with dry nitrogen (N 2 ). The relative humidity (RH) inside the compartment was measured by using a data logger HygroLog HL-20D (Rotronic, Switzerland). The spectral measurements were not carried out until the datalogger showed RH = 0 within its accuracy and the water vapor absorption lines were indistinguishable from noise up to 2.5 THz (nearly 120 min of purging before the first spectra acquisition).

2.5. THz-TDS Data Analysis

THz-TDS spectroscopy offers the capability to determine the complex refractive index of a sample, denoted as n ^ , as a function of angular frequency ω [2]:
n ^ ( ω ) = n ( ω ) + i k ( ω ) = n ( ω ) + i α ( ω ) c 2 ω
where n ( ω ) is the phase refractive index, k ( ω ) is the extinction coefficient, α ( ω ) = 2 k ω c is the absorption coefficient, and c is the speed of light.
In our spectroscopic measurements in transmission mode, two time-domain THz pulses propagating through the pellets (sample) and through the N 2 atmosphere (reference) were recorded, and their spectral amplitude and phase, E ^ s ( ω ) for the sample and E ^ r ( ω ) for reference, were calculated by a standard discrete fast Fourier transform (FFT) algorithm implemented in a Wolfram Mathematica (Champaign, IL, USA) program.
E ^ s ( ω ) and E ^ r ( ω ) were compared by using the complex transfer function T ^ ( ω ) , defined as
T ^ ( ω ) = T ( ω ) e i ϕ ( ω ) = E ^ s ( ω ) E ^ r ( ω )
where T ( ω ) and ϕ ( ω ) are the transfer function amplitude and phase, respectively.
The variation of n ^ ( ω ) with frequency can be deduced through the solving of the inverse scattering problem for electromagnetic waves. This involves equating the experimental transfer function
T ^ e x p ( ω j ) = E ^ s ( ω j ) E ^ r ( ω j )
(j is a data array index) to the analytical expression of T ^ ( ω j ) , obtained by solving the direct electromagnetic problem.
The coherence of THz radiation in THz-TDS poses a significant challenge when extracting optical parameters from E ^ s ( ω ) and E ^ r ( ω ) due to the established FP interference effect resulting from multiple reflections within the sample [43]. In this scenario, the analytical form of T ^ ( ω ) , derived using the transfer matrix method [44], is
T ^ ( ω ) = E s ( ω ) E r ( ω ) = 4 n ^ ( 1 + n ^ ) 2 e α d / 2 e i n ^ ω d / c F P ( ω )
where the F P term takes into account the FP interference effect
F P ( ω ) = 1 1 n ^ 1 n ^ + 1 e α d e i 2 n ^ ω d / c .
Equations (9) and (10) are valid for radiation impinging perpendicularly on a flat sample. The extraction of the optical parameters as a function of frequency can be performed by equating the theoretical and experimental transfer functions: T ^ ( ω j ) = T ^ e x p ( ω j ) . However, this equation can be solved only numerically.
In order to determine the optical parameters of saccharides from the THz-TDS spectral data, we have employed a numerical procedure written in the Wolfram Mathematica environment and already described in previous articles [30,31]. This procedure is based on the Davidenko method [45] for finding the roots of complex functions. It establishes frequency-dependent optical parameters by solving the implicit equation derived from equating the experimental and theoretical transfer functions, incorporating the self-contained FP effects. The comprehensive elimination of residual FP oscillations inherent in the optical parameter trends is achieved solely through the optimization of sample thicknesses.

2.6. Absorption Coefficients and Refractive Indexes Calculations

The DOE, as discussed in Section 2.2, did not incorporate the potential existence of a volume fraction of air, ν a i r , within the pellets, which could modify the optical parameters. Thus, in order to obtain more precise values of the saccharides’ absorption coefficient and refractive index, the value of ν a i r was estimated for all pellets. As already reported in Section 2.3, the mass of the pellets was always lower than the sum of the masses of saccharides and PET used for their preparation. Then, the actual masses of saccharides and PET in the pellets, m s a and m P E T a , respectively, were estimated. The overall lost mass in the preparation is m p l o s s = m p ( m s + m P E T ) , where m p is the weighed mass of the pellet. It is then possible to estimate m s a and m P E T a by assuming that their lost masses, m x l o s t , are proportional to their weighted mass percentage in the pellet:
m x a = m x m x l o s t = m x m x m p m p l o s s
where x = s , P E T .
From the knowledge of the mass densities of the saccharides and PET (values used in the calculations are shown in the Supplementary Materials), it is then possible to calculate their actual volume fraction, ν x a , as
ν x a = m x a V p ρ x
Since ν a i r + ν P E T + ν s = 1 , it is possible to recover ν a i r . The results are shown in Table 1.
Such values can now be used to calculate the absorption coefficients, α s , and the refractive indexes, n s , of the saccharides. Since the absorption coefficient and the refractive index of the pellets, α p and n p , respectively, are
α p = α s ν s + α a i r ν a i r + α P E T ν P E T .
and
n p = n s ν s + n a i r ν a i r + n P E T ν P E T .
by assuming α a i r = 0 and n a i r = 1 in the in the measured THz range, then
α s = α p α P E T ν P E T ν s ,
and
n s = n p ν a i r ν P E T n P E T ν s .
Values of α P E T and n P E T were recovered from measurements of pure PET pellets. The behaviors of α s as a function of the frequency are shown in Section 3, while those of n s are shown in Figure S11 of the Supplementary Materials.

2.7. DFT Simulations

All the studied saccharides are modeled as crystals and their geometry is optimized by using a DFT plane-wave code with ultrasoft pseudopotentials that are included in the Quantum Espresso package. The convergence criterion of geometry optimization for total energy and force were both set at 1.0d-5 Ry. The theoretical THz spectra were obtained by exploiting DFT ab initio techniques. The Quantum Espresso package was used with the plane-waves basis set, within the finite displacements framework (FD code) [46,47]. To account for van der Waals interactions, a non-local van der Waals density functional known as vdW-DF2 was utilized. This functional builds upon the precise semilocal exchange functional, PW86 [48], and was selected to enhance the portrayal of H-bonds [49,50].
Ultrasoft pseudopotentials [51], suitable for the non-local van der Waals functionals, were generated [52]. When using such functionals, the convergence on both wavefunctions and the charge cutoff is a delicate issue. In this study, Kohn–Sham wavefunctions were truncated using a cutoff of 40 Ry, while the charge density employed a cutoff of 800 Ry. The Irreducible Brillouin Zone was discretized using 14 k-points. The vibrational properties were evaluated through finite displacements within the DFT framework under the harmonic approximation. The calculations encompassed phonon eigenvalues and eigenfunctions at the Γ point, alongside the determination of Born effective charges. The simulated crystal structures and parameter information can be found in the Supplementary Material.
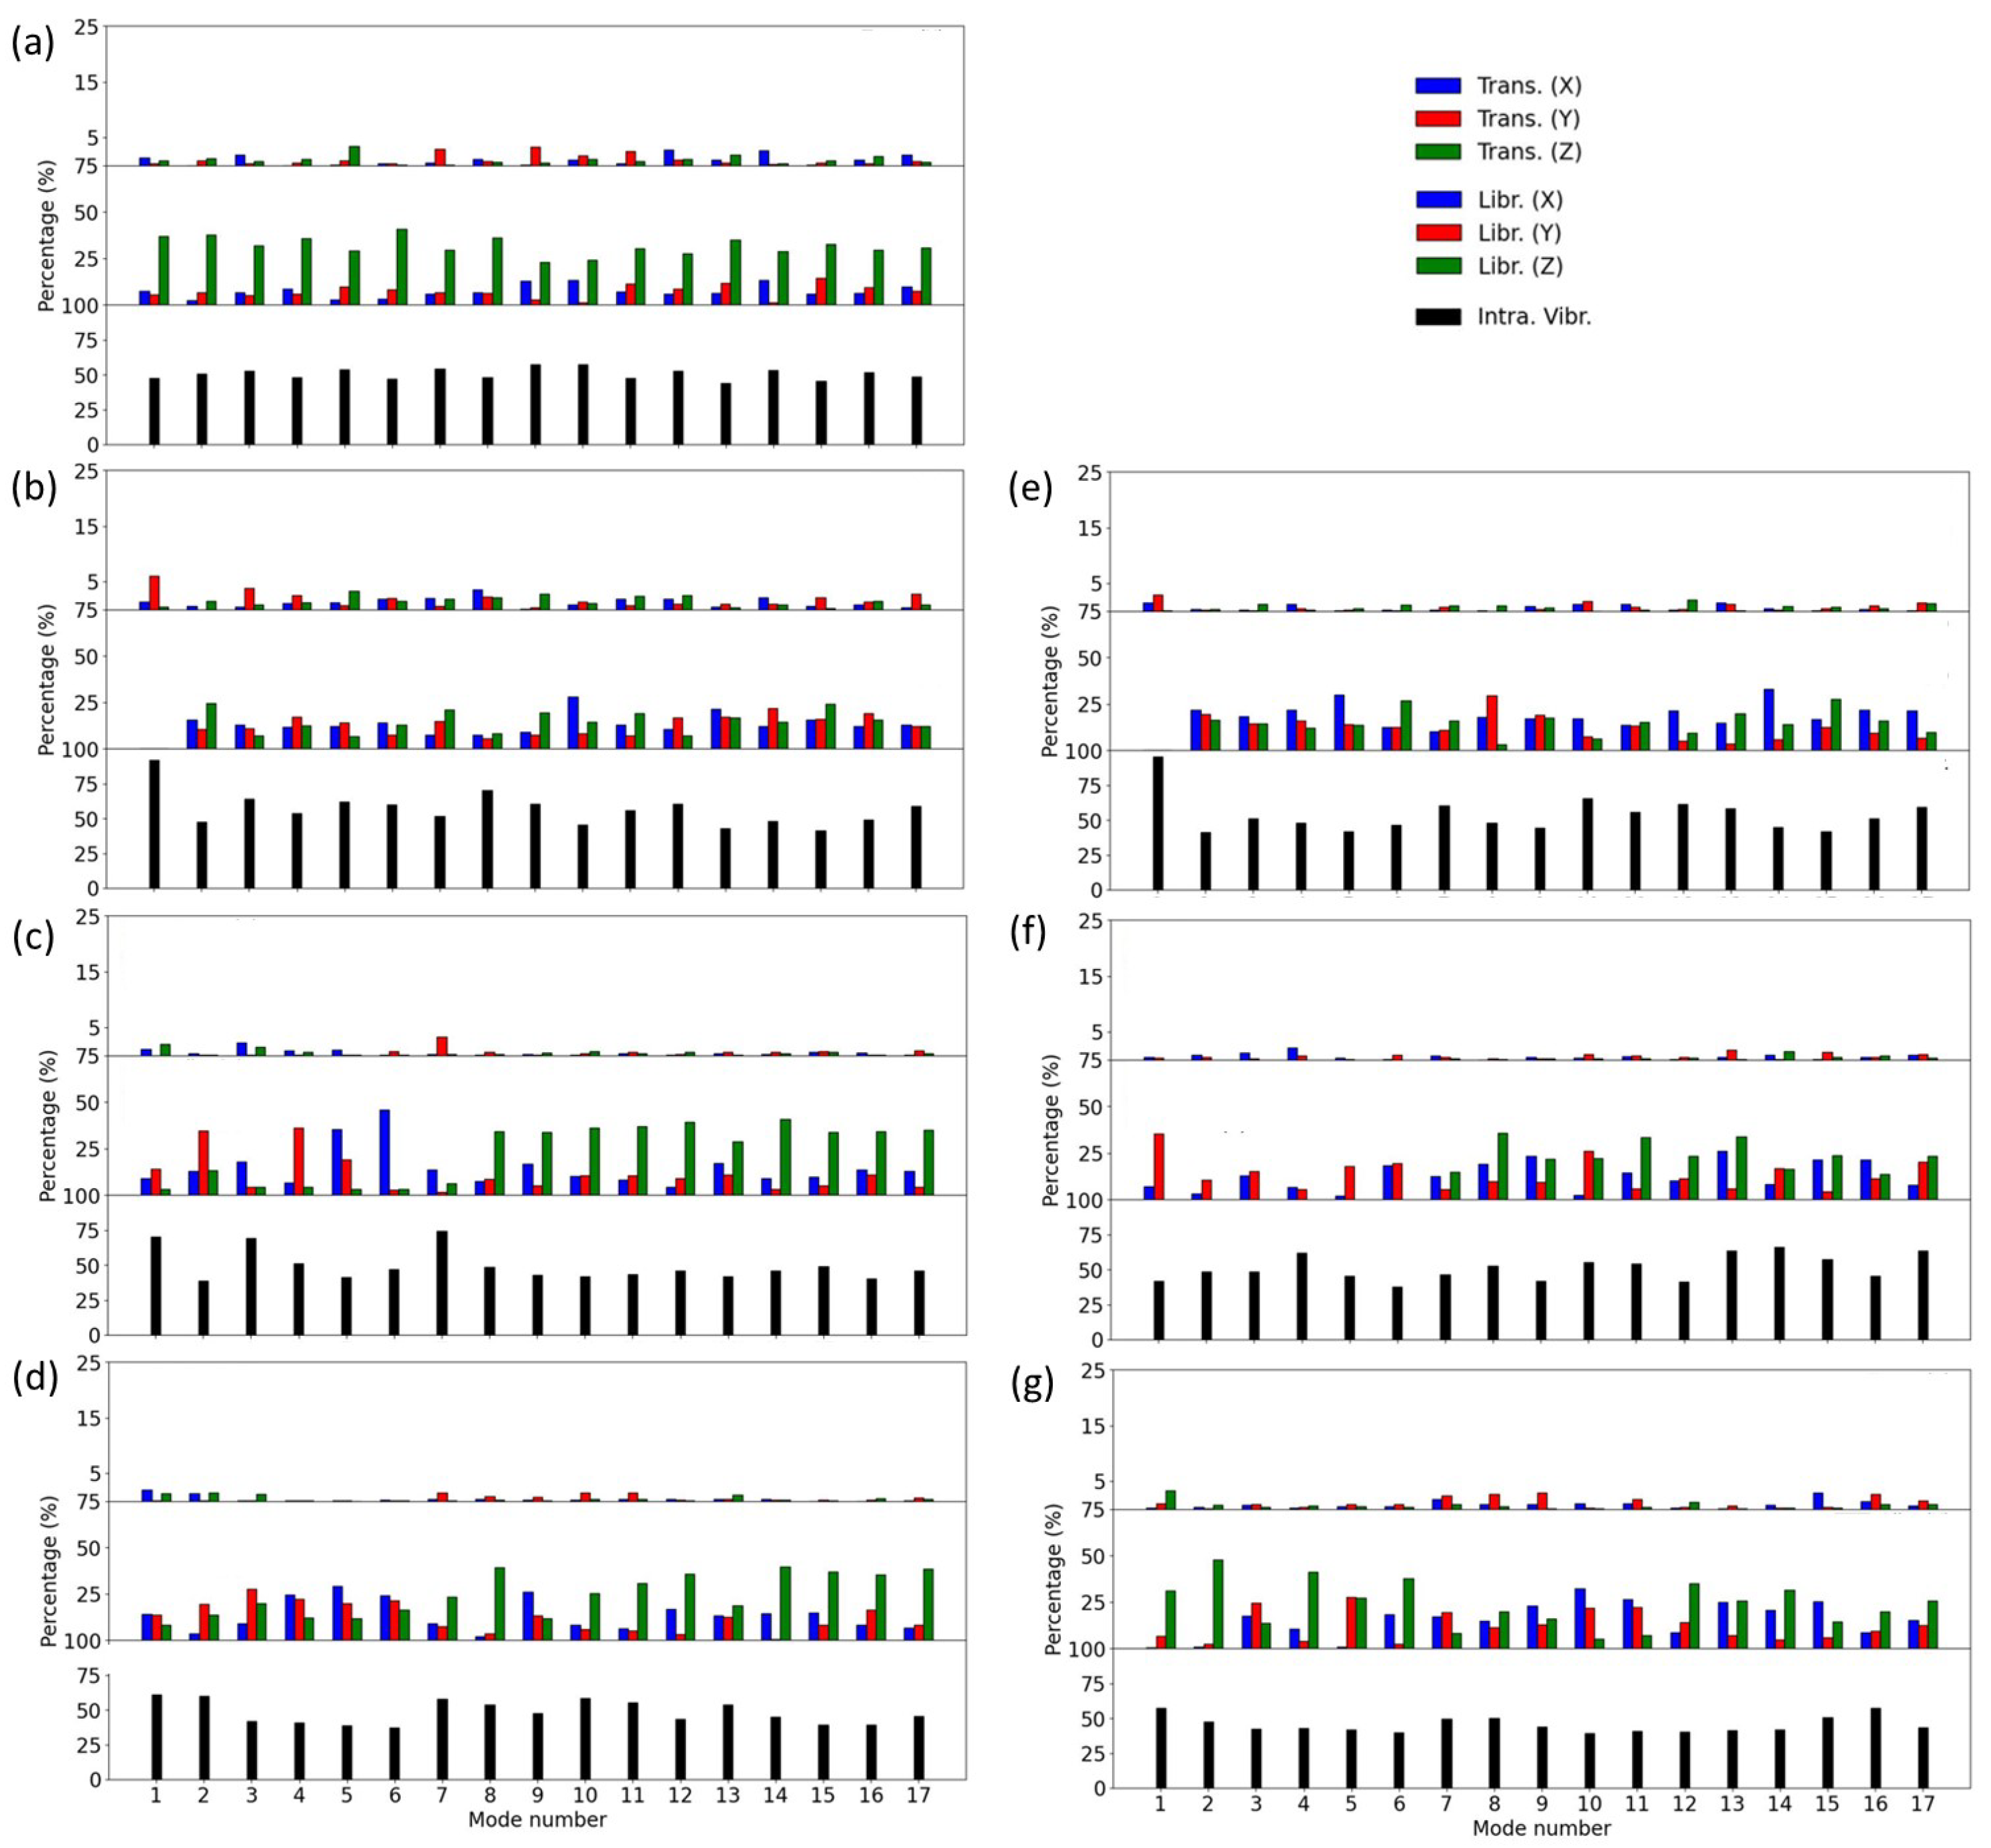
2.8. Mode Analysis

The observed absorption characteristics of saccharides could arise from intermolecular vibrations facilitated by networks of H-bonds, as well as intramolecular vibrations encompassing the collective backbone motions of molecules. The intermolecular vibrations may entail both translations and rotations of molecules. In this investigation, we adopted the method outlined by F. Zhang et al. [7] for mode analysis, which aims to categorize molecular optical phonon modes in relation to intermolecular translations, intermolecular librations, and intramolecular vibrations.
This method’s focus lies in assessing vibrations within the irreducible molecular units present within the unit cell. In specific cases, such as α LA, α LM, β LA, CBS, and CEL, there are two molecules per unit cell, while GLU and GAL possess four molecules per unit cell. Intermolecular translations are characterized by the center of mass (COM) displacement along the crystallographic Cartesian coordinate system’s three axes: X, Y, and Z. Intermolecular libration, involving the constrained rotation of the entire molecule as a rigid body, can be deconstructed into three independent librations about the molecule’s three principal axes: x, y, and z.
For intramolecular vibrations within the nth mode, the displacement vector of the ith atom is determined by subtracting the contributions of all translations and principal librations from its overall motion. The amplitudes of the translations, principal librations, and intramolecular vibrations for the nth normal mode are ascertained using the root-mean-square mass-weighted atomic displacement of all atoms within the molecule, given by the equation:
D l n = 1 N i = 1 N m i ( Δ i V n , l ) 2
Here, Δ i V n , l signifies the atomic displacement vectors of an irreducible molecule in the nth normal mode, with V representing X, Y, or Z and l pertaining to the three translations and three principal librations. N denotes the number of atoms in the molecule. The percentage contribution P l n of each component within the nth mode is computed as follows:
P l n = D l n l D l n × 100 % .
The analysis of the vibrational modes was performed using the atomic displacement vectors associated with each vibrational mode obtained from DFT simulations. A Fortran language program was written for this purpose.

3. Results

3.1. β LA, CBS and CEL

The THz spectra of β LA, CBS, and CEL are shown in Figure 2a. Across all spectra, a general trend emerges: the absorption coefficient rises with frequency, transitioning from levels below 10 cm 1 at 0.3 THz to approximately 200 cm 1 at 3 THz. The increasing background intensity as a function of frequency is a common trend for organic molecular crystals, and it is due to the increasing vibrational density of states (VDOS) of the amorphous phase in the compounds [7,30]. Superimposed on this trend, several peaks due to the crystalline phases can be observed, whose frequency and intensity strongly depend on each compound (Table 2).
The THz vibrational absorption spectrum of β LA presents five peaks at 0.53, 1.20, 1.37, 1.85, and 2.21 THz in the range 0.3–2.7 THz (Figure 2a). The small intensity peaks at 0.53 and that at 1.37 THz correspond to the spectral fingerprints of α LM (see Figure 2 and Table 2), which is present in small quantities in β LA [17]. The observed peak at 1.20 THz is assigned to β LA, as already observed in a study focused on the non-destructive evaluation of particle size in lactose powder [16] and on the identification of anomers in lactose [17]. To our knowledge, the other peaks have never been described.
As already described, THz-TDS spectroscopy, being able to access the phase of the electromagnetic impulses transmitted through the samples, allows the measurement of their refractive index. Using the procedure described in Section 2.6, it was possible to obtain the refractive index, n s (Equation (16)), of all the studied compounds. The graphs of n S as a function of the frequency of the studied saccharides are presented in Figure S11 of Supplementary Materials.
The THz vibrational absorption spectrum of CBS presents five peaks at 1.24, 1.54, 2.07, 2.31, and 2.66 THz in the range 0.3–3.2 THz (Table 2). The peak at 1.24 THz was detected in [13], and all peaks were also shown in reference [4].
The THz vibrational spectrum of CEL is characterized by a monotonic increase from 0.3 THz to approximately 1.6 THz, followed by a broad and not very intense peak at 2.15 THz (Table 2). This peak was recently investigated in detail, and it was shown that it is typical of the cellulose I β polymorph exclusively [32]. In the region around 3 THz, another not intense peak can be appreciated, barely distinguishable from the noise. As reported in [53], the spectroscopic features of CEL around 3 THz depend on the cellulose water content. The CEL, equilibrated at a relative humidity RH = 47.7%, presents well-defined bands at approximately 2.6 and 3 THz. As the RH is decreased, a strong reduction in the intensity and a broadening of the bands are observed. For CEL, equilibrated in a dry environment, as in the present study, only low intensity and broad spectroscopic features, are observed at approximately 2.73, 3.00, and 3.19 THz, hardly detectable from noise.
The broad peak at 1.85 THz of β LA is the most intense, and it was assigned to the calculated peaks at 1.79 and 1.83 THz, which correspond to modes number 2 and 3 (Figure 2a,b). The other broad peak at 2.21 THz can be assigned to the calculated peak at 2.27 THz, which corresponds to mode number 4. The two most intense peaks of CBS at 2.07 and 2.31 THz were assigned to the calculated modes at 2.01, 2.06, and 2.15 THz, and at 2.42 and 2.48 THz, respectively, which correspond to mode numbers from 4 to 8 (Figure 2a,b). The other three weaker peaks at 1.24, 1.54, and 2.66 THz were assigned to the simulated peaks at 0.89, 1.53, and 2.77 THz, which correspond to modes numbers 1, 2, and 9, respectively. The shoulder at 2.15 THz of CEL was assigned to the calculated mode at 2.23 THz, which corresponds to mode number 2 (Figure 2a,b). The other three peaks at 2.73, 3.00, and 3.19 THz were assigned to the calculated peaks at 2.73, 3.00, and 3.27 THz, corresponding to vibrational modes 3, 4, and 5 (see also Table S2 of Supplementary Materials).
The frequencies of the simulated peaks of β LA, CBS, and CEL in the 0.3–3.3 THz range are shown in Figure 2b and in Table 3.

3.2. GLU, GAL and α LA

The THz absorption spectra of GLU, GAL, and α LA are shown in Figure 3a. In all the spectra, an increasing background intensity as a function of frequency due to the amorphous phase in the compounds is observed [7,30]. Superimposed on this trend, several peaks due to the crystalline phases can be observed. The measured absorption spectrum of GLU presents six peaks at 1.28, 1.43, 2.08, 2.52, 2.68, and 2.92 THz (Table 2). The most evident peak is at 1.43 THz. The other four peaks are two shoulders (1.27 and 2.08 THz), two broad peaks at 2.52 and 2.68 THz that almost merged, and another broad peak at 2.92 THz. The observed peaks are at frequencies compatible with those found in the previous studies for anhydrous glucose [11,25,26,54] and consistent with frequencies observed at 300 K in a temperature-dependent experiment [23].
The absorption spectrum of GAL presents three peaks at 1.20, 2.13, and 2.32 THz in the 0.2–3.2 THz range. A barely distinguishable peak from noise is noticeable at approximately 2.85 THz. The most evident peaks are at 2.13 and 2.32 THz. This last peak shows the highest absorbing coefficient (486.8 cm 1 , see Table 2) among all the studied saccharides. The observed peaks are at frequencies compatible with those found in a previous study for GAL [55] and consistent with frequencies observed at 300 K in a temperature-dependent experiment [23].
The frequencies of the simulated peaks of GLU, GAL, and α LA in the 0.3–3.3 THz range are shown in Figure 3b and in Table 3. The most intense peaks of GLU at 1.43 and 2.52 THz were assigned to the simulated peaks at 1.61 and 2.54 THz, respectively, which correspond to mode numbers 1 and 7. The broad peaks at 2.08, 2.68, and 2.92 THz were assigned to the calculated peaks at 2.05, 2.77, and 3.00 THz, respectively, which correspond to mode numbers 4, 8, and 9. The discrepancy between the experimental peaks’ positions and the calculated frequencies is always less than 0.18 THz, which corresponds to ≈0.7 meV, an energy shift compatible with the simulation accuracy. The most evident peaks of GAL at 2.13 and 2.32 THz were assigned to the simulated peaks at 2.17 and 2.33 THz, respectively, which correspond to mode numbers 3 and 5.

3.3. α LM, α LA, β LM

The THz absorption spectra of α LA, β LA, and α LM are shown in Figure 4a. Furthermore, for these spectra, as a function of frequency, an increasing background intensity due to the amorphous phase in the compounds is observed [7,30]. Superimposed on this trend, several peaks due to the crystalline phases can be observed whose frequency and intensity depend on each compound (Table 2). The experimental absorption spectra of the two anhydrous isomeric forms of lactose, α LA and β LA, are qualitatively and quantitatively very similar, showing five peaks of similar intensity in the range 0.3–2.9 THz centered at 1.20, 1.83, 2.21, 2.39, and at approximately 2.68 THz for β LA, and at 1.19, 1.86, 2.20, 2.39, and at approximately 2.68 THz for α LA (Table 2). Moreover, β LA shows two low-intensity peaks at 0.53 and 1.37 THz.
The spectra of these anhydrous forms are partially different from that of the lactose hydrous form α LM, which shows peaks with smaller widths in the range 0.3–3 THz at 0.53, 1.19, 1.37, 1.81, 2.55, and 2.87 THz. The most evident peaks are at 0.53, 1.37, 2.55, and 2.87 THz. The observed peaks are at frequencies compatible with those found in the previous studies for monohydrate lactose [4,6,15,16] and consistent with frequencies observed at 300 K in a temperature-dependent experiment [23].
Interestingly, the small intensity peaks found in the anhydrous forms at 0.53 and 1.37 THz were shown to belong to a small amount of α LM [17]. Two spectral regions at approximately 1.19 THz and at 1.83 THz show peaks that appear in all spectra of the anhydrous or hydrous lactose forms, even if their spectral width is lower in α LM. Interestingly, as was recently observed, the peaks of the anhydrous forms of lactose are at frequencies that differ from those found for α LM submitted to heating at 377 K to remove water molecules [6]. This suggests that the phase transformations of lactose are complex, as was also stated by the same authors of Ref. [6].
The frequencies of the simulated peaks of α LM and α LA in the 0.3–3.3 THz range are shown in Figure 4b and in Table 3 (for β LM see Section 3.1). The most evident peaks of α LA at 1.19, 1.86, and approximately 2.68 THz were assigned to the calculated modes at 1.04, 1.93, and 2.84 THz, which correspond to mode numbers 2, 4, and 7, respectively. The smaller peaks at 2.20 and 2.38 THz were assigned to the modes at 2.25 and 2.38 THz, respectively, which correspond to mode numbers 5 and 6. The most intense peaks of α LM at 0.53, 1.37, 2.55, and 2.87 THz were assigned to the calculated modes at 1.12, 1.40, 2.51, and 2.82 THz, which correspond to mode numbers 1, 2, 6, and 7 (Figure 4b), respectively. The discrepancy between the experimental peak position at 0.53 THz and the calculated frequency for mode 1 is 0.67 THz, which corresponds to ≈2.8 meV. As was recently demonstrated, the frequencies of the calculated THz peaks of α LM strongly depend on the position of the added water molecule in the α -lactose molecule. This can explain the discrepancy between the experimental and the calculated frequency of the first peak, since in our simulations, we have not changed the position of the water molecule but we have used the coordinates obtained from X-ray diffraction measurements from PubChem (https://pubchem.ncbi.nlm.nih.gov/compound/alpha-lactose, accessed on 24 February 2020).

3.4. Analysis of Vibrational Modes

The mode decomposition described in Section 2.8 was used to analyze the low-frequency vibrational modes of all the studied saccharides. Figure 5 illustrates the proportional contributions, as determined through Equation (18), of the initial 17 modes’ intermolecular translations, librations, and intramolecular vibrations. The values of the intermolecular translations shown in Figure 5 are the average of those found for each saccharide molecule in the unit cell (two molecules for aLA, aLM, bLA, CBS, and CEL and four molecules for GAL and GLU). The intermolecular libration and the intramolecular vibrations dominate the optically active normal modes at the THz frequencies. Instead, weak (≤5%) intermolecular translations are found.
The atomic displacement vectors for the most prominent vibrational modes of the examined saccharides are shown in Figures S12–S18 of the Supplementary Materials.

4. Discussion

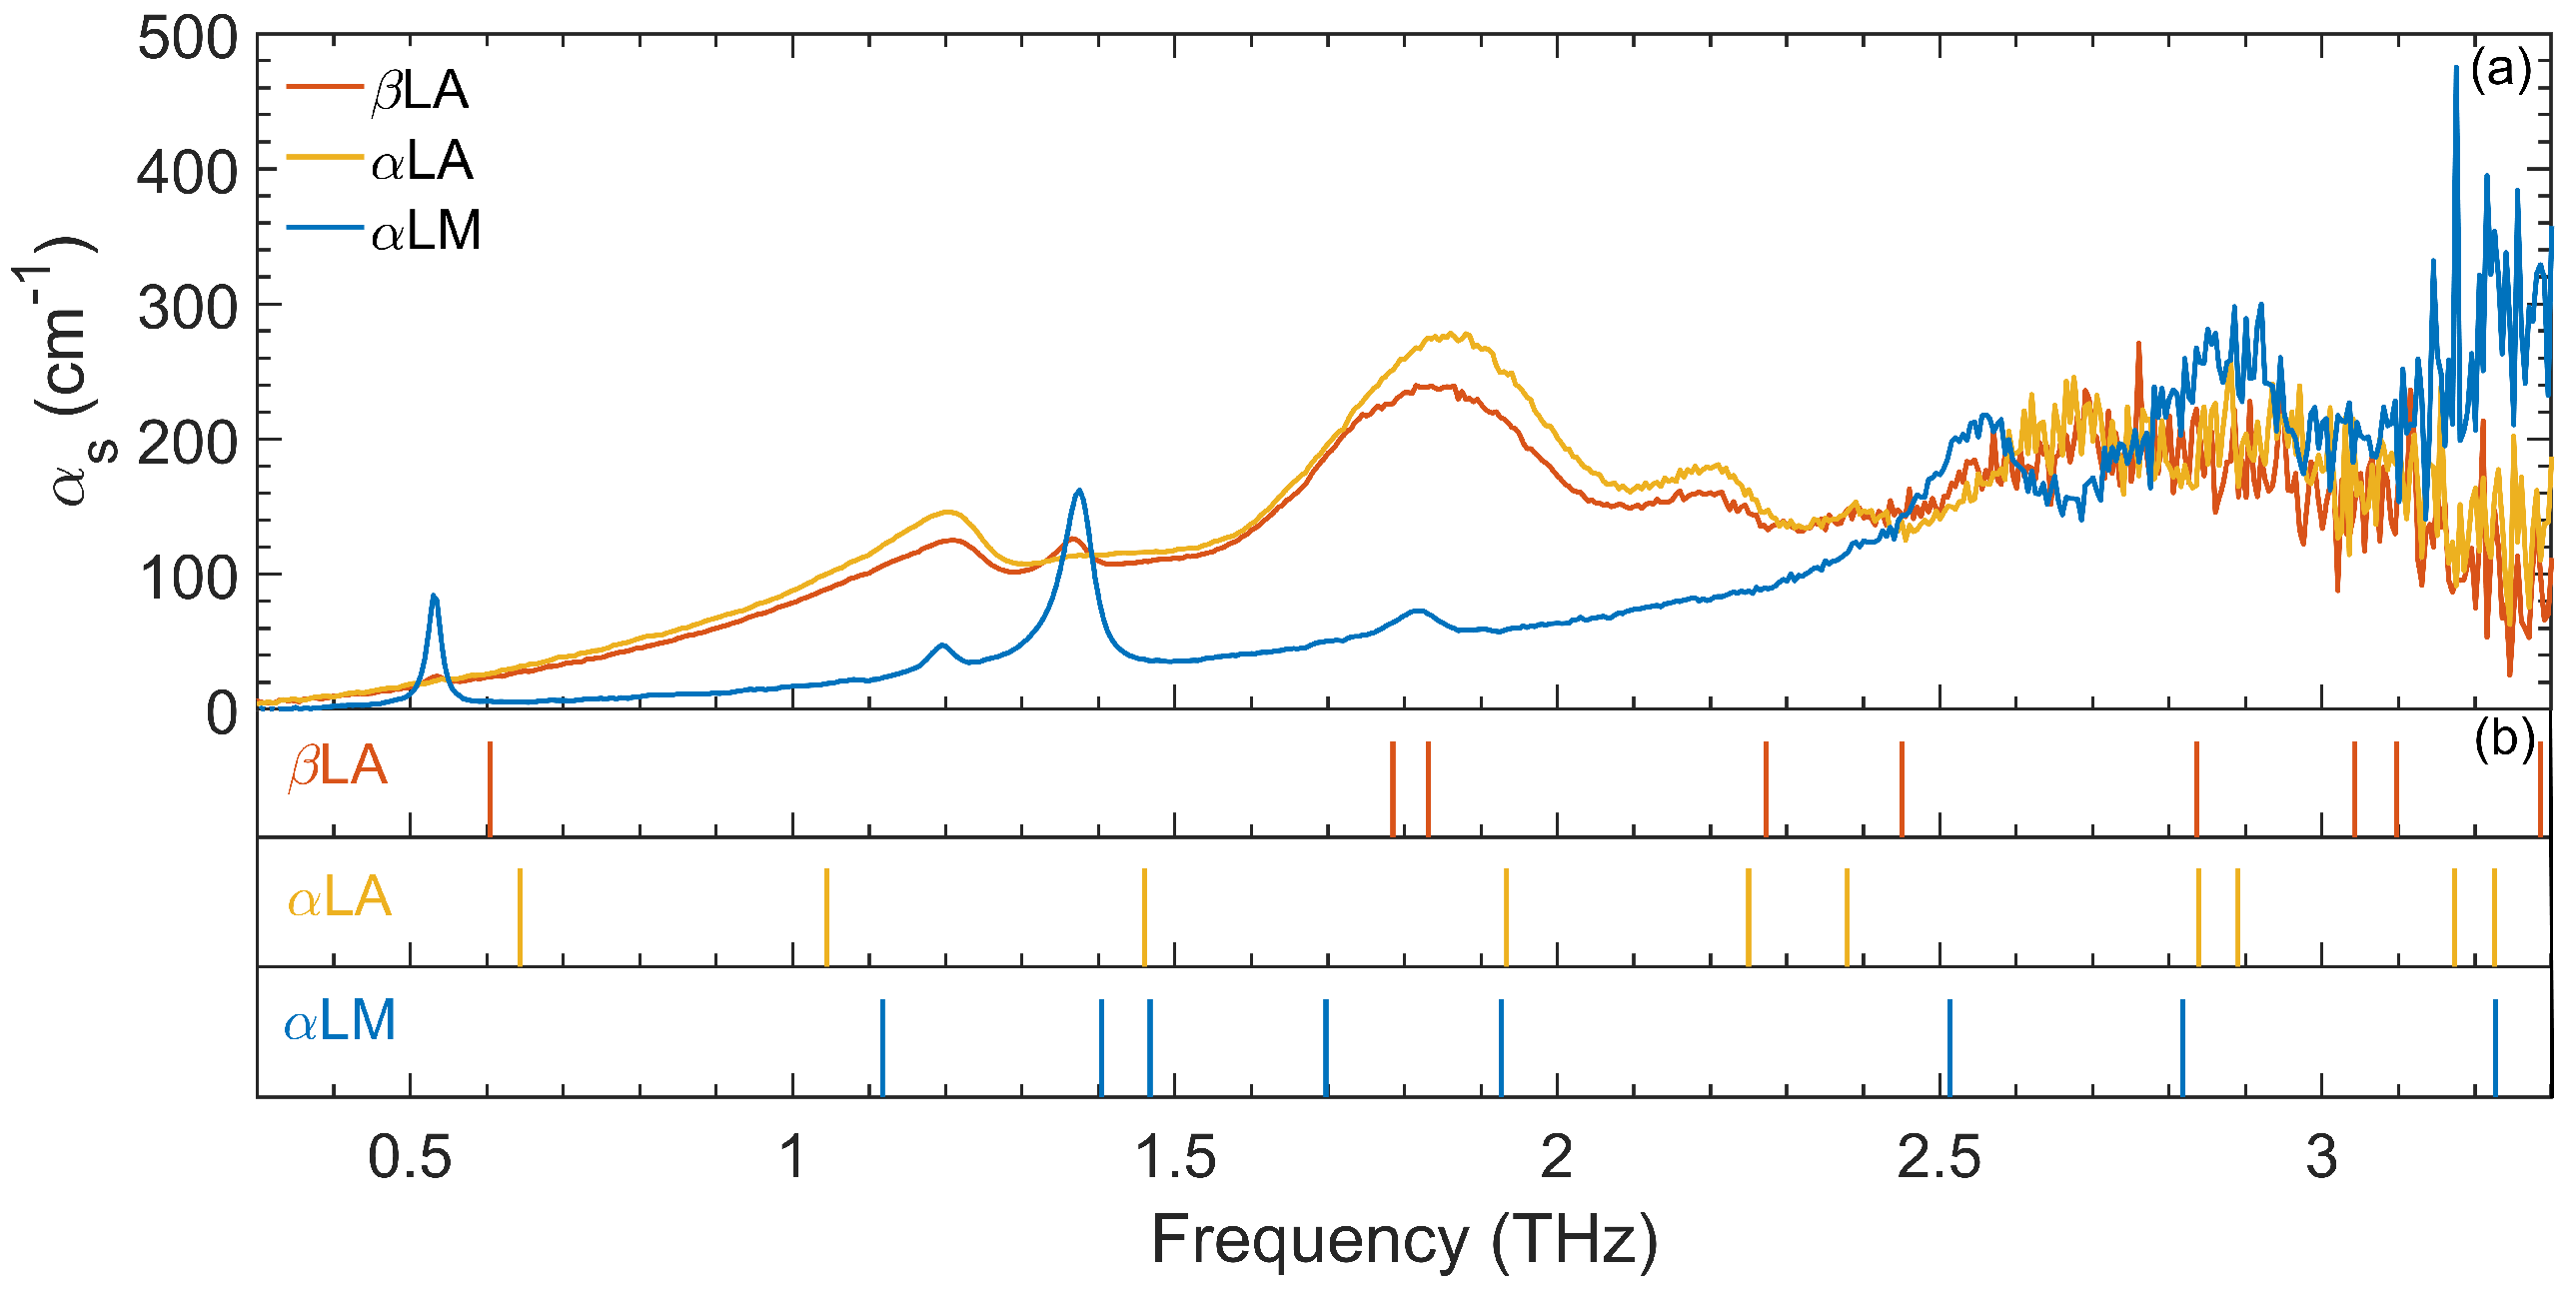
The observed spectral differences of the studied saccharides can be qualitatively explained in terms of molecular structure, H-bonding network, and the presence of water in the crystallographic structure. The pattern of absorption peaks looks similar for β LA and CBS (Figure 2), and it is possible to appreciate an overall shift towards the higher frequencies of the spectrum of CBS compared to that of β LA. The crystal structure of β LA is nearly isomorphous with CBS. However, the H-bonding scheme around the axial O(4) atom of β LA is different from that of CBS. In particular, the β LA structure presents just one of the three H-bonds of CBS [56,57]. The fact that in β LA, the O(4) atom of the galactose subunit is connected through a single H-bond with the O(3’) atom of a neighboring glucose subunit can roughly explain the shift of THz peaks for β LA to lower frequencies. As shown in Section 2.8, of the highest intensity absorption peaks of β LA and CBS (at 1.83 and 2.07 THz, respectively) approximately 60% are due to intermolecular librations.
The presence of fewer H-bonds gives a weaker overall force constant (K) of the overall chemical bonds that regulate these intermolecular librations of the molecules. Since the oscillating mass is the same for β LA and CBS (their molecular mass is M = 342.297 uma), according to the harmonic oscillator frequency formula ν o = 1 2 π K M , a lower normal mode vibrational frequency ν o is expected. In order to estimate K, we applied this formula to the 1.83 THz peak of β LA and the 2.07 THz peak of CBS, obtaining K values of approximately 75 and 96 N/m, respectively. The difference is approximately 21 N/m. Since CBS possesses two additional H-bonds, by dividing this value by two, we found K ≃ 10.5 N/m, a value within the force constant range of the H-bond, from approximately 3 to 80 N/m depending on the molecule [58].
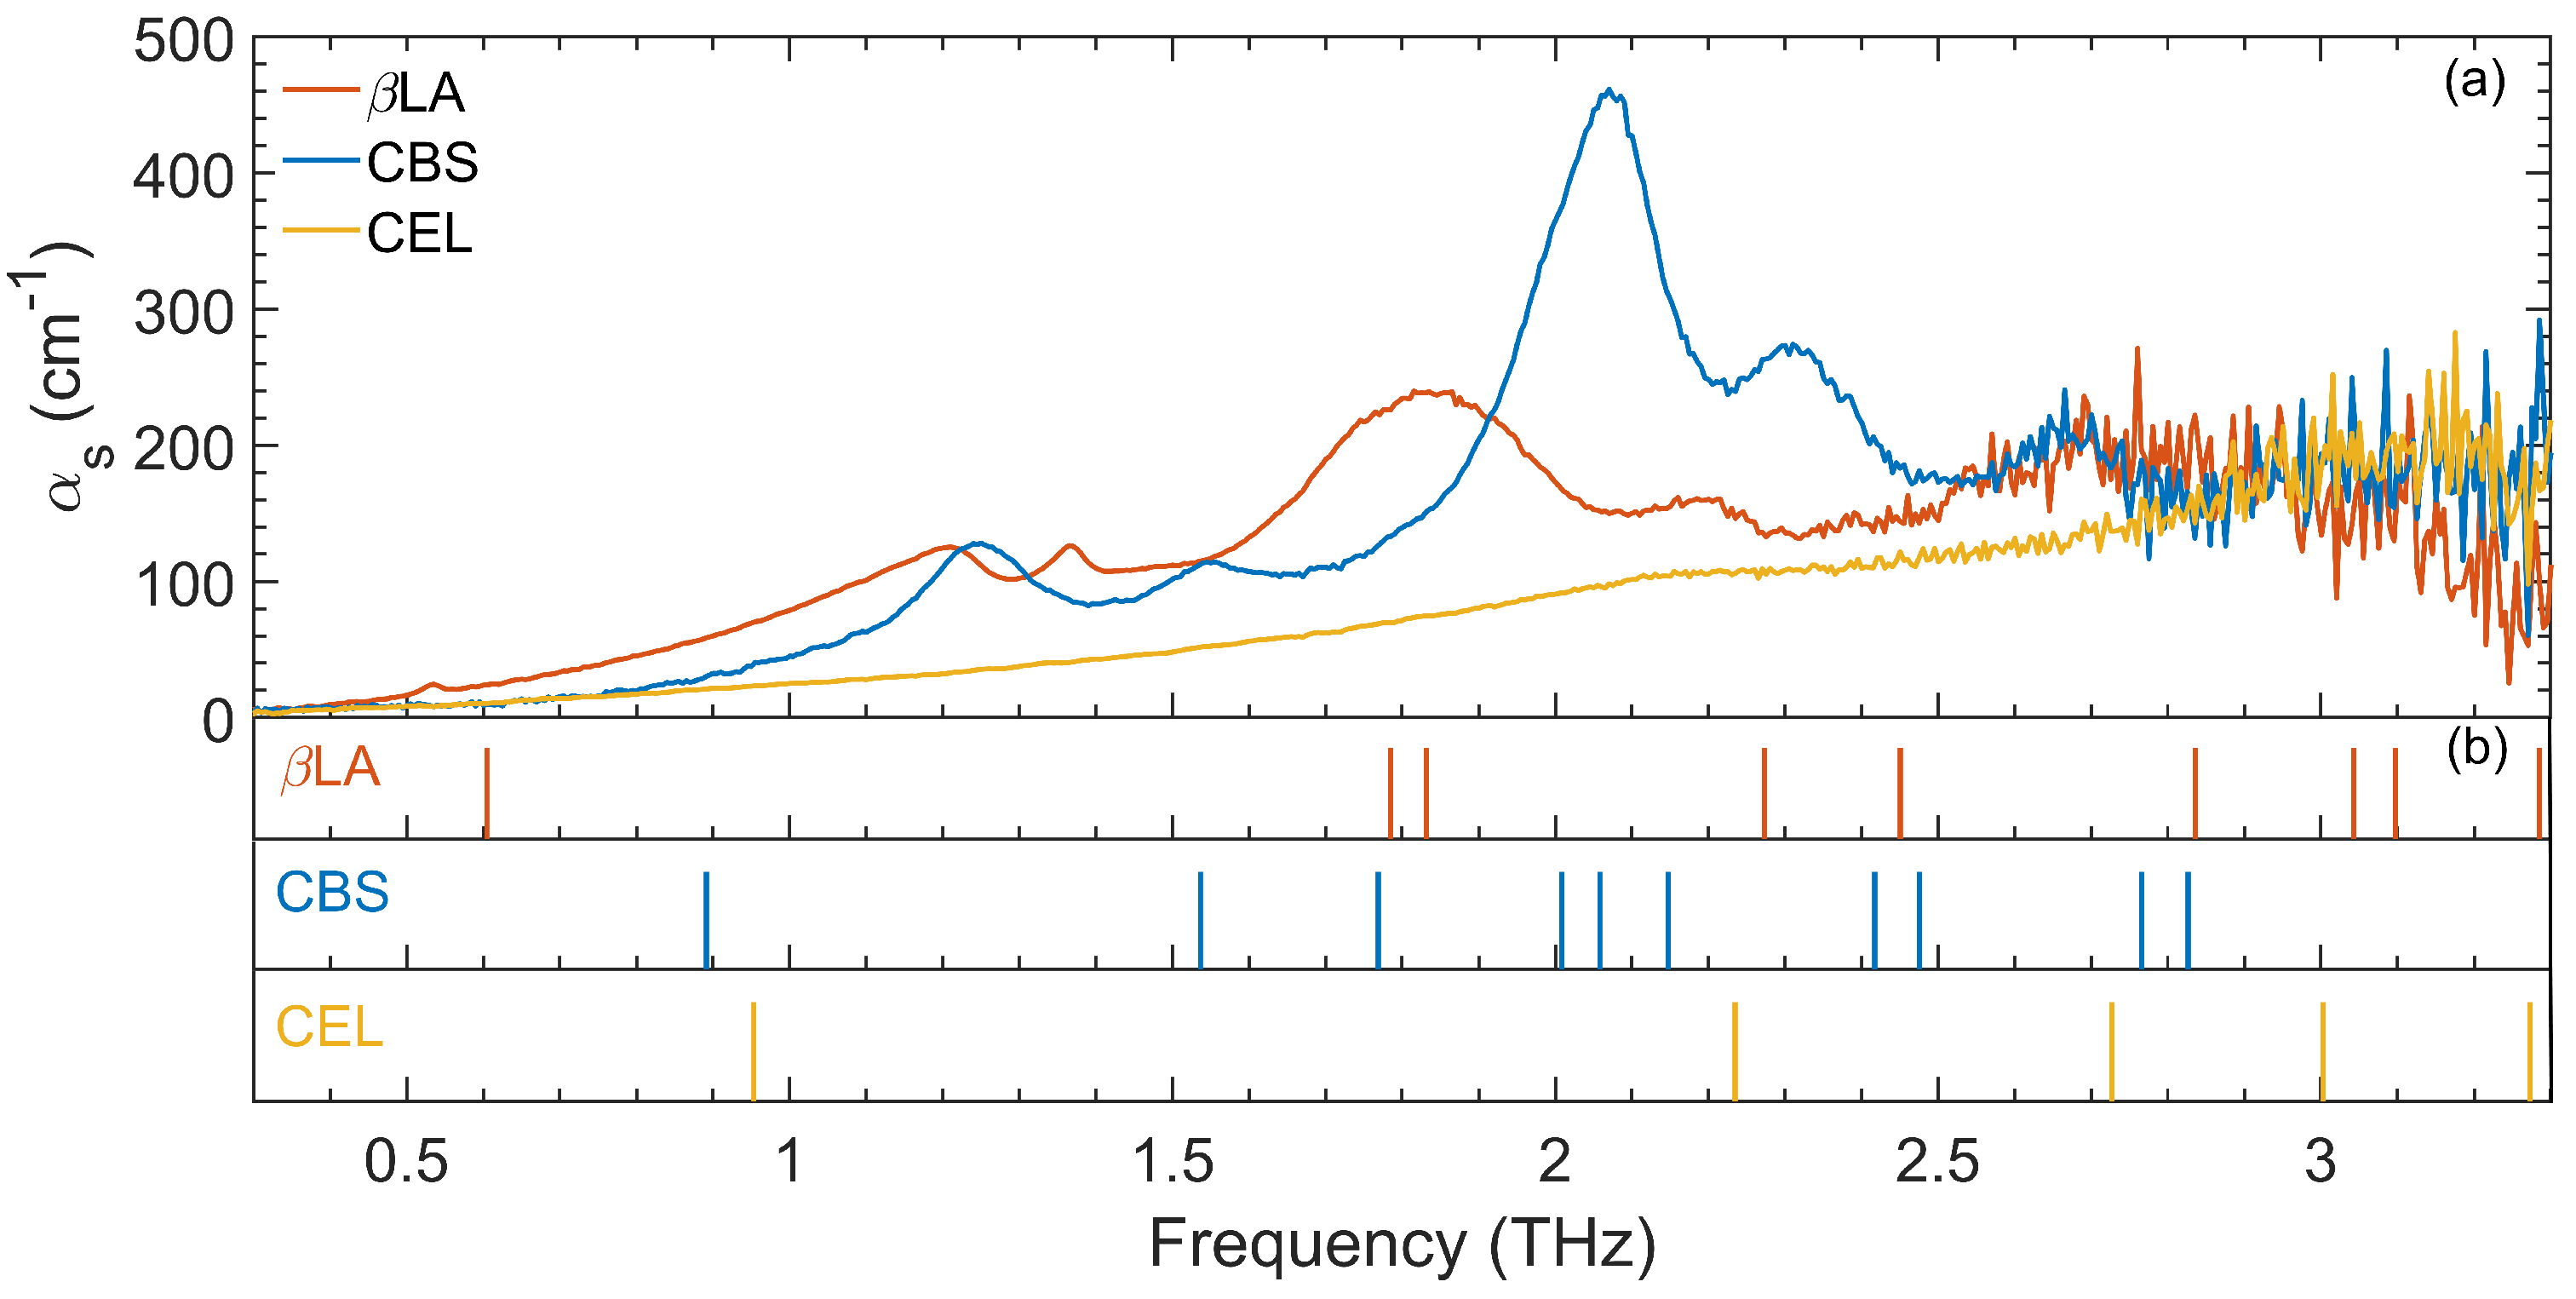
The THz spectra of CBS and CEL (Figure 2a and Table 2) appear to be very different: while CBS shows five evident peaks, CEL is characterized by two small intensity peaks at 2.15 and about 3 THz superimposed to the monotonic increase. Even if CBS is the repeating unit of CEL, the supramolecular structure of the two compounds is very different due to different intermolecular H-bond networks. The CEL supramolecular structure is characterized by a network of inter- and intramolecular H-bonds, which give great stiffness to CEL chains made up of hundreds to thousands of glucose units [59]. CBS consists of two glucose units linked by a β -(1,4 ) glycosidic bond, and its structure is, therefore, more flexible than that of CEL. These structural differences may explain the presence of the several vibrational peaks in the CBS spectrum compared to that of CEL.
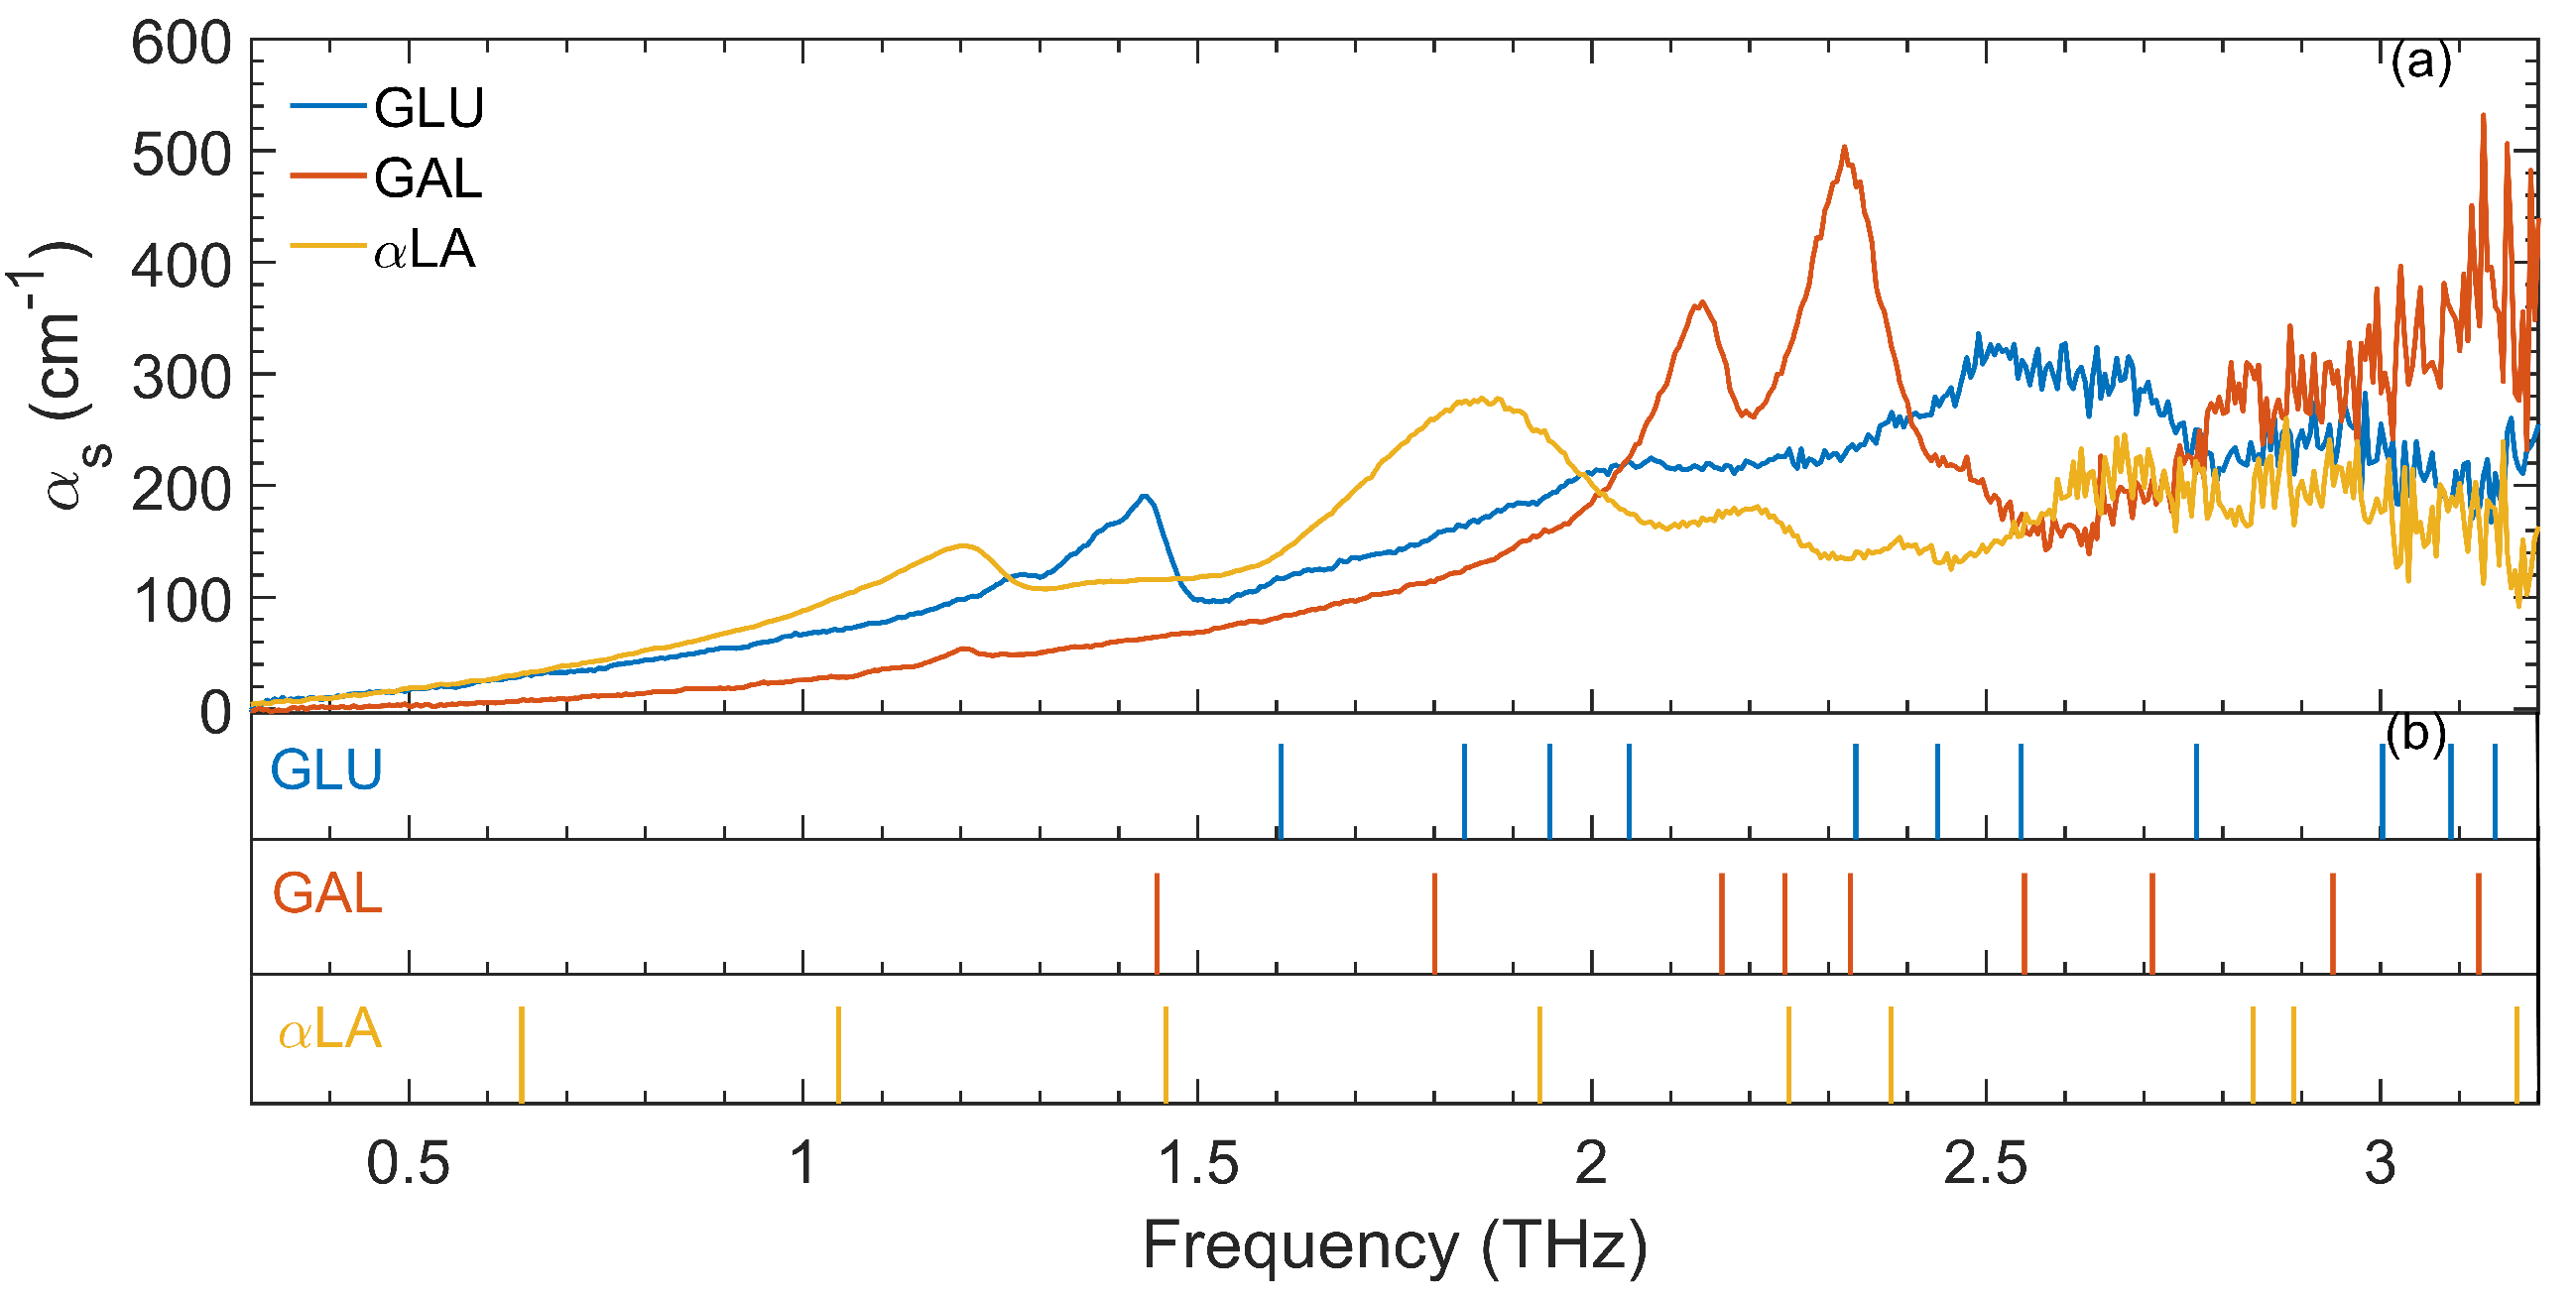
GLU and GAL are stereoisomers of each other. The main structural difference is the opposite orientation of the OH groups at carbon atom C(4) in the pyranose ring. Despite this, GLU and GAL exhibit very different THz spectra. The rearrangement of the hydroxyl group changes the potential energy distribution, and this most likely causes differences in the intermolecular vibrational motions, giving very distinct THz spectra. A GLU unit linked to a GAL unit through β -(1,4) glucosidic linkage forms α LA. If the THz spectra of GLU and GAL are compared with the THz spectrum of α LA (Figure 3), very marked differences are evident. The absorption spectrum of α LA shows five peaks at 1.19, 1.86, 2.20, 2.38, and at approximately 2.68 THz (see also Section 3.3). The most evident peaks were at 1.19, 1.86, and approximately 2.68 THz. These insights underscore the inadequacy of a single-molecule approach for modeling spectra within the THz range. This is due to the presence of vibrational modes that extend across multiple molecules, in contrast to the mid-infrared spectroscopic range where vibrations tend to be localized around individual or a few molecular bonds [6]. A relevant contribution to the THz spectra comes from the interactions between the molecular units. This properly explains the complexity of the low-energy dynamics of these compounds. Conversely, it can serve as an experimental tool to investigate and differentiate the crystalline structure of a molecular crystal specimen.
In order to obtain quantitative data, the peaks at 0.53 THz and 1.37 THz in α LM were subjected to Lorentzian curve fitting, yielding full-width-at-half-maximum (FWHM) values of (0.021 ± 0.002) THz and (0.047 ± 0.002) THz, respectively. This analysis draws upon both classical and quantum physics, where a Lorentzian line shape signifies homogeneous damping, indicating that the molecular oscillators accountable for absorption experience equivalent scattering or damping mechanisms, regardless of their individual characteristics or states [15]. Mechanistically, this dynamic is often governed by an exponential decay over time, characterized by a time constant τ linked to the Lorentzian linewidth via τ = ( π F W H M ) 1 . Consequently, for the vibrations responsible for the 0.53 THz band, τ amounts to 15.1 ps, while for the 1.37 THz band, it stands at 6.8 ps. These τ values notably exceed the room-temperature damping times associated with molecular vibrations, including collective ones (such as phonons) in solids [15]. This suggests that the spectral features at 0.53 THz and 1.37 THz stem from a collective vibrational transition that evades the typically rapid scattering mechanisms. One plausible explanation lies in the significant reduction of phonon–phonon scattering, attributed to a relatively subdued lactose crystal intermolecular potential energy. This diminished potential energy likely arises from the presence of water molecules within the α LM crystal structure [6]. The comparison of the spectra of α LM, α LA, and β LA shows the importance of water molecules in affecting the THz vibrational spectra by modifying the intermolecular interactions mediated by H-bonds.
The qualitative analyses of the THz spectra show the complexity of the observed features and the need for computational simulations in order to assign the experimental peaks to optically active vibrational modes and to obtain information on their vibrational characters. In the comparison between the experimental and calculated spectra, it must be considered that the theoretical method is able to determine the normal mode frequencies of crystalline samples in the harmonic oscillator approximation. This methodology forms the foundation for associating THz absorption peaks with crystalline samples [4]. Nevertheless, even with a grasp of the normal modes within a molecular crystalline system, attributing these modes remains intricate due to the presence of anharmonic effects. These effects induce changes in phonon energies and concurrently curtail their lifetimes. As a consequence, the observed THz peaks generally exhibit frequencies that deviate from those predicted by the harmonic model, accompanied by significantly broader line shapes. Hence, anticipating a flawless alignment between a THz spectrum and a normal mode simulation grounded in the harmonic approximation would be unrealistic, even when employing the most precise modeling methodologies [4]. In light of anharmonicity’s impact on both band frequency and line shape, the accuracy of normal mode assignments would be optimized by utilizing the THz spectra acquired at the lowest attainable temperature to mitigate the anharmonic effects. However, the frequency shifts caused by temperature variations seldom surpass 0.1 THz [4,5,11].
Figures S12–S18 of the Supplementary Materials show that the vibrations within the molecules mostly involve bending vibrations of H atoms and rocking motion of the O-H group. Usually, these vibrations appear at higher frequencies, but due to interactions with vibrations between molecules, they also appear at lower frequencies [4]. This mixing of intermolecular vibrations and the H and O-H vibrations was observed previously in other studies, such as the combination of vibrations and torsion in certain molecules. This mixing likely extends to the vibrations responsible for hydrogen bond formation in the O(N)-H groups [4,7]. Therefore, no clear demarcation exists between the predominant intermolecular librations and intramolecular vibrations for the studied saccharides. The distinctive frequency domains of intramolecular vibrations entirely coincide with those of intermolecular librations as a consequence of the strong mixing of these two categories of vibrations that takes place in the studied THz range [7].

5. Conclusions

We conducted a detailed spectroscopic study of seven saccharides (GLU, GAL, α LM, α LA, β LA, CBS, and CEL) by using a THz-TDS system. The THz-TDS data analysis was carefully performed to eliminate the FP interference effect, and the actual volume fraction of samples within the pellets was evaluated to recover the absorption coefficient (cm 1 ) and refractive index of the saccharides. The experimental results were compared with the theoretical spectra obtained by ab initio techniques based on DFT considering H-bonding interactions with an enhanced version of the van der Waals non-local density functional vdW-DF2.
The analysis of the saccharides’ low-energy vibrational modes followed the methodology introduced by F. Zhang et al. [7]. This facilitated the calculation of the proportional contributions of intermolecular translations, intermolecular librations, and intramolecular vibrations for every mode within the saccharides. The low-energy vibrations of the studied saccharides are mainly due to intermolecular librations and intramolecular vibrations, with a small percentage of intermolecular translations. The convergence of the characteristic frequency ranges between intermolecular librations and intramolecular vibrations implies the flexibility of the molecular backbone and a significant amalgamation of these two vibration classes within these frequency domains.
Saccharides, and in particular, lactose, are one of the most used pharmaceutical excipients. In fact, approximately 70% of pharmaceutical dosage forms contain lactose as a filler, carrier, excipient, or binder agent. Therefore, we believe that our analysis of the vibrational modes in the THz region could be used in the design and synthesis pharmaceutical processes.

Supplementary Materials

The following supporting information can be downloaded at: https://www.mdpi.com/article/10.3390/app13179719/s1. Figure S1: Sketch of the THz beamline used for the experiments with the multiple sample holder. TPX1 to TPX4 are polymethylpentene lenses with 50 mm focal length; Figure S2: Time traces (left) and Fourier transform of the THz signal (right) propagating through the dry N2 (black lines) and the noise floor of the system (red lines); Figure S3: The DR (left) and highest measurable absorbance ( α d ) m a x (right) of the THz-TDS system; Table S1: Typical nominal density of the investigated saccharides and PET, as reported in the literature [39,57,60,61,62]; Table S2: Experimental THz frequencies modes associated with the simulated ones and the correspondent mode number; Figure S4–S10: Ball and stick representation of CBS, β LA, α LM, GLU, CEL, α LA, and GAL, molecular crystals. The unit cell is indicated with a box. Black, red, and white spheres represent, respectively, carbon, oxygen and hydrogen atoms, and the azure dotted lines the H-bonds; Table S3: Unit cell parameters for all simulated systems. a, b, and c are the primitive vectors lengths, and α , β , and γ are the axial angles; Figure S11: Refractive index, ns, of (a) GLU, (b) GAL, (c) α LA, (d) β LA, (e) α LM, (f) CBS, (g) CEL; Figure S12–S18: Atomic displacement vectors of CBS, β LA, α LM, GLU, CEL, α LA, and GAL, for the main vibrational modes. Black, red, and white spheres represent, respectively, carbon, oxygen and hydrogen atoms, and the red dotted lines the H-bonds.

Author Contributions

Conceptualization, A.A.P. and M.M.; methodology, A.A.P. and M.M.; software, A.A.P., N.L. and A.M.C.; validation, A.A.P., N.L., O.P. and M.M.; formal analysis, A.A.P., N.L. and M.M.; investigation, A.A.P. and M.M.; resources, M.M.; data curation, A.A.P. and N.L.; writing—original draft preparation, A.A.P. and A.M.C.; writing—review and editing, A.A.P., N.L., O.P., A.M.C. and M.M.; visualization, A.A.P. and N.L.; supervision, M.M.; project administration, M.M.; funding acquisition, M.M. All authors have read and agreed to the published version of the manuscript.

Funding

This research was funded by Regione Lazio, Italy, (through L.R. 13/08 Progetto Gruppo di Ricerca MICROARTE grant number A0375–2020–36515) and from the Consiglio Nazionale delle Ricerche, Italy, under the Project n. B86C19000230005 of the Joint Bilateral Agreement CNR/CACH Biennial Programme 2019–2021.

Institutional Review Board Statement

Not applicable.

Informed Consent Statement

Not applicable.

Data Availability Statement

The data presented in this paper are available upon request.

Acknowledgments

We thank Mauro Giustini for experimental help and Lilia Boeri for help in analyzing vibrational modes.

Conflicts of Interest

The authors declare no conflict of interest.

References

  1. Baxter, J.B.; Guglietta, G.W. Terahertz Spectroscopy. Anal. Chem. 2011, 83, 4342–4368. [Google Scholar] [CrossRef] [PubMed]
  2. Jepsen, P.U.; Cooke, D.G.; Koch, M. Terahertz spectroscopy and imaging—Modern techniques and applications. Laser Photonics Rev. 2011, 5, 124–166. [Google Scholar] [CrossRef]
  3. Dhillon, S.S.; Vitiello, M.S.; Linfield, E.H.; Davies, A.G.; Hoffmann, M.C.; Booske, J.; Paoloni, C.; Gensch, M.; Weightman, P.; Williams, G.P.; et al. The 2017 terahertz science and technology roadmap. J. Phys. D Appl. Phys. 2017, 50, 043001. [Google Scholar] [CrossRef]
  4. Zhang, F.; Wang, H.W.; Tominaga, K.; Hayashi, M.; Hasunuma, T.; Kondo, A. Application of THz Vibrational Spectroscopy to Molecular Characterization and the Theoretical Fundamentals: An Illustration Using Saccharide Molecules. Chem. Asian J. 2017, 12, 324–331. [Google Scholar] [CrossRef] [PubMed]
  5. Sanders, T.J.; Allen, J.L.; Horvat, J.; Lewis, R.A. Terahertz response of dl-alanine: Experiment and theory. Phys. Chem. Chem. Phys. 2021, 23, 657–665. [Google Scholar] [CrossRef]
  6. Mitryukovskiy, S.; Vanpoucke, D.E.P.; Bai, Y.; Hannotte, T.; Lavancier, M.; Hourlier, D.; Roos, G.; Peretti, R. On the influence of water on THz vibrational spectral features of molecular crystals. Phys. Chem. Chem. Phys. 2022, 24, 6107–6125. [Google Scholar] [CrossRef] [PubMed]
  7. Zhang, F.; Wang, H.W.; Tominaga, K.; Hayashi, M. Mixing of intermolecular and intramolecular vibrations in optical phonon modes: Terahertz spectroscopy and solid-state density functional theory. Wiley Interdiscip. Rev. Comput. Mol. Sci. 2016, 6, 386–409. [Google Scholar] [CrossRef]
  8. Vanpoucke, D.E. Partitioning the vibrational spectrum: Fingerprinting defects in solids. Comput. Mater. Sci. 2020, 181, 109736. [Google Scholar] [CrossRef]
  9. Banks, P.A.; Burgess, L.; Ruggiero, M.T. The necessity of periodic boundary conditions for the accurate calculation of crystalline terahertz spectra. Phys. Chem. Chem. Phys. 2021, 23, 20038–20051. [Google Scholar] [CrossRef]
  10. Bo, Y.; Fang, J.; Zhang, Z.; Xue, J.; Liu, J.; Hong, Z.; Du, Y. Terahertz and Raman Spectroscopic Investigation of Monohydrate Cocrystal of Antitubercular Isoniazid with Protocatechuic Acid. Pharmaceutics 2021, 13, 1303. [Google Scholar] [CrossRef]
  11. Walther, M.; Fischer, B.M.; Jepsen, P.U. Noncovalent intermolecular forces in polycrystalline and amorphous saccharides in the far infrared. Chem. Phys. 2003, 288, 261–268. [Google Scholar] [CrossRef]
  12. Rauter, A.P.; Lindhorst, T.K.; Queneau, Y. (Eds.) Carbohydrate Chemistry; Royal Society of Chemistry: London, UK, 2020. [Google Scholar] [CrossRef]
  13. Bjarnason, J.E.; Brown, E.R.; Korter, T.M. Comparison of the THz absorption feature in lactose to related saccharides. SPIE 2007, 6549, 162–170. [Google Scholar] [CrossRef]
  14. Listiohadi, Y.; Hourigan, J.; Sleigh, R.; Steele, R. Moisture sorption, compressibility and caking of lactose polymorphs. Int. J. Pharm. 2008, 359, 123–134. [Google Scholar] [CrossRef] [PubMed]
  15. Brown, E.R.; Bjarnason, J.E.; Fedor, A.M.; Korter, T.M. On the strong and narrow absorption signature in lactose at 0.53THz. Appl. Phys. Lett. 2007, 90, 061908. [Google Scholar] [CrossRef]
  16. Yamauchi, S.; Hatakeyama, S.; Imai, Y.; Tonouchi, M. Nondestructive evaluation of crystallized-particle size in lactose-powder by terahertz time-domain spectroscopy. Opt. Eng. 2013, 53, 031203. [Google Scholar] [CrossRef]
  17. Yamauchi, S.; Hatakeyam, S.; Imai, Y.; Tonouchi, M. Terahertz Time-Domain Spectroscopy to Identify and Evaluate Anomer in Lactose. Am. J. Anal. Chem. 2013, 04, 756–762. [Google Scholar] [CrossRef]
  18. Tao, C.; Zhi-hua, C.; Fang-rong, H.; Xian-hua, Y.; Chuan-pei, X. A study of terahertz spectra of monosaccharides and disaccharides with structural similarities. Spectrosc. Spectr. Anal. 2019, 39, 686–692. [Google Scholar] [CrossRef]
  19. Warnecke, S.; Wu, J.X.; Rinnan, Å.; Allesø, M.; van den Berg, F.; Jepsen, P.U.; Engelsen, S.B. Quantifying crystalline α-lactose monohydrate in amorphous lactose using terahertz time domain spectroscopy and near infrared spectroscopy. Vib. Spectrosc. 2019, 102, 39–46. [Google Scholar] [CrossRef]
  20. da Silva, I.J.G.; Raimundo, I.M.; Mizaikoff, B. Analysis of sugars and sweeteners via terahertz time-domain spectroscopy. Anal. Methods 2022, 14, 2657–2664. [Google Scholar] [CrossRef]
  21. Komandin, G.A.; Porodinkov, O.E.; Nozdrin, V.S.; Musina, G.R.; Chernomyrdin, N.V.; Zaytsev, K.I.; Spektor, I.E. Temperature Evolution of the Dielectric Response of α-Lactose Monohydrate in the THz Frequency Range. Opt. Spectrosc. 2020, 128, 752–758. [Google Scholar] [CrossRef]
  22. Komandin, G.A.; Zaytsev, K.I.; Dolganova, I.N.; Nozdrin, V.S.; Chuchupal, S.V.; Anzin, V.B.; Spektor, I.E. Quantification of solid-phase chemical reactions using the temperature-dependent terahertz pulsed spectroscopy, sum rule, and Arrhenius theory: Thermal decomposition of α-lactose monohydrate. Opt. Express 2022, 30, 9208. [Google Scholar] [CrossRef]
  23. Komandin, G.A.; Nozdrin, V.S.; Chuchupal, S.V. Thermally activated transformations of the dielectric response function of mono- and disaccharides in the THz range. Vib. Spectrosc. 2023, 125, 103508. [Google Scholar] [CrossRef]
  24. Komandin, G.A.; Nozdrin, V.S.; Chuchupal, S.V.; Gavdush, A.A.; Musina, G.R.; Spektor, I.E. Broadband Reflection Spectra of Saccharides in the THz and IR Ranges. Opt. Spectrosc. 2022, 130, 262–268. [Google Scholar] [CrossRef]
  25. Zheng, Z.P.; Fan, W.H.; Li, H.; Tang, J. Terahertz spectral investigation of anhydrous and monohydrated glucose using terahertz spectroscopy and solid-state theory. J. Mol. Spectrosc. 2014, 296, 9–13. [Google Scholar] [CrossRef]
  26. Yan, H.; Fan, W.; Chen, X.; Liu, L.; Wang, H.; Jiang, X. Terahertz signatures and quantitative analysis of glucose anhydrate and monohydrate mixture. Spectrochim. Acta Part A Mol. Biomol. Spectrosc. 2021, 258, 119825. [Google Scholar] [CrossRef] [PubMed]
  27. Zhang, T.; Yan, S.; Hao, J.; Li, D. Experimental and Theoretical Investigations of Terahertz Spectra of the Structural Isomers: Mannose and Galactose. J. Spectrosc. 2021, 2021, 3469262. [Google Scholar] [CrossRef]
  28. Sato, K.; Sato, H.; Ohashi, T.; Takahashi, K. Investigation of inter- and intramolecular dynamics of disaccharides by temperature-dependent terahertz spectrum. In Proceedings of the 2017 42nd International Conference on Infrared, Millimeter, and Terahertz Waves (IRMMW-THz), Cancun, Mexico, 27 August–1 September 2017; pp. 1–2. [Google Scholar] [CrossRef]
  29. Vieira, F.S.; Pasquini, C. Determination of Cellulose Crystallinity by Terahertz-Time Domain Spectroscopy. Anal. Chem. 2014, 86, 3780–3786. [Google Scholar] [CrossRef]
  30. Peccianti, M.; Fastampa, R.; Mosca Conte, A.; Pulci, O.; Violante, C.; Łojewska, J.; Clerici, M.; Morandotti, R.; Missori, M. Terahertz Absorption by Cellulose: Application to Ancient Paper Artifacts. Phys. Rev. Appl. 2017, 7, 064019. [Google Scholar] [CrossRef]
  31. Fastampa, R.; Pilozzi, L.; Missori, M. Cancellation of Fabry-Perot interference effects in terahertz time-domain spectroscopy of optically thin samples. Phys. Rev. A 2017, 95, 063831. [Google Scholar] [CrossRef]
  32. Wang, H.; Horikawa, Y.; Tsuchikawa, S.; Inagaki, T. Terahertz time-domain spectroscopy as a novel tool for crystallographic analysis in cellulose. Cellulose 2020, 27, 9767–9777. [Google Scholar] [CrossRef]
  33. Burford, N.M.; El-Shenawee, M.O. Review of terahertz photoconductive antenna technology. Opt. Eng. 2017, 56, 010901. [Google Scholar] [CrossRef]
  34. Duvillaret, L.; Garet, F.; Coutaz, J.L. Highly precise determination of optical constants and sample thickness in terahertz time-domain spectroscopy. Appl. Opt. 1999, 38, 409–415. [Google Scholar] [CrossRef] [PubMed]
  35. Dorney, T.D.; Baraniuk, R.G.; Mittleman, D.M. Material parameter estimation with terahertz time-domain spectroscopy. J. Opt. Soc. Am. A 2001, 18, 1562–1571. [Google Scholar] [CrossRef] [PubMed]
  36. Jepsen, P.U.; Fischer, B.M. Dynamic range in Terahertz Time-Domain Transmission and Reflection Spectroscopy. Opt. Lett. 2005, 30, 29–31. [Google Scholar] [CrossRef]
  37. Pupeza, I.; Wilk, R.; Koch, M. Highly accurate optical material parameter determination with THz time-domain spectroscopy. Opt. Express 2007, 15, 4335–4350. [Google Scholar] [CrossRef]
  38. Scheller, M.; Jansen, C.; Koch, M. Analyzing sub-100-μm samples with transmission terahertz time domain spectroscopy. Opt. Commun. 2009, 282, 1304. [Google Scholar] [CrossRef]
  39. Shendurse, A.; Khedkar, C. Lactose. In Encyclopedia of Food and Health; Elsevier: Amsterdam, The Netherlands, 2016; pp. 509–516. [Google Scholar] [CrossRef]
  40. Tofani, S.; Zografopoulos, D.C.; Missori, M.; Fastampa, R.; Beccherelli, R. Terahertz focusing properties of polymeric zone plates characterized by a modified knife-edge technique. J. Opt. Soc. Am. B 2019, 36, D88. [Google Scholar] [CrossRef]
  41. Tofani, S.; Zografopoulos, D.C.; Missori, M.; Fastampa, R.; Beccherelli, R. High-Resolution Binary Zone Plate in Double-Sided Configuration for Terahertz Radiation Focusing. IEEE Photonics Technol. Lett. 2019, 31, 117–120. [Google Scholar] [CrossRef]
  42. Bernath, P.F. The spectroscopy of water vapour: Experiment, theory and applications. Phys. Chem. Chem. Phys. 2002, 4, 1501–1509. [Google Scholar] [CrossRef]
  43. Duvillaret, L.; Garet, F.; Coutaz, J.L. A Reliable Method for Extraction of Material Parameters in Terahertz Time-Domain Spectroscopy. IEEE J. Sel. Top. Quantum Electron. 1996, 2, 739. [Google Scholar] [CrossRef]
  44. Chew, W.C. Waves and Fields in Inhomogeneous Media; Wiley-IEEE Press: Hoboken, NJ, USA, 1999. [Google Scholar]
  45. Hejase, H.A.N. On The Use of Davidenko’s Method in Complex Root Search. IEEE Trans. Microw. Theory Tech. 1993, 41, 141–143. [Google Scholar] [CrossRef]
  46. Umari, P.; Pasquarello, A. Ab initio Molecular Dynamics in a Finite Homogeneous Electric Field. Phys. Rev. Lett. 2002, 89, 157601. [Google Scholar] [CrossRef]
  47. Calzolari, A.; Buongiorno Nardelli, M. Dielectric properties and Raman spectra of ZnO from a first principles finite-differences/finite-fields approach. Sci. Rep. 2013, 3, 2999. [Google Scholar] [CrossRef]
  48. Perdew, J.; Wang, Y. Accurate and simple density functional for the electronic exchange energy: Generalized gradient approximation. Phys. Rev. B 1986, 33, 8800. [Google Scholar] [CrossRef] [PubMed]
  49. Lee, K.; Murray, E.D.; Kong, L.; Lundqvist, B.I.; Langreth, D.C. Higher-accuracy van der Waals density functional. Phys. Rev. B 2010, 82, 081101. [Google Scholar] [CrossRef]
  50. Dion, M.; Rydberg, H.; Schroder, E.; Langreth, D.; Lundqvist, I.B. Van der Waals Density Functional for General Geometries. Phys. Rev. Lett. 2004, 92, 246401. [Google Scholar] [CrossRef]
  51. Vanderbilt, D. Soft self-consistent pseudopotentials in a generalized eigenvalue formalism. Phys. Rev. B 1990, 41, 7892. [Google Scholar] [CrossRef]
  52. Sabatini, R.; Gorni, T.; de Gironcoli, S. Nonlocal van der Waals density functional made simple and efficient. Phys. Rev. B 2013, 87, 041108. [Google Scholar] [CrossRef]
  53. Missori, M.; Pawcenis, D.; Bagniuk, J.; Conte, A.M.; Violante, C.; Maggio, M.; Peccianti, M.; Pulci, O.; Lojewska, J. Quantitative diagnostics of ancient paper using THz time-domain spectroscopy. Microchem. J. 2018, 142, 54–61. [Google Scholar] [CrossRef]
  54. Takahashi, M.; Ishikawa, Y. Terahertz vibrations of crystalline α-D-glucose and the spectral change in mutual transitions between the anhydride and monohydrate. Chem. Phys. Lett. 2015, 642, 29–34. [Google Scholar] [CrossRef]
  55. Zhang, T.; Tao, A.; Yan, S. Terahertz Time-Domain Spectroscopy of Crystalline Glucose and Galactose. In Proceedings of the 2008 2nd International Conference on Bioinformatics and Biomedical Engineering, Shanghai, China, 16–18 May 2008. [Google Scholar] [CrossRef]
  56. Hirotsu, K.; Shimada, A. The Crystal and Molecular Structure of β-Lactose. Bull. Chem. Soc. Jpn. 1974, 47, 1872–1879. [Google Scholar] [CrossRef]
  57. Jacobson, R.A.; Wunderlich, J.A.; Lipscomb, W.N. The crystal and molecular structure of cellobiose. Acta Crystallogr. 1961, 14, 598–607. [Google Scholar] [CrossRef]
  58. Freindorf, M.; Kraka, E.; Cremer, D. A comprehensive analysis of hydrogen bond interactions based on local vibrational modes. Int. J. Quantum Chem. 2012, 112, 3174–3187. [Google Scholar] [CrossRef]
  59. Klemm, D.; Heublein, B.; Fink, H.P.; Bohn, A. Cellulose: Fascinating biopolymer and sustainable raw material. Angew. Chem. Int. Ed. 2005, 44, 3358–3393. [Google Scholar] [CrossRef] [PubMed]
  60. Mark, H.F.; Kroschwitz, J.I. Encyclopedia of Polymer Science and Engineering, A to Amorphous Polymers; A Wiley-Interscience Publication: Hoboken, NJ, USA, 1985; Volume 9780471895404, p. 84019713. Available online: https://books.google.it/books?id=3dBTAAAAMAAJ (accessed on 22 August 2023).
  61. Haynes, W.M. CRC Handbook of Chemistry and Physics, 95th ed.; CRC Press: Hoboken, NJ, USA, 2014; Volume 9781482208689, p. 2704. [Google Scholar]
  62. Okamura, T.-a. Polyethylene (PE; Low Density and High Density). In Encyclopedia of Polymeric Nanomaterials; Springer: Berlin/Heidelberg, Germany, 2015; pp. 1826–1829. [Google Scholar] [CrossRef]
Figure 1. The chemical structures of the studied saccharides (the abbreviations used to denote the compounds are explained in the Section 2.1 Sample). Black, red, and white spheres represent, respectively, carbon, oxygen, and hydrogen atoms.
Applsci 13 09719 g001
Figure 2. (a) THz absorption coefficient of β LA, CBS and CEL. All spectra show absorption peaks superimposed to a background intensity increasing as a function of frequency. (b) Simulated low-frequency THz vibrational modes (color vertical lines).
Applsci 13 09719 g002
Figure 3. (a) THz absorption coefficient of GLU, GAL, and α LA. All the spectra show absorption peaks superimposed to a background intensity increasing as a function of frequency. (b) Simulated low-frequency THz vibrational modes (color vertical lines).
Applsci 13 09719 g003
Figure 4. (a) THz absorption coefficient of α LM, α LA, and β LA. All the spectra show absorption peaks superimposed to a background intensity increasing as a function of frequency. (b) Simulated low-frequency THz vibrational modes (color vertical lines).
Applsci 13 09719 g004
Figure 5. Mode analysis of the studied saccharides: (a) GLU, (b) GAL, (c) α LM, (d) α LA, (e) β LA, (f) CBS, and (g) CEL. Each panel is divided into three graphs that show for each mode the percentage contributions of the three intermolecular translations (top), the three intermolecular librations (middle), and the intramolecular vibrations (bottom).
Applsci 13 09719 g005
Table 1. Volume fractions of saccharides ( ν s a ), PET ( ν P E T a ), and air ( ν a i r ) measured in the prepared pellets.
Sample Label ν s a ν PET a ν air
GLU0.090.710.20
GAL0.040.750.21
α LM0.080.730.19
α LA0.080.740.18
β LA0.080.740.18
CBS0.040.730.23
CEL0.080.710.21
Table 2. Experimental peak frequencies (THz) and the corresponding value of the absorption coefficients (in cm 1 ) in brackets in the 0.3–3.3 THz frequency range.
β LACBSCELGLUGAL α LA α LM
1.20 (23.9)1.24 (127.7)2.15 (103.8)1.27 (126.4)1.20 (54.1)1.19 (145.4)0.53 (84.2)
1.83 (124.6)1.54 (114.0)2.73 (136.9)1.43 (184.8)2.14 (364.6)1.86 (278.4)1.19 (47.5)
2.21 (126.3)2.07 (461.3)3.00 (199.7)2.08 (190.3)2.32 (486.8)2.20 (179.7)1.37 (158.5)
2.39 (239.3)2.31 (274.1)3.19 (218.0)2.51 (285.5) 2.39 (153.6)1.81 (72.9)
2.68 (160.3)2.66 (240.8) 2.68 (277.9) 2.68 (218.5)2.55 (217.3)
2.92 (293.3) 2.87 (278.3)
Table 3. Simulated vibrational modes (THz) in the 0.3–3.3 THz frequency range.
Mode
Number
Simulated Modes Frequencies (THz)
β LA CBS CEL GLU GAL α LA α LM
10.610.890.951.611.450.641.12
21.791.542.241.841.801.041.40
31.831.772.731.952.171.461.47
42.272.013.002.052.251.931.70
52.452.063.272.332.332.251.93
62.842.15 2.442.552.382.51
73.042.42 2.542.712.842.82
83.102.48 2.772.942.893.23
93.292.77 3.003.123.17
10 2.83 3.093.233.23
11 3.11 3.15
12 3.26
Disclaimer/Publisher’s Note: The statements, opinions and data contained in all publications are solely those of the individual author(s) and contributor(s) and not of MDPI and/or the editor(s). MDPI and/or the editor(s) disclaim responsibility for any injury to people or property resulting from any ideas, methods, instructions or products referred to in the content.

