Article

TwSense: Highly Robust Through-the-Wall Human Detection Method Based on COTS Wi-Fi Device

1
College of Computer Science and Engineering, Northwest Normal University, Lanzhou 730070, China
2
Gansu Province Internet of Things Engineering Research Center, Lanzhou 730070, China
*
Author to whom correspondence should be addressed.
Appl. Sci. 2023, 13(17), 9668; https://doi.org/10.3390/app13179668
Submission received: 26 July 2023 / Revised: 19 August 2023 / Accepted: 25 August 2023 / Published: 26 August 2023

Abstract

:
With the popularization of Wi-Fi router devices, the application of device-free sensing has garnered significant attention due to its potential to make our lives more convenient. Wi-Fi signal-based through-the-wall human detection offers practical applications, such as emergency rescue and elderly monitoring. However, the accuracy of through-the-wall human detection is hindered by signal attenuation caused by wall materials and multiple propagation paths of interference. Therefore, through-the-wall human detection presents a substantial challenge. In this paper, we proposed a highly robust through-the-wall human detection method based on a commercial Wi-Fi device (TwSense). To mitigate interference from wall materials and other environmental factors, we employed the robust principal component analysis (OR-PCA) method to extract the target signal of Channel State Information (CSI). Subsequently, we segmented the action-induced Doppler shift feature image using the K-means clustering method. The features of the images were extracted using the Histogram of Oriented Gradients (HOG) algorithm. Finally, these features were fed into an SVM classifier (G-SVM) optimized by a grid search algorithm for action classification and recognition, thereby enhancing human detection accuracy. We evaluated the robustness of the entire system. The experimental results demonstrated that TwSense achieved the highest accuracy of 96%.

1. Introduction

With the advancement of wireless technology, Wi-Fi-enabled intelligent devices (e.g., cameras, air conditioners, smart audio, etc.) have been deployed everywhere [1], with many Wi-Fi devices in homes and offices. No matter what environment we are in, the radio frequency (RF) signals emitted by these devices surround us all the time. Therefore, people can use ubiquitous Wi-Fi signals in their daily lives to enable applications for sensing purposes (such as monitoring the usage of public restrooms). This type of device-free sensing technology is currently gaining increasing attention.
Research on human detection using Wi-Fi signals has received much attention recently. However, most of the early work was related to something other than through-the-wall detection. Recently, through-the-wall sensing has received much attention because it can monitor human activities without privacy and security [2]. With powerful capabilities across different rooms, through-the-wall sensing can provide an application solution for elderly monitoring, intruder detection, and emergency rescue [3]. Recent works on device-free human detection can be divided into two main categories: active mode and passive mode. The difference between the two is that the active mode requires outdoor devices to send RF signals indoors continuously. In contrast, the passive mode can always obtain the Wi-Fi signals sent by indoor Wi-Fi devices and thus conduct human detection, which can more easily obtain the state data of indoor personnel. The passive mode shown in Figure 1 allows easy acquisition of Wi-Fi signals sent by indoor Wi-Fi devices [4] for human detection. As the human body moves through the space between various Wi-Fi devices, the Wi-Fi signal is refracted, reflected, and diffracted through the human body. The resulting signals are in a different state than those generated after passing directly through an interfering object. These signals have different levels of interference, based on which we can distinguish whether a person is in the room. Due to the movement of a person, the Wi-Fi signal may pass through a wall via the LOS path or the NLOS path, both of which receive different signal strengths. We can also roughly determine the location and status of a person based on this method.
Regarding research on human body detection, traditional methods for human sensing and detection often require users to wear specialized wearable sensors [5] or use cameras, RFID [6], smartphones, and other devices. In these cases, the operations become more complicated, deployment costs increase, and people’s mobility is significantly affected, causing considerable inconvenience to their daily activities and routines. Moreover, some devices are susceptible to environmental influences and restrictions and may even raise privacy concerns for users.
Unlike traditional approaches based on vision and devices, wireless technology is used to sense and detect the state of the human body without installing more devices or wearable devices using ubiquitous Wi-Fi signals. The advantage of this approach is that Wi-Fi devices are very inexpensive and widely available. However, the complexity of indoor environments and the varying structures of walls can affect the effectiveness of person detection. Channel State Information (CSI) is a fine-grained measurement of the physical layer that contains the amplitude and phase information of each orthogonal subcarrier in the channel [7]. CSI obtained from Wi-Fi signals may be more suitable for human detection.
However, most relevant research focuses on indoor human perception, recognition, and detection using Wi-Fi signals. There has been relatively little research on human perception after Wi-Fi signals have penetrated through-the-wall or other obstacles. The reason for this is that through-the-wall human detection poses significant challenges. After Wi-Fi signals pass through-the-wall, they are subjected to interference from wall materials and multiple propagation paths behind the walls, resulting in severe signal attenuation and affecting detection accuracy. Existing through-the-wall detection methods rely on densely distributed transmitters and receivers or require specialized signal transmission equipment, which is unsuitable for commercial devices. Many existing device-free Wi-Fi human detection systems based on CSI experience significant performance degradation in through-the-wall scenarios. Therefore, utilizing CSI variations for human perception in through-the-wall conditions is a challenging problem.
To solve the problem, Wi-Fi signals through-the-wall increase the difficulty of human detection. In this paper, we propose a highly robust through-the-wall human detection method based on a ubiquitous commercial Wi-Fi device (TwSense). The robust principal component analysis algorithm (OR-PCA) [8] removes the complex noise caused by walls from the acquired data. Thus, we extracted CSI’s correlation and selected the subcarriers with significant features for conversion to Doppler frequency shift images. We then used a clustering algorithm (K-means) to segment the Doppler shift images based on the motions. Then, the feature vectors obtained by the HOG algorithm were fed into the G-SVM classifier to enable human detection through-the-wall. For four materials of walls: concrete, plaster, wooden door, and glass, we analyzed the effects of different parameter settings (different personnel, thickness, personnel position, and device spacing) on the experimental results and evaluated the robustness of the whole system. The experimental results showed that TwSense had high detection accuracy. At the same time, based on the experimental results, we provided a better deployment scheme for future practical through-the-wall applications. In summary, the main contributions of the paper are as follows:
  • We proposed a highly robust method for through-the-wall human detection based on a ubiquitous commercial Wi-Fi device (TwSense). This method used the passive mode to detect the presence of people in the room using the CSI in the Wi-Fi signal. It also provided a solution for the emergency rescue and health monitoring of older people.
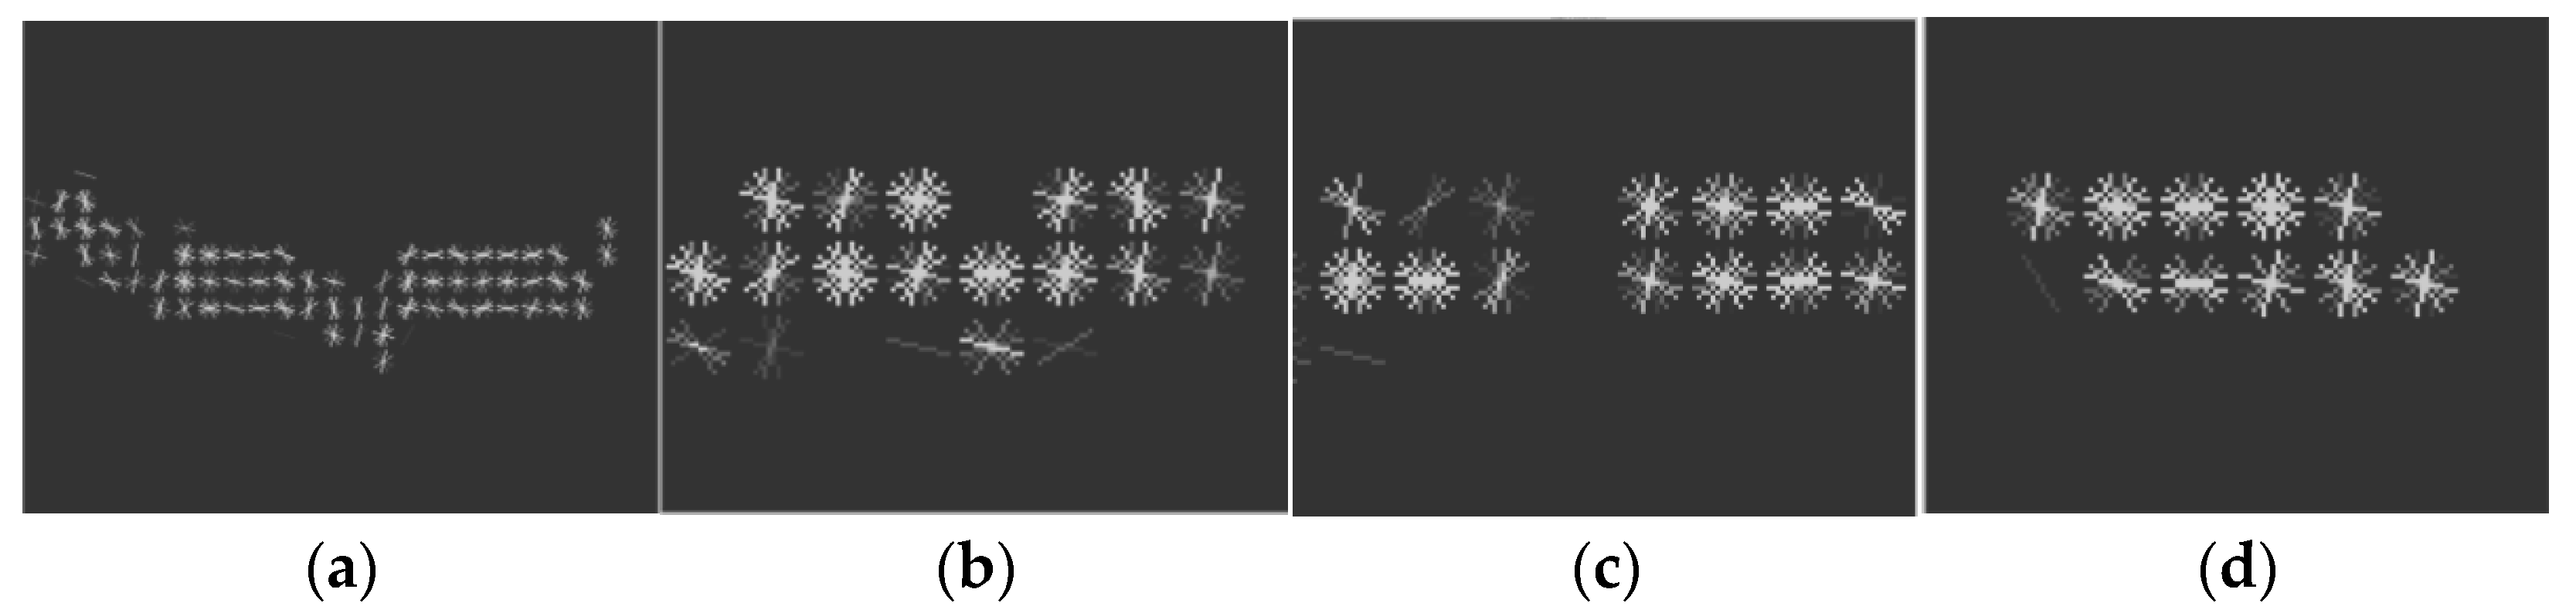
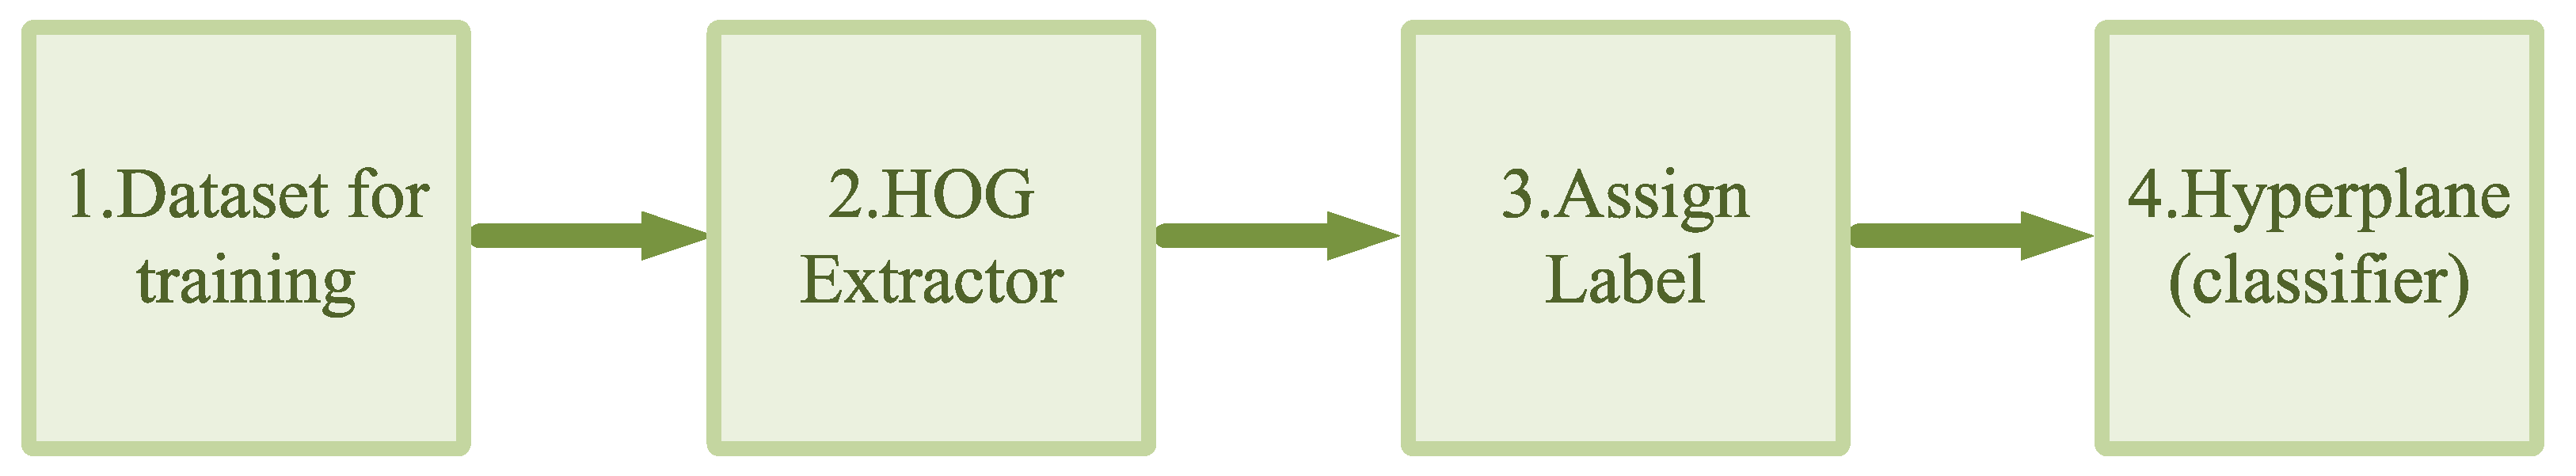
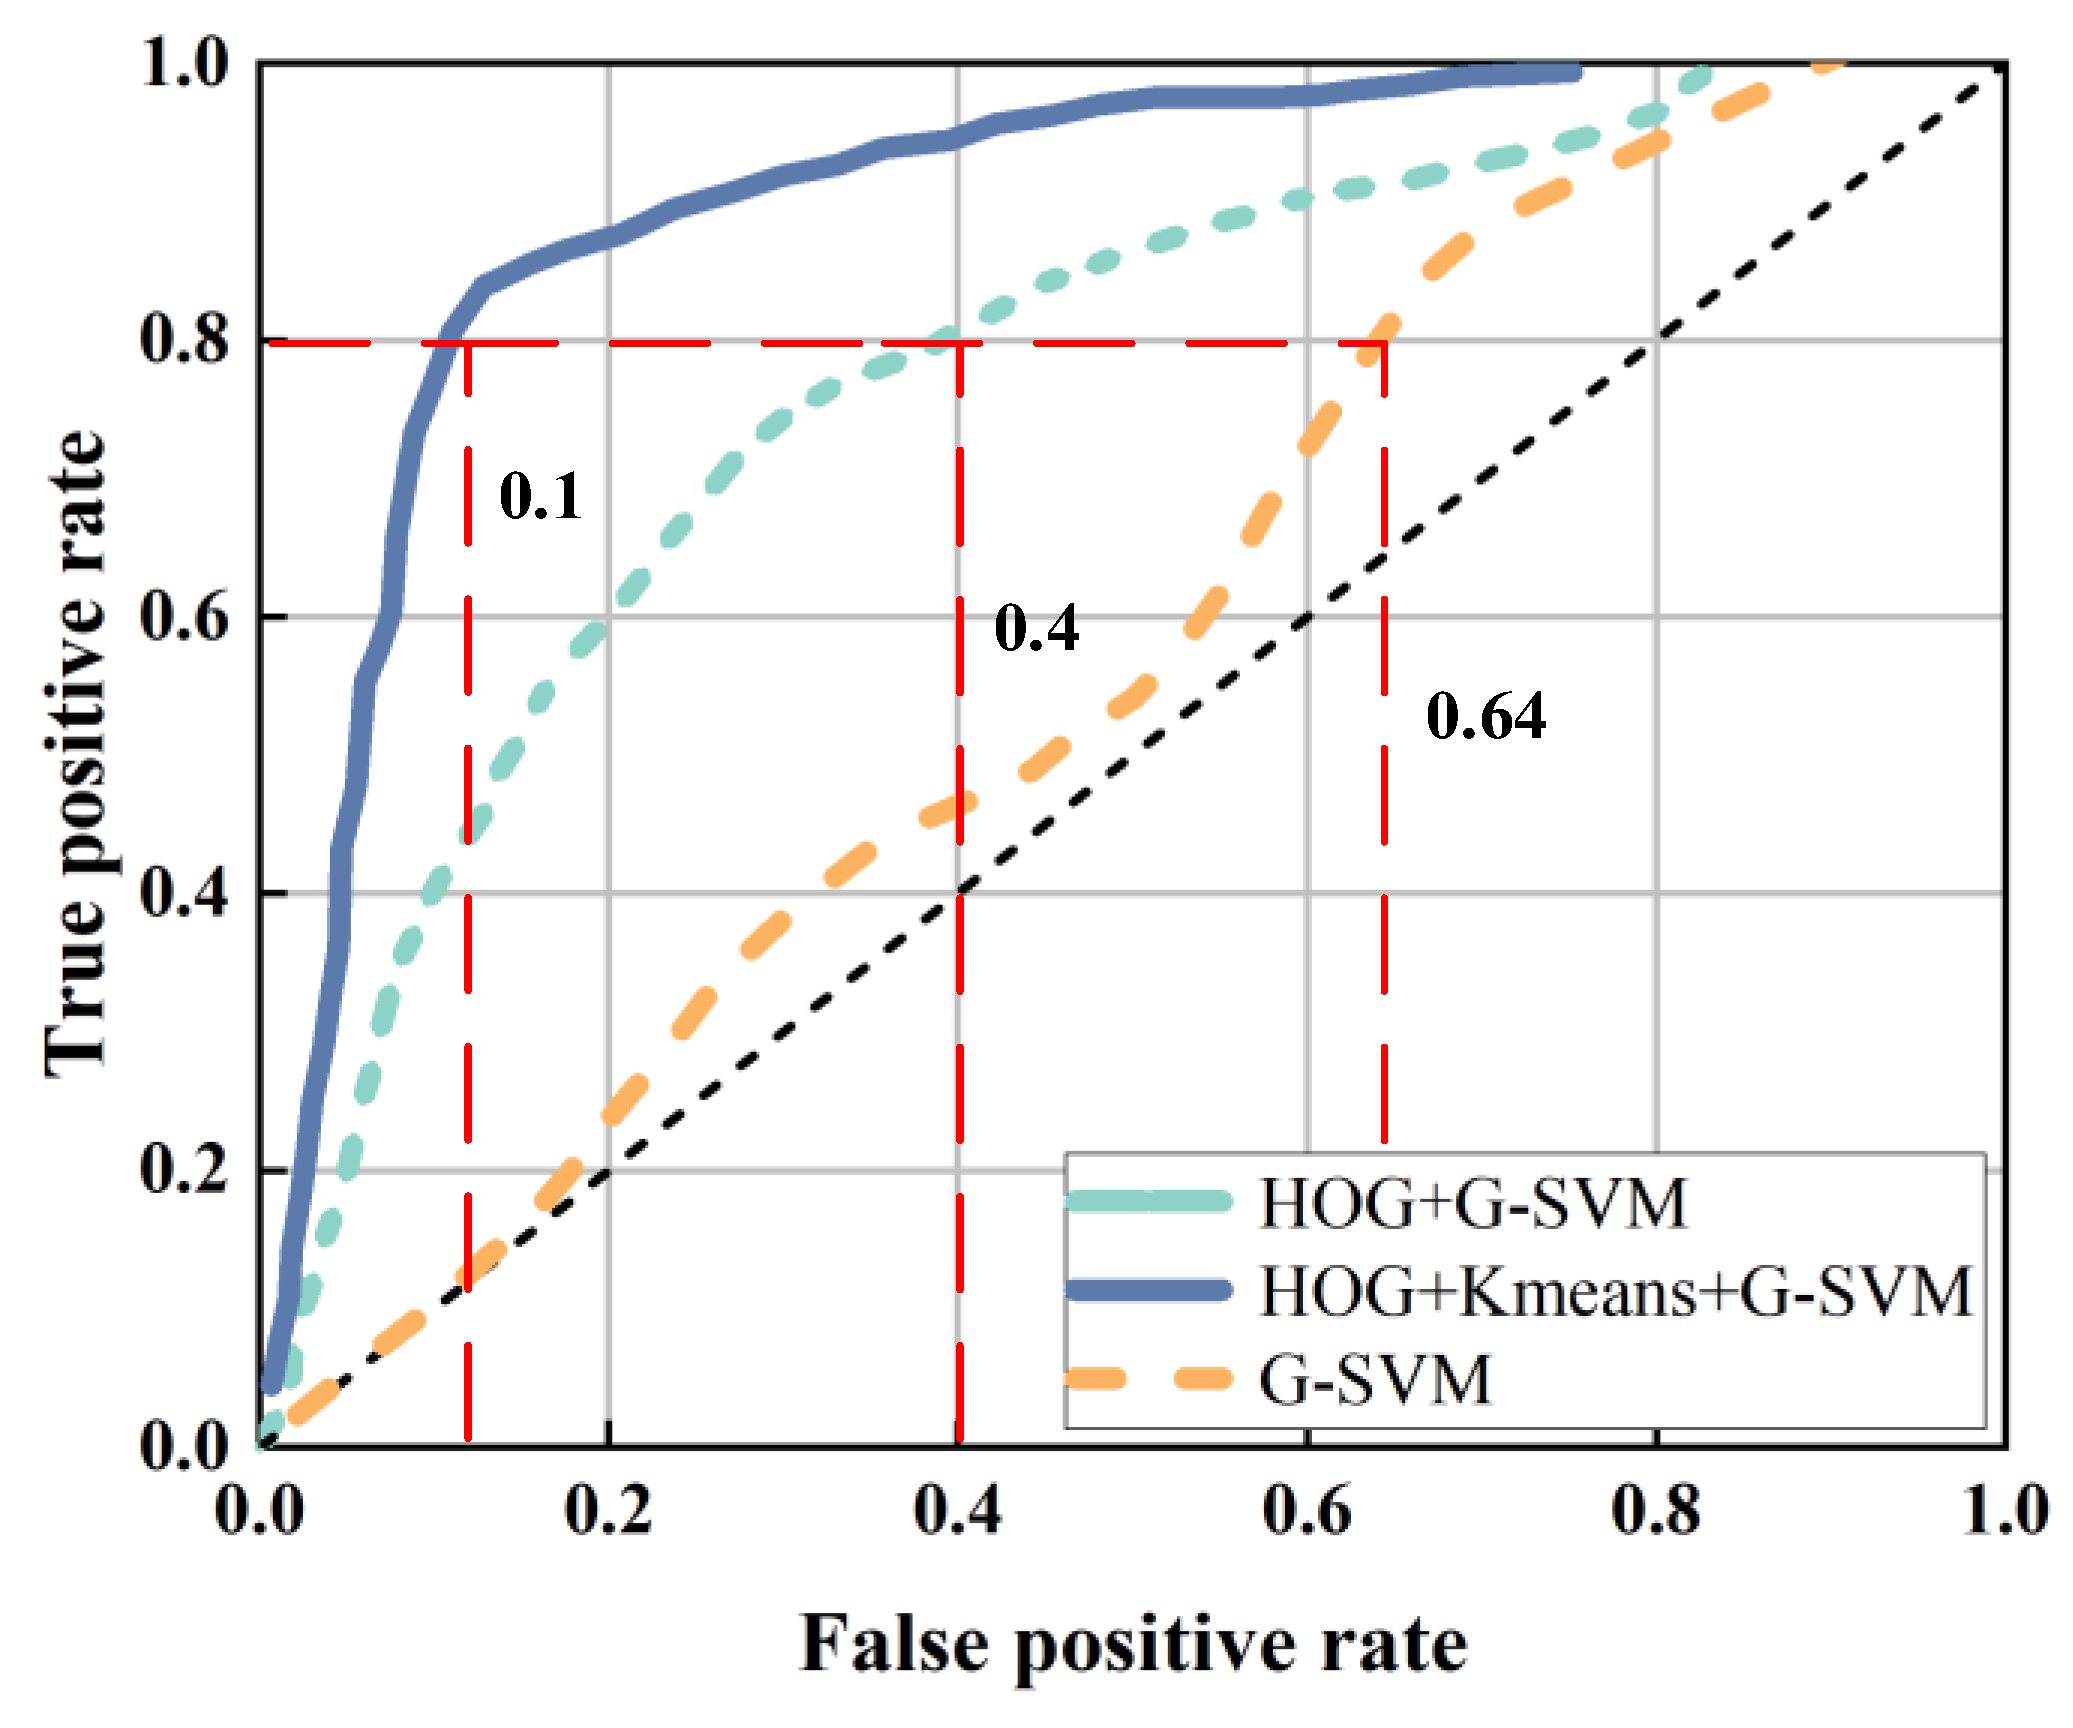
  • In this paper, we adopted the OR-PCA method to extract the correlation of CSI, eliminated the noise generated from other obstacles, such as walls, used the clustering algorithm to segment the Doppler-shifted images caused by motion and then the HOG algorithm to obtain the critical features of the images, and finally fed them into the SVM classifier optimized by the grid search algorithm (G-SVM) for motion classification. This method not only distinguished the indoor personnel state (unoccupied, occupied) well but also improved the accuracy of human body detection in the case of through-the-wall detection.
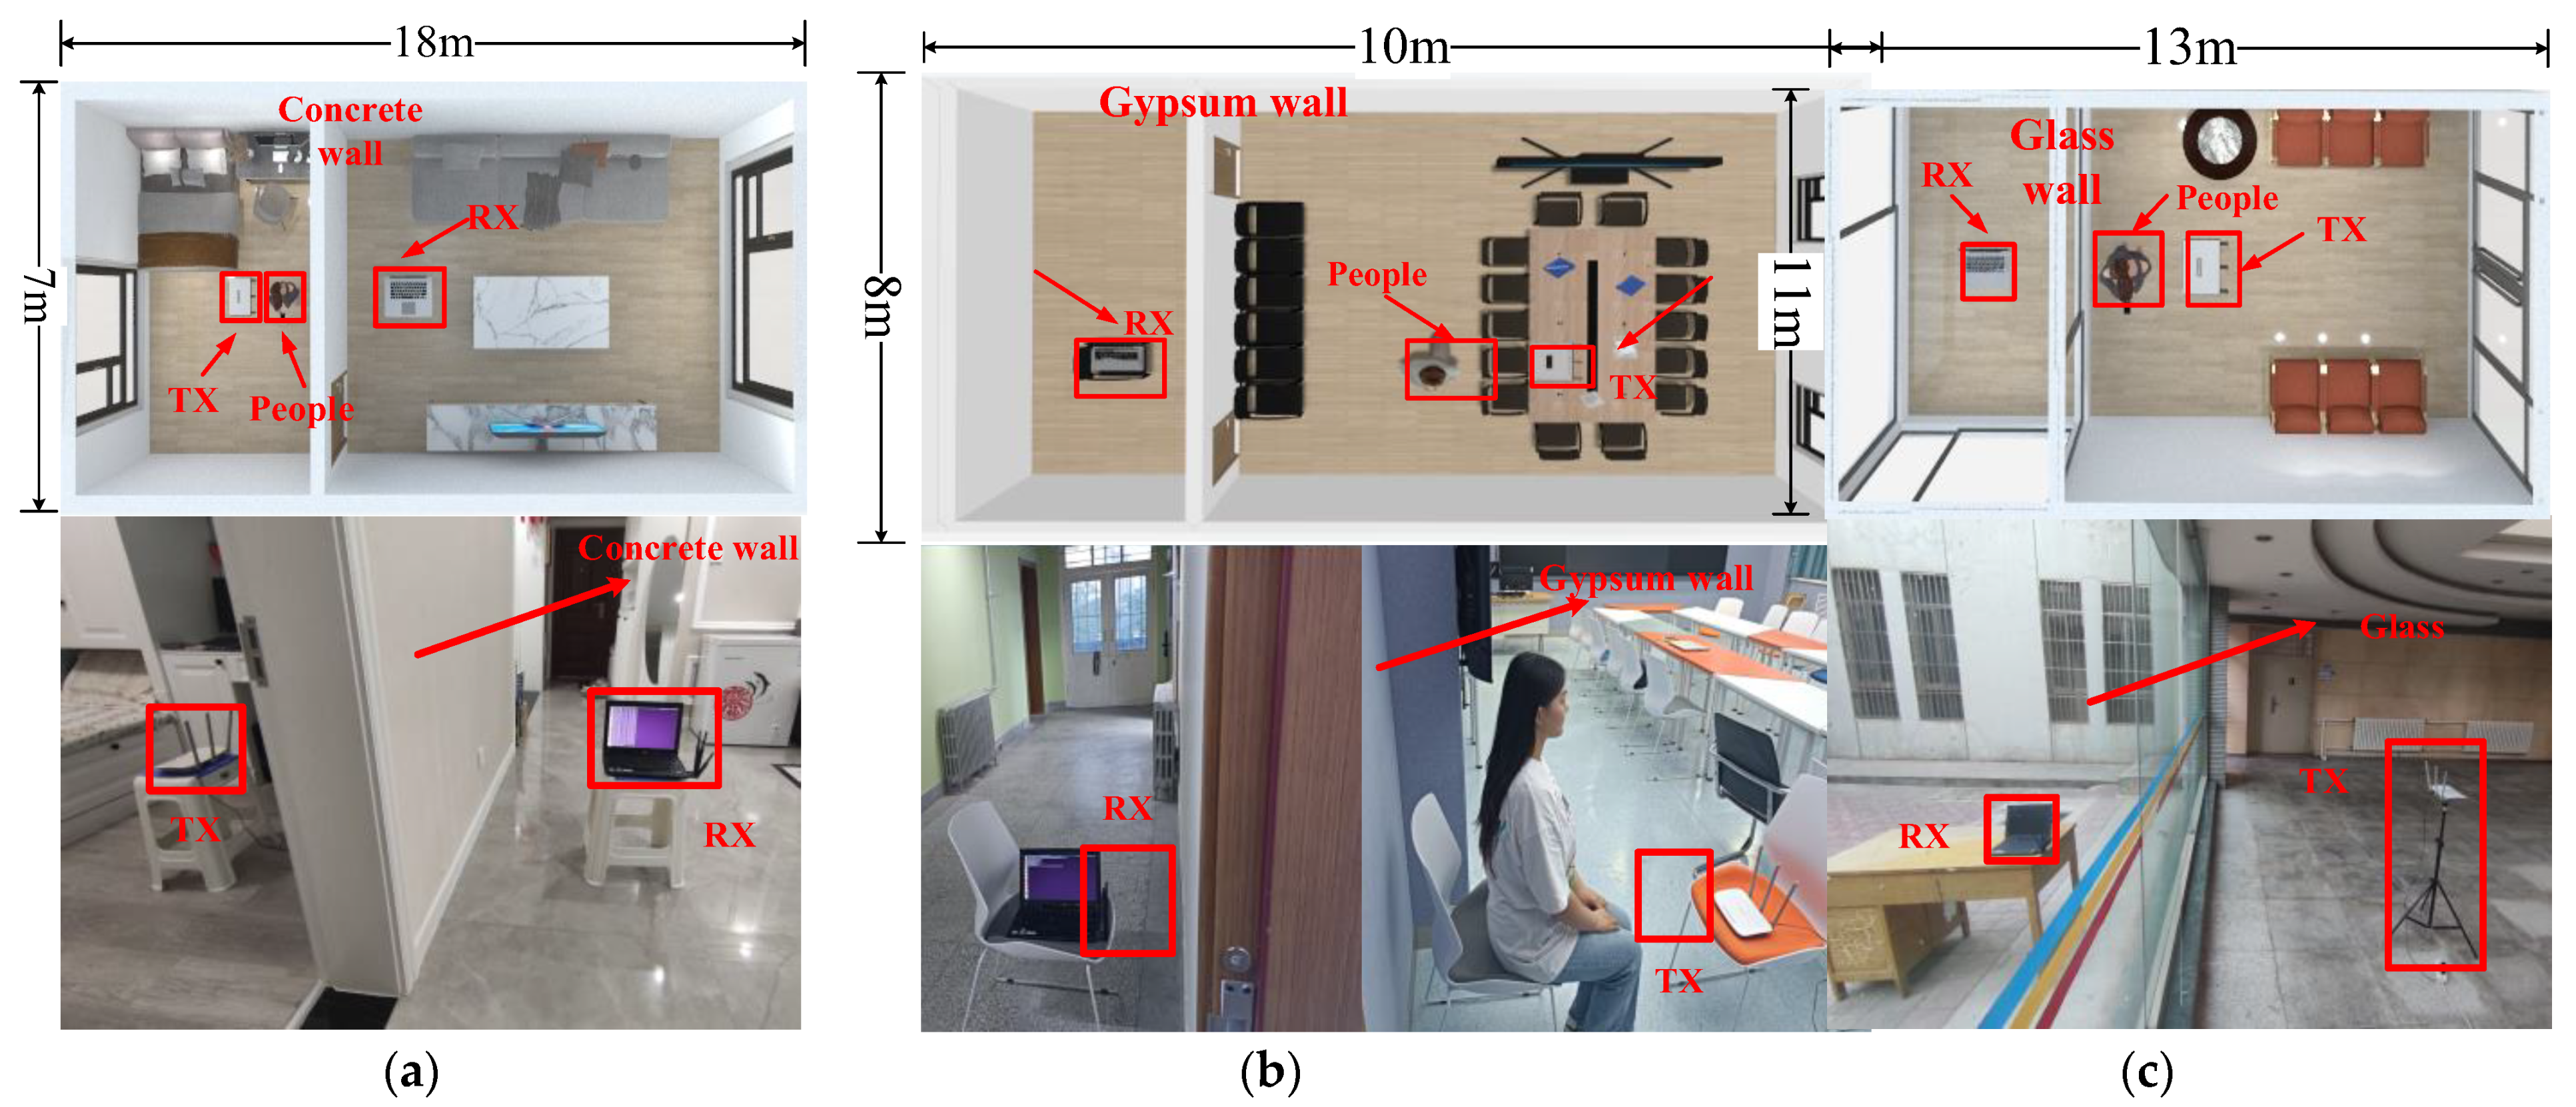
  • We used commercially available Wi-Fi devices to collect various data for different wall materials and thicknesses, as well as for different personnel locations and device distances. The reliability and stability of the system were verified by adjusting various parameters. The final experimental results provided usage boundaries and deployment scenarios for through-the-wall practical applications.
The rest of this article is organized as follows. The second part introduces the related work and research; the third part introduces the related technical theory; the fourth part describes the system structure and design in detail; the fifth part evaluates and analyzes the experiments; and the sixth part summarizes the whole work and proposes a future outlook.

2. Related Work

2.1. Radar Through-the-Wall

Regarding through-the-wall human detection, radar technology is currently widely used. Radar technology can utilize ultra-wideband signals through-the-wall and detect the presence of human beings.
Ding et al. [9] proposed a target localization algorithm based on an improved Hough transform frequency-fitting technique. The adaptive extended Bessel frequency fitting model is constructed by dynamically adjusting two shape parameters. The demodulation of the echo signal using the fitted curve completes the separation of multiple target components and combines it with Doppler processing methods to synthesize the target motion trajectory, realizing real-time target localization of the wall-penetrating radar targets. Dong et al. [10] proposed a study of a time-frequency correlation MUSIC algorithm for the detection of human body targets in wall-penetrating radar, which is achieved by correlating the inverse fast Fourier transform (IFFT) algorithm with the MUSIC algorithm. The power enhancement of the target signal is accomplished according to the time domain distance calculation results. The signal is then converted to the frequency domain for the direction of arrival (DOA) estimation. The status and position information of the human target behind the wall can be better monitored. Rohman et al. [11] used radar technology to detect the presence of people behind obstacles and proposed a new signal processing method for extracting and enhancing human detection signals from radar to detect whether the human body status is well detected. However, the problem with most of the human body detection through the wall using radar technology is that the experiment has relatively high requirements for the environment, and it must be in a dry environment and within a certain linear distance or a small range to achieve better results. Otherwise, it will attenuate radar signal power; human body signals are challenging to detect, and deployment costs are high, so this technology is not suitable for all scenarios.

2.2. Wi-Fi Through-the-Wall

Although there has been much research on human sensing for CSI, through-the-wall applications still need to be improved compared to non-through-the-wall applications. This is because Wi-Fi signals are more severely attenuated after through-the-wall, which has a complex impact on recognition accuracy, and through-the-wall is still facing tremendous difficulties and challenges, so there is less technical and related research work on Wi-Fi through-the-wall for human detection. However, through-the-wall sensing technology enables us to monitor human activity more effectively and accurately, and many potential applications would benefit from powerful capabilities across different rooms, such as elderly monitoring, intruder detection, and emergency rescue. In the actual wall-penetrating environment, as there is no enclosed space, Wi-Fi signals may cross to the other side of the wall through various gaps in the environment (e.g., door cracks, small holes, etc.) through reflection, refraction, scattering, diffraction, etc. Therefore, it is critical to determine the method that can penetrate the wall and sense the target. Furthermore, Wi-Fi devices provide a good alternative.
Gong et al. [12] proposed a Wi-Fi-based system for device-less behavioral recognition of wall penetration, which recognizes behavioral activities by extracting and analyzing the amplitude values of the subcarriers in the wireless channel and classifying the preprocessed activity samples using Bi-LSTM. Guo et al. [13] proposed a crowd base counting system using Wi-Fi signals, which utilizes commercially available Wi-Fi devices to extract the phase difference data of channel state information (CSI), removes the uncorrelated noise, extracts the feature group by combining the subcarrier correlation, and then uses a BP neural network to realize human detection and head counting through-the-wall. Yuan et al. [14] proposed a new system that extracts finer features from the time off (ToF) of the signal and then trains a neural network to classify these features to determine if there is a stationary person behind the wall. Experiments were conducted in a typical office, and good performance was achieved. Wang et al. proposed a device-free through-the-wall human detection and localization system, TWPalo [15], by iterating the obtained AoA, ToF, and DFS, all with channel reconstruction and pair-cancellation, so that the CSI of each propagation path could be separated. Finally, the human-induced reflection (HIR) parameters and an ellipse-based model are established by the obtained parameters and the spatial geometric relationship between the human movement and the position of the transceiver pair to achieve human detection and localization in the through-the-wall scenario, where the experiments are conducted mainly in conference rooms and offices using wall materials of glass and concrete.
Although the articles mentioned earlier on the perception of Wi-Fi through-the-wall have achieved good results, many experiments have been conducted in austere environments. Therefore, these experiments only sometimes guarantee the robustness of the system. However, in wall-penetrating scenarios, many factors, such as wall material and thickness, and changes in personnel positions, can significantly affect recognition performance. However, many studies have yet to analyze this problem in experiments, so we will design multi-class comparative experiments to verify the reliability of the system proposed in this paper.

3. Preliminaries

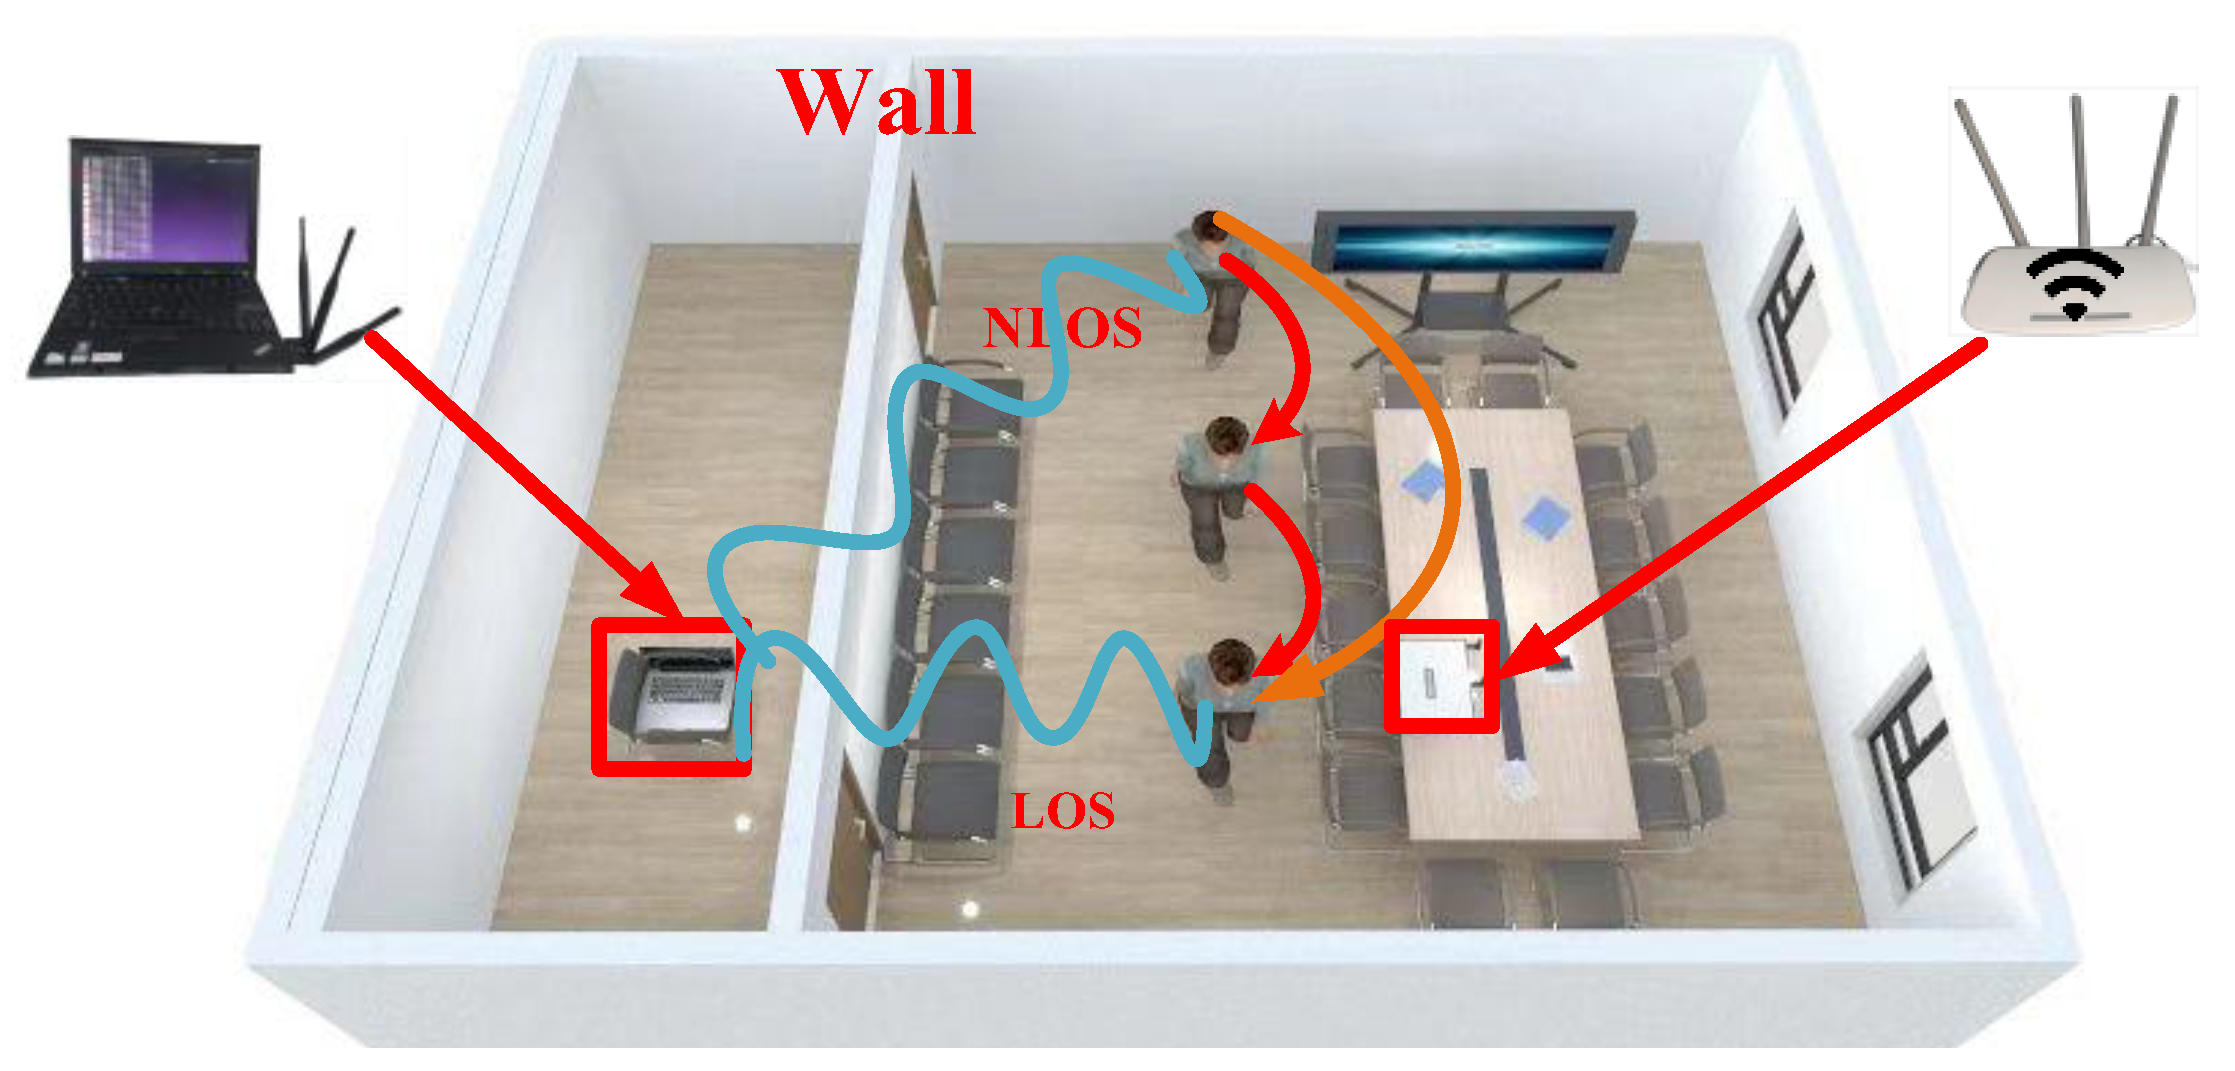
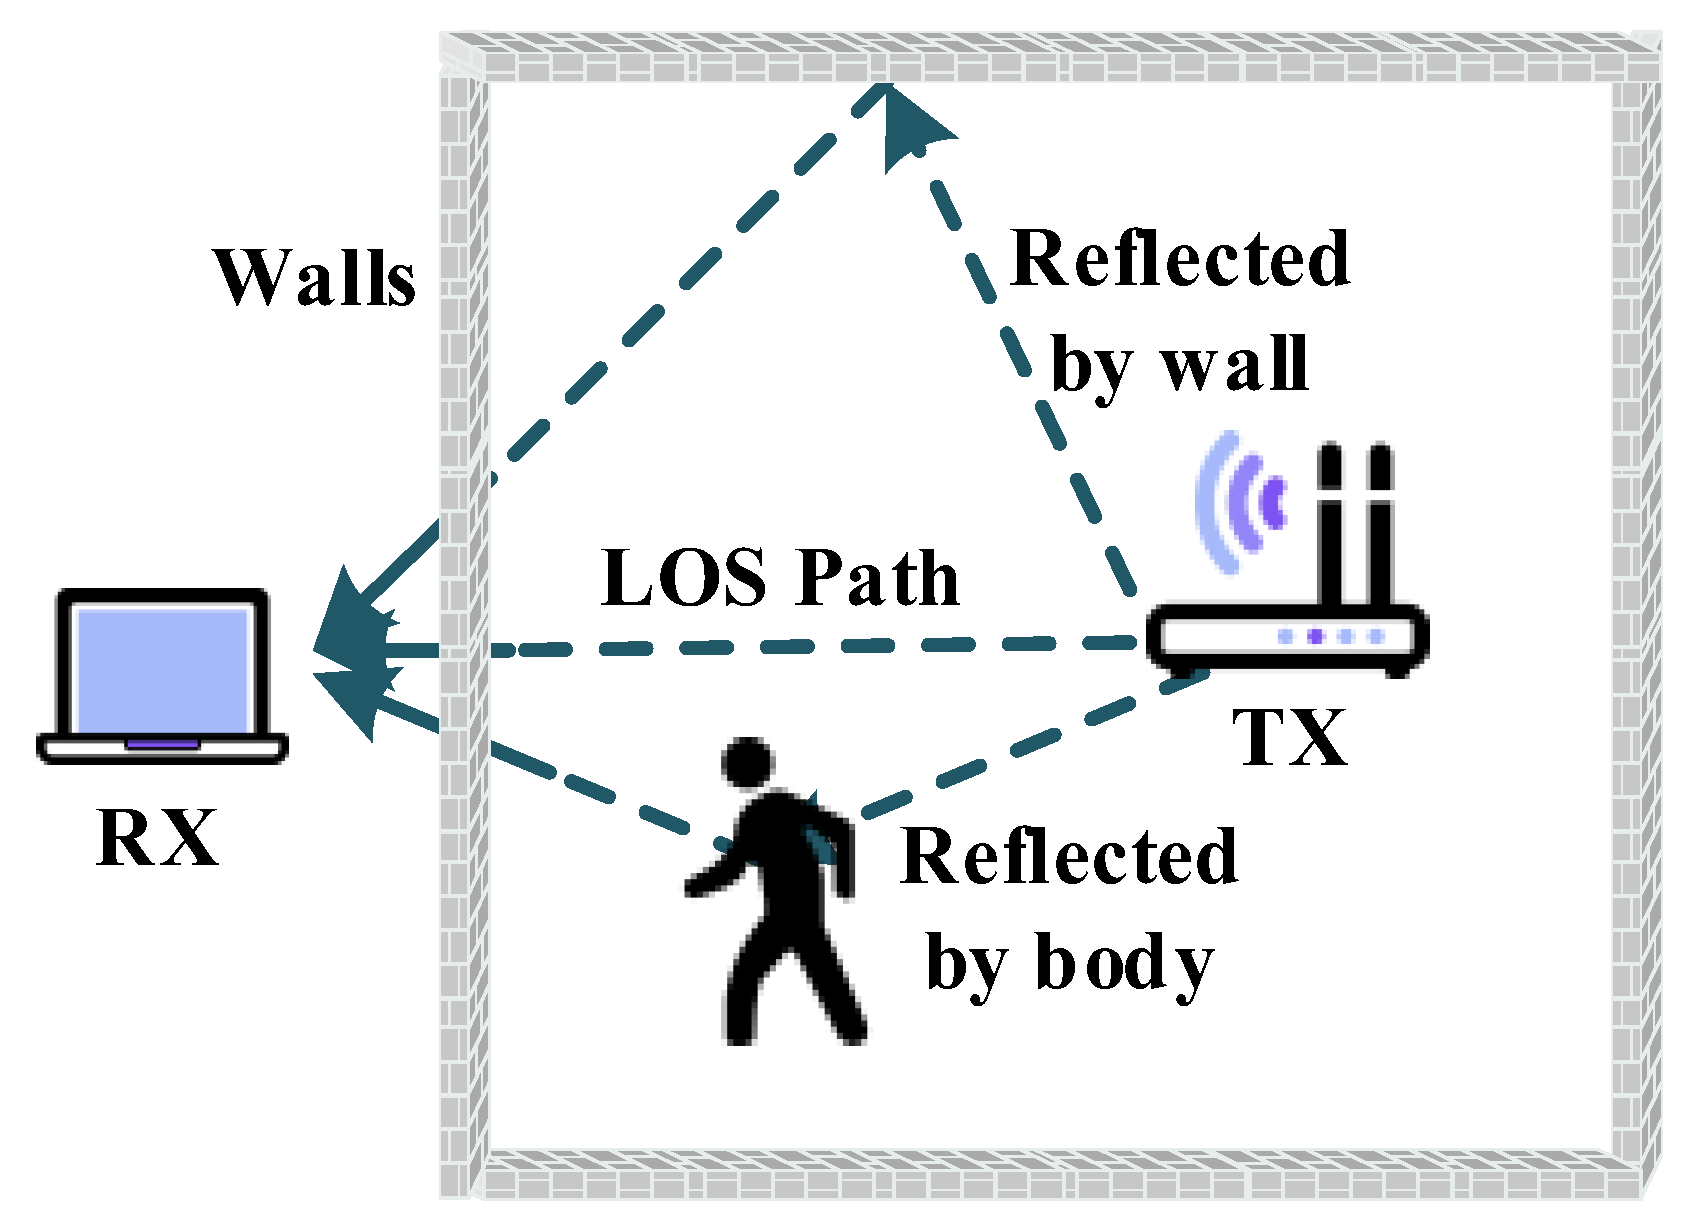
3.1. Through-the-Wall CSI Model

CSI describes how a signal propagates from a transmitter to a receiver in wireless communications. At the same time, CSI is affected by the physical environment (such as reflection, diffraction, and scattering). In a narrow-band flat fading channel with multiple transmit and receive antennas (MIMO), the channel can be modeled as follows:
y = H x + n
where x is the transmitting vector; y is the receiving vector; H is the channel matrix; and n is the noise vector.
Since commercial Wi-Fi devices use Orthogonal Frequency Division Multiplexing (OFDM) systems, CSI has physical layer information with fine-grained characteristics, describing the amplitude and phase information of each subcarrier to express channel characteristics. Specifically expressed as:
H ( f , t ) = i N α i ( t ) e j 2 π f τ i ( t )
where α i is the amplitude attenuation of the ith path, N is the total number of propagation paths, α i ( t ) and τ i ( t ) are the complex attenuation factor and flight time of the ith path, respectively [16].
When the Wi-Fi signal propagates through-the-wall, it will be affected by the complex structure of the indoor wall, the human body, the ceiling, the floor, the table and chairs, and other objects, resulting in the reflection, scattering, and refraction of the signal. As shown in Figure 2, according to the free space propagation model [17], the propagation model of the Wi-Fi signal in the above environmental influence is:
P r ( d ) = P t G t G r λ 2 ( 4 π ) 2 d 2 L
where P r ( d ) is the receiving power, G r is the receiving antenna gain, G t is the transmitting antenna gain, P t is the transmitting power, λ is the wavelength, and d is the distance from the transmitting end to the receiving end. In a typical indoor environment, considering a series of signals passing through-the-wall and people’s motion, the model can be expressed as:
ω = ρ s 6
P r ( d ) = P t G t G r λ 2 ( 4 π ) 2 ( d 2 + 4 d r 2 + η 2 ) L L ω
where d r is the distance from the reflection point to the direct path, η is the change in path length caused by human motion, L is the system loss factor, ω is the influence of the wall material on the signal, ρ is the density of the wall, s is the surface area of the wall, and L ω is related to the material of the wall. The thicker the thickness of the wall material and the more complex the structure, the higher the value L ω , and the greater the attenuation of the signal. For example, if the wall is 15 inches wide concrete, L ω = 15 dB, and if the wall is 1.18 feet glass, L ω = 3 dB because the glass material is simpler in structure than the concrete wall. The lower the value in Equation (4), the less the glass material affects the signal, and the less signal attenuation will occur. Thus, the received power of P r ( d ) will become larger, and the obtained CSI signal characteristics will be more obvious.

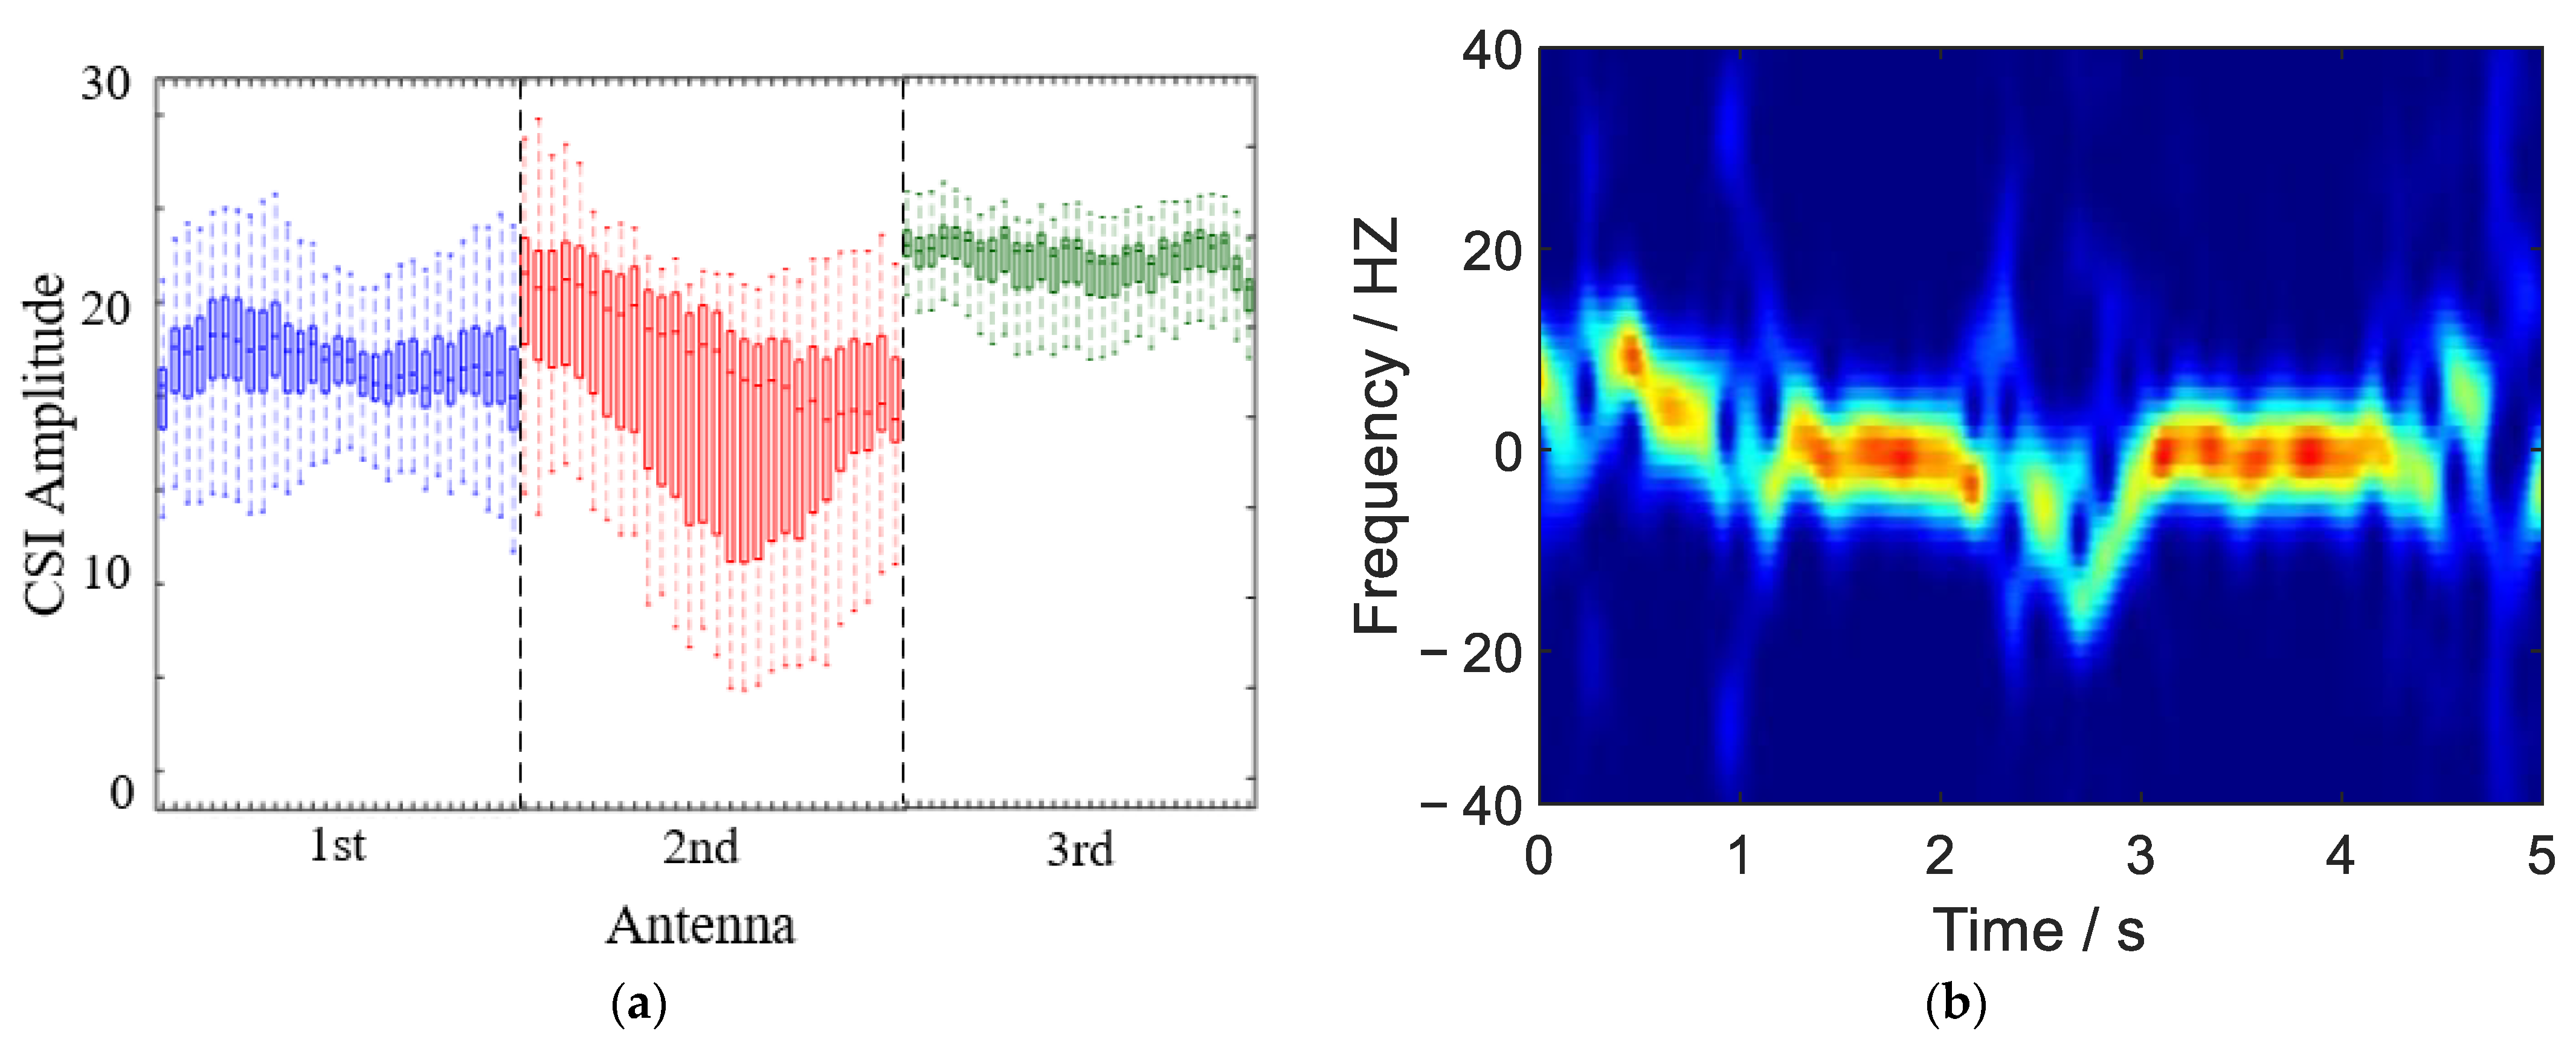
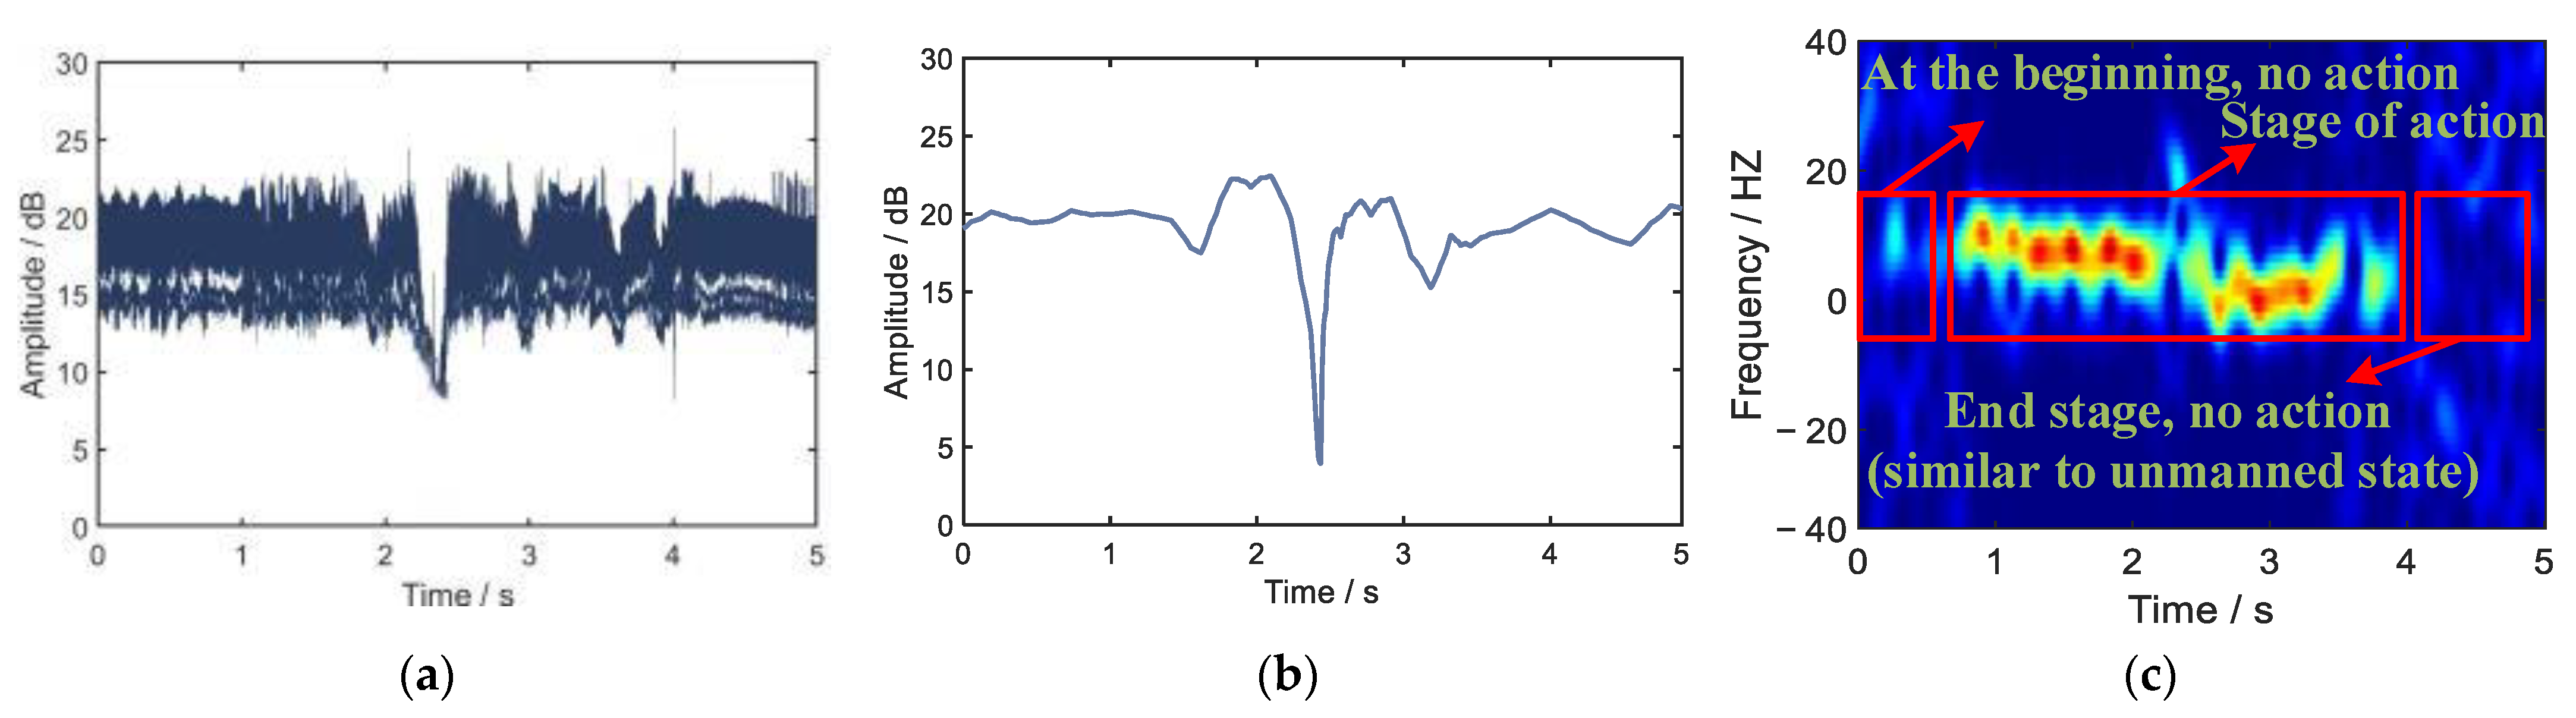
3.2. OR-PCA and Doppler Shift

Robust Principal Component Analysis (OR-PCA) can effectively reduce the degree of interference to CSI signals from other environmental factors, such as walls. This method requires the use of the principle of low-rank matrix decomposition, that is P = A + B ( P R n 1 × n 2 ) , it is assumed that the matrix A is a low-rank matrix. B is the sparse error, known P, and finally needs to get the value of A and B. Therefore, it can be expressed as the following combinatorial problem [18]:
min A + γ B 1
s . t .   P = A + B
where A is the kernel norm of matrix A and is the sum of singular values of A. That is A = i = 1 min { n 1 , n 2 } τ i , τ i is the ith singular value of A, where n 1 and n 2 are the row and column lengths of P, respectively, γ is the weighting factor.
Therefore, OR-PCA eliminates the influence of noise B generated by other physical environmental factors, such as walls, on the data P, thereby obtaining significant CSI amplitude changes and making the Doppler frequency shift image characteristics caused by human motion more obvious.
According to the literature, the Doppler frequency shift is the change in the oscillation frequency of the reflected signal [19], as shown in Figure 3b. Usually, the Doppler frequency shift of the reflector signal can be expressed as:
F D = 1 υ d d t d ( t )
where υ is the wavelength of the signal and d ( t ) is the length of the reflection path. Using the above formula, the Doppler frequency shift of the CSI signal can be extracted. In order to extract the Doppler shift correctly, converting the noisy CSI into a spectrogram of the Doppler shift requires selecting the correct antenna pair, as shown in Figure 3a. According to Equations (2) and (6), the channel response can be calculated with the Doppler shift on each path is expressed as:
D ( f , t ) H s ( f ) + i H d α i ( t ) W ( F D i ( t ) )
where H s ( f ) is the sum of the static path responses that through-the-wall when no action is triggered in the absence of people, and H d is the set of dynamic paths after passing through-the-wall caused by the signal changes caused by the action in the presence of people, which W ( F D i ( t ) ) is the cutoff of the target signal area window function. The Doppler shift of the CSI signal can be extracted using Equation (9), thus accurately extracting the characteristics of the personnel when they are present.

4. System Architecture

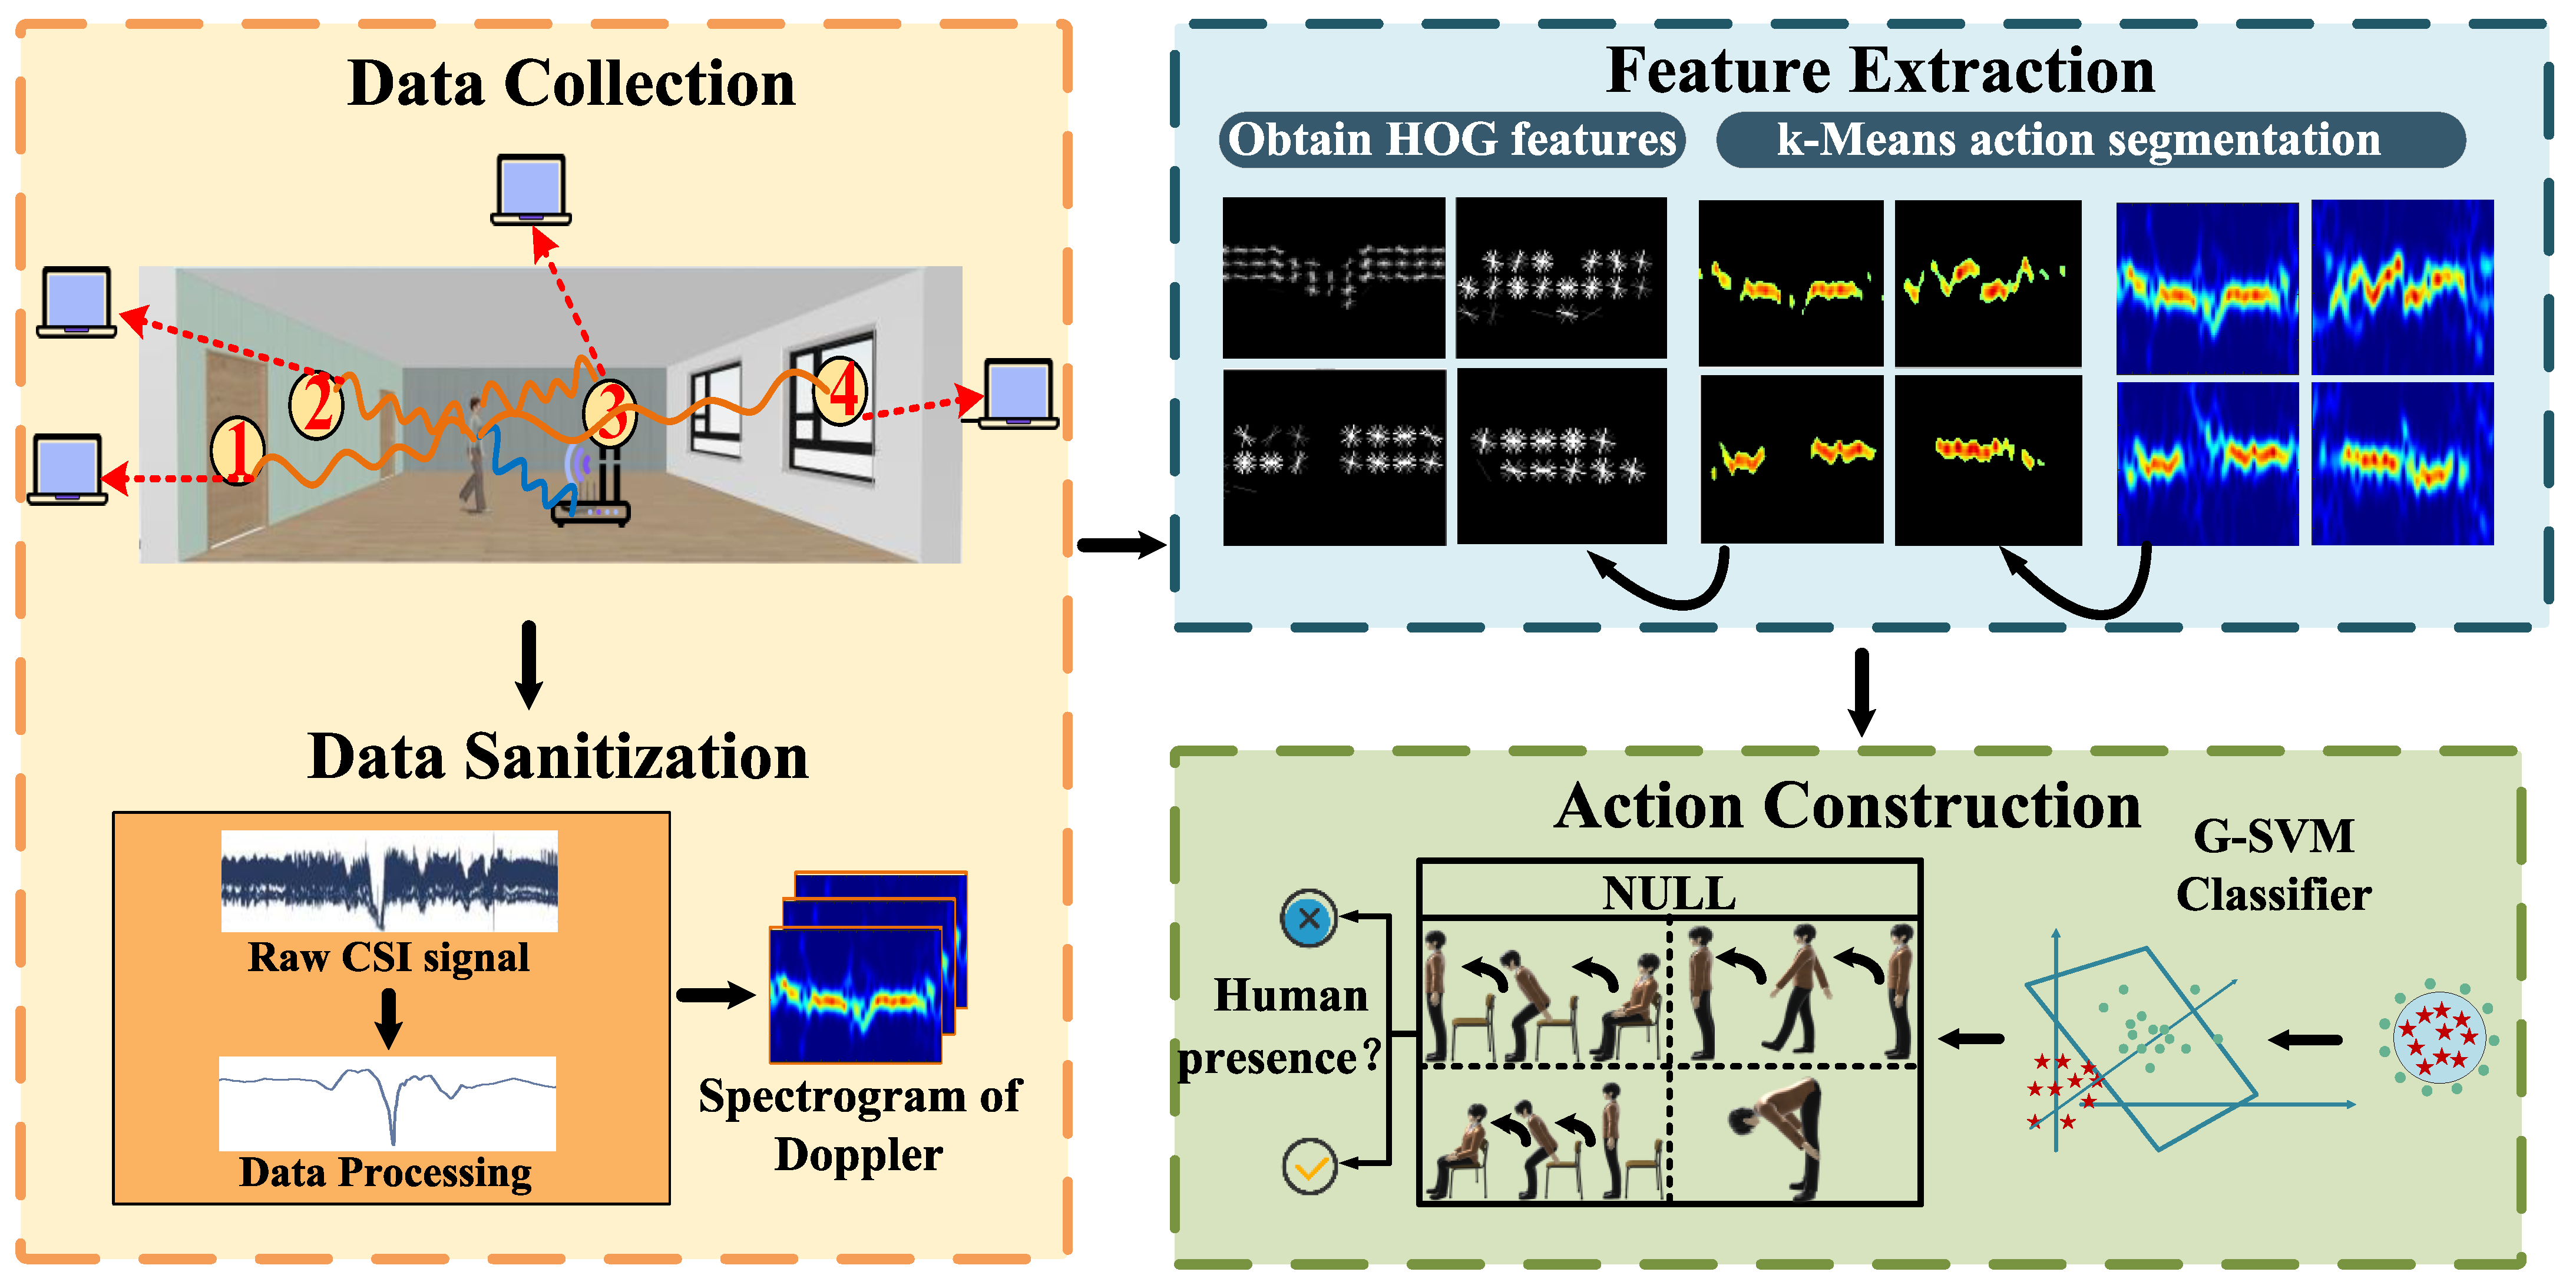
4.1. System Overview

We divided the system proposed in this paper into four main parts: data collection, data processing, feature extraction, and active construction. The system flow is shown in Figure 4. In the data collection part, we selected multiple wall materials (concrete wall, plaster wall, wooden door, glass wall) and used a TP-LINK router and a commercial laptop device equipped with an Intel 5300 NIC to communicate in the experimental scenario with different wall materials: the router as the transmitter and the laptop as the receiver. The receiving device records and stores the raw CSI action signals. The data preprocessing part requires the raw CSI data to be processed and converted into Doppler shifts. First, outlier removal is performed on the raw CSI action data using the Hampel filter, and denoising is performed using a discrete wavelet transform. Then, the correlation extraction of CSI is performed using the OR-PCA algorithm to remove complex noise from other obstacles and walls. Finally, the subcarriers with significant waveforms are converted into Doppler shift maps. The feature extraction part first uses the K-Means algorithm to segment the central part of the action in the formed Doppler shift image and then extracts the HOG feature of the segmented image as the feature vector of the action, which is convenient for use in the human body detection and recognition stage. In the human detection and recognition stage, the G-SVM classifier optimized by the grid search algorithm is used to classify and identify the images after feature extraction, and finally output the human detection results.

4.2. Data Preprocessing

The first component of processing the collected CSI data is the removal of abnormal values. From the experimental process and the collected data, there is a mixture of abnormal data not caused by human motion, so these data need to be removed.
Since commercial Wi-Fi equipment is very susceptible to the influence of complex indoor and outdoor environments, especially in the condition of passing through-the-wall, it will become more serious; it will make the raw CSI data contain noise that affects the human detection results, so the CSI data should first be denoised [20]. Here, we use a denoising method based on discrete wavelet transform to remove random noise and smooth the CSI data.
The PCA algorithm is used to select the optimal subcarrier in the channel to reduce the data dimension and computational complexity. In this way, the complexity of the data can be effectively reduced, and the optimal sub-carrier can be selected to represent the channel. Compared with the original CSI data, the data after using the PCA algorithm is smoother and cleaner, and a specific CSI correlation can be extracted. The quality of the CSI correlation determines the accuracy of the final human detection. However, when walls block all direct and reflected propagation paths between the transmitter and receiver, the change in CSI value caused by human activities becomes small, and existing denoising techniques (PCA) may lead to a poor final classification effect. The reason is that the CSI correlation directly extracted from the raw CSI measurements includes not only the correlation between human activities but also the correlation between the background environment and noise, which will seriously interfere with the CSI correlation between human activities and the changes in CSI values caused by them.
Table 1 shows the signal attenuation for the different wall materials. Therefore, we must eliminate the complex indoor propagation environment and noise interference on the waveform. Here, we chose OR-PCA for correlation extraction of CSI. According to CSI magnitude matrix analysis and low-rank matrix decomposition theory, OR-PCA divides the original CSI measurement into two components: the indoor physical environment CSI value and the changed CSI value, which are separated into two components. In order to obtain only the CSI value due to human movement and thus detect the presence of a person, we need to separate the original CSI from other ambient noise, such as walls, and the separation process can be expressed as follows:
min C S I w a l l + γ C S I p e r s o n 1
s . t .   C S I r a w = C S I w a l l + C S I p e r s o n
where C S I r a w is the original CSI value, C S I w a l l and C S I p e r s o n is the CSI values from other environments, such as walls and changes caused by human actions, respectively. In Equation (6), B is equivalent to C S I p e r s o n , which should be removed for sparse noise, but C S I p e r s o n contains the CSI value caused by human activities and noise, so the augmented Lagrange multiplier method is used to solve it.
OR-PCA extracts the CSI value after eliminating the influence of the environment and noise on the waveform by eliminating the CSI value of the physical environment OR-PCA extracts the CSI values that contain only the changes caused by human motion as much as possible by eliminating the CSI values of interference signals generated by other environmental noises, such as walls, so that the changes in CSI values are more pronounced than raw values. In this way, even if the Wi-Fi signal passes through-the-wall, the OR-PCA waveform will change significantly when the human activity state occurs. The before and after CSI sequences of human motion using OR-PCA under the through-wall condition are plotted, as shown in Figure 5. From Figure 5a, it can be seen that the original CSI contains more noise, and the waveform features are not obvious. At the same time, the amplitude of the subcarrier changes significantly, as shown in Figure 5b, after the noise from other environmental disturbances, such as walls, is processed away using the OR-PCA algorithm.
Then, the selected optimal sub-carrier is converted into a Doppler frequency shift, as shown in Figure 5c. It can be seen that there is no change in the Doppler image when the previous action does not start, which is similar to the Doppler frequency when no one exists. This is also a critical performance to distinguish whether there is someone indoors.

4.3. Motion Segmentation and Feature Extraction

We classified the representative motion states when someone is present into four types, as shown in Figure 6: walking, sitting down, stooping, and getting up. They correspond to the Doppler frequency shifts caused by each action. From the figure, we can see that the Doppler shift changes with the action, and the Doppler shift caused by different actions are different, and the different Doppler effects caused by different actions simultaneously are the factors that distinguish the presence of the human body whether or not. Doppler images need to be extracted with corresponding features to improve the final classification results. In this paper, first, we used the K-Means algorithm to segment the action subject in the image that causes the Doppler shift, and the pixels of RGB images were divided into three classes by calculating the Euclidean distance. The results showed that the K-Means algorithm segmented the action occurring part accurately.
The feature extraction part used the Histogram of Oriented Gradient (HOG) feature. The HOG feature obtained the local feature of the detected object by detecting the gradient and edge direction information of the local object. Compared with other feature extraction methods, HOG can better capture the local shape information, and can maintain good invariance and stability to the geometric and optical changes of Doppler frequency shift images, so different distances or similar content of the same action can be extracted by using the HOG feature when testing with different people. Therefore, this paper extracted the HOG feature of a Doppler frequency shift image.
K-means clustering was used to convert the Doppler image into a grayscale image and, at the same time, reduced the local shadow of the image, reduced the impact caused by the attenuation of the signal in the process of penetrating the wall so that during feature extraction, the image features were more apparent, which is necessary for gamma space normalization. The standardized Gamma compression equation is:
I ( x , y ) = I ( x , y ) G a m m a
where x , y are the horizontal and vertical coordinates of the pixel, respectively. This method can well reduce the influence of image feature extraction.
Then, the horizontal and vertical gradients of each pixel were calculated in the image. Operations can effectively record the look of the graph based on color and luminance changes. The gradient size and gradient direction for each pixel were calculated, more clearly outlining the action signals in the graphics:
G ( x , y ) = G x 2 ( x , y ) + G y 2 ( x , y )
ξ ( x , y ) = tan 1 G y ( x , y ) G x ( x , y )
where G x ( x , y ) and G y ( x , y ) are the horizontal and vertical gradients of the image pixels, respectively, and G ( x , y ) and ξ ( x , y ) are the gradient magnitude and direction, respectively.
Then, the picture was divided into several cells of the same size. It consisted of tiny unit pixels. Gradient information for 6 × 6 pixels in each cell was collected using a histogram of 9 cells. All pixels in the cell were multiplied by the gradient magnitude to project the gradient direction; their projections were then summed to form a histogram of cell gradient directions.
Each adjacent unit was formed into an interval, and the eigenvectors in an interval were combined to obtain multi-dimensional eigenvectors to obtain HOG features, as shown in Figure 6. The following normalization equation integrated the extracted multiple feature vectors into one:
f = σ σ 2 + τ 2
where σ is the multi-dimensional eigenvector, which τ is a small constant, in order to avoid the denominator from becoming 0.
All the extracted HOG features were integrated, and the HOG features were used as the input vector for the subsequent classification work. In the feature extraction stage, if the input data were offline data, the HOG features were extracted directly; if we want to perform person detection dynamically, we first need to perform the segmentation of the person state, segment the images of the two states of occupied and unoccupied, and then perform the HOG feature extraction, and input the data into the classifier in order to output the final action classification results.

4.4. G-SVM

Completing person presence detection requires the use of support vector machines (SVM) to classify the presence and absence of persons. SVM is a very typical binary classification algorithm. However, to avoid the occurrence of overlearning and under learning in classification, this paper used the G-SVM algorithm to optimize the penalty factor C and the kernel parameter g by using the grid search algorithm [21]. The penalty factor C and the kernel parameter g in the SVM algorithm were divided into a grid in a given range, and the values of all grid nodes were traversed. Then, the point with the highest classification accuracy was selected. The penalty factor C and the kernel parameter g corresponding to that point were optimal, thus improving the classification accuracy.
There are two main types of personnel status: no presence and occupied. Actions with occupants were divided into four groups, and people with no presence were divided into one group. When people exist, 150 data groups were collected for each action, and 600 groups of four kinds of action exist. We collected 600 datasets without the presence of anyone. The process of G-SVM training for classification was as shown in Figure 7:
We sequentially acquired RGB images from the Step 1 dataset to extract features at Step 2 (using the HOG algorithm). We divided the data into two categories, training set and test set, from which 80% of the data samples were selected as training samples and 20% as test samples. The final feature vector was formed by combining the HOG descriptors of all the blocks in the detection window, and then fed to the G-SVM classifier as input features. Based on the characteristics of the input images, labels continued to be assigned to each corresponding image at step 3 (a label of 1 corresponds to an image where a person is present; a label of 0 corresponds to an image where no person is present). Then, at step 4, based on the G-SVM algorithm, these were used to train on the Matlab tool, thereby obtaining hyperplanes for classification.
The training sample set was ( A i , B i ) ( i = 1 , 2 , , k ) , where A i is the input variable, B i is the corresponding expected value, and k is the number of samples. In this paper, the Gaussian kernel function was used to map the linear inseparable data in the low-dimensional input space to the high-dimensional feature space to make it linearly separable. The optimal separation hyperplane was constructed in the high-dimensional feature space to distinguish the state of the human, and then determine whether there was a person in the room. In order to find the optimal separating hyperplane that separate the two states, occupied and unoccupied, we needed to solve the following constrained minimization problem to find the optimal parameter for classification to distinguish these two types of data:
min P = 1 2 ω 2 + C i n ( ξ i + ξ i )
where ω is the direction vector separating the hyperplane, P is the optimization objective, C is the penalty factor, and ξ i and ξ i are the relaxation coefficients.
The linear regression function was obtained using the Lalangrangian function and then computed using the Gaussian kernel function for the solution:
f ( x ) = i n ( α i + α i ) G ( A i , B i ) + b
G ( A i , B i ) = exp { g A i B i 2 }
where α i and α i are the Lagrange factor, G ( A i , B i ) is the kernel function, and g is the kernel parameter, if f ( x ) > 0 , then A i corresponds to the person action data.
The whole process of using the grid search algorithm to improve the SVM classifier is shown in Algorithm 1.
Algorithm 1: G-SVM
Input: Dataset: ( A i , B i ) ( i = 1 , 2 , , k ) , learning algorithm: SVC; the number of training iterations: k.
Output:  a v g max (Maximum accuracy average) optimal parameters ( C , g ) .
Initialization: penalty factor C [2−8, 28], kernel parameter g [2−8, 28].
1. For i = 1, 2…k do
2. Construct G rid ( C , g ) coordinate system at intervals of 1;
3.   For  ( C , g ) = ( C , g ) 1   ( C , g ) 2 ,… ( C , g ) k  do
4.    K = Test, K − 1 = Train, Test[(C,g)]K-fold cross-validation, replace the training set and the test set
5.    while Not is ( C , g ) k  do
6.    repeat step 3 and 4, Calculate the average classification accuracy under each parameter combination a v g
7.    end
8.   end for
9.   For  a v g = a v g 1 , a v g 2 ,… a v g k  do
10.    sort(avg) and select a v g max
11.   end for
12.  end for
13.  Output:  Re t u r n a v g max ( C , g )
Eventually, the results of the returned penalty factor c and kernel parameter g were used as the optimal parameters, which could find the most accurate classification results for human detection, effectively avoiding the problems of overlearning and under learning. This could effectively distinguish between two types of feature data (human and non-human), improve the feasibility and accuracy of data classification, and achieve better human detection results.

5. Results and Evaluation

5.1. Experimental Set Up

This paper used a commercial TP-Link wireless router and a Thinkpad x201 laptop equipped with a Wi-Fi network card as the experimental equipment. As shown in Figure 8, the Wi-Fi network card was an Intel Wi-Fi Link 5300 with 3 antennas as the receiver, and the router is a TL-WDR5300 with three antennas as a transmitter for sending CSI signals. To collect CSI measurements, we installed the Linux CSI tool [22] on a laptop. In our experiments, the transmitter operated in the 5 GHz band using a 20 MHz channel bandwidth. To ensure communication quality, the notebook computer was equipped with an extended antenna, and the signal gain was 6 dB. At the same time, the CSI measurements obtained from the Linux CSI tool were processed using MATLAB.
To evaluate the performance of through-the-wall human body detection in different environments, four wall materials and three experimental environments were designed for verification. The experimental environments were bedroom, meeting room, and hall, respectively. The general structure is shown in Figure 9. The wall materials were concrete, plaster walls, wooden doors, and glass. Laptops with Intel Wi-Fi Link 5300 were deployed on one side and TP-Link wireless routers on the other in each environment.
Table 2 shows the recognition accuracy under different wall materials. It can be seen that the recognition accuracy rate of the glass wall material was the highest, and the effect was the best. The accuracy rate of the wooden door and gypsum wall material was slightly lower, and the accuracy rate of the concrete wall material was the lowest. However, the recognition accuracy rate was more than 90%, which was a better result.

5.2. Analysis of Experimental Results

To analyze the influence of different experimental parameters on the experimental results, we mainly studied the influence of the wall material on the experiment. From different wall thicknesses, different equipment spacing, different positions of personnel, and different test participants. These aspects were used to verify the reliability of the experiment.

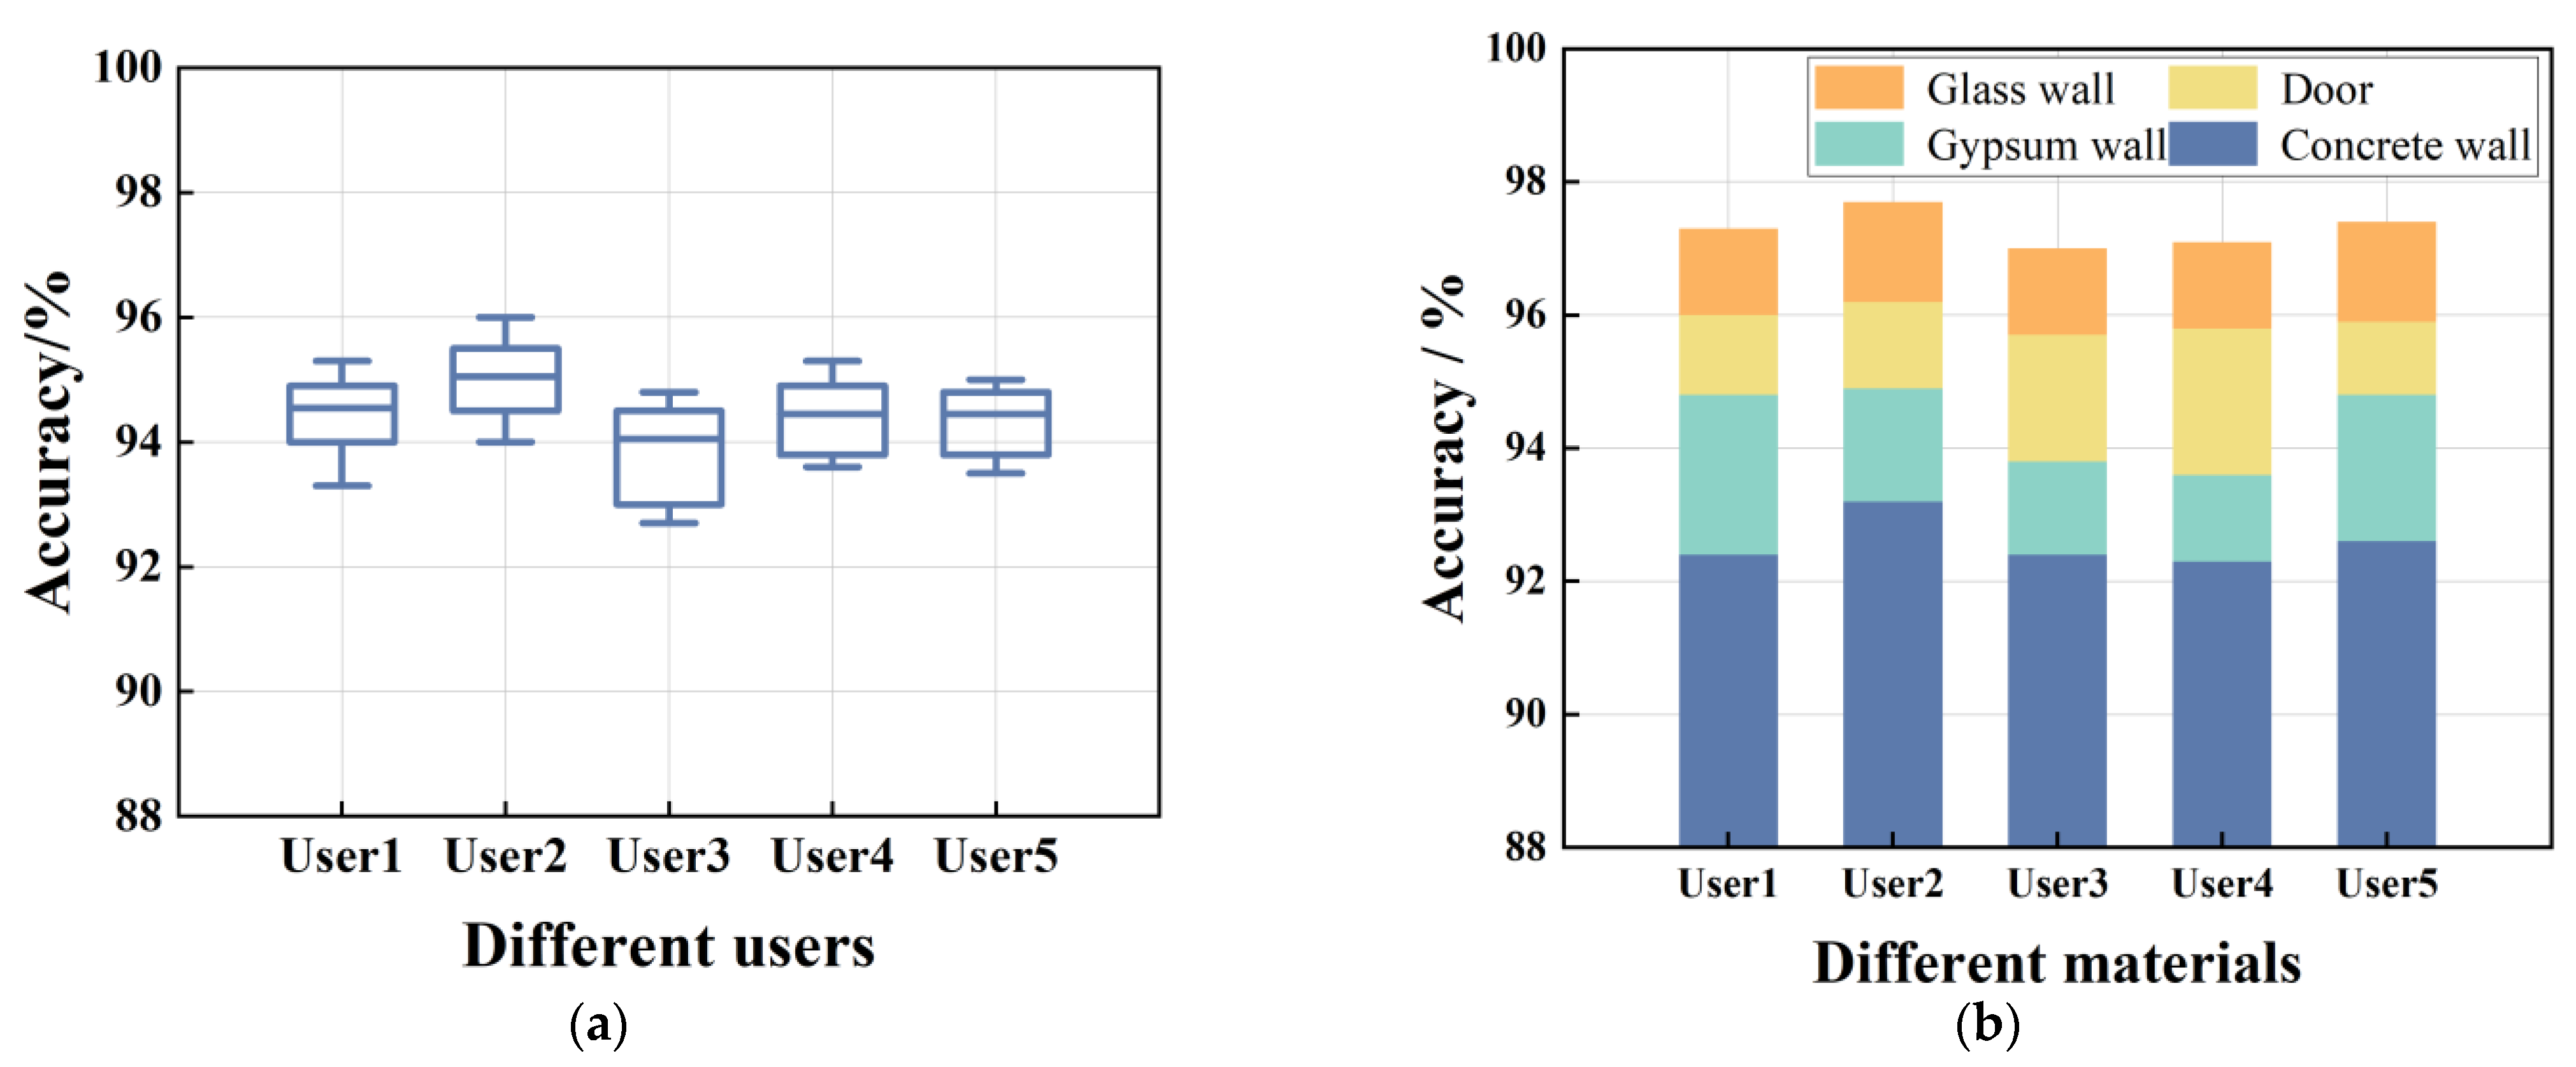
5.2.1. Influence on Different Users

To verify the influence of different users on the experimental effect. We selected a total of 5 volunteers to participate in the experiment, including 2 females and 3 males. As can be seen from Figure 10a, the recognition accuracy of the three male users of user 1, user 2, and user 5 was usually higher than that of the two female personnel of user 3 and user 4, but the overall average accuracy was small. Figure 10b shows the results of the recognition accuracy of different users using the walls of different materials. It also demonstrated that the recognition accuracy of male personnel was indeed higher than that of female personnel in general. However, the influence of different testers on the final detection accuracy of the experiment was relatively small. We also used four kinds of walls for experimental verification. It can be seen that the average recognition accuracy rate was the highest when passing through the glass wall, followed by a slightly lower recognition accuracy rate when passing through the wooden door. Due to the gypsum wall and concrete wall structure being more complex, the recognition accuracy through the gypsum wall is lower than that through the door, and the recognition accuracy through the concrete wall is the lowest. The final experimental results showed that under the condition of different wall materials, different experimenters had different final detection accuracy of the experiment. The experimental accuracy of glass walls was the highest, and the experimental accuracy of the concrete wall was the lowest. In the case of the same wall material, the experimental accuracy of the user was not much different, thus verifying the stability of the system performance.

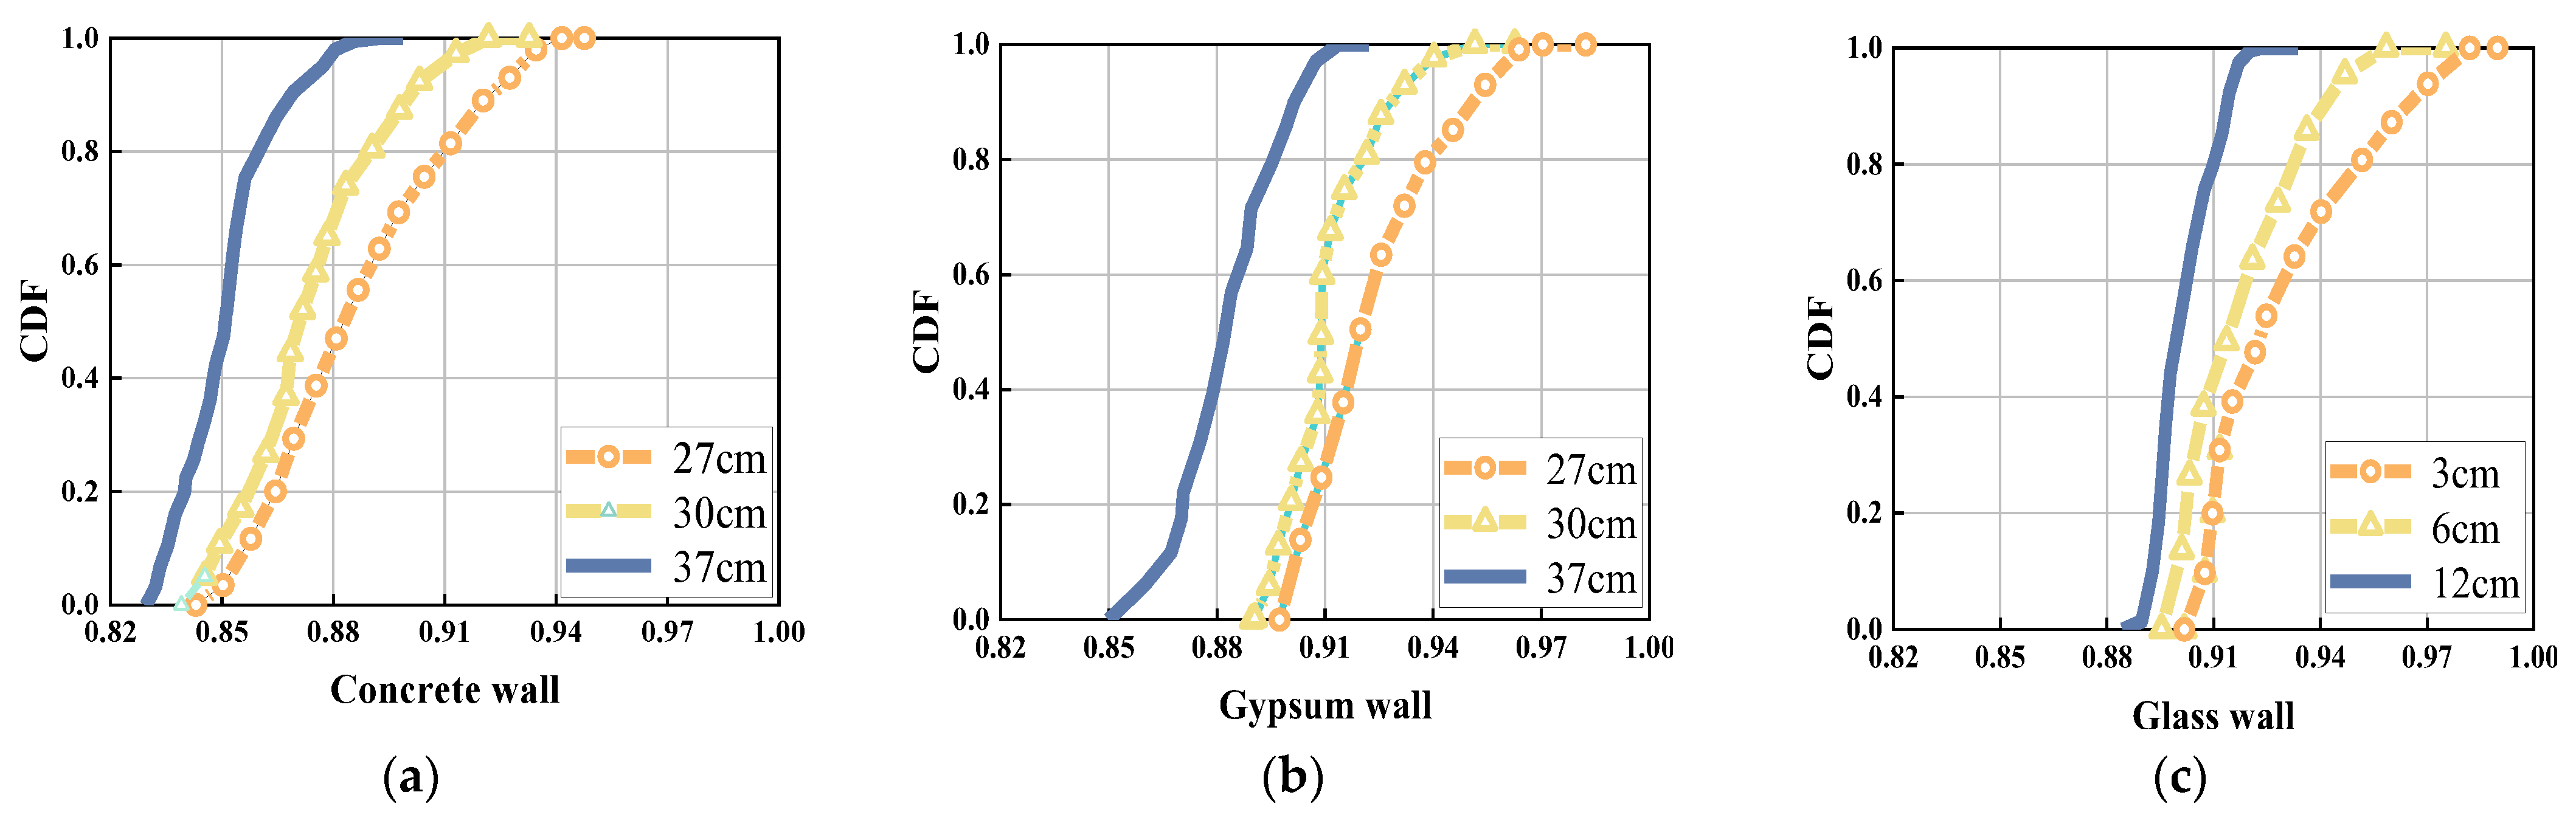
5.2.2. Influence on Different Wall Thicknesses

To verify that different wall thicknesses had a particular impact on recognition accuracy, we first selected three kinds of walls: concrete walls, plaster walls, and glass walls. Since the thickness of the door in daily life was roughly the same, we did not consider the difference or effect of the thickness of the door here in the experiment. Then, under the same material as the wall, three different thicknesses of walls were selected for experiments. The thicknesses of the gypsum wall and the concrete wall were selected as 27 cm, 30 cm, and 37 cm, respectively, and the thickness of the glass was generally higher than that of other walls, and the selected thicknesses were 3 cm, 6 cm, and 12 cm. The final experimental results are shown in Figure 11. It can be seen from Figure 11a that when the wall was made of concrete, the recognition accuracy of the wall thickness of 27 cm was the highest, and the accuracy was slightly lower when the thickness was 30 cm. The worst accuracy was 37 cm. In addition, in Figure 11b, when the wall was made of gypsum material, the recognition accuracy of the wall thickness of 27 cm was the highest, and the recognition accuracy of the thickness of 37 cm was the worst. In Figure 11c, when the wall was made of glass, the recognition accuracy of the wall thickness of 3 cm was the highest, and the recognition accuracy of the thickness of 12 cm was the worst. It can also be seen from the figure that when the wall was made of concrete and gypsum, the difference in the recognition accuracy caused by the change in the wall thickness was more remarkable; when the wall was made of glass. The difference in the recognition accuracy caused by the change in the wall thickness was slight. Therefore, the experimental results showed that the thickness of the wall was related to the experimental accuracy; when the wall thickness was thicker, the wall interference was more excellent and thus the accuracy of recognition was lower.

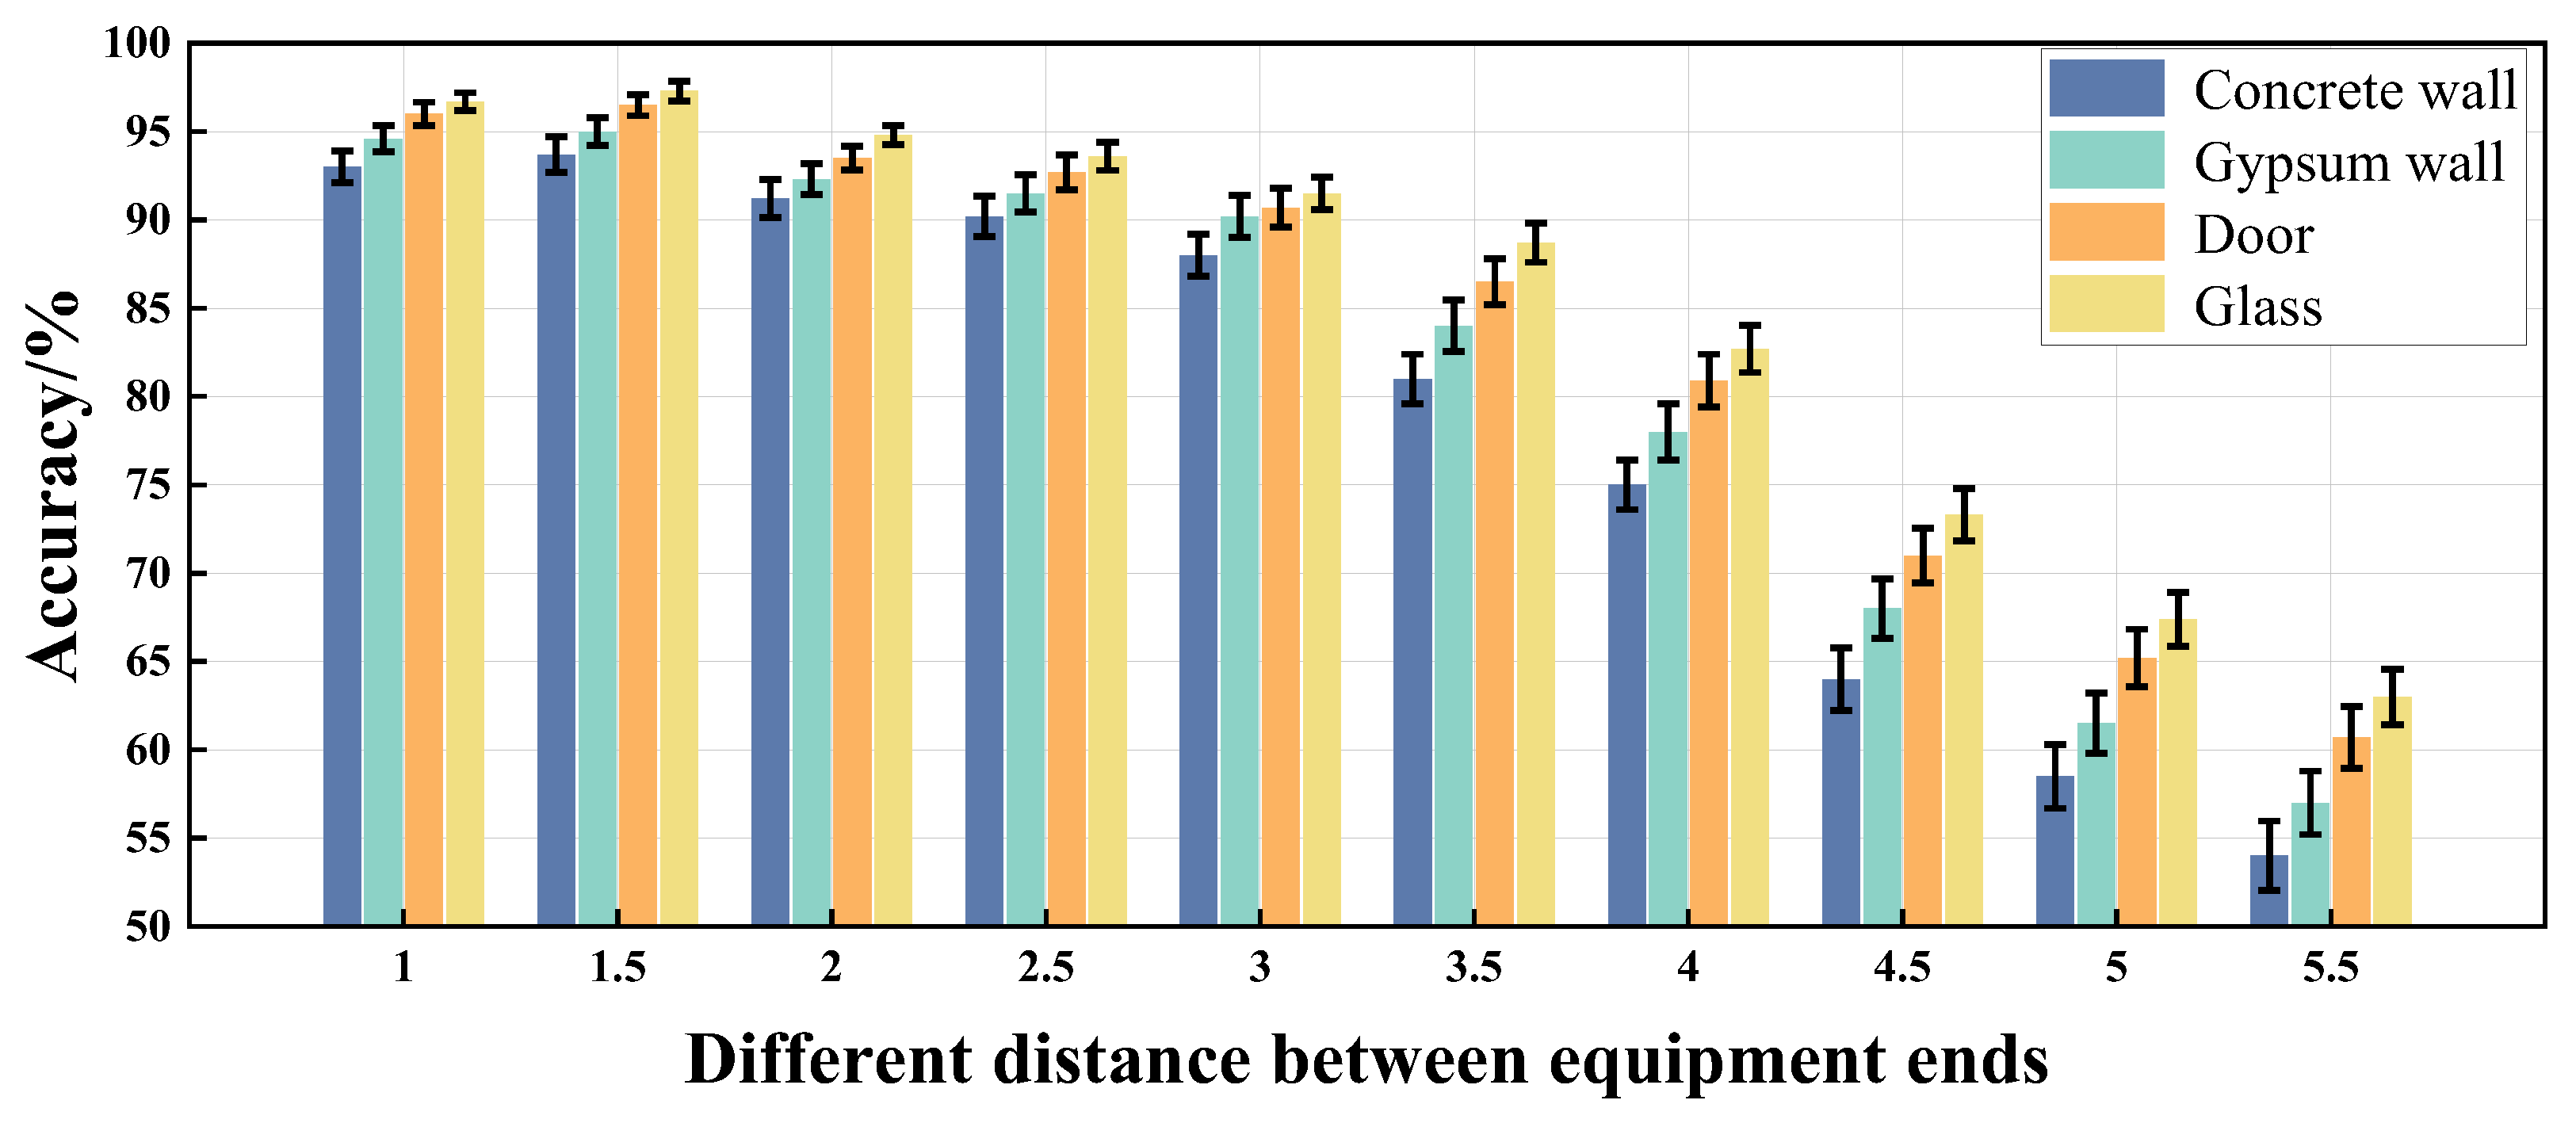
5.2.3. Influence on Different Distances of Equipment

In order to verify that the device spacing can have an impact on the final experimental results, we set the distance between the transmitter and receiver between 1 m and 5.5 m, with an interval of 0.5 m for each distance, and verified it by using walls of different materials. The experimental results are shown in Figure 12. In the concrete wall experimental scenario, when the device spacing was about 1.5, the highest recognition accuracy reached 94.7%; when the device spacing was about 2.5 m, the action recognition rate dropped to 83.3%. When the device spacing was 5.5 m, the accuracy was the lowest, reaching 54%. Similarly, in the two experimental scenarios of plaster wall and door, the recognition accuracy was highest when the device spacing was 1.5 m, both at 95% and above. In the glass wall experimental scenario, the effect of device spacing on the experimental results was more minor compared to other materials of the wall. Recognition accuracy was the highest. Thus, if we want to obtain the best experimental effect, the equipment spacing should be set at 1.5 m, at which time the router is 1 m away from the wall, which can realize the effect of high-precision human detection. The final results of the experiment showed that the recognition accuracy of human detection through concrete and plaster walls was lower than that of the two materials of glass walls and doors. The main reason is that the signal attenuation of glass walls and doors is smaller than that of walls. With the increase of the equipment spacing, the recognition accuracy decreased, the accuracy of the equipment spacing outside the 5.5 m was less than 50%, and the detection effect became worse and worse. When the equipment spacing was within 3.5 m, the probability of action recognition was maintained at 80% and above, indicating that the system had a better performance. The results also showed that the size of the equipment spacing affected the accuracy of the detection, but a smaller spacing of equipment was not better. The results also showed that the size of the equipment spacing affected the detection accuracy, but a more minor equipment spacing was not better. We need to find the most suitable distance. At this time, the quality of the collected data and the final classification effect was also the best.

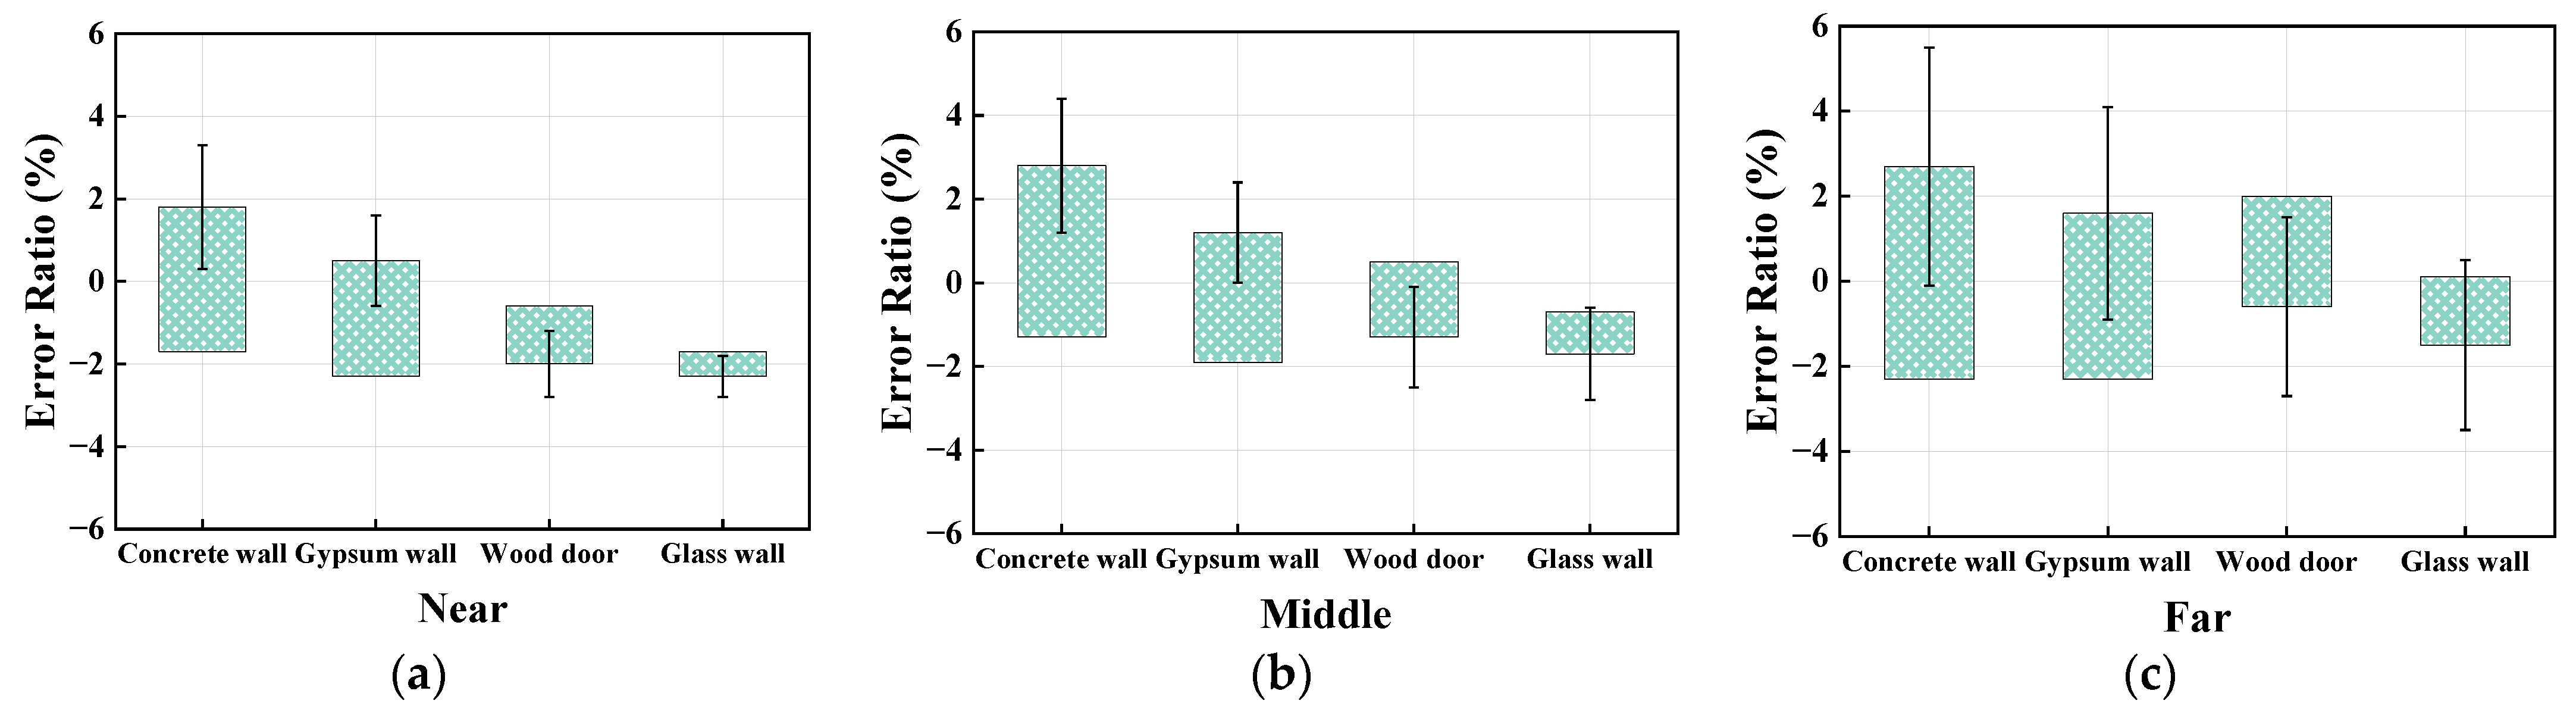
5.2.4. Influence of a Different Position

To verify that the different positions of the personnel had a particular impact on the experimental results, we selected three positions with different distances from the device, as shown in Figure 13: close to the device, in the middle position, and far away from the device. The three positions were separated by 1.5 m and were verified in the walls of four materials: glass, wooden door, gypsum, and concrete. The errors in different personnel positions are shown in Figure 13. Figure 13a shows the error ratio of different wall materials when approaching the equipment. The error ratio of glass walls was lower than that of wooden doors, followed by gypsum walls, and the most significant error was concrete material. When using the same material wall to conduct experiments, it can be seen that the error ratio of the position close to the equipment was smaller than that of the intermediate position and the position far away from the equipment. The final results showed that when the human body was close to the device, the error ratio was the smallest, the recognition accuracy rate was the highest, and the experimental effect was better. When the human body was far away from the device, the error ratio was the largest, the recognition accuracy rate was the lowest, and the experimental effect was worse. To obtain better results, the location of the personnel is crucial and needs to be as close to the equipment as possible.

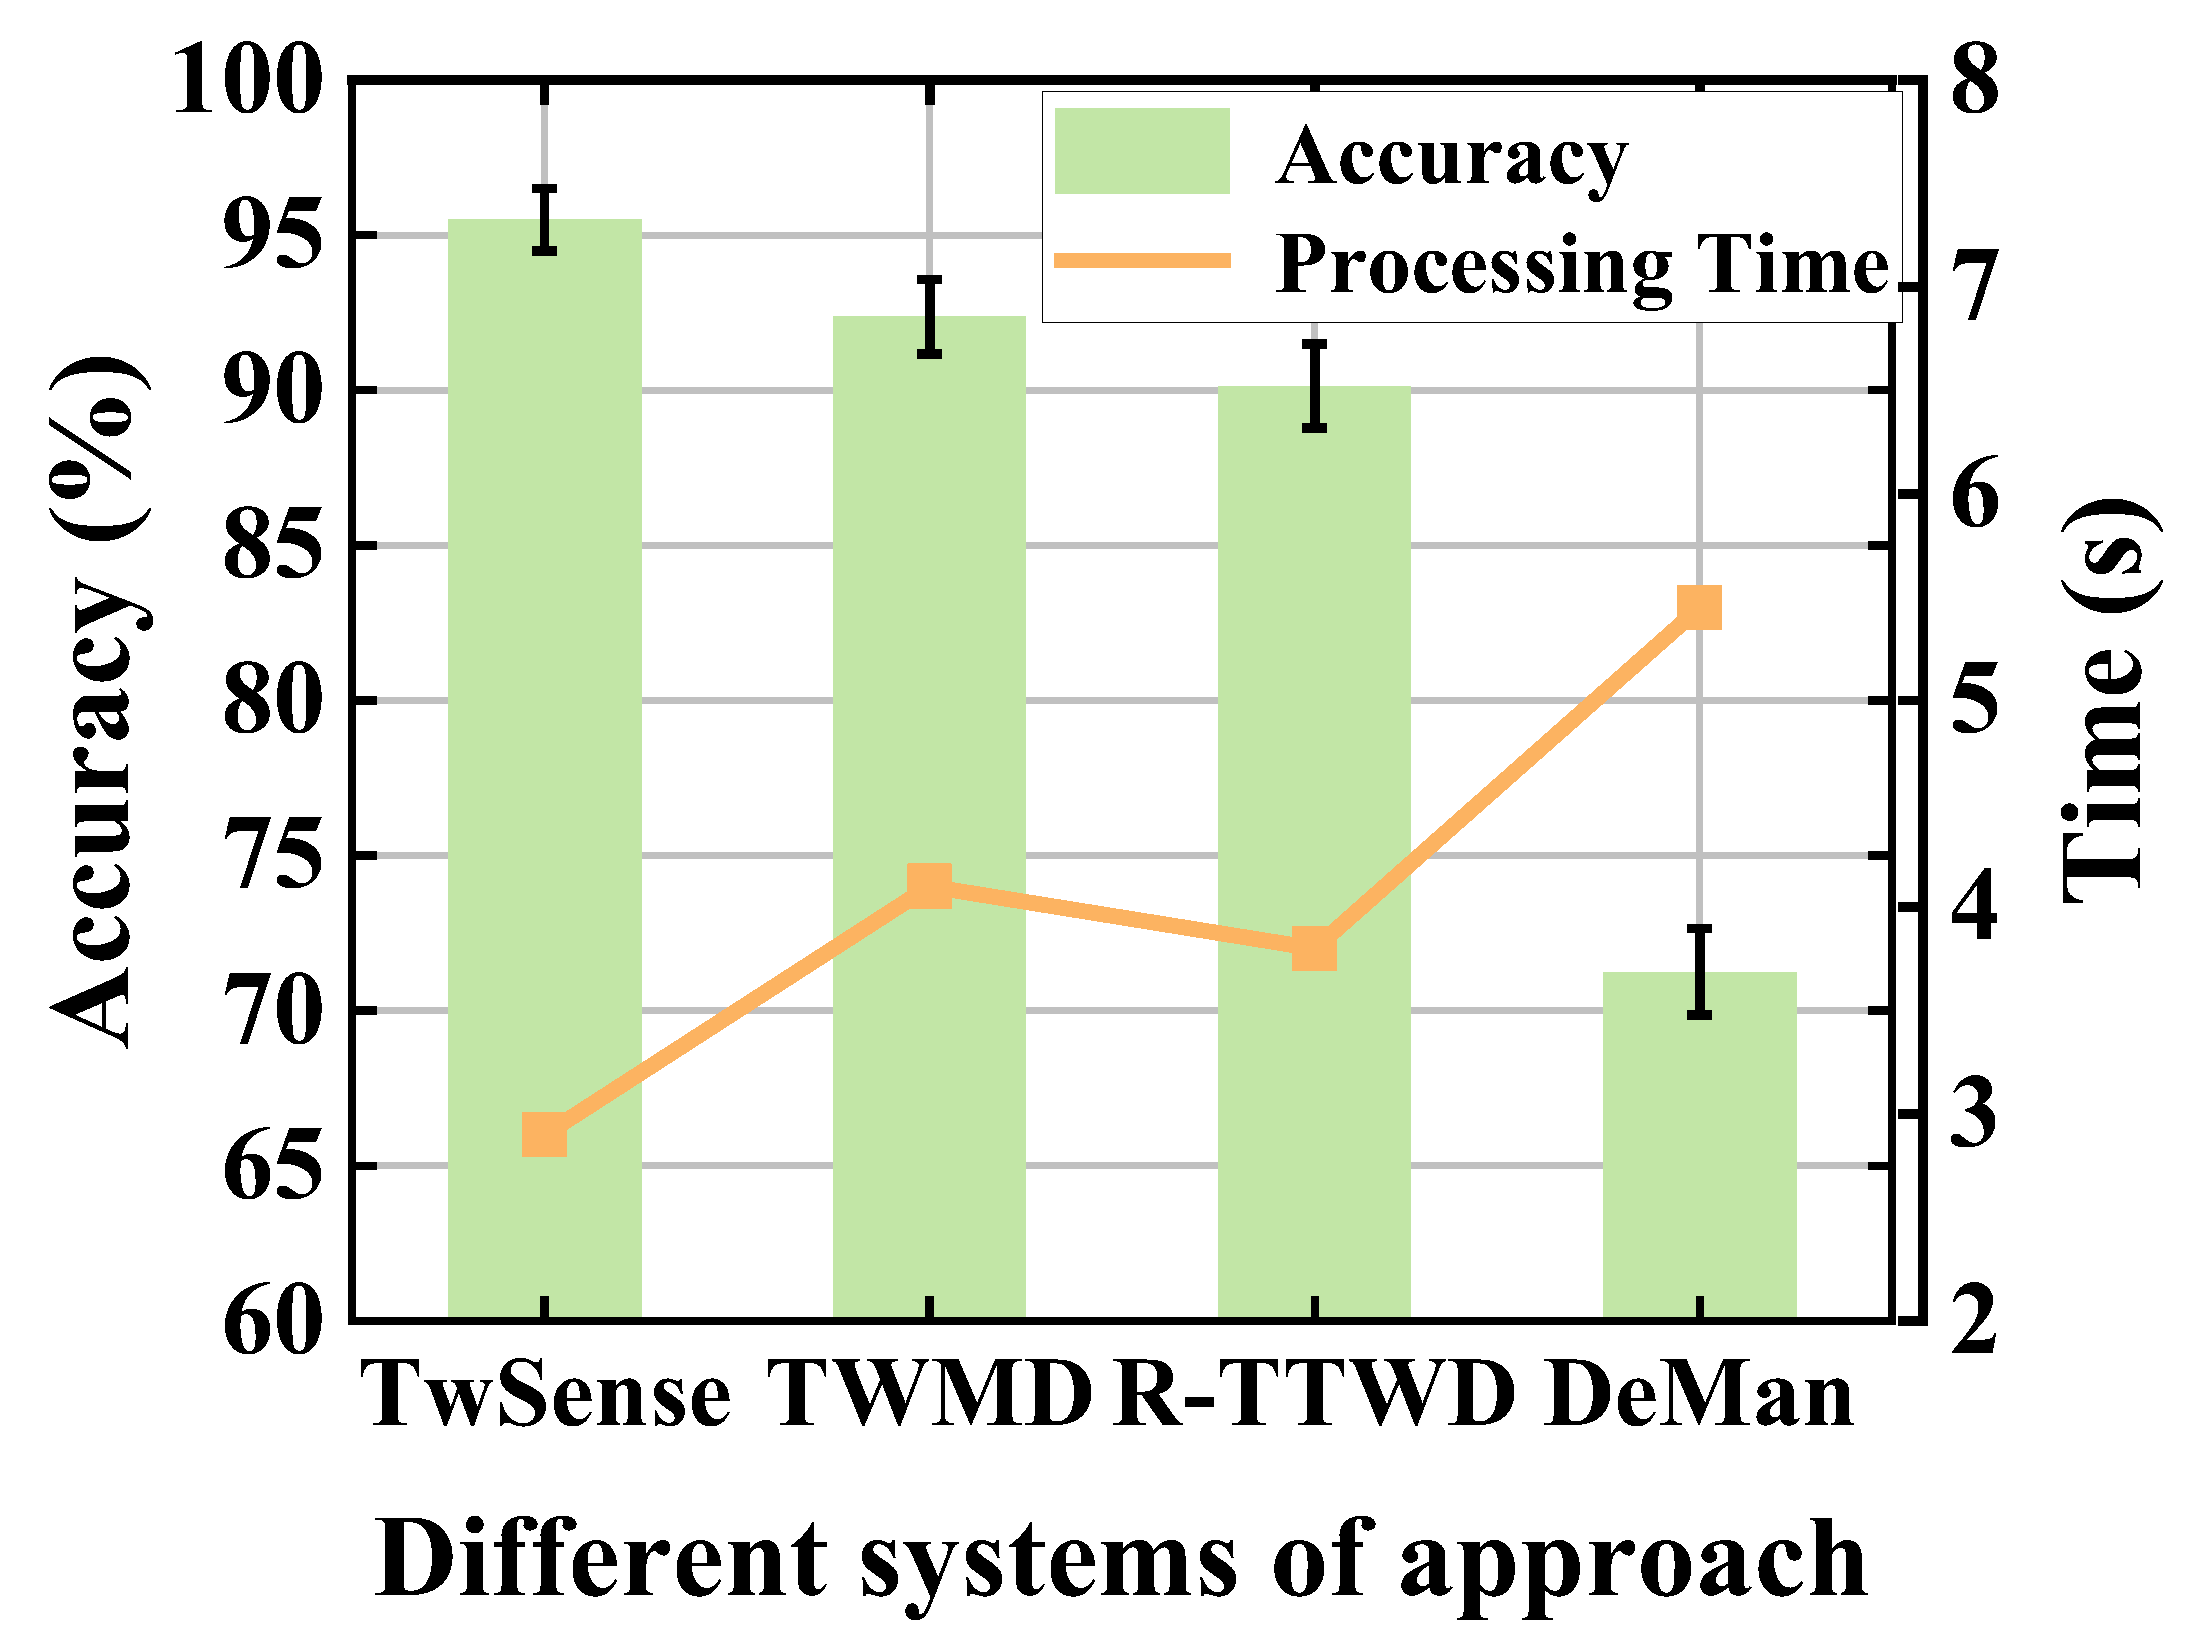
5.3. System Performance Evaluation

In order to prove that the combined algorithm of Kmeans+HOG+G-SVM (KHG) used in this paper was better than the single algorithm for classification and to verify the reliability and high performance of the method proposed in this experiment, we used the ROC curve as an evaluation criterion, thus analyzing the effectiveness of the KHG classification method. The results are shown in Figure 14. With the simultaneous use of Doppler shift, we compared the two classification methods without using the K-means clustering method and only using the G-SVM algorithm. From the comparison results, it can be seen that, when the actual positive rate (TPR) reached 0.8, the KHG method proposed in this paper had a false positive rate (FPR) of 0.1, which was the best performance, and the FPR of the method without using the K-means clustering method reached 0.4, which was slightly lower than that of KHG. The FPR of only using the G-SVM method reached 0.64, which was the worst performance. From the comparison results, we see that the KHG method in this paper had the best performance, and the method using only the G-SVM method without HOG feature extraction had the worst performance, indicating that the combination algorithm was better than a single algorithm for classification.
To evaluate the classification performance of the TwSense system, this paper was compared with the typical detection systems DeMan [23], R-TTWD [24], and TWMD [25], three methods related to human detection under the use of four wall materials conditions. The classification method we used was the combined algorithm (HKG) of HOG+K-means+G-SVM, and then the ROC curve was used as the evaluation standard to analyze the effect of the KHG classification method. The results are shown in Table 3.
Table 3 shows the experimental results of the average recognition accuracy of human detection using the four methods. It can be seen from the table that in the glass wall experiment scene, our system used glass material and had a simple structure. Thus, the attenuation of the Wi-Fi signal after passing through the glass was small, and the classification accuracy was the highest. Compared with the glass wall, the thickness of the door had been improved, the structure was slightly complicated, and the classification effect was slightly worse. The structure of the gypsum wall and concrete wall was more complex, resulting in excellent attenuation of the signal, and the classification accuracy was the lowest but still more than 90%. However, DeMan’s detection effect in several wall-penetrating scenes was not ideal, and its accuracy was about 50%. R-TTWD had relatively better detection accuracy for presence or absence (no one is one category; other categories are considered one category), with an accuracy of about 93%; the TWMD system performed human counting work by detecting human bodies, and the recognition accuracy was around 94%. The comparison results showed that the TwSense system improved detection accuracy based on previous work and effectively improved the accuracy of the system.
In order to verify the processing efficiency of these several systems using the methods, we compared the running time of several systems, as shown in Figure 15, from which it can be seen that the average recognition accuracy using the TwSense method was 95.5% and took 2.8 s; the average recognition accuracy using the TWMD method was 92.4% and took 4.2 s; the average recognition accuracy using the R-TTWD method was 90% in 3.7 s; the average recognition accuracy using the TW-See method was 71.2% in 5.6 s. In terms of processing time and accuracy, TwSense had a significantly lower processing time than the other systems, a higher recognition accuracy than the other systems, and the highest processing efficiency.

6. Conclusions

This paper proposed a highly robust detection method for people through-the-wall based on ubiquitous commercial Wi-Fi devices. First, commercial wireless equipment was used to collect the CSI signal of human motion, and then the OR-PCA algorithm was mainly used to extract the correlation of the collected CSI signal. The Doppler frequency shift image caused by the action was segmented by the K-means clustering method. Then, the HOG algorithm was used to send the acquired Doppler frequency shift image features to the improved algorithm G-SVM classifier to classify the human activity state, which not only reduced the number of training samples but also improved the accuracy of G-SVM classification. This paper evaluated and verified the robustness of the proposed system by analyzing the effects of different environments, different people, different distances, and the use of different wall materials. The experimental results showed that the proposed scheme had high robustness. In future work, since most walls in life are made of concrete, in order to improve the accuracy of through-the-wall detection at this time, TwSense will explore the use of the Fresnel zone model in combination with the through-the-wall condition to establish a theoretical model of through-the-wall detection between human activity and wireless signals. Since the final effect of the difference between the stationary and unoccupied state of the person is small, it is necessary to further study the original basis of the through-the-wall condition to accurately detect the human body breathing to achieve a practical distinction between the stationary and unoccupied state of the person, which will provide more ideas for the actual through-the-wall application. For non-technical users, we suggest that the through-wall human body detection application of a simple and easy-to-understand user interface, for example, the elderly in the toilet. When detecting the presence of people show red, no one presence shows green; in the case of not violating personal privacy, it can be more obvious to show the state of the personnel.

Author Contributions

Z.Z. and Z.H. conceived and designed the experiments; Z.Z. and K.H. performed the experiments; Z.Z. analyzed the data and wrote the paper; X.D. and K.H. helped write the introduction and related work; Z.H. critically revised the paper; K.H. revised the equations and critically revised the paper. All authors have read and agreed to the published version of the manuscript.

Funding

This work was supported by the National Natural Science Foundation of China (Grant 62262061, Grant 62162056), the Key Science and Technology Support Program of Gansu Province (Grant 20YF8GA048), the 2019 Chinese Academy of Sciences “Light of the West” Talent Program, Science and Technology Innovation Project of Gansu Province (Grant CX2JA037, 17CX2JA039), the 2019 Lanzhou City Science and Technology Plan Project (2019-4-44), the 2020 Lanzhou City Talent Innovation and Entrepreneurship Project (2020-RC-116), and the Gansu Provincial Department of Education: Industry Support Program Project (2022CYZC-12).

Institutional Review Board Statement

The study does not require ethical approval.

Informed Consent Statement

Written informed consent was obtained from the experimentalists for this paper.

Data Availability Statement

The study did not report any data.

Conflicts of Interest

The authors declare no conflict of interest.

References

  1. Zhang, R.; Ning, L.; Li, M. Feature extraction of trajectories for mobility modeling in 5G NB-IoT networks. Wirel. Netw. 2021. [Google Scholar] [CrossRef]
  2. Nirmal, I.; Khamis, A.; Hassan, M. Deep Learning for Radio-based Human Sensing: Recent Advances and Future Directions. IEEE Commun. Surv. Tutor. 2021, 99, 1. [Google Scholar] [CrossRef]
  3. Liu, H.; Liu, Y.; Chen, Y. A Survey on CSI-Based Human Behavior Recognition in Through-the-Wall Scenario. IEEE Access 2019, 7, 78772–78793. [Google Scholar]
  4. Wang, J.; Jiang, H.; Xiong, J. LiFS: Low Human-Effort, Device-Free Localization with Fine-Grained Subcarrier Information. In Proceedings of the 22nd Annual International Conference on Mobile Computing and Networking, New York, NY, USA, 3–7 October 2016; pp. 243–256. [Google Scholar]
  5. Xu, W.; Mi, Z.; Sawchuk, A.A. Robust Human Activity and Sensor Location Corecognition via Sparse Signal Representation IEEE Trans. Biomed. Eng. 2012, 59, 3169–3176. [Google Scholar]
  6. Fortin-Simard, D.; Bilodeau, J.S.; Bouchard, K. Exploiting Passive RFID Technology for Activity Recognition in Smart Homes. IEEE Intell. Syst. 2015, 30, 7–15. [Google Scholar] [CrossRef]
  7. Zhou, R.; Lu, X.; Fu, Y. Device-free crowd counting with WiFi channel state information and deep neural networks. Wirel. Netw. 2020, 26, 3495–3506. [Google Scholar]
  8. Wu, X.; Chu, Z.; Yang, P. TW-See: Human Activity Recognition through the Wall with Commodity Wi-Fi Devices. IEEE Trans. Veh. Technol. 2018, 68, 306–319. [Google Scholar]
  9. Ding, Y.P.; Gao, S.; Guo, X. Target Location Algorithm of Continuous Wave through Wall Radar Based on Extended Bezier Fitting Model. J. Signal Process. 2022, 38, 720–728. [Google Scholar]
  10. Dong, X.; Ren, W.; Xue, Z. A Time-Frequency Associated MUSIC Algorithm Research on Human Target Detection by Through-Wall Radar. J. Beijing Inst. Technol. Engl. Ed. 2022, 31, 123–130. [Google Scholar]
  11. Rohman, B.; Andra, M.B.; Nishimoto, M. Through-the-Wall Human Respiration Detection Using UWB Impulse Radar on Hovering Drone. IEEE J. Sel. Top. Appl. Earth Obs. Remote Sens. 2021, 14, 6572–6584. [Google Scholar] [CrossRef]
  12. Gong, Z.Y.; Lu, X.; Liu, Y.X. Device-Free Through-the-Wall Activity Recognition Using Bi-Directional Long Short-Term Memory and WiFi Channel State Information. J. Electron. Technol. 2021, 19, 357–368. [Google Scholar]
  13. Guo, Z.; Xiao, F.; Sheng, B.; Sun, L.; Yu, S. TWCC: A Robust Through-the-Wall Crowd Counting System Using Ambient WiFi Signals. IEEE Trans. 2022, 71, 4198–4211. [Google Scholar] [CrossRef]
  14. Yuan, Z.; Wu, S.; Yang, X.; Ailin, H. Device-Free Stationary Human Detection with WiFi in Through-the-Wall Scenarios; Springer: Berlin/Heidelberg, Germany, 2019; Volume 1, pp. 201–208. [Google Scholar]
  15. Wang, J.; Tian, Z.; Yang, X. TWPalo: Through-the-wall passive localization of moving human with Wi-Fi. Comput. Commun. 2020, 157, 284–297. [Google Scholar] [CrossRef]
  16. He, Y.; Chen, Y.; Hu, Y. WiFi Vision: Sensing, Recognition, and Detection with Commodity MIMO-OFDM WiFi. IEEE Internet Things J. 2020, 7, 8296–8317. [Google Scholar] [CrossRef]
  17. Rappaport, T.S. Wireless Communications: Principles and Practice; Prentice Hall PTR: Hoboken, NJ, USA, 1996. [Google Scholar]
  18. Chandrasekaran, V.; Sanghavi, S.; Parrilo, P.A. Sparse and Low-Rank Matrix Decompositions Communication, Control, and Computing, Allerton 2009. In Proceedings of the 47th Annual Allerton Conference on Communication, Control, and Computing, Monticello, IL, USA, 30 September–2 October 2009. [Google Scholar]
  19. Zheng, Y.; Zhang, Y.; Qian, K. Zero-Effort Cross-Domain Gesture Recognition with Wi-Fi. In Proceedings of the 17th Annual International Conference, Seoul, Republic of Korea, 17–21 June 2019. [Google Scholar]
  20. Wang, Y.; Lei, Y.; Zhang, Y. A robust indoor localization method with calibration strategy based on joint distribution adaptation. Wirel. Netw. 2021, 27, 1739–1753. [Google Scholar] [CrossRef]
  21. Liu, W.; Huang, Q.; Wei, M. Image Quality Evaluation Based on SVM and Improved Grid Search Algorithm. In Proceedings of the 2020 IEEE 15th International Conference on Advanced Trends in Radioelectronics, Telecommunications and Computer Engineering (TCSET), Lviv-Slavske, Ukraine, 25–29 February 2020; IEEE: New York, NY, USA, 2020. [Google Scholar]
  22. Halperirr, D.; Hu, W.; Sheth, A. Tool release: Gathering 802.11n traces with channel state information. ACM SIGCOMM Comput. Commun. Rev. 2011, 41, 53. [Google Scholar] [CrossRef]
  23. Wu, C.; Yang, Z.; Zhou, Z.; Liu, X.; Liu, Y.; Cao, J. Non-Invasive Detection of Moving and Stationary Human With WiFi. IEEE J. Sel. Areas Commun. 2015, 33, 2329–2342. [Google Scholar] [CrossRef]
  24. Zhu, H.; Xiao, F.; Sun, L.; Wang, R.; Yang, P. R-TTWD: Robust Device-Free Through-The-Wall Detection of Moving Human With WiFi. IEEE J. Sel. Areas Commun. 2017, 35, 1090–1103. [Google Scholar] [CrossRef]
  25. Yang, X.; Wu, S.; Zhou, M. Indoor through-the-Wall Passive Human Target Detection with WiFi. In Proceedings of the 2019 IEEE Globecom Workshops (GC Wkshps), Waikoloa, HI, USA, 9–13 December 2019; IEEE: New York, NY, USA, 2020. [Google Scholar]
Figure 1. Indoor passive mode human detection.
Applsci 13 09668 g001
Figure 2. Wi-Fi through-the-wall principle.
Applsci 13 09668 g002
Figure 3. CSI signal and Doppler shift: (a) Antenna selection; (b) Spectrogram of Doppler.
Applsci 13 09668 g003
Figure 4. The system architecture of TwSense.
Applsci 13 09668 g004
Figure 5. Through-the-wall Wi-Fi signal conversion to Doppler shift map: (a) Raw CSI; (b) Optimal subcarriers extracted by OR-PCA; (c) Doppler shift map.
Applsci 13 09668 g005
Figure 6. HOG feature maps extracted from different actions: (a) Walk; (b) Get up; (c) Stoop; (d) Sit down.
Applsci 13 09668 g006
Figure 7. Diagram of searching hyperplane for classification on MATLAB tool.
Applsci 13 09668 g007
Figure 8. Experimental equipment: (a) Receiver device; (b) Transmitter device.
Applsci 13 09668 g008
Figure 9. Experimental scenes of walls with different materials: (a) Concrete wall; (b) Glass and wooden door material; (c) Gypsum wall material.
Applsci 13 09668 g009
Figure 10. The influence of different materials of different people: (a) Recognition effect of different users; (b) Recognition effect of each person under different wall materials.
Applsci 13 09668 g010
Figure 11. Cumulative distribution functions of various materials with different thicknesses: (a) CDF of the concrete wall; (b) CDF of the gypsum wall; (c) CDF of the glass wall.
Applsci 13 09668 g011
Figure 12. The experimental effect of different equipment spacing.
Applsci 13 09668 g012
Figure 13. The experimental results of the different locations of the personnel: (a) Error ratios at near positions from the device; (b) Error ratios at middle positions from the device; (c) Error ratios at far positions from the device.
Applsci 13 09668 g013
Figure 14. Comparison of ROC curves of different classification algorithms.
Applsci 13 09668 g014
Figure 15. Recognition accuracy and response time of different systems.
Applsci 13 09668 g015
Table 1. RF attenuation of different materials at 5 GHZ.
Building Materials5 GHz
Glass wall 1.18 inches3 dB
Wooden Door 1.75 inches6 dB
Gypsum wall 11 inches13 dB
Concrete wall 15 inches15 dB
Table 2. Experimental results of different wall materials.
Experimental SceneWall MaterialsAccuracy (%)
bedroomConcrete wall93.6
meeting roomGypsum wall94.8
meeting roomDoor96.5
hallGlass wall97.3
Table 3. Comparison of different classification systems for different materials.
Experimental SceneSystemMethodDifferent Material Recognition Accuracy (%)
Concrete WallGypsum WallWooden
Door
Glass
Wall
bedroom,
meeting room,
hall
TwSenseOR-PCA+HOG+Doppler+G-Svm93.694.896.597.3
TWMDBP Network90919395.5
R-TTWDPCA+SVM878991.593
DeManSine model+Parameter estimation50717985
Disclaimer/Publisher’s Note: The statements, opinions and data contained in all publications are solely those of the individual author(s) and contributor(s) and not of MDPI and/or the editor(s). MDPI and/or the editor(s) disclaim responsibility for any injury to people or property resulting from any ideas, methods, instructions or products referred to in the content.

