

Convolutional Neural Network and Language Model-Based Sequential CT Image Captioning for Intracerebral Hemorrhage

Abstract
:1. Introduction
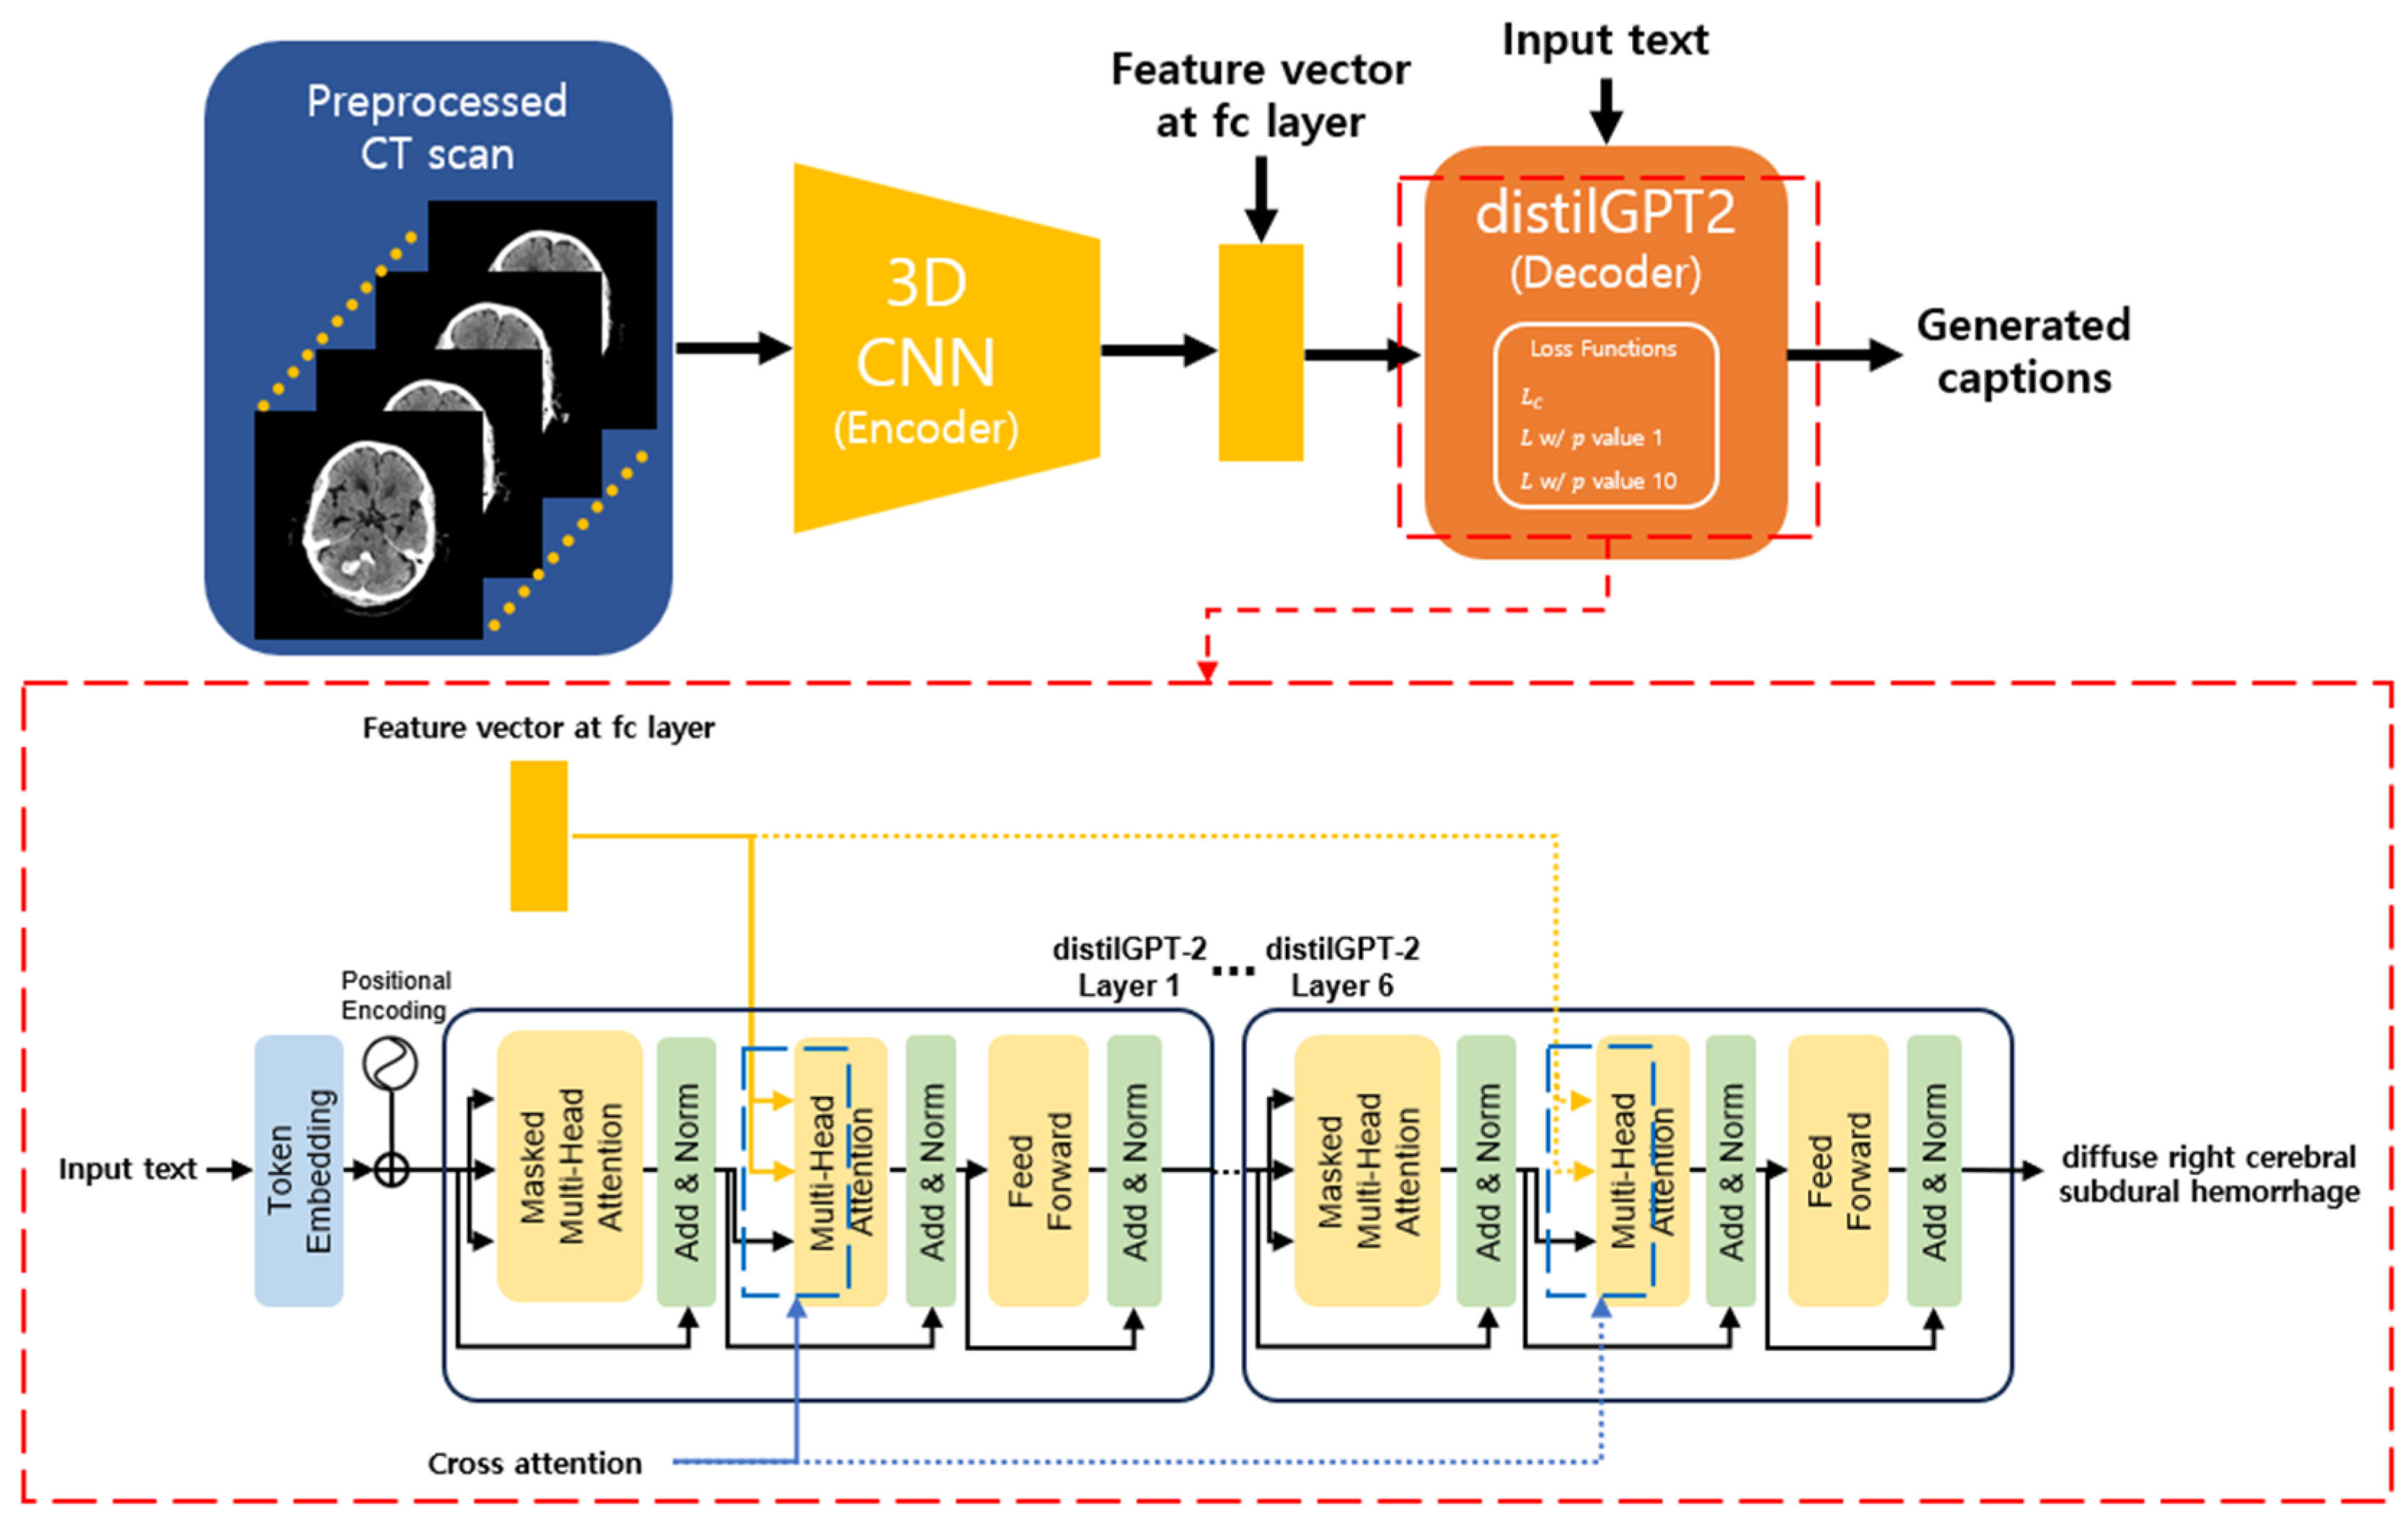
2. Methodology
2.1. Encoder
2.2. Decoder
2.3. Penalty Applied Loss Function
2.4. Text Generation Strategy
3. Experiment Results
3.1. Experimental Setup
3.2. Dataset
3.2.1. Image Caption
3.2.2. CT Scan
3.3. Evaluation Metric
3.4. Experiment Result with All Test Data
3.5. Experiment Result with the Test Data Consisted of ICH CT Scan
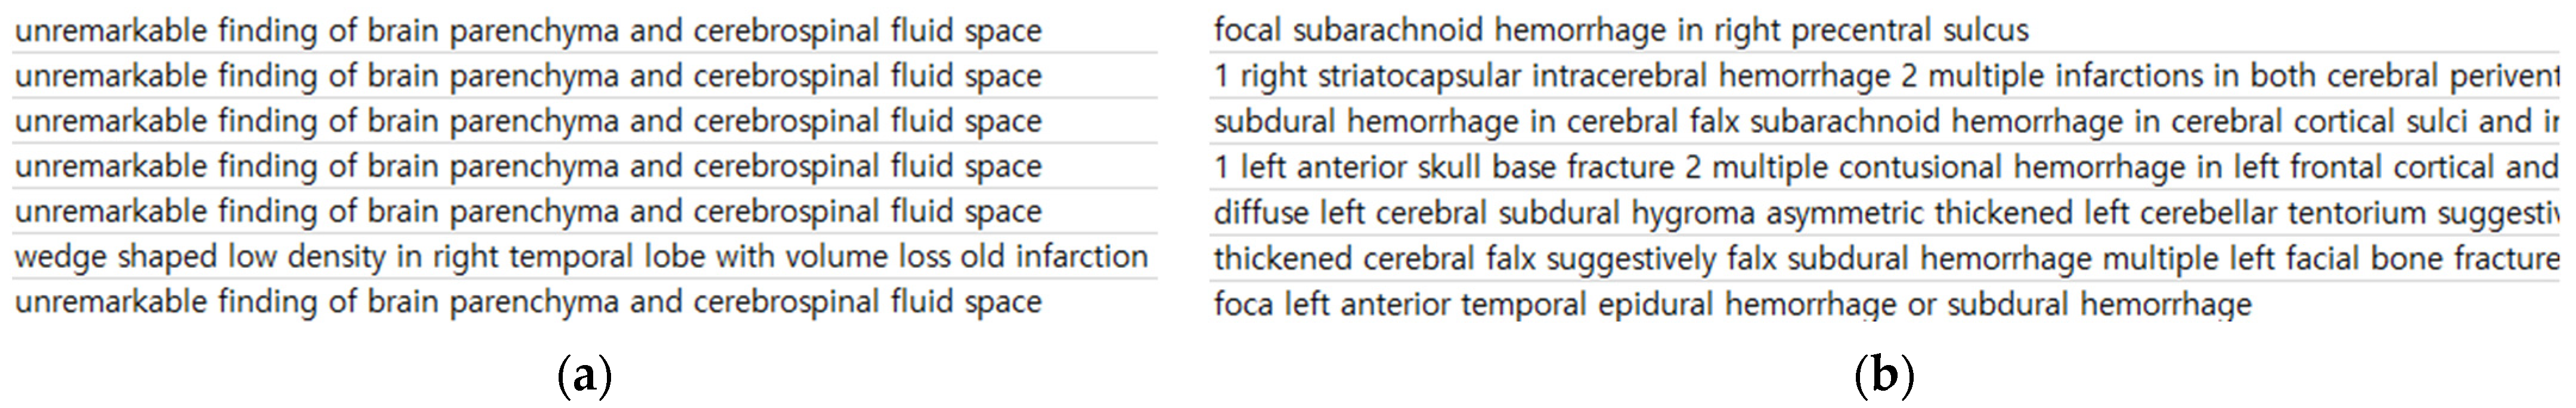
3.6. Examples of Generated Text
4. Conclusions
Author Contributions
Funding
Institutional Review Board Statement
Informed Consent Statement
Data Availability Statement
Conflicts of Interest
References
- Cordonnier, C.; Demchuk, A.; Ziai, W.; Anderson, C.S. Intracerebral haemorrhage: Current approaches to acute management. Lancet 2018, 392, 1257–1268. [Google Scholar] [CrossRef] [PubMed]
- Krishnamurthi, R.V.; Feigin, V.L.; Forouzanfar, M.H.; Mensah, G.A.; Connor, M.; Bennett, D.A.; Moran, A.E.; Sacco, R.L.; Anderson, L.M.; Truelsen, T.; et al. Global and regional burden of first-ever ischaemic and haemorrhagic stroke during 1990–2010: Findings from the Global Burden of Disease Study 2010. Lancet Glob. Health 2013, 1, e259–e281. [Google Scholar] [CrossRef] [PubMed]
- Mohammed, B.A.; Senan, E.M.; Al-Mekhlafi, Z.G.; Rassem, T.H.; Makbol, N.M.; Alanazi, A.A.; Almurayziq, T.S.; Ghaleb, F.A.; Sallam, A.A. Multi-Method Diagnosis of CT Images for Rapid Detection of Intracranial Hemorrhages Based on Deep and Hybrid Learning. Electronics 2022, 11, 2460. [Google Scholar] [CrossRef]
- Bako, A.T.; Pan, A.; Potter, T.; Tannous, J.; Johnson, C.; Baig, E.; Meeks, J.; Woo, D.; Vahidy, F.S. Contemporary trends in the nationwide incidence of primary intracerebral hemorrhage. Stroke 2022, 53, e70–e74. [Google Scholar] [CrossRef]
- Rindler, R.S.; Allen, J.W.; Barrow, J.W.; Pradilla, G.; Barrow, D.L. Neuroimaging of Intracerebral Hemorrhage. Neurosurgery 2020, 86, E414–E423. [Google Scholar] [CrossRef] [PubMed]
- London, T.R.C.O.R. Clinical Radiology UK Workforce Census 2020 Report. Available online: https://www.rcr.ac.uk/system/files/publication/field_publication_files/clinical-radiology-uk-workforce-census-2020-report.pdf (accessed on 21 July 2023).
- Ionescu, B.; Müller, H.; Péteri, R.; Rückert, J.; Abacha, A.B.; de Herrera, A.G.S.; Friedrich, C.M.; Bloch, L.; Brüngel, R.; Idrissi-Yaghir, A.; et al. Overview of the ImageCLEF 2022: Multimedia Retrieval in Medical, Social Media and Nature Applications. In International Conference of the Cross-Language Evaluation Forum for European Languages; Springer International Publishing: Cham, Switzerland, 2022; pp. 541–564. [Google Scholar]
- Hajihosseini, M.; Lotfollahi, Y.; Nobakhtian, M.; Javid, M.M.; Omidi, F.; Eetemadi, S. IUST_NLPLAB at ImageCLEFmedical Caption Tasks. In Proceedings of the Conference and Labs of the Evaluation Forum, Bologna, Italy, 5–8 September 2022. [Google Scholar]
- Lebrat, L.; Nicolson, A.; Santa Cruz, R.; Belous, G.; Koopman, B.; Dowling, J. CSIRO at ImageCLEFmedical Caption 2022. In Proceedings of the CLEF 2022: Conference and Labs of the Evaluation Forum, Bologna, Italy, 5–8 September 2022; Volume 3180, pp. 1455–1473. [Google Scholar]
- Demner-Fushman, D.; Kohli, M.D.; Rosenman, M.B.; Shooshan, S.E.; Rodriguez, L.; Antani, S.; Thoma, G.R.; McDonald, C.J. Preparing a collection of radiology examinations for distribution and retrieval. J. Am. Med. Inform. Assoc. 2016, 23, 304–310. [Google Scholar] [CrossRef] [PubMed]
- Johnson, A.E.; Pollard, T.J.; Berkowitz, S.J.; Greenbaum, N.R.; Lungren, M.P.; Deng, C.-Y.; Mark, R.G.; Horng, S. MIMIC-CXR, a de-identified publicly available database of chest radiographs with free-text reports. Sci. Data 2019, 6, 317. [Google Scholar] [CrossRef] [PubMed]
- Selivanov, A.; Rogov, O.Y.; Chesakov, D.; Shelmanov, A.; Fedulova, I.; Dylov, D.V. Medical image captioning via generative pretrained transformers. Sci. Rep. 2023, 13, 4171. [Google Scholar] [CrossRef]
- Yang, S.; Ji, J.; Zhang, X.; Liu, Y.; Wang, Z. Weakly Guided Hierarchical Encoder-Decoder Network for Brain CT Report Generation. In Proceedings of the 2021 IEEE International Conference on Bioinformatics and Biomedicine (BIBM), Houston, TX, USA, 9–12 December 2021; pp. 568–573. [Google Scholar]
- Caceres, J.A.; Goldstein, J.N. Intracranial Hemorrhage. Emerg. Med. Clin. N. Am. 2012, 30, 771–794. [Google Scholar] [CrossRef] [PubMed]
- Freeman, W.D.; Aguilar, M.I. Intracranial hemorrhage: Diagnosis and management. Neurol. Clin. 2012, 30, 211–240. [Google Scholar] [CrossRef]
- Perez del Barrio, A.; Esteve Domínguez, A.S.; Menéndez Fernández-Miranda, P.; Sanz Bellón, P.; Rodríguez González, D.; Lloret Iglesias, L.; Marques Fraguela, E.; González Mandly, A.A.; Vega, J.A. A deep learning model for prognosis prediction after intracranial hemorrhage. J. Neuroimaging 2023, 33, 218–226. [Google Scholar] [CrossRef]
- Neethi, A.S.; Niyas, S.; Kannath, S.K.; Mathew, J.; Anzar, A.M.; Rajan, J. Stroke classification from computed tomography scans using 3D convolutional neural network. Biomed. Signal Process. Control 2022, 76, 103720. [Google Scholar] [CrossRef]
- Henderson, E.G.A.; Vasquez Osorio, E.M.; van Herk, M.; Green, A.F. Optimising a 3D convolutional neural network for head and neck computed tomography segmentation with limited training data. Phys. Imaging Radiat. Oncol. 2022, 22, 44–50. [Google Scholar] [CrossRef] [PubMed]
- Rani, S.; Kumar, S.; Ghai, D.; Prasad, K. Automatic Detection of Brain Tumor from CT and MRI Images using Wireframe model and 3D Alex-Net. In Proceedings of the 2022 International Conference on Decision Aid Sciences and Applications (DASA), Chiangrai, Thailand, 23–25 March 2022; pp. 1132–1138. [Google Scholar]
- He, K.; Zhang, X.; Ren, S.; Sun, J. Deep residual learning for image recognition. In Proceedings of the IEEE Conference on Computer Vision and Pattern Recognition, Las Vegas, NV, USA, 26 June 2016–1 July 2016; pp. 770–778. [Google Scholar]
- Tan, M.; Le, Q. Efficientnet: Rethinking model scaling for convolutional neural networks. In Proceedings of the International Conference on Machine Learning, Long Beach, CA, USA, 9–15 June 2019; pp. 6105–6114. [Google Scholar]
- Huang, G.; Liu, Z.; Van Der Maaten, L.; Weinberger, K.Q. Densely connected convolutional networks. In Proceedings of the IEEE Conference on Computer Vision and Pattern Recognition, Honolulu, HI, USA, 21–26 July 2017; pp. 4700–4708. [Google Scholar]
- Liu, Z.; Mao, H.; Wu, C.-Y.; Feichtenhofer, C.; Darrell, T.; Xie, S. A convnet for the 2020s. In Proceedings of the IEEE/CVF Conference on Computer Vision and Pattern Recognition, New Orleans, LA, USA, 18–24 June 2022; pp. 11976–11986. [Google Scholar]
- Olivastri, S.; Singh, G.; Cuzzolin, F. End-to-end video captioning. In Proceedings of the IEEE/CVF International Conference on Computer Vision Workshops, Long Beach, CA, USA, 16–17 June 2019. [Google Scholar]
- Solovyev, R.; Kalinin, A.A.; Gabruseva, T. 3D convolutional neural networks for stalled brain capillary detection. Comput. Biol. Med. 2022, 141, 105089. [Google Scholar] [CrossRef] [PubMed]
- Li, Z.; Wallace, E.; Shen, S.; Lin, K.; Keutzer, K.; Klein, D.; Gonzalez, J. Train Big, Then Compress: Rethinking Model Size for Efficient Training and Inference of Transformers. In Proceedings of the 37th International Conference on Machine Learning, Virtual, 13–18 July 2020; pp. 5958–5968. [Google Scholar]
- Mars, M. From Word Embeddings to Pre-Trained Language Models: A State-of-the-Art Walkthrough. Appl. Sci. 2022, 12, 8805. [Google Scholar] [CrossRef]
- Sharma, S.; Asri, L.E.; Schulz, H.; Zumer, J. Relevance of unsupervised metrics in task-oriented dialogue for evaluating natural language generation. arXiv 2017, arXiv:1706.09799. [Google Scholar]
- Papineni, K.; Roukos, S.; Ward, T.; Zhu, W.-J. Bleu: A method for automatic evaluation of machine translation. In Proceedings of the 40th Annual Meeting of the Association for Computational Linguistics, Stroudsburg, PA, USA, 7–12 July 2002; pp. 311–318. [Google Scholar]
- Banerjee, S.; Lavie, A. METEOR: An automatic metric for MT evaluation with improved correlation with human judgments. In Proceedings of the ACL Workshop On intrinsic and Extrinsic Evaluation Measures for Machine Translation and/or Summarization, Ann Arbor, MI, USA, 29 June 2005; pp. 65–72. [Google Scholar]
- Lin, C.-Y. Rouge: A package for automatic evaluation of summaries. In Text Summarization Branches Out; Association for Computational Linguistics: Barcelona, Spain, 2004; pp. 74–81. [Google Scholar]
- MedicalAI. ClinicalBERT. Available online: https://huggingface.co/medicalai/ClinicalBERT (accessed on 21 July 2023).


| Normal | ICH |
|---|---|
| Unremarkable finding of brain parenchyma and cerebrospinal fluid space | Left frontal subcortical intracerebral hemorrhage with surrounding edema |
| Loss Function | Models | BLEU * | METEOR | ROUGE-L | Cosine Similarity |
|---|---|---|---|---|---|
| ResNet-50 + G | 0.26 | 0.19 | 0.51 | 0.75 | |
| ResNet-50 + B | 0.31 | 0.21 | 0.54 | 0.77 | |
| ResNet-50 + T | 0.08 | 0.06 | 0.13 | 0.58 | |
| EfficientNet-B5 + G | 0.28 | 0.20 | 0.52 | 0.76 | |
| EfficientNet-B5 + B | 0.35 | 0.23 | 0.56 | 0.78 | |
| EfficientNet-B5 + T | 0.09 | 0.08 | 0.17 | 0.62 | |
| DenseNet-201 + G | 0.28 | 0.20 | 0.53 | 0.76 | |
| DenseNet-201 + B | 0.23 | 0.16 | 0.44 | 0.73 | |
| DenseNet-201 + T | 0.07 | 0.06 | 0.12 | 0.57 | |
| ConvNeXt-S + G | 0.26 | 0.19 | 0.51 | 0.75 | |
| ConvNeXt-S + B | 0.25 | 0.19 | 0.51 | 0.75 | |
| ConvNeXt-S + T | 0.06 | 0.05 | 0.12 | 0.57 | |
| w/ value 1 | ResNet-50 + G | 0.29 | 0.19 | 0.51 | 0.76 |
| ResNet-50 + B | 0.33 | 0.22 | 0.54 | 0.77 | |
| ResNet-50 + T | 0.07 | 0.06 | 0.12 | 0.58 | |
| EfficientNet-B5 + G | 0.24 | 0.17 | 0.44 | 0.73 | |
| EfficientNet-B5 + B | 0.21 | 0.15 | 0.34 | 0.68 | |
| EfficientNet-B5 + T | 0.09 | 0.08 | 0.15 | 0.60 | |
| DenseNet-201 + G | 0.27 | 0.20 | 0.52 | 0.76 | |
| DenseNet-201 + B | 0.19 | 0.12 | 0.33 | 0.66 | |
| DenseNet-201 + T | 0.07 | 0.06 | 0.13 | 0.59 | |
| ConvNeXt-S + G | 0.26 | 0.19 | 0.51 | 0.75 | |
| ConvNeXt-S + B | 0.25 | 0.19 | 0.51 | 0.75 | |
| ConvNeXt-S + T | 0.06 | 0.05 | 0.11 | 0.56 | |
| w/ value 10 | ResNet-50 + G | 0.28 | 0.2 | 0.52 | 0.76 |
| ResNet-50 + B | 0.31 | 0.22 | 0.54 | 0.77 | |
| ResNet-50 + T | 0.08 | 0.07 | 0.14 | 0.59 | |
| EfficientNet-B5 + G | 0.27 | 0.17 | 0.45 | 0.73 | |
| EfficientNet-B5 + B | 0.20 | 0.15 | 0.34 | 0.67 | |
| EfficientNet-B5 + T | 0.11 | 0.09 | 0.18 | 0.63 | |
| DenseNet-201 + G | 0.28 | 0.20 | 0.53 | 0.77 | |
| DenseNet-201 + B | 0.24 | 0.16 | 0.44 | 0.75 | |
| DenseNet-201 + T | 0.09 | 0.07 | 0.16 | 0.6 | |
| ConvNeXt-S + G | 0.06 | 0.1 | 0.16 | 0.56 | |
| ConvNeXt-S + B | 0.06 | 0.11 | 0.14 | 0.53 | |
| ConvNeXt-S + T | 0.03 | 0.01 | 0.11 | 0.56 |
| Loss Function | Models | BLEU * | METEOR | ROUGE-L | Cosine Similarity |
|---|---|---|---|---|---|
| ResNet-50 + G | 0.01 | 0.03 | 0.08 | 0.51 | |
| ResNet-50 + B | 0.09 | 0.08 | 0.20 | 0.61 | |
| ResNet-50 + T | 0.04 | 0.05 | 0.09 | 0.59 | |
| EfficientNet-B5 + G | 0.06 | 0.09 | 0.16 | 0.58 | |
| EfficientNet-B5 + B | 0.16 | 0.13 | 0.28 | 0.63 | |
| EfficientNet-B5 + T | 0.09 | 0.10 | 0.17 | 0.63 | |
| DenseNet-201 + G | 0.06 | 0.09 | 0.09 | 0.56 | |
| DenseNet-201 + B | 0.12 | 0.16 | 0.10 | 0.62 | |
| DenseNet-201 + T | 0.08 | 0.10 | 0.07 | 0.60 | |
| ConvNeXt-S + G | 0.01 | 0.02 | 0.06 | 0.53 | |
| ConvNeXt-S + B | 0.01 | 0.02 | 0.06 | 0.53 | |
| ConvNeXt-S + T | 0.03 | 0.03 | 0.07 | 0.55 | |
| value 1 | ResNet-50 + G | 0.15 | 0.05 | 0.11 | 0.58 |
| ResNet-50 + B | 0.14 | 0.10 | 0.22 | 0.62 | |
| ResNet-50 + T | 0.04 | 0.06 | 0.09 | 0.60 | |
| EfficientNet-B5 + G | 0.07 | 0.10 | 0.17 | 0.62 | |
| EfficientNet-B5 + B | 0.17 | 0.17 | 0.30 | 0.68 | |
| EfficientNet-B5 + T | 0.10 | 0.11 | 0.18 | 0.65 | |
| DenseNet-201 + G | 0.04 | 0.08 | 0.13 | 0.54 | |
| DenseNet-201 + B | 0.13 | 0.15 | 0.27 | 0.62 | |
| DenseNet-201 + T | 0.07 | 0.10 | 0.16 | 0.60 | |
| ConvNeXt-S + G | 0.01 | 0.02 | 0.06 | 0.53 | |
| ConvNeXt-S + B | 0.01 | 0.02 | 0.06 | 0.53 | |
| ConvNeXt-S + T | 0.04 | 0.05 | 0.09 | 0.58 | |
| value 10 | ResNet-50 + G | 0.03 | 0.05 | 0.11 | 0.57 |
| ResNet-50 + B | 0.12 | 0.10 | 0.24 | 0.63 | |
| ResNet-50 + T | 0.04 | 0.06 | 0.09 | 0.60 | |
| EfficientNet-B5 + G | 0.07 | 0.08 | 0.16 | 0.61 | |
| EfficientNet-B5 + B | 0.18 | 0.14 | 0.29 | 0.66 | |
| EfficientNet-B5 + T | 0.11 | 0.10 | 0.18 | 0.65 | |
| DenseNet-201 + G | 0.06 | 0.09 | 0.16 | 0.58 | |
| DenseNet-201 + B | 0.15 | 0.14 | 0.28 | 0.63 | |
| DenseNet-201 + T | 0.08 | 0.10 | 0.16 | 0.63 | |
| ConvNeXt-S + G | 0.01 | 0.05 | 0.05 | 0.52 | |
| ConvNeXt-S + B | 0.02 | 0.07 | 0.07 | 0.51 | |
| ConvNeXt-S + T | 0.03 | 0.08 | 0.08 | 0.57 |
| Reference Text | Value 1 | Value 10 | |
|---|---|---|---|
| diffuse left cerebral subdural hemorrhage midline shifting focal lacunar infarction in left internal capsule | diffuse right cerebral subdural hemorrhage | diffuse left cerebral subdural hemorrhage midline shifting subdural hemorrhage along the cerebral subarachnoid hemorrhage in right sylvian cistern | diffuse right cerebral subdural hemorrhage midline shifting multiple old lacunar infarctions in both basal ganglia and right thalamus |
| sdh, right cerebral hemisphere small vessel disease with lacunar infarctions otherwise no demonstrable abnormal finding | sdh in right fronto parietal otherwise no demonstrable abnormal finding | sdh, left fronto temporo parietal otherwise no demonstrable abnormal finding | sdh, right cerebral hemisphere small vessel disease with lacunar infarctions otherwise no demonstrable abnormal finding |
| unremarkable finding of brain parenchyma and cerebrospinal fluid space | unremarkable finding of brain parenchyma and cerebrospinal fluid space | unremarkable finding of brain parenchyma and cerebrospinal fluid space | unremarkable finding of brain parenchyma and cerebrospinal fluid space |
| unremarkable finding of brain parenchyma and cerebrospinal fluid space | unremarkable finding of brain parenchyma and cerebrospinal fluid space | diffuse brain atrophy | diffuse brain atrophy |
Disclaimer/Publisher’s Note: The statements, opinions and data contained in all publications are solely those of the individual author(s) and contributor(s) and not of MDPI and/or the editor(s). MDPI and/or the editor(s) disclaim responsibility for any injury to people or property resulting from any ideas, methods, instructions or products referred to in the content. |
© 2023 by the authors. Licensee MDPI, Basel, Switzerland. This article is an open access article distributed under the terms and conditions of the Creative Commons Attribution (CC BY) license (https://creativecommons.org/licenses/by/4.0/).
Share and Cite
Kim, G.-Y.; Oh, B.-D.; Kim, C.; Kim, Y.-S. Convolutional Neural Network and Language Model-Based Sequential CT Image Captioning for Intracerebral Hemorrhage. Appl. Sci. 2023, 13, 9665. https://doi.org/10.3390/app13179665
Kim G-Y, Oh B-D, Kim C, Kim Y-S. Convolutional Neural Network and Language Model-Based Sequential CT Image Captioning for Intracerebral Hemorrhage. Applied Sciences. 2023; 13(17):9665. https://doi.org/10.3390/app13179665
Chicago/Turabian StyleKim, Gi-Youn, Byoung-Doo Oh, Chulho Kim, and Yu-Seop Kim. 2023. "Convolutional Neural Network and Language Model-Based Sequential CT Image Captioning for Intracerebral Hemorrhage" Applied Sciences 13, no. 17: 9665. https://doi.org/10.3390/app13179665