Article

Shearing Characteristics of Mortar–Rock Binary Medium Interfaces with Different Roughness

1
School of Resources, Environment and Safety Engineering, Hunan University of Science and Technology, Xiangtan 411201, China
2
School of Resources & Safety Engineering, Central South University, Changsha 410083, China
*
Author to whom correspondence should be addressed.
Appl. Sci. 2023, 13(15), 8930; https://doi.org/10.3390/app13158930
Submission received: 6 June 2023 / Revised: 25 June 2023 / Accepted: 31 July 2023 / Published: 3 August 2023
(This article belongs to the Special Issue Advances in Failure Behavior of Rocks)

Abstract

:
This study focuses on the crucial role of the shear characteristics of the mortar–rock interface (MRI) in geotechnical engineering. These properties largely determine the effectiveness of engineering reinforcement measures such as anchoring and grouting. The mechanical and deformation properties of the MRI with different roughness characteristics will be investigated. To achieve this, an indoor direct shear test was conducted on the mortar–rock binary medium (MRBM). The interface was numerically modeled from the test data using finite difference fractional value software. Direct shear simulation of the MRI by changing the normal stress ( σ n ) and the sawtooth angle ( α ) was carried out. The results showed that as the normal stress and sawtooth angle increased, the shear stiffness of the MRI also increased. The shear stiffness was found to have a linear relationship with both the normal stress and the sawtooth angle. The peak shear displacement was identified as an indirect indicator of the shear failure mode of the binary medium interface (BMI). Quantitative relationships between the shear strength (τ), cohesion (c), angle of internal friction (ϕ), residual shear strength ( τ r ), residual angle of internal friction ( ϕ r ), and degradation rate of the shear strength of the BMI were established based on the two influencing factors. Additionally, the study investigates how the sawtooth angle and the normal stress affect the variation in the normal displacement during direct shear testing of the MRBM. The findings revealed a correlation between the peak dilation angle of the BMI and the normal stress and sawtooth angle.

1. Introduction

In nature and geotechnical engineering, it is a common phenomenon that discontinuous medium becomes continuous medium due to cementation between the mediums. This phenomenon is widely found in construction engineering [1,2,3], public safety [4,5,6], mine safety mining [7,8,9,10], and other aspects. This bonding surface makes the discontinuous medium stable by bonding and is also a weak surface of the structure, which is prone to dislocation or fracture failure [11,12], such as grouting and anchoring are important means in reinforcing the surrounding rock in deep roadways [13]. The research on the interface formation of the same material tends to be perfect [14,15,16,17,18,19]. The shear strength and the interface failure area of different materials are very different from those of the same medium on either side [20,21]. The stability of this type of reinforcement system is mainly determined by the stability of the two interfaces of bolt and mortar and mortar and surrounding rock [22,23,24,25,26,27,28,29,30,31]. Therefore, the strength of the BMI affects the strength of the surrounding slope or rock mass [32]. It is found that when the α in the BMI is small, the specimen failure mode is first brittle and then plastic. At a large sawtooth angle, the specimen shows brittle failure [33]. On this basis, the shear failure mechanism of the BMI under different influencing factors of interface roughness and different loading conditions has been investigated [34]. In terms of numerical simulation, most scholars used discrete element and finite element methods [35,36,37]. The particle flow method has also been used to study the τ of specimens at the BMI under various σ n [38]. The empirical formula for calculating the τ of the BMI was suggested by simulating the direct shear test of the BMI with various values of the joint roughness coefficient (JRC) using the discrete element numerical simulation method [20]. In terms of theoretical research, most scholars’ research directions mainly focus on the constitutive model of the binary medium interface [39,40,41]. The triaxial compression test was conducted on the semi-interpenetrated articulated mudstone samples, and the corresponding mechanical behavior and failure mechanism were explained. The constitutive model of the binary medium interface of the semi-interpenetrated jointed mudstone specimens has been proposed [42]. The shear stress at the BMI was found to be smaller than that at the bolt–mortar interface [43]. An energy fracture criterion is proposed for crack initiation at the MRI under consideration of viscoelastic properties [44].
The inner pores and chemical composition of mortar and rock are uncertain, and the human factors when pouring and curing the mortar–rock binary medium specimens are also uncertain. It is also difficult to carry out repeat tests due to the influence of the test apparatus, test environment, and other factors. Therefore, experimental studies on the binary medium are greatly limited. By means of the numerical simulation software FLAC3D 3.0 for geotechnical engineering, the numerical simulation of the shear test of the BMI with more various sawtooth angles and the corresponding force of the method is carried out to extend the experimental study of the MRI.

2. Materials and Methods

FLAC3D numerical simulation software is excellent for simulating stresses and strains in geotechnical materials under complex loads, but its modeling approach is complex. In this paper, a CAD-ANSYS combined modeling approach is used to establish the geometric model of the MRI. This means the 2D geometric surface domain of the model is created in CAD. The surface domain is then transferred to ANSYS to stretch and create a 3D geometric model. The model is meshed with tetrahedral cells. Finally, the node and cell data are converted into a numerical model that can be imported into FLAC3D by means of a self-programmed conversion program. Considering the complexity of the stresses and strains at the interface, the tetrahedral cells on both sides of the interface are set with small edge lengths to form a larger number of cells when meshing in ANSYS, which enable a more detailed analysis of the stresses and strains at the interface. However, if the whole model is meshed with small edge-length cells, it will lead to too many cells in the model and low computational efficiency. Therefore, on the premise that the number of cells at the interface is guaranteed, the number of cells is reduced by increasing the cell edge lengths near the edges of the model to improve computational efficiency. The mortar–rock binary media model used in this paper has a bonding effect between the two media. Therefore, an interlayer with a thickness of 0.001 m is placed between the two media. The interlayer parameters are the same as the mortar parameters. The contact between each set of units uses the contact force automatically generated by the software.
We modeled the interface as an isosceles triangular sawtooth shape with different angles based on Tang’s experimental study [34]. The α is the base angle of the isosceles triangle. In this paper, we set the sawtooth angles to 8°, 16°, 23°, 30°, 36°, and 45°, as shown in Figure 1. The model diagrams of the samples of the BMI with various angles of the interface sawtooth are shown in the figure. We used a cube-shaped sample with a length, width, and height of 70 mm. The orange and blue units in the diagram represent the mortar and rock materials in the BMI, respectively. The numbers of the model units in Figure 1a–f are 14,354, 28,144, 29,042, 27,190, 26,863, and 26,143, respectively. We used the Mohr–Coulomb strain-softening model to analyze the stress–strain behavior of the rock mass, and in FLAC3D, the strain-softening model in the elastic stage is consistent with the Mohr–Coulomb model. They differ in their plasticity, and the material parameters decrease as deformation increases. For rocks, these parameters mainly include cohesion, internal friction angle, dilatancy angle, etc. In the Mohr–Coulomb model, these parameters are constant, and in the strain-softening model, the piecewise function can be customized, and the above parameter values will change with the change of strain value. Table 1 and Table 2 show how these parameters relate to each other. The mechanical parameters of the rock and mortar are presented in Table 3, where E is the elastic modulus, μ is Poisson’s ratio, c is the cohesive force, ϕ is the internal friction angle, σ t is the tensile strength, and d n is the dilatancy angle.
To explore the influence of a larger range of σ n on the BMI, we set the normal stress to 11 levels: 0.1, 0.5, 1, 1.5, 2, 2.5, 3, 3.5, 4, 4.5, and 5 MPa. During the simulation process, the σ n was distributed equally over the top surface of the model, and the normal load remained constant throughout. After the unbalanced force of the specimen converged, the tangential load was provided by the uniform movement of the upper mortar, with a shear loading rate of 5 × 10⁻⁴ mm/step. The boundary conditions were as follows: the lower rock in the X-axis direction was constrained by the chain bar, and the upper mortar was a free interface; chain rod constraints were applied in the Y-axis direction; and in the Z-axis direction, the lower rock was constrained by a chain rod, and the upper mortar was a free surface.
To test the reliability of the model, we compared the direct shear test results [32], and the numerical simulation test data of the binary media interface of 30° α at 3 MPa σ n in Reference Figure 2 shows the correlation between the shear stress and the shear displacement of the specimen. The blue line in the figure shows the indoor test value and the red curve shows the simulated value obtained by the numerical simulation. You can see that the two forms are basically the same. The peak and residual shear strength are also similar, as is the shear displacement corresponding to the peak strength.
Figure 3 and Figure 4 show the evolution of the major strain cloud diagram of the specimen during the indoor test and the numerical simulation test, respectively. The principal strain cloud diagram of the indoor test was obtained using the consistent method of digital speckle analysis, while the main strain cloud diagram of the numerical simulation test was recorded and saved by the program.
As shown in Figure 3, the main strain before the shear peak value of the serrated binary medium interface was distributed on the intermediate shear zone, mainly on the side of the mortar, and regularly along the serrated angle. The development process gradually extended from one side to the other side until it penetrated. Figure 4 shows that the main strain of the numerical simulation was mainly distributed on the side of the mortar, along the serrated interface. There was almost no strain on the side of the rock, consistent with the indoor test results. These results show that the simulation reliability of the shear strain change of the binary media interface by FLAC3D is high and can reasonably reflect the real situation of the test.
Figure 5a,b show the failure diagrams of the specimens after the destruction of the test in the laboratory [32] and the numerical simulation test, respectively. In Figure 5b, the yellow unit shows the shear failure unit, the red unit shows the tensile failure unit, and the blue unit shows the undamaged unit. It can be observed from the figures that the mortar and rock parts were damaged when the specimen was finally destroyed, indicating that some sawtooth gnawing failure had occurred.
By comparing Figure 5a with Figure 5b, it was found that the failure mode of the numerical simulation specimen was consistent with the indoor test. Therefore, it is considered that the numerical simulation parameters are reliable, and the model can simulate effectively the shear strain characteristics and mechanical properties of the MRI.

3. Results

To analyze the shear stress variation (τ) across the interface between the mortar–rock binary medium during the shear process, we recorded the unbalanced force in the shear direction on the shear band during the shear process and calculated the shear stress. Figure 6 indicates the connection between the shear stress and the shear displacement (δ-s) of the BMI with a sawtooth angle of 30° under 3 MPa σ n . The δ-s diagram of the BMI can be divided into four stages.
To further analyze the action of σ n and the interface α at each stage of the τ δ s curve, we drew the connection between shear stress and shear displacement of the MRI with six types of sawtooth angles in shear tests under different σ n in Figure 7a–f.
In the elastic phase, the shear stress across the binary interface grew linearly with the increase in shear displacement. The greater the σ n , the later the elastic stage of the specimen ended, indicating that the sample was in the elastic strain stage prior to failure. The greater the σ n , the larger the shear displacement of the specimen in the shear direction of the mortar and rock medium. Comparing the shear stress–shear displacement curve in Figure 7a–f, we found that the greater the sawtooth angle, the greater the slope of the δ-s curve, indicating that the larger the shear stiffness of the BMI specimen. This is because the number of serrations of the test piece is the same. The greater the α and the more rock and mortar elements involved in providing shear resistance on the shear surface, the greater the shear rigidity of the BMI.
At the failure stage, with the increasing shear displacement, the shear stress increased, but the velocity decreased compared to the elastic stage and declined rapidly after achieving the shear peak. The higher the normal stress, the higher the peak shear stress. By comparing the δ-s curves of different sawtooth angles in Figure 7, we found that for a small sawtooth angle, the peak shear stress curve at the failure stage would fluctuate near the peak value, and the higher the normal stress, the more focused the curve fluctuation was at the failure stage. This shows that when the binary medium interface was unstable and damaged, the larger the normal stress, the larger the α , the smaller the range of shear stress fluctuation, and the smaller the degree of irregular change of shear stress.
Softening, the δ-s curve shows a downward trend, indicating that the strain energy accumulated in the elastic and fracture phases is released after the specimen fractures. The shear failure process of the BMI is divided into two parts, namely, interface separation failure and sawtooth gnawing slip. When shear failure happens at the binary media interface, the two failure modes occur simultaneously. Therefore, the δ-s curve of the BMI shows a steep decline after failure and fluctuates to the residual stage after the decline. Comparing the δ-s curves of the individual serration angles in Figure 7, it is found that the shear stress fluctuates greatly during the transition period when the σ n is small and the serration angle is small. When the σ n is great and the serration angle is large, the curve has almost no fluctuation or the fluctuation is very small during the transition period. This shows that the strain energy release rate after specimen failure is unstable under the circumstance of small normal stress and small sawtooth angle.
In the residual phase, shear stress remains essentially unchanged as shear displacement increases, but the more normal stress, the more residual shear stress. By comparing the δ-s curves of various α in Figure 7, it is found that the larger the sawtooth angle, the larger the range of residual shear stress with σ n , indicating that the action of σ n on the τ r of the binary interface is related to the α , and the influence of τ r increases as the α increases.
For specimens with a small deformation size, the change in shear strain is consistent with the change in shear displacement. Therefore, the slope k (unit: MPa/mm) of the δ-s curve could be used to reflect the shear stiffness of the binary medium interface in the elastic stage to a certain extent. According to the experimental analysis, the shear stiffness of the BMI is related to the σ n . However, because of the inconsistency of the internal structure of the natural rock and the mortar material, the experimental data results are highly discrete, and the regularity is weak when the number of test samples is not large enough. To further analyze the influence of α and σ n on the shear elastic phase of the BMI, the slope of the curve of the shear elastic stage of the BMI of each sawtooth angle in Figure 7 is summarized in Table 4 and Figure 8. Table 4 shows that the slope k value is affected by the change in σ n and α . When σ n increases 0.1 MPa to 5 MPa, the slope k value of the curve increases by about 1.5–4 MPa/mm. When the sawtooth angle changes from 8° to 45°, the slope k value of the curve increases by 15–20 MPa/mm, indicating that increasing the σ n and increasing the α can increase the shear stiffness of the BMI in the elastic stage, which has a more obvious effect on shear stiffness from the change in α . Figure 8 shows the relationship correlation between the shear k value of the BMI and the σ n and the interface α . Note that the shear k value of the BMI is low when the α is low and the σ n is low. On the contrary, the k value is higher. The three-dimensional scatter diagram in the observation diagram has a good linear relationship between the k-value, the σ n , and the interface α . The linear Expression (1) is used to fit the correlation between the k value and the σ n and the α.
k = k 0 + b 1 σ n + c 1 α
where σ n   is the normal stress, α is the sawtooth angle, and the constant k 0 = 2.709, b 1 = 0.7164, and c 1 = 0.4765.

4. Discussion

In Table 5 and Figure 9, the shear displacement corresponding to the peak shear stress of the BMI under different α and different σ n is calculated, and the unit of the peak shear displacement is mm. Table 5 shows that with increasing σ n and α , the shear stress peak displacement at the binary interface increases. The distribution range of peak shear displacement is related to σ n and α as shown in Figure 9.
When σ n and α are small (such as the light green background in the top left corner of Table 5 and the scattered dots in the green wireframe in Figure 9), the peak shear displacement is less than 0.5 mm, indicating that in this case, the sawtooth binary medium interface has a very small shear displacement when the two medium interfaces are separated and destroyed. However, due to the relatively smooth interface and the low degree of sawtooth adhesion, the binary medium interface, in this case, does not have sawtooth gnawing damage, as shown in Figure 10a. In the diagram, the BMI with a serrated angle of 8° is destroyed under the σ n of 0.5 MPa. The failure position of the interface unit is concentrated on the bonding surface of the rock and mortar, while the two sides of the medium are not damaged. That is, the failure mode of the BMI with a flat interface is interface separation failure under the condition of small normal stress.
As shown in the purple background area in Table 5 and the data points in the purple wireframe in Figure 8, the peak displacement is mostly concentrated near 1 mm. In both cases, the interface shear of the BMI mostly occurs in the mixed failure mode of interface separation and sawtooth partial gnawing, as shown in Figure 10b,c. Figure 10b is the element failure diagram of the BMI with a α of 36° under the σ n of 0.5 MPa. Figure 10c is the unit failure diagram of the BMI with a serrated angle of 16° under the σ n of 4.5 MPa. The yellow unit is the shear failure unit, the red unit is the tensile failure unit, and the blue is the undamaged unit. The failure elements in the figure are mainly distributed in the part of the mortar on the upper side of the serration and are mainly shear failure. When the binary medium interface with a serration angle of 36° is destroyed, the rock part receives a small amount of damage, while when the binary medium interface with a serration angle of 16° is destroyed, the rock part was not destroyed, indicating that the increase in serration angle can fully exploit the shearing capacity of the rock material, thereby enhancing the ability of the two mediums to work together.
For a large sawtooth angle and a large normal stress (such as the light red background in the lower right corner of Table 5 and the scatters in the light red wireframe in Figure 9), the peak shear displacement is over 2 mm, indicating that the sawtooth BMI is under the action of high normal stress in this case. There is no obvious interface separation failure, and due to the large sawtooth angle of the interface, the binary interface failure mode becomes the gnawing failure mode along the tooth root under shear stress, as shown in Figure 10d. In the figure, the binary medium interface with a α of 45° is destroyed under the σ n of 4.5 MPa. After the failure, the failure position of the interface unit is focused on the middle of the specimen and almost the entire shear band. The mortar and rock near the interface have a lot of damage, indicating that the binary medium interface with rough interface is under the action of large σ n . The shear failure mode is gnawing failure.
Figure 11 shows the correlation of the shear strength and the normal stress of the BMI at various sawtooth angles. As shown, the shear strength of the BMIs increases with increasing σ n and interfacial α . This is because the higher σ n brings the two media closer together, enhancing the shear strength of the BMI. Different from most rock joints, the shear strength of the BMI with a α of 8° does not change under the σ n of 0.1 MPa, 0.5 MPa, and 1 MPa. This is because when the interface is relatively flat and the σ n is low, the shear strength of the BMI is dependent on the bonding effect between the two media. Therefore, in this case of geotechnical engineering, increasing the strength of the BMI material and the roughness of the interface as much as possible can effectively improve the shear performance of the BMI. Taking the BMI material as an example, in this case, it is recommended to increase the roughness of the interface of the BMI and improve the bonding performance of the cement, for example by adding glass fiber, steel fiber, and using ultrafine cement.
Based on the standard Mohr–Coulomb rock shear strength measurement, the shear strength parameters of the BMI at different α are calculated: c and ϕ. The concrete findings are presented in Figure 12 and Table 6. From Table 6, the shear strength of the BMI at each sawtooth angle satisfies the Mohr–Coulomb criterion, and the fit coefficient is greater than 0.95, indicating the reliability of using the Mohr–Coulomb rock shear criterion to describe the correlation between the τ of the BMI and the α . The mathematical relationship is shown in Formula (2). In the table, as the α increases, the c and ϕ of the mortar–rock BMI show an increasing trend. Figure 12a,b show the correlation between the interfacial adhesion angle and the ϕ of the BMI and the sawtooth angle, respectively. Figure 12a indicates that the increase rate of the interfacial adhesion of the binary medium gradually increases as the sawtooth angle increases. Formula (3) is used to quantify the connection of the interface strength of the MRBM with the sawtooth angle. In the formula, c is the interface bonding force of the MRBM and the sawtooth angle. The correlation coefficient R2 is 0.98, more than 0.95, indicating that the fitting result is good and the fitting formula is reliable. From Figure 12b, as the α becomes larger, the rate of increase in the ϕ of the BMI first becomes larger and then smaller. To quantitatively express the relationship between the ϕ of the binary interface and the α , the piecewise function is used to fit the data in Figure 12b. The result of the fitting is shown in Formula (4), and the fitting correlation coefficient, R2 = 0.9866, indicates that the fitting effect is favorable and the fitting formula is reliable.
τ max = c + σ n tan ( ϕ ) .
where τmax is the interface shear strength of MRBM, σ n is normal stress, c is binary medium interface cohesion, and ϕ is the internal friction angle of BMI.
c = a + b [ tan ( α ) ] d
where α is the sawtooth angle and a, b, d are constants, a = 1.199, b = 4.848, d = 1.43.
ϕ = k + l α , α α i ϕ i + n ( α α i ) , α > α i .
where α i is the critical sawtooth angle, α i = 24.1752, and k, l, n are constants, k = 18.12, l = 0.7237, n = 0.1671.
To further study the effect of α on τ r , Figure 13 shows the correlation between the τ r and the σ n of the BMI at various sawtooth angles. It is seen that as σ n and interface α increase, the τ r of the binary interface increases linearly. This is because the larger the σ n and α , the rougher the interface morphology of the two media after failure, and the closer the bonding, thus improving the τ r of the BMI.
Based on the Mohr–Coulomb criterion, the τ r - σ n relationship in Figure 13 is fitted by Formula (5), and the τ r parameters of the BMI are obtained: residual cohesion ( c r ) and ϕ r , as shown in Table 7 and Figure 14. Table 7 shows that the correlation between the τ r and the σ n of the BMI for various interface sawtooth angles is consistent with the Mohr–Coulomb rock shear criterion, indicating that the Mohr–Coulomb rock shear criterion is described for the BMI and the reliability of the connection between τ r and σ n . In the table, as the α increases, the c r and the ϕ r of the BMI increase.
Figure 14a shows the correlation between the α of the BMI and the residual bonding force. The figure shows that the residual bond strength is 0 MPa when the α is small (8–16°), indicating that the binary medium interface with a flat interface has almost no bonding effect after shear failure, and the interface separation slip friction effect is obvious after failure. As the interface α increases, the bond strength of the BMI continuously increases, and the increase in the interface roughness and the occlusion of the interface sawtooth make the interface still have a shear performance at small σ n . The relationship between the residual cohesive force of the BMI and the tangent value of the sawtooth angle is fitted by the piecewise Function (6). It is found that the relationship between the residual cohesive force and the tangent value of the α conforms to the piecewise function, and the fitting correlation coefficient is 0.9782, indicating that the correlation between the two is high. Figure 14b shows the correlation between the α and the ϕ r of the BMI. The diagram shows that as the α increases, the ϕ r of the BMI increases. The relationship between the ϕ r and the α of the BMI is fitted by Equation (7). The fitting correlation coefficient is 0.9984, indicating that Equation (7) is used to describe the reliability of the ϕ r of the BMI at the sawtooth interface.
τ r = c r + σ n tan ( ϕ r ) .
where τ r is the residual shear strength, c r is the residual cohesion, and ϕ r is the residual angle of internal friction.
c r = 0 , α α m m [ tan ( α ) tan ( α m ) ] , α > α m .
where α m is the critical sawtooth angle, α m = 16°, and m is a constant related to the material.
ϕ r = P 1 α / ( P 2 + α )
where P 1 , P 2 are constants, P 1 = 35.00, P 2 = 13.68.
η = τ max τ r τ max × 100 %
where η is the strength degradation rate, τ m a x is the interface shear strength of the binary medium, and τ r   is the residual shear strength of the binary medium interface.
η = 100 + a 1 σ n + b 1 tan ( α ) + c 1 ( σ n ) 2 + d 1 tan 2 ( α )
where η is the strength degradation rate, σ n is the normal stress, α is the sawtooth angle, and a1, b1, c1, d1 are constants, a1 = −8.821, b1 = −42.32, c1 = 0.7996, d1 = 30.63.
To further investigate the shear behavior of the BMI after shear failure, the shear strength deterioration rate (η) is calculated by Formula (8) to characterize the deterioration of the shear performance of the BMI after failure compared with that before failure. Figure 15 shows the correlation between the shear strength deterioration rate (η) of the BMI and the σ n and the interface α . It can be seen in the figure that η is the largest when the σ n is 0.1 MPa and the α is 8°, and η m a x   is 97.56%. The η is smallest at 5 MPa σ n and 30° α , and the η m i n is 60.01%. By observing the relationship between η and σ n and α in Figure 15, it is shown that as the σ n increases, the shear strength degradation rate of the BMI gradually decreases (as shown by the red dotted arrow in Figure 15), with a decrease of about 15%, which is the strength reduction after the shear failure decreases, indicating that the increase in σ n reduces the strength deterioration effect of the BMI after failure. When the α is less than 30°, η gradually decreases as the α increases, and the decrease is about 12%. When the α is 30°, η reaches the minimum value. For α greater than 30°, η gradually increases with the increase in the α , with an increase of about 3% (as shown by the green dotted arrow in Figure 15). The relationship between η and σ n and α in Figure 15 is fitted by Equation (8). The fitting correlation coefficient R2 = 0.967 indicates that the fitting result is reliable. The correlation between the shear strength degradation rate of the BMI and σ n and α can be predicted by Equation (8). In engineering, the shear strength of the BMI before failure is inverted by the residual shear strength after failure.

5. Conclusions

In this paper, the shear characteristics of the interface between the MRBM with different roughness were studied by using the research method combining laboratory tests and numerical simulation. The main conclusions are as follows:
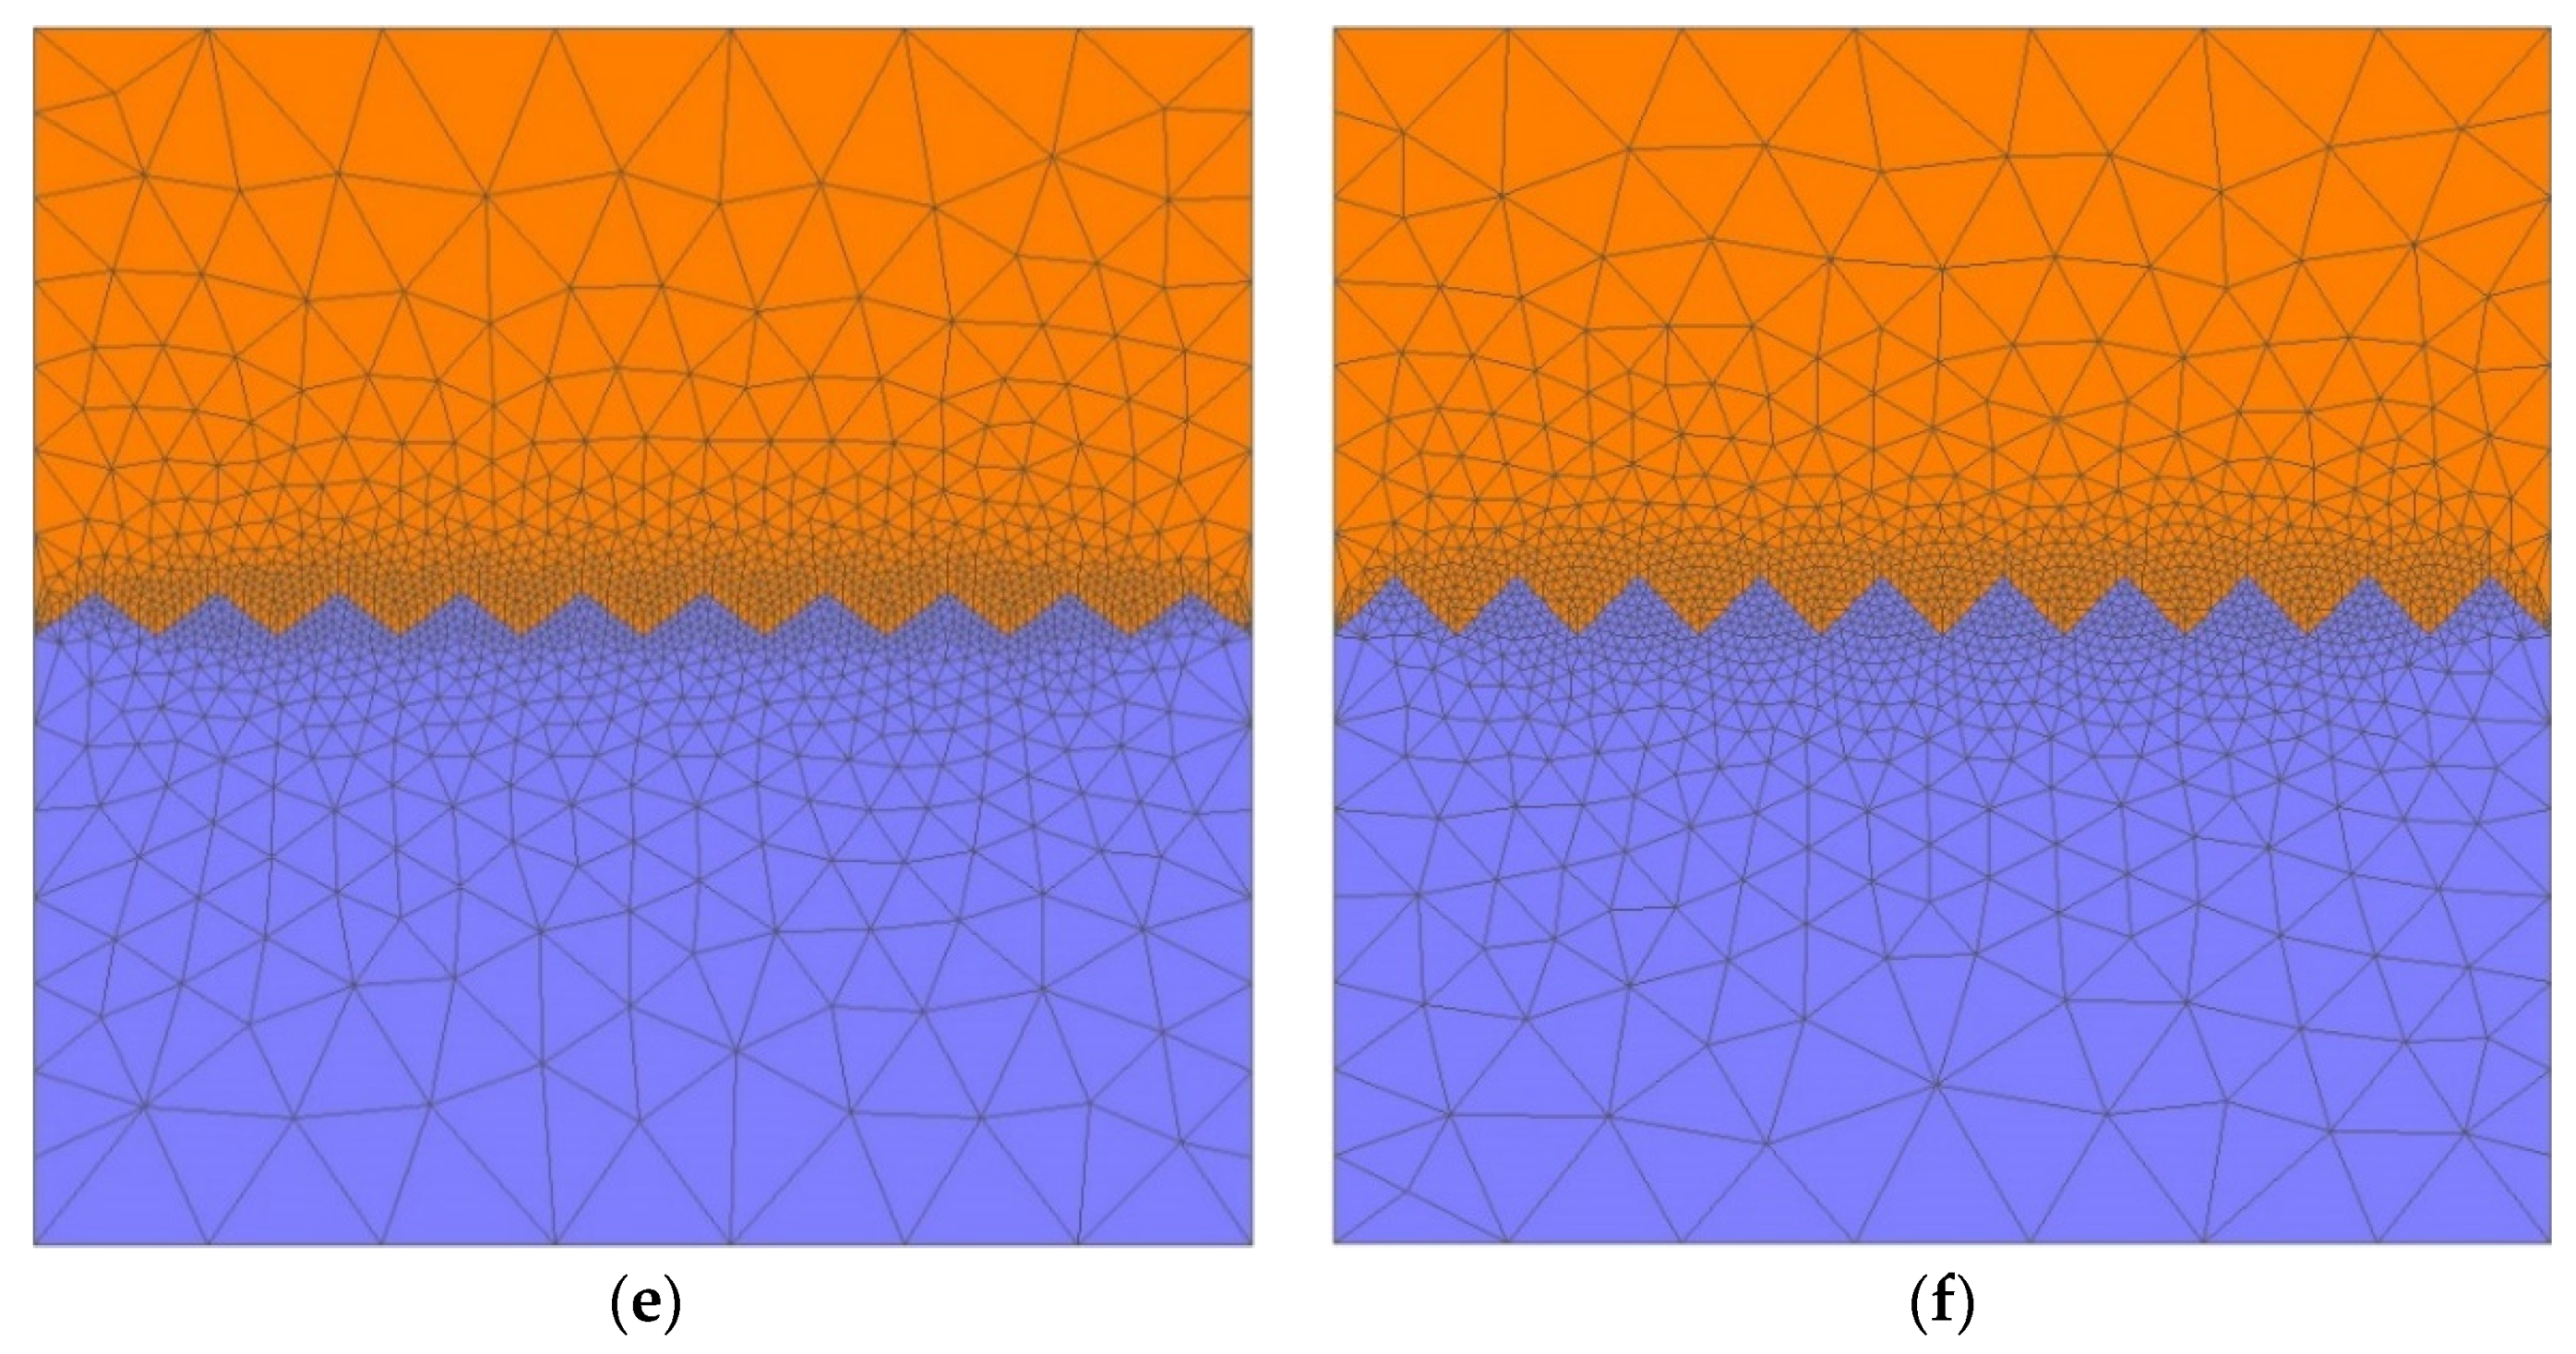
  • Through the indoor direct shear test, the shear stress–displacement relationship and the failure mode of the mortar–rock interface are obtained. A series of direct shear numerical simulation tests will be carried out based on the numerical model of the mortar–rock interface.
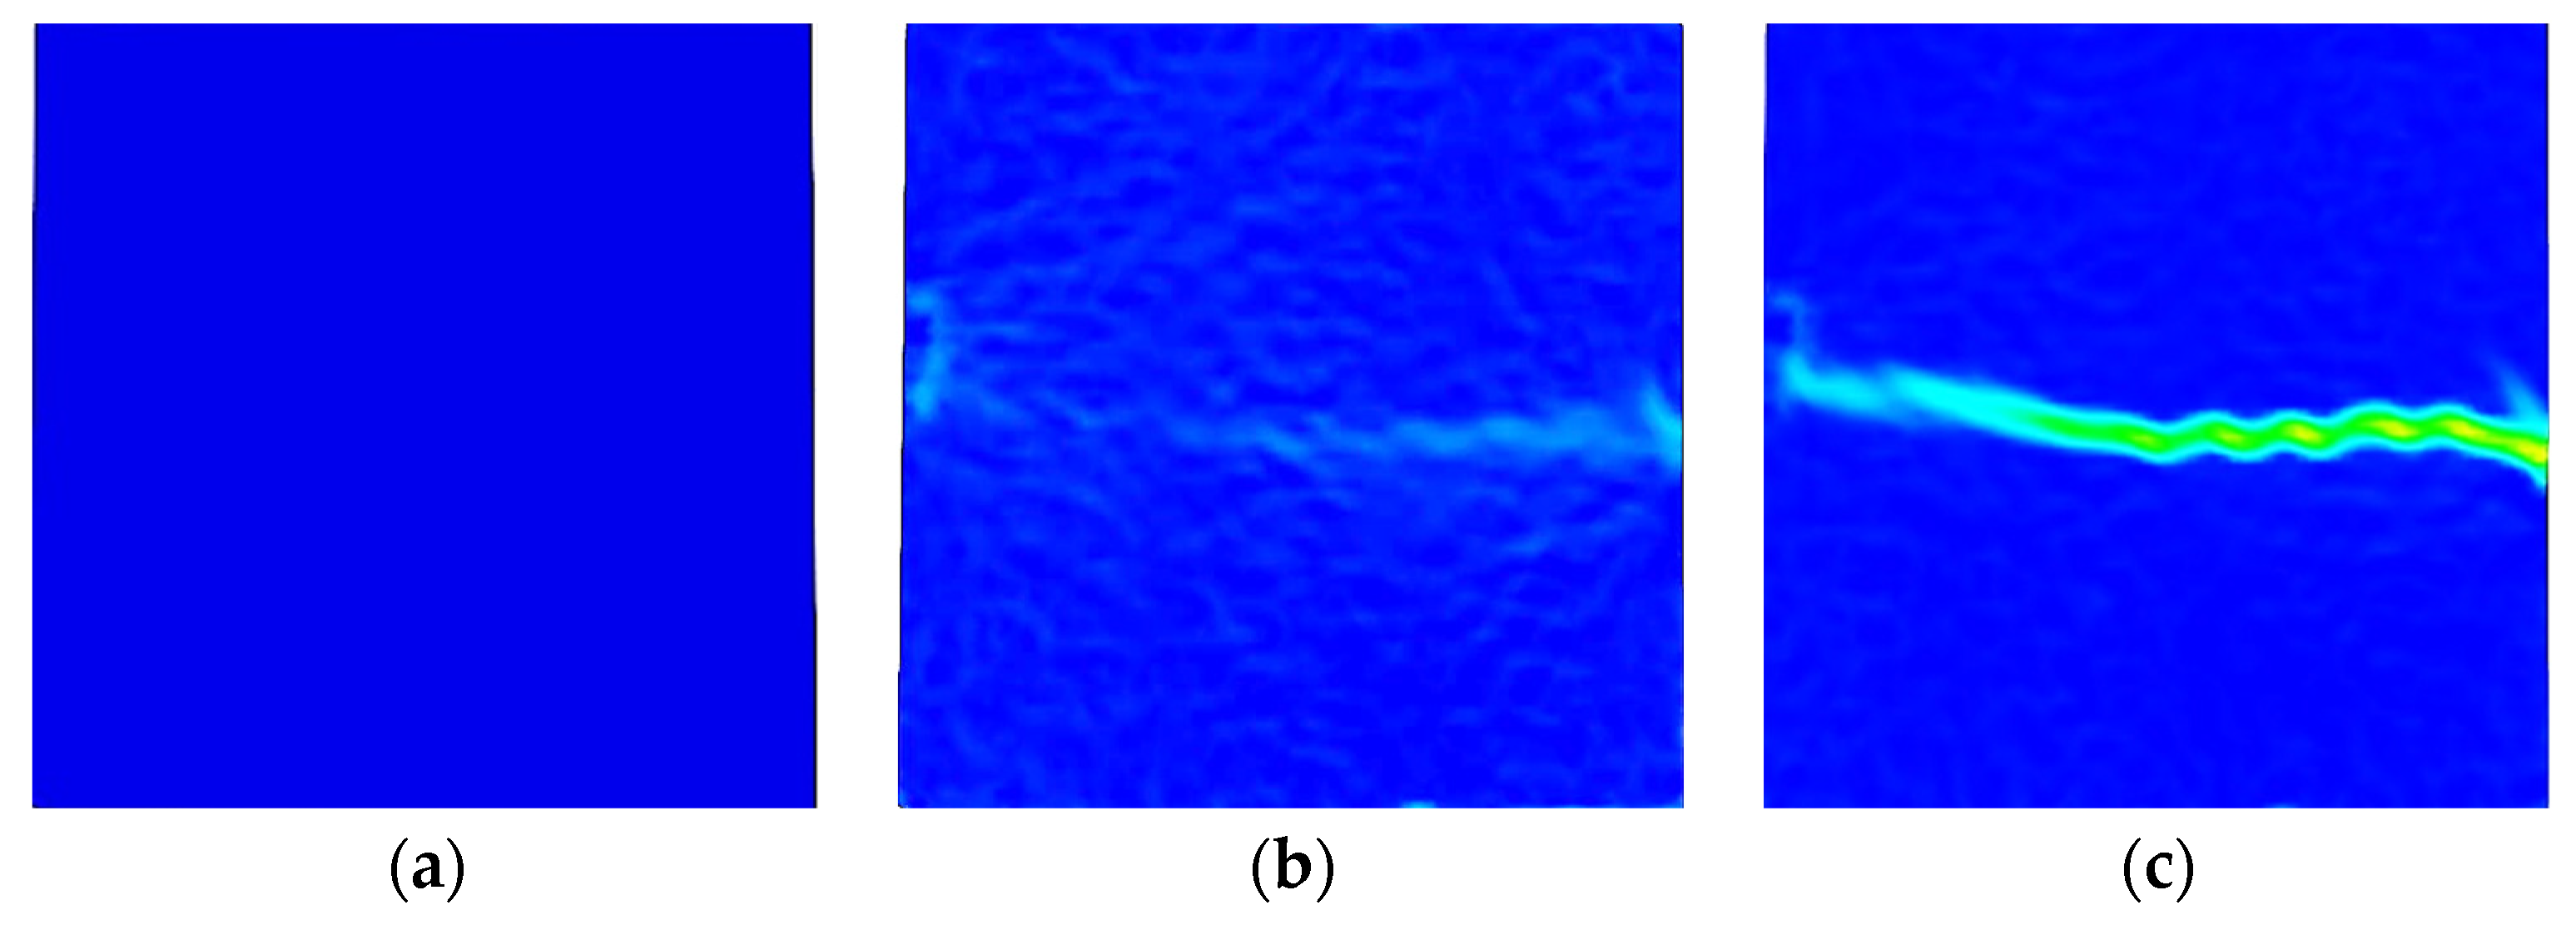
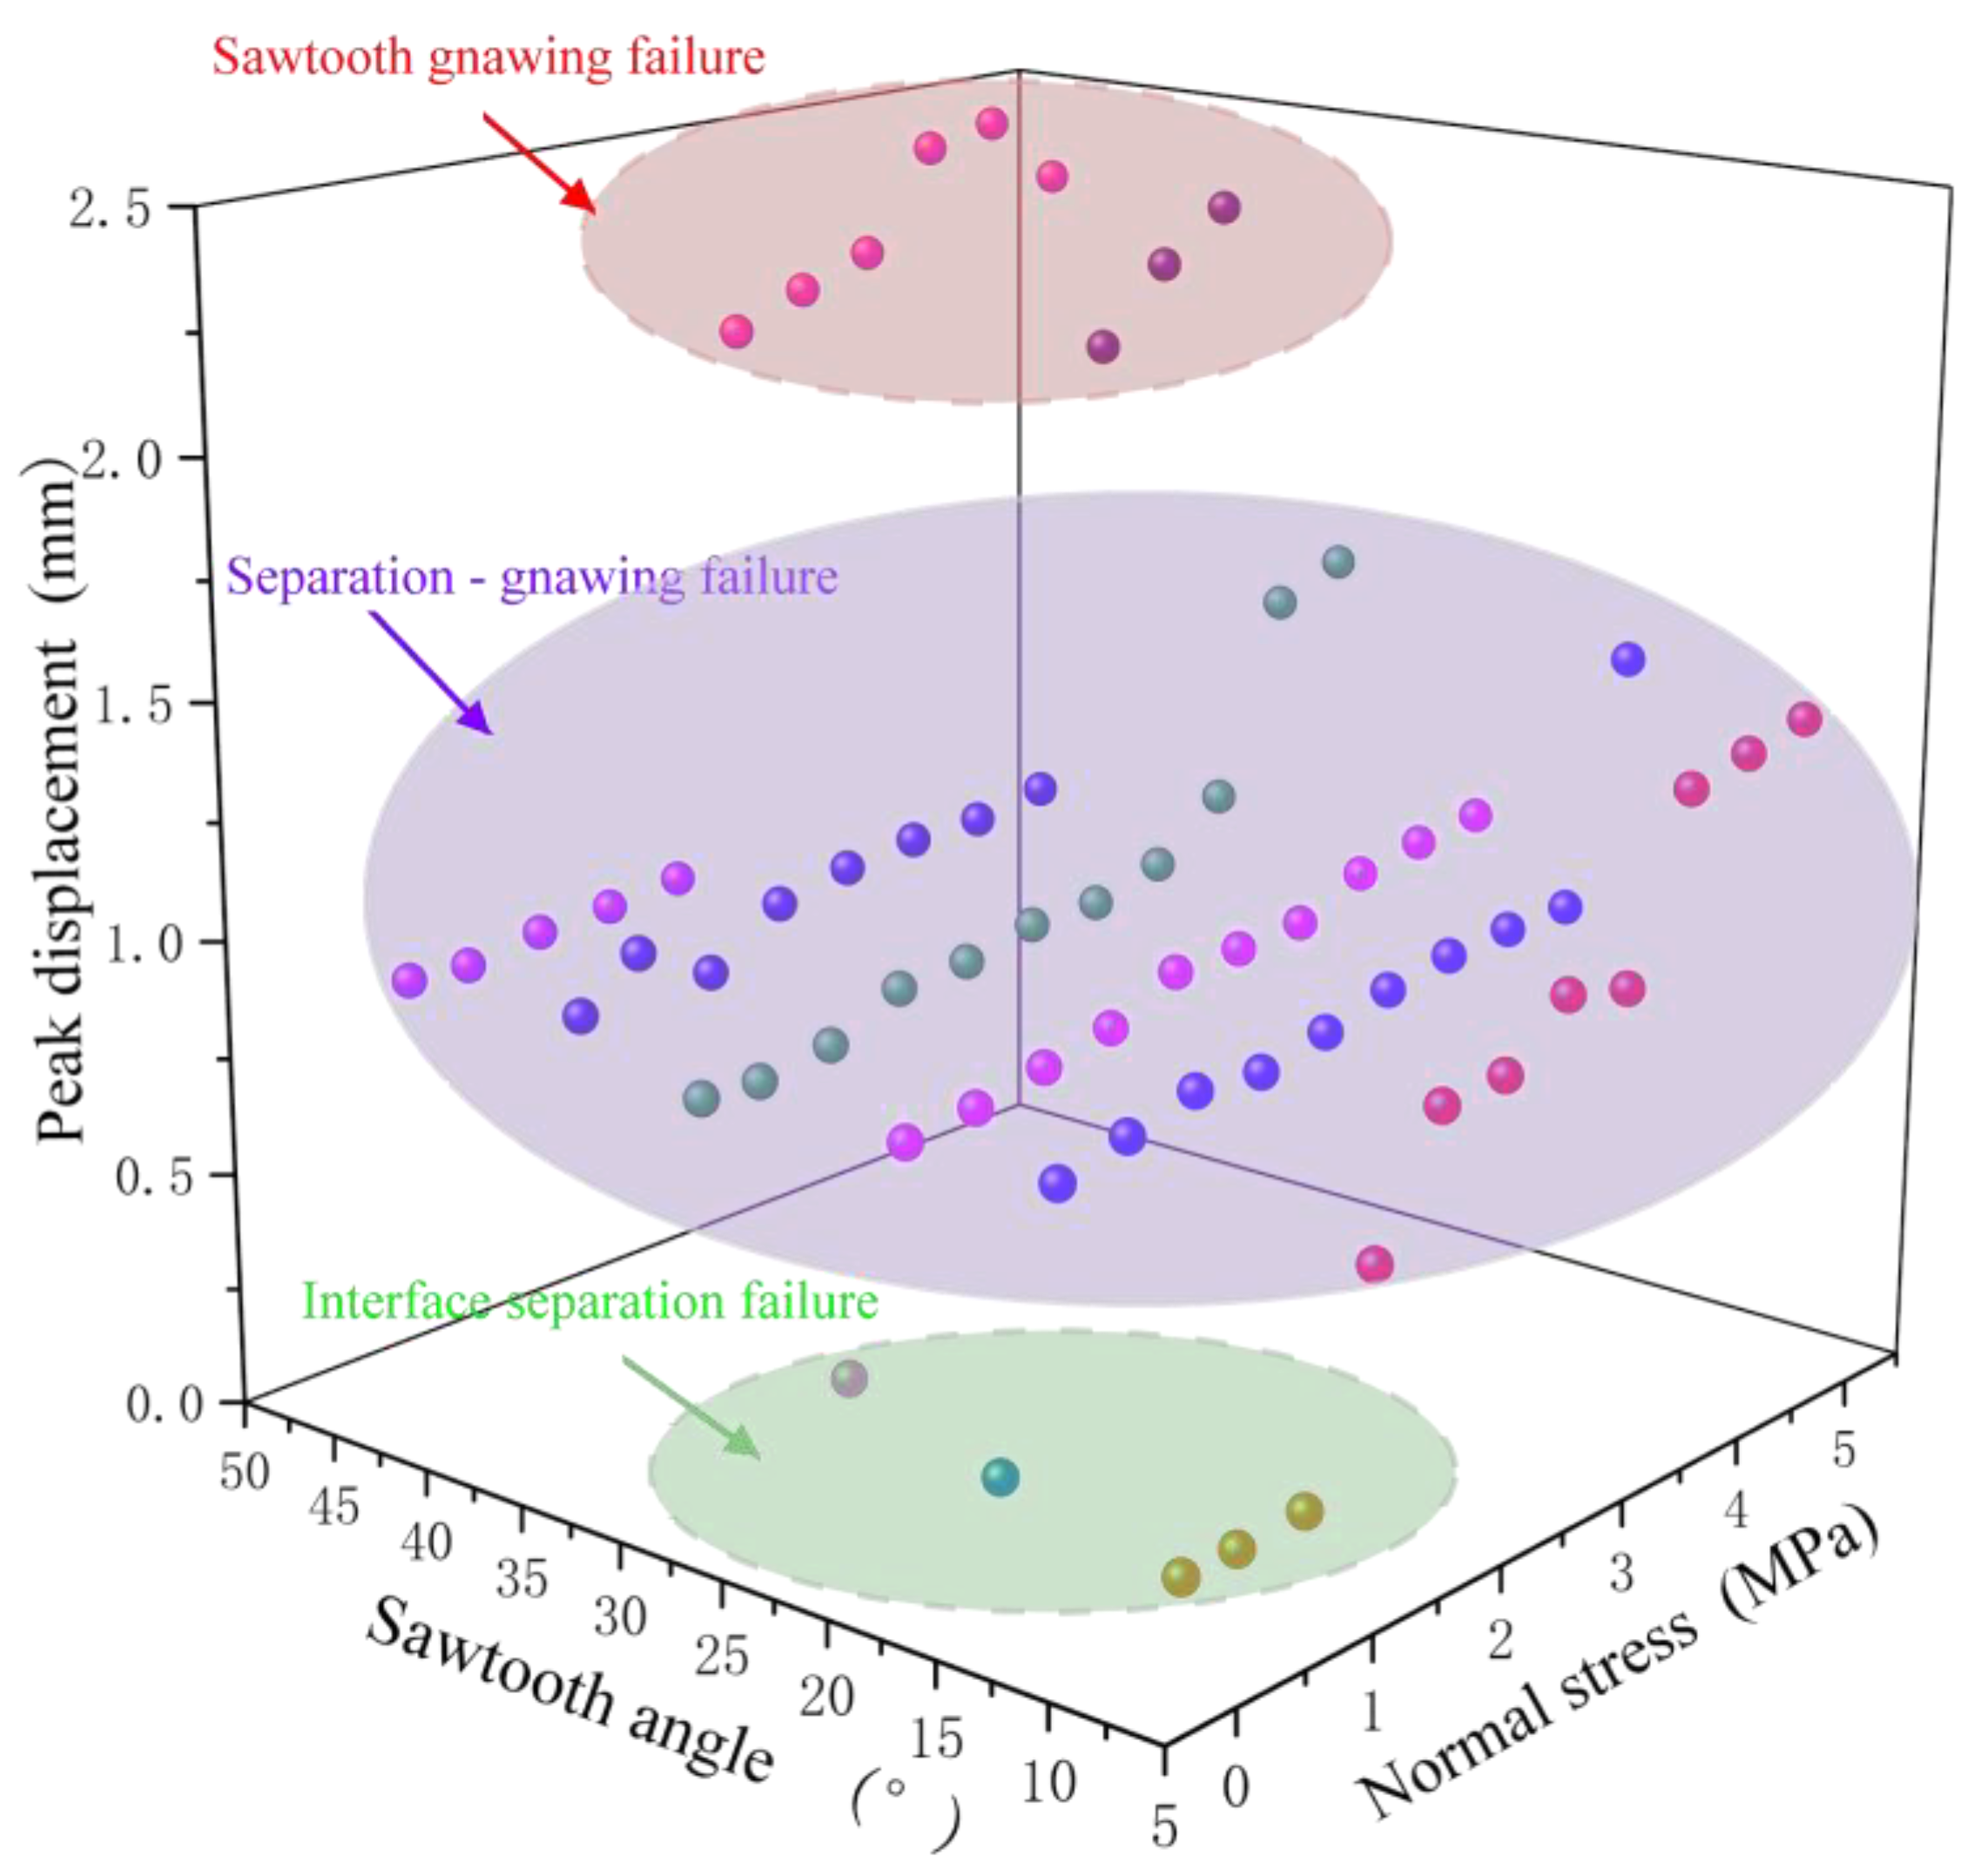
  • There are three shear failure modes of the mortar–rock interface, which are interface separation failure, separation shear failure, and serrated shear failure. For the interface with low roughness, under the state of low normal stress, the interface is generally separated and destroyed, while for the interface with low roughness, under the environment of high normal stress and high roughness interface under the shear stress of the first normal stress, the interface is generally separated and broken. For the interface with high roughness, under high normal stress, most of them are jagged shear failures. The shear displacement corresponds to the peak stress and can be used to judge the failure mode of the interface.
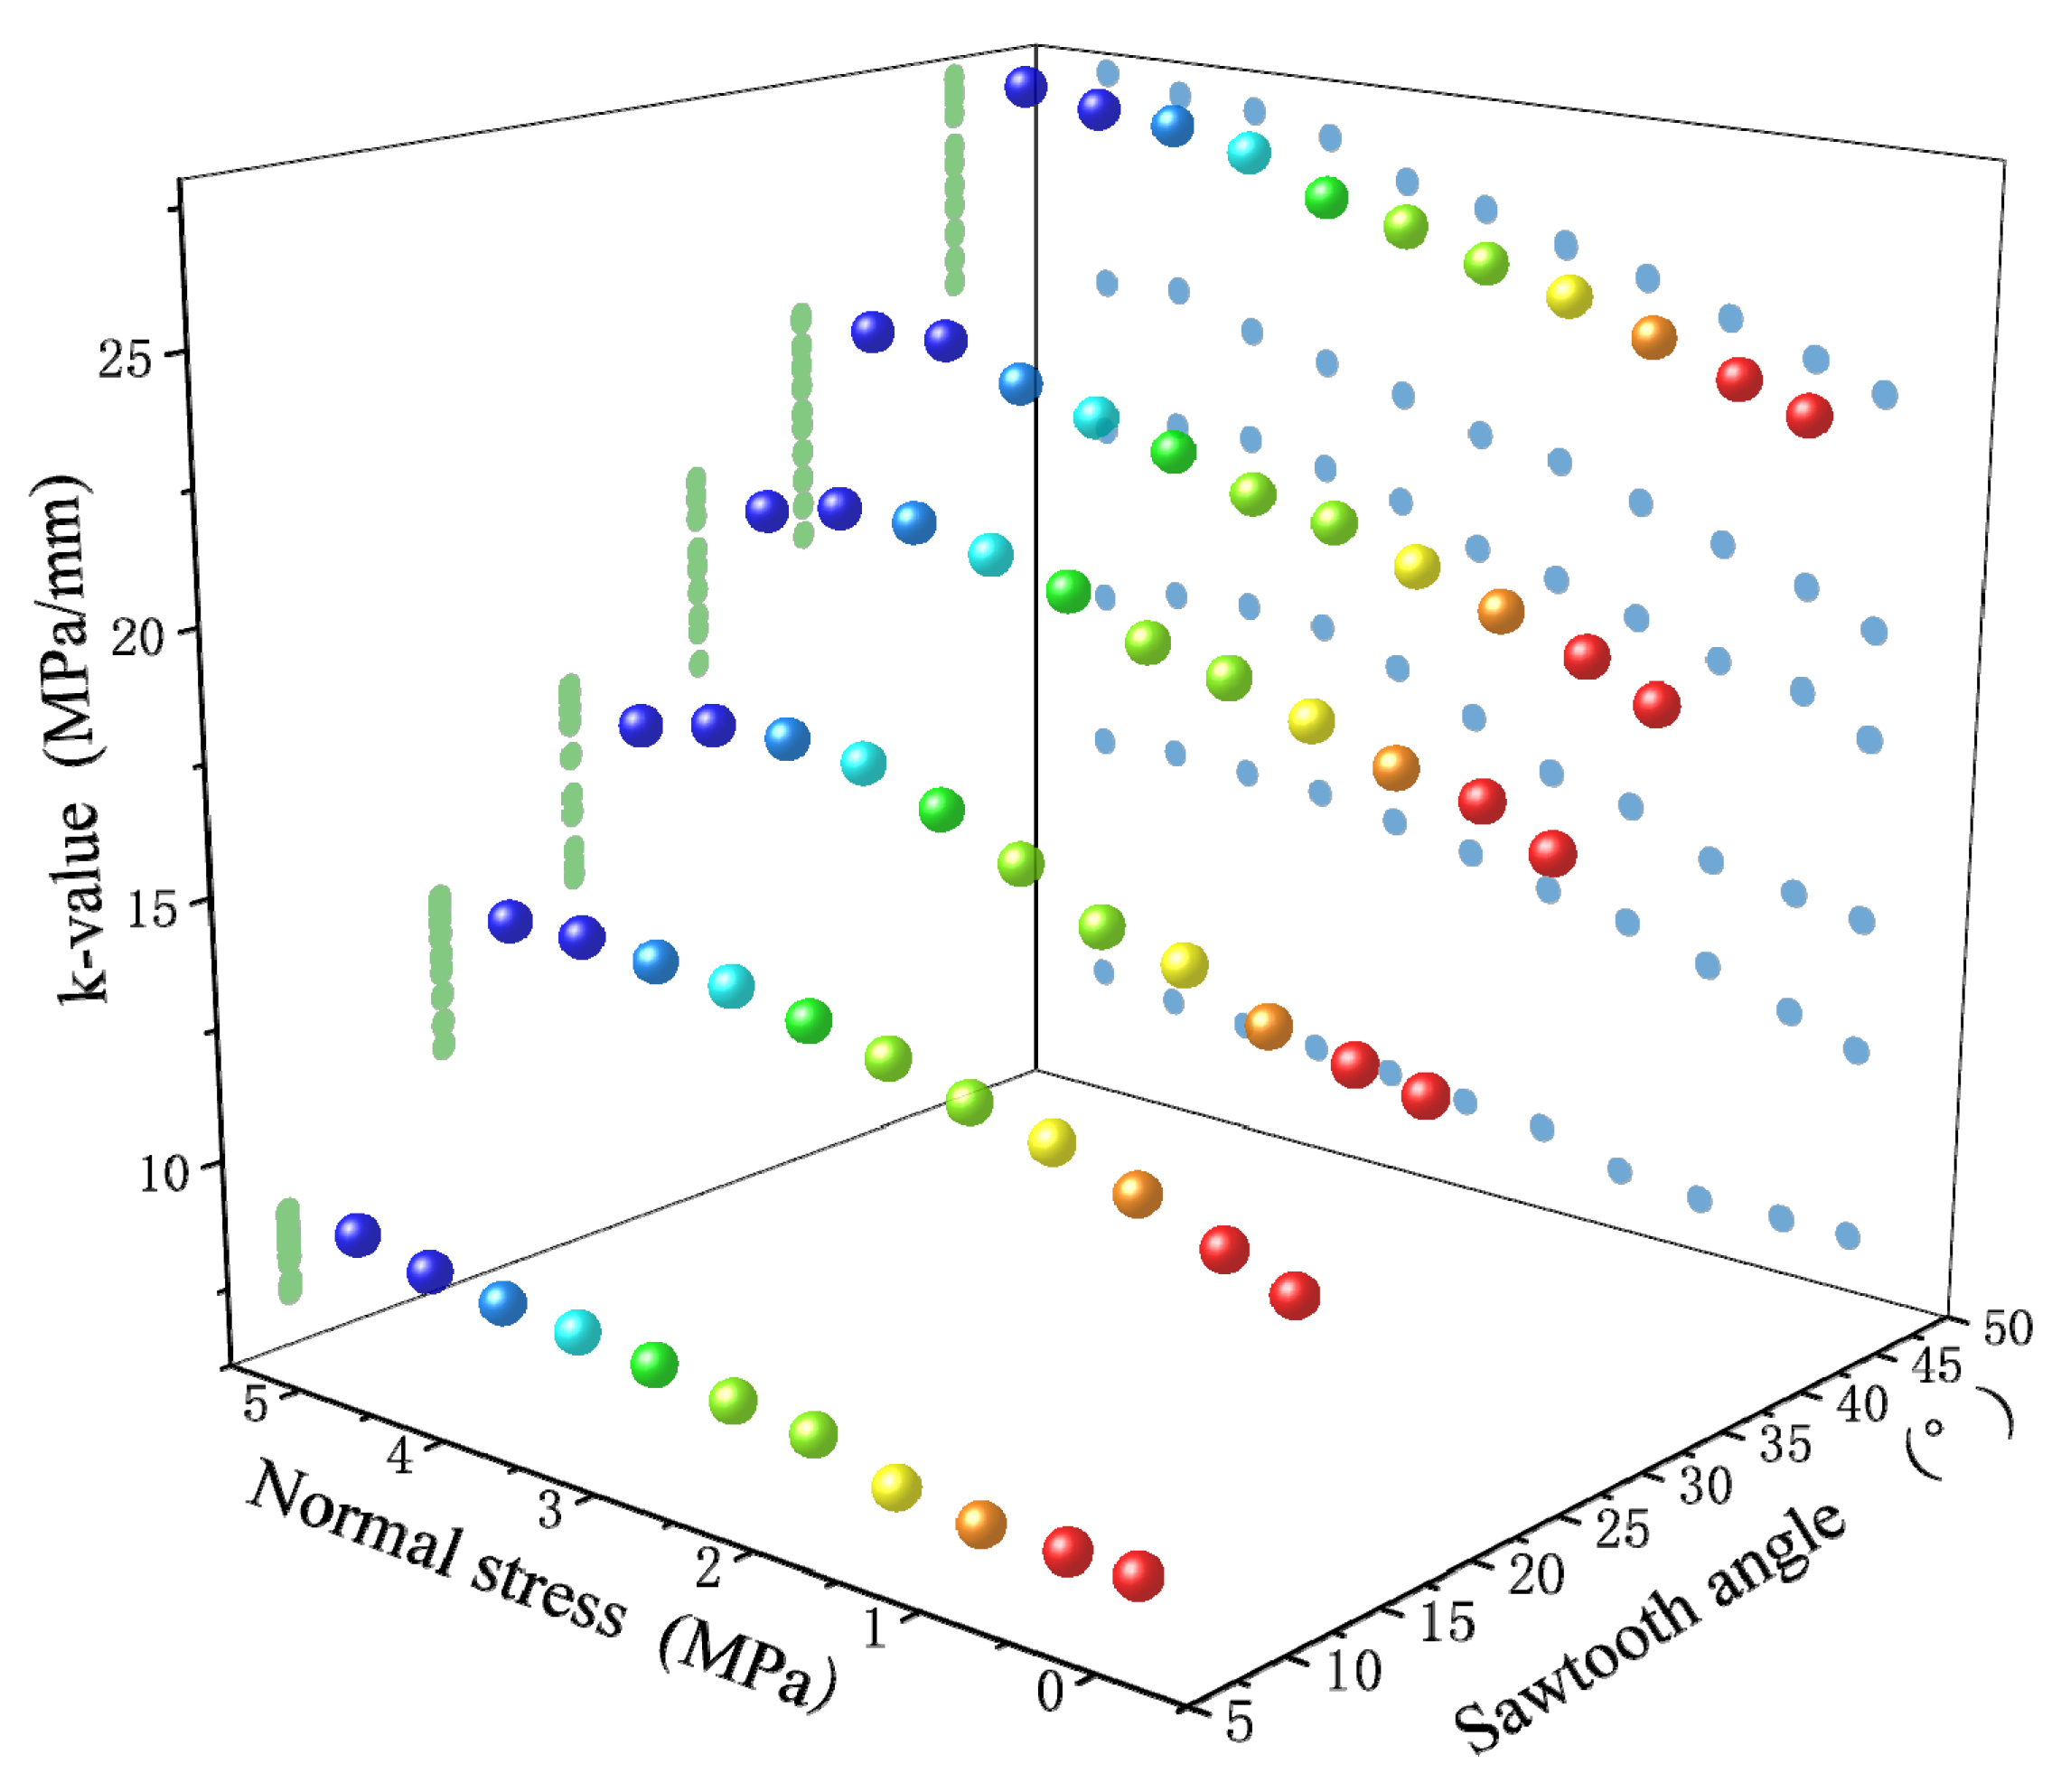
  • From the change in the shear stress–displacement curve shape, it is found that the larger the interface roughness and the normal stress are, the larger the shear stiffness of the binary medium is, and then the linear correlation between the interface shear stiffness of the binary medium and the two is established.
  • Based on the Mohr–Coulomb criterion and the shear strength of the interface, the quantitative correlation between the interfacial adhesion, the internal friction angle, the residual internal friction angle, the sawtooth angle, and the normal stress of the MRBM is obtained. The correlation between the shear strength degradation rate of the MRBM and the normal stress and sawtooth angle is analyzed.
In the indoor test, the specimen is made for a long time, and the strength of the specimen is easily influenced by the environment. Numerical simulation can solve the discrete problem of the specimen and improve the research efficiency. However, this study only simulates the shear test of the same mortar–rock material and can further expand the shear test of binary media with different strengths.

Author Contributions

Formal analysis and resources, Y.Z.; Methodology and writing—original draft, M.Z.; Conceptualization, software and writing—original draft, W.T.; Supervision and visualization, Y.C. All authors have read and agreed to the published version of the manuscript.

Funding

This paper obtained its funding from the National Natural Science Foundation of China (Grant No. 52274118 and No. 51774131) and the Construction Project of Chenzhou National Sustainable Development Agenda Innovation Demonstration Zone (2021sfQ18). The authors wish to acknowledge this support.

Informed Consent Statement

Not applicable.

Acknowledgments

Investigation, review and editing, Wang Ping; Funding acquisition, review and editing, Lin Hang; Validation and visualization, Wang Wei.

Conflicts of Interest

The authors declare no conflict of interest.

References

  1. Li, Y.; Zeng, X.; Lin, Z.; Su, J.; Gao, T.; Deng, R.; Liu, X. Experimental study on phosphate rock modified soil-bentonite as a cut-off wall material. Water Supply 2022, 22, 1676–1690. [Google Scholar]
  2. Liu, Y.; He, B.; Xie, J.; Lu, Y.; Zhang, L. Compatibility of geosynthetic clay liners at different temperatures. J. Environ. Prot. Ecol. 2021, 22, 2295–2306. [Google Scholar]
  3. Zou, S.; Li, H.; Liu, L.; Wang, S.; Zhang, X.; Zhang, G. Research on improving comprehensive properties of a new sawdust composite insulation material by torrefaction. Process Saf. Environ. Prot. 2021, 152, 361–374. [Google Scholar]
  4. Fan, H.; Lu, Y.; Hu, Y.; Fang, J.; Lv, C.; Xu, C.; Feng, X.; Liu, Y. A landslide susceptibility evaluation of highway disasters based on the frequency ratio coupling model. Sustainability 2022, 14, 7740. [Google Scholar]
  5. Han, Y.-S.; Dong, S.-K.; Chen, Z.-C.; Hu, K.-H.; Su, F.-H.; Huang, P. Assessment of secondary mountain hazards along a section of the Dujiangyan-Wenchuan highway. J. Mt. Sci. 2014, 11, 51–65. [Google Scholar]
  6. Zhu, W.; Gu, S.-q. Casing mechanism of engineering hazards in a oil field in central China. Environ. Earth Sci. 2013, 70, 869–875. [Google Scholar]
  7. Li, M.; Lv, H.; Lu, Y.; Wang, D.; Shi, S.; Li, R. Instantaneous discharge characteristics and its methane ignition mechanism of coal mine rock damage. Environ. Sci. Pollut. Res. 2022, 29, 62495–62506. [Google Scholar]
  8. Tian, Z.; Zhang, Z.; Deng, M.; Yan, S.; Bai, J. Gob-side entry retained with soft roof, floor, and seam in thin coal seams: A case study. Sustainability 2020, 12, 1197. [Google Scholar]
  9. Zhang, J.; Yang, F.; Zhang, R.; He, J.; Xie, Y.; Miao, Z.; Zhang, J. Experimental Research on Coal Seam Structure and Gas Occurrence Influencing Factors in Weijiadi Mine China. Fresenius Environ. Bull. 2022, 31, 74–80. [Google Scholar]
  10. Zhao, Y.; Luo, S.; Wang, Y.; Wang, W.; Zhang, L.; Wan, W. Numerical analysis of karst water inrush and a criterion for establishing the width of water-resistant rock pillars. Mine Water Environ. 2017, 36, 508–519. [Google Scholar]
  11. Brown, E.T. The mechanics of discontinua: Engineering in discontinuous rock masses. Aust. Geomech. J. 2004, 39, 51–72. [Google Scholar]
  12. Jaeger, J. Shear failure of anistropic rocks. Geol. Mag. 1960, 97, 65–72. [Google Scholar]
  13. Wang, F.; Zhang, C.; Wei, S.; Zhang, X.; Guo, S. Whole section anchor-grouting reinforcement technology and its application in underground roadways with loose and fractured surrounding rock. Tunn. Undergr. Space Technol. 2016, 51, 133–143. [Google Scholar] [CrossRef]
  14. Fan, X.; Kulatilake, P.H.S.W.; Chen, X. Mechanical behavior of rock-like jointed blocks with multi-non-persistent joints under uniaxial loading: A particle mechanics approach. Eng. Geol. 2015, 190, 17–32. [Google Scholar]
  15. Gui, Y.; Xia, C.; Ding, W.; Qian, X.; Du, S. A New Method for 3D Modeling of Joint Surface Degradation and Void Space Evolution Under Normal and Shear Loads. Rock Mech. Rock Eng. 2017, 50, 2827–2836. [Google Scholar]
  16. Lin, H.; Zhang, X.; Cao, R.; Wen, Z. Improved nonlinear Burgers shear creep model based on the time-dependent shear strength for rock. Environ. Earth Sci. 2020, 79, 149. [Google Scholar]
  17. Xie, S.; Lin, H.; Duan, H. A novel criterion for yield shear displacement of rock discontinuities based on renormalization group theory. Eng. Geol. 2023, 314, 107008. [Google Scholar]
  18. Xie, S.; Lin, H.; Duan, H.; Chen, Y. Modeling description of interface shear deformation: A theoretical study on damage statistical distributions. Constr. Build. Mater. 2023, 394, 132052. [Google Scholar]
  19. Zhao, Y.; Zhang, L.; Asce, F.; Liao, J.; Tang, L. Experimental Study of Fracture Toughness and Subcritical Crack Growth of Three Rocks under Different Environments. Int. J. Geomech. 2020, 20, 4020128. [Google Scholar]
  20. Han, L.; Lin, H.; Chen, Y.; Lei, D. Effects of strength property difference on shear strength of joint of binary media. Environ. Earth Sci. 2021, 80, 712. [Google Scholar]
  21. Shen, Y.; Wang, Y.; Yang, Y.; Sun, Q.; Luo, T.; Zhang, H. Influence of surface roughness and hydrophilicity on bonding strength of concrete-rock interface. Constr. Build. Mater. 2019, 213, 156–166. [Google Scholar]
  22. Dai, S.; Gong, Y.; Wang, F.; Hu, P. Experimental study on influential factors of shale permeability based on the gas pulse decay method. Fresenius Environ. Bull. 2019, 28, 6307–6313. [Google Scholar]
  23. Liu, S.; Nie, Y.; Hu, W.; Ashiru, M.; Li, Z.; Zuo, J. The Influence of Mixing Degree between Coarse and Fine Particles on the Strength of Offshore and Coast Foundations. Sustainability 2022, 14, 9177. [Google Scholar]
  24. Pan, Y.-H.; Qi, J.-R.; Zhang, J.-F.; Peng, Y.-X.; Chen, C.; Ma, H.-N.; Ye, C. A Comparative Study on Steady-State Water Inflow into a Circular Underwater Tunnel with an Excavation Damage Zone. Water 2022, 14, 3154. [Google Scholar]
  25. Sun, C.; Sun, M.; Tao, T.; Qu, F.; Wang, G.; Zhang, P.; Li, Y.; Duan, J. Chloride binding capacity and its effect on the microstructure of mortar made with marine sand. Sustainability 2021, 13, 4169. [Google Scholar]
  26. Sun, C.; Sun, M.; Tao, T.; Qu, F.; Wang, G.; Zhang, P.; Li, Y.; Duan, J. Chloride-binding capacity of mortars composed of marine sand subjected to external chloride penetration. J. Oceanol. Limnol. 2022, 40, 1462–1471. [Google Scholar]
  27. Wu, H.; Jia, Q.; Wang, W.; Zhang, N.; Zhao, Y. Experimental Test on Nonuniform Deformation in the Tilted Strata of a Deep Coal Mine. Sustainability 2021, 13, 13280. [Google Scholar]
  28. Yu, W.; Li, K.; Liu, Z.; An, B.; Wang, P.; Wu, H. Mechanical characteristics and deformation control of surrounding rock in weakly cemented siltstone. Environ. Earth Sci. 2021, 80, 337. [Google Scholar]
  29. Yuan, Z.; Zhao, J.; Li, S.; Jiang, Z.; Huang, F. A unified solution for surrounding rock of roadway considering seepage, dilatancy, strain-softening and intermediate principal stress. Sustainability 2022, 14, 8099. [Google Scholar]
  30. Zhang, R.; Tang, P.; Lan, T.; Liu, Z.; Ling, S. Resilient and Sustainability Analysis of Flexible Supporting Structure of Expansive Soil Slope. Sustainability 2022, 14, 12813. [Google Scholar]
  31. Zhao, Y.; Tang, J.; Chen, Y.; Zhang, L.; Wang, W.; Wan, W.; Liao, J. Hydromechanical coupling tests for mechanical and permeability characteristics of fractured limestone in complete stress–strain process. Environ. Earth Sci. 2017, 76, 24. [Google Scholar]
  32. Tang, W.; Lin, H.; Chen, Y.; Feng, J.; Hu, H. Mechanical characteristics and acoustic emission characteristics of mortar-rock binary medium. Buildings 2022, 12, 665. [Google Scholar]
  33. Tang, W.; Lin, H. Influence of dentate discontinuity height on shear properties of soft structure plane. J. Cent. South Univ. 2017, 48, 1300–1307. [Google Scholar]
  34. Tang, W.; Lin, H. Influence of Internal Friction Angle and Interface Roughness on Shear Behavior of Mortar-Rock Binary Medium Joint. Geotech. Geol. Eng. 2021, 39, 3917–3929. [Google Scholar]
  35. Shang, J.; Yokota, Y.; Zhao, Z.; Dang, W. DEM simulation of mortar-bolt interface behaviour subjected to shearing. Constr. Build. Mater. 2018, 185, 120–137. [Google Scholar]
  36. Sun, B.-J.; Liu, Q.-W.; Li, W.-T.; Yang, X.-Z.; Yang, B.; Li, T.-C. Numerical implementation of rock bolts with yield and fracture behaviour under tensile-shear load. Eng. Fail. Anal. 2022, 139, 106462. [Google Scholar]
  37. Yokota, Y.; Zhao, Z.; Nie, W.; Date, K.; Iwano, K.; Okada, Y. Experimental and Numerical Study on the Interface Behaviour Between the Rock Bolt and Bond Material. Rock Mech. Rock Eng. 2018, 52, 869–879. [Google Scholar]
  38. Cao, R.; Tang, W.; Lin, H.; Fan, X. Numerical Analysis for the Progressive Failure of Binary-Medium Interface under Shearing. Adv. Civ. Eng. 2018, 2018, 4197172. [Google Scholar]
  39. Mortara, G. A simple model for sand-structure interface behaviour. Geotech. Eng. 2020, 174, 33–43. [Google Scholar]
  40. Saberi, M.; Annan, C.D.; Konrad, J.M. Three-dimensional constitutive model for cyclic behavior of soil-structure interfaces. Soil Dyn. Earthq. Eng. 2020, 134, 106162. [Google Scholar]
  41. Zhou, J.; Zhou, C.; Feng, Q.; Gao, T. Analytical Model for Load-Transfer Mechanism of Rock-Socketed Drilled Piles: Considering Bond Strength of the Concrete–Rock Interface. Int. J. Geomech. 2020, 20, 04020059. [Google Scholar]
  42. Yu, B. Mechanical properties and binary-medium constitutive model for semi-through jointed mudstone samples. Int. J. Rock Mech. Min. Sci. 2020, 132, 104376. [Google Scholar] [CrossRef]
  43. Yan, Z.; Long, Z.; Qu, W. The effect of shear on the anchorage interface of rock slope with weak layers under earthquake. Rock Soil Mech 2019, 40, 2882–2890. [Google Scholar]
  44. Dong, W.; Yuan, W.; Zhang, B.; Zhong, H. Energy-Based Fracture Criterion of Rock–Concrete Interface Considering Viscoelastic Characteristics. J. Eng. Mech. 2022, 148, 04021155. [Google Scholar] [CrossRef]
Figure 1. Numerical models. (a) 8°. (b) 16°. (c) 23°. (d) 30°. (e) 36°. (f) 45°.
Applsci 13 08930 g001aApplsci 13 08930 g001b
Figure 2. Relationship between shear stress and shear displacement.
Applsci 13 08930 g002
Figure 3. The evolution process of the main strain under direct shear testing. (a) 0 mm. (b) 0.6 mm. (c) 0.8 mm. (d) 0.9 mm. (e) 0.95 mm. (f) 1.0 mm.
Applsci 13 08930 g003aApplsci 13 08930 g003b
Figure 4. Numerical simulation of the shear strain evolution process. (a) 0 mm. (b) 0.2 mm. (c) 0.4 mm. (d) 0.6 mm. (e) 0.8 mm. (f) 1.0 mm.
Applsci 13 08930 g004
Figure 5. Sample failure diagram. (a) Laboratory test. (b) Numerical simulation.
Applsci 13 08930 g005
Figure 6. Shearing stage diagram.
Applsci 13 08930 g006
Figure 7. Relationship between shear stress and shear displacement. (a) Sawtooth angle 8°. (b) Sawtooth angle 16°. (c) Sawtooth angle 23°. (d) Sawtooth angle 30°. (e) Sawtooth angle 36°. (f) Sawtooth angle 45°.
Applsci 13 08930 g007
Figure 8. Relationship between the k value and normal stress and sawtooth angle.
Applsci 13 08930 g008
Figure 9. Relationship between the peak shear displacement and normal stress and sawtooth angle.
Applsci 13 08930 g009
Figure 10. Binary medium interface failure mode diagram. (a) α = 8°, σ n = 0.5 MPa. (b) α = 30°, σ n = 0.5 MPa. (c) α = 16°, σ n = 3 MPa. (d) α = 45°, σ n = 4.5 MPa.
Applsci 13 08930 g010
Figure 11. Relationship between the shear strength and normal stress of the binary medium interface.
Applsci 13 08930 g011
Figure 12. Relationship between the shear strength parameters and sawtooth angle. (a) The relationship between cohesion and sawtooth angle. (b) Relationship between internal friction angle and sawtooth angle.
Applsci 13 08930 g012
Figure 13. Relationship between the residual shear strength and normal stress of the binary medium interface.
Applsci 13 08930 g013
Figure 14. Relationship between the residual shear strength parameters and sawtooth angle. (a) Relationship between the residual adhesion and sawtooth angle. (b) Relationship between the residual internal friction angle and sawtooth angle.
Applsci 13 08930 g014aApplsci 13 08930 g014b
Figure 15. The relationship between the strength degradation rate and sawtooth angle and normal stress.
Applsci 13 08930 g015
Table 1. Mortar strain softening parameters.
Plastic Strain00.0050.011
C/MPa3.120.640.480
ϕ 40322612
Table 2. Strain softening parameters of rock.
Plastic Strain00.0050.011
C/MPa97.22.71.8
ϕ 6148.839.718.3
Table 3. Material parameters.
MaterialE/GPaμC/MPa       ϕ   d n σ t /MPa γ /kN·m−3
mortar1.670.33.1240151.7619
rock160.21961286.227
Table 4. The k values of the interface of the binary medium with different sawtooth angles under different normal stresses.
Normal Stress/MPaSawtooth Angle 8°Sawtooth Angle 16°Sawtooth Angle 23°Sawtooth Angle 30°Sawtooth Angle 36°Sawtooth Angle 45°
0.17.1010.8213.4116.9319.0023.47
0.57.1011.2713.6417.6019.6023.93
1.07.0611.8213.9317.8720.1324.47
1.57.2112.3214.6718.4020.6725.00
2.07.6712.6115.0018.8721.2025.40
2.57.7913.0115.8019.221.4725.87
3.07.9913.3116.4719.8722.0026.20
3.58.1213.5717.0020.2722.4026.87
4.08.2013.6517.1320.6022.8027.20
4.58.3313.7317.0720.6023.4027.33
5.08.6013.6716.7320.2723.3327.60
Table 5. Relationship between the peak displacement of shear stress and sawtooth angle and normal stress.
Normal Stress
/MPa
Sawtooth
Angle 8°
Sawtooth
Angle 16°
Sawtooth
Angle 23°
Sawtooth
Angle 30°
Sawtooth
Angle 36°
Sawtooth
Angle 45°
0.10.200.270.370.850.950.92
0.50.200.810.800.841.040.91
1.00.200.850.820.860.950.93
1.50.640.890.850.931.040.94
2.00.90.870.880.941.070.95
2.50.910.90.950.971.092.11
3.01.020.940.950.971.092.17
3.50.980.960.951.011.112.22
4.01.350.971.011.112.052.42
4.51.380.971.041.502.202.45
5.01.411.461.051.552.302.31
Table 6. Shear strength parameters of mortar–rock interface.
Sawtooth Angle (°)Cohesion (MPa)Internal Frictional Angle (°)Correlation Coefficient R2
81.60224.4800.9894
161.98128.4840.994
232.41335.4170.9998
303.26236.6640.9979
364.67937.4740.9987
455.91539.1470.9986
Table 7. Residual shear strength parameters of mortar–rock interface index.
Sawtooth Angle (°)Residual Cohesion (MPa)Residual Angle of Internal Friction (°)Correlation Coefficient R2
81.60224.480.9894
161.98128.480.994
232.41335.420.9998
303.26236.660.9979
364.67937.470.9987
455.91539.150.9986
Disclaimer/Publisher’s Note: The statements, opinions and data contained in all publications are solely those of the individual author(s) and contributor(s) and not of MDPI and/or the editor(s). MDPI and/or the editor(s) disclaim responsibility for any injury to people or property resulting from any ideas, methods, instructions or products referred to in the content.

