Article

Study of Root Canal Length Estimations by 3D Spatial Reproduction with Stereoscopic Vision

1
Department of Endodontics, Kanagawa Dental University, Yokosuka 238-8580, Japan
2
Department of Liberal Arts Education, School of Dentistry, Kanagawa Dental University, Yokosuka 238-8580, Japan
*
Author to whom correspondence should be addressed.
Appl. Sci. 2023, 13(15), 8651; https://doi.org/10.3390/app13158651
Submission received: 19 June 2023 / Revised: 19 July 2023 / Accepted: 25 July 2023 / Published: 27 July 2023
(This article belongs to the Special Issue 3D Scene Understanding and Object Recognition)

Abstract

:
Extended Reality (XR) applications are considered useful for skill acquisition in dental education. In this study, we examined the functionality and usefulness of an application called “SR View for Endo” that measures root canal length using a Spatial Reality Display (SRD) capable of naked-eye stereoscopic viewing. Three-dimensional computer graphics (3DCG) data of dental models were obtained and output to both the SRD and conventional 2D display devices. Forty dentists working at the Kanagawa Dental University Hospital measured root canal length using both types of devices and provided feedback through a questionnaire. Statistical analysis using one-way analysis of variance evaluated the measurement values and time, while multivariate analysis assessed the relationship between questionnaire responses and measurement time. There was no significant difference in the measurement values between the 2D device and SRD, but there was a significant difference in measurement time. Furthermore, a negative correlation was observed between the frequency of device usage and the extended measurement time of the 2D device. Measurements using the SRD demonstrated higher accuracy and shorter measurement times compared to the 2D device, increasing expectations for clinical practice in dental education and clinical education for clinical applications. However, a certain percentage of participants experienced symptoms resembling motion sickness associated with virtual reality (VR).

1. Introduction

In medical education, there is a desire for an environment that enables the acquisition of both accurate knowledge and skills. To facilitate the acquisition of such knowledge and skills, technologies such as virtual reality (VR), which artificially creates spaces that can be experienced as if they were real, and augmented reality (AR), which overlays computer graphics (CG) onto real-world spaces, have been developed. The effectiveness of these technologies in medical education has been reported with head-mounted displays (HMD) in the form of goggles or glasses [1,2]. These technologies, including VR, AR, and mixed reality (MR), are collectively referred to as extended reality (XR). They allow the display of computer-generated images (CGI) in the wearer’s field of view, bridging the gap between the real world and virtual reality [3,4]. Anatomical training using VR, such as skull models and models of the middle and inner ear, has been shown to have comparable learning effects to conventional teaching methods in medical students [5,6]. Furthermore, VR has been shown to be an effective method for improving anatomical knowledge, while increasing learner motivation, compared to other educational approaches [7,8]. In addition, AR and MR have been shown to be superior to traditional methods for skill acquisition in the development of injection needle insertion techniques [9].
In dental education, the use of head-mounted displays (HMDs) to replicate VR and AR environments has allowed for the observation of areas not directly visible to the naked eye [10,11]. Furthermore, VR-based skill acquisition for maxillofacial surgery trainees has been found to be superior to traditional skill acquisition methods [12], and the use of AR for local anesthesia training for dental students has been reported to allow for faster task completion compared to traditional methods [13,14]. In addition, the acquisition of cavity preparation skills in conservative dentistry typically requires the consumption of tooth models with each training session, but the use of VR has still been shown to improve the efficiency of skill acquisition [15]. AR/VR applications have been evaluated as being accessible without time constraints and are capable of providing comprehensive educational support to students in undergraduate and graduate dental education [16]. However, skill acquisition devices for dental practice, such as those represented by Simodont (MOOG, Nieuwegein, The Netherlands), have been reported to be prohibitively expensive, thus posing a challenge for widespread adoption [17].
On the other hand, head-mounted displays (HMD), which are wearable devices, allow for accurate stereoscopic viewing, but they require the interpupillary distance (IPD) to be adjusted for each user and to be reflected in the device [18]. It has also been reported that even after wearing the HMD, differences in the sense of physical distance to objects within the field of view can be perceived [19]. Furthermore, fatigue has been observed when using HoloLens as an HMD due to its 500 g weight, making it less suitable for long-term training [20].
In 2020, a high-resolution stereoscopic display (SRD: Sony, ELF-SR1, Tokyo, Japan, 2020) was developed that allows a naked-eye viewing of three-dimensional images without the need for any device attachments. In dental education, the use of the SRD for the practical training of head and neck anatomy among dental students showed a correlation between the comprehension of anatomical knowledge and the amount of information displayed on the SRD [21]. In addition, the SRD has been reported to have the potential to reduce the effects of convergence and adaptation problems associated with conventional HMDs [22].
Our aim was to investigate the application of 3D computer graphics (3DCG) in the initial measurement of root canal treatment in endodontics. Root canal length measurement is performed by two reliable methods: electronic apex locators and dental radiography. Electronic apex locators were developed in 1958 and have undergone improvements in accuracy and miniaturization [23,24,25]. However, electronic apex locators cannot be used in patients with cardiac pacemakers, and try-in radiographic imaging cannot provide accurate measurements if the anatomical apical foramen is not aligned with the apex [26]. CT/CBCT data are output as DICOM (Digital Imaging and Communications in Medicine) data, which are the international standard for medical data communication. The 3D models of DICOM data are typically displayed on 2D devices. Performing root canal length measurements using applications on 2D devices requires the user to manually set the maximum axial length and cross-section of the tooth, which can be a cumbersome process.
In this study, we performed region segmentation using 3D medical image segmentation software on the DICOM data of dental models, which were obtained by conventional clinical dental techniques. The segmented models were then converted into 3D computer graphics (3DCG) and displayed on a spatial reproduction display to determine the accuracy of stereoscopic content perception without wearing a head-mounted display (HMD). We used an application called “SR View for Endo”, which enables three-dimensional visualization and measurement of root canal length by understanding the three-dimensional morphology of the root canal. SR View for Endo was newly developed for this study. In this study, we analyzed the accuracy and usefulness of root canal length measurements by using a naked-eye stereoscopic display of 3DCG root canal models.

2. Materials and Methods

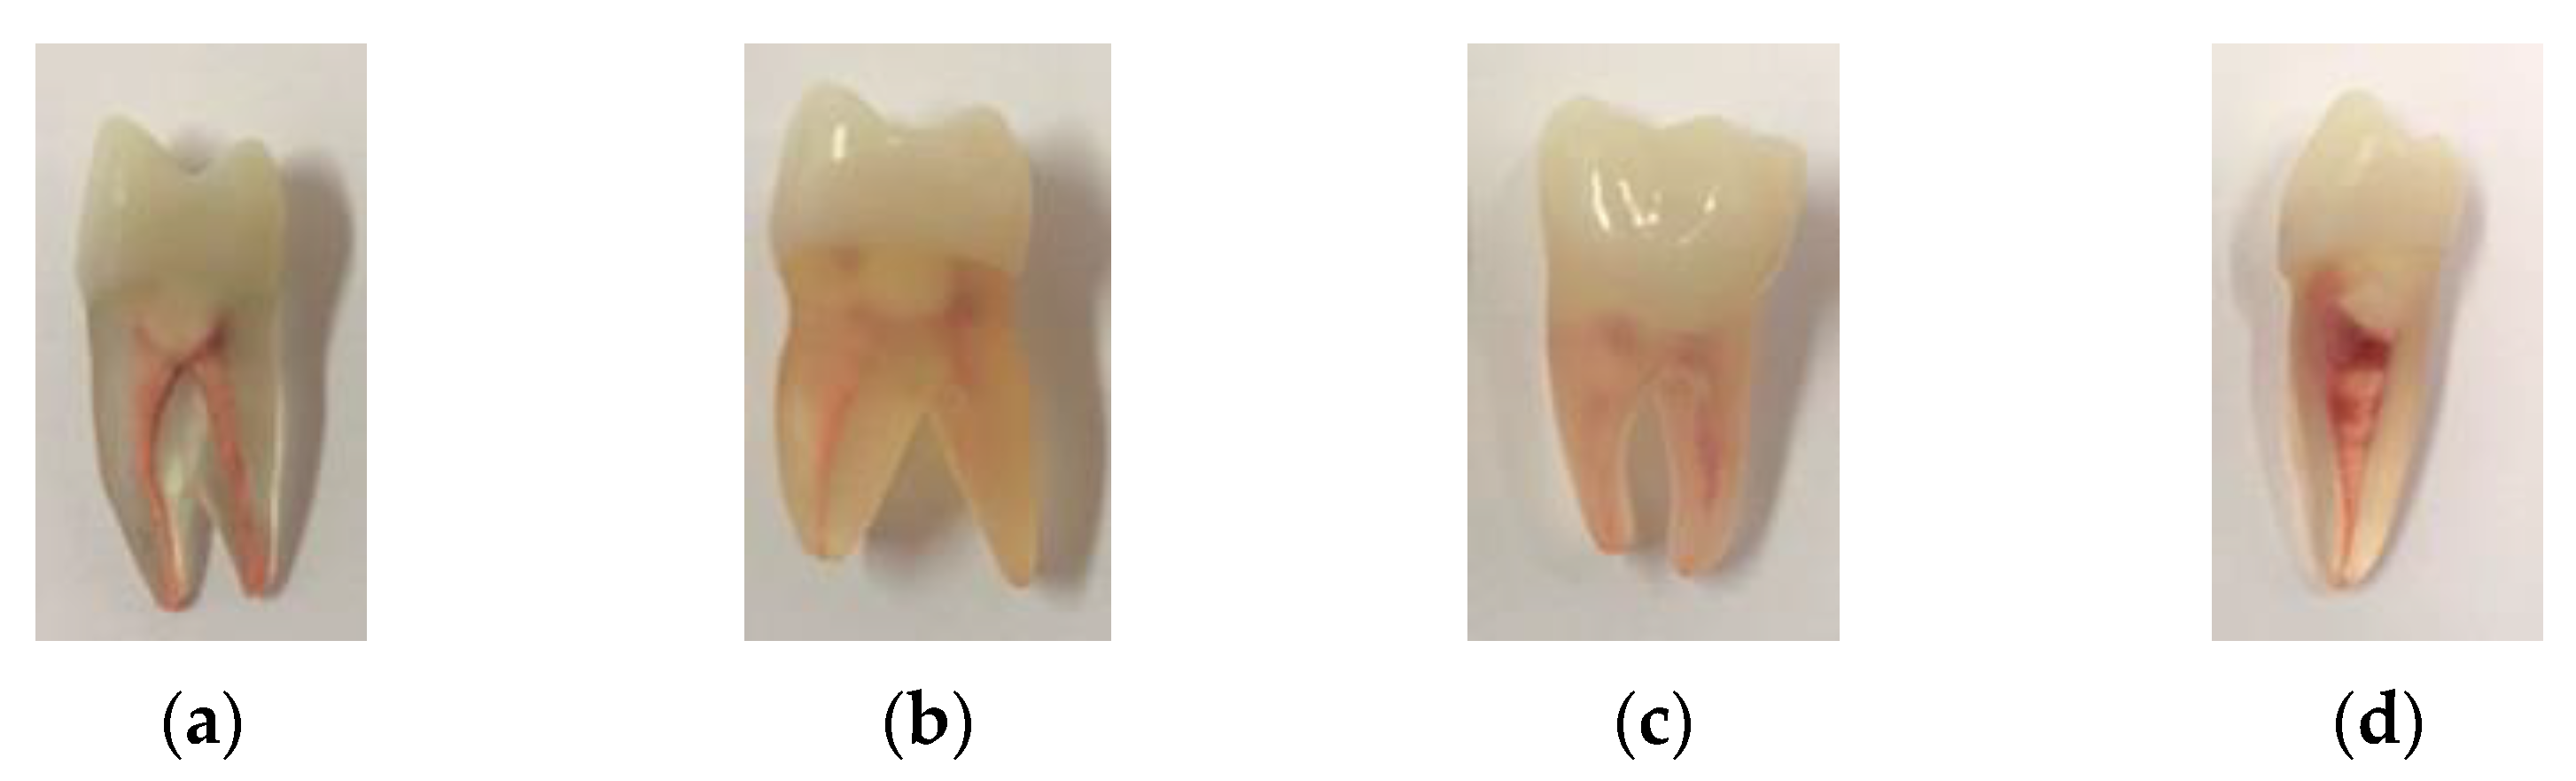
2.1. Construction of Dental Models

In this study, we used four root canal training models with different root canal morphologies, including maxillary first premolar (FDI, #24), maxillary first molar (FDI, #26), mandibular first premolar (FDI, #36), and mandibular first molar (FDI, #44) (provided by NISSIN, Tokyo, Japan (Figure 1)). All models were tested after completion of the pulp chamber access from the coronal side. The tooth models were acquired using a head X-ray CT unit, i.e., a 3D Accuitomo (3DAccuitomo; J Morita Mfg. Corp., Kyoto, Japan). Imaging was performed in a 360° diameter area of 4 cm × 4 cm, which was the most accurate condition. To minimize artifacts on the tooth models, the imaging was performed with a tube voltage of 70 kV and a tube current of 5 mA, and the data were output as DICOM files.

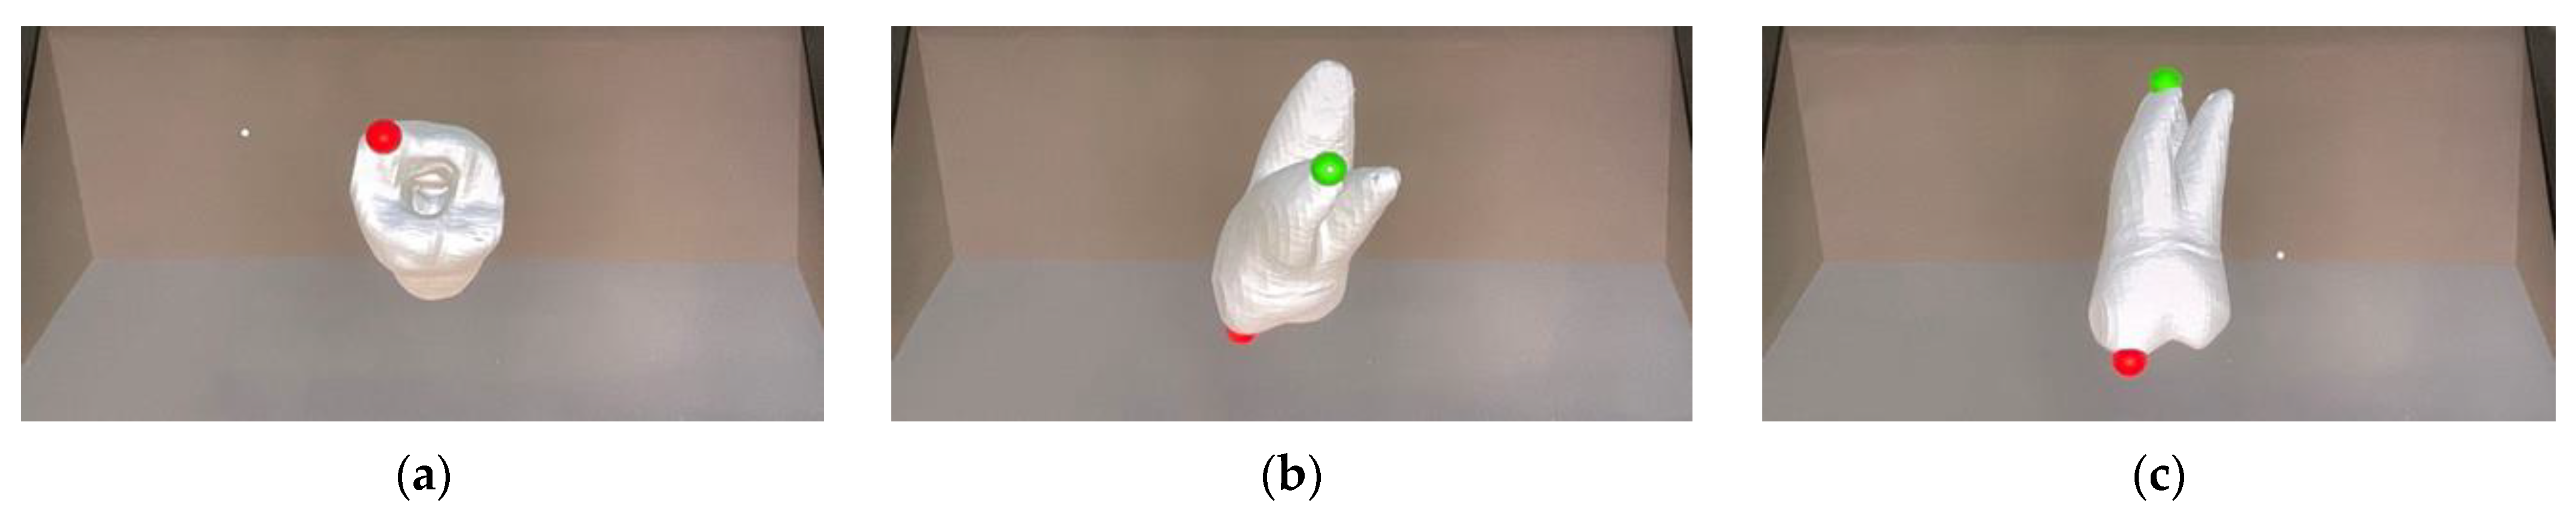
2.2. Construction of a Three-Dimensional Space Reproduction (3DCG) Environment Using SRD

The output DICOM data were segmented into regions using Materialise Mimics (Materialise NV, Leuven, Belgium), a 3D medical imaging segmentation software. The segmented tooth models were then converted to OBJ data. The tooth models in OBJ format were used to create an application to output to SRD using Unity (14.4.2019) [27].

2.3. Software “SR View for Endo”

The OBJ data of the tooth, displayed as a 3D model in SRD, allows for the easy manipulation of movement, scaling, and rotation with the mouse, thus enabling linear distance measurements with “SR View for Endo” (Figure 2). In this study, the experiment was purposely conducted in the opaque setting, because the measurer needed to arbitrarily select on the surface of the 3D model. With “SR View for Endo” it is possible to select any surface of the displayed 3D model and to set measurement reference points on this surface. By placing two arbitrary points on the surface of the 3D model, the linear distance between these two points is displayed. The actual measurement technique with SRD was performed according to the following steps: the “SR View for Endo” application was initiated. To avoid bias during evaluation, the measured values were hidden by pressing the “P” key. Tooth models were selected using the “Space” key. The display could be manipulated to any position, angle, and size by using the mouse. After adjusting the size and angle of the 3D model, the first reference point was set by right-clicking. Then, the angle was readjusted, and the second reference point was set by another right click. After setting the two reference points, the measurement value was displayed and recorded. This operation was performed for each tooth model, and the order of display for the tooth models was randomized.

2.4. Conventional 2D Devices

The traditional 2D device is an application that displays 3D models on a regular PC display. Measurements with the 2D device involve displaying four screens: X-axis, Y-axis, Z-axis, and reconstructed image (Figure 3). The actual measurements with the 2D device were performed using the following procedure. To display the slice planes of the first and second reference points on the X-axis screen and the Z-axis screen of the 2D device screen, the slice planes on the X-axis screen or the Z-axis screen were adjusted, and the other axis screen was fine-tuned. The accuracy of the measurement position was confirmed, and the first and second reference points were set by selecting the tool icons. The measurement values were then displayed and recorded. This operation was performed on each dental model, and the display order of the dental models was randomized.

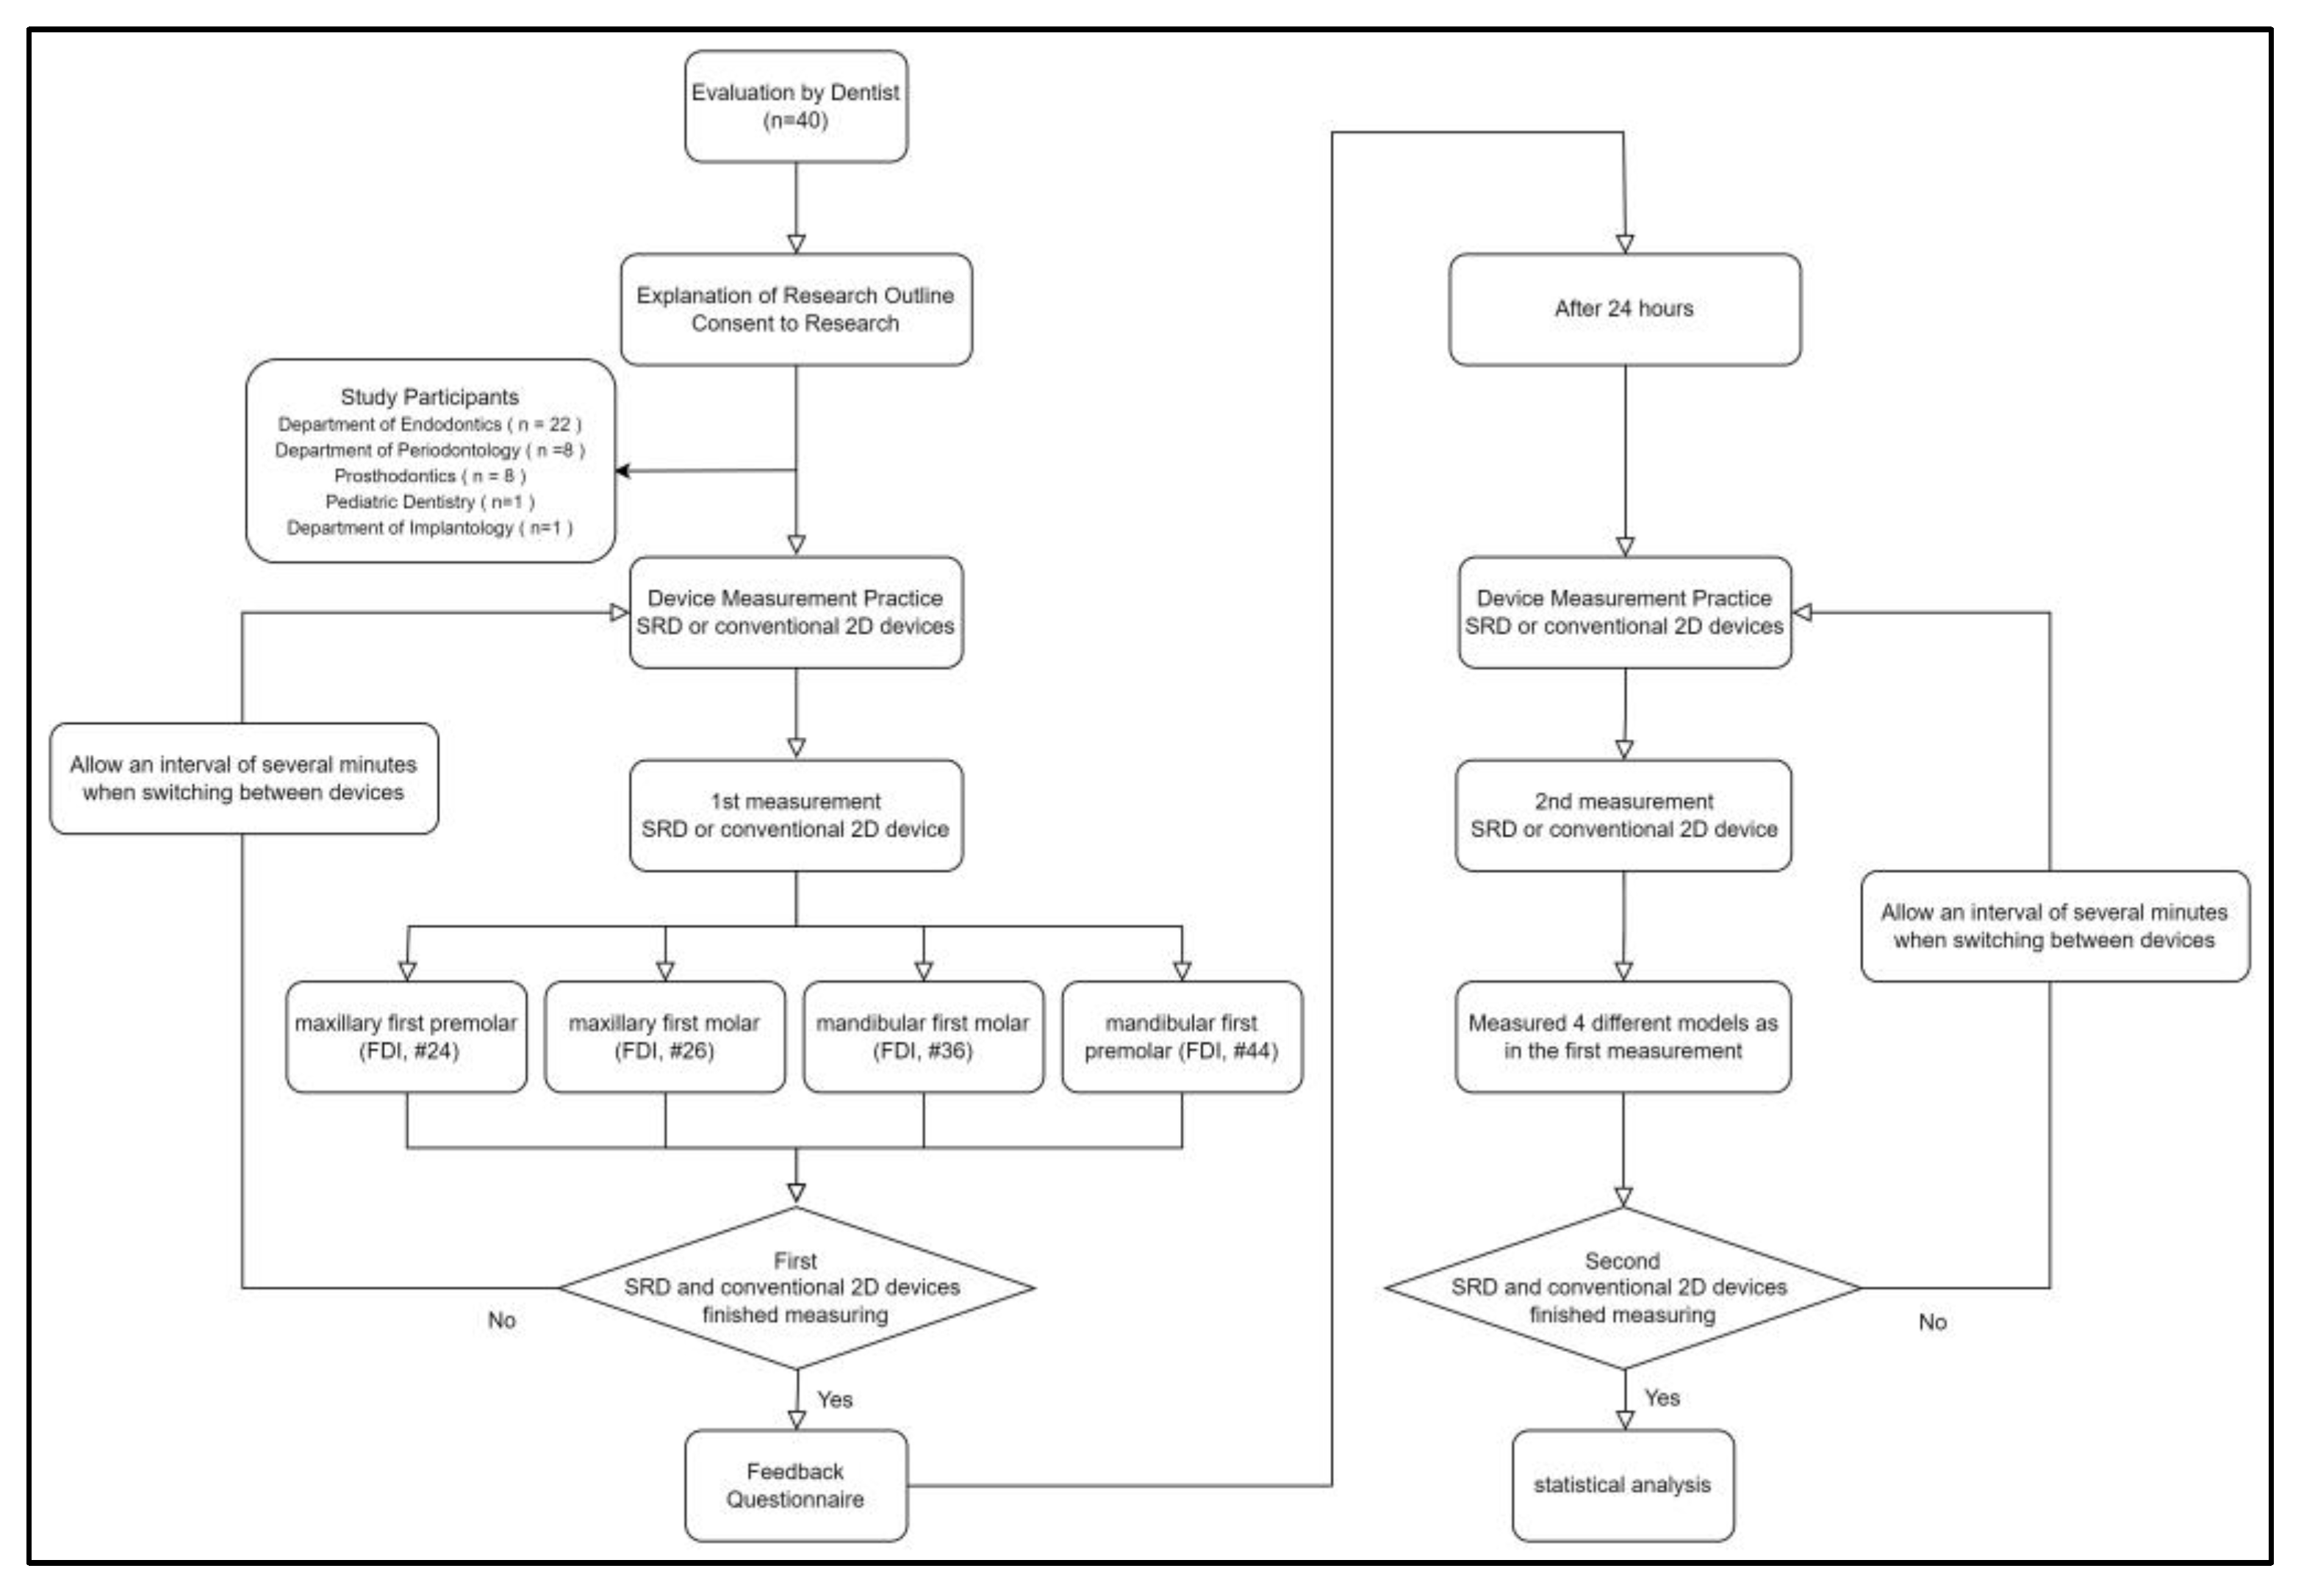
2.5. Evaluation by Dentists

The measurement evaluation was conducted by randomly selecting 40 dentists from Kanagawa Dental University Hospital who had no visual impairment and no previous experience with SRD. The evaluators performed measurements using both the conventional 2D device and SR View for Endo. The order of measurement was randomized, and the graders were trained until they were satisfied. Measurements were taken for root canal measurement and the measurement time. An interval of several minutes was provided when changing measurement applications. To avoid bias during the measurement, the evaluators were not allowed to see the measurement results. In addition, to ensure measurement reliability, two measurements were performed for each evaluator with an interval of at least 24 h. A feedback questionnaire was administered after the first measurement (Figure 4). This study was reviewed and approved by the Research Ethics Committee of Kanagawa Dental University (approval number: 897).

2.6. Statistical Processing

For the objective evaluations, the measured values of root canal length and its measurement time were aggregated, and normality was confirmed using the Kolmogorov–Smirnov test. In addition, intraclass correlation coefficients (ICCs) and their 95% confidence intervals were calculated to assess the intra-rater reliability. A Bland–Altman analysis was also performed to confirm agreement. A comparison of differences in scores and measurement time was then performed using one-way ANOVA, followed by the Bonferroni post hoc test.
For the subjective assessments, the Likert scale and free-text responses from the feedback questionnaire administered after the first measurement with the SRD and 2D devices were analyzed. The free-text responses were classified using topic modeling through text mining.
For the tooth model with the lowest standard deviation of measurement time, the correlation between the first measurement time with the 2D device and age, gender, frequency of 2D device use, and self-rated eye fatigue in the feedback questionnaire was analyzed using Spearman’s rank correlation coefficient. Independent variables were used for age, gender, and the frequency of 2D device use. Age was coded as 0 for less than 30 years, 1 for 30–39 years, and 2 for 40 years and older. Gender was coded as 0 for female and 1 for male. The frequency of 2D device use was coded as 0 for first-time users, 1 for occasional users, 2 for monthly users, and 3 for weekly users. All statistical analyses were performed using IBM SPSS Statistics version 28.0, with a 5% significance level.

3. Results

3.1. Consistency among Measurers

In this study, a group of 40 dentists that consisted of 32 males and 8 females was randomly selected. Intra-rater reliability was assessed using the intraclass correlation coefficient (ICC) for the two measurements made by each of the 40 individuals. It was confirmed that there were no reliability problems for the two measurements by each rater (ICC ≥ 0.606) (Table 1). In addition, a visual confirmation of agreement using Bland–Altman analysis revealed results within the limits of agreement (LOA) for all 40 subjects with the SRD (Figure 5), and for 38 of 40 subjects with the 2D device (Figure 6).

3.2. Objective Evaluation

The group of 40 randomly selected subjects consisted of 32 males and 8 females. For each subject, the mean root canal length measurements and corresponding measurement times were calculated for four different tooth types using SRD and an existing 2D viewer. The normality of the continuous variables was confirmed using the Kolmogorov–Smirnov test. Table 2 shows the measurement results and times for SRD and the existing 2D device for each tooth type. The average differences between the first and second measurements were within 0.02 mm for the four tooth types with the SRD, and within 0.03 mm with the 2D device. The tooth type with the lowest standard deviation was tooth #24 for both the SRD and the 2D device. The average differences between the first and second measurements were within 6.26 s for the SRD and 4.98 s for the 2D device. The tooth type with the lowest standard deviation was tooth #24 for both the SRD and the 2D device.
When comparing the differences between the first and second measurements for the SRD and the 2D unit (four measurements in total) for the four tooth models, no significant differences were observed in the one-way ANOVA analysis (p ≥ 0.05). However, when comparing the differences in measurement time (four measurements in total), significant differences were found by one-way ANOVA (p < 0.05). Therefore, subsequent pairwise comparisons using the Bonferroni method showed significant differences between the SRD and the 2D device for all four tooth models, regardless of the first or second measurement.

3.3. Subjective Evaluation

The Likert scale feedback questionnaire administered after the first measurement with SRD and 2D devices showed high ratings for the evaluations related to stereoscopic vision (mean rating 9.4/10), image delay (mean rating 9.3/10), and their use in clinical and educational settings (mean rating 9.3/10). These ratings were consistently above 9 on average. Ratings with some variabilities were observed for motion sickness (mean rating 7.9/10) and eye fatigue (mean rating 7.4/10), with the lowest rating of 3 points for eye fatigue (Table 3).
Open-ended responses were received from 24 of the 40 participants. After categorizing the responses using topic modeling, the identified problems with SRD use included six cases related to operability, four cases related to eye fatigue, two cases related to motion sickness, and four other cases. The reported benefits included 10 cases related to depth perception, 5 cases related to clinical education for clinical application, 4 cases related to operability, and 3 cases related to educational application. Suggestions for improvement included five cases to improve operability, four cases to improve image quality, and four cases to explore applications in other fields.

3.4. Multivariate Analysis

For Model #24, which had the smallest standard deviation in measurement time, the relationship between the first measurement time was obtained by using the 2D device, and the various factors were analyzed using Spearman’s rank correlation. As a result, a significant negative correlation was observed between the frequency of 2D device use and measurement time (correlation coefficient = −0.358) (Table 4).

4. Discussion

In this study, we developed an application, which is capable of viewing computer-generated 3D images, for root canal length measurement using a naked-eye stereoscopic display (SRD). We performed both objective evaluations of measurement accuracy and subjective evaluations, such as eye fatigue.
For the objective evaluation, we compared the measurement values and measurement times for four different tooth models with different root canal morphologies. There was no significant difference in measurements between the SRD and the 2D device. The Bland–Altman analysis showed that the SRD had a lower standard deviation (SD) of measurements compared to the 2D device. Previous studies have reported measurement accuracy errors of 0.02–0.59 mm for dental arch models when using SRD, indicating the possibility of an accurate 3D computer-generated stereoscopic model display [22]. In our study, the measurement range (maximum value minus minimum value) for the four different dental models ranged from 0.16 to 0.62 mm. We also evaluated the measurement method by measuring the four different tooth models with different morphologies. The #44 tooth model was found to be the easiest to measure. When measuring tooth models, it is necessary to set the first reference point on the occlusal surface and the second reference point at the root canal apex. The #44 tooth model has one cusp and one root canal, which makes its morphology particularly straightforward, and the difficulty of measurement is low. However, the Bland–Altman analysis showed that the #44 tooth model had the highest number of measurements that deviated from the limits of agreement (LOA). This is believed to be due to the specific measurement method of the 2D device and the morphology of the #44 tooth model. Typically, when measuring a 3D model with a 2D device, all three axis planes (X, Y, and Z) must be displayed simultaneously, and the central axis is set on each axis plane. Since this study was limited to root canal length measurements, the measurement on the y-axis, which is the long axis, becomes important. Therefore, if the y-axis measurement is performed without adjusting the x and z axes from the condition captured by the cone beam computed tomography (CBCT), it becomes impossible to set the maximum cusp point on the occlusal surface. Tooth Model #44 has a cusp and a root canal; thus, it was initially measured without adjusting the axes, which may have resulted in misalignment due to the examiner’s assumptions when setting the reference points. As a result, using the SRD for measurements created a sense that the tooth model being measured was right in front of the examiner, thus reducing the measurement errors that are caused by examiner assumptions.
On the other hand, the #26 tooth model (Figure 1b) presented measurement difficulties. To measure the maximum long axis during the root canal length setting in the #26 tooth model, it was necessary to select one of the three cusps as the first reference point and one of the three root canals as the second reference point, which made it more difficult. Therefore, with the 2D unit, all axis planes had to be adjusted from the initial setup. However, only one measurement deviated from the limits of agreement (LOA) according to Bland–Altman analysis. Tooth models identified as morphologically challenging had fewer measurement errors, suggesting that the measurement reference plane and reference point adjustments could be considered. Although there was no statistically significant difference in measurement values between the SRD and the 2D device, the consistency of measurement values in the Bland–Altman analysis suggested that the measurement environment specific to the 2D device induced psychological assumptions in the examiner and resulted in larger error ranges.
Measurement time showed a significant difference between the SRD and the 2D device for the first and second measurements. The average difference in measurement time between the devices was approximately 30 s for all tooth models. Root canal length measurements using the SRD were found to be more accurate and faster than conventional 2D devices. The shortest measurement time was 6.48 s for the second measurement of the #24 tooth model when using the SRD. The #24 tooth model has two cusps and a root canal, making it moderately challenging morphologically, but the angle of the cusp apex used as the measurement reference was acute, making it easier to set the reference point. The average measurement time followed a similar pattern to the morphological difficulty, with the #44 tooth model being the fastest, followed by #24, #36, and #26, indicating that measurements using the SRD are influenced by the morphological difficulty, which affects the measurement time. The factors contributing to the longer measurement time with the 2D unit are believed to be influenced by the specific measurement method of the 2D unit. The measurement procedure with the SRD involves enlarging the image and aligning the axis plane with the occlusal surface to set the first reference point. Then, the axis plane is aligned with the anatomical apical foramen to set the second reference point, which requires approximately five mouse clicks. On the other hand, when measuring with the 2D unit, the slice planes for the first and second reference points, which represent the maximum long axis on the y axis, are first displayed on the screen using the x and y axes. Adjusting one axis causes a shift in the other axis plane, requiring the examiner to make fine adjustments one plane at a time, which increases the measurement time. In addition, the synchronized display of the slice planes during the basic adjustment process places a load on the PC, resulting in operational delays. When adjusting one axis at a time, a shift occurs on the other axis plane, causing the measurement time to be extended as the examiner repeatedly fine-tunes one screen at a time. Additionally, during the operation of basic adjustments, the synchronization of the slice plane for display puts a load on the PC, resulting in operational delays. Furthermore, the influence of factors that extend the measurement time of 2D devices was suggested to have an impact on familiarity, as a weak negative correlation with the frequency of 2D device usage was observed in the first measurement time for the #24 tooth model.
In terms of subjective evaluation, feedback questionnaires were administered to assess the evaluation of tooth model measurements that were obtained by the examiners using the SRD. The Likert scale included in the feedback questionnaire referenced survey items evaluating the user experience by displaying endoscopic images on HoloLens [28]. The evaluation using the Likert scale indicated that sufficient stereoscopic vision was achievable, and technical issues such as video latency were resolved. The evaluations through using the SRD regarding the sense of depth and the image latency were obtained in skull models [21] and dental arch models [22], but evaluations specific to root canal morphology in tooth models were not identified. This study successfully obtained the evaluations of tooth models. However, the evaluation of image quality yielded lower results (average rating of 7.9/10). This is believed to be due to the segmentation of the STL data that were extracted from the DICOM data. Since it was technically challenging to directly display DICOM data on the SRD in this study, segmentation and OBJ conversion with the use of Mimics were necessary. To improve image quality, it is expected that improvements will be made to enable the direct input of DICOM data into the SRD for measurement, enhancing convenience by improving image quality and eliminating the need for measurement preparation.
On the other hand, concerns about VR sickness have been raised in the application of VR technology. The main symptoms of VR sickness include eye strain and simulator sickness [29], and the most commonly used method to subjectively assess VR sickness is the Simulator Sickness Questionnaire (SSQ) [30]. The SRD used in this study is an SR technology classified as XR technology, but there was concern that symptoms similar to VR sickness might occur. Therefore, the ratings related to eye strain and simulator sickness in the SSQ questionnaire were examined. In the feedback questionnaire, 21% of respondents rated simulator sickness as 5 or lower, and 26% reported experiencing simulator sickness, suggesting the presence of symptoms similar to VR sickness in SR technology.
In the evaluations related to future applications in education and clinical practice, the satisfaction rate (rating of 6 or higher) was 100% on the Likert scale, indicating the potential usefulness of the SRD. Furthermore, in the open-ended responses, in addition to root canal length measurements, responses were obtained regarding the treatment explanations that were based on root canal morphology, which were obtained through preoperative 3DCG, and the desire to use it for student education. On the other hand, the topic modeling analysis of negative feedback identified three issues: usability, eye strain, and simulator sickness. Regarding usability, direct suggestions for improvement were made, such as adding a user interface (UI) to allow for the modification of the tooth models and for improving the size of the reference point display during measurements.

5. Conclusions

In this study, we developed an application called “SR View for Endo” that allows the examiner to freely adjust the angle and magnification while stereoscopically viewing 3D computer-generated graphics (3DCG) without the need for special glasses. The application automatically tracks the model’s surface based on predefined measurement reference points. We conducted a functional analysis of this application. The results showed that it provided rapid and accurate measurements compared to conventional 2D devices. Using tooth models with different morphologies revealed a reduction in measurement errors caused by cognitive biases associated with morphological difficulty. Subjectively, the application received positive evaluations from dental professionals in terms of its ability to display stereoscopic perception without the need for glasses, making it suitable for educational and clinical education for clinical applications. However, some participants experienced eye fatigue and motion sickness to a certain extent. In the future, when utilizing stereoscopic rendering display (SRD) for dental education and clinical education for clinical applications, it is recommended to explain the symptoms of VR sickness and advise users to discontinue usage if they experience discomfort. Furthermore, there is a need to develop an application that allows direct measurement using DICOM data to improve image quality. This study is a feasibility study, so in order to ensure practicality in a clinical setting, software improvement and hardware development are necessary.

Author Contributions

Conceptualization, T.T. and N.M.; methodology, T.T.; software, T.I. and A.N.; validation, T.T., N.M. and N.T.-I.; formal analysis, T.T.; investigation, T.T.; resources, T.T., T.I., A.N. and N.M.; data curation, T.T.; writing—original draft preparation, T.T.; writing—review and editing, T.T., N.T.-I. and N.M.; visualization, T.T.; supervision, T.T., T.I. and N.M.; project administration, N.M. All authors have read and agreed to the published version of the manuscript.

Funding

This research received no external funding.

Institutional Review Board Statement

This study was conducted according to the guidelines of the Declaration of Helsinki and was approved by the Institutional Ethics Committee of Kanagawa Dental University (no. 723).

Informed Consent Statement

Informed consent was obtained from all subjects involved in this study.

Data Availability Statement

All data are available upon request.

Conflicts of Interest

The authors declare no conflict of interest.

References

  1. Pottle, J. Virtual reality and the transformation of medical education. Future Health J. 2019, 6, 181–185. [Google Scholar] [CrossRef] [PubMed] [Green Version]
  2. Barteit, S.; Lanfermann, L.; Barnighausen, T.; Neuhann, F.; Beiersmann, C. Augmented, Mixed, and Virtual Reality-Based Head-Mounted Devices for Medical Education: Systematic Review. JMIR Serious Games 2021, 9, e29080. [Google Scholar] [CrossRef] [PubMed]
  3. Zhang, J.; Lu, V.; Khanduja, V. The impact of extended reality on surgery: A scoping review. Int. Orthop. 2023, 47, 611–621. [Google Scholar] [CrossRef]
  4. Kamphuis, C.; Barsom, E.; Schijven, M.; Christoph, N. Augmented reality in medical education? Perspect. Med. Educ. 2014, 3, 300–311. [Google Scholar] [CrossRef] [PubMed] [Green Version]
  5. Chen, S.; Zhu, J.; Cheng, C.; Pan, Z.; Liu, L.; Du, J.; Shen, X.; Shen, Z.; Zhu, H.; Liu, J.; et al. Can virtual reality improve traditional anatomy education programmes? A mixed-methods study on the use of a 3D skull model. BMC Med. Educ. 2020, 20, 395. [Google Scholar] [CrossRef]
  6. Gnanasegaram, J.J.; Leung, R.; Beyea, J.A. Evaluating the effectiveness of learning ear anatomy using holographic models. J. Otolaryngol. Head Neck Surg. 2020, 49, 63. [Google Scholar] [CrossRef]
  7. Zhao, J.; Xu, X.; Jiang, H.; Ding, Y. The effectiveness of virtual reality-based technology on anatomy teaching: A meta-analysis of randomized controlled studies. BMC Med. Educ. 2020, 20, 127. [Google Scholar] [CrossRef]
  8. Zackoff, M.W.; Real, F.J.; Cruse, B.; Davis, D.; Klein, M. Medical Student Perspectives on the Use of Immersive Virtual Reality for Clinical Assessment Training. Acad. Pediatr. 2019, 19, 849–851. [Google Scholar] [CrossRef]
  9. Gerup, J.; Soerensen, C.B.; Dieckmann, P. Augmented reality and mixed reality for healthcare education beyond surgery: An integrative review. Int. J. Med. Educ. 2020, 11, 1–18. [Google Scholar] [CrossRef] [Green Version]
  10. Reymus, M.; Liebermann, A.; Diegritz, C. Virtual reality: An effective tool for teaching root canal anatomy to undergraduate dental students—A preliminary study. Int. Endod. J. 2020, 53, 1581–1587. [Google Scholar] [CrossRef]
  11. Elbashti, M.E.; Itamiya, T.; Aswehlee, A.M.; Sumita, Y.I.; Ella, B.; Naveau, A. Augmented Reality for Interactive Visualization of 3D Maxillofacial Prosthetic Data. Int. J. Prosthodont. 2020, 33, 680–683. [Google Scholar] [CrossRef]
  12. Pulijala, Y.; Ma, M.; Pears, M.; Peebles, D.; Ayoub, A. Effectiveness of Immersive Virtual Reality in Surgical Training-A Randomized Control Trial. J. Oral. Maxillofac. Surg. 2018, 76, 1065–1072. [Google Scholar] [CrossRef] [Green Version]
  13. Mladenovic, R.; Dakovic, D.; Pereira, L.; Matvijenko, V.; Mladenovic, K. Effect of augmented reality simulation on administration of local anaesthesia in paediatric patients. Eur. J. Dent. Educ. 2020, 24, 507–512. [Google Scholar] [CrossRef]
  14. Mladenovic, R.; Pereira, L.A.P.; Mladenovic, K.; Videnovic, N.; Bukumiric, Z.; Mladenovic, J. Effectiveness of Augmented Reality Mobile Simulator in Teaching Local Anesthesia of Inferior Alveolar Nerve Block. J. Dent. Educ. 2019, 83, 423–428. [Google Scholar] [CrossRef] [Green Version]
  15. Vincent, M.; Joseph, D.; Amory, C.; Paoli, N.; Ambrosini, P.; Mortier, E.; Tran, N. Contribution of Haptic Simulation to Analogic Training Environment in Restorative Dentistry. J. Dent. Educ. 2020, 84, 367–376. [Google Scholar] [CrossRef]
  16. Joda, T.; Gallucci, G.O.; Wismeijer, D.; Zitzmann, N.U. Augmented and virtual reality in dental medicine: A systematic review. Comput. Biol. Med. 2019, 108, 93–100. [Google Scholar] [CrossRef]
  17. Clemente, M.P.; Moreira, A.; Pinto, J.C.; Amarante, J.M.; Mendes, J. The Challenge of Dental Education After COVID-19 Pandemic—Present and Future Innovation Study Design. Inquiry 2021, 58, 469580211018293. [Google Scholar] [CrossRef] [PubMed]
  18. Condino, S.; Turini, G.; Parchi, P.D.; Viglialoro, R.M.; Piolanti, N.; Gesi, M.; Ferrari, M.; Ferrari, V. How to Build a Patient-Specific Hybrid Simulator for Orthopaedic Open Surgery: Benefits and Limits of Mixed-Reality Using the Microsoft HoloLens. J. Healthc. Eng. 2018, 2018, 5435097. [Google Scholar] [CrossRef] [PubMed] [Green Version]
  19. McKnight, R.R.; Pean, C.A.; Buck, J.S.; Hwang, J.S.; Hsu, J.R.; Pierrie, S.N. Virtual Reality and Augmented Reality-Translating Surgical Training into Surgical Technique. Curr. Rev. Musculoskelet. Med. 2020, 13, 663–674. [Google Scholar] [CrossRef]
  20. Lu, S.; Sanchez Perdomo, Y.P.; Jiang, X.; Zheng, B. Integrating Eye-Tracking to Augmented Reality System for Surgical Training. J. Med. Syst. 2020, 44, 192. [Google Scholar] [CrossRef] [PubMed]
  21. Itamiya, T.; To, M.; Oguchi, T.; Fuchida, S.; Matsuo, M.; Hasegawa, I.; Kawana, H.; Kimoto, K. A Novel Anatomy Education Method Using a Spatial Reality Display Capable of Stereoscopic Imaging with the Naked Eye. Appl. Sci. 2021, 11, 7323. [Google Scholar] [CrossRef]
  22. Ariwa, M.; Itamiya, T.; Koizumi, S.; Yamaguchi, T. Comparison of the Observation Errors of Augmented and Spatial Reality Systems. Appl. Sci. 2021, 11, 12076. [Google Scholar] [CrossRef]
  23. Kobayashi, C. Electronic canal length measurement. Oral Surg. Oral Med. Oral Pathol. Oral Radiol. Endod. 1995, 79, 226–231. [Google Scholar] [CrossRef]
  24. Nekoofar, M.H.; Ghandi, M.M.; Hayes, S.J.; Dummer, P.M. The fundamental operating principles of electronic root canal length measurement devices. Int. Endod. J. 2006, 39, 595–609. [Google Scholar] [CrossRef] [PubMed]
  25. Tsesis, I.; Blazer, T.; Ben-Izhack, G.; Taschieri, S.; Del Fabbro, M.; Corbella, S.; Rosen, E. The Precision of Electronic Apex Locators in Working Length Determination: A Systematic Review and Meta-analysis of the Literature. J. Endod. 2015, 41, 1818–1823. [Google Scholar] [CrossRef] [PubMed]
  26. Martins, J.N.; Marques, D.; Mata, A.; Carames, J. Clinical efficacy of electronic apex locators: Systematic review. J. Endod. 2014, 40, 759–777. [Google Scholar] [CrossRef]
  27. Unity. Available online: https://unity.com/ja (accessed on 7 July 2023).
  28. Al Janabi, H.F.; Aydin, A.; Palaneer, S.; Macchione, N.; Al-Jabir, A.; Khan, M.S.; Dasgupta, P.; Ahmed, K. Effectiveness of the HoloLens mixed-reality headset in minimally invasive surgery: A simulation-based feasibility study. Surg. Endosc. 2020, 34, 1143–1149. [Google Scholar] [CrossRef] [Green Version]
  29. LaViola, J.J. A discussion of cybersickness in virtual environments. ACM SIGCHI Bull. 2000, 32, 47–56. [Google Scholar] [CrossRef]
  30. Chang, E.; Kim, H.T.; Yoo, B. Virtual Reality Sickness: A Review of Causes and Measurements. Int. J. Hum. Comput. Interact. 2020, 36, 1658–1682. [Google Scholar] [CrossRef]
Figure 1. The dental models used in this study. Maxillary first premolar (a), maxillary first molar (b), mandibular first molar (c), and mandibular first premolar (d).
Applsci 13 08651 g001
Figure 2. An example of a series of operations for measurement using SR View for Endo in the state where the 3D space reproduction (3DCG) environment is constructed by SRD. The SRD screen after setting the first reference point on the #26 tooth model (a). The SRD screen after setting the second reference point by right-clicking (b). The SRD screen after changing the angle after measurement (c).
Applsci 13 08651 g002
Figure 3. Measurement screen using the conventional 2D device. Screen (a) displaying the dental model of tooth number 26. Schematic diagram (b) of the 2D device measurement screen.
Applsci 13 08651 g003
Figure 4. Study design flow chart.
Applsci 13 08651 g004
Figure 5. Bland–Altman plots of the first and second measurements by the spatial reality display (SRD). Scatterplot of Bland–Altman limits for maxillary first premolar as measured by the SRD (a); maxillary first premolar measurements obtained by the SRD (b); scatterplot of Bland–Altman limits for maxillary first molar as measured by the SRD (c); maxillary first molar measurements obtained by the SRD (d); scatterplot of Bland–Altman limits for mandibular first premolar as measured by the SRD (e); mandibular first premolar measurements obtained by the SRD (f); scatterplot of Bland–Altman limits for mandibular first premolar as measured by the SRD (g); and mandibular first premolar measurements obtained by the SRD (h).
Applsci 13 08651 g005aApplsci 13 08651 g005b
Figure 6. Bland–Altman plots of the first and second measurements by the two-dimensional (2D) device. Scatterplot of Bland–Altman limits for maxillary first premolar as measured by the 2D device (a); maxillary first premolar measurements obtained by the 2D device (b); scatterplot of Bland–Altman limits for maxillary first molar as measured by the 2D device (c); maxillary first molar measurements obtained by the 2D device (d); scatterplot of Bland–Altman limits for mandibular first premolar as measured by the SRD (e); mandibular first premolar measurements obtained by the 2D device (f); scatterplot of Bland–Altman limits for mandibular first premolar as measured by the 2D device (g); and mandibular first premolar measurements obtained by the 2D device (h).
Applsci 13 08651 g006aApplsci 13 08651 g006b
Table 1. Intraclass coefficients for each device and tooth model.
DeviceTeethICC (95% CI)p-Values
SRD#240.662 (0.365–0.821)p < 0.001
#260.952 (0.910–0.975)p < 0.001
#360.952 (0.910–0.975)p < 0.001
#440.894 (0.801–0.944)p < 0.001
2D#240.707 (0.448–0.844)p < 0.001
#260.885 (0.784–0.939)p < 0.001
#360.871 (0.758–0.932)p < 0.001
#440.606 (0.259–0.791)p < 0.002
Intraclass coefficients for each device and tooth model.
Table 2. Measurements of the root canal length for each device and tooth model.
DeviceModelNumber of MeasurementMeasurements of Root Canal (mm)Measurement Time (s)
Mean (SD)MinMaxMean (SD)MinMax
SRD#24122.97 (0.04)22.8523.0620.31 (8.01)6.7243.06
222.95(0.04)22.8823.0414.82 (3.79)6.4823.76
#26121.24 (0.13)20.8421.4420.86 (6.90)8.6539.19
221.25 (0.15)20.8621.4817.40 (5.52)8.1731.94
#36120.81 (0.10)20.5820.9622.06 (8.10)8.1740.98
220.81 (0.10)20.5120.9615.79 (5.09)6.1426.73
#44122.86 (0.13)22.5723.0819.32 (5.85)8.9628.73
222.85 (0.14)22.5023.0214.38 (4.00)6.8922.64
2D device#24122.90 (0.21)22.3923.3048.15 (15.68)23.3979.69
222.91 (0.19)22.5123.3244.48 (13.71)22.5574.23
#26121.18 (0.41)20.2321.9454.69 (20.12)21.73105.84
221.15 (0.40)20.1621.9251.73 (19.03)22.21101.06
#36120.84 (0.36)20.2421.5156.43 (20.06)25.45107.86
220.86 (0.30)20.2521.4851.46 (18.71)23.3495.50
#44122.85 (0.32)22.2823.7151.84 (15.68)23.9883.57
222.82 (0.35)22.0523.6048.66 (16.63)25.1290.27
SD, standard deviation; SRD, spatial reality display; and 2D, two-dimensional.
Table 3. Dentist feedback on SR View for Endo.
Mean (SD)MinMax
Three-dimensionality9.4 (±0.9)710
Image lag9.3 (±1.1)510
Operability8.9 (±1.3)510
Articulation8.7 (±1.3)510
Screen sickness7.9 (±1.9)410
Image quality8.1 (±2.2)410
Eye fatigue7.4 (±2.1)310
I feel the SRD will have a role within education9.3 (±1.2)610
I feel the SRD will have a role within practice9.3 (±0.9)610
Rating (1 = strongly disagree, 10 = strongly agree)
Table 4. Spearman’s rank correlation between measurement time and each variable.
rp
Age group 10.2760.084
Gender 2−0.0220.894
Frequency of 2D device use 3−0.3580.023
Eye fatigue (Riccardo scale) 4−0.0880.587
The variables included age group (20 s: 0, 30 s: 1, 40 s and over: 2) 1, gender (female: 0, male: 1) 2, 2D device usage history (first use: 0, several times: 1, about once a month: 2, about once a week: 3) 3, and eye fatigue (feel tired: 1, do not feel tired at all: 10) 4.
Disclaimer/Publisher’s Note: The statements, opinions and data contained in all publications are solely those of the individual author(s) and contributor(s) and not of MDPI and/or the editor(s). MDPI and/or the editor(s) disclaim responsibility for any injury to people or property resulting from any ideas, methods, instructions or products referred to in the content.

