1. Introduction
In an era marked by rapid technological advancements, economic fluctuations, and global competition, businesses are constantly grappling with uncertainty and complexity [
1,
2,
3]. These challenges demand not only operational excellence but also strategic adaptability to remain competitive and thrive in the marketplace [
4,
5]. Organizations must now evolve at an accelerated pace to meet the ever-changing needs of their customers and stakeholders, while also addressing emerging threats and opportunities [
6,
7]. This growing demand for adaptability and resilience has led to the emergence of enterprise agility [
8], a critical factor for success in today’s volatile business landscape [
9].
In today’s fast-paced business landscape, the criticality of swiftly adapting and seizing emerging opportunities for the success of any organization is recognized. The importance of enterprise agility in driving growth and delivering value for clients and ecosystems is acknowledged by Tata Consultancy Services (TCS) [
10,
11,
12]. Since 2014, agile transformation has been actively pursued by the organization on a global scale, both internally and externally, in order to foster innovation and resilience in an increasingly dynamic environment [
13,
14,
15].
Agile organizations demonstrate the capacity to navigate change effectively, capitalizing on new possibilities while minimizing the adverse effects of disruptions [
16,
17]. This approach necessitates a proactive and adaptable mindset, as well as [
10,
11,
18] an openness to experimentation, learning from setbacks [
19,
20], and innovation and entrepreneurship [
21]. Companies that fail to embrace agility risk falling behind their competition and losing market share [
22,
23,
24].
Despite the burgeoning need for enterprise agility and the acknowledgment of its significance, there remains a conspicuous lack of robust quantitative methodologies to effectively measure the impact of agility implementation within an organization. Although numerous performance indicators and metrics have been proposed, a significant gap persists regarding statistically robust and widely accepted frameworks for comprehensively assessing enterprise agility. This deficiency constrains the ability of organizations to fully comprehend the implications of their agile transformation efforts, consequently limiting their capacity to optimize their strategies and processes.
This research delves into an approach for assessing enterprise agility, integrating statistical analysis with continuous improvement methodologies [
11,
25,
26]. A concrete challenge encountered by the case-study organization is presented, followed by the strategies that were adopted to overcome it, and the consequent results that were attained. Additionally, valuable insights and recommendations are furnished, catering to organizations that seek to deploy a similar system for the appraisal and enhancement of their enterprise agility.
Specifically, this paper yields the following contributions:
The primary contribution of this paper is the proposal of a methodology, designed for the statistical measurement of the impact generated by the implementation of business agility within large organizations.
The methodology was validated through its application to TCS. This involved an examination of strategy for enhancing and measuring business agility.
Valuable insights and recommendations are extended to those organizations which are aspiring to devise and implement a similar system aimed at assessing and enhancing their business agility.
Throughout this research, the application of robust statistical methods to measure business agility emerged as a crucial highlight. Specifically, the use of the Fisher–Snedecor power analysis test for variance inequality has proven to be valuable within the realm of organizational metric calculations and processes. This unique methodology not only facilitated the effective measurement of the impact generated by the implementation of business agility but also shed light on significant results. Moreover, the successful use of such rigorous statistical analysis reinforces the notion that business agility can indeed be quantified and enhanced in a substantial manner.
The structure of this document is as follows:
Section 2 provides a brief overview of the state-of-the-art in applying the concept of agility in companies. The proposed methodology, case study, and the agility index utilized are detailed in
Section 3. The results and statistical validation are presented in
Section 4, with a discussion of the obtained results featured in
Section 5. Finally,
Section 6 summarizes the conclusions and outlines proposed future directions.
2. Enterprise Agility
Agility is increasingly important for companies in today’s volatile and uncertain business environment. Agile organizations are able to adapt to change quickly and effectively, which gives them a competitive advantage. There is a growing body of research on the impact of agility in companies, and the studies cited in this section provide a brief overview of the state-of-the-art.
In [
27], the authors provide a valuable example for managers and professionals in the automotive industry. In [
28], the authors discuss the relationship between agility and poaching. Poaching refers to the act of hiring employees from another company. The authors found that an organization’s response to poaching can have a significant impact on employee productivity. A constructive response to poaching, which seeks to retain employees by addressing their needs and concerns, is negatively correlated with employee productivity. A defensive response to poaching, which seeks to protect the organization from the negative effects of poaching by, for example, hiring more employees or increasing security measures, is positively correlated with employee productivity. The authors also found that organizational agility may mediate the relationship between poaching and productivity. This means that agile organizations, which are typically characterized by their ability to adapt to change quickly and effectively, can better withstand the negative effects of poaching and maintain high levels of productivity.
The authors of [
29] found that there is a direct positive relationship between ranking human resources as an important top position in a company and the extent to which specific practices to increase workforce agility are adopted. The study surveyed large, independent decision-making companies from western Romania, and found that an average of 45% of these companies have adopted management practices to increase workforce agility, and 31.7% of these companies rank human resources as their most important resource. The study used the Pearson Chi-Square test to confirm the hypothesis that there is a direct positive relationship between these two factors (significance = 0.026). The study concludes that if managers intend to develop a sustainable and competitive business, they should attribute a strategic role to employees and adopt practices to increase their agility.
In 2017, TCS, a multinational information technology services and consulting company embarked on a large-scale cultural transformation to become Enterprise Agile by 2020 [
30,
31]. This transformation involved absorbing agility throughout the entire organization and reinventing the flow of value across the organization. The transformation impacted half a million people worldwide and was orchestrated in the following three areas:
Structure and people: A new organizational structure that is more agile and responsive to change was created. The company also invested in training and development programs to help employees adopt agile mindsets and practices.
Culture and processes: A new culture that is more collaborative, innovative, and customer-centric was created. The company also implemented new processes that support agile ways of working.
Technology and tools: TCS invested in new technologies and tools that support agile ways of working. The company also created a new agile ecosystem that includes agile coaches, trainers, and mentors.
A study conducted in [
32] found that supply chain management (SCM) activities have a positive impact on operational performance, but this impact is mediated by strategic agility. This means that strategic agility plays a role in translating the benefits of SCM activities into improved operational performance. The study also found that the most important SCM activities for pharmaceutical companies are alliances with suppliers, customer relationship management, logistics, information flow, and knowledge sharing. The study concludes that pharmaceutical companies can improve their operational performance by focusing on these SCM activities and by developing their strategic agility. Companies can respond to top-down social innovation and social entrepreneurship initiatives using social bricolage and agility. Social bricolage is the process of exploiting available and local resources to meet social needs, while agility is the ability to adapt to change quickly and effectively. The authors of [
33] found that companies that used these strategies during the COVID-19 pandemic were able to quickly adapt to the changing needs of the market and the government, and they were able to meet the urgent social needs of the time.
The studies cited in this section provide evidence of the importance of agility for companies in today’s business environment. However, to the best of our knowledge, there is no methodology to quantitatively measure and evaluate the significance and statistical power with respect to the incorporation of agility in companies. The following section details the proposed methodology to address this type of situation.
3. Methodology
In this section, the agility index used is introduced, the proposed methodology for conducting statistical analysis is presented, and the case study is finally detailed. In
Section 3.1, a description of various indices for measuring agility and the specific index used in this study are provided. Subsequently, in
Section 3.2, the details of the proposed methodology for conducting statistical analyses are elaborated. Ultimately, in
Section 3.3, the case study is thoroughly examined.
3.1. Measuring Enterprise Agility
The measurement of enterprise agility is essential for any company that wants to improve its responsiveness to market changes and customer needs [
14]. However, starting an organizational agility measurement system that supports agile governance and helps track progress and evolution towards future state goals can be a challenging task for many companies [
16].
The CMMI for Agile is a framework for assessing and improving the agility of organizations. It is based on the Capability Maturity Model Integration (CMMI), which is a well-established framework for assessing and improving the maturity of organizations. The CMMI for Agile includes a number of practices that can help organizations become more agile, such as iterative and incremental development, continuous improvement, and customer collaboration.
The Agility Quotient is a measure of an organization’s ability to adapt to change. It is calculated by measuring the organization’s ability to respond to change, its ability to learn from change, and its ability to manage change. The Agility Quotient can be used to track an organization’s progress over time and to identify areas where the organization can improve its agility.
The Scaled Agile Framework (SAFe) is a framework for scaling agile development. It provides a set of principles and practices for organizing and managing large-scale agile projects. SAFe includes a number of metrics for measuring agility, such as the number of features delivered per sprint and the percentage of features that are delivered on time and within budget. SAFe can be used to help organizations scale agile development without sacrificing agility.
The Agile Adoption Index is a measure of the extent to which an organization has adopted agile practices. It is calculated by measuring the organization’s use of agile practices, such as daily standups, sprint planning, and retrospectives. The Agile Adoption Index can be used to track an organization’s progress over time and to identify areas where the organization can improve its adoption of agile practices.
The Agility Health Radar is a measurement that provides insight into the agility of an organization, assessing different dimensions. This tool utilizes a combination of assessments, surveys, and data analysis to generate an accurate picture of the level of agility and identify areas for improvement.
The AgilityDebt™ index is a proprietary way for TCS to measure the debt that an organization has that restricts its agility. It is calculated by means of a carefully sequenced polynomial, dependent on its factors, which is fed by variables that are continuously monitored thanks to the data recorded in TCS information systems. In the following paragraphs of this section, the concept of a polynomial is explicated, and the specific dimensions applicable to the cases of IT and CBO are discussed.
In this study, the AgilityDebt™ index was employed among the various indicators previously mentioned. However, it is noteworthy to underline that the proposed statistical methodology is indicator-agnostic. This proprietary index enables TCS to quantify an organization’s constraints on agility. The development of AgilityDebt™ was made possible by TCS’s extensive experience in spearheading over 300 agile transformations worldwide. While this index serves as a tool in the recommended statistical methodology, it should be emphasized that this methodology remains applicable when utilizing alternative indicators.
The comprehension of the AgilityDebt™ index is straightforward for all members of an organization. It operates within a unique range from 0 to 1, where a lower value is favorable, as it signifies lower debt, thus portraying an elevated level of organizational agility.
Within an organization, the AgilityDebt™ index has the capacity to scale both horizontally and vertically. It encapsulates different perspectives, from the detailed project level to an aggregated client, business vertical, or country level, then extending back up to a regional or global level within TCS. The horizontal scalability of this tool is demonstrated as it is not confined to IT services, but also pertains to all service units TCS offers its clients, such as Cognitive Business Operations (CBO) (
https://www.tcs.com/what-we-do/services/cognitive-business-operations, accessed on 25 March 2023), Consulting, and Enterprise Solutions, among others.
In recent times, the AgilityDebt™ index has emerged as an effective governance tool for C-level executives tasked with spearheading organizational change in large and complex entities. The AgilityDebt™ index can be conveniently customized to align with our client’s organizations. It is calculated through a meticulously structured polynomial, contingent on its factors, and informed by variables that are constantly monitored through data input into TCS’s information systems. To illustrate how AgilityDebt™ is measured within the IT realm, we can look at the following contributing factors:
The extent of agile training and competency levels among staff;
The usage of agile practitioners;
The agile maturity of projects/services;
Customer satisfaction;
The business outcomes generated by our delivery.
In the CBO world, as a guiding example, we can mention the following factors to execute the AgilityDebt™ measurement:
As an example,
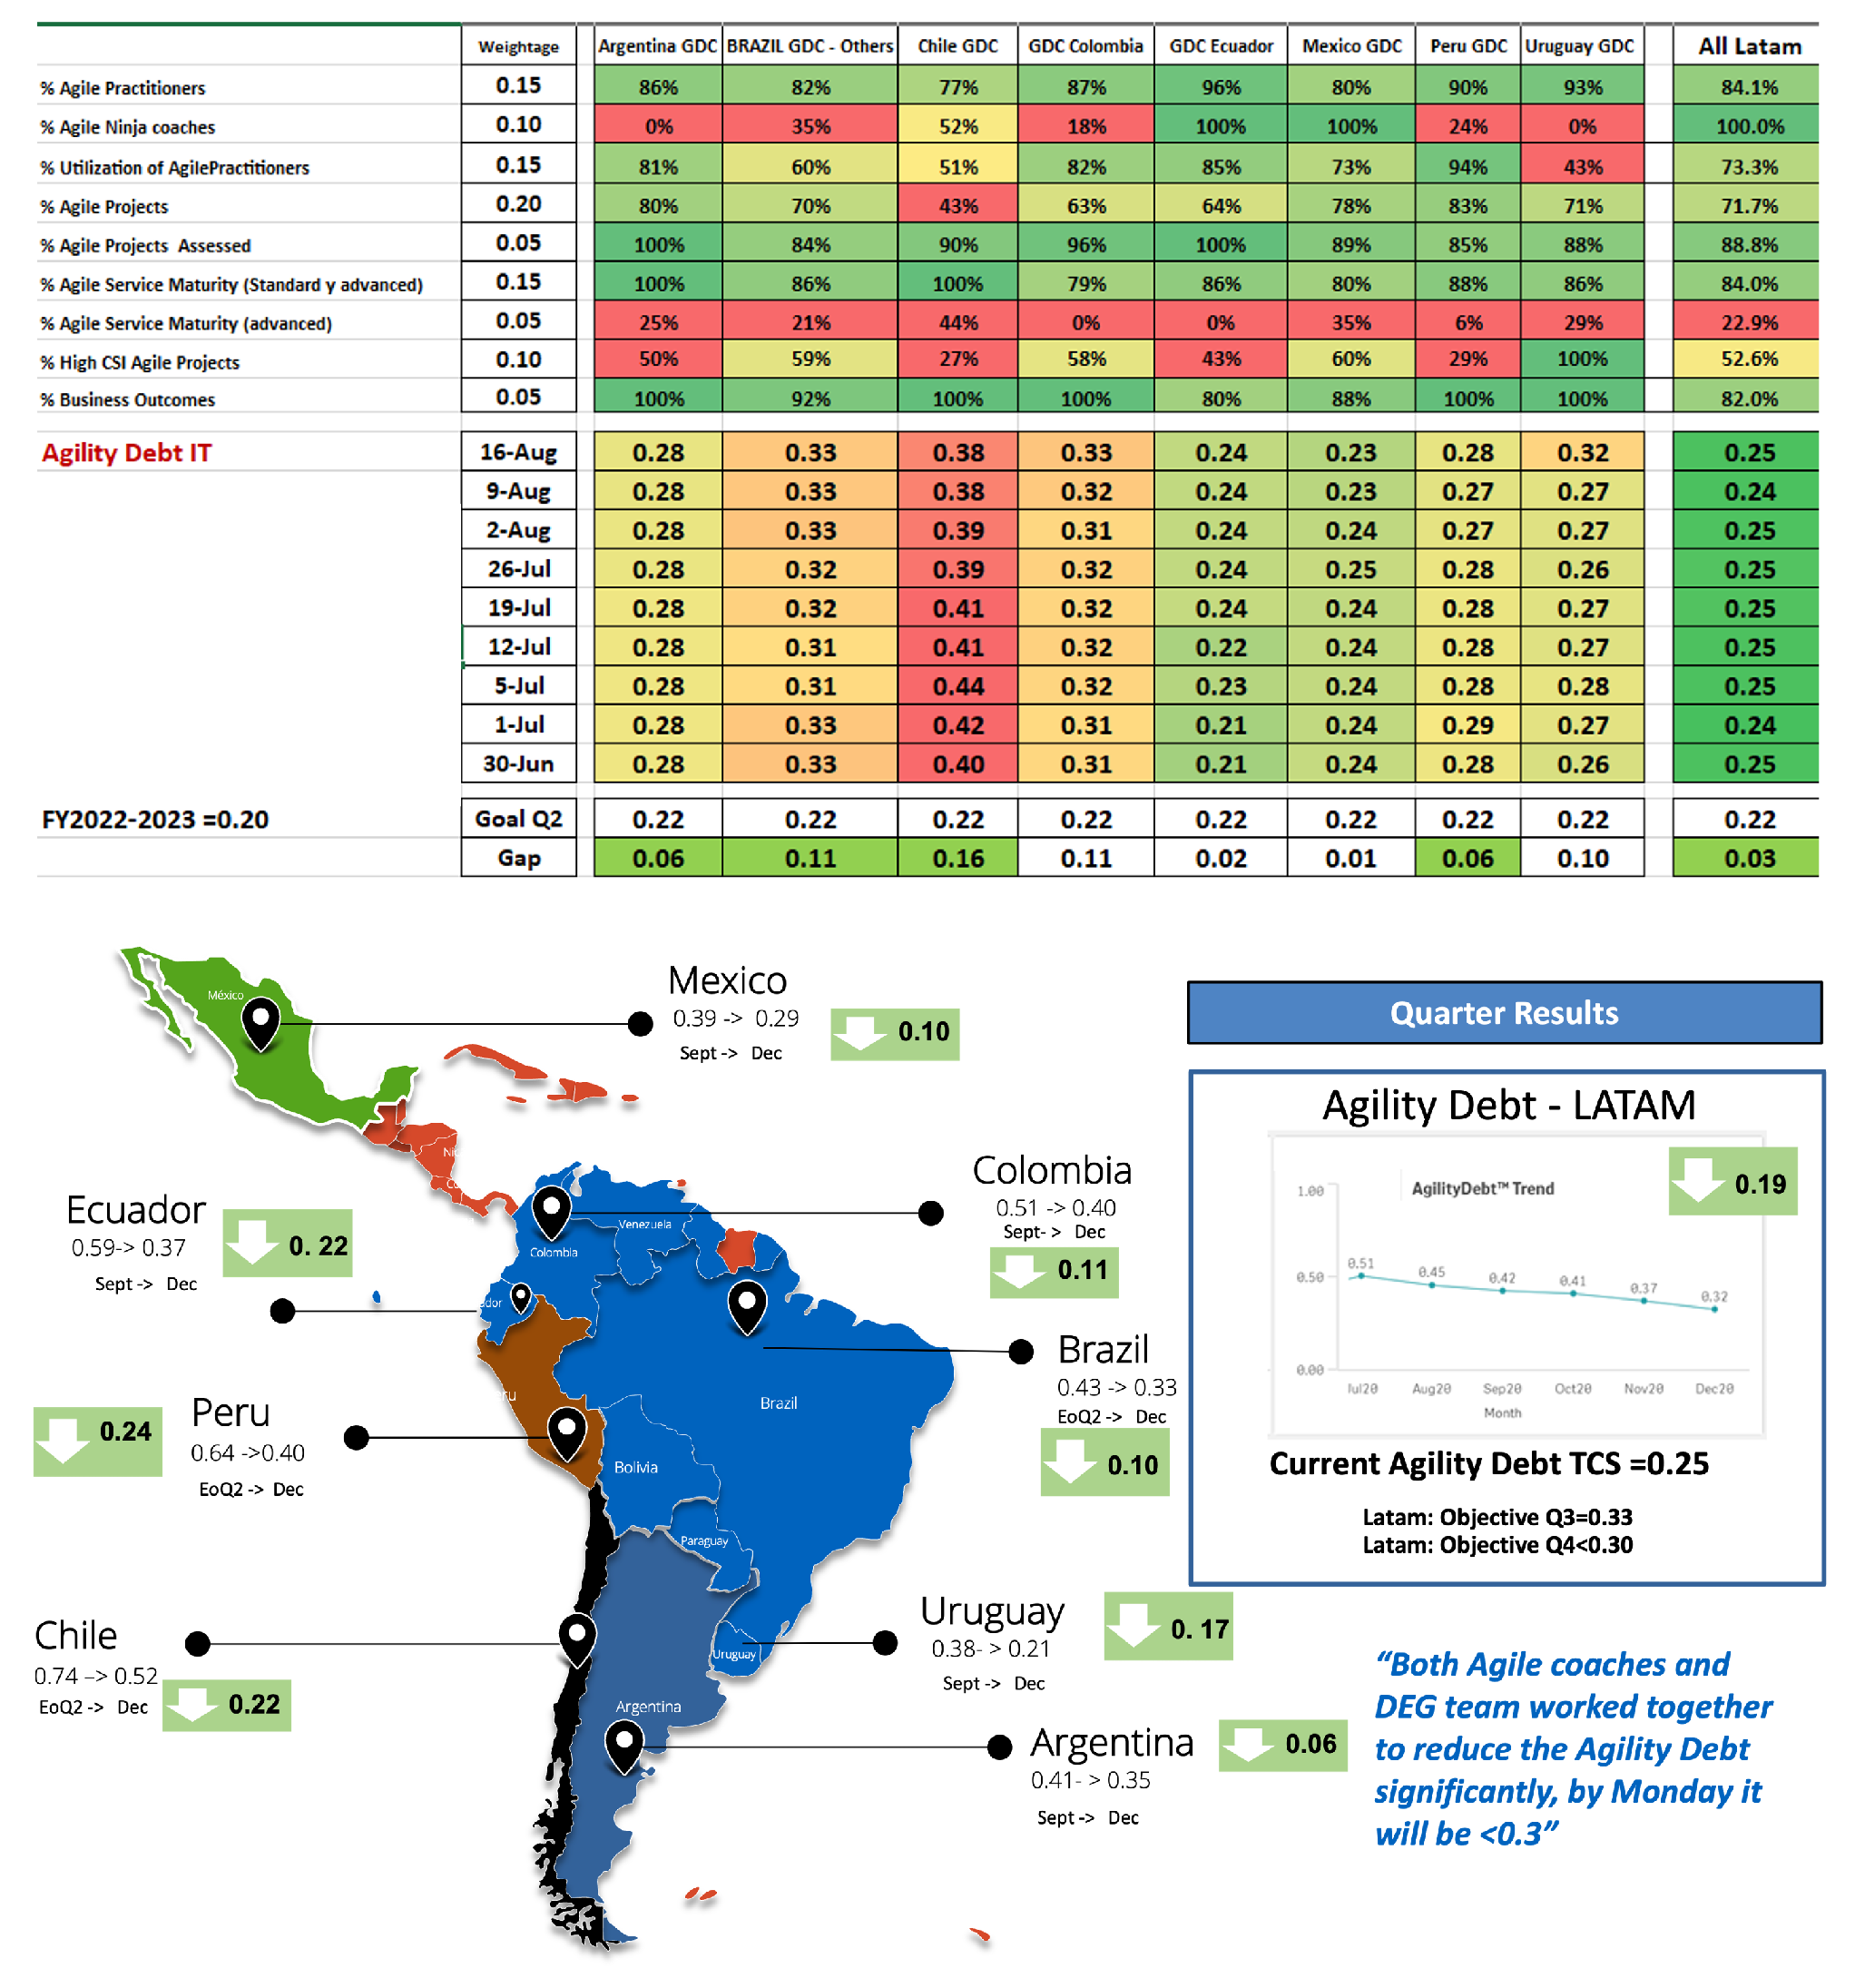
Figure 1 shows a dashboard with AgilityDebt™ values by country and global Latam, including a view of the performance of each factor in the polynomial equation. This dashboard is evaluated weekly and monthly with the leaders and C-Levels of TCS Latam.
3.2. Proposed Methodology for Demonstrating the Statistical Significance and Power of the Improvement in AgilityDebt™
We used statistical analysis to objectively demonstrate that the change or improvement exhibited in the AgilityDebt™ after the actions implemented by the transformation team corresponds to a statistically significant finding and is not something that results from the randomness of the data and its sampling error [
34].
For this purpose, the method employed to carry out the data analysis consisted of the following steps:
- (1)
Dataset capture (pre and post): Samples are extracted and their statistics are calculated (mean, standard deviation, variance, and size), along with graphs to improve data interpretation [
34].
- (2)
Normality test of the samples: A normality test is performed on both samples with the aim of ensuring that the normality assumption is met [
35], and to perform future parametric tests of difference of variances and tests of difference of means.
- (3)
Fisher’s F-test for variance difference: If normality exists in step number 2, this test is performed to:
- (a)
Evaluate if there are statistically significant differences in the variability of the samples [
36,
37].
- (b)
Determine if the future test of difference of means to be executed in step number 4 will assume equality of variances or not.
- (4)
Student’s
t-test for mean difference: If normality exists in step number 2, this test is performed to determine if there are statistically significant differences in the means of the samples [
38].
- (5)
Power test: If there are statistically significant differences in both the variance difference test and the mean difference test, a power test is performed to evaluate the size of the effect [
39,
40] obtained and the probability that the effect is true.
- (6)
Analysis conclusions: Based on the results of the previous steps, we conclude whether the improvement obtained in AgilityDebt™ has substantial significance from a practical point of view for our organization [
34].
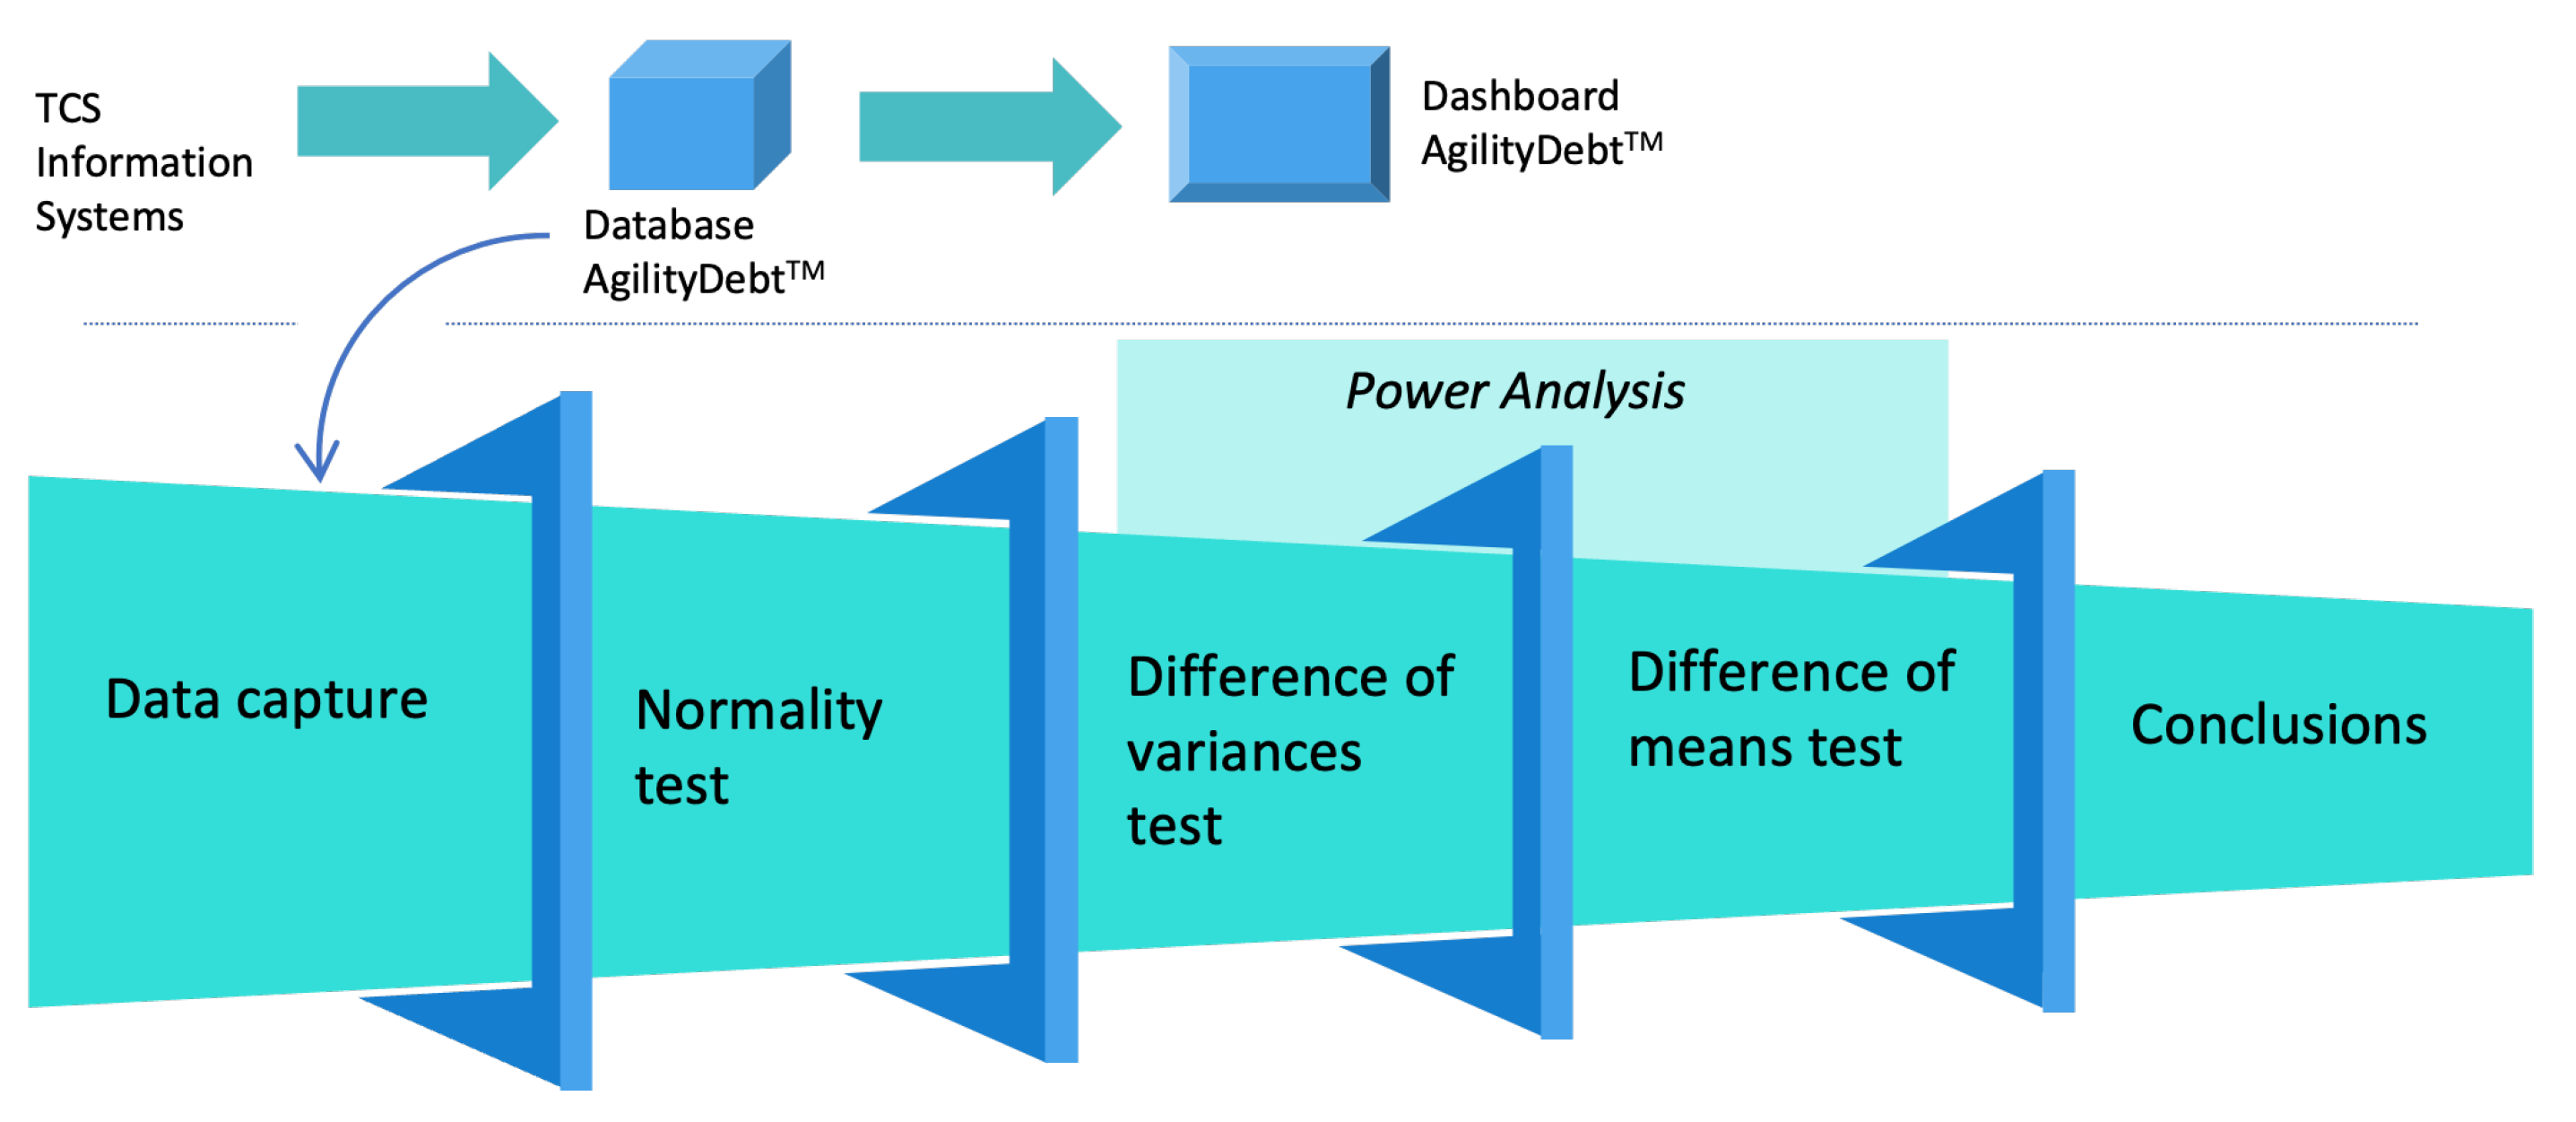
In
Figure 2, we can observe the presented methodology and its interaction with the information systems of the company in which the case study is applied in the following chapter.
The analysis of data provides scientific tools to systematically and efficiently evaluate the study samples [
41]. We use the Python ecosystem tools to perform statistical analysis.
3.3. Case Study on the Application of AgilityDebt™ and Statistical Methodology: The Latin American Challenge
Getting started in IT: At TCS Latam, where we currently have over 27,000 employees and more than 800 IT and CBO projects, we set ourselves the challenge over three years ago of continuously improving [
11] our enterprise agility with the AgilityDebt™ instrument, with the mission of collectively making an impact this asset within the organization [
42], in order to achieve the following:
Promote agility with leaders and sponsors;
Energize the agile cultural change;
Improve our delivery;
Positively impact the growth of our clients.
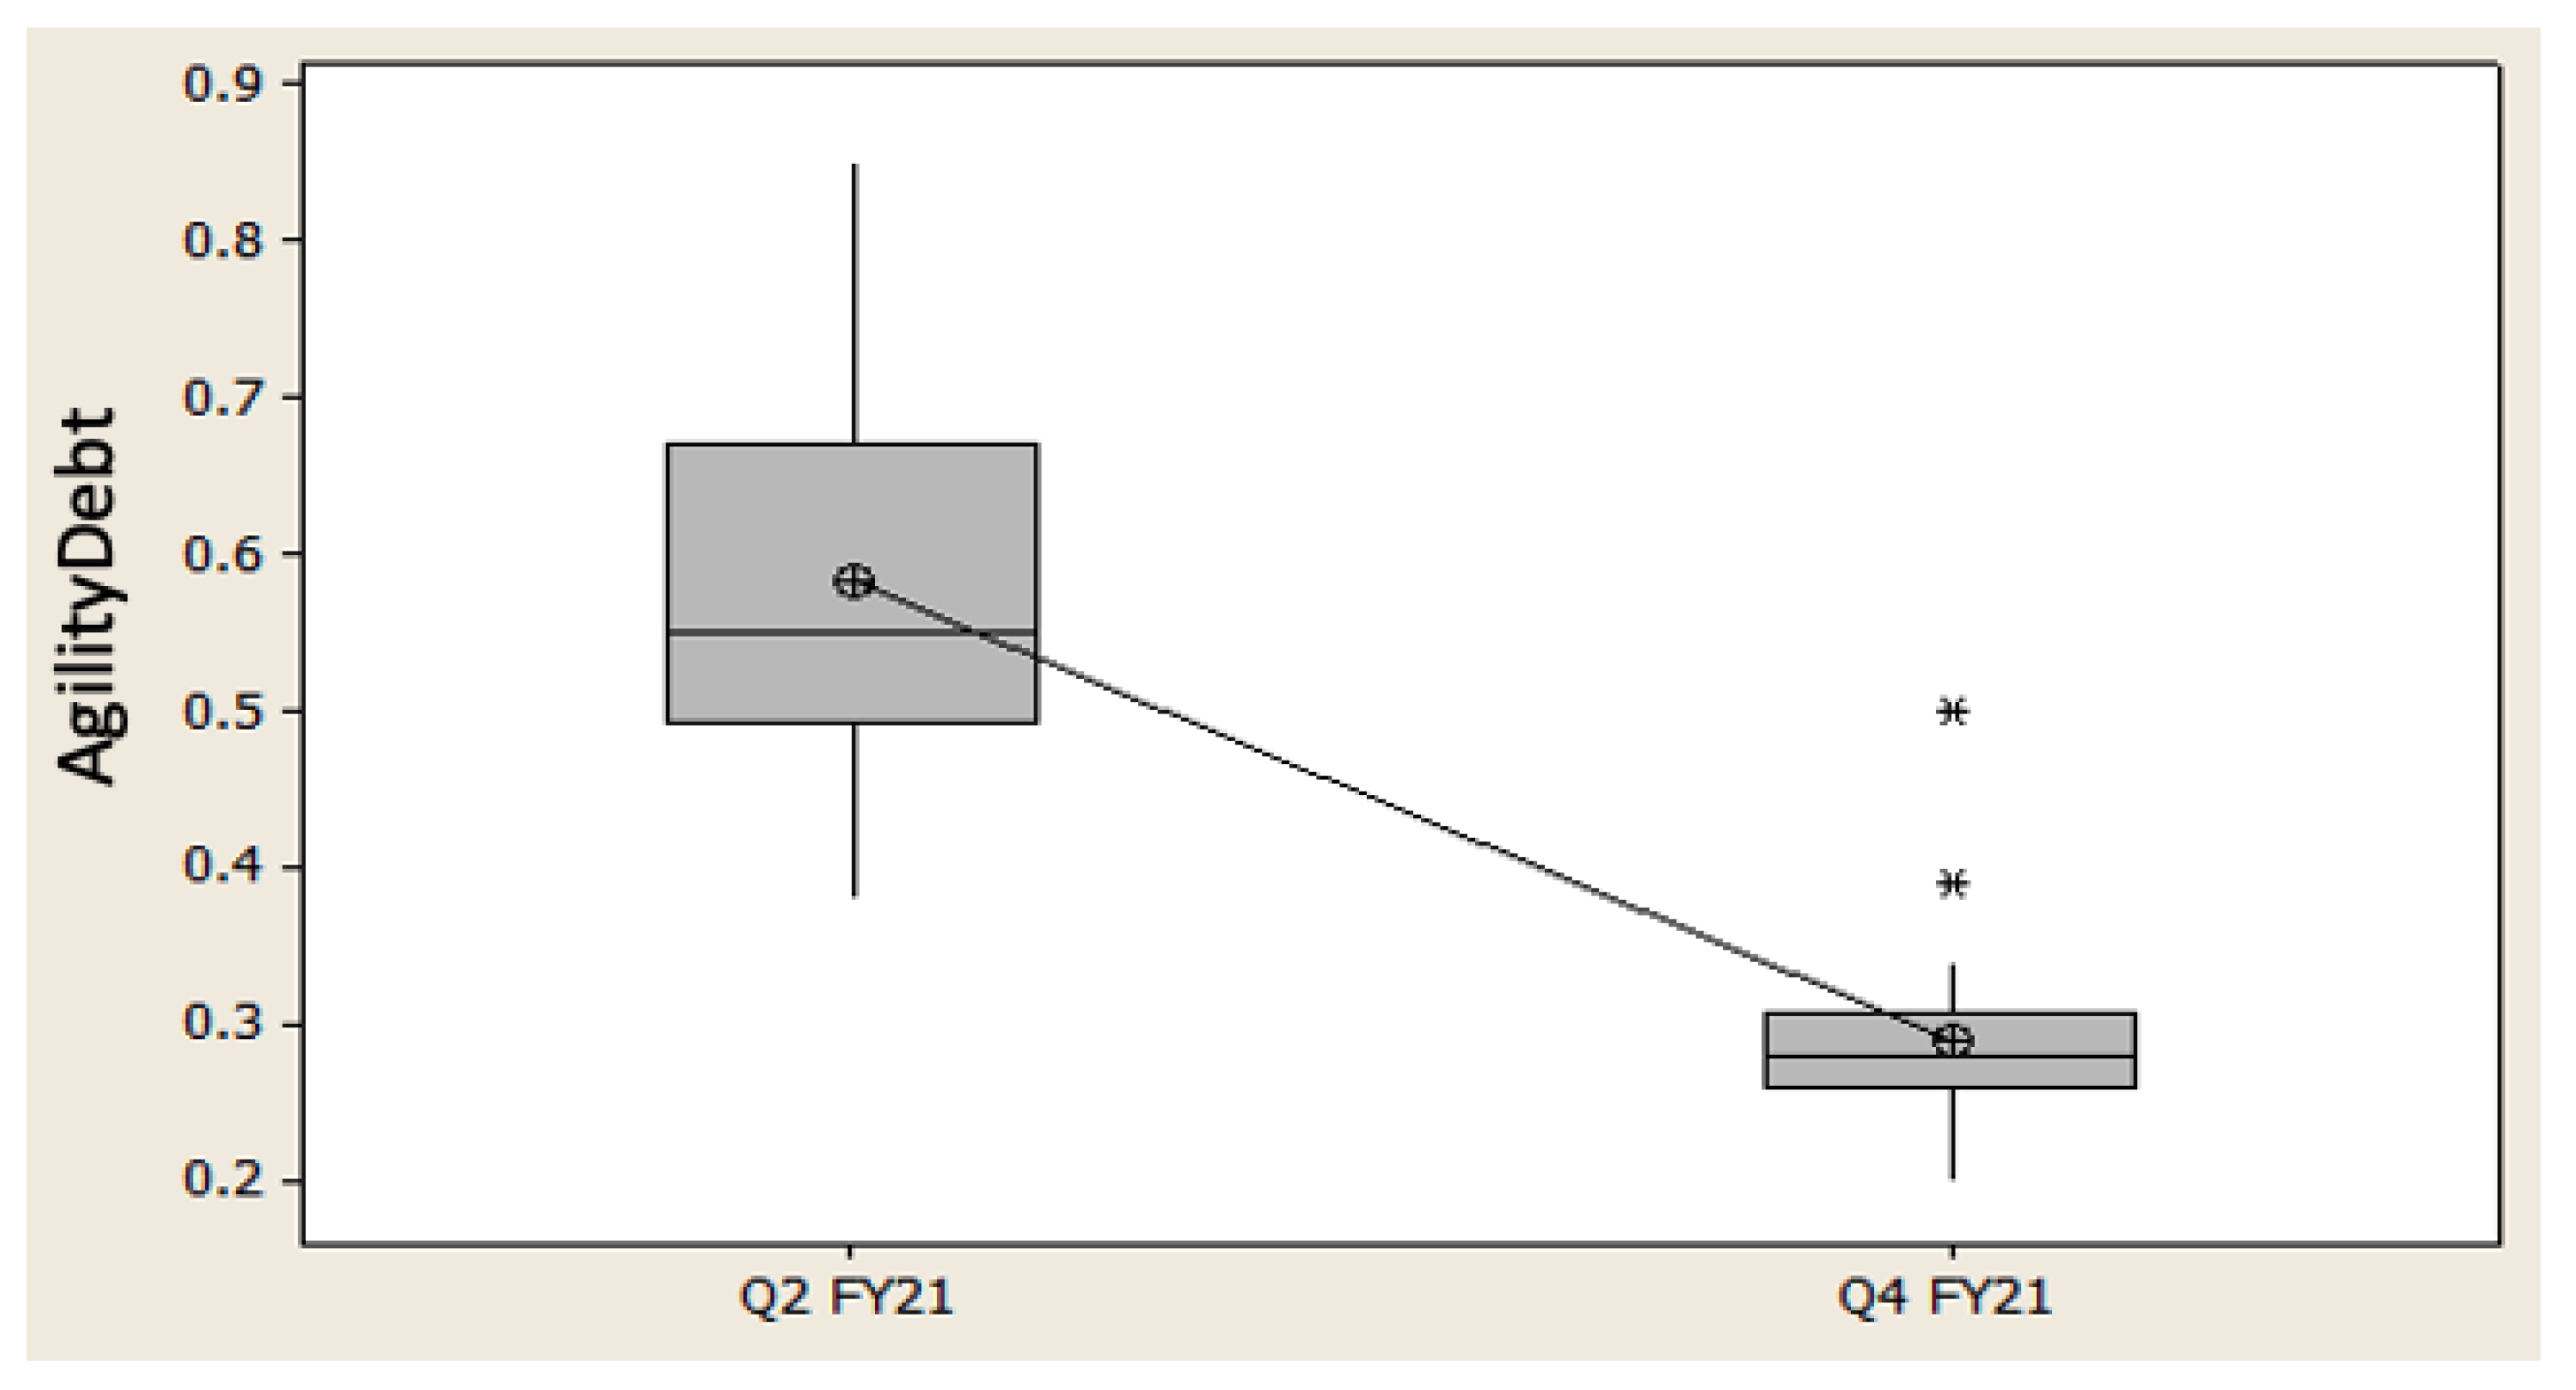
In 2020, we started measuring AgilityDebt™. First, we did it for the IT world, where we successfully managed to reduce debt from 0.58 for the second quarter of the fiscal year 2021 (Q2-FY21) to 0.29 for the fourth quarter of the fiscal year 2021 (Q4-FY21).
Figure 3 shows a graph where this reduction can be observed.
As a result of the positive experience in the IT world, in 2021 we took on the challenge of scaling continuous improvement horizontally, now bringing good agility improvement practices to the world of CBO services.
Escalating to CBO: In this document, we want to explain in detail the challenge of improving enterprise agility in CBO, including the methodology and results obtained.
For CBO, we apply a process similar to the IT case, which involves weekly monitoring of the metric in all TCS Latam countries. After having enough data points, we conduct an initial analysis to calculate the mean and dispersion at the regional level, that is, considering all Latin American countries where TCS operates with CBO services.
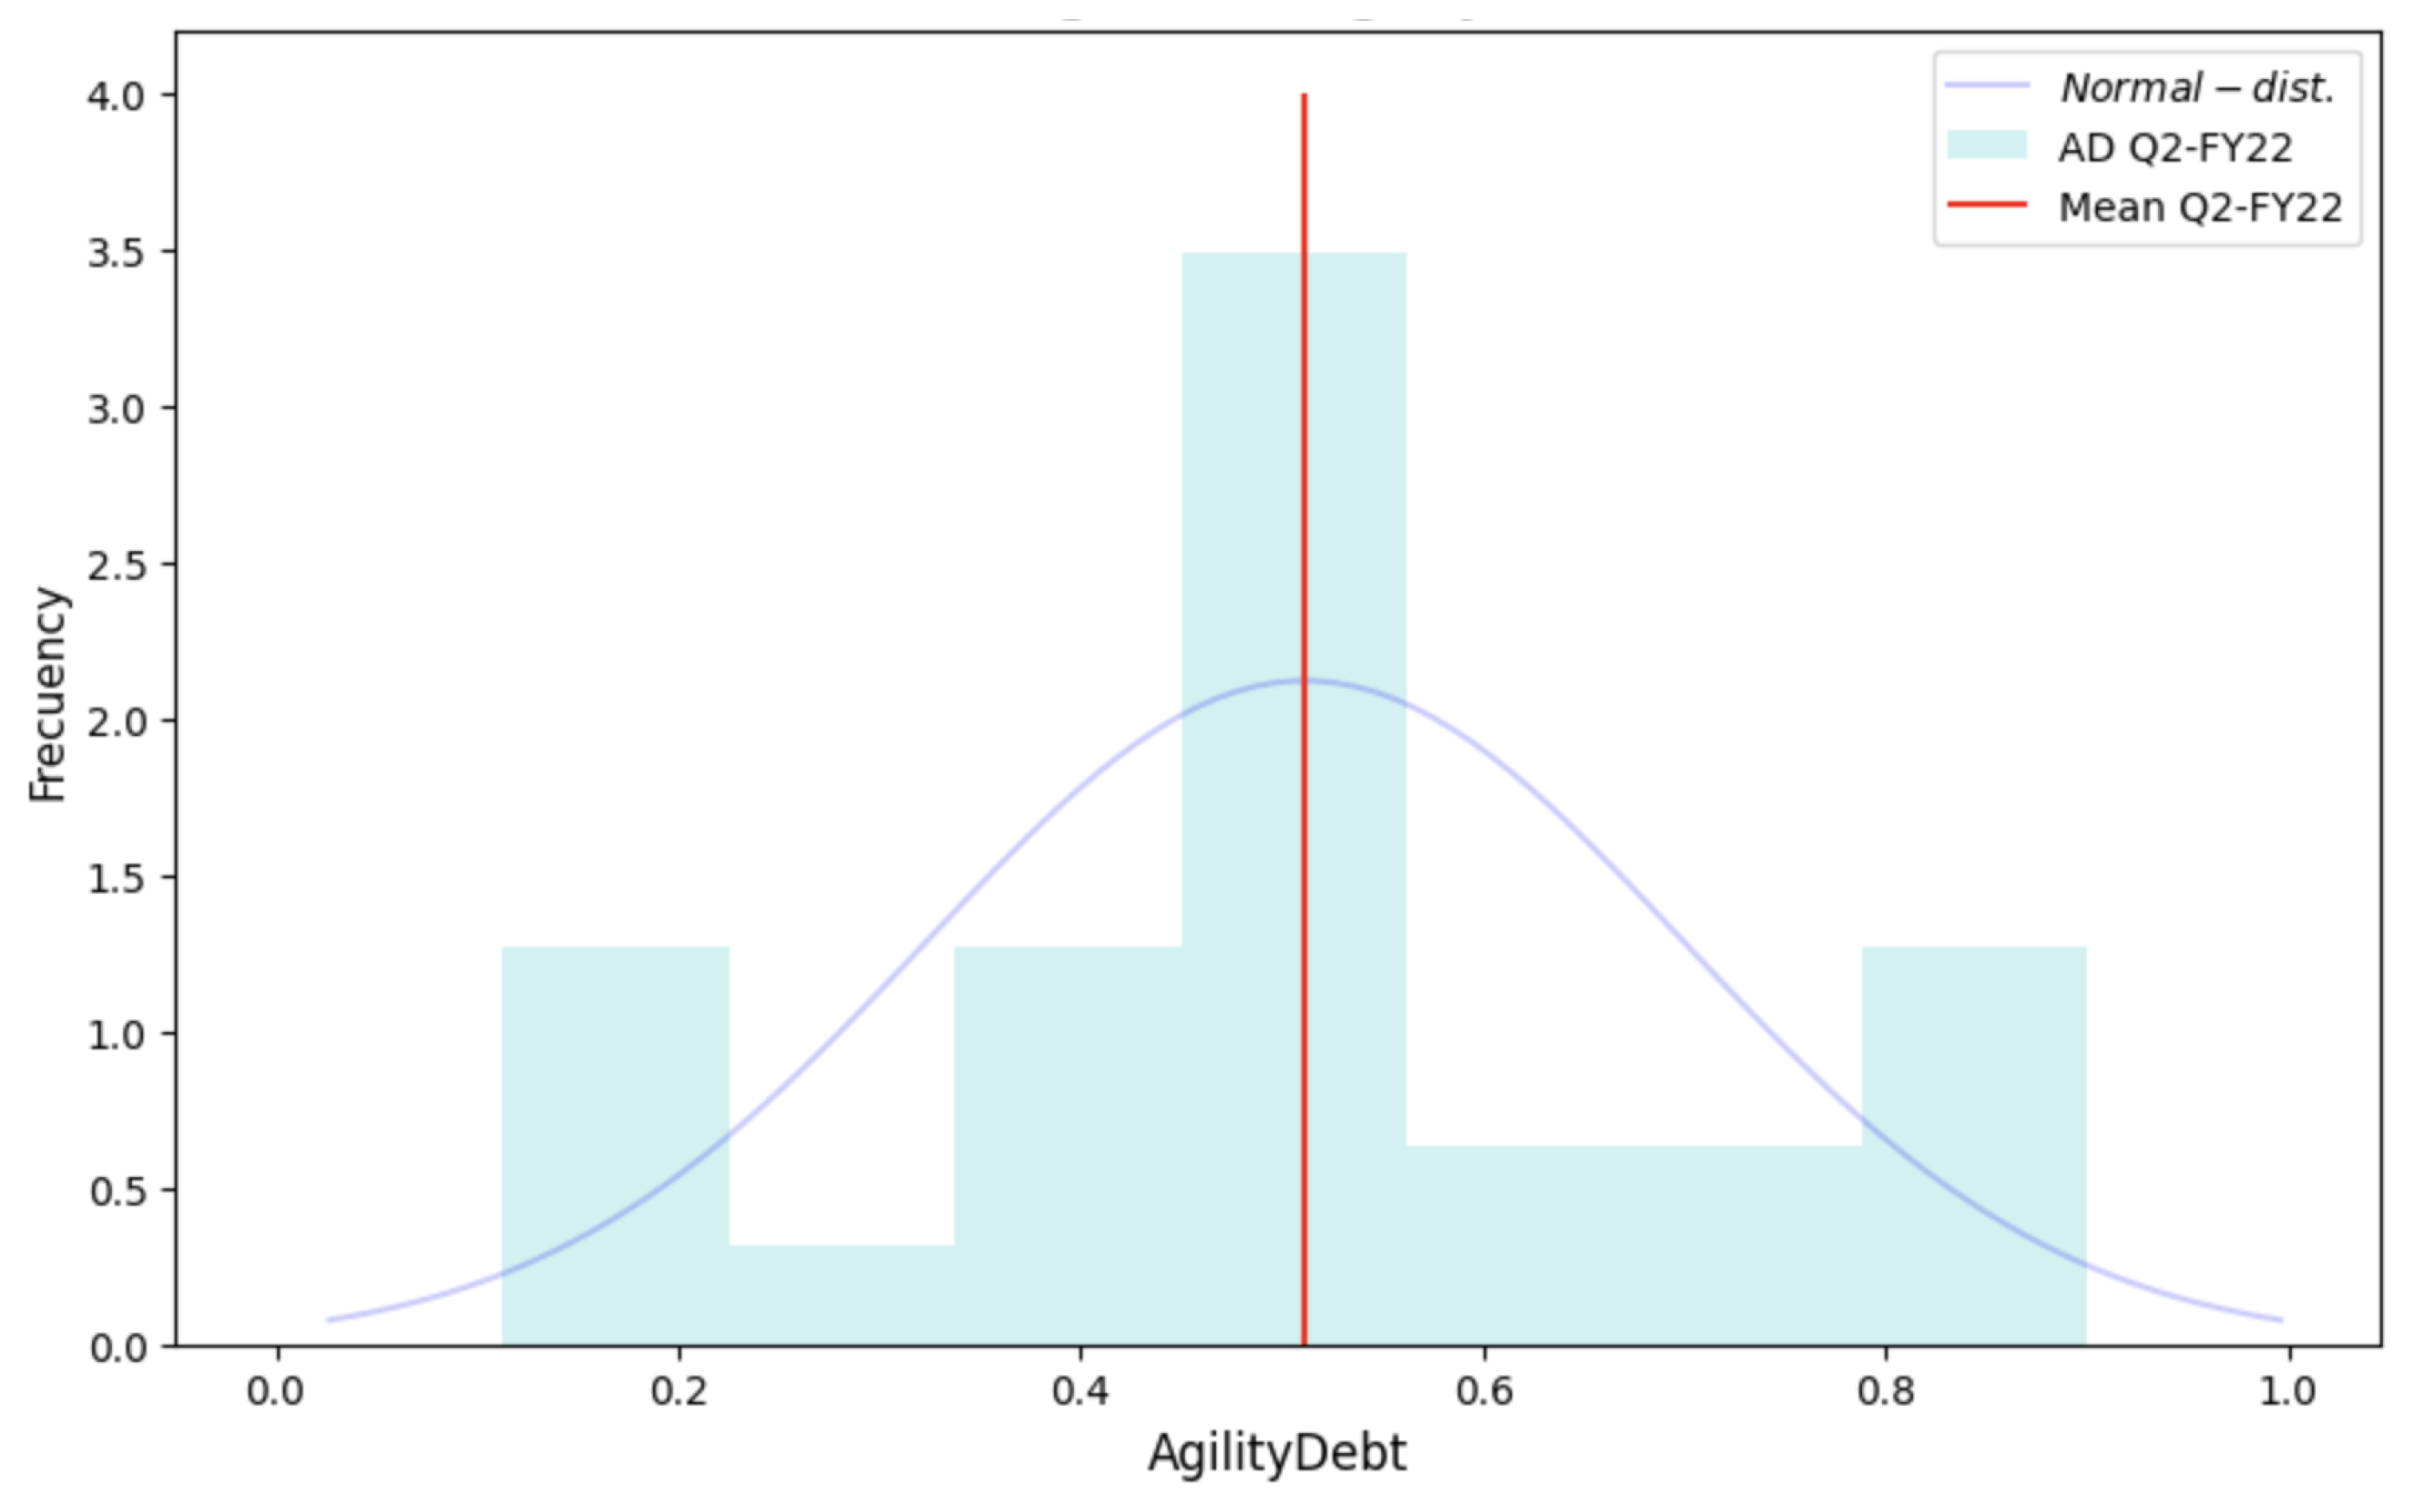
This analysis yields a baseline for the second quarter of the fiscal year 2022 (Q2-FY22) of 0.51 on average and 0.19 in terms of dispersion (standard deviation), as shown in
Figure 4 and
Table 1. As previously explained, the scale of this index ranges from 0 to 1, where 0 represents low debt and high agility, and 1 represents high debt and low agility. In this sense, having a score of 0.51 represents a medium or regular agility, and as our Agile Enterprise Vision inspires us to the Zero-For-Tomorrow (0-4-2), which means achieving zero agile debt and consequently enabling high enterprise agility, we decide to create an improvement team [
11,
25] with the aim of significantly reducing CBO AgilityDebt™ in the organization.
Agile transformation journey at CBO: Setting the next milestone at a 30% reduction within six months, the initiation of the improvement process was fundamentally influenced by the individuals involved. A team, fully synchronized with the agile transformation vision, was assembled, composed of dedicated change agents and agile facilitators [
43], who willingly chose to partake in this transformative journey.
The team began by analyzing and diagnosing the current situation, which allowed us to identify certain patterns and causes that explained the high [
25] AgilityDebt™ in CBO. Later, we applied prioritization mechanisms [
44,
45] that allowed us to establish the initial version of our agile debt improvement backlog. In front of this backlog, the transformation team co-created different hypotheses and their respective actionable items to implement.
Our project had a limited budget of six months; therefore, the objective of reducing the AgilityDebt™ by at least 30% had to be achieved in the fourth quarter of the fiscal year 2022 (Q4-FY22).
The actionable items devised by the transformation team were related to the following:
The transformation team conducted weekly tracking of the actionable items and their results [
42], which allowed us to adapt the improvement backlog and the board where the project’s progress in reducing the debt was visualized [
13,
49]. Monthly, the organization’s leaders reviewed the progress and provided feedback [
22,
46] to continue reducing the AgilityDebt™. The TCS Latam agile community played a crucial role in socializing agility and seeking new change agents [
48]. Thanks to this, we were able to add new facilitators, scrum masters, and agile coaches to this transformation initiative [
42,
47].
4. Results and Statistical Validation
The results of the statistical analysis conducted in this research demonstrate a highly significant improvement in TCS Latam’s AgilityDebt™ CBO. The average reduction in the indicator is not only statistically significant but also relevant, with a 43% decrease, equivalent to a reduction of 2230 basis points between Q2-FY22 and Q4-FY22. This result surpasses the initial goal of a 30% reduction. Additionally, the analysis reveals a marked improvement in consistency among the countries reporting the debt indicator within the Latam region. This is evidenced by a significant decrease in variance between Q2-FY22 and Q4-FY22, translating to a substantial 45% reduction in terms of standard deviation.
The following sections will provide more details on the statistical methods used, the results of the analysis, and the conclusions that can be drawn from the findings.
4.1. Data Capture
At the end of the fourth quarter of fiscal year 2022 (Q4-FY22), we extracted a new sample of data points from TCS Latam countries with CBO services, yielding a result of 0.29 for the mean and 0.10 for the standard deviation. Although we met our established target of reducing AgilityDebt™ by 2230 basis points, we needed to perform a statistical analysis to verify the significance of this reduction.
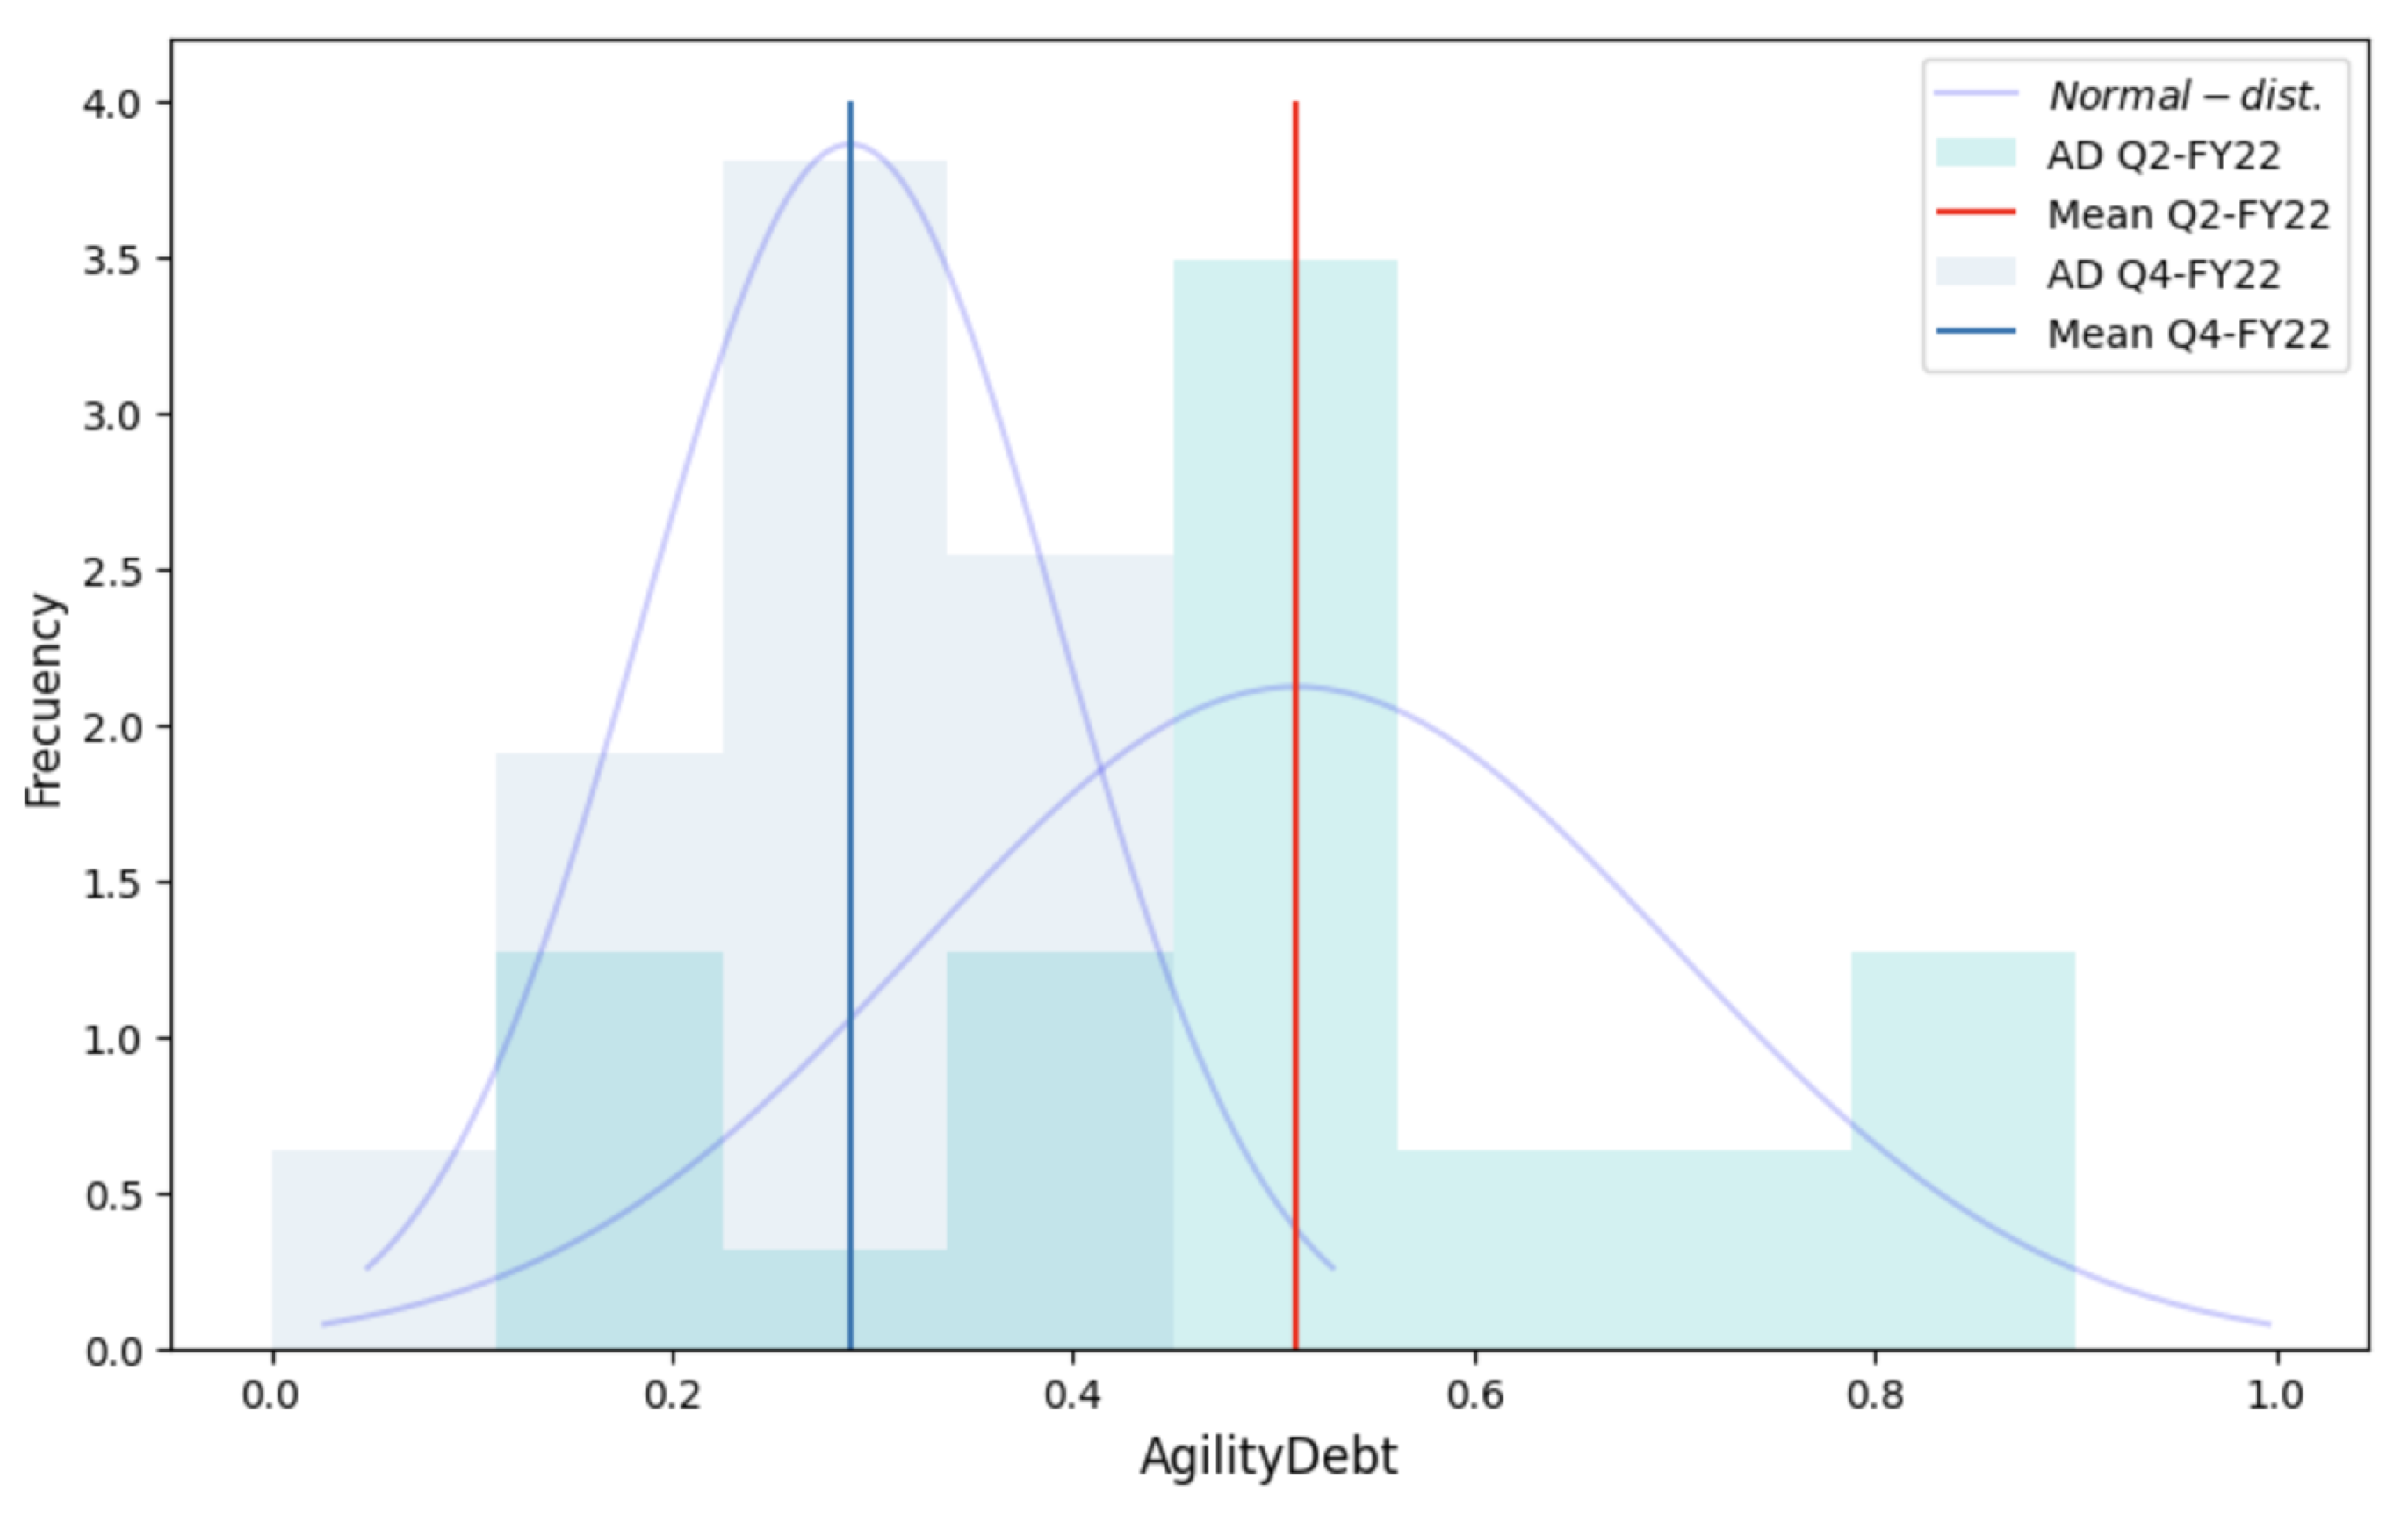
Figure 5 and
Table 2, show a visualization with histograms and main statistics of both evaluated samples. Remember that in our case these samples were the following:
4.2. Normality Test
After capturing both datasets (Q2-FY22 and Q4-FY22) and performing a descriptive analysis of them, the first step was to evaluate the normality of the data in both datasets. We conducted a normality test using the Anderson–Darling test [
35], where we formulated the following hypothesis:
H0: The data follows a normal distribution.
H1: The data does not follow a normal distribution.
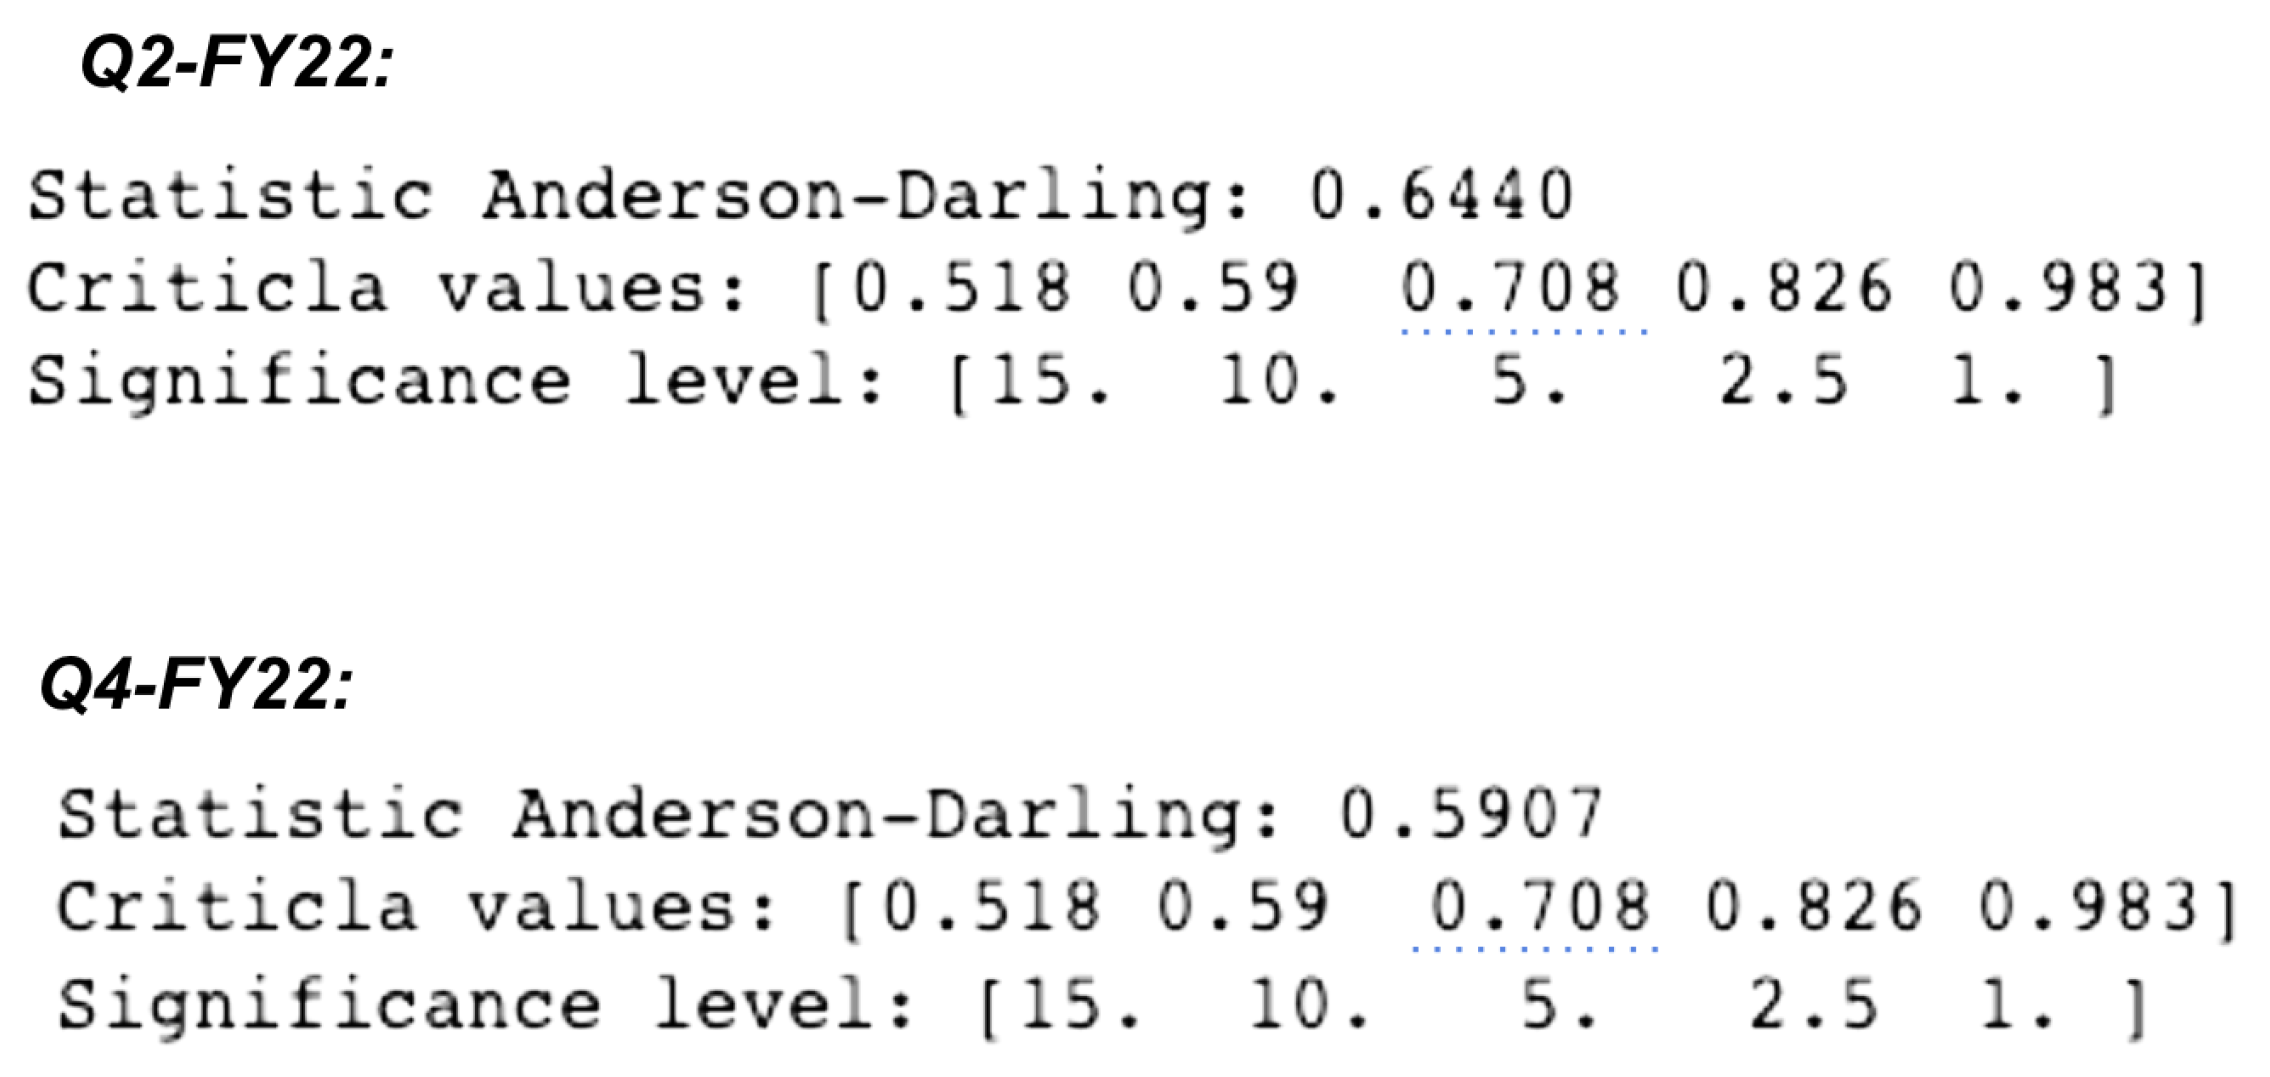
The results obtained in this test are presented in
Figure 6.
Conclusion: Both samples, at a significance level of 0.05, show that they follow a normal distribution because the Anderson–Darling test statistics of both samples (0.644 for Q2-FY22 and 0.5907 for Q4-FY22) were lower than the critical value of 0.708 for a significance level of 0.05. Thus, we do not reject the null hypothesis .
This result validated the future execution of a Student’s t-test for the difference in means of two independent samples, and the execution of a Fisher’s F-test for the difference in variances of two independent samples.
4.3. Difference of Variances Test (Fisher’s F-Test)
Before conducting the mean difference test, it is necessary to evaluate whether the variances of both samples are equal or not, which is achieved through a Fisher’s
F test [
36,
37]. Running the test shows that the variances differ significantly and that we significantly reduce variability in the Q4-FY22 quarter compared to the Q2-FY22 quarter.
The Fisher’s method involves taking the ratio of the larger population variance,
, to the smaller population variance,
, and then looking up the ratio on an
F distribution curve [
36,
37,
50].
In this test, the null hypothesis states that the ratio is equal to 1:
and the alternative hypothesis states that the ratio is greater than 1:
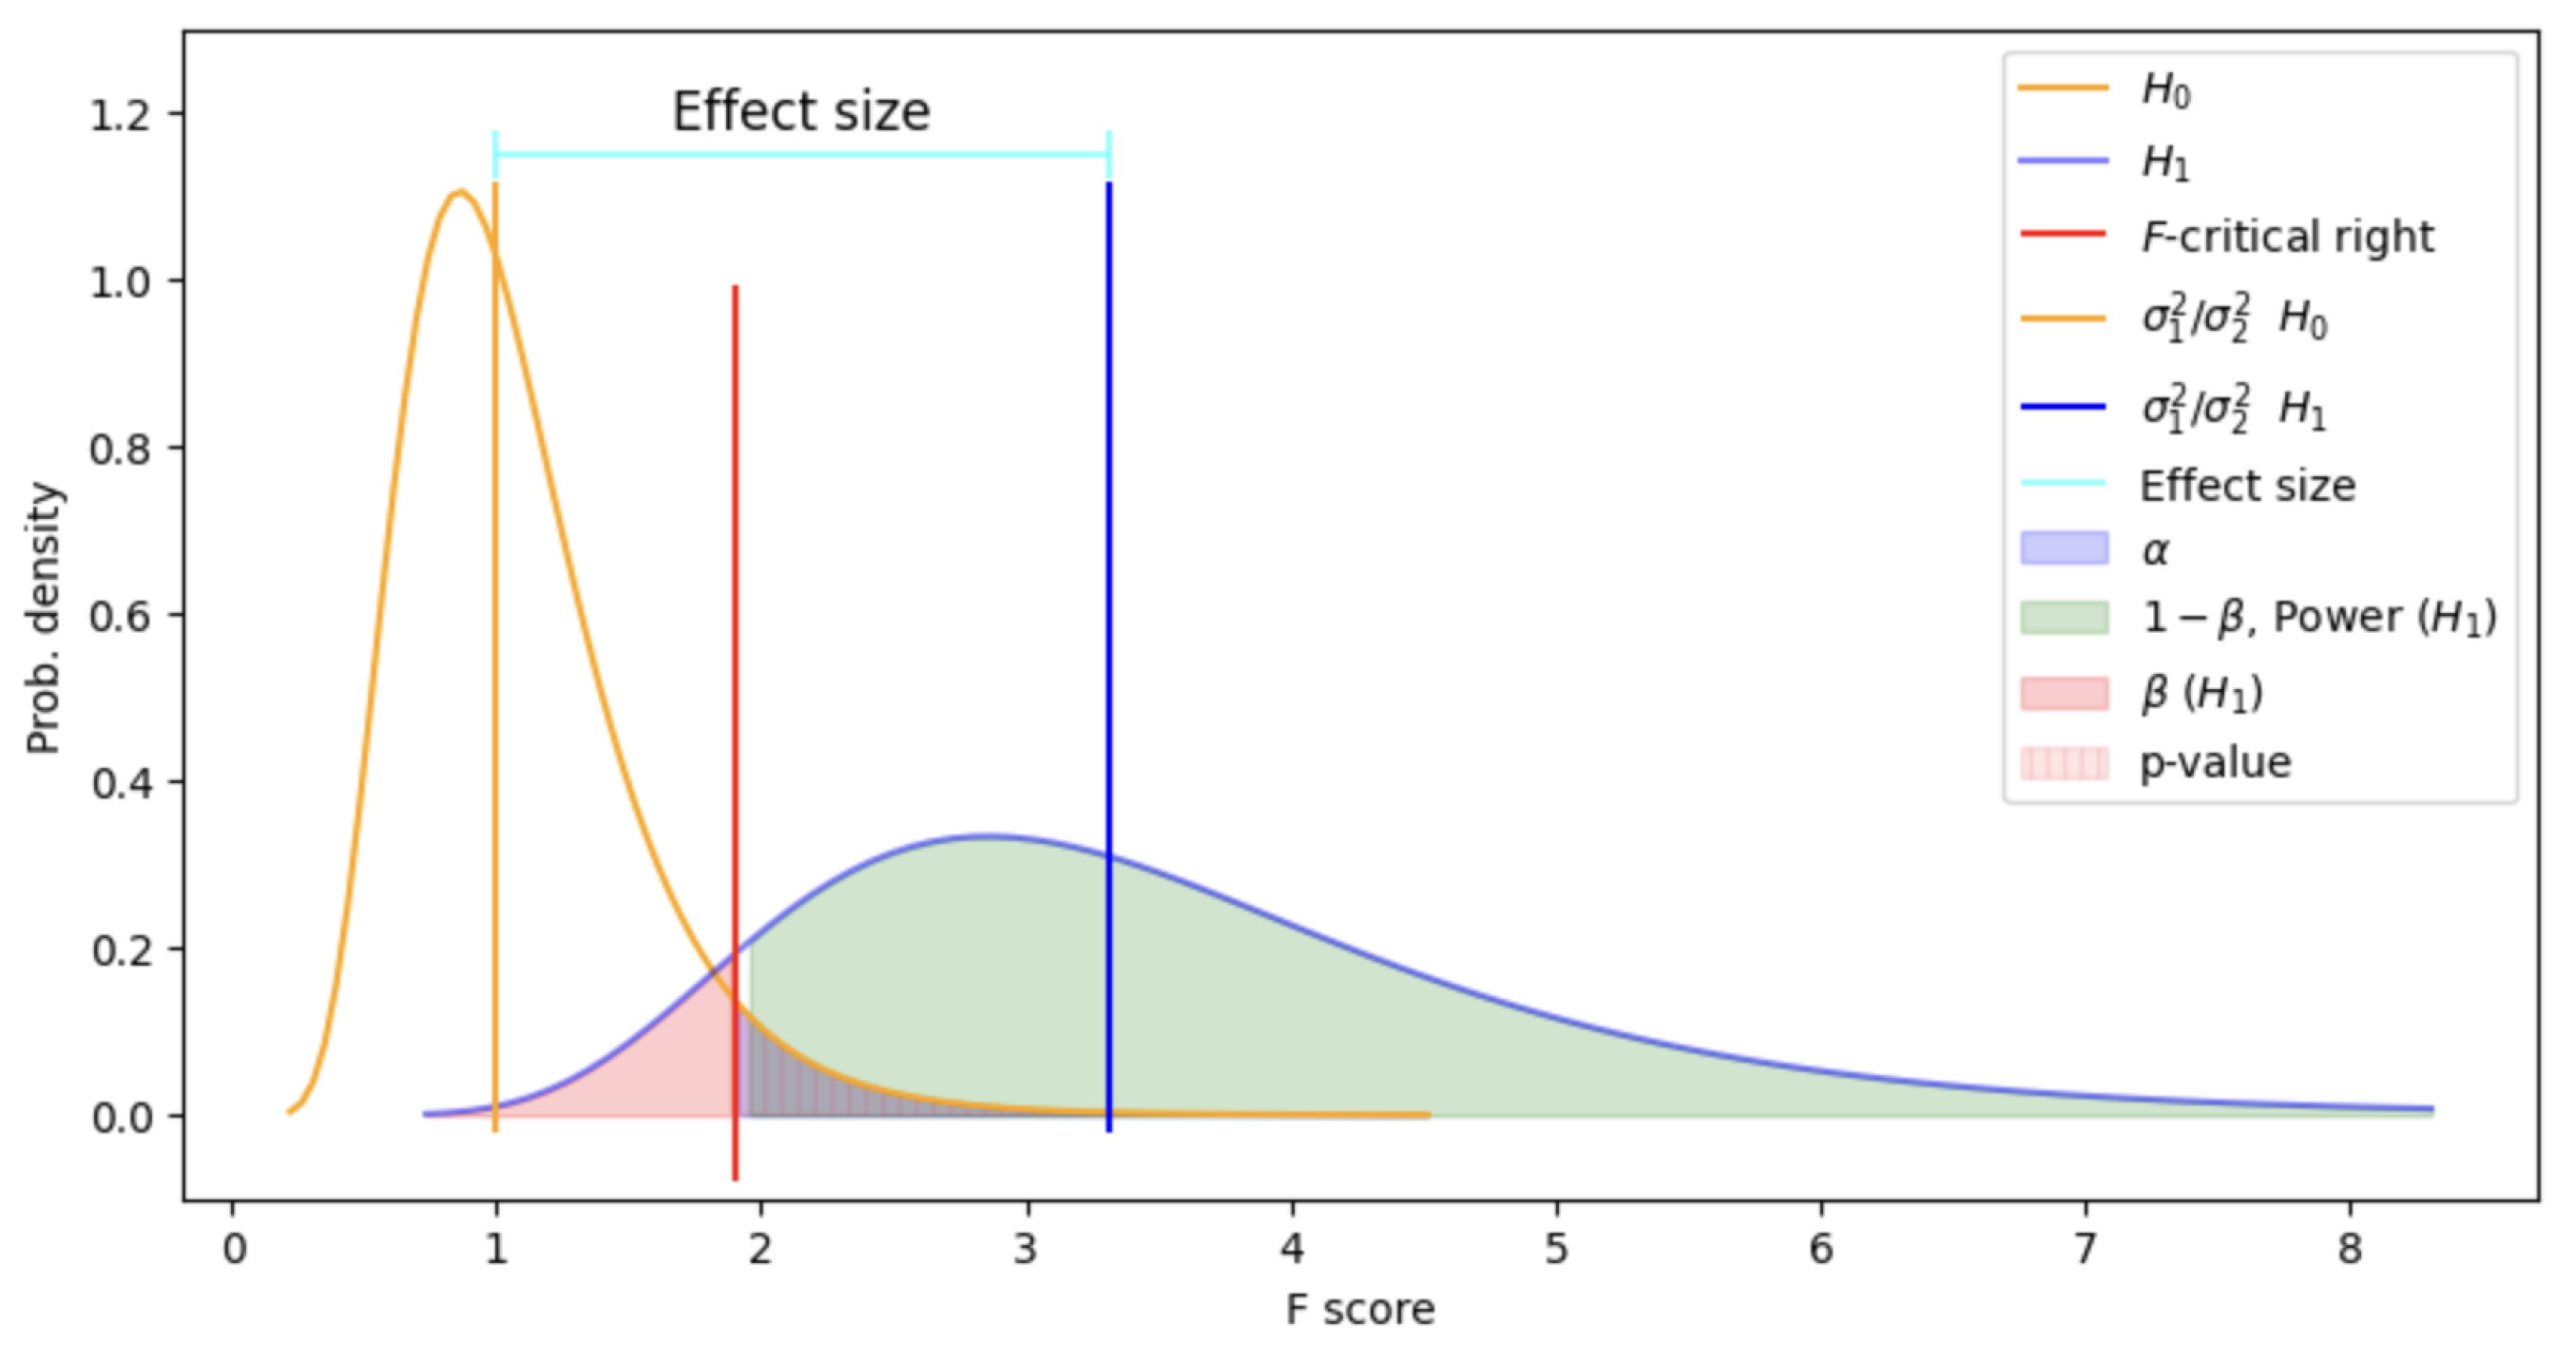
In the
Figure 7 and
Table 3, we can see the results of the executed Fisher’s
F-Test.
Conclusion: For this one-tailed test, since the p-value of 0.0014 is less than the pre-established alpha (
) of 0.05, or since the
F statistic of the test equal to 3.31 falls outside the non-rejection zone (0.00 to 1.90), we proceed to reject the
; therefore, we conclude that the variance of the Q2-FY22 period is statistically higher than the variance of the Q4-FY22 period. Then, upon evaluating the power of
[
41], we see that the exhibited power of 0.92 is greater than the threshold of 0.80 and the relative effect size of 1.8204 is also highly relevant, so we conclude that in practical terms the variance of the Q4-FY22 period is significantly lower than that of the Q2-FY22 period, meaning that there is a significant and relevant reduction in the variability of the AgilityDebt™ data in CBO.
4.4. Difference of Means Test (Student’s T-Test)
Once we complete the variance difference test, we proceeded to carry out the expected test of difference of means (applying different variances). The
t-test of Student can be utilized in cases where at least one of the sample sizes is small (less than 30 units), the samples are independent, the populations have normal distribution, and the variances of both populations are equal [
38,
50]. If the latter requirement is not met (equality of variances), as is the case in our study since the variances are not equal, we apply the
t-test of Student with an adjustment in the equation to calculate the degrees of freedom, without calculating the pooled variance [
51]. In this case, we use the sample variances to calculate the standard deviation of the difference of the sample means.
In this test, the hypotheses are formulated as follows:
The null hypothesis states that the difference is equal to 0:
and the alternative hypothesis states that the difference is less than 0:
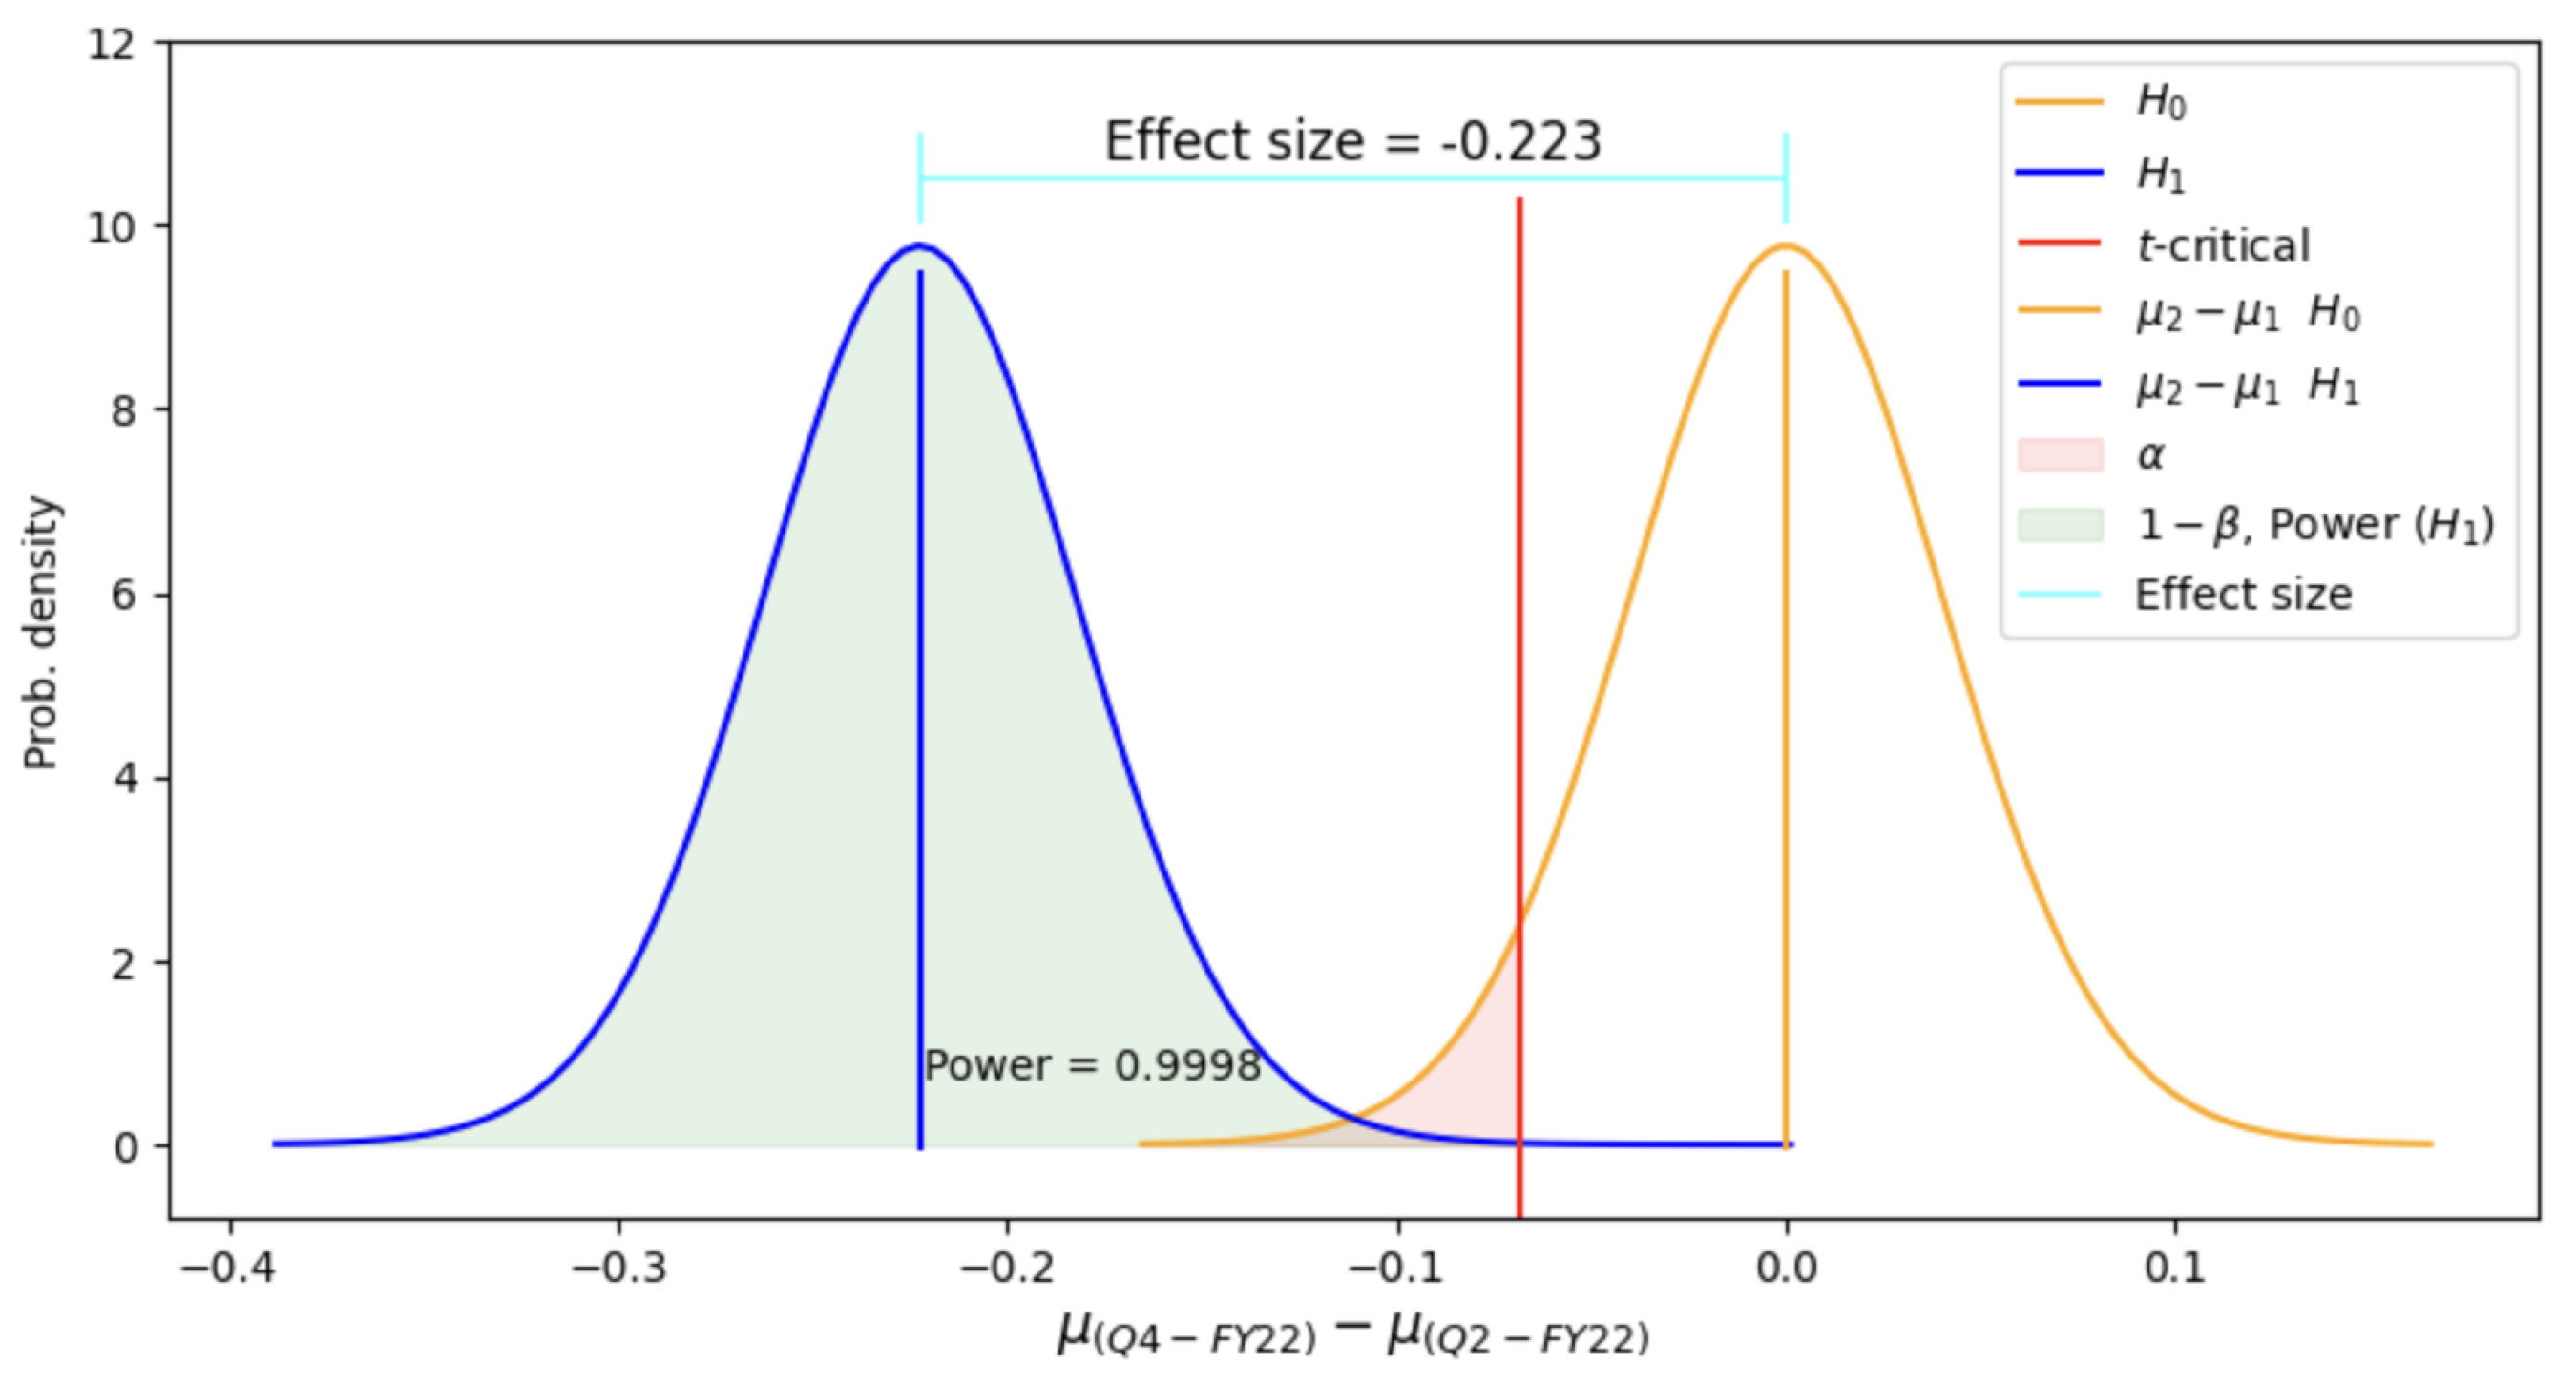
This is because we want to test whether the reduction exhibited in AgilityDebt™ from Q4-FY22 compared to Q2-FY22 was actually less than zero, and not just due to chance. In the
Figure 8 and
Table 4, we can see the results of the executed Student’s
t-Test.
Conclusion: Since the t test statistic of −5.48 was less than the critical T equal to −1.68, or the p-value was less than the preset alpha () of 0.05, the is rejected, concluding that the average of Q4-FY22 is statistically lower than the average of Q2-FY22.
As the
is rejected, we proceed to calculate the effect size and power of the test [
39,
40].
From the power analysis, we conclude that the effect [
41] produced by the AgilityDebt™ improvement project, which reduced the indicator by 2230 basis points, is highly significant. Additionally, the reduction exhibits statistical power of almost 100%. Therefore, the improvement is not due to random chance, but is real and highly relevant.
4.5. Analysis Conclusions
In conclusion, the analysis conducted in this research demonstrates a highly significant improvement in TCS Latam’s AgilityDebt™ CBO. The average reduction in the indicator is not only statistically significant but also relevant, with a 43% decrease, equivalent to a reduction of 2230 basis points between Q2-FY22 and Q4-FY22. This impressive result surpasses the initial goal of a 30% reduction. Additionally, the analysis reveals a marked improvement in consistency among the countries reporting the debt indicator within the Latam region. This is evidenced by a significant decrease in variance between Q2-FY22 and Q4-FY22, translating to a substantial 45% reduction in terms of standard deviation.
4.6. Continuous Improvement
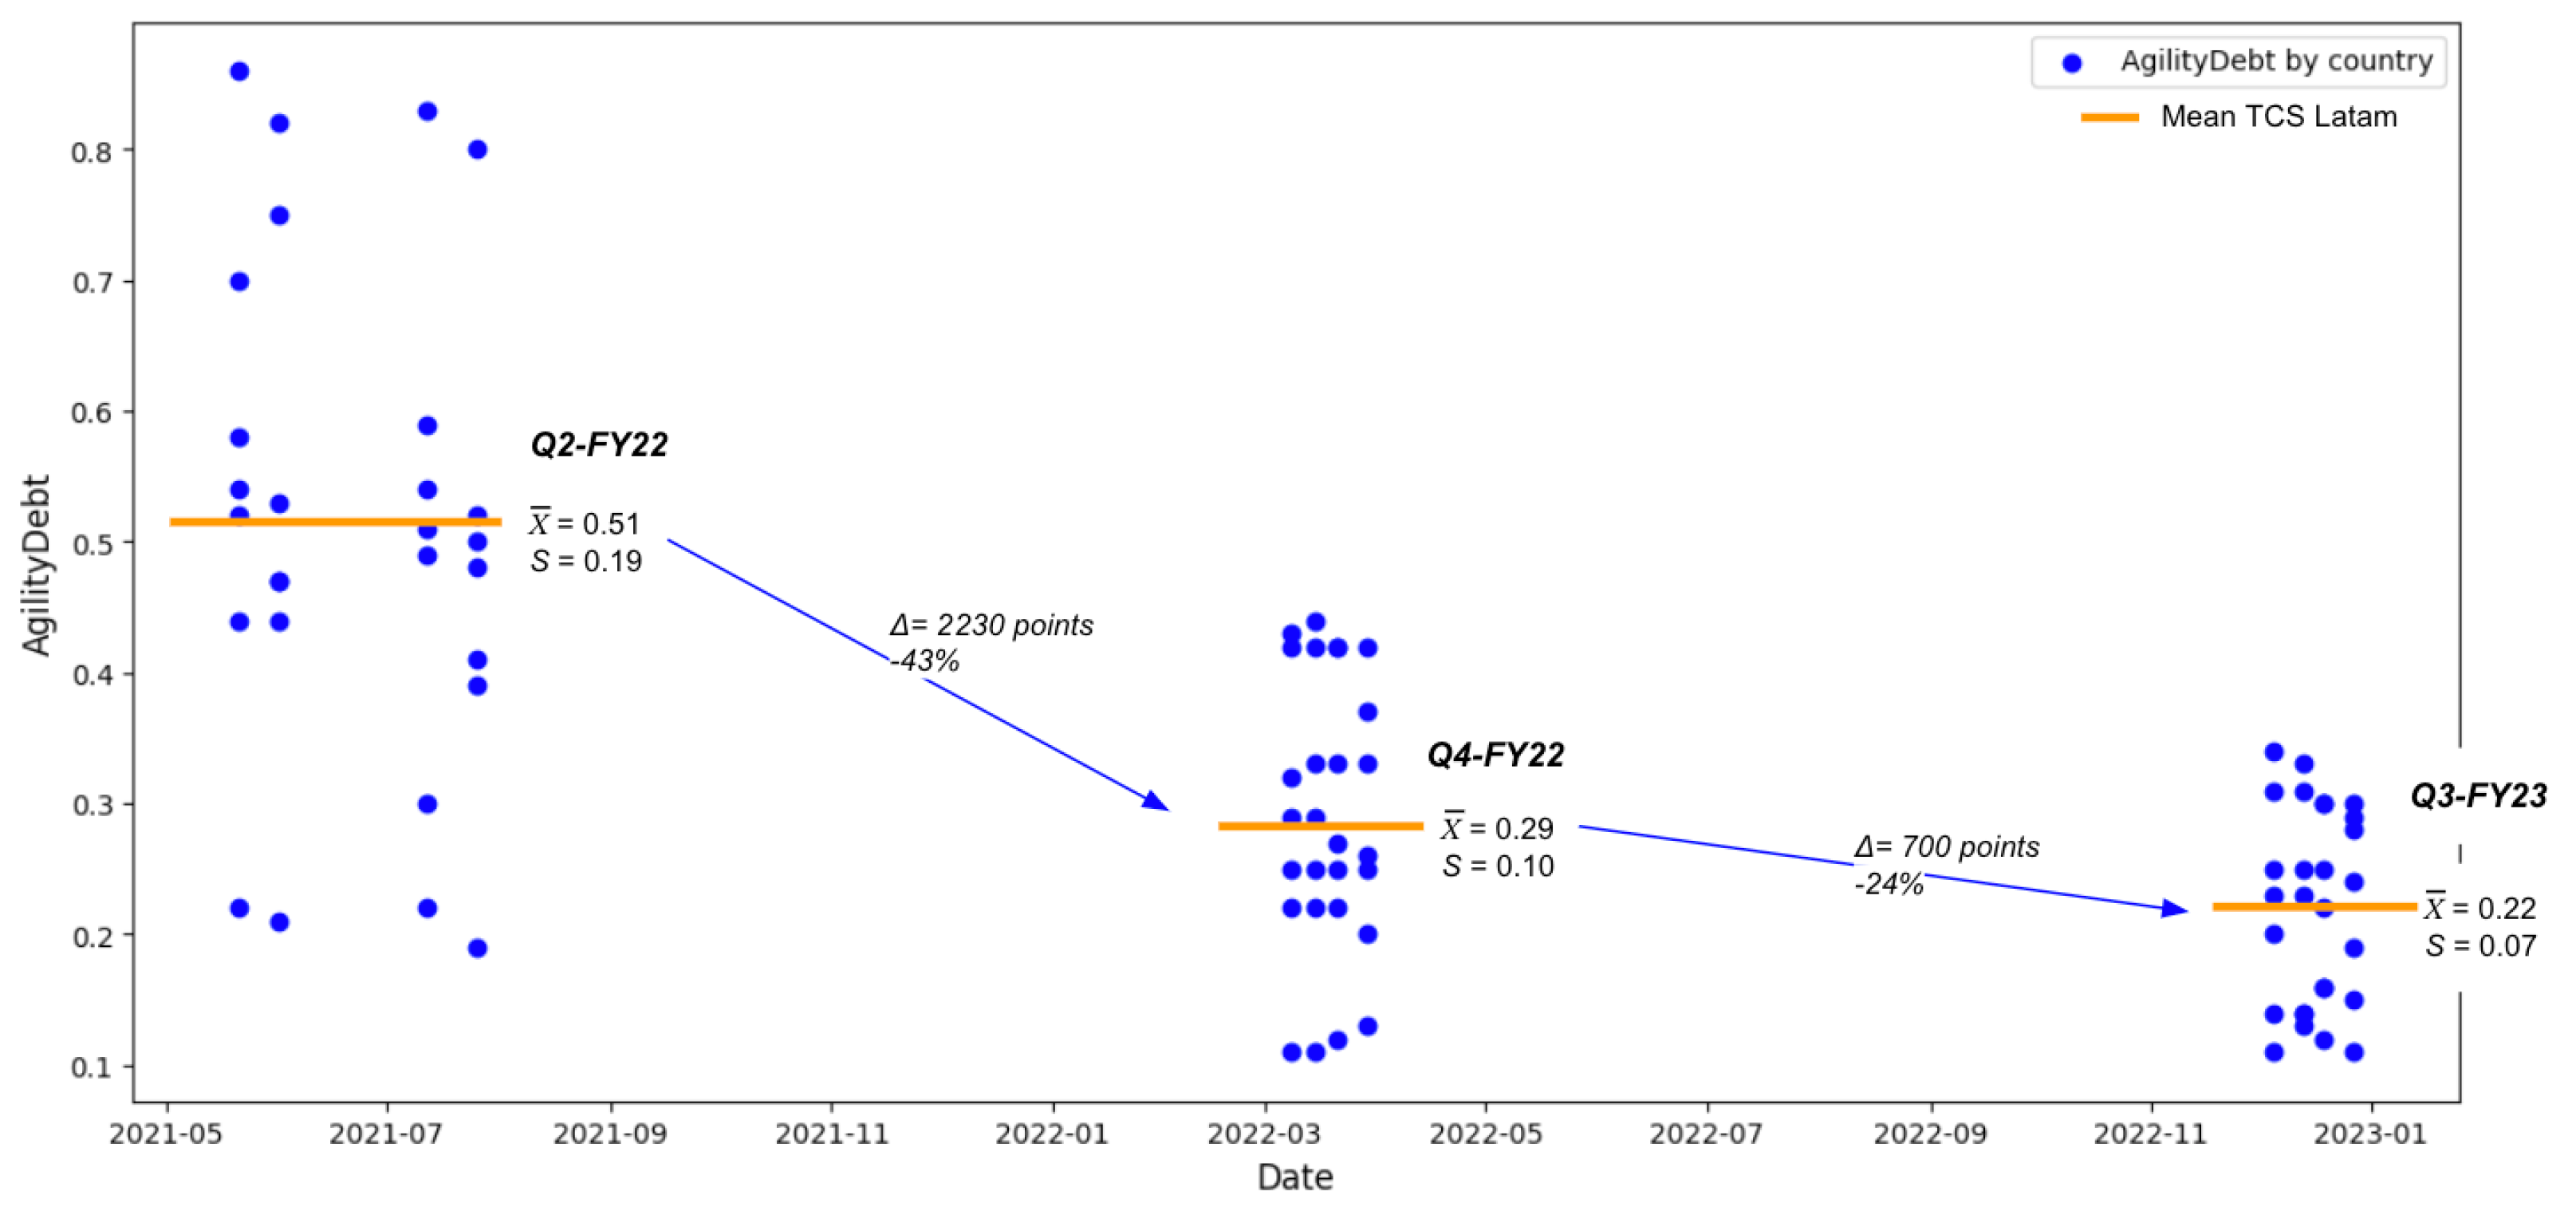
The path to improve AgilityDebt™ does not end here. TCS Latam continues to apply the same improvement framework to further reduce and control this parameter. By the end of the third quarter of fiscal year 2023 (Q3-FY23), the indicator continues to decrease, reaching 0.22 (see
Figure 9). This reduction is statistically significant in both mean and variance, and in its substantive relevance for the organization.
Today, we see an empowered agile movement that has created different learning communities [
48] within TCS, an agile competence enriched with new change agents such as Scrum Masters [
43], Agile Champions, Agile Coaches [
47], and certainly, better-equipped projects with disruptive practices and tools are delivering better outcomes for clients. It is important to mention that as of the third quarter of fiscal year 2023 (Q3-FY23), the IT AgilityDebt™ is also at a mean of 0.22.
In
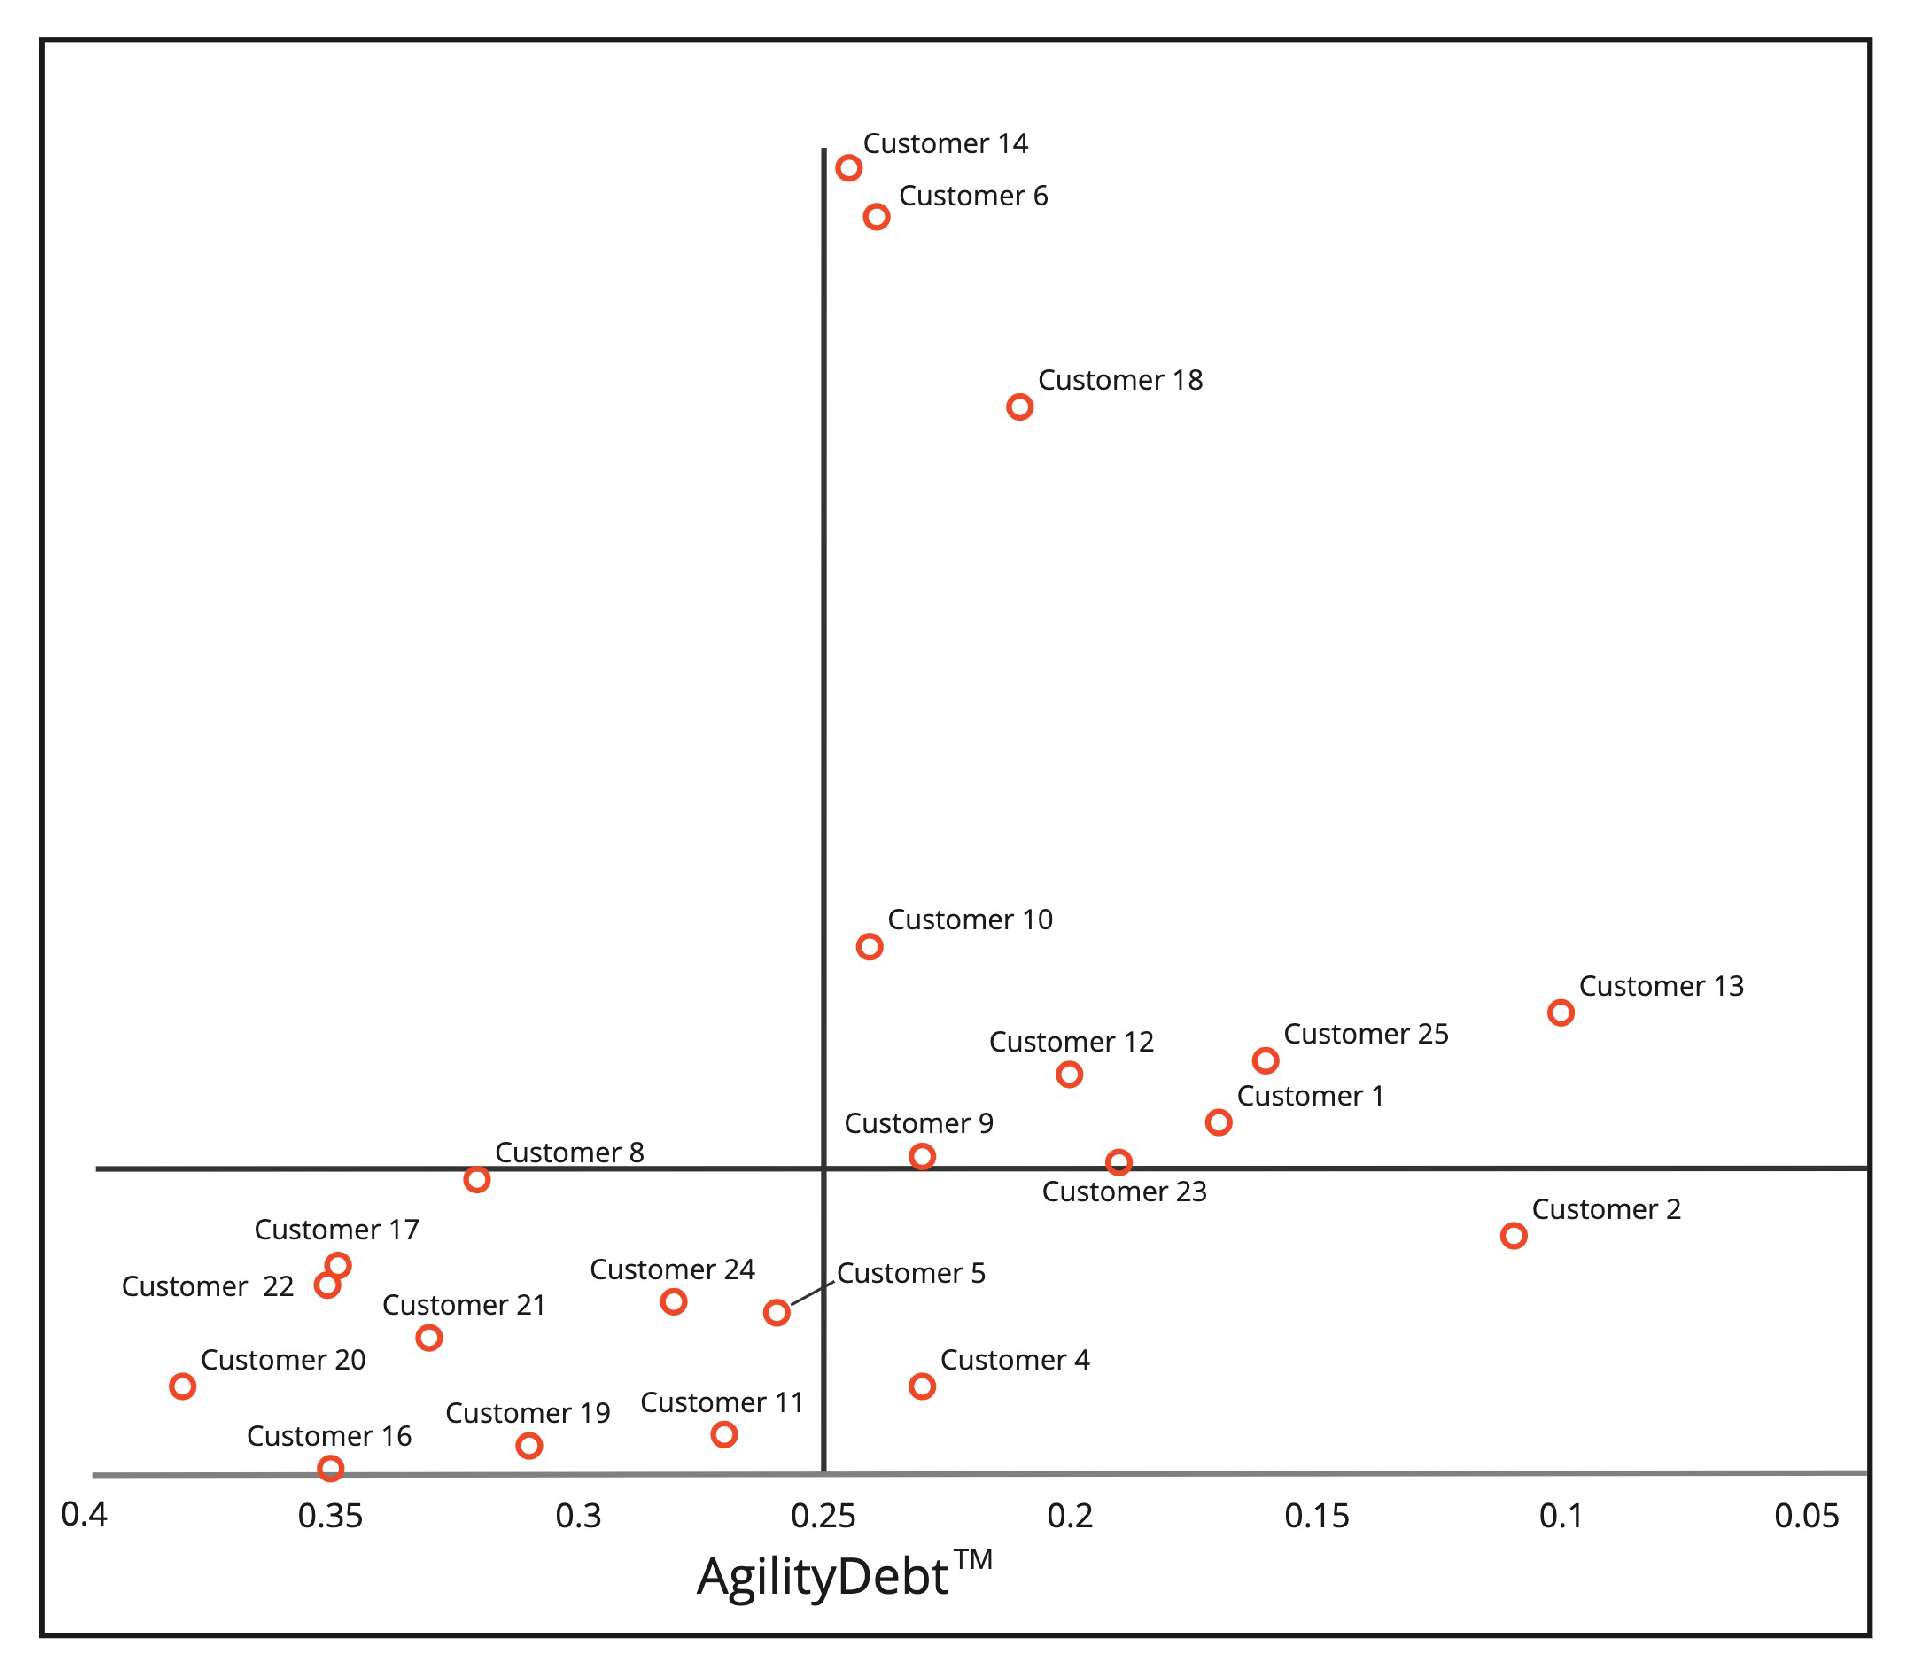
Figure 10, the correlation between the level of AgilityDebt™ calculated by TCS clients and the commercial growth rate they have exhibited can be appreciated.
This study is key to demonstrating the value of AgilityDebt™ and its direct impact on business outcomes. The ’TCS Agile Initiative Network’ team leads the agile practice for all of TCS worldwide and carries out the analysis globally [
52].
Our work demonstrates that enterprise agility is fundamental to business success and can be achieved through an agile, collaborative, and transparent approach [
19,
43].
5. Discussion: Key Recommendations for Implementing a System for Measuring Enterprise Agility
Implementing a system for measuring enterprise agility may seem like a complex task, especially if the organization has no previous experience in this field. However, there are some key recommendations that can help guide the process and ensure its success:
Define the purpose and objectives of the measurement system: The first step in implementing a system for measuring enterprise agility is to define its purpose and objectives. Why do we want to measure enterprise agility? What results do we expect to obtain? Which areas of the organization do we want to improve? What matters to measure in this transformation? These questions should be answered before starting to collect data, and ideally, it should be a co-created process that connects with the organization’s vision and purpose [
53].
Identify the key dimensions of enterprise agility: To measure organizational agility effectively, it is important to identify the key dimensions that must be measured. These may include the ability to experiment and adapt to change [
13], the speed of decision-making, project maturity, the ability to learn and continuously improve, collaboration, and transparency in communication, among others [
14].
Select appropriate metrics and measurement tools: Once the key dimensions have been identified, it is necessary to select appropriate metrics and measurement tools for each of them. Metrics may include response time to changes, product delivery time, the number of production errors, customer satisfaction, the number of agile practitioners, among others. Measurement tools may vary from surveys and interviews for perception metrics to real-time database reading for operational metrics. It is ideal to incorporate data analysis tools [
54].
Establish a system for data collection and analysis: The next step is to establish a system for data collection and analysis. This may involve real-time data capture and processing through a polynomial that calculates a global metric, which can scale both vertically and horizontally. Here, exploratory data analysis is essential to visualize information and help identify patterns and insights, create timely alerts [
54], and most importantly, define research questions and continuous improvement hypotheses. It is important to ensure that the data collection and analysis system is reliable and consistent to ensure the accuracy of the results.
Establish a feedback and continuous improvement process: Finally, it is important to establish a feedback and continuous improvement process [
11,
18] to ensure that the enterprise agility measurement system is working effectively. This may involve reviewing and adjusting metrics and measurement tools, reviewing the results obtained, and implementing improvements [
44] to address the areas for improvement identified.
By following these steps, an organization can measure and improve its enterprise agility effectively, reliably, and consistently. Lastly, it is important to remember that all of the above requires a highly connected human team with the organizational transformational purpose [
53]. Without this connection, there will be no essential inspiration, momentum, and energy to energize the organization [
19].
6. Conclusions
The need to measure agility is essential for any organization that wishes to improve its response to environmental changes and the growing complexity of its customers and stakeholders. However, the challenge is not insignificant and faces problems at both methodological and cultural levels.
The history of the agile transformation in TCS Latam is an interesting and valuable case study, which shows how the implementation of concrete measures and continuous improvement can lead to significant results in enterprise agility. The use of the AgilityDebt™ index as a measurement tool and the focus on agile mindset, socialization of agile culture, and the formation of collaborative teams [
42] have been key factors in the success of this initiative [
14].
The active participation of leaders and the agile community has been crucial in ensuring the sustainability of the results [
46]. This case has demonstrated that agility is not merely an abstract goal but can be measured and improved in a tangible way, with clear benefits for teams, clients, and the organization as a whole. Overall, this case study offers valuable insights into how an organization can leverage agile practices and principles to enhance its agility, foster innovation, and create value for its stakeholders [
19].
In methodological terms, our work applied, among other tests, the Fisher–Snedecor power analysis test for variance inequality. To the best of our knowledge, this type of test represents a novel implementation in this type of organizational metric calculation and process. This kind of test assumes normality in the data. As future work, we aim to create a new workflow considering non-parametric tests to address data with other distributions.
Based on these encouraging results, several next steps are recommended to navigate toward an agile culture and strategy: First, investigate the key factors contributing to the observed improvements in the agility debt indicator and identify best practices that can be shared across the organization to sustain and further enhance performance. Second, develop a continuous improvement plan to periodically assess and adjust the AgilityDebt™ strategy, ensuring it remains relevant and effective in addressing new challenges that may arise in the dynamic business environment. Third, expand the scope of the research to include a broader range of performance metrics and a more comprehensive analysis of the impact of the AgilityDebt™ on overall business performance, including customer satisfaction and financial outcomes. Fourth, strengthen communication and collaboration between organization teams to ensure the successful implementation of identified best practices and to foster a culture of continuous improvement throughout the organization. Finally, conduct regular reviews and update the AgilityDebt™ strategy as needed, based on the evolving business landscape and the lessons learned from ongoing performance monitoring and analysis. As a fifth point of consideration, the potential incorporation of alternative indices, as delineated in the Methodology section, could enhance the statistical analysis. This approach may offer further evaluation of the method’s scalability across a variety of business agility measurement systems.
Are you looking to enhance your organization’s agile maturity and achieve replicable and scalable positive impacts? To achieve your goals, it is essential to have the right tools and strategies in place. Analyzing data and utilizing agile assets can provide valuable insights that will inform your decision-making process. Furthermore, working with an experienced team of agile coaches can help ensure a successful transformation journey.
Author Contributions
Conceptualization, R.M.-D. and A.L.-A.; Methodology, R.M.-D., A.L.-A. and J.G.; Software, R.M.-D. and A.L.-A.; Validation, R.M.-D., A.L.-A. and J.G.; Formal analysis, J.G.; Investigation, R.M.-D.; Writing—original draft, R.M.-D. and J.G.; Writing—review & editing, A.L.-A. and J.G.; Visualization, A.L.-A.; Supervision, J.G. All authors have read and agreed to the published version of the manuscript.
Funding
This research received no external funding.
Data Availability Statement
The data used in this study is obtained from the internal information systems of TCS and the clients involved in the studies. In both cases, the data is not publicly accessible.
Acknowledgments
We appreciate the opportunity, support, comments, suggestions, and complementary material shared to strengthen this article from Vaidiyanathan Sathyamurthy (Director of Delivery Excellence for TCS Latam), Jorge Abad Londoño (Head Agility for TCS Latam), Mohammed Musthafa Soukath Ali (Head-TCS Strategic Initiative), and Durba Biswas (Agile Coach-Agile Initiative Network).
Conflicts of Interest
The authors declare no conflict of interest.
References
- Bradley, J.B.; Loucks, J.; Macaulay, J.; Noronha, A.; Wade, M. Digital Vortex: How Digital Disruption Is Redefining Industries; Global Center for Digital Business Transformation, 2015. [Google Scholar]
- Porter, M.E. Competitive Strategy: Creating and Sustaining Superior Performance; The Free: New York, NY, USA, 1985. [Google Scholar]
- Chesbrough, H.W. Open Innovation: The New Imperative for Creating and Profiting from Technology; Harvard Business Press: Brighton, MA, USA, 2003. [Google Scholar]
- Drucker, P.F. What makes an effective executive. Harv. Bus. Rev. 2004, 82, 58–63, 136. [Google Scholar]
- Barney, J.B.; Peteraf, M.A. Comment on Hashai and Buckley: Transactions costs, capabilities, and corporate advantage considerations in theories of the multinational enterprise. Glob. Strategy J. 2014, 4, 70–73. [Google Scholar] [CrossRef]
- Christensen, C.M. The Innovator’s Dilemma: When New Technologies Cause Great Firms to Fail; Harvard Business Review Press: Brighton, MA, USA, 2013. [Google Scholar]
- Teece, D.J.; Pisano, G.; Shuen, A. Dynamic capabilities and strategic management. Strateg. Manag. J. 1997, 18, 509–533. [Google Scholar] [CrossRef]
- Schwaber, K.; Beedle, M. Agile Software Development with Scrum; Series in Agile Software Development; Prentice Hall: Upper Saddle River, NJ, USA, 2002; Volume 1. [Google Scholar]
- Aghina, W.; Handscomb, C.; Ludolph, J.; Rona, D.; West, D. Enterprise Agility: Buzz or Business Impact; McKinsey & Company: New York, NY, USA, 2020; pp. 1–19. [Google Scholar]
- Fowler, M.; Highsmith, J.; Fowler, M. The agile manifesto. Softw. Dev. 2001, 9, 28–35. [Google Scholar]
- Womack, J.P.; Jones, D.T. Lean Thinking: Banish Waste and Create Wealth in Your Corporation, 2nd ed.; Simon and Schuster: New York, NY, USA, 2003. [Google Scholar]
- TCS. TCS COIN™; TCS: Mumbai, India, 2018; Volume 1, pp. 2–4. [Google Scholar]
- Takeuchi, H.; Nonaka, I. The new new product development game. Harv. Bus. Rev. 1986, 64, 137–146. [Google Scholar]
- Denning, S. The Age of Agile: How Smart Companies Are Transforming the Way Work Gets Done, 1st ed.; Amacom: New York, NY, USA, 2018. [Google Scholar]
- TCS. Winning in a Business 4.0 World; TCS: Mumbai, India, 2019; Volume 1, pp. 4–52. [Google Scholar]
- Abad, J.H.; Salazar, L.; Jimenez, A.; Moraga, R.A. Nuevas Aguas, Nuevos Navíos, Nuevos Navegantes: Business Agility Con Notas Sobre Transformación Digital, 1st ed.; Amazon Digital Services LLC: Seattle, WA, USA, 2022. [Google Scholar]
- Kotter, J.P. Leading change: Why transformation efforts fail. In Museum Management and Marketing; Routledge: Abingdon-on-Thames, UK, 2007; pp. 20–29. [Google Scholar]
- Liker, J.K. The Toyota Way: 14 Management Principles from the World’s Greatest Manufacturer, 1st ed.; McGraw-Hill: New York, NY, USA, 2004. [Google Scholar]
- Hamel, G. The Future of Management, 1st ed.; Harvard Business Press: Brighton, MA, USA, 2007. [Google Scholar]
- Edmondson, A.C. Strategies for learning from failure. Harv. Bus. Rev. 2011, 89, 48–55. [Google Scholar]
- Silva, D.S.; Ghezzi, A.; Aguiar, R.B.d.; Cortimiglia, M.N.; ten Caten, C.S. Lean Startup, Agile Methodologies and Customer Development for business model innovation: A systematic review and research agenda. Int. J. Entrep. Behav. Res. 2020, 26, 595–628. [Google Scholar] [CrossRef]
- Mundra, S. Enterprise Agility: Being Agile in a Changing World, 1st ed.; Packt Publishing: Birmingham, UK, 2018. [Google Scholar]
- Tarba, S.Y.; Frynas, J.G.; Liu, Y.; Wood, G.; Sarala, R.M.; Fainshmidt, S. Strategic agility in international business. J. World Bus. 2023, 58, 100737. [Google Scholar] [CrossRef]
- Zahra, S.A.; George, G. Absorptive capacity: A review, reconceptualization, and extension. Acad. Manag. Rev. 2002, 27, 185–203. [Google Scholar] [CrossRef]
- Harry, M.J. Six Sigma: A Breakthrough Strategy for Profitability. Qual. Prog. 1998, 31, 60–64. [Google Scholar]
- Jarrar, Y.F.; Zairi, M. Best practice transfer for future competitiveness: A study of best practices. Total Qual. Manag. 2000, 11, 734–740. [Google Scholar] [CrossRef]
- Giacosa, E.; Culasso, F.; Crocco, E. Customer agility in the modern automotive sector: How lead management shapes agile digital companies. Technol. Forecast. Soc. Chang. 2022, 175, 121362. [Google Scholar] [CrossRef]
- Li, M.; Malik, M.S.; Ijaz, M.; Irfan, M. Employer Responses to Poaching on Employee Productivity: The Mediating Role of Organizational Agility in Technology Companies. Sustainability 2023, 15, 5369. [Google Scholar] [CrossRef]
- Munteanu, A.I.; Bibu, N.; Nastase, M.; Cristache, N.; Matis, C. Analysis of practices to increase the workforce agility and to develop a sustainable and competitive business. Sustainability 2020, 12, 3545. [Google Scholar] [CrossRef]
- Anjum, F.; Veermanju, K.T. Company Analysis: Tata Consultancy Services. IARJSET 2022, 9, 53–71. [Google Scholar] [CrossRef]
- TCS. Agile As a Way of Life: The TCS Story; TCS: Mumbai, India, 2022; Volume 1, p. 1. [Google Scholar]
- Omoush, M.M. Investigation the relationship between supply chain management activities and operational performance: Testing the mediating role of strategic agility-a practical study on the pharmaceutical companies. Int. Bus. Res. 2020, 13, 1–74. [Google Scholar] [CrossRef] [Green Version]
- Crupi, A.; Liu, S.; Liu, W. The top-down pattern of social innovation and social entrepreneurship. Bricolage and agility in response to COVID-19: Cases from China. R&D Manag. 2022, 52, 313–330. [Google Scholar]
- Cumming, G. Introduction to the New Statistics: Estimation, Open Science, and Beyond, 1st ed.; Routledge: Abingdon-on-Thames, UK, 2016. [Google Scholar]
- Anderson, T.W.; Darling, D.A. A test of goodness of fit. J. Am. Stat. Assoc. 1954, 49, 765–769. [Google Scholar] [CrossRef]
- Fisher, R.A. Statistical Methods for Research Workers, 1st ed.; Oliver and Boyd: Edinburgh, UK, 1925. [Google Scholar]
- Snedecor, G.W.; Cochran, W.G. Statistical Methods, 8th ed.; Iowa State University Press: Ames, IA, USA, 1989. [Google Scholar]
- Student. The Probable Error of a Mean. Biometrika 1908, 6, 1–25. [Google Scholar] [CrossRef]
- Cohen, J. Statistical Power Analysis for the Behavioral Sciences, 2nd ed.; Lawrence Erlbaum Associates: Mahwah, NJ, USA, 1988. [Google Scholar]
- Cohen, J. Statistical Power Analysis. Curr. Dir. Psychol. Sci. 1992, 1, 98–101. [Google Scholar] [CrossRef]
- Ellis, P.D. The Essential Guide to Effect Sizes: An Introduction to Statistical Power, Meta-Analysis and the Interpretation of Research Results, 1st ed.; Cambridge University Press: Cambridge, UK, 2010. [Google Scholar]
- Kotter, J.P. Leading Change: Why Transformation Efforts Fail. Harv. Bus. Rev. 1995, 73, 59–67. [Google Scholar]
- Schwaber, K.; Sutherland, J. The Scrum Guide The Definitive Guide to Scrum: The Rules of the Game, 6th ed. 2020. Available online: scrumguides.org (accessed on 25 March 2023).
- Lockwood, T. Design Thinking: Integrating Innovation, Customer Experience, and Brand Value, 1st ed.; Allworth Press: New York, NY, USA, 2009. [Google Scholar]
- Gray, D.; Brown, S.; Macanufo, J. Gamestorming: A Playbook for Innovators, Rulebreakers, and Changemakers, 1st ed.; O’Reilly Media, Inc.: Sebastopol, CA, USA, 2010. [Google Scholar]
- Deming, W.E. Out of the Crisis, 1st ed.; MIT Press: Cambridge, MA, USA, 1982. [Google Scholar]
- Soukath, M.M. The Road to Agile Coaching: A Life Changing Leadership Role, 1st ed.; Amazon Digital Services LLC: Seattle, WA, USA, 2020. [Google Scholar]
- Wenger, E. Communities of Practice: Learning, Meaning, and Identity, 1st ed.; Cambridge University Press: Cambridge, UK, 1998. [Google Scholar]
- Anderson, D.J. Kanban: Successful Evolutionary Change for Your Technology Business, 1st ed.; Blue Hole Press: Chicago, IL, USA, 2010. [Google Scholar]
- Neyman, J.; Pearson, E.S. On the Problem of the Most Efficient Tests of Statistical Hypotheses. Philos. Trans. R. Soc. London. Ser. A Contain. Pap. Math. Phys. Character 1933, 231, 289–337. [Google Scholar] [CrossRef] [Green Version]
- Welch, B.L. The Generalization of `Student’s’ Problem When Several Different Population Variances Are Involved. Biometrika 1947, 34, 28–35. [Google Scholar] [CrossRef] [PubMed]
- TCS. Here’s the TCS Agile Transformation Story; TCS: Mumbai, India, 2022; Volume 1, p. 1. [Google Scholar]
- Satell, G. Cascades: How to Create a Movement That Drives Transformational Change, 1st ed.; McGraw-Hill: New York, NY, USA, 2019. [Google Scholar]
- Provost, F.; Fawcett, T. Data Science for Business: What You Need to Know about Data Mining and Data-Analytic Thinking, 1st ed.; O’Reilly Media: Sebastopol, CA, USA, 2013. [Google Scholar]
Figure 1.
AgilityDebt™ dashboard by country. This panel is generated from the database that contains the operational records of TCS. It provides a double aggregated view, both by country and by evaluated factor, arriving at the overall data for TCS Latam.
Figure 1.
AgilityDebt™ dashboard by country. This panel is generated from the database that contains the operational records of TCS. It provides a double aggregated view, both by country and by evaluated factor, arriving at the overall data for TCS Latam.
Figure 2.
Data analysis method. A suitable data analysis method uses sampling to perform an initial exploratory analysis before conducting hypothesis testing and advanced analysis. This rigorous approach ensures accurate and reliable conclusions.
Figure 2.
Data analysis method. A suitable data analysis method uses sampling to perform an initial exploratory analysis before conducting hypothesis testing and advanced analysis. This rigorous approach ensures accurate and reliable conclusions.
Figure 3.
Boxplot AgilityDebt™ IT: Q2-FY21, Q4-FY21. A box-plot chart with two datasets is useful for comparing the distribution of two numerical sets and can provide valuable information about the median, interquartile range, and outliers of the data (represented as asterisk in the plot).
Figure 3.
Boxplot AgilityDebt™ IT: Q2-FY21, Q4-FY21. A box-plot chart with two datasets is useful for comparing the distribution of two numerical sets and can provide valuable information about the median, interquartile range, and outliers of the data (represented as asterisk in the plot).
Figure 4.
AgilityDebt™ CBO Histogram-Q2-FY22, from the initial sample taken. Histograms are useful for visualizing the shape of the data distribution, including measures of central tendency, dispersion, and the presence of outliers.
Figure 4.
AgilityDebt™ CBO Histogram-Q2-FY22, from the initial sample taken. Histograms are useful for visualizing the shape of the data distribution, including measures of central tendency, dispersion, and the presence of outliers.
Figure 5.
AgilityDebt™ CBO Histogram-Q2-FY22 v/s Q4-FY22. Using two histograms in a single graph allows for a clear visual comparison of the distribution between two datasets. This approach can be helpful in identifying similarities and differences in the shape, spread, and presence of outliers within each set.
Figure 6.
Anderson–Darling normality test. The normality test of data is an important step in data analysis that ensures the validity and reliability of the results obtained by selecting appropriate statistical methods for the data distribution.
Figure 6.
Anderson–Darling normality test. The normality test of data is an important step in data analysis that ensures the validity and reliability of the results obtained by selecting appropriate statistical methods for the data distribution.
Figure 7.
Difference of variances test (Fisher’s F-test). This graph allows visualizing the hypothesis testing of variance difference and the associated statistical power analysis, which represents the effect produced.
Figure 7.
Difference of variances test (Fisher’s F-test). This graph allows visualizing the hypothesis testing of variance difference and the associated statistical power analysis, which represents the effect produced.
Figure 8.
Difference of means test (Student’s t-test). This graph allows visualizing the hypothesis testing of mean difference and the associated statistical power analysis, which represents the effect produced.
Figure 8.
Difference of means test (Student’s t-test). This graph allows visualizing the hypothesis testing of mean difference and the associated statistical power analysis, which represents the effect produced.
Figure 9.
Evolution of AgilityDebt™ CBO − TCS Latam. This graph illustrates the time evolution of AgilityDebt™, which has shown a negative trend over time.
Figure 9.
Evolution of AgilityDebt™ CBO − TCS Latam. This graph illustrates the time evolution of AgilityDebt™, which has shown a negative trend over time.
Figure 10.
Correlation analysis: AgilityDebt™ vs. growth. The plot presents a clear relationship between the variables, indicating that lower AgilityDebt is associated with higher growth.
Figure 10.
Correlation analysis: AgilityDebt™ vs. growth. The plot presents a clear relationship between the variables, indicating that lower AgilityDebt is associated with higher growth.
Table 1.
Sample statistics Q2-FY22.
Table 1.
Sample statistics Q2-FY22.
| Statistic | Value Q2-FY22 |
|---|
| Size | 28 |
| Mean | 0.51 |
| Std. dev. | 0.19 |
| Variance | 0.04 |
Table 2.
Sample statistics Q2-FY22 and Q4-FY22.
Table 2.
Sample statistics Q2-FY22 and Q4-FY22.
| Statistic | Value Q2-FY22 | Value Q4-FY22 |
|---|
| Size | 28 | 28 |
| Mean | 0.51 | 0.29 |
| Std. dev. | 0.19 | 0.10 |
| Variance | 0.04 | 0.01 |
Table 3.
F-Test results.
| Statistic | Value |
|---|
| F-test | 3.31 |
| F-critical | 1.90 |
| p-value | 0.0014 |
| Power | 0.9217 |
| Beta | 0.0783 |
| Effect (rate std. dev) | 1.8204 |
Table 4.
t-Test results.
| Statistic | Value |
|---|
| T-test | −5.48 |
| T-critical | −1.68 |
| p-value | 0.0000 |
| Power | 0.9998 |
| Beta | 0.0002 |
| Effect size | −0.2230 |
| Disclaimer/Publisher’s Note: The statements, opinions and data contained in all publications are solely those of the individual author(s) and contributor(s) and not of MDPI and/or the editor(s). MDPI and/or the editor(s) disclaim responsibility for any injury to people or property resulting from any ideas, methods, instructions or products referred to in the content. |
© 2023 by the authors. Licensee MDPI, Basel, Switzerland. This article is an open access article distributed under the terms and conditions of the Creative Commons Attribution (CC BY) license (https://creativecommons.org/licenses/by/4.0/).


