Article

An Embedded System Based on Raspberry Pi for Effective Electrocardiogram Monitoring

1
Electronics Engineering Department, Yarmouk University, Irbid P.O. Box 21163, Jordan
2
Biomedical Engineering Department, Yarmouk University, Irbid P.O. Box 21163, Jordan
*
Author to whom correspondence should be addressed.
Appl. Sci. 2023, 13(14), 8273; https://doi.org/10.3390/app13148273
Submission received: 22 June 2023 / Revised: 11 July 2023 / Accepted: 13 July 2023 / Published: 17 July 2023

Abstract

:
In recent years, there has been a growing demand for affordable and user-friendly medical diagnostic devices due to the rise in global diseases. This study focuses on the development of an embedded system based on Raspberry Pi that enables faster and more efficient monitoring of electrocardiogram (ECG). The incorporation of Raspberry Pi allows for both wireless and wired interfaces, facilitating the creation of an ECG diagnostic embedded system capable of real-time detection and immediate response to any abnormalities in heart functionality. The system presented in this research encompasses a comprehensive electronic circuit comprising analog and digital components to measure and display the ECG signal. Within the analog section, the circuit performs essential signal conditioning tasks, such as signal amplification and noise filtering, ensuring a clean signal within the desired frequency range. The entire system is powered using a power bank. The digital segment incorporates an analog-to-digital converter necessary for converting the received analog signal into a digital format compatible with Raspberry Pi. A graphical liquid-crystal display is utilized to display the measured signal. The device successfully measures ECG signals at various heart rates, capturing all crucial peaks that can be used as indicators of an individual’s health condition. By comparing the signals obtained from healthy individuals with those exhibiting heart arrhythmias, valuable insights can be gained regarding their health status. The proposed system aims to be portable, cost-effective, and user-friendly in different environments.

1. Introduction

The electrical activity of one’s heart over a period of time can be interpreted as what is called Electrocardiography (ECG) [1,2,3]. ECG is a non-stationary physiological signal that represents the graphic tracing of the voltage generated from the heart muscle or cardiac through a heartbeat [4,5,6]. The diagnostic of heart diseases highly depends on ECG since it provides a very precise evaluation of the heart performance [4,5,6,7]. Abnormal heart conditions such as conduction disturbance, arrhythmia and heart morphology can be interpreted from the monitored ECG signal [1,2,3,4,5,6,7].
The ECG signal is represented as a waveform with peaks and valleys that form the PQRST pattern [6,8,9,10]. The deflections of the sinus rhythm represent the events of the atria and the ventricles of the heart in the normal rhythm. The morphological characteristics of the heartbeat vary from person to person and for the same person under different circumstances [8,9,10]. The amplitudes of the P wave, QRS complex, S wave, T wave, and the intervals namely RR, PR, QT, and QRS complex are used to measure the health condition of the heart [6].
The variations in the morphological pattern of the heartbeat can be used by experienced doctors to detect any abnormal heart conditions. The changes of these measures are compared to the normal values to predict the cardiac arrhythmia which is referred to any irregular cardiac cycle patterns [10,11,12,13,14].
Continuous monitoring and analysis of ECG signals provide better diagnoses, assessment, and control of many of the cardiovascular diseases (CVDs) [10,11]. The risk of heart diseases could be prevented by early and fast monitoring using advance systems [4,5,7,8,9,10,11,12]. Nowadays, there is a real suffering due to the lack of availability of important medical resources for the treatment of heart diseases especially in developing countries; where there is not enough number of medical experts and clinical equipment [4,5,7,10,11]. Therefore, developing a reliable, automatic, and low-cost system is necessary for monitoring and diagnosing of diseases. This system can be controlled by linking appropriate medical assessments to utilizing computer-aided diagnosis systems (CADS). An automatic monitoring procedures for health conditions is provided by CADS, it basically works based on analyzing physiological signals for monitoring and evaluating the functionality of the corresponding organ [2,3,4,5,8,9,10]. The advance development in sensor technology, electronic and communication infrastructure, machine learning algorithms, modeling, and data processing lead to introducing a great development in healthcare devices. As a result, ECG monitoring systems have been developed and widely used in the healthcare sector [13,14,15,16,17,18,19,20].
Powerful processors including microprocessors, microcontrollers, digital signal processors, FPGA, etc. have been widely used for embedded systems due to the development in technological advances such as in microelectronics and software engineering [3,4,5,6]. They are also used for building sophisticated personal computers (PC) and communication networks with varied standards such as TCP/IP, GSM, Bluetooth, Wi-Fi, ZigBee, etc. [3,4,5,6,7,14]. The advances in electronics and software technologies have also led to the development of portable systems that are cheap, compact, and light in weight [9,10,11,12,13,14]. These systems are user friendly, and can be accessible to large number of people in the world including the developing countries. One of the most important uses of portable systems is in the design of medical devices such as the ECG monitors that can be used to save more lives, and create valuable data for research and diagnostic.
ECG acquisition modules have been developed to study the ECG signal [15,16,17,18,19,20], and some standard databases have been used to analyze the signal. Some software solutions are used for signal processing to reduce the noise and to classify the cardiovascular diseases [20,21,22,23,24,25,26,27].
Moreover, cost-effective embedded systems have been designed based on standard and cheap components [5,7,8,21,22]. Some of these systems were built based on microcontroller units to do the necessary control for the acquisition of the ECG and the disease classification [23,24,25,26,27,28]. Remote monitoring of ECG via Bluetooth [5,14] or via a radio frequency (RF) module integrated into a microcontroller [18,19,21,22,23,24,25,26,27,28] have been applied extensively in literature. Noureddine et al. [5] presented a portable miniature wireless device for ECG measurements that can be used for early heart attack detection. They implemented the acquisition module with wireless transmission capabilities that can be used for real time ECG processing and visualization in mobile devices. The results they presented show that the measured ECG signal is noisy and some of the peaks are missing which might affect the accuracy of heart disease diagnosis. Yadav et al. [7] proposed a universal portable, low cost system to monitor the ECG signal. They implemented a very simple circuit that was simulated on Proteus software, and they built their circuit on a bread board without using any microcontroller. The measured ECG signal is noisy, not stable, and doesn’t show correct peaks. Abdul Jamil et al. [8] presented A prototype of a Single Channel 3-Lead Electrocardiograph and developed a software-based processing environment to provide all the features of the ECG signal. The design was implemented on a stripboard without using any microcontroller and tested using a LabView. Chen et al. [29] have presented a small-sized, non-contact, real-time recording system for mobile long-term monitoring of ECG signals.
A real-time analysis and remote monitoring of the heart rate variability (HRV) was done successfully using a portable ECG monitor based on an ARM microcontroller [30]. Patil et al. [31] proposed a real time ECG on internet using Raspberry Pi, they built a simple circuit on a bread board and displayed the results on an Oscilloscope. Recently, Joukhadar et al. [32] proposed a portable raspberry pi-based system for heart valve diseases diagnosis using automatic segmentation and artificial neural network. The hardware of the proposed system consists of a phonocardiogram (PCG) signal acquisition module and a raspberry pi connected to a touch screen to process and display the data.
In recent years, Machine learning algorithms have been utilized in the development of ECG systems that not only used to monitor the ECG signal but also possess the capability to classify arrhythmia [33,34,35]. More recently, Karri et al. [35] have created a built-in system that can identify the QRS complex and classify arrhythmias using patient-specific ECG data. Their primary emphasis was on the machine learning algorithms rather than the hardware, and they provided insufficient information about the hardware design of the ECG system.
In this work, we have developed an embedded system based on raspberry pi that can be used for monitoring electrocardiogram in faster and more efficient manner. The use of raspberry pi increases the possibility of storing more data and allows continuous tracking of the patient’s history.

Our Contribution

In this work, we are presenting the development of an embedded system based on raspberry pi that can be used to successfully measure the electrocardiogram signals at different heart rates. The measured signal includes all the important peaks that can be used as an indicator for the health condition by comparing the signal from healthy cases with that from patients who have heart diseases. The contributions of this work can be summarized as follows:
Integration of Raspberry Pi for ECG Monitoring: While it is true that previous research has explored the use of Raspberry Pi in ECG devices, our work presents a comprehensive and practical implementation of an embedded system using Raspberry Pi for effective ECG monitoring. We have focused on optimizing the system’s performance, ensuring real-time monitoring, and developing a portable, cost-effective, and user-friendly solution.
Complete System Design: Although prior studies have discussed aspects of ECG device development, our paper provides a detailed account of the entire system design, encompassing analog and digital components. We describe the electronic circuit, including signal conditioning, amplification, noise filtering, and power management, as well as the incorporation of an analog-to-digital converter and a graphical liquid-crystal display for signal measurement and visualization. The comprehensive integration of these components is a noteworthy contribution to our work.
Health Condition Analysis: Our paper emphasizes the importance of analyzing the ECG signals to assess health conditions. We propose a method for detecting abnormal heart functionality in real time by comparing signals obtained from healthy individuals with those exhibiting heart arrhythmia. This aspect of our work contributes to the field by providing a practical approach to diagnosing and monitoring cardiac abnormalities using Raspberry Pi.
While we acknowledge that previous research has explored related topics, our work distinguishes itself by providing a holistic and practical solution for ECG monitoring, incorporating Raspberry Pi as a key component, and focusing on real-time detection and health condition analysis.
We have covered the details of our work in the next sections including the simulation of the ECG system circuit on Proteus software; the connection on the bread board and testing using both the commercial ECG simulator and the human body signals; and finally we have included the PCB design of our complete system connected to the raspberry pi and graphical LCD, and the results of testing the final device using both commercial ECG simulator and human body signals.

2. Materials and Methods

2.1. Materials

All through-hole electronic components and ECG leads are from Mikroelectron, Jordan; patient simulator (METRON’s PS-416M) is from Sandra Company, Amman, Jordan; ECG pads are from Al-Gazawi for Medical supplies; PCB designs were done in Seed Studio Fusion, Hong Kong, China; all surface mount SMD electronic components are from Mouser Electronics, Munich, Germany.

2.2. Methods

Proteus software 8.12 was used to simulate the main ECG circuit, an ECG signal similar to the human ECG was generated using an Arduino code [15]. The generated signal was converted from analog format to 8-bit digital format, by normalizing the data from 0 to 1, multiplying it by 255 and approximating the data (for integers only). The data that can be used for ECG signal generation were represented as sampling points in an Arduino programming code. See Section S.1 in Supplementary Material.

3. The ECG Circuit Design

The magnitude of an ECG signal varies from microvolt to millivolt range [9,10]. Therefore, the signal should be amplified in order to be distinguished from noise, and high and low frequency noises need to be filtered out.
The main task of the ECG circuit is to make the ECG signal more measurable by amplifying the small ECG signal collected from the heart, as well as to filter out the external and internal noise, in addition to reducing the common-mode interference using a right leg drive (RLD).

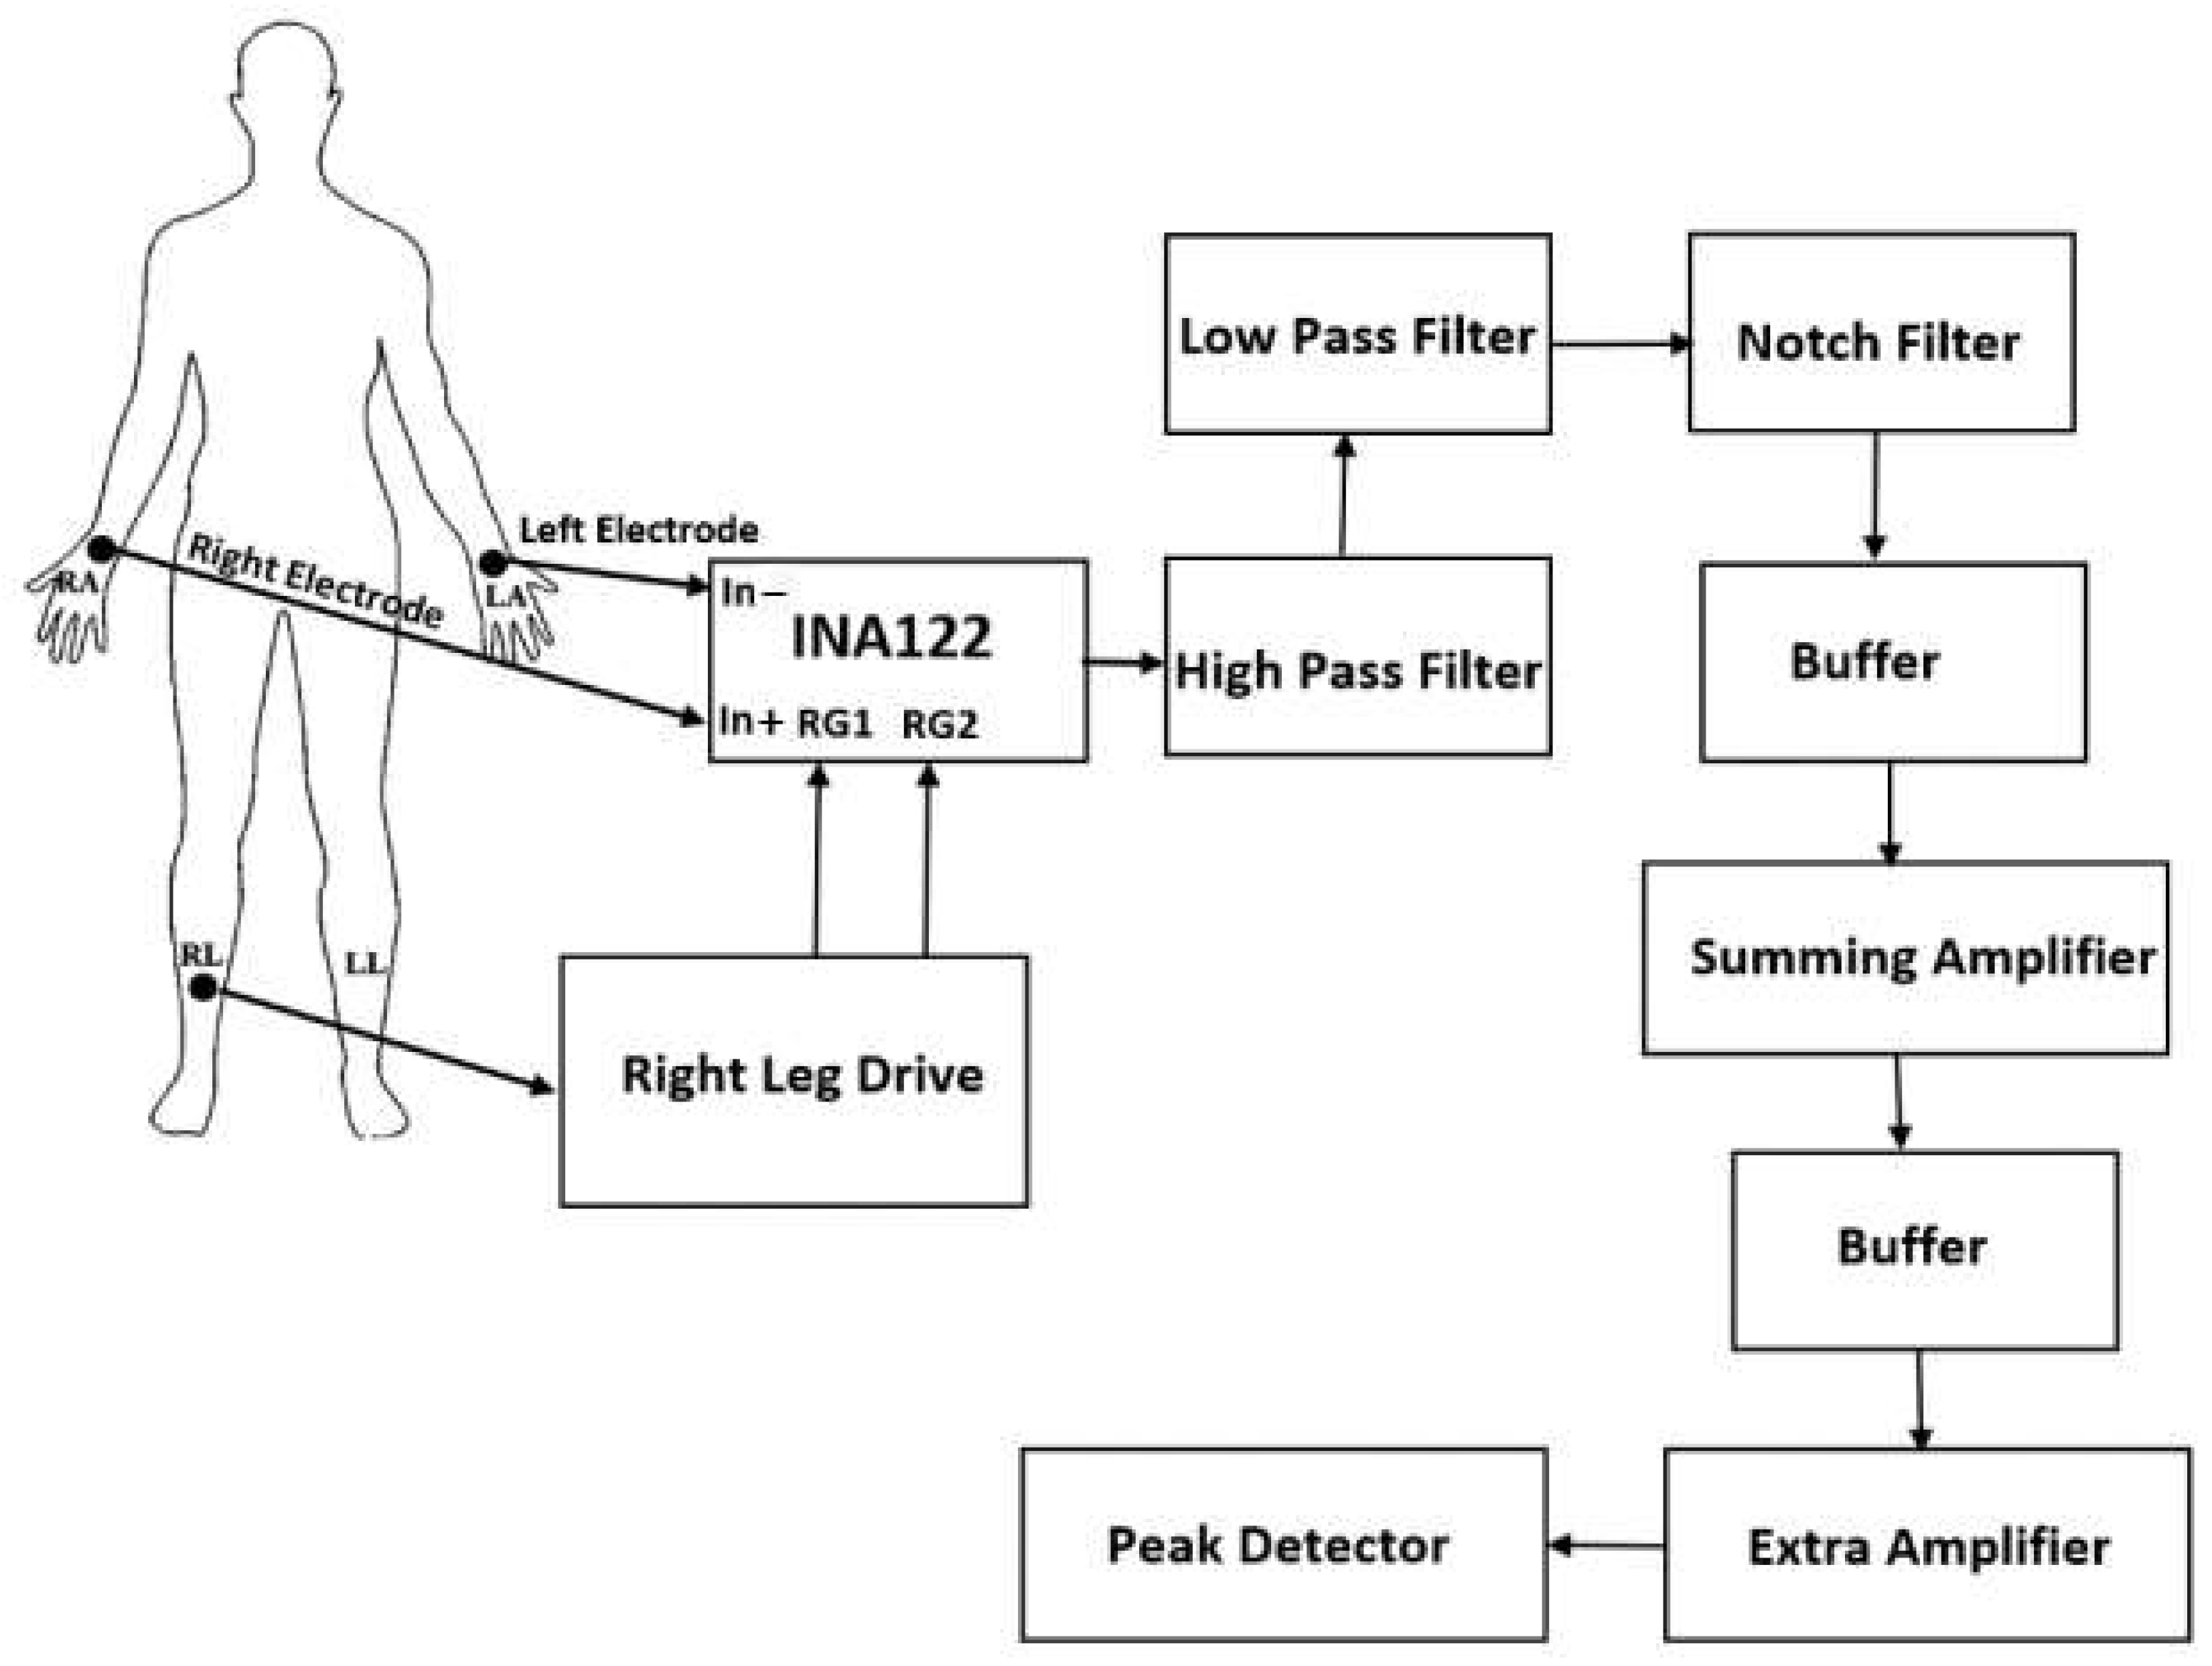
3.1. The Block Diagram of the Circuit

The main stages of the ECG circuit designed in this paper are shown in the block diagram represented in Figure 1. The ECG signal is taken from the human body through three leads connected to Right Arm (RA), Left Arm (LA), and Right Leg (RL).
The first stage represents the combination of the instrumentation amplifier (INA122) that is used to collect the main signal from the RA and LA through the right and left electrodes, and the right leg is connected through a third electrode to the RLD.
The second stage is a high pass filter used to reduce the high frequency noise, then a low pass filter used for low frequency noise reduction, and a notch filter used to filter out the noise coming from the power lines. In the next stage, we have added a summing amplifier to add some DC-offset to make the signal compatible with analog to digital conversion for extra processing. Then we have added an extra amplifier for extra amplification of the signal. The final stage consists of a peak detector to detect R-peaks for measuring heart rate. We also have added buffers between stages to reduce loading effect.

3.2. The Schematic Diagram of the ECG Circuit

The Schematic Diagram of the ECG circuit is shown in Figure 2. All the factors that might affect the accuracy of the ECG signal measurement have been considered in our circuit design and programming code. An instrumentation amplifier (IA) is used to take the difference between LA and RA signals, and different stages of filters are used to reduce noise. The right leg drive is implemented to eliminate common mode interference with human body, and we have used extra stages of amplifiers to amplify signal. R-peak detection is done through the peak detector to measure the heart rate. The design and function of each stage is explained in details in the following subsections.

3.2.1. The Instrumentation Amplifier

The ECG measurement system designed in this work has three leads, the leads connected to RA and LA collect two signals that are 180° out of phase. The INA122 instrumentation amplifier was used as a difference amplifier to amplify the difference between the two signals. INA122 is used for accurate, low noise differential signal acquisition and it is known of its very low input bias current of only 25 nA max, very low voltage noise of only 60 nV/sqrt(Hz). Moreover, it has a high controllable gain and a high common mode rejection ratio which makes sure that the noise at the input will not be amplified, as a result this will yield to a higher integrity signal. The RG of the IA used in this work is 4.7 kΩ which makes its gain = 47.5 to amplify the difference between the applied input signals. For more details, please see Section S.2 in Supplementary Material.

3.2.2. The Right Leg Drive (RLD)

The RLD circuit (labeled as Right Leg Drive) in Figure 2 is used to reduce any common mode interference from the amplifier. Through using the RLD, the average common mode signal is amplified and inverted back into the patient’s right leg through the third lead. Thus the 50 Hz noise from the AC power will be cancelled and a cleaner ECG output signal will be created. The common mode rejection ratio can be improved by increasing the gain that can be used in the feedback loop. Also, the attenuation needed from the common mode rejection of the instrumentation amplifier can be relaxed by canceling the noise through using RLD. Although it is very important to use the RLD in biomedical systems, it was not used in previous literature [11,25]. As a result, their published ECG signals are not clean and most of the important peaks are either missing or not clear.

3.2.3. The High Pass Filter

The high pass filter shown in Figure S1a (in Supplementary Material) is a second order active filter that was designed to pass a frequency range above 0.08 Hz. The values of resistors and capacitors were calculated based on the following equation that is used to determine the cutoff frequency fC [36]:
f C = 1 2 π R 1 C 1 R 2 C 2  
By setting R1 = R2 = R and C1 = C2 = C, then fC = 1/2πRC, We have designed the HPF at fC = 0.08 Hz, then R = 200 kΩ, and C = 10 µF. The buffers were added to reduce the loading effect between cascaded stages which highly improves the measured signal.

3.2.4. The Low Pass Filter

The low pass filter shown in Figure S1b (in Supplementary Material) is a second order active filter that was designed to pass a frequency range below 100 Hz. The initial values of resistors and capacitors were chosen based on Equation (1) that is used to determine fC. The LPF was designed at fC = 100 Hz by setting R1 = R2 = R = 100 kΩ, and C1 = C2 = C = 15 nF.
The buffers were added to reduce loading effect between cascaded stages which highly improves the measured signal.

3.2.5. The Notch Filter

The notch filter in Figure S1c in Supplementary Material is used to remove the 50 Hz noise that comes from the AC power line. The initial values of resistors and capacitors were chosen based on Equation (2) that is used to determine fC [36]:
fC = 1/4πRC
2R = 300 kΩ, R = 150 kΩ
2C = 20 nF, C = 10 nF
The notch filter was designed at fC = 50 Hz by setting RH3 = RH4 = 330 kΩ, and CL1 = CL2 = C = 10 nF, RL2 = 150 kΩ.

3.2.6. The Summing Amplifier

To make the ECG signal compatible with the analog to digital converter, we have used the summing amplifier to do level shifting.
Adding a DC offset is necessary to remove the dc component and make all parts of the signal above the ground. After the summing amplifier, an extra amplifier with a gain = 2 was added to increase the amplitude of the ECG signal before the peak detector.

3.2.7. The Peak Detector

The circuit shown in Figure S2 (in Supplementary Material) is a peak detector that is used for R-peaks detection to determine the heart rate from a measured ECG signal. The circuit simply consists of a BJT transistor that works as a switch in two regions either saturation or cutoff. The resistors R12 and R14 are used to ensure that the waves smaller than the R-wave are below 0.7 V by attenuating the signal, this will result in counting the R-peaks only and generate a negative pulse at each R-peak.

4. The ECG Circuit Simulation

We have done the circuit simulation using Proteus Professional software to validate it’s functioning as shown in Figure S3 (in Supplementary Material). This helped us to ensure that all circuit stages work properly before connecting on the bread board and before building the final printed circuit board (PCB) layout that is used to build the final PCB for our ECG device.

The ECG Signal Generation

Since the function generator on Proteus software doesn’t include ECG signal, we have built the circuit shown in the red rectangle in Figure S3 to generate an ECG-like signal.
We have sampled a real human ECG by converting it to digital format using 8-bits analog to digital converter. The data were normalized and multiplied by 255 then approximated to integers only. The resulting data were represented as sampling points in an Arduino programming code.
The ECG signal generation code (.hex file) was uploaded to ATMEGA328P at its maximum operating frequency of 20 MHz. The DAC0808 was used to convert the signal from digital format to analog format to be used as an ECG signal from the ECG electrodes. Then a signal attenuator (amplifier with a voltage gain less than unity) was used to reduce the signal level to be in millivolt range to mimic the ECG signal comes from the human body. A 50 Hz sinusoidal wave was added to represent the noise from human body. Since we need to collect signals from two electrodes. We have used the generated signal to represent the signal from the 1st electrode, and then we applied it on an inverting amplifier to generate the signal that represents the 2nd electrode. We have applied the two generated signals to the inputs of the instrumentation amplifier which represents the first stage of the ECG device.

5. The ECG Circuit Connection on Bread Board

We have connected the complete circuit on a Bread Board as shown in Figure 3, and tested its function by displaying the signal on an Oscilloscope. We have used the patient simulator to generate the ECG signal and apply it as an input to the circuit through the ECG leads. We also have collected some ECG signals from human body.

6. The Printed Circuit Board Design

The PCB layout was built in Altium Designer software. The widths of the tracks are between (0.025–0.05) mm, the final design area is (5.6 cm × 6.5 cm). The components dimensions were selected in such a way the area of the PCB is smaller than the area of Raspberry pi 4. This ensures that the PCB is completely behind the Graphical LCD in the packaging of the final handheld ECG device. The PCB top and bottom layers, and the final PCB after soldering the components on are shown in Figure S5 (in Supplementary Material).

7. The Final Device

The PCB layout was sent to seed studio, China, and all components soldering was done in Dr. Yusra Obeidat research lab located in the electronic engineering department (Hijjawi Faculty for Engineering Technology, Yarmouk University, Irbid, Jordan). Then the PCB was connected to the raspberry pi, and the NEXTION 2.4 INCH TFT screen was connected to the PCB to display the ECG signal (Figure 4a).
Additionally, a 3D-printed device was fabricated to serve as the final packaging. It housed all the components, including the PCB and Raspberry Pi, within it. The device was designed in such a way that the screen, power input, and input port were visible to the user, enhancing its practicality as a portable monitor (refer to Figure 4b). The final device’s dimensions measured 7.6 cm × 9.5 cm × 3 cm. To facilitate its operation, a Python programming code was developed. This code defined the Raspberry Pi’s operating system, initialized the graphical LCD for displaying the ECG signal, and included instructions to effectively filter out any remaining noise (please see the code in Supplementary material).

8. Results and Discussion

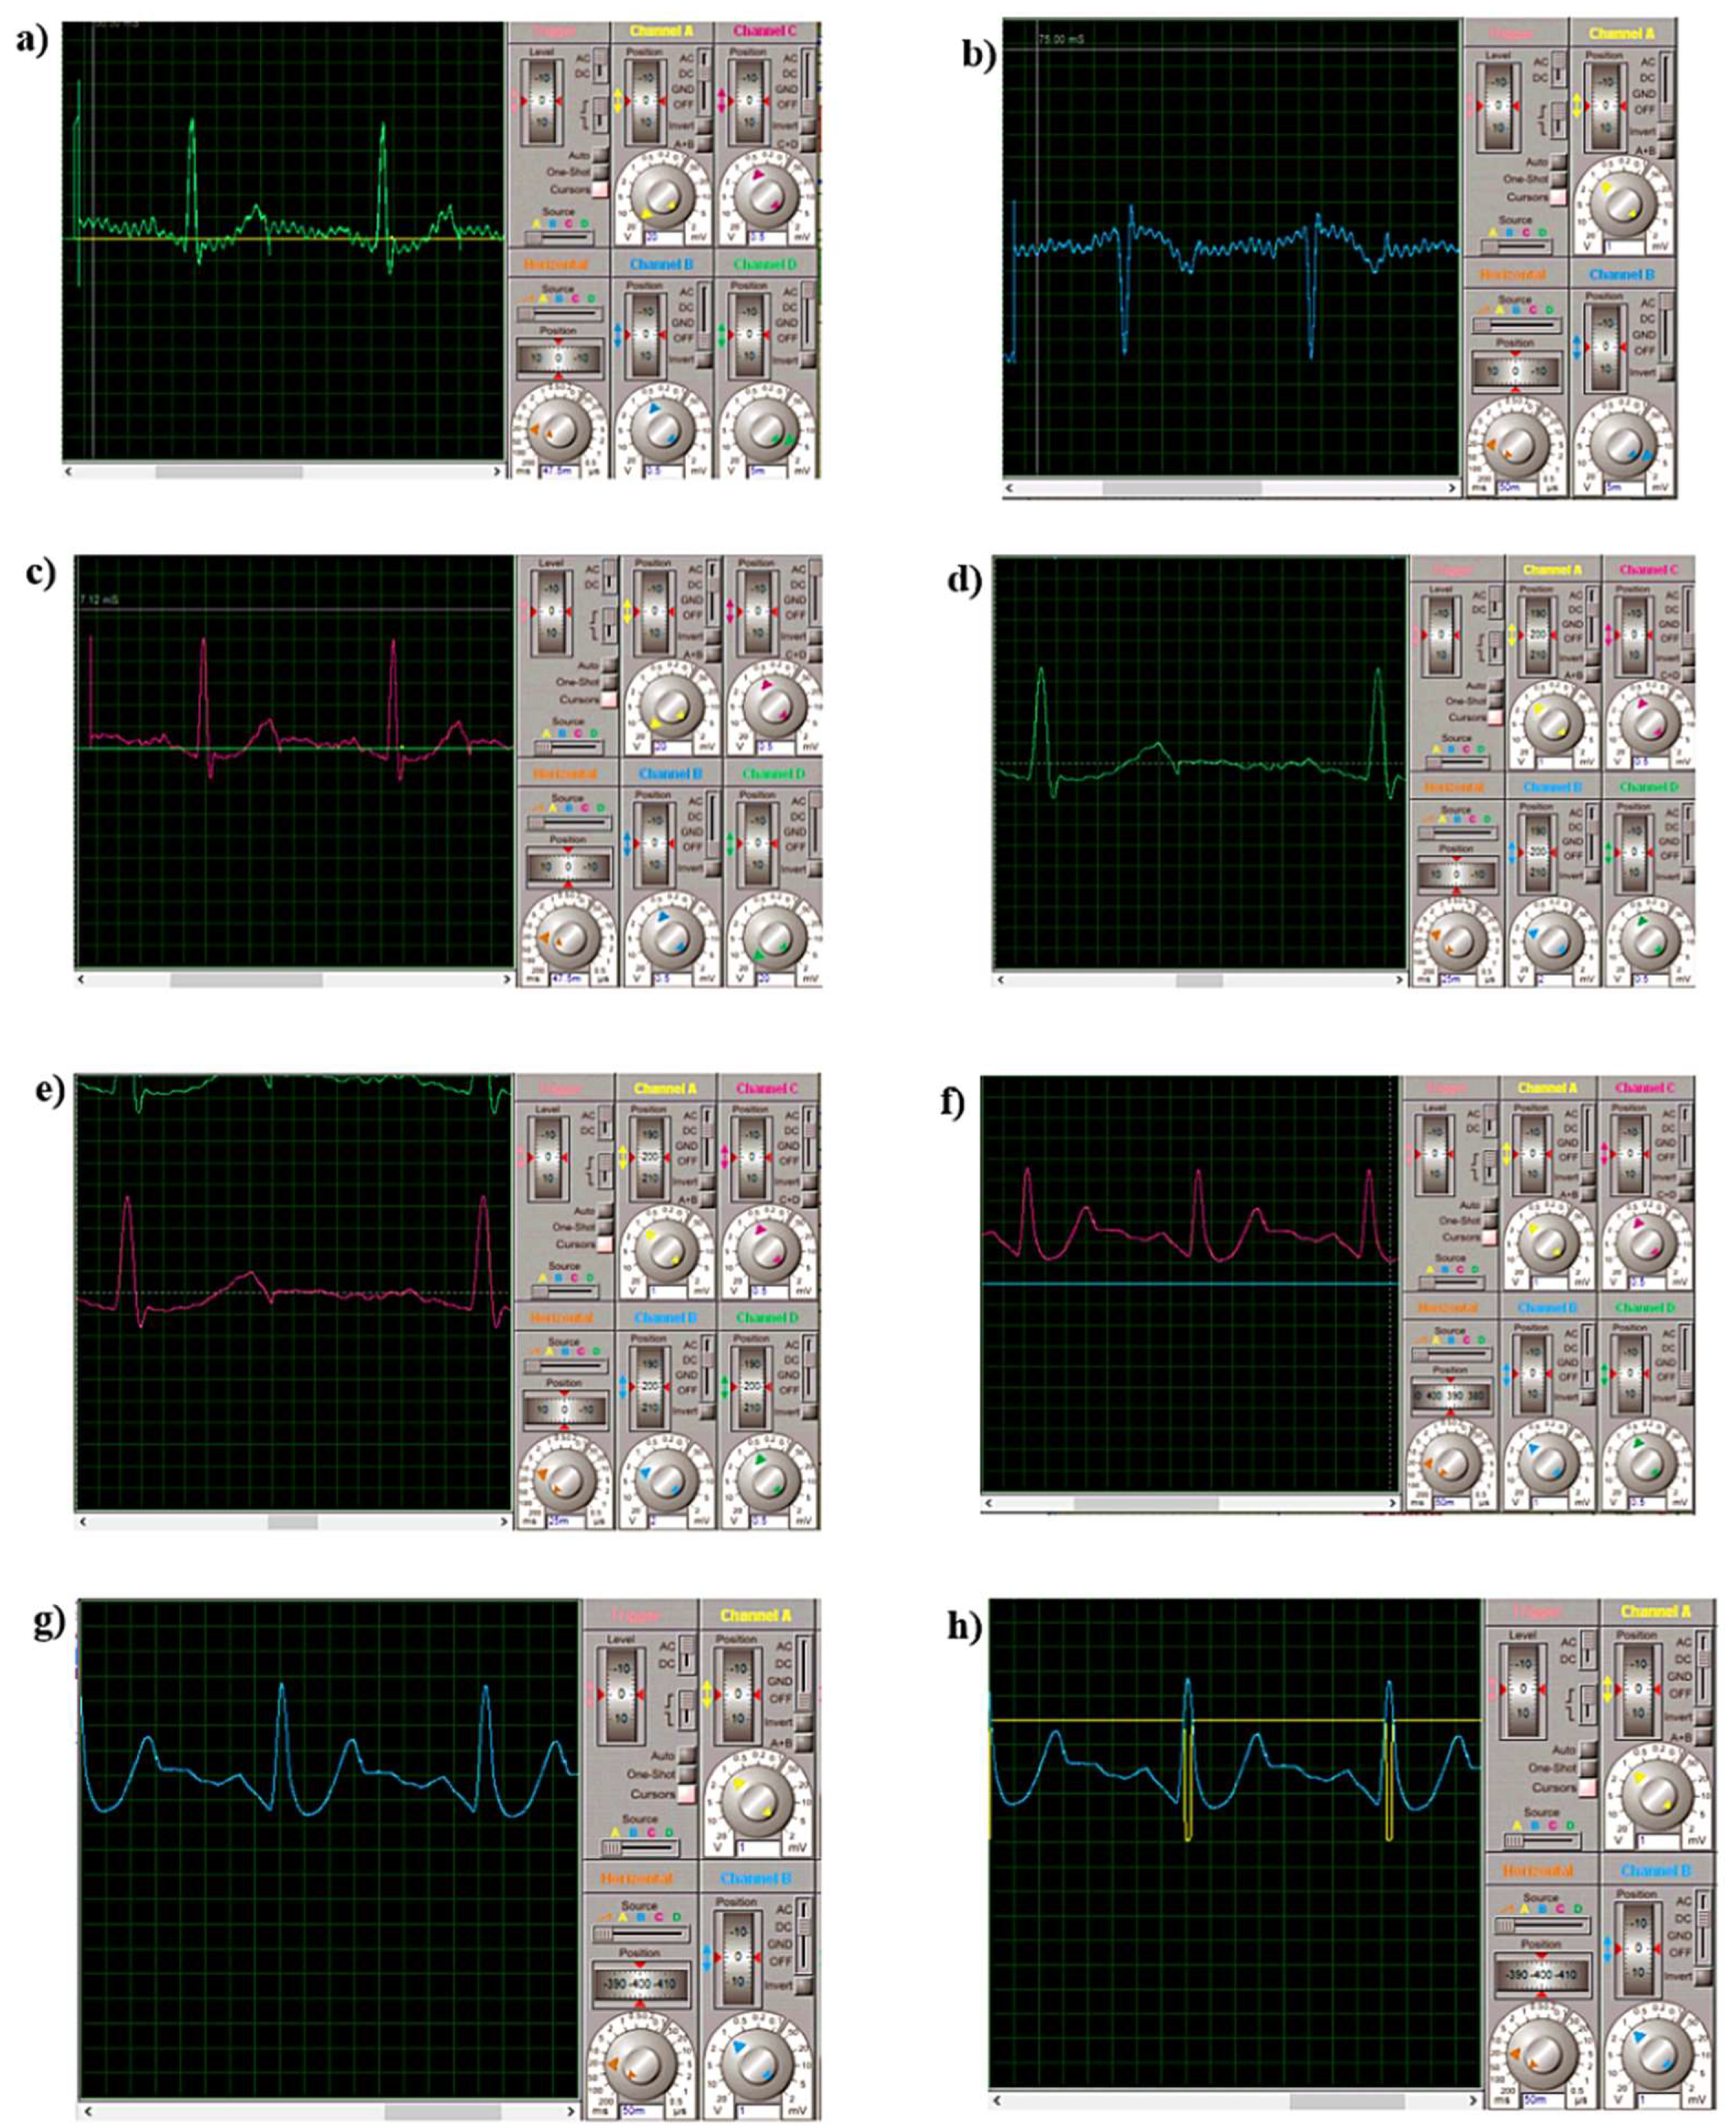
8.1. The Simulation Results

Proteus Professional software was used to simulate the ECG circuit. The ECG signal was generated using the C code included in Section S.1 in the Supplementary Material in which we sampled a real human ECG signal. The code was uploaded on the ATMEGA328P. We have generated two electrodes signals using the circuit described in Section 2.1. Figure 5a shows the output corresponding to the 1st electrode, Figure 5b shows the output corresponding to the 2nd electrode which is 180° out of phase from the 1st electrode signal. The scale for the 1st and 2nd electrodes signals is 5 mV which is in the range of the real ECG signal generated from the human body. After applying the two electrodes signals on the inputs of the IA and measured the output signal as shown in Figure 5c, the output of the IA was applied to the HPF, LPF, and notch filter, then the output signal was applied to the summing amplifier as shown in Figure 5d–f where the scale of the readings in all measurements is 0.5 V. The generated signal was applied to an extra amplifier and the output is shown in Figure 5g where the scale of the reading increased to 1 V, and the final output was applied to the R-peak detector resulting in the signal shown in Figure 5h.

8.2. The Results Measured from the Bread Board

The circuit connected on the bread board was tested using ECG signals with different heart rates in beats per minute (BPM) in the range of (30–300) BPM. The input ECG signals were generated from the commercial Patient Simulator and the measured signal was displayed on an Oscilloscope. As shown in Figure 6, the circuit was able to measure all the necessary Peaks i.e., (P, Q, R, S, T) waves at all heart rates.

8.3. The Results Measured from the Final Device

The final device was tested using ECG signals with different heart rates in beats per minute (BPM) in the range of (60–300) BPM generated from the Patient Simulator. The signal was displayed on the screen of the device as well as on the VNC Viewer of the raspberry pi that was opened on the phone and/or the laptop. The device was able to successfully measure the ECG signals at all tested heart rates as shown in Figure 7. The measured ECG signal includes all the important peaks that can be used as an indicator for the health condition by comparing the ECG from healthy cases with that from patients who have heart diseases.
Moreover, we have tested the final device by measuring ECG signals from human body (Figure 7g). We have achieved good results that show the ability of the device to monitor the ECG signal from human body at different heart rates and different conditions (Figure 8a–d). The device designed in this work can be used for monitoring the ECG signals at different rates and variable conditions. In our work, we have considered the safety rules in designing and applying our system. We have used RLD in the main circuit to avoid any common mode interference with the human body, we have designed our final device to be compatible with the regular ECG leads that are used in hospitals, and we have used the medical pads that are typically used in clinics to collect the ECG signals from human body. We also use cottons with medical alcohol to clean the skin before and after putting the pads on. Moreover, we have received an IRB from the Dean of Scientific Research and Graduate studies at Yarmouk University to be able to use the device for measuring the ECG signal from human. The entire procedure was confirmed with a Specialist doctor and nurse from King-Abdullah hospital, Irbid, Jordan as a part from the scientific research rules in Yarmouk University.
The device’s utilization of a graphical LCD screen enhances its portability and enables easy usage in various locations. Additionally, the ECG signal can be displayed on a smartphone (refer to Figure S7 in Supplementary Material) or a personal computer through VNC viewer. Furthermore, the recorded data can be stored on the cloud and accessed through a mobile application, which facilitates continuous monitoring of the patient’s condition and aids the doctor in future diagnostics. As a result, this approach simplifies and expedites ECG signal monitoring when compared to embedded systems that rely on microcontrollers [3,23,24].
Moreover, incorporating Raspberry Pi offers advantages in terms of data storage and facilitates signal analysis and classification using machine learning models. Our proposed work provides more comprehensive details about the entire system, including improved signal quality with all the necessary peaks, making it more reliable and suitable for researchers and industries compared to previous publications [11,25,26,27,28,29,30]. By contrast, the system described in [5] exhibits inferior signal conditioning, allowing noise to affect the ECG signal shape and peaks, potentially impacting the accuracy of heart disease diagnosis. Additionally, their reliance on a simple PIC microcontroller limits data storage capabilities and continuous monitoring of the patient’s ECG signal.
Furthermore, our design outperforms the work presented in [7] in terms of accurate ECG monitoring. We conducted tests using both a patient simulator and human signals, while they proposed a simple circuit simulated on Proteus software and built it on a breadboard without employing any microcontroller. Importantly, they did not measure a real ECG signal from the human body. The ECG signal they measured was characterized by noise, instability, and inaccurate peaks, rendering their system unsuitable for effective ECG monitoring.
In addition, Abdul Jamil et al. [8] conducted their study using a stripboard instead of a microcontroller, and they solely tested the implementation using LabView. On the other hand, Patil et al. [31] did not construct a fully functional ECG device; instead, they connected a basic circuit on a breadboard and displayed the data on an oscilloscope. The circuit design details were not provided, and no human tests were conducted. Their data collection was limited to a patient simulator, and they did not demonstrate different cases or heart rates. Moreover, the presented signal did not exhibit S and T waves.
In conclusion, our group is the first to develop a comprehensive ECG monitoring device utilizing Raspberry Pi. A recent study conducted by Joukhadar et al. [32] introduced a portable system based on Raspberry Pi for diagnosing heart valve diseases. However, it is important to note that their monitoring system is specifically designed to measure the phonocardiogram (PCG) signal, not the ECG signal.

9. Conclusions and Future Work

In this paper, we have introduced the development of an innovative embedded system based on Raspberry Pi that revolutionizes the monitoring of electrocardiogram (ECG) signals in clinical applications. Our device offers a faster and more efficient approach to ECG monitoring, utilizing only three leads that can be easily connected to the human body. Once the leads are connected, and the device is powered on, the ECG signal is instantly displayed on the screen, enabling swift monitoring. To optimize the efficiency of our system, we have taken into consideration all factors that may affect signal accuracy. We have implemented the necessary filter stages in the circuit design, ensured a well-designed PCB layout, and developed a protective package to shield the circuit components from external noise sources. Through extensive testing using both ECG signals generated from a commercial Patient Simulator and real human subjects, our device has successfully measured ECG signals across various heart rates, accurately capturing all crucial peaks that serve as indicators of health conditions.
The measured ECG results can be conveniently displayed on the graphical LCD screen and easily accessed on a smartphone or PC through the VNC viewer. Furthermore, the data can be securely stored on the cloud via a mobile application, allowing for seamless monitoring of patient conditions and providing valuable assistance to doctors in future diagnostics. In response to the rising demand for affordable and user-friendly medical diagnostic devices, our study focuses on the development of an embedded system that integrates the power of Raspberry Pi. This enables both wireless and wired interfaces, creating an ECG diagnostic embedded system capable of real-time detection and immediate response to any abnormalities in heart functionality. Our system effectively measures and displays the ECG signal by incorporating a comprehensive electronic circuit comprising analog and digital components.
Within the analog section of the circuit, vital signal conditioning tasks, including amplification and noise filtering, are performed to ensure a clean signal within the desired frequency range. The entire system is powered using a power bank, enhancing its portability and accessibility. The digital segment incorporates an analog-to-digital converter, enabling the conversion of the received analog signal into a digital format compatible with Raspberry Pi. A graphical liquid-crystal display is employed to visualize the measured signal accurately. Through the successful measurement of ECG signals at various heart rates, our device captures all crucial peaks that serve as indicators of an individual’s health condition. By comparing the signals obtained from healthy individuals with those exhibiting heart arrhythmias, valuable insights can be gained regarding their health status. The proposed system aims to be portable, cost-effective, and user-friendly in diverse environments, catering to the growing need for affordable and accessible medical diagnostic solutions.
In conclusion, our embedded system based on Raspberry Pi offers a significant advancement in ECG monitoring, providing a faster, more efficient, and more comprehensive solution for healthcare professionals. The integration of cutting-edge technology, combined with rigorous testing and optimization, positions our device as a valuable tool in diagnosing and monitoring cardiac health conditions, ultimately contributing to improved patient care and well-being.
In future work, we plan to employ the device for heart arrhythmia classification using a hybrid model developed in our previous research [37]. This model combines a 1D Convolutional Neural Network (CNN) with Long Short-Term Memory (LSTM) to achieve rapid, accurate, and automated ECG beat-wise classification. This advancement will greatly aid doctors in diagnosing heart diseases in a more efficient manner.
Furthermore, we have obtained institutional Review Board (IRB) approval to deploy this system in hospitals and clinical applications, ensuring its feasibility for real-world usage.

Supplementary Materials

The following are available online at https://www.mdpi.com/article/10.3390/app13148273/s1, Figure S1: The second order HPF. (b) The second order LPF. (c) The second order BSF. Figure S2: The Peak Detector. Figure S3: The ECG Circuit Simulation Using Proteus Professional Software. Figure S4: The Printed Circuit Board Schematic. Figure S5: The ECG PCB Layout. Figure S6: The Bode Plots for Filters. Figure S7: An ECG signal from human displayed on a smart phone through VNC viewer.; The ECG Signal Generation; The Gain of INA122; Filters and Peak Detector; Circuit Connection on Proteus Professional Software; The Printed Circuit Board Schematic and Layout on Altium; The Filters Bode Plots. All authors have read and agreed to the published version of the manuscript.

Author Contributions

Conceptualization, Y.M.O. and A.M.A.; methodology, Y.M.O.; software, Y.M.O.; validation, Y.M.O. and A.M.A.; formal analysis, Y.M.O. and A.M.A.; investigation, Y.M.O.; resources, Y.M.O. and A.M.A.; data curation, Y.M.O. and A.M.A.; writing original draft preparation, Y.M.O.; writing review and editing, Y.M.O. and A.M.A.; visualization, Y.M.O.; supervision, Y.M.O.; project administration, Y.M.O.; funding acquisition, Y.M.O. All authors have read and agreed to the published version of the manuscript.

Funding

This research was funded by the Scientific Research & Graduate Studies Deanship at Yarmouk University, the grant amount is of about 15.495$ (Project No.42/2021).

Institutional Review Board Statement

The study was conducted according to the guidelines of the Declaration of Helsinki, and approved by the Institutional Review Board at Yarmouk University (RD/119/12/3466).

Informed Consent Statement

Informed consent was obtained from all subjects involved in the study.

Data Availability Statement

All data generated or analyzed during this study are included in this published article (tables and figures) and its Supplementary File.

Acknowledgments

The authors would like to thank the Scientific Research & Graduate Studies Deanship at Yarmouk University for their funding support of about 15.495$ (Project No.42/2021).

Conflicts of Interest

The authors declare no competing interests.

References

  1. Martínez, A.; Alcaraz, R.; Rieta, J.J. Application of the phasor transform for automatic delineation of single-lead ECG fiducial points. Physiol. Meas. 2010, 31, 1467–1485. [Google Scholar] [CrossRef] [PubMed]
  2. Maheswari, A.; Ramachandran, V. System for Detection of Vital Signals with an Embedded System. Afr. J. Inf. Commun. Technol. 2011, 6, 22–30. [Google Scholar]
  3. Al-omary, A. Heart Disease Monitoring System Using Web and Smartphone. Int. J. Adv. Res. Electr. Electron. Instrum. Eng. 2014, 3, 8265–8273. [Google Scholar]
  4. Amour, N.; Hersi, A.; Alajlan, N.; Bazi, Y.; Alhichri, H. Implementation of a Mobile Health System for Monitoring ECG signals. In Proceedings of the BioMedCom 2014 Conference, Cambridge, MA, USA, 14–16 December 2014; pp. 1–7. [Google Scholar]
  5. Belgacem, N.; Bereksi-reguig, F. Bluetooth Portable Device for ECG and Patient Motion Monitoring. Nat. Technol. 2011, 3, 19–23. [Google Scholar]
  6. Camps-valls, G.; Caama, A.J.; Guerrero-mart, J.F. ECG Signal Processing, Classification and Interpretation; Springer Science & Business Media: Berlin/Heidelberg, Germany, 2012; pp. 195–217. [Google Scholar]
  7. Yadav, U.; Pancholi, U.; Tugnawat, A.; Patnaik, R. Designing of portable and low cost ECG signal acquisition system. J. Biol. Eng. Res. Rev. 2014, 1, 26–31. [Google Scholar]
  8. Jamil, M.A.; Soon, C.; Achilleos, A.; Youseffi, M.; Javid, F. Electrocardiograph (ECG) Circuit Design and Software-based Processing using LabVIEW. J. Telecommun. Electron. Comput. Eng. 2018, 9, 57–66. Available online: http://journal.utem.edu.my/index.php/jtec/article/view/3099 (accessed on 10 July 2023).
  9. Bogdanov, M.; Baigildin, S.; Fabarisova, A.; Ushenin, K.; Solovyova, O. Effects of Lead Position, Cardiac Rhythm Variation and Drug-induced QT Prolongation on Performance of Machine Learning Methods for ECG Processing. In Proceedings of the 2020 Ural Symposium on Biomedical Engineering, Radioelectronics and Information Technology (USBEREIT), Yekaterinburg, Russia, 14–15 May 2020; pp. 40–43. [Google Scholar] [CrossRef]
  10. Du, W.Y. Design of an ECG Sensor Circuitry for Cardiovascular Disease Diagnosis. Int. J. Biosens. Bioelectron. 2017, 2, 120–125. [Google Scholar] [CrossRef] [Green Version]
  11. Basaif, A.; Aljunid, S.; Sabri, N.; Omer, M.I.; Salim, M. Design and implementation of an embedded system to analysis an ECG signal for heart diagnosis system. J. Telecommun. Inf. Technol. 2016, 91, 289–297. [Google Scholar]
  12. Jemilehin, T.; Adu, M. Design and Simulation of Electrocardiogram Circuit with Automatic Analysis of ECG Signal. Analele Univ. Murgu’ 2016, 26, 1. [Google Scholar]
  13. Mougoufan, B.; Bertin, J.; Fouda, E.; Maurice, T.; Wolfram, K. Adaptive ECG beat classification by ordinal pattern based entropies. Commun. Nonlinear Sci. Numer. Simul. 2019, 84, 105156. [Google Scholar] [CrossRef]
  14. Lucani, D.; Cataldo, G.; Cruz, J.; Villegas, G.; Wong, S. A portable ECG monitoring device with Bluetooth and Holter ca-pabilities for telemedicine applications. In Proceedings of the 2006 International Conference of the IEEE Engineering in Medicine and Biology Society, New York, NY, USA, 30 August–3 September 2006. [Google Scholar]
  15. Sobrinho, A.; Cunha, P.; da Silva, L.D.; Perkusich, A.; Cordeiro, T.; Rego, J. A simulation approach to certify electrocardiography devices. In Proceedings of the 2015 17th International Conference on E-health Networking, Application & Services (HealthCom), Boston, MA, USA, 14–17 October 2015; pp. 86–90. [Google Scholar] [CrossRef]
  16. Serhani, M.A.; El Kassabi, H.T.; Ismail, H.; Navaz, A.N. ECG Monitoring Systems: Review, Architecture, Processes, and Key Challenges. Sensors 2020, 20, 1796. [Google Scholar] [CrossRef] [Green Version]
  17. Istepainan, R.; García, R.; Alesanco, A.; Olmos, S. A novel realtime multilead ECG compression and de-noising method based on the wavelet transform. IEEE Trans. Inform. Technol. Biomed. 2003, 30, 593–596. [Google Scholar]
  18. Borromeo, S.; Rodriguez-Sanchez, C.; Machado, F.; Tamames, J.A.H.; de la Prieta, R. A reconfigurable, wearable, wireless ECG system. In Proceedings of the 2007 29th Annual International Conference of the IEEE Engineering in Medicine and Biology Society, Lyon, France, 22–26 August 2007. [Google Scholar]
  19. Nurmaini, S.; Darmawahyuni, A.; Mukti, A.N.S.; Rachmatullah, M.N.; Firdaus, F.; Tutuko, B. Deep Learning-Based Stacked Denoising and Autoencoder for ECG Heartbeat Classification. Electronics 2020, 9, 135. [Google Scholar] [CrossRef] [Green Version]
  20. Mykoliuk, I.; Jancarczyk, D.; Karpinski, M.; Kifer, V. Machine learning methods in electrocardiography classification. In Proceedings of the ACIT, Ceske Budejovice, Czech Republic, 1–3 June 2018; Volume 1–10, pp. 102–105. [Google Scholar]
  21. Chien, C.-N.; Hsu, H.-W.; Jang, J.-K.; Rau, C.-L.; Jaw, F.-S. Microcontroller-based wireless recorder for biomedical signals. In Proceedings of the 2005 IEEE Engineering in Medicine and Biology 27th Annual Conference, Shanghai, China, 17–18 January 2006. [Google Scholar]
  22. Company-Bosch, E.; Hartmann, E. ECG Front-End Design is Simplified with MicroConverter. Analog Devices Application Note. Analog. Dialogue 2003, 37, 1–5. [Google Scholar]
  23. El Hassan, E.M.; Mohammed, K. Design and Implementation of an Embedded System for Ambulatory Cardiac Monotoring. In Proceedings of the 2011 International Conference on Broadband and Wireless Computing, Communication and Applications, Barcelona, Spain, 26–28 October 2011; pp. 437–440. [Google Scholar] [CrossRef]
  24. Bravo-Zanoguera, M.; Cuevas-González, D.; Reyna, M.A.; García-Vázquez, J.P.; Avitia, R.L. Fabricating a Portable ECG Device Using AD823X Analog Front-End Microchips and Open-Source Development Validation. Sensors 2020, 20, 5962. [Google Scholar] [CrossRef]
  25. Bravo-Zanoguera, M.; Cuevas-González, D.; García-Vázquez, J.P.; Avitia, R.L.; Reyna, M.A. Portable ECG System Design Using the AD8232 Microchip and Open-Source Platform. Proceedings 2020, 42, 49. [Google Scholar] [CrossRef]
  26. Islam, M.; Rahaman, A.; Islam, R. Development of Smart Healthcare Monitoring System in IoT Environment. SN Comput. Sci. 2020, 1, 185. [Google Scholar] [CrossRef]
  27. Priya, E.; Chitra, R. Smartphone based portable ECG monitoring system. In Proceedings of the 2021 4th International Conference on Computing and Communications Technologies (ICCCT), Chennai, India, 16–17 December 2021; pp. 121–126. [Google Scholar] [CrossRef]
  28. Alimbayeva, Z.N.; Alimbayev, C.A.; Bayanbay, N.A.; Ozhikenov, K.A.; Bodin, O.N.; Mukazhanov, Y.B. Portable ECG Monitoring System. (IJACSA) Int. J. Adv. Comput. Sci. Appl. 2022, 13, 63–76. [Google Scholar] [CrossRef]
  29. Chen, Q.; Kastratovic, S.; Eid, M.; Ha, S. A Non-Contact Compact Portable ECG Monitoring System. Electronics 2021, 10, 2279. [Google Scholar] [CrossRef]
  30. Rodriguez, V.H.; Medrano, C.; Plaza, I. Embedded System Based on an ARM Microcontroller to Analyze Heart Rate Variability in Real Time Using Wavelets. Wirel. Commun. Mob. Comput. 2018, 2018, 9138578. [Google Scholar] [CrossRef] [Green Version]
  31. Patil, P.; Bhole, K. Real time ECG on internet using Raspberry Pi. In Proceedings of the 2018 International Conference on Communication, Computing and Internet of Things (IC3IoT), Chennai, India, 15–17 February 2018; pp. 267–270. [Google Scholar] [CrossRef]
  32. Joukhadar, A.; Chachati, L.; Al-Mohammed, M.; Albasha, O. A portable Raspberry Pi-based system for diagnosis of heart valve diseases using automatic segmentation and artificial neural networks. Cogent Eng. 2020, 7, 1856757. [Google Scholar] [CrossRef]
  33. Zhang, L.; Liu, J. Research Progress of ECG Monitoring Equipment and Algorithms Based on Polymer Materials. Micromachines 2021, 12, 1282. [Google Scholar] [CrossRef] [PubMed]
  34. Sharma, K.; Eskicioglu, R. Deep Learning-based ECG Classification on Raspberry PI using a Tensorflow Lite Model based on PTB-XL Dataset. Int. J. Artif. Intell. Appl. 2022, 13, 55–66. [Google Scholar] [CrossRef]
  35. Karri, M.; Annavarapu, C.S.R. A real-time embedded system to detect QRS-complex and arrhythmia classification using LSTM through hybridized features. Expert Syst. Appl. 2023, 214. [Google Scholar] [CrossRef]
  36. Chen, W.K. Passive and Active Filters: Theory and Implementation; John Wiley & Sons: Hoboken, NJ, USA, 1986; Chapter 5. [Google Scholar]
  37. Obeidat, Y.; Alqudah, A.M. A Hybrid Lightweight 1D CNN-LSTM Architecture for Automated ECG Beat-Wise Classification. Trait. Signal 2021, 38, 1281–1291. [Google Scholar] [CrossRef]
Figure 1. The Block Diagram of the ECG Circuit.
Applsci 13 08273 g001
Figure 2. The Schematic Diagram of the ECG Circuit.
Applsci 13 08273 g002
Figure 3. (a) The ECG Circuit Connection on Bread Board. (b) The ECG Circuit Testing.
Applsci 13 08273 g003
Figure 4. (a) The Device main parts connection. (b) The Final Device. (The bars depicted in both (a) and (b) have a measurement of 1 cm).
Applsci 13 08273 g004
Figure 5. The ECG output signal: (a) The first electrode. (b) The second electrode. (c) The IA output. (d) The HPF output. (e) The LPF output. (f) The summing amplifier output. (g) The final output. (h) The peak detector output.
Applsci 13 08273 g005
Figure 6. The Bread Board ECG output signal: (a) 30 BPM. (b) 60 BPM. (c) 80 BPM. (d) 120 BPM. (e) 180 BPM. (f) 300 BPM.
Applsci 13 08273 g006
Figure 7. The Final Device ECG output signal: (a) 60 BPM. (b) 60 BPM. (c) 80 BPM. (d) 120 BPM. (e) 180 BPM. (f) 300 BPM. (g) Measuring ECG signals from human body.
Applsci 13 08273 g007
Figure 8. The Final Device ECG output signal from four different males of ages between 18–20.
Applsci 13 08273 g008
Disclaimer/Publisher’s Note: The statements, opinions and data contained in all publications are solely those of the individual author(s) and contributor(s) and not of MDPI and/or the editor(s). MDPI and/or the editor(s) disclaim responsibility for any injury to people or property resulting from any ideas, methods, instructions or products referred to in the content.

