

Resonant Fatigue Tests on Drill Pipe Connections with Different Geometries and Sizes


Abstract
:1. Introduction
- Surface irregularities,
- Section variation at the upset,
- Corrosion pitting,
- Stress concentrations at the threaded region.
2. Materials and Methods
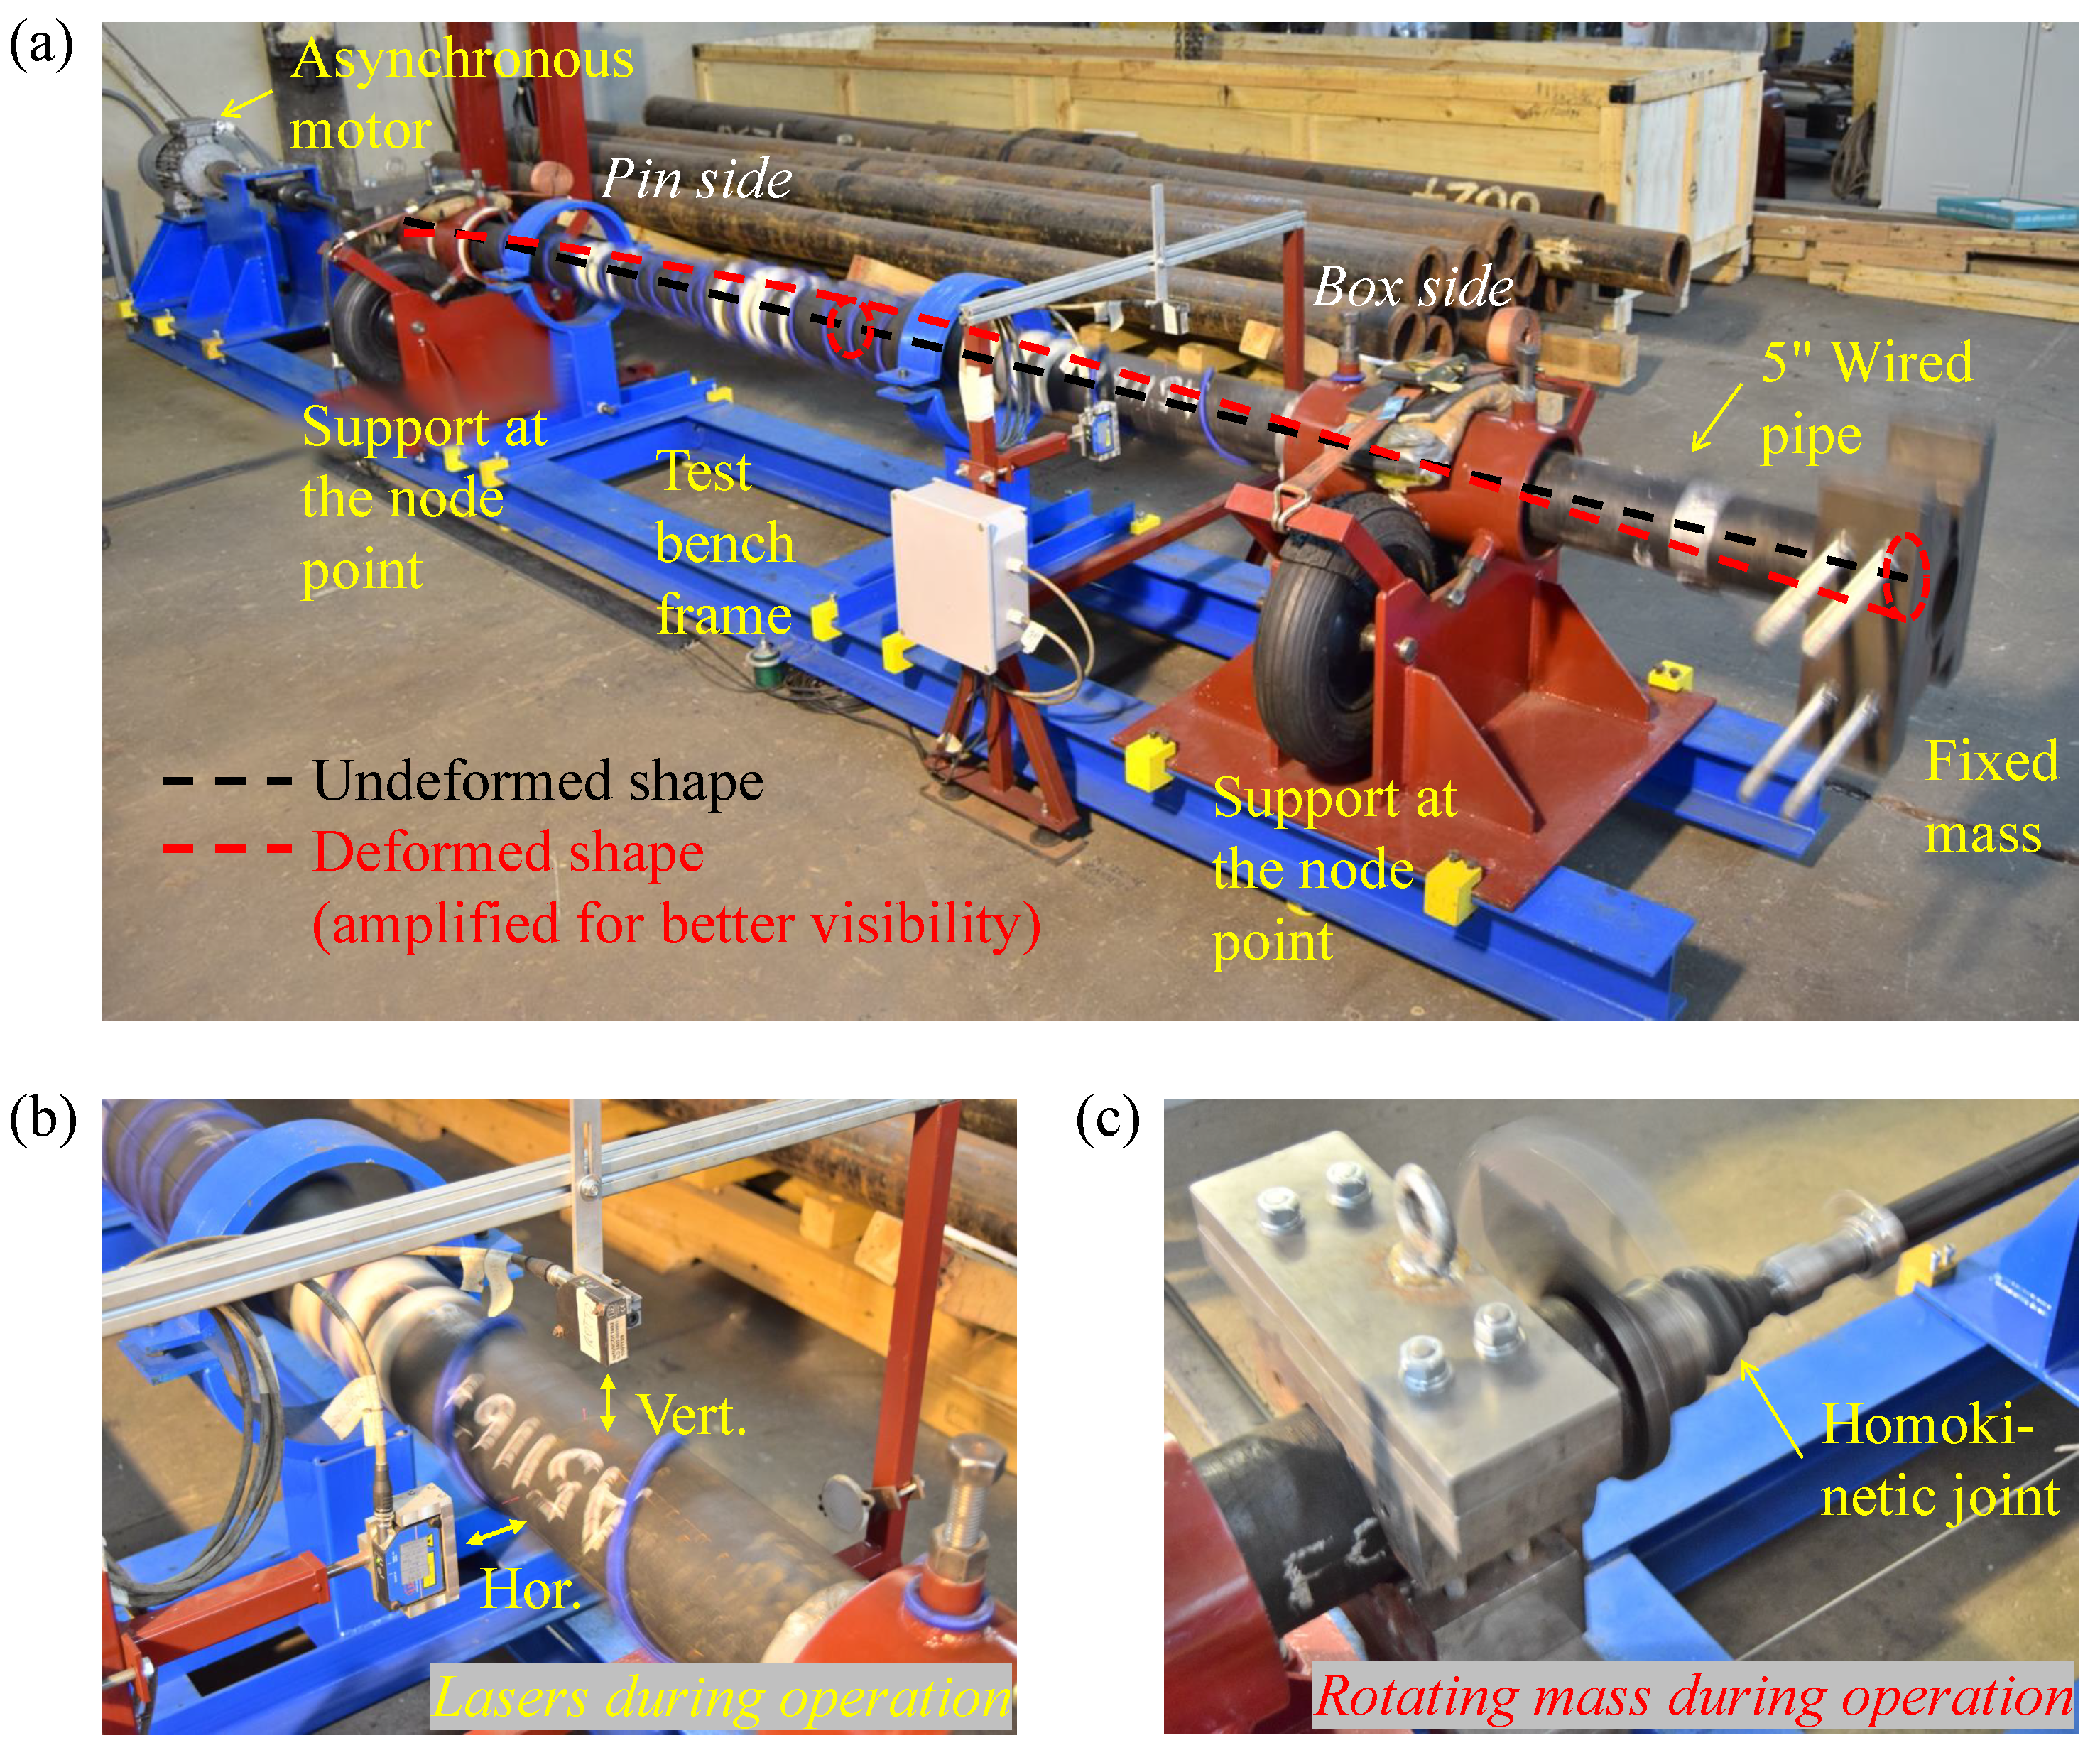
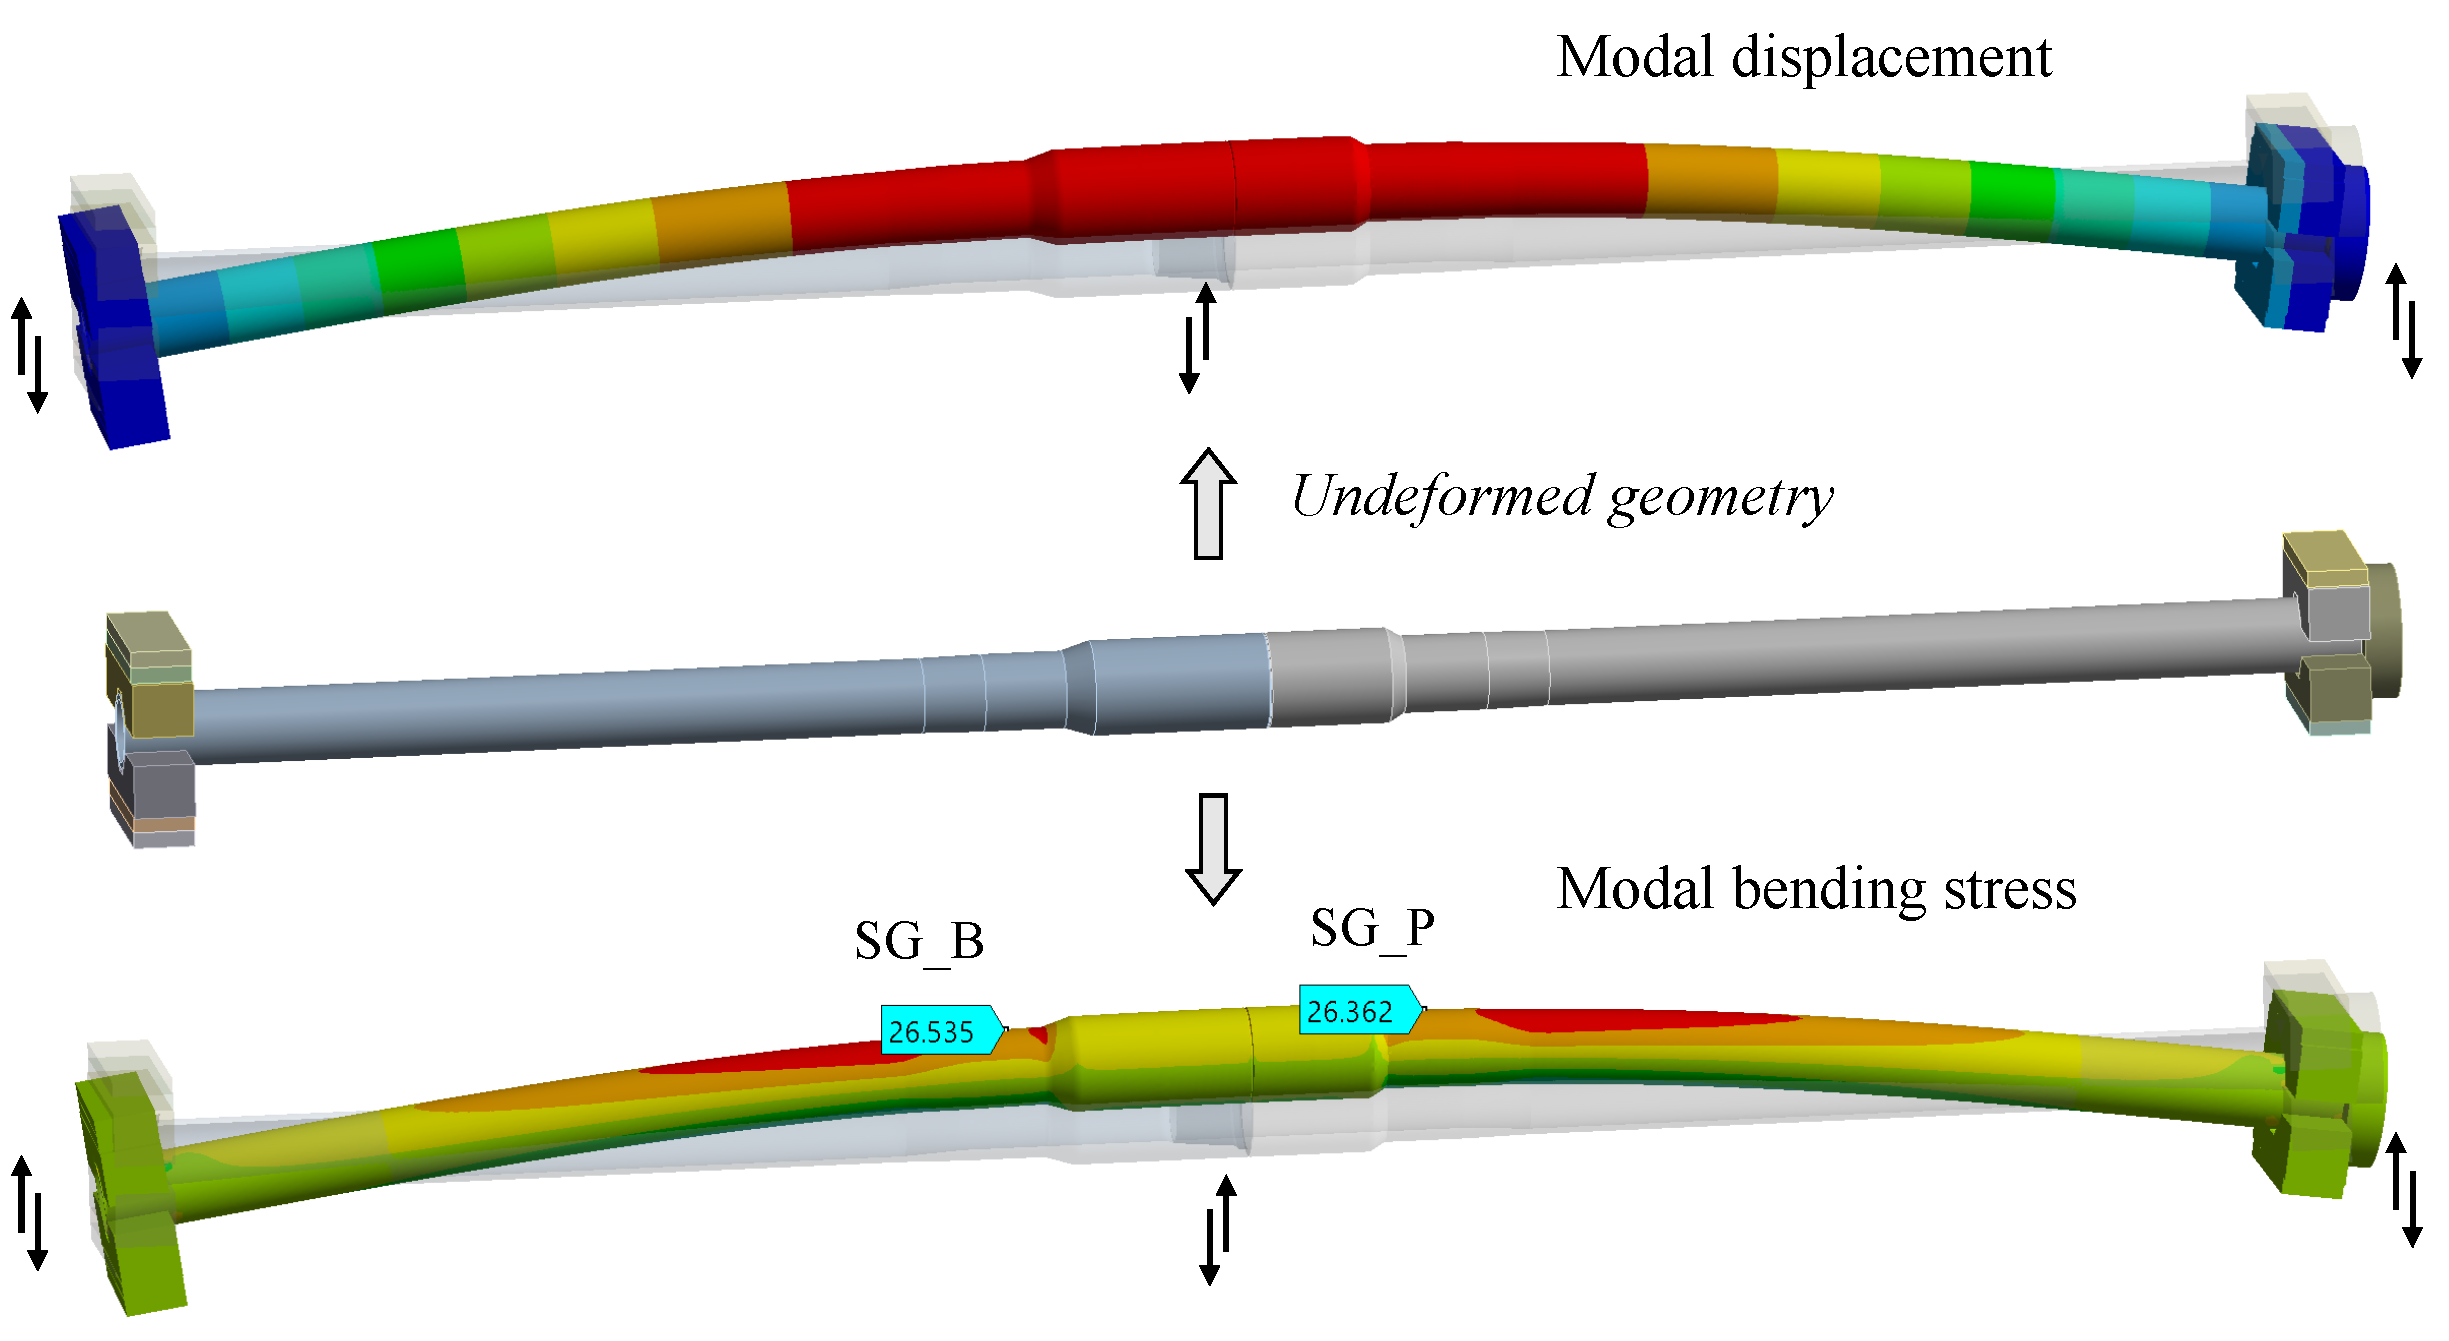
2.1. Description of the Resonant Test Rig
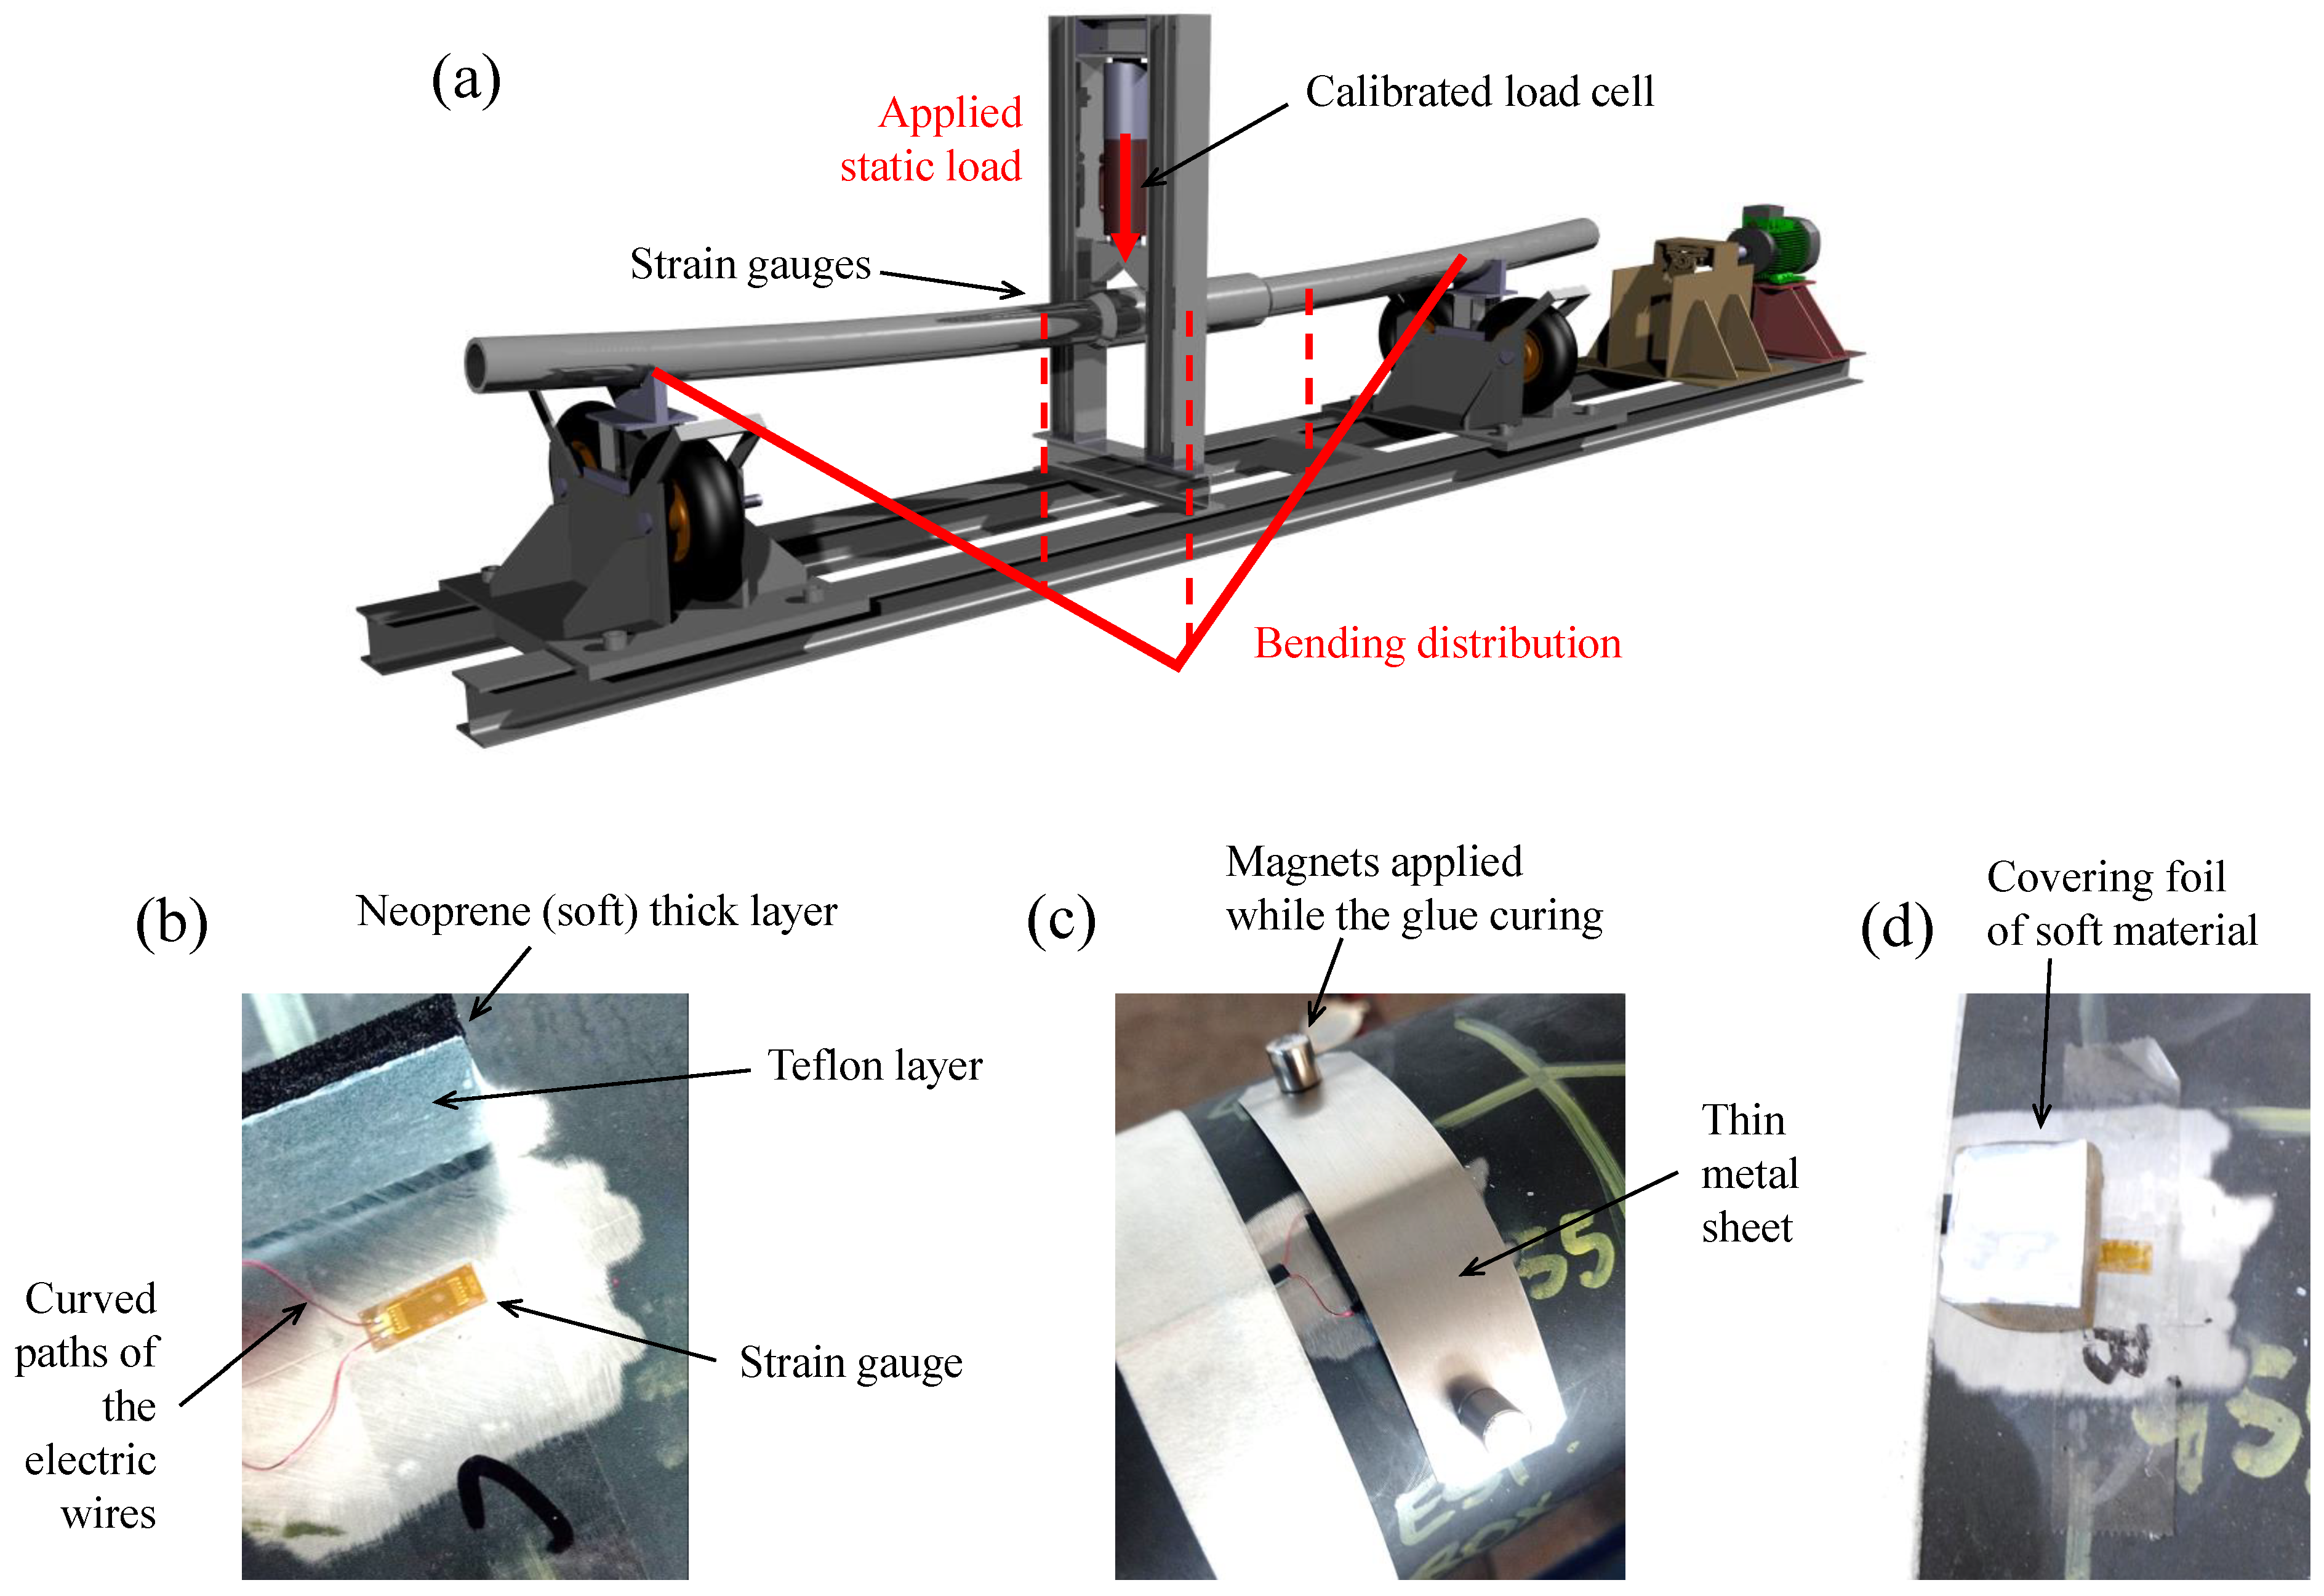
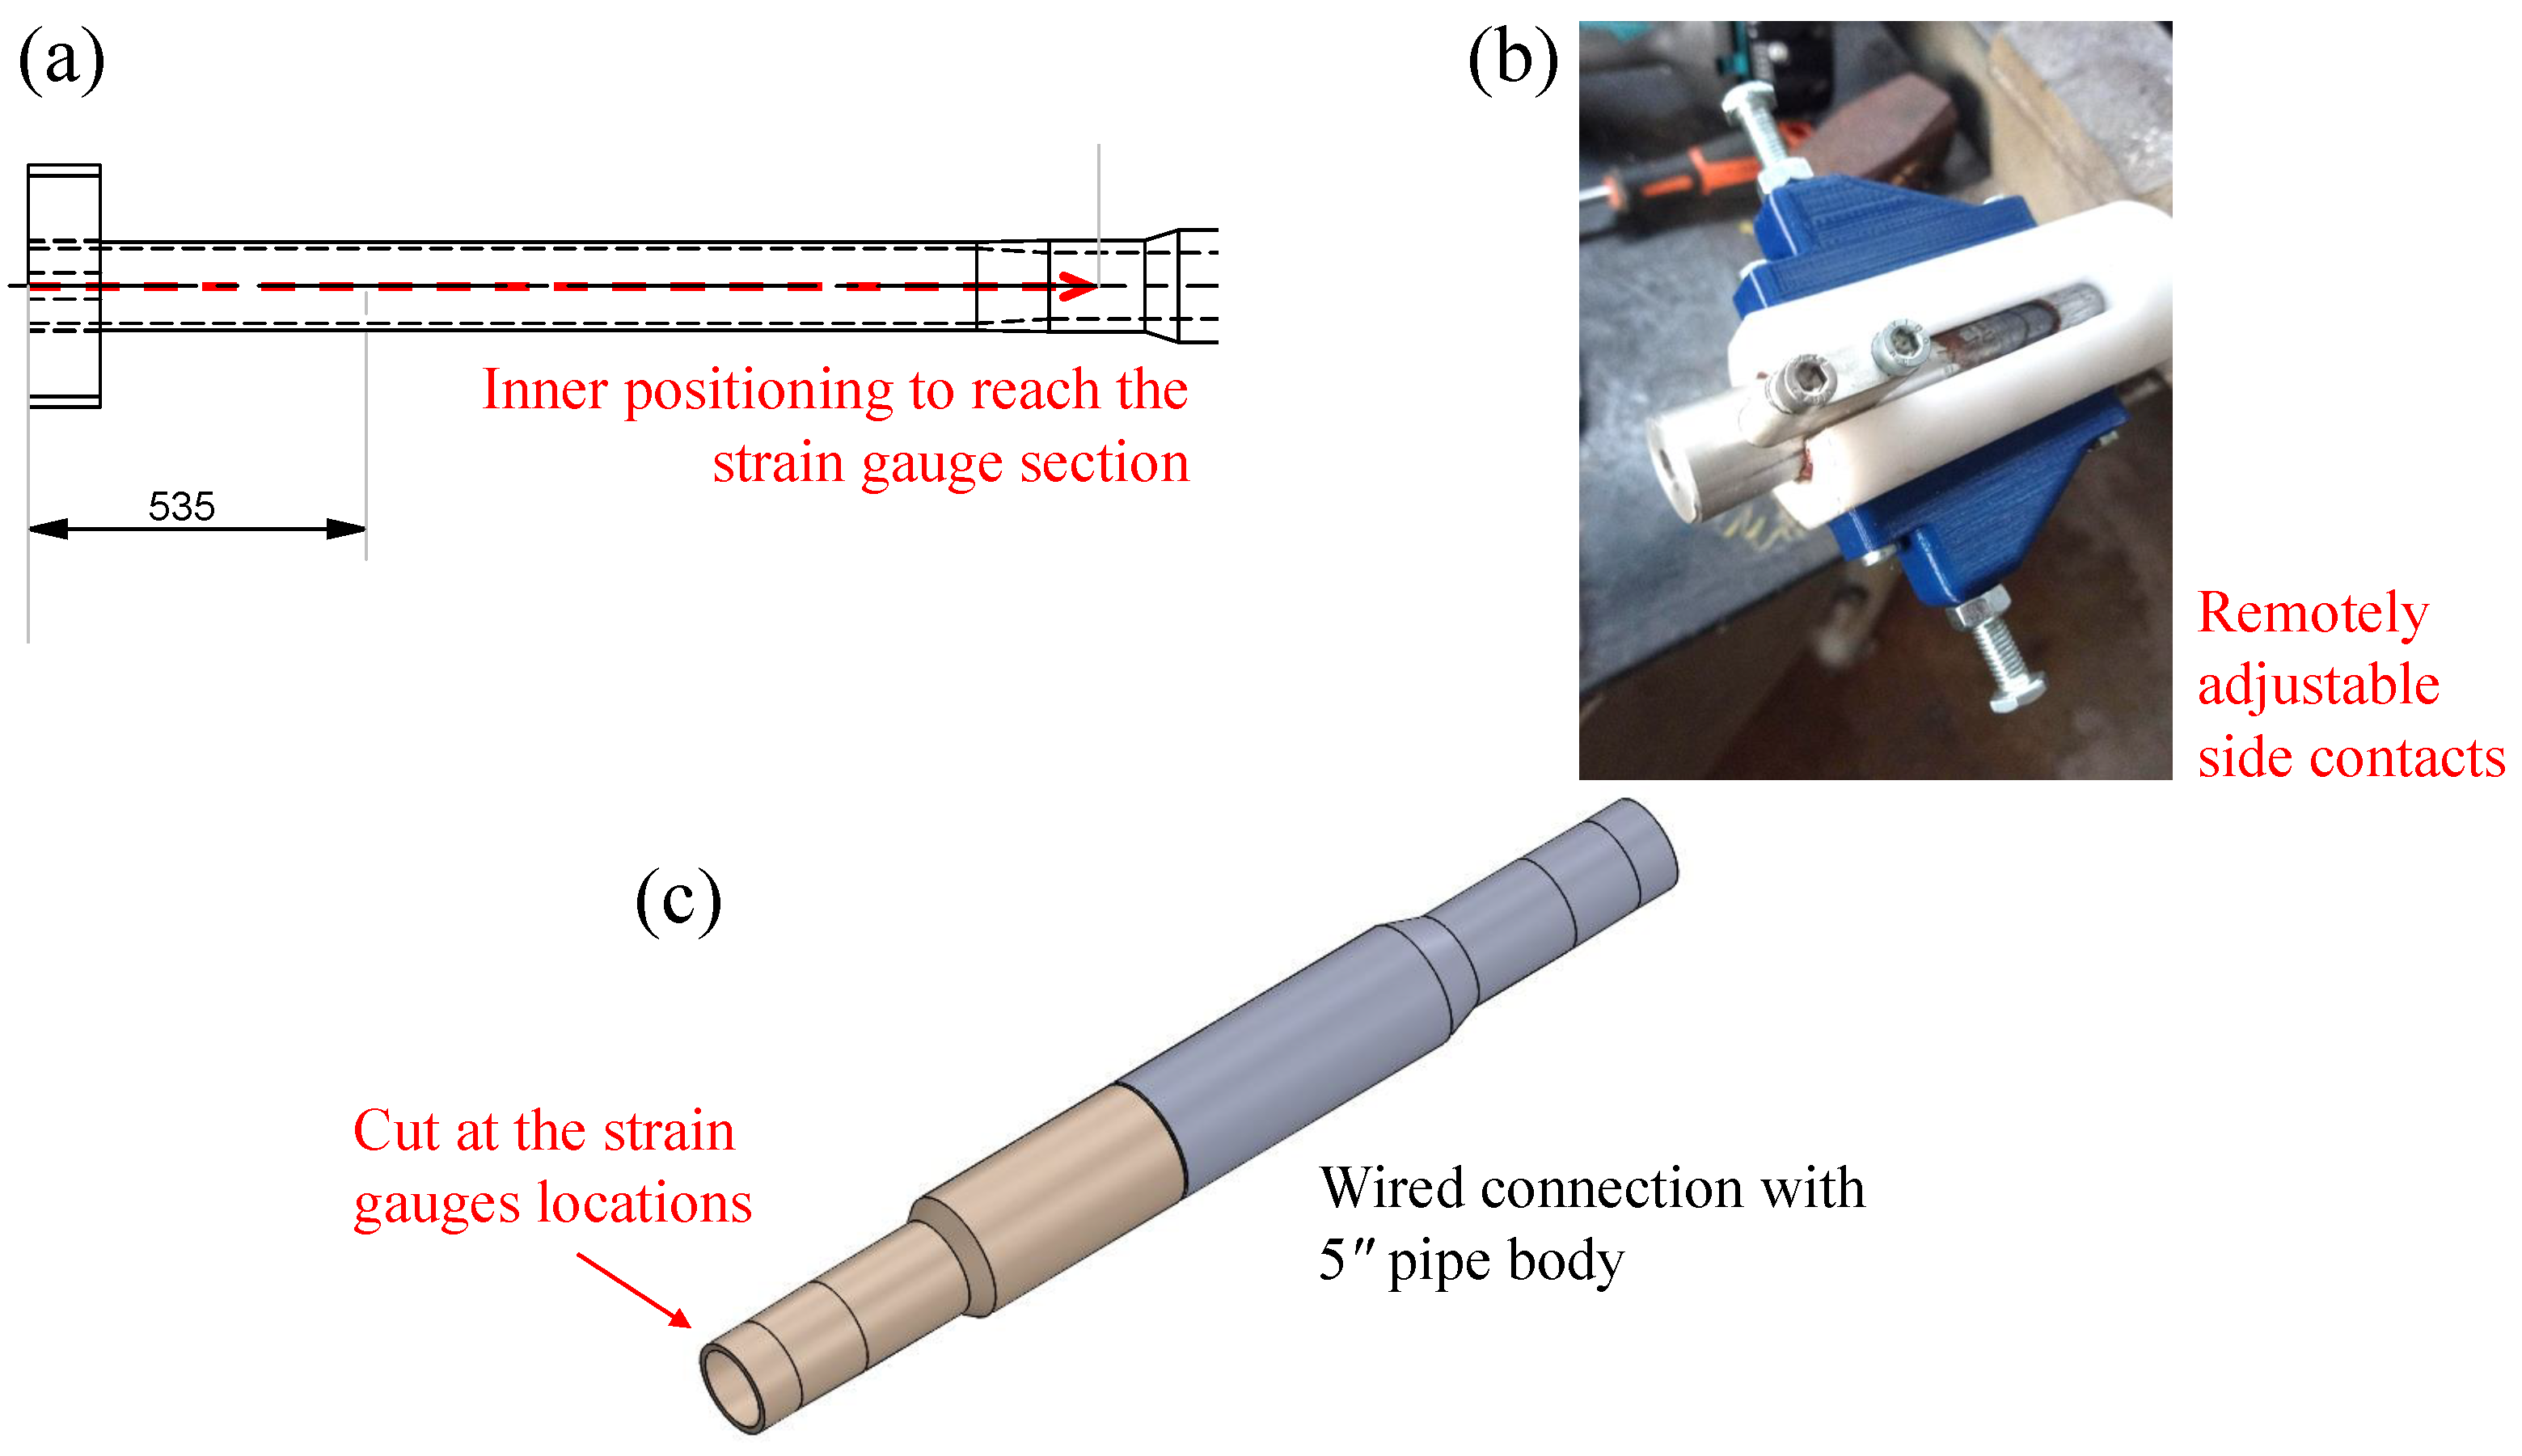
2.2. Calibration of the Strain Gauges and Laser Signal Set Up
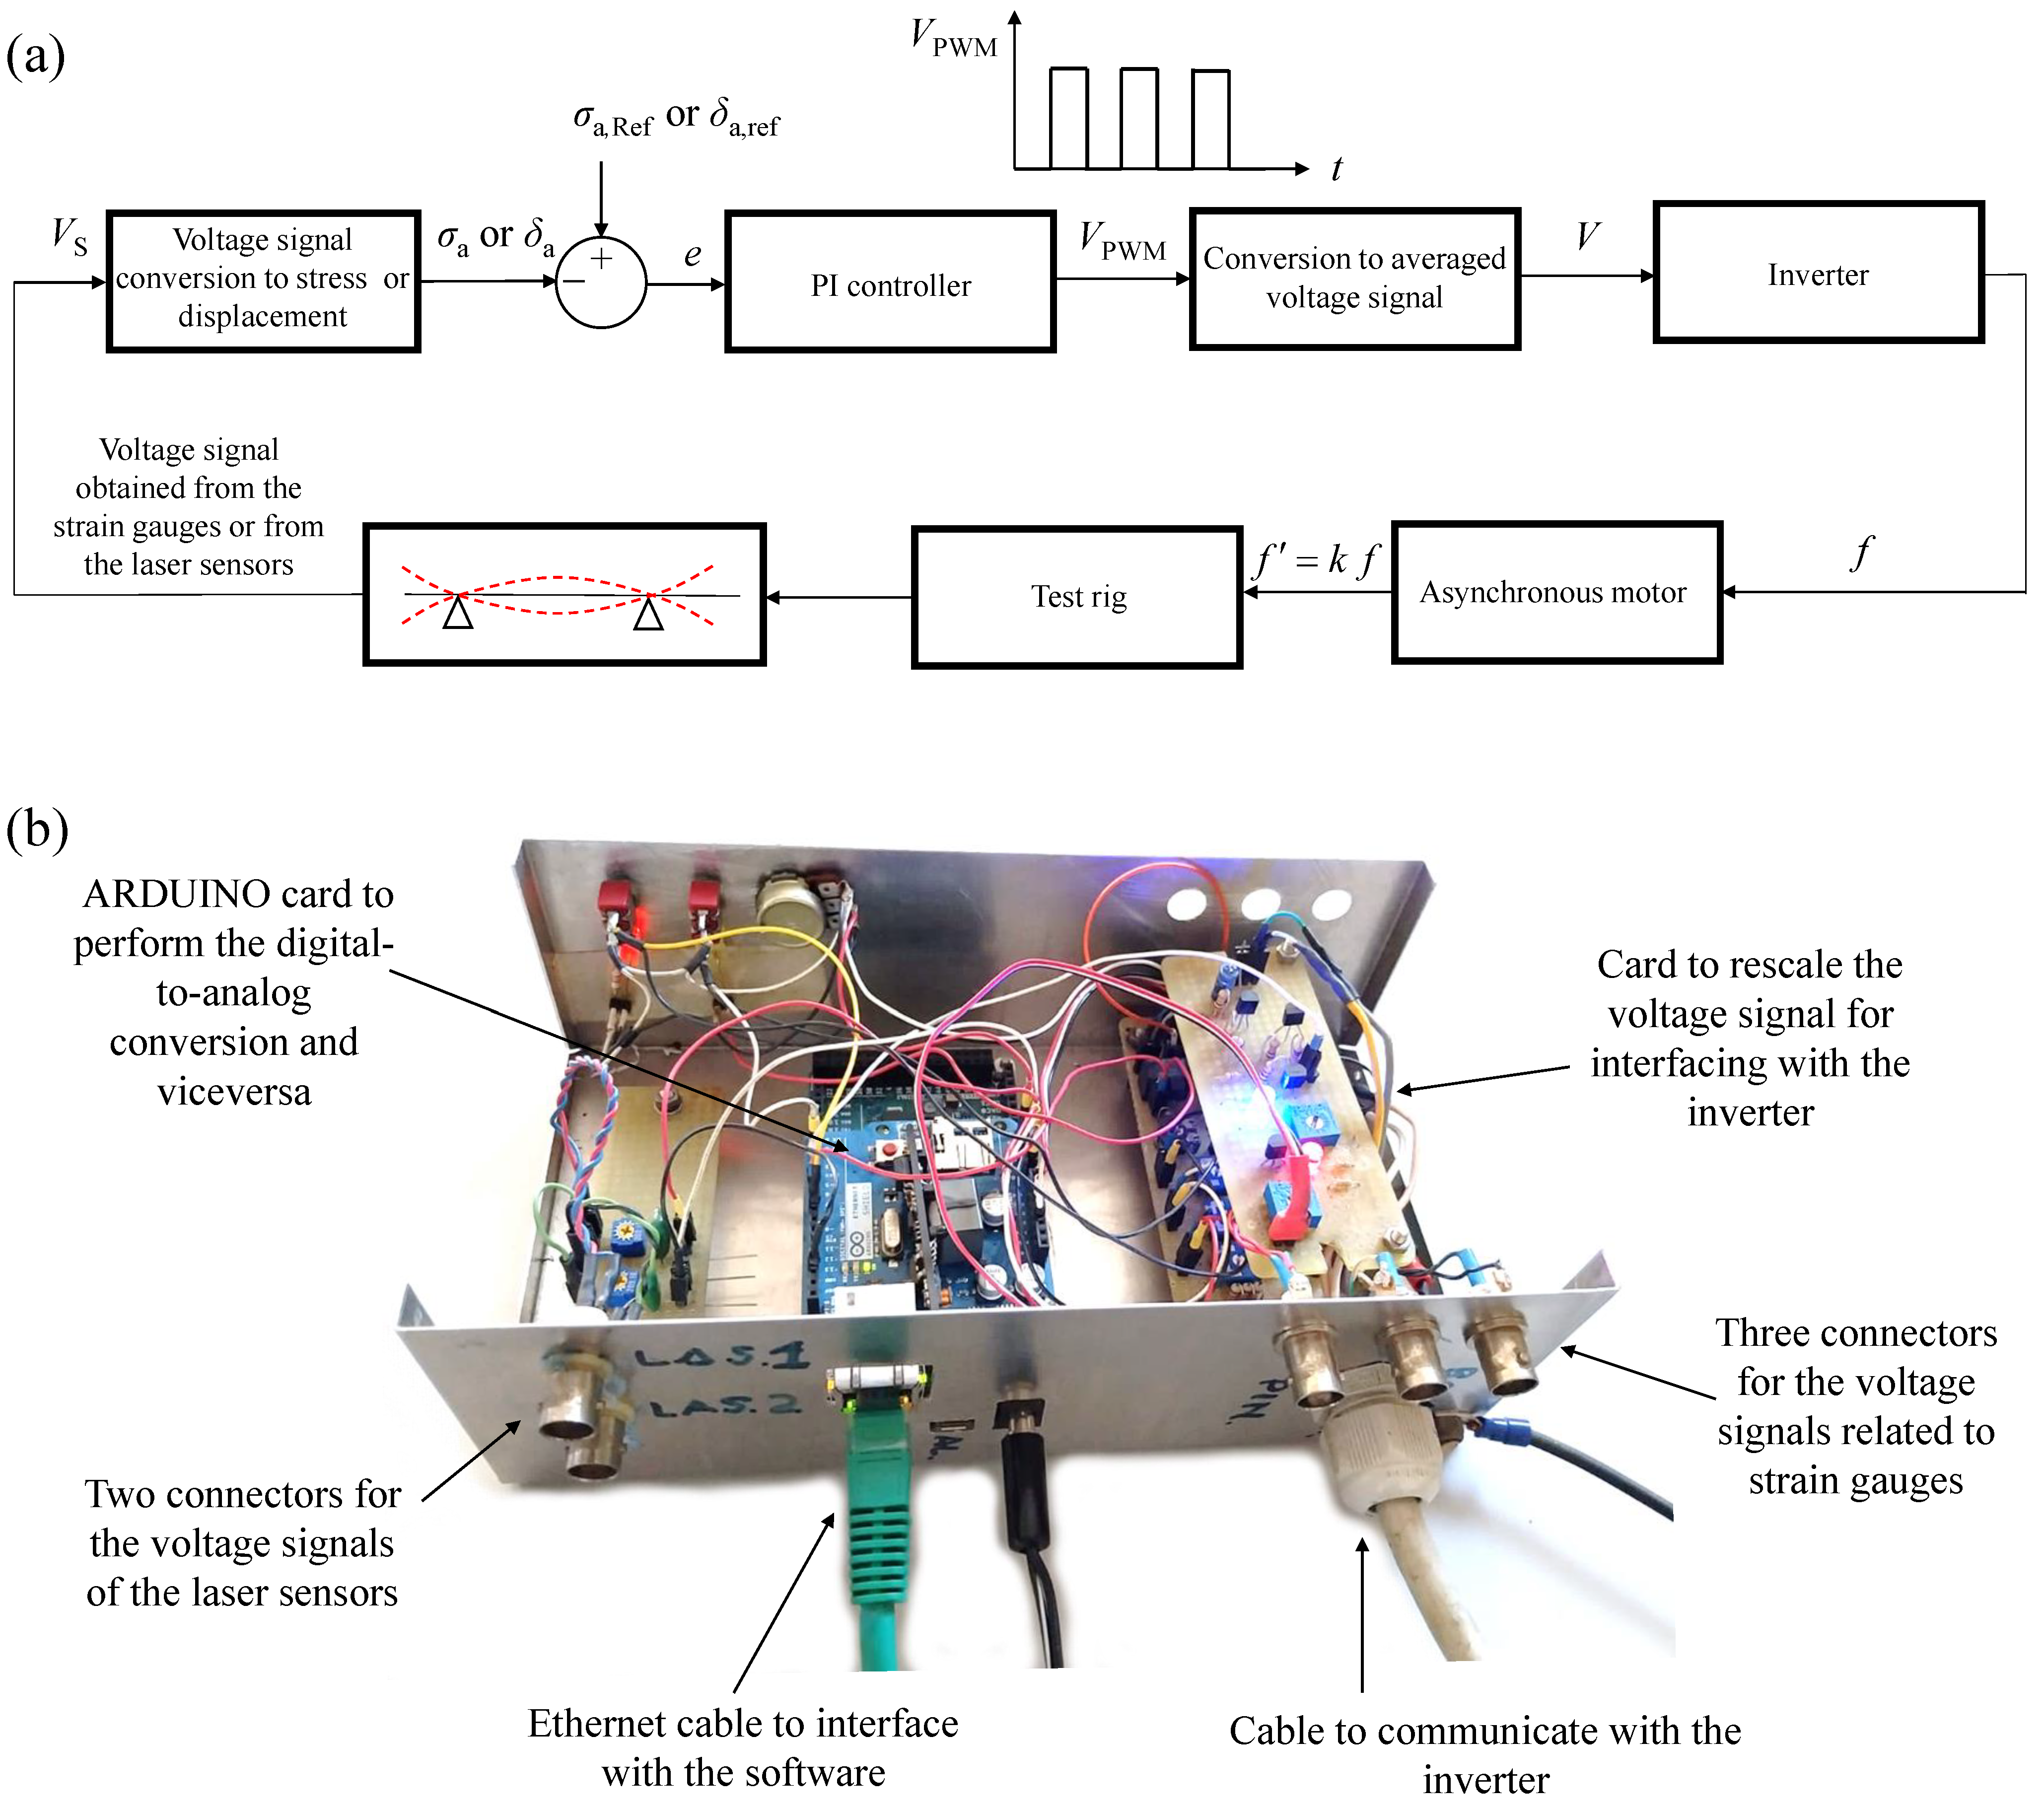
2.3. Control System to Regulate the Test Rig during the Test
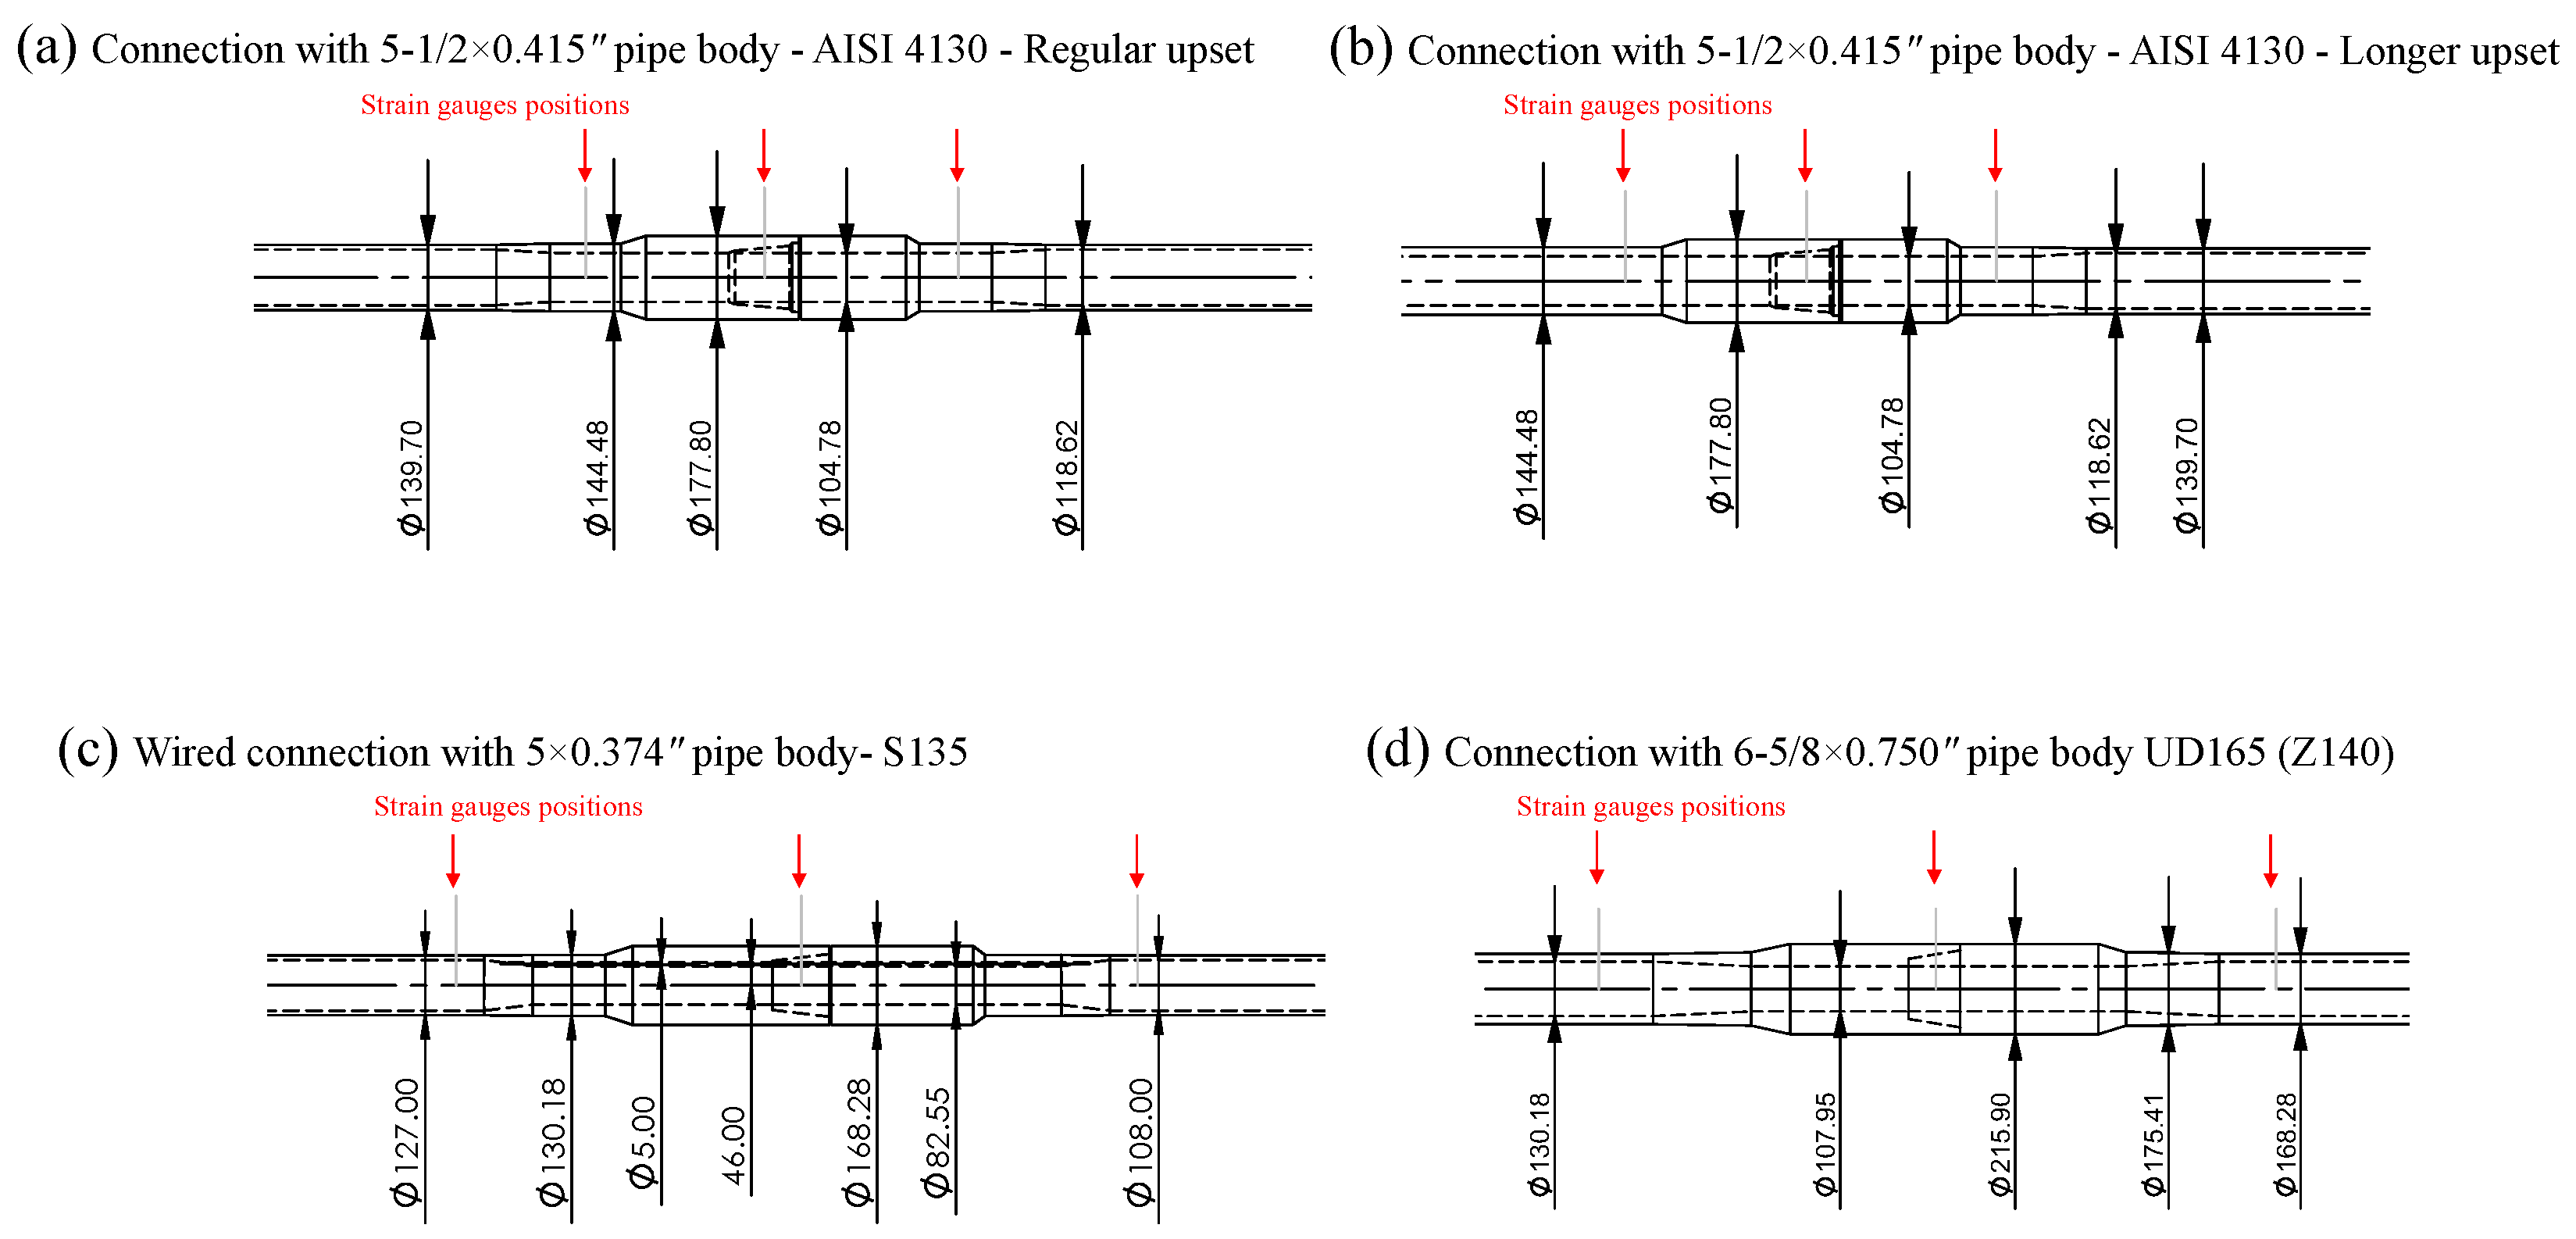
2.4. Types and Geometries of the Tested Specimens
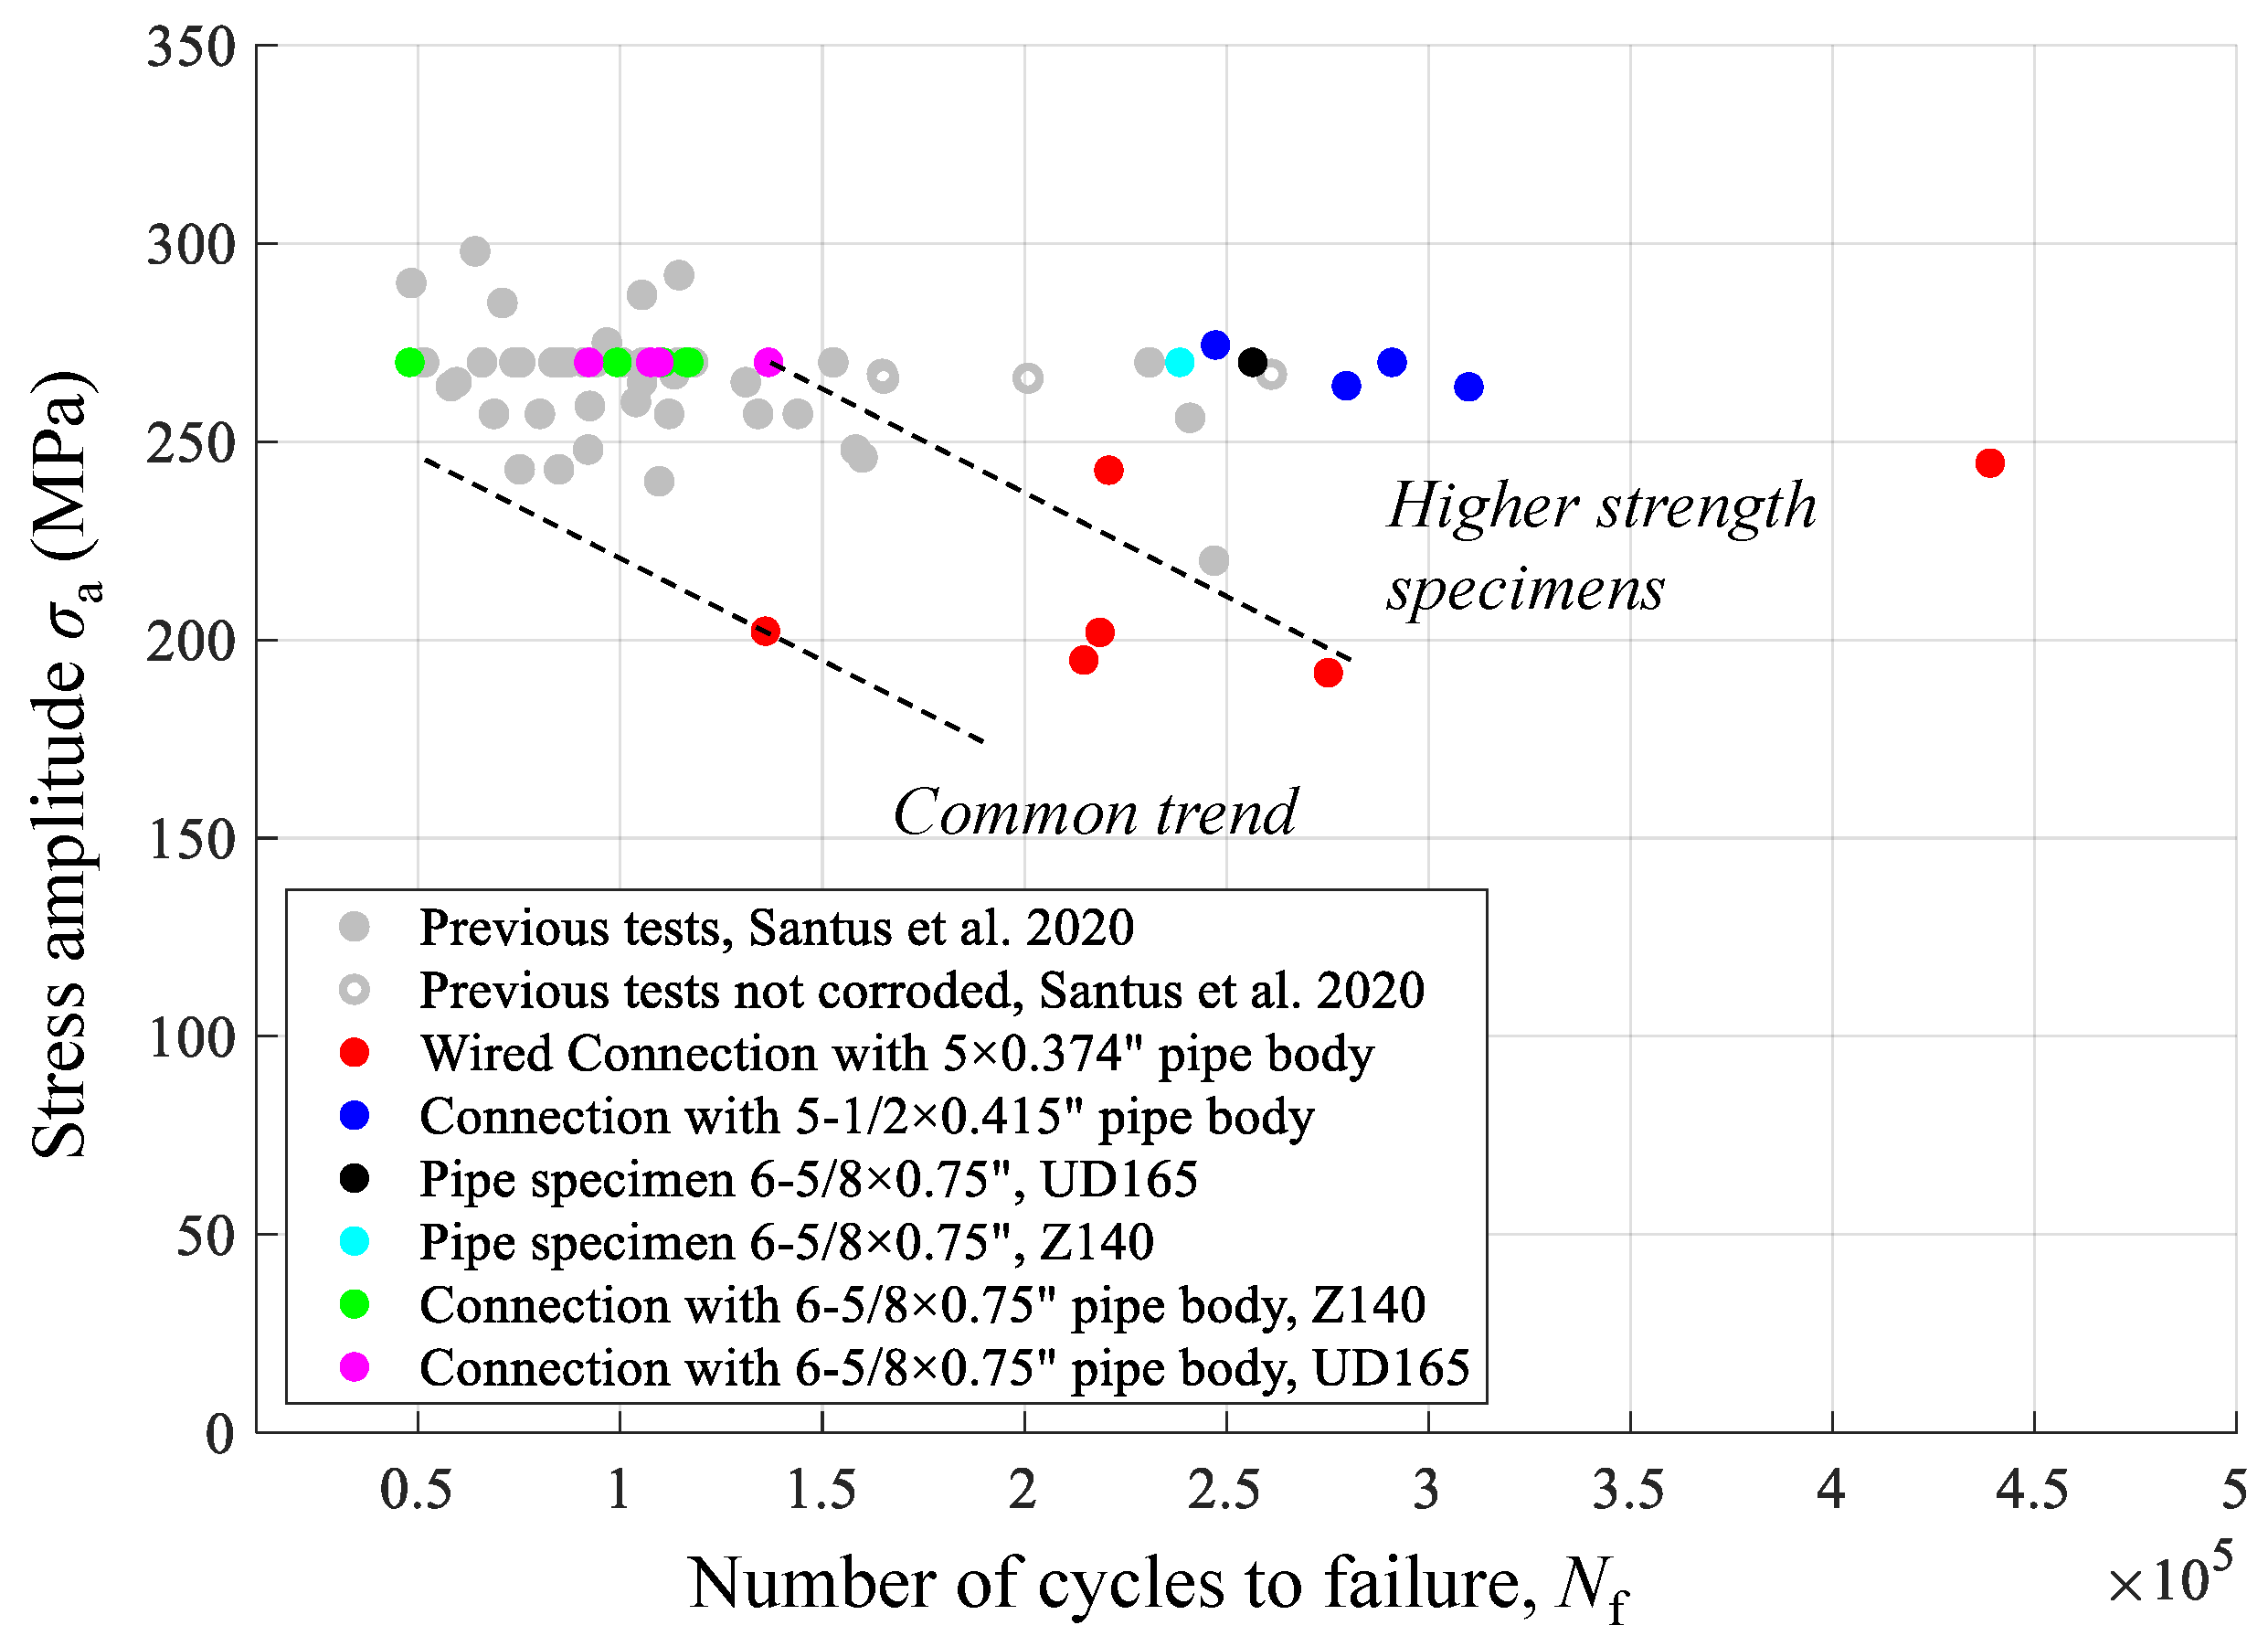
3. Results
4. Discussion
5. Conclusions
Author Contributions
Funding
Data Availability Statement
Conflicts of Interest
Abbreviations
| API | American Petroleum Institute |
| FE | Finite Element |
| FET | First engaged thread |
| LET | Last engaged thread |
| PI | Proportional Integrative |
| PWM | Pulse-width modulation |
| RU | Regular Upset |
| LU | Longer Upset |
| SG_B | Strain gauge at the box |
| SG_C | Strain gauge at the connection |
| SG_P | Strain gauge at the pin |
References
- API Specification. Specification for Rotary Drill Stem Elements; American Petroleum Institute: Washington, DC, USA, 2006. [Google Scholar]
- Inoue, T.; Wada, K.; Miyazaki, E.; Miyazaki, T. Scientific Drilling Program of Drilling Vessel Chikyu and Drilling Data Acquisition for Future Technical Development. In Proceedings of the Volume 5: Ocean Space Utilization Ocean Renewable Energy, ASMEDC, Rotterdam, The Netherlands, 19–24 June 2011. [Google Scholar] [CrossRef]
- Inoue, T.; Kyo, M.; Sakura, K. Fatigue Strength Evaluation of Drill Pipe for Challenging Deep Drilling Project—Japan Trench Fast Drilling (JFAST). In Proceedings of the International Ocean and Polar Engineering Conference, Anchorage, Alaska, 30 June–5 July 2013. ISOPE-I-13-224. [Google Scholar]
- Zamani, S.M.; Hassanzadeh-Tabrizi, S.A.; Sharifi, H. Failure analysis of drill pipe: A review. Eng. Fail. Anal. 2016, 59, 605–623. [Google Scholar] [CrossRef]
- Rahman, M. Stress concentration incorporated fatigue analysis of die-marked drill pipes. Int. J. Fatigue 1999, 21, 799–811. [Google Scholar] [CrossRef]
- Rahman, M.K.; Hossain, M.M.; Rahman, S.S. Survival assessment of die-marked drill pipes. Eng. Fail. Anal. 1999, 6, 277–299. [Google Scholar] [CrossRef]
- Zhu, H.; Lin, Y.; Zeng, D.; Zhou, Y.; Xie, J. Simulation analysis of flow field and shear stress distribution in internal upset transition zone of drill pipe. Eng. Fail. Anal. 2012, 21, 67–77. [Google Scholar] [CrossRef]
- Liu, Y.; Li, F.; Xu, X.; Yang, B.; Lu, C. Simulation Technology in Failure Analysis of Drill Pipe. Procedia Eng. 2011, 12, 236–241. [Google Scholar] [CrossRef] [Green Version]
- Lin, Y.; Qi, X.; Zhu, D.; Zeng, D.; Zhu, H.; Deng, K.; Shi, T. Failure analysis and appropriate design of drill pipe upset transition area. Eng. Fail. Anal. 2013, 31, 255–267. [Google Scholar] [CrossRef]
- Lu, S.; Feng, Y.; Luo, F.; Qin, C.; Wang, X. Failure analysis of IEU drill pipe wash out. Int. J. Fatigue 2005, 27, 1360–1365. [Google Scholar] [CrossRef]
- Luo, S.; Wu, S. Effect of stress distribution on the tool joint failure of internal and external upset drill pipes. Mater. Des. 2013, 52, 308–314. [Google Scholar] [CrossRef]
- Lubinski, A. Maximum Permissible Dog-Legs in Rotary Boreholes. J. Pet. Technol. 1961, 13, 175–194. [Google Scholar] [CrossRef]
- MacDonald, K.A. Failure analysis of drillstring and bottom hole assembly components. Eng. Fail. Anal. 1994, 1, 91–117. [Google Scholar] [CrossRef]
- Tafreshi, A.; Dover, W. Stress analysis of drillstring threaded connections using the finite element method. Int. J. Fatigue 1993, 15, 429–438. [Google Scholar] [CrossRef]
- Macdonald, K.A. The effectiveness of stress relief features in austenitic drillcollar connections. Eng. Fail. Anal. 1996, 3, 267–279. [Google Scholar] [CrossRef]
- Macdonald, K.A.; Deans, W.F. Stress analysis of drillstring threaded connections using the finite element method. Eng. Fail. Anal. 1995, 2, 1–30. [Google Scholar] [CrossRef]
- Vaisberg, O.; Vincké, O.; Perrin, G.; Sarda, J.P.; Fay, J.B. Fatigue of Drillstring: State of the Art. Oil Gas Sci.-Technol.-Rev. Inst. Fr. Pet. 2002, 57, 7–37. [Google Scholar] [CrossRef] [Green Version]
- Macdonald, K.A.; Bjune, J.V. Failure analysis of drillstrings. Eng. Fail. Anal. 2007, 14, 1641–1666. [Google Scholar] [CrossRef]
- Albdiry, M.T.; Almensory, M.F. Failure analysis of drillstring in petroleum industry: A review. Eng. Fail. Anal. 2016, 65, 74–85. [Google Scholar] [CrossRef]
- Ferjani, M.; Averbuch, D.; Constantinescu, A. A computational approach for the fatigue design of threaded connections. Int. J. Fatigue 2011, 33, 610–623. [Google Scholar] [CrossRef] [Green Version]
- Zarka, J. A New Approach in Inelastic Analysis of Structures; Laboratoire de Mecanique des Solides: Palaiseau, France, 1990. [Google Scholar]
- Lin, T.; Zhang, Q.; Lian, Z.; Liu, Y.; Zhang, Y.; Chen, Y. Multi-axial fatigue life prediction of drill collar thread in gas drilling. Eng. Fail. Anal. 2016, 59, 151–160. [Google Scholar] [CrossRef]
- Santus, C.; Bertini, L.; Burchianti, A.; Inoue, T.; Sakurai, N. Fatigue resonant tests on drill collar rotary shouldered connections and critical thread root identification. Eng. Fail. Anal. 2018, 89, 138–149. [Google Scholar] [CrossRef]
- Wittenberghe, J.V.; Baets, P.D.; Waele, W.D.; Galle, T.; Bui, T.T.; Roeck, G.D. Design characteristics that improve the fatigue life of threaded pipe connections. Int. J. Sustain. Constr. Des. 2011, 2, 334–341. [Google Scholar] [CrossRef]
- Liu, H.; He, Y.; Wan, J.; Chen, L.; Yi, X.; Hou, S.; Wang, Y.; He, D.; Li, G. New design method of unequal taper thread (UTT) pairs and its application in API NC38 thread improvement. Petroleum 2023, in press. [Google Scholar] [CrossRef]
- Korin, I.; Ipiña, J.P. Controlled residual stresses introduction to improve fatigue resistance of rotary shouldered connections used in oil drilling industry. Int. J. Press. Vessel. Pip. 2010, 87, 696–703. [Google Scholar] [CrossRef]
- Moradi, S.; Ranjbar, K. Experimental and computational failure analysis of drillstrings. Eng. Fail. Anal. 2009, 16, 923–933. [Google Scholar] [CrossRef]
- Inoue, T.; Ozaki, M.; Miyazaki, T.; Nishigaki, M.; Setta, K. Fatigue strength evaluationof drill pipe constantly bent in strong current. In Proceedings of the 8th 2008 ISOPE Pacific/Asia Offshore Mechanics Symposium, Bangkok, Thailand, 10–14 November 2008. [Google Scholar]
- Inoue, T.; Kyo, M.; Sakura, K.; Fukui, T. Fatigue Strength Investigation of Drill Pipe for Challenging Scientific Deep Drilling and Utilization of Drilling Data to Estimate Cumulative Fatigue. In Proceedings of the Offshore Technology Conference, Houston, TX, USA, 5–8 May 2014. [Google Scholar] [CrossRef]
- Baryshnikov, A.; Calderoni, A.; Ligrone, A.; Ferrara, P. A New Approach to the Analysis of Drillstring Fatigue Behavior. SPE Drill. Complet. 1997, 12, 77–84. [Google Scholar] [CrossRef]
- Hakimi, H.; Moradi, S. Drillstring vibration analysis using differential quadrature method. J. Pet. Sci. Eng. 2010, 70, 235–242. [Google Scholar] [CrossRef]
- Besselink, B.; van de Wouw, N.; Nijmeijer, H. A Semi-Analytical Study of Stick-Slip Oscillations in Drilling Systems. J. Comput. Nonlinear Dyn. 2010, 6, 021006. [Google Scholar] [CrossRef] [Green Version]
- Kessai, I.; Benammar, S.; Doghmane, M.Z.; Tee, K.F. Drill Bit Deformations in Rotary Drilling Systems under Large-Amplitude Stick-Slip Vibrations. Appl. Sci. 2020, 10, 6523. [Google Scholar] [CrossRef]
- Wada, R.; Kaneko, T.; Ozaki, M.; Inoue, T.; Senga, H. Longitudinal natural vibration of ultra-long drill string during offshore drilling. Ocean. Eng. 2018, 156, 1–13. [Google Scholar] [CrossRef]
- Kulke, V.; Thunich, P.; Schiefer, F.; Ostermeyer, G.P. A Method for the Design and Optimization of Nonlinear Tuned Damping Concepts to Mitigate Self-Excited Drill String Vibrations Using Multiple Scales Lindstedt-Poincaré. Appl. Sci. 2021, 11, 1559. [Google Scholar] [CrossRef]
- Riane, R.; Doghmane, M.Z.; Kidouche, M.; Tee, K.F.; Djezzar, S. Stick-Slip Vibration Suppression in Drill String Using Observer-Based LQG Controller. Sensors 2022, 22, 5979. [Google Scholar] [CrossRef]
- Teodoriu, C. Oil Country Tubular Goods Fatigue Testing: Do We Test Them Enough? In Proceedings of the Volume 4: Materials Technology. American Society of Mechanical Engineers, Trondheim, Norway, 25–30 June 2017. [Google Scholar] [CrossRef]
- Miscow, G. Techniques to characterize fatigue behaviour of full size drill pipes and small scale samples. Int. J. Fatigue 2004, 26, 575–584. [Google Scholar] [CrossRef]
- Bertini, L.; Beghini, M.; Santus, C.; Baryshnikov, A. Resonant test rigs for fatigue full scale testing of oil drill string connections. Int. J. Fatigue 2008, 30, 978–988. [Google Scholar] [CrossRef]
- Haagensen, P.J.; Grøttum, T.I. Fatigue Assessment of Drill Pipes. In Proceedings of the Volume 4: Materials Technology. American Society of Mechanical Engineers, Trondheim, Norway, 25–30 June 2017. [Google Scholar] [CrossRef]
- Oku, Y.; Sugino, M.; Ando, Y.; Makino, T.; Komoda, R.; Takazaki, D.; Kubota, M. Fretting fatigue on thread root of premium threaded connections. Tribol. Int. 2017, 108, 111–120. [Google Scholar] [CrossRef]
- Wittenberghe, J.V.; Baets, P.D.; Waele, W.D.; Ost, W.; Verstraete, M.; Hertelé, S. Resonant Bending Fatigue Test Setup for Pipes With Optical Displacement Measuring System. J. Offshore Mech. Arct. Eng. 2012, 134. [Google Scholar] [CrossRef]
- Santus, C.; Burchianti, A.; Inoue, T.; Ishiguro, H. Fatigue resonant tests on S140 and S150 grade corroded drill pipe connections and pipe bodies. Int. J. Press. Vessel. Pip. 2020, 184, 104107. [Google Scholar] [CrossRef]
- Schneider, S.; Herrmann, R.; Marx, S. Development of a resonant fatigue testing facility for large-scale beams in bending. Int. J. Fatigue 2018, 113, 171–183. [Google Scholar] [CrossRef]
- Chuan, W.; Zhu, H.; Wang, D. Test System and Model for Fatigue Performance Evaluation of Marine Riser. J. Appl. Sci. 2013, 13, 854–861. [Google Scholar] [CrossRef] [Green Version]
- Xiaoming, F.; Zhichao, Y.; Liquan, W.; Yuxuan, H. Experiment and Finite Analysis on Resonant Bending Fatigue of Marine Risers. Open Mech. Eng. J. 2015, 9, 205–212. [Google Scholar] [CrossRef] [Green Version]
- Snowberg, D.; Dana, S.; Hughes, S.; Berling, P. Implementation of a Biaxial Resonant Fatigue Test Method on a Large Wind Turbine Blade; Technical Report; National Renewable Energy Lab. (NREL): Golden, CO, USA, 2014. [Google Scholar] [CrossRef] [Green Version]
- Melcher, D.; Bätge, M.; Neßlinger, S. A novel rotor blade fatigue test setup with elliptical biaxial resonant excitation. Wind. Energy Sci. 2020, 5, 675–684. [Google Scholar] [CrossRef]
- Yun, G.J.; Abdullah, A.B.M.; Binienda, W. Development of a Closed-Loop High-Cycle Resonant Fatigue Testing System. Exp. Mech. 2011, 52, 275–288. [Google Scholar] [CrossRef]
- Feng, M.; Li, M. Development of a Computerized Electrodynamic Resonant Fatigue Test Machine and Its Applications to Automotive Components; SAE Technical Paper Series; SAE International: Warrendale, PA, USA, 2003. [Google Scholar] [CrossRef]
- Huertas, J.I.; Navarrete, N.; Giraldo, M.; Uribe, J.D.; Gasca, J.J. Resonant fatigue test bench for shaft testing. Fatigue Fract. Eng. Mater. Struct. 2016, 40, 364–374. [Google Scholar] [CrossRef]
- Thomas, C.; Sainz-Aja, J.; Setien, J.; Cimentada, A.; Polanco, J.A. Resonance fatigue testing on high-strength self-compacting concrete. J. Build. Eng. 2021, 35, 102057. [Google Scholar] [CrossRef]
- Okeke, C.P.; Thite, A.N.; Durodola, J.F.; Greenrod, M.T. A novel test rig for measuring bending fatigue using resonant behaviour. Procedia Struct. Integr. 2018, 13, 1470–1475. [Google Scholar] [CrossRef]
- Mitu, A.M.; Sireteanu, T.; Pop, N.; Chis, L.C.; Maxim, V.M.; Apsan, M.R. Numerical and Experimental Study of the Fatigue Behavior for a Medical Rehabilitation Exoskeleton Device Using the Resonance Method. Materials 2023, 16, 1316. [Google Scholar] [CrossRef]
- Shahani, A.R.; Sharifi, S.M.H. Contact stress analysis and calculation of stress concentration factors at the tool joint of a drill pipe. Mater. Des. 2009, 30, 3615–3621. [Google Scholar] [CrossRef]
- Santus, C.; Grossi, T.; Romanelli, L.; Pedranz, M.; Benedetti, M. A computationally fast and accurate procedure for the identification of the Chaboche isotropic-kinematic hardening model parameters based on strain-controlled cycles and asymptotic ratcheting rate. Int. J. Plast. 2023, 160, 103503. [Google Scholar] [CrossRef]


| Specimen Type | Specimen ID | Imposed Stress | Number of Cycles | Location of Crack |
|---|---|---|---|---|
| Amplitude (MPa) | to Failure, | Initiation Point | ||
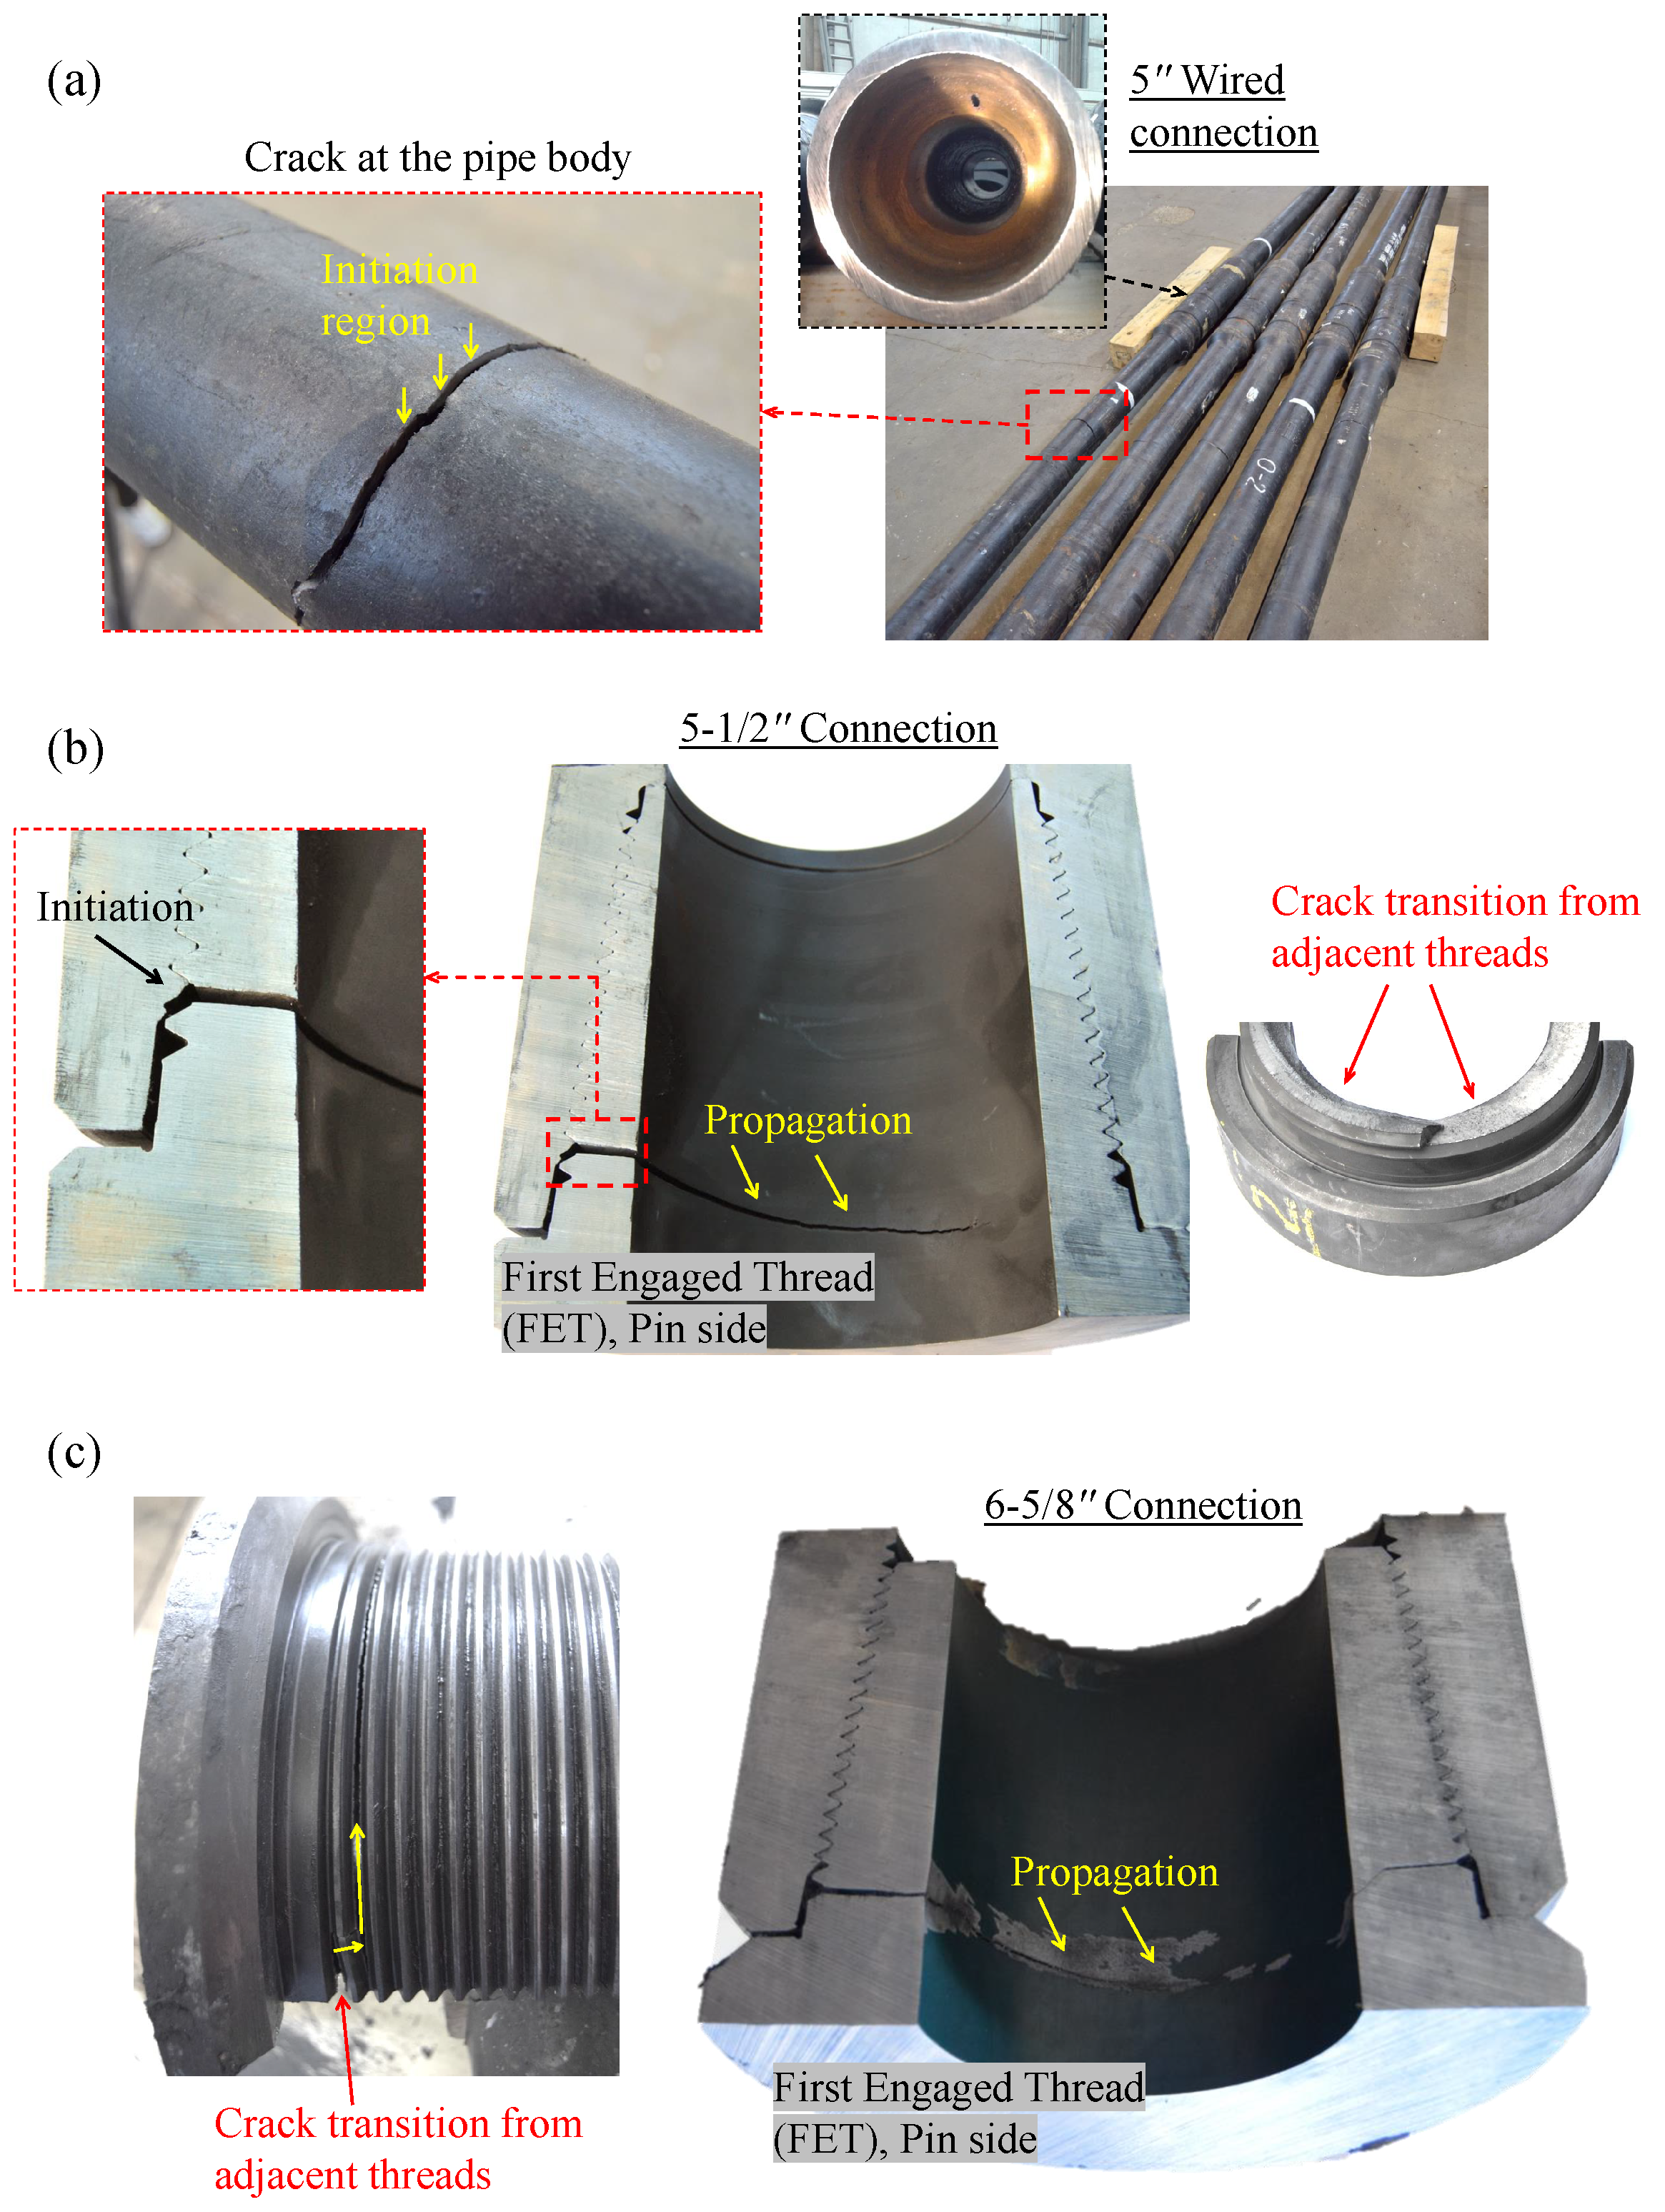
| Connection with 5-1/2” pipe body | RU W0581-1 | FET of the Pin side | ||
| RU W0581-2 | ||||
| LU W0579-1 | ||||
| LU W0582-1 | ||||
| Wired Connection with 5” pipe body | A51136 | Pipe body | ||
| A51155 | ||||
| A51168 | ||||
| A51167 | ||||
| A51140 | ||||
| A51119 | ||||
| Connection with 6-5/8” pipe body | Z140-14012 | 270 | FET of the Pin side | |
| Z140-14030 | 270 | |||
| Z140-14041 | 270 | |||
| Z140-14076 | 270 | |||
| Z140-14099 | 270 | |||
| Z140-14110 | 270 | |||
| UD165-9250 | 270 | |||
| UD165-49267 | 270 | |||
| UD165-49218 | 270 | |||
| UD165-49221 | 270 | |||
| UD165-9257 | 270 | |||
| Pipe specimens 6-5/8” | UD165-49267 | 270 | Pipe body | |
| Z140-14076 | 270 |
Disclaimer/Publisher’s Note: The statements, opinions and data contained in all publications are solely those of the individual author(s) and contributor(s) and not of MDPI and/or the editor(s). MDPI and/or the editor(s) disclaim responsibility for any injury to people or property resulting from any ideas, methods, instructions or products referred to in the content. |
© 2023 by the authors. Licensee MDPI, Basel, Switzerland. This article is an open access article distributed under the terms and conditions of the Creative Commons Attribution (CC BY) license (https://creativecommons.org/licenses/by/4.0/).
Share and Cite
Santus, C.; Romanelli, L.; Burchianti, A.; Inoue, T. Resonant Fatigue Tests on Drill Pipe Connections with Different Geometries and Sizes. Appl. Sci. 2023, 13, 8006. https://doi.org/10.3390/app13148006
Santus C, Romanelli L, Burchianti A, Inoue T. Resonant Fatigue Tests on Drill Pipe Connections with Different Geometries and Sizes. Applied Sciences. 2023; 13(14):8006. https://doi.org/10.3390/app13148006
Chicago/Turabian StyleSantus, Ciro, Lorenzo Romanelli, Alessandro Burchianti, and Tomoya Inoue. 2023. "Resonant Fatigue Tests on Drill Pipe Connections with Different Geometries and Sizes" Applied Sciences 13, no. 14: 8006. https://doi.org/10.3390/app13148006