Article

Experimental and Numerical Investigation of the Mesoscale Size Effect in Notched Woven Composites

by
Andrea Ferrarese
*,
Carlo Boursier Niutta
,
Alberto Ciampaglia
,
Raffaele Ciardiello
,
Davide S. Paolino
and
Giovanni Belingardi
Department of Mechanical and Aerospace Engineering, Politecnico di Torino, 10129 Torino, Italy
*
Author to whom correspondence should be addressed.
Appl. Sci. 2023, 13(7), 4300; https://doi.org/10.3390/app13074300
Submission received: 6 March 2023 / Revised: 22 March 2023 / Accepted: 22 March 2023 / Published: 28 March 2023
(This article belongs to the Special Issue Focus on Fatigue and Fracture of Engineering Materials, Volume II)

Abstract

:
The uniaxial strength of 2 × 2 twill carbon fiber-epoxy composite with circular open holes is governed by the stress concentration induced by the notch, as well as by the variation of the material response with the stress localization. In this study, these concurrent phenomena were studied using an experimental-numerical approach, considering the effect of the composite heterogeneity. An innovative simplified mesoscale model using shell elements to replicate the woven pattern was developed. The material properties of the model were identified with a data-driven optimization scheme that minimizes the difference between the experimental full-field strain, measured with Digital Image Correlation, and the one predicted by the model itself. The elastic properties identified for the material at tow level are analogous to that of a unidirectional composite, with longitudinal and transverse moduli of around 102 GPa and 15 GPa, respectively. The calibrated model was used to analyze the stress concentration and localization induced by circular notches with increasing diameter. A size effect describing the increase in the carbon fiber tow strength following the increase in stress localization was observed. The mesoscale material strength was found to increase by about 2.5 times in the presence of the notch, from 2131 to 3922 MPa in fiber direction, partially balancing the stress intensification effect of the hole that leads to an approximately three-fold stress increase in the material.

1. Introduction

Digital Image Correlation (DIC) is a well-established method to obtain full-field strain measurements during mechanical testing on the surfaces of material coupons and components. This measurement technique is often applied when performing tests on heterogeneous materials, where data with fine spatial resolution are needed, and for identifying local material properties [1]. Due to their intrinsic heterogeneity and anisotropy, stress concentration in composite materials is a complex problem, the study of which has greatly benefited from full-field techniques; previous works have used electronic speckle pattern interferometry [2], the grid method [3], and digital image correlation [4]. A common application of full-field measurements to this problem is for validating a finite element analysis, by comparing the measured strain field with the numerical results [2,3].
The tensile strength of hole-notched composites is a classic example of size effect. In general, this effect is the dependence of mechanical behavior on the scale of the problem, typically observed in brittle and quasi-brittle materials [5]. Failure in these materials is determined by the presence of statistically distributed defects; the probability of a defect large enough to cause failure depends on the volume of the material [6]. Early studies handled this problem with semi-empirical models, aimed at predicting the decrease in failure properties at specimen or component level, with criteria such as the point stress or the average stress in a region [7]. These criteria remain useful due to their ease of application, and are still been extended to recently developed composites [8,9,10] or used to check the accuracy of newly developed numerical methods [11]. Later studies [3,12,13,14] have focused on the damage and failure mechanisms with full-field measurements, often using the mixed experimental–numerical approach. In a unique approach, Anzelotti et al. used DIC and FEM to perform a stress analysis in a twill fabric composite under open-hole tension [15]. However, most studies have focused on unidirectional fiber composites. To the best of the authors’ knowledge, there has not been research on using the capabilities of direct image correlation to systematically study size effect in widely used heterogeneous composite materials such as woven fabric composites.
Another application of full-field strain measurements is the determination of parameters for material models, once again using mixed experimental-numerical methods [9,16,17,18,19]. These methods are usually a variant of the so-called Finite Element Model-Updating schemes. A Finite Element Model (FEM) is iteratively solved, and the resulting strains in output are compared to the experimental ones in an objective function, appropriately formulated to evaluate the discrepancy in the specific problem. At every step, an optimization algorithm updates the model with the values of the material parameters to be identified, attempting to minimize the objective function. When a pre-determined convergence criterion is reached, the resulting optimized parameters are retained [16]. This approach has already been used by [20] at a theoretical proof-of-concept level to identify material properties of microscale composite constituents.
The objectives of the present work are two-fold. First, to develop a FEMU method capable of preserving the mesoscale material heterogeneity captured by DIC measurements. Second, to use this method to extend the understanding of size effect in heterogeneous fiber-reinforced composites from macroscale to mesoscale. This work, therefore, proposes a study of the hole size effect at local level, with full-field knowledge of the stress in the material obtained from the DIC-determined strain field. An innovative integrated experimental-numerical approach is developed, making use of image processing tools and DIC from modeling to validation. The central concept is the use of an FEM simulation that provides a faithful representation of the stress fields in the tested specimen while remaining computationally manageable. A 2D shell model is built, taking into account the information on the local changes of material direction obtained from the DIC data and image processing. The properties are determined with data-driven optimization, minimizing the difference between the DIC-measured and FEM strain fields. Thereafter, the calibrated model is used to analyze the stress concentration and localization induced by circular notches with increasing diameter, revealing two counteracting effects related to the size effect. Even though the volume subjected to stress intensification increases with the notch diameter, an increase in the carbon fiber tow strength following that in the stress localization has been observed, partially compensating for the stress intensification induced by the notch.
The structure of this article is as follows. Section 2 contains a detailed description of the material tested, the mechanical tests performed, the construction of the numerical model with the aid of image processing, the finite element analysis, the data-driven parameter identification, and the methods used to study the size effect. The results of the experimental tests, numerical modeling, and parameter and size effect studies are reported in Section 3. Finally, Section 4 contains a discussion of the strengths and weaknesses of the model construction process and the model itself, and concludes with the findings on the size effect in circular notches.

2. Materials and Methods

2.1. Material and Mechanical Testing

The material system studied is a carbon fiber-reinforced epoxy prepreg from Microtex Composite (GG630 T125 12K, 37% resin). The matrix is an E3-150 resin, reinforced with a 2 × 2 twill carbon fiber fabric. A laminate with a [0/90/0] stacking sequence was manufactured by hand layup and autoclave curing, with an average thickness of 2 mm. Rectangular specimens measuring 250 (l) by 24 (w) mm were cut from the manufactured plate using a CNC machine, and holes were drilled into them. Three different values of hole diameter D were considered: 2, 4, and 8 mm. The central 4-mm diameter was selected to have a width-to-diameter ratio of 6, the value prescribed by open-hole tensile strength testing standard ASTM D5766 [21]. The other two were derived from the first with a factor of 2, picked to remain at a scale where considering the mesoscale analysis undertaken is most meaningful. An overview of the specimen dimensions and nomenclature is given in Table 1.
Tensile tests were conducted with an Instron 8001 hydraulic universal testing machine with a procedure adapted from the ASTM D3039 standard [22], at a quasi-static displacement rate of 2 mm/min. At least three specimens for each configuration were tested and mean values were considered. The free span of the specimen between the grips measured 145 mm. All tests were recorded with an 8.9 MP stereo camera system, imaging the entire specimen. In order to perform DIC, the specimens were airbrushed with a black-on-white speckle pattern (Figure 1b). Before painting, pictures of the bare specimens on the test fixture were taken (Figure 1a), to be used later to build the FEM model. The speckle images were processed using Correlated Solution’s VIC 3D 9.1.6 DIC software, selecting an optimal subset size of 31 px and a step between the subsets of 6 px, which is less than 1/3 of the subset size in accordance with [23]. The load was measured with a 100 kN load cell, while DIC was used to monitor displacement and strains on the specimen surface.

2.2. Numerical Model

A simplified mesoscale numerical model was developed, which accounts for the heterogeneity of the material under study to correctly predict the strain and stress localization. The complex strain distribution observed in woven composites originates from the orthotropic fiber bundles (tows) interlocking in perpendicular directions. This structure, which needs to be described in the model, is visible as it appears on the surface of the specimen in Figure 2a and schematically in Figure 2b.
Composite laminates are often modeled in a simplified form using 2D shell elements. In the model developed, the mesoscale-level heterogeneity has been described by locally changing material directions—or, in other words, dividing the component into two orthotropic materials with identical properties and orthogonal orientations. The 3D woven structure was replaced by two layers with opposite distributions of material, as depicted in Figure 2c. These were implemented as two layers of integration points in a single shell, thus allowing a sizeable reduction in computational effort when compared to more standard multiscale approaches. Properties of the constituent material, while not identifiable through classic mechanical testing, were obtained by minimizing the discrepancy between the experimental and numerical full-field strain.
The finite element solver used was LS-Dyna. The two-material model was built using scripts in MATLAB and Python, and the open-source software GMESH v.4.8.4. The process is summarized in Figure 3.
At first, a map of the vertical and horizontal fiber tows on the outer face of the specimen was built via a MATLAB script by processing the image of the specimen surface taken immediately before the test. The coordinates of every point on the specimen surface were determined with calibration of the stereoscopic DIC. Figure 3a shows a detail of the specimen, while Figure 3b–f illustrates the process developed to build its material map. Thanks to their differences in terms of reflectivity, in the grayscale images, the tows of fibers emerging to the surface appear brighter when oriented along the vertical direction than along the horizontal direction. Using a K-means clustering algorithm operating on the grey level of the image, defined with integer values between 0 (white) and 255 (black), the tows were identified. The most straightforward method was found to divide the image into three clusters, and to flatten the two least numerous into one, giving good tow identification. Smaller, unrelated clusters were filtered out to remove noise. The centroids of the main clusters were assumed to be the centers of the fiber tows, with their coordinates defined with DIC. The map was first built by fitting a geometrically exact grid to these points using optimization to determine its x-y spacing and the in-plane rotation angle. In the next step, the full map of the two material orientations was constructed building rectangles around the tow centers, with dimensions obtained from the optimized grid spacing.
The structured FEM mesh (Figure 3f) was finally generated from parametrized geometry in GMESH. It is composed of a single layer of four-node Belythscko-Tsay shell elements. Six through-thickness integration points were used to represent the three composite layers, and the material was specified per every integration point. Each of the three plies in the real composite was modeled via two through-thickness integration points in the shells, with alternating materials, representing the interwoven tows of fibers in a simplified fashion. A mesh convergence study was conducted to identify the appropriate mesh size. The unnotched specimens were simulated with a mesh size of 0.5 mm to have 10 × 20 elements for each tow of the woven texture. In open hole specimens, the mesh refinement in correspondence with the hole was considered, with a minimum mesh size of 0.05 mm.
An orthotropic linear elastic material model, *MAT_54 in LS-Dyna, was used. A Python script was used to apply the appropriate material direction to every integration point according to the map previously described. The material properties of the modeled tows were identified with an optimization process minimizing the difference between the numerical and DIC surface strain maps at a given applied load. More details about the material properties identification are given in the following section.

2.3. Data-Driven Calibration of Material Properties

The methodology introduced exploits the huge amount of data coming from the full-field displacement measurements to calibrate a simplified mesoscale shell model of the woven composite. The data-driven calibration was carried out in two distinct stages: one for the elastic and one for the failure material properties.

2.3.1. Optimization of the Elastic Properties

The elastic material properties of the tows were determined by performing a tensile test on an unnotched specimen. Figure 4 shows a schema of the optimization algorithm used to determine the properties of the elastic material model.
The algorithm is based on a surrogate optimization solver from MATLAB global optimization toolbox, which was chosen for its ability to converge to a global minimum [24]. The objective was to identify the material parameters by minimizing the difference between the surface strains measured with DIC and those computed in the uppermost integration points in the FE model. DIC and FEM strains were linearly interpolated over a common grid. The objective function was formulated as:
C = ( ( ε x x F E ε x x D I C R M S ( ε x x D I C ) ) 2 + ( ε y y F E ε y y D I C R M S ( ε y y D I C ) ) 2 + ( ε x y F E ε x y D I C R M S ( ε x y D I C ) ) 2 )
where εxx, εyy, and εxy are transverse, longitudinal, and plane shear strain fields, respectively; the FE and DIC superscripts indicate numerical and experimental/DIC grid-interpolated strain fields; RMS is the root mean square value of the strain field; and ∑ indicates the summation over all the strain field grid points. To obtain better results, it is useful to weigh the strain field differences over their respective experimental RMS values, since strains in the loading direction were an order of magnitude greater than those in the transverse direction. During the optimization stage, the model was loaded imposing the experimental load curve. For the validation and stress concentration study, this was changed to a constant displacement rate, to better duplicate the experimental tests.

2.3.2. Failure Properties

Failure stresses were retrieved from the stresses in the FEM at the frame corresponding to a load equal to the failure load of the unnotched specimen. Following the material model, *MAT_54 of LS-Dyna, failure was modeled with the Hashin criterion, each tow being a unidirectional carbon fiber reinforced composite. Given the specific load case and the separation of materials, several hypotheses were made:
1.
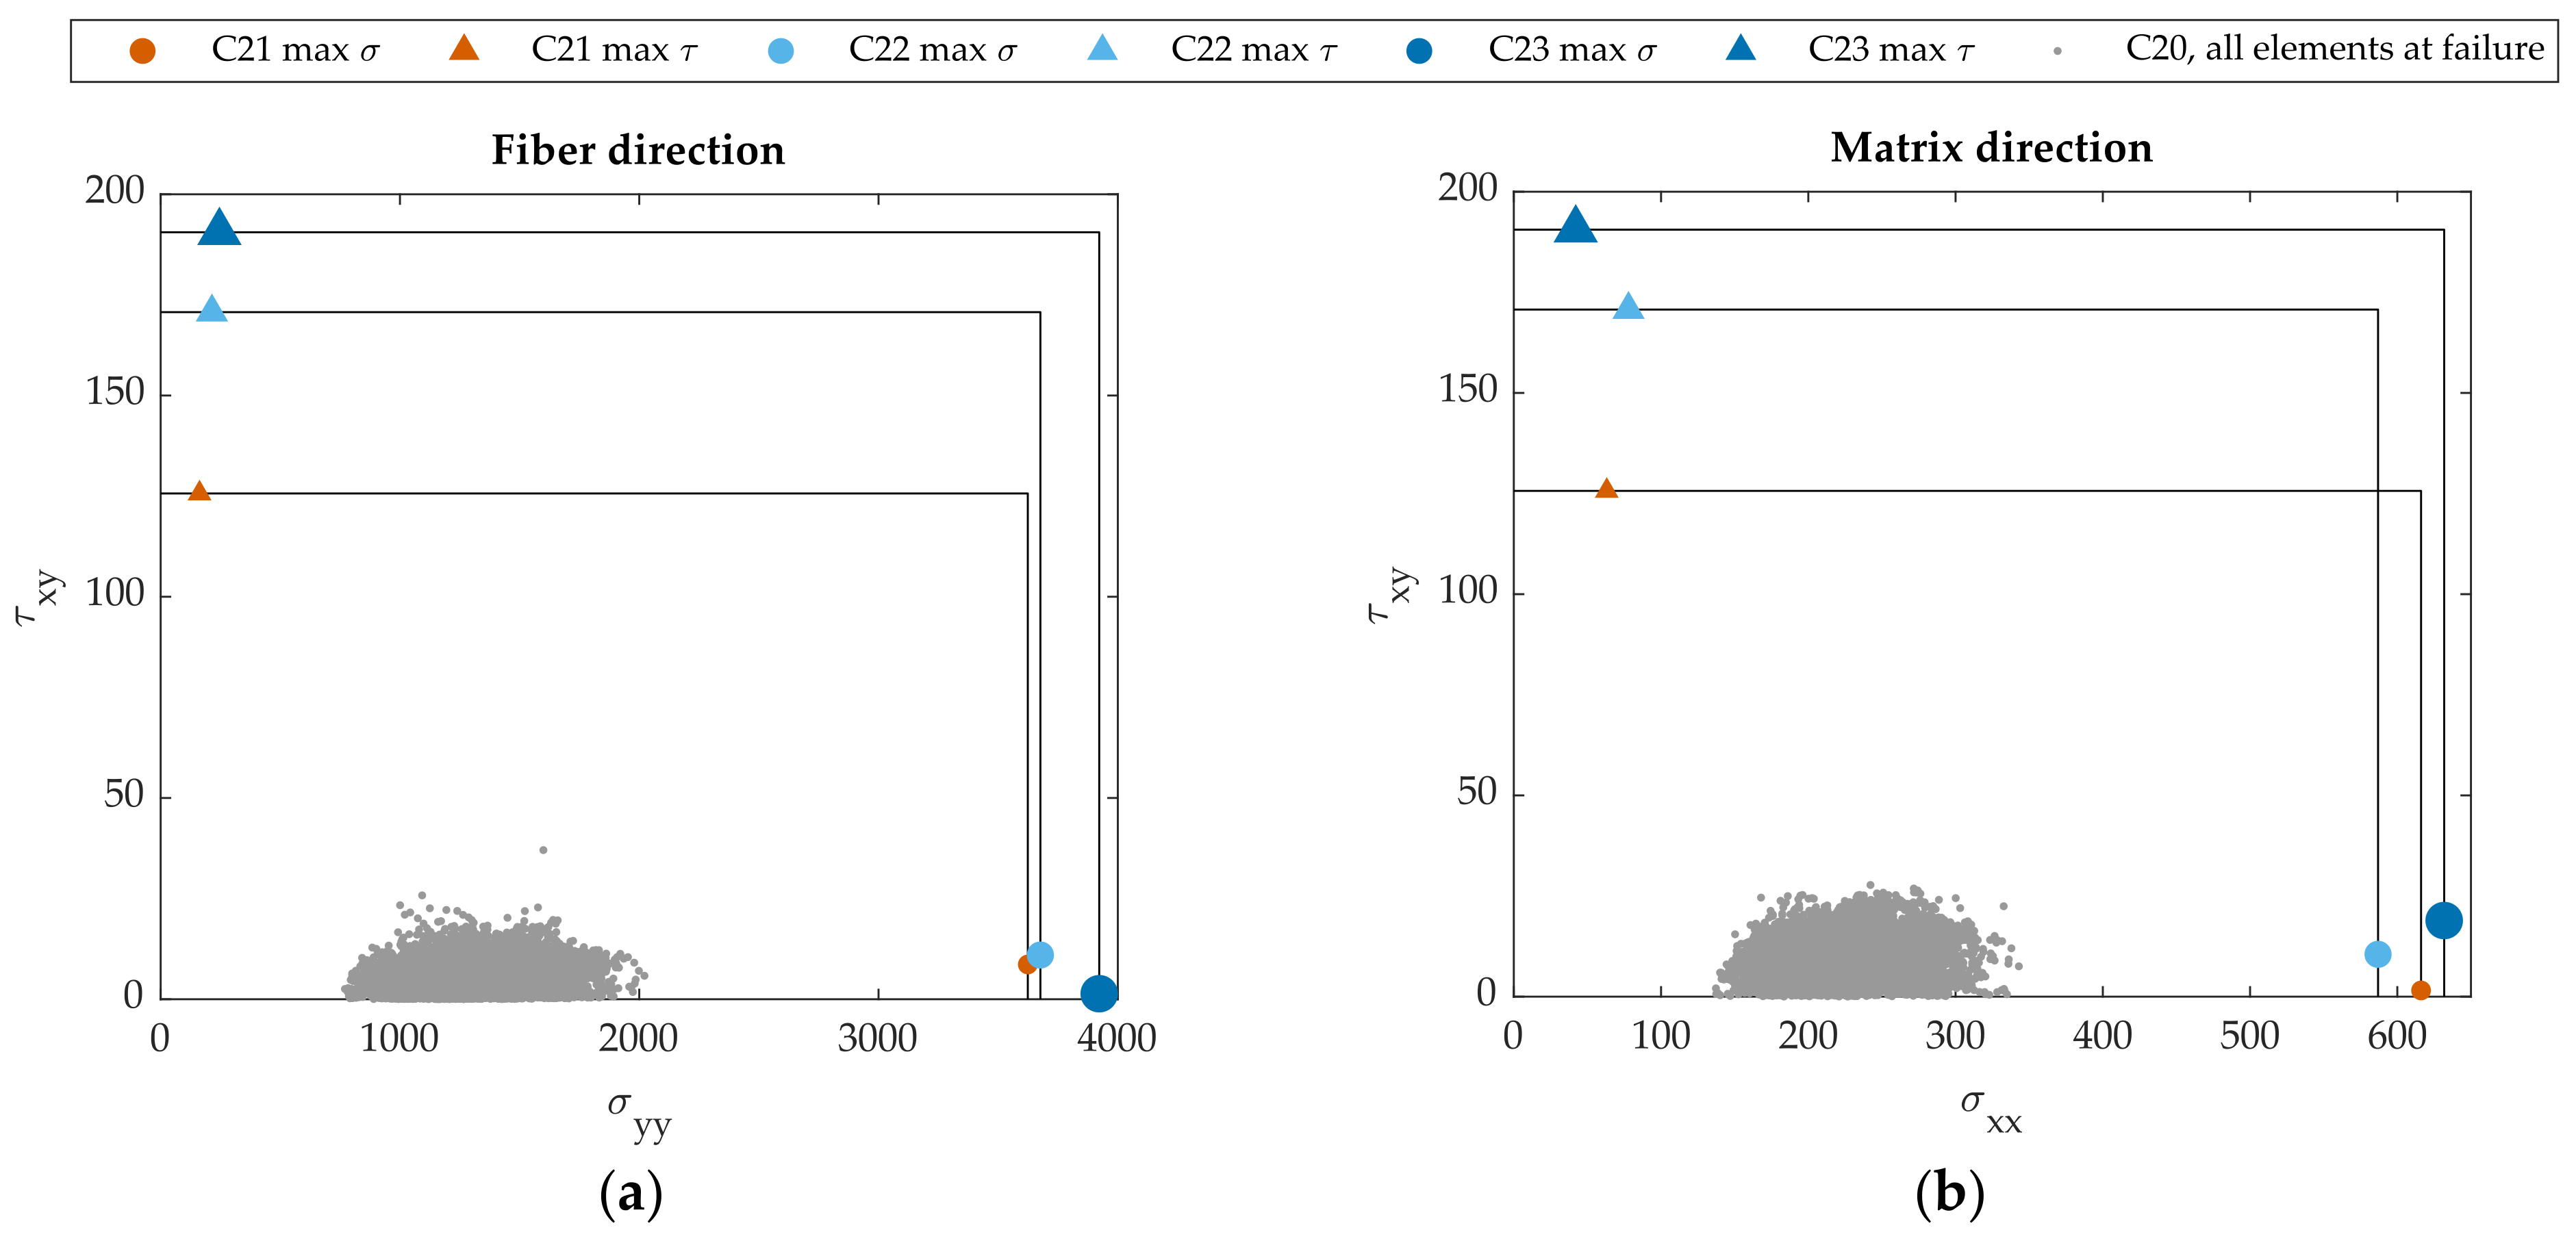
The stresses causing failure are longitudinal stress σ y y and shear stress τ x y ;
2.
In vertical tows (“fiber direction”), failure occurs by fiber breakage. The failure criterion is thus:
e f 2 = ( σ y y S 1 ) 2 1     e f 2 0 failure
where σ y y is the longitudinal stress, S 1 is the longitudinal tensile strength of the material (fiber direction), and e f is the failure index in the fiber direction.
3.
In horizontal tows (“matrix direction”), failure occurs by matrix failure due to tensile stresses combined with shear stresses. The failure criterion is thus:
e m 2 = ( σ y y S 2 ) 2 + ( τ x y S 12 ) 2 1     e m 2 0 failure
where σ y y and τ x y are longitudinal and shear stresses, S 2 is the transverse tensile strength of the material (matrix direction), S 12 is the shear strength, and e m is the failure index in the matrix direction.
Three material strength parameters are thus needed: S 1 , S 2 , and S 12 . They were estimated by observation of the element-by-element, ply-by-ply maximum stress state in the numerical model.
With a similar approach, the stress state of notched specimens was investigated in correspondence with the failure load. The stress concentration, the location of most loaded elements, and the material volume subjected to intensification were recovered through the validated mesoscale FEM. The size effect due to stress intensification and localization was therefore investigated.

3. Results

In this section, the results are presented. Firstly, the experimental test results are reported and then the retrieved material properties, related to the elastic field and the failure, are presented and discussed.

3.1. Experimental Results

Experimental mean curves are shown in Figure 5. In the load-displacement plot (Figure 5a), which uses data from the test machine’s load cell and displacement transducer, the specimens display different stiffnesses and maximum loads. As expected, both stiffness and maximum load are highest for the plain specimen, and decrease following hole size. In the stress-strain plots (Figure 5b), all specimens show a similar tensile modulus, whereas hole size affects the nominal ultimate tensile strength of the specimens. The strain values reported were computed by averaging the DIC surface strain over the entire specimen AOI, while the engineering stress value was computed as the ratio between the applied load and the unnotched section area. All specimens showed mostly linear behavior throughout the test, with some non-linearity arising before the final failure. A brittle failure along a line passing through the hole was observed for all the tested specimens.
Test results for ultimate tensile strength are collected in Table 2. Three specimens were tested per hole size. UTSnom is the nominal tensile strength calculated over the gross (unnotched) section, while UTSnet was obtained considering the reduction in section due to the hole. UTSnom exhibits a monotonic decreasing trend with increasing hole sizes. The specimens with the smallest hole size show the highest UTSnet and low variability; larger hole specimens have lower values but much more significant dispersion in the results. Overall, however, dispersion in the results appears low, with a maximum coefficient of variation of 2.81%.
Figure 6 shows an example of DIC-determined strain fields for a notched specimen. Longitudinal strain is the highest in entity overall. Diagonal high-strain bands corresponding to longitudinal tows are readily observable. Faint high-strain bands in the opposite diagonal direction are the result of the intermediate 90° ply showing through. An interaction between the material distribution and the open hole concentration is visible in the area around the notch. Strain concentration is not symmetrical with respect to the hole. The strain field cannot be adequately described by a homogeneous material model. Transverse strain (Figure 6b) shows the lowest values, as well as few banding and concentration effects. Shear strains (Figure 6c) are also close to null far from the hole, but rise in 45° directions around the hole. The maximum value remains lower than that of longitudinal strain, and the strain field seems less affected by the material distribution.

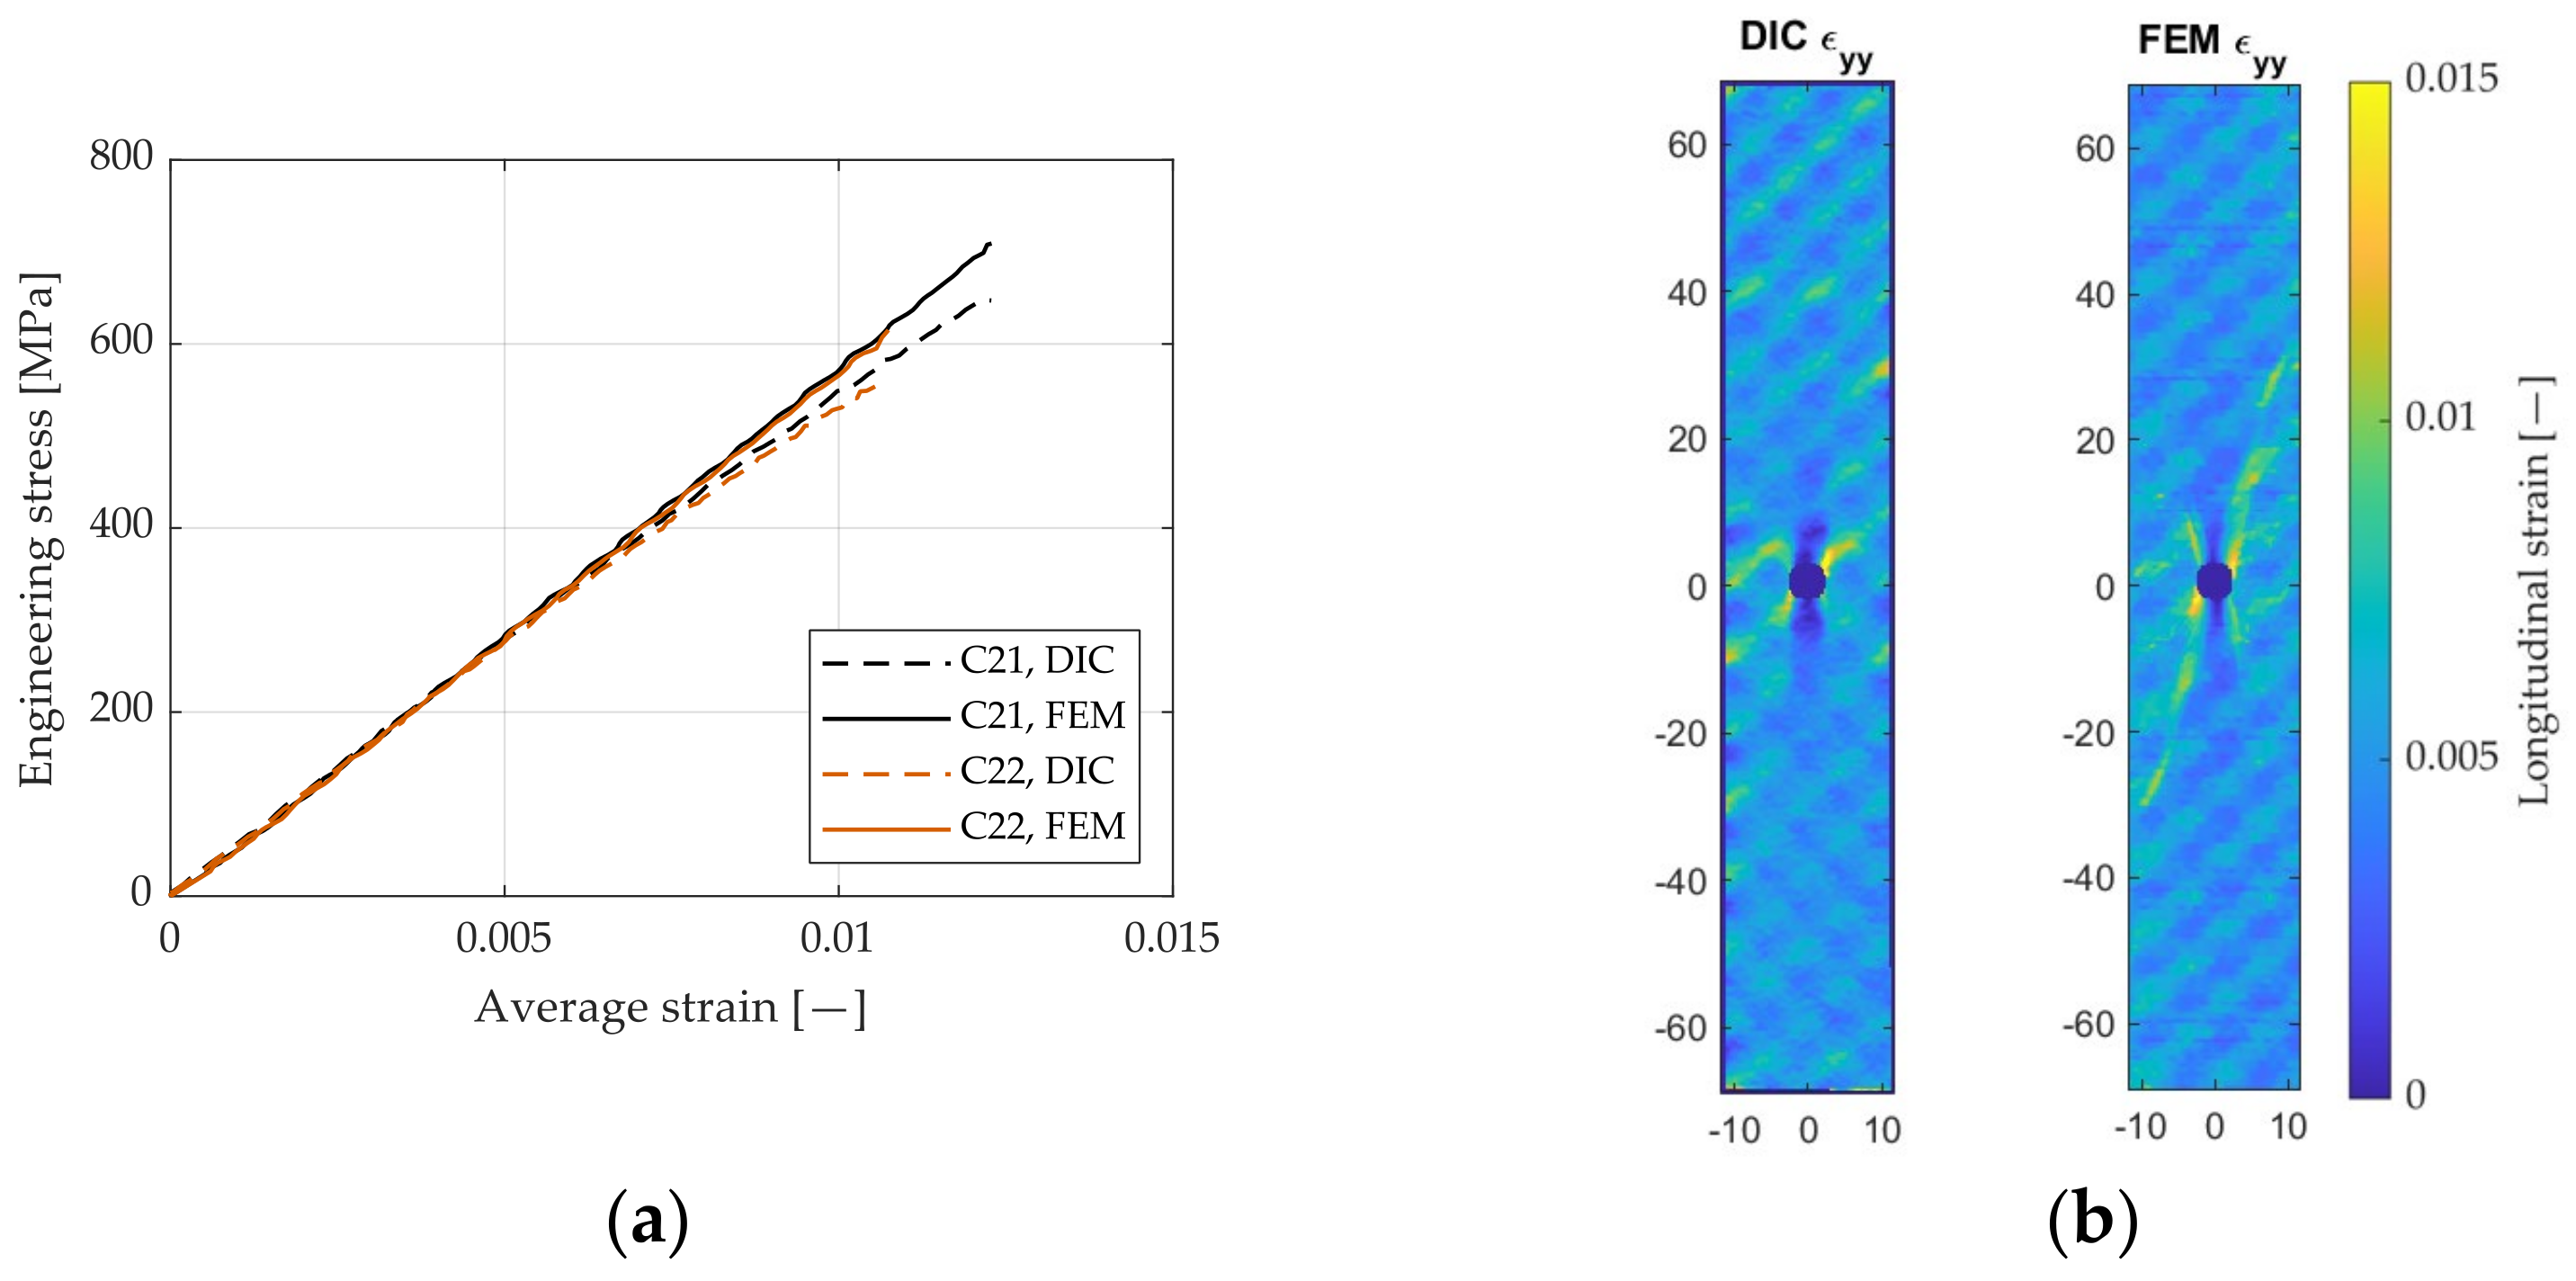
3.2. Elastic Properties

Table 3 shows the elastic properties of the tow identified through the data-driven optimization scheme, running the optimization algorithm for the unnotched specimen.
As the surrogate optimization algorithm makes use of random sampling, its results were not deterministic. It was observed that the optimization converged after 100–150 iterations.
While the transverse elastic modulus is comparable to those typically obtained for unidirectional composite, the longitudinal modulus is slightly lower than typical values. This difference can be ascribed to the finite element model. Bundles sway from the in-plane direction and bend in the through-thickness direction, which results in a local change in the elastic property along the bundle itself, according to the curvature of the bundle. In particular, the elastic properties decrease with the bundle curvature according to the classical laminate theory. This geometrically induced elastic variation is not retained in the finite element model as it is assumed that all the elements of longitudinal tows present the same elastic properties. As such, the elastic properties of longitudinal bundles are lower than those typical of unidirectional carbon fiber composite. On the contrary, the effect of tow curvature does not affect the elastic properties of the transverse bundles and the obtained transverse modulus is in accordance with that typical of unidirectional composite.
To validate the mesoscale model calibrated with the data-driven procedure, the identified properties were used to model a notched specimen in a mesoscale fashion. A constant displacement rate was applied to the specimen and the global stress and strain curves from the tensile tests, and the strain maps were compared with the experimental results. As shown in Figure 7, the FE model well captures the elastic behavior of the tested specimens, thus validating the obtained material properties. This can also be appreciated through the comparison of the strain map in the longitudinal direction reported in Figure 7b. The model is able to capture the strain variation to a good degree due to the material heterogeneity which combines with the strain intensification in the proximity of the circular notch. The diagonal banding effect in the strain field is also well represented, including the opposite direction diagonal banding due to the 90° layer.
Regarding the stress-strain curves, it is also worth observing the slightly nonlinear behavior of the experimental curves in the proximity of the final failure, which results in a slight discrepancy to the finite element model. The FE model indeed did not retain a damage law and assumed for simplicity an elastic behavior until the final failure.

3.3. Failure Properties

Table 4 shows the failure strengths determined for the constituent material according to the methodology described in Section 2.3.2.
Consistent with the hypotheses made in Section 2.3.2, the maximum longitudinal stress was always reached in elements belonging to longitudinal tows, and maximum transverse and shear stresses in horizontal tows.
The volume of material affected by the notch was calculated to estimate the entity of stress intensification. This volume was defined as the sum of the volumes of the portions of material around the integration points, the stress of which at failure load was higher than the remote stress in the specimen. In turn, remote stresses ( σ 1 and σ 2 —subscript referring to the local material direction) were defined as the maximum reached in a region far from the fixture and the stress concentration areas, as wide as the specimen and multiples in height of the characteristic size of the tows. Volumes were separately identified and calculated for vertical and horizontal tows. The values calculated for each specimen are laid out in Table 5, where “Volume 1” and “Volume 2” refer to the volume subjected to the intensification of the stress along the material directions 1 and 2, respectively. The volumes subjected to intensification are also mapped out in Figure 8.
The affected volume scales up with the hole diameter. Interestingly, the interaction of the stress concentration with the non-homogeneous material structure can be also observed. For specimens C21 and C22, with respective hole diameters of 2 and 4 mm, both smaller than the 5-mm tow size, the stress concentration remains localized. On the other hand, in specimen C23, with its 8-mm diameter hole, the notch is not contained within a tow and more than one diagonal row of tows is interrupted.
Entire bundles of vertical fibers passing through the hole are not bearing any load above and under it, which must be transferred by shear stresses to the tows on the left and right of the hole. This more inefficient use of the material leads to a wider distribution of affected volume.
Figure 9 shows the highest stress integration points for all specimens on the σ y y τ x y and σ x x τ x y plane for the three specimens. There is a distinct separation in stress states between the vertical and horizontal tows—with the former bearing the highest fiber-direction tensile stresses, and the latter the highest matrix tensile and shear stresses. It can be noted how, despite an apparent higher ultimate tensile strength, every single element in the unnotched specimen (grey point cloud) is in a much lower stress state.
The circular hole thus leads to two different effects in the stress field:
1.
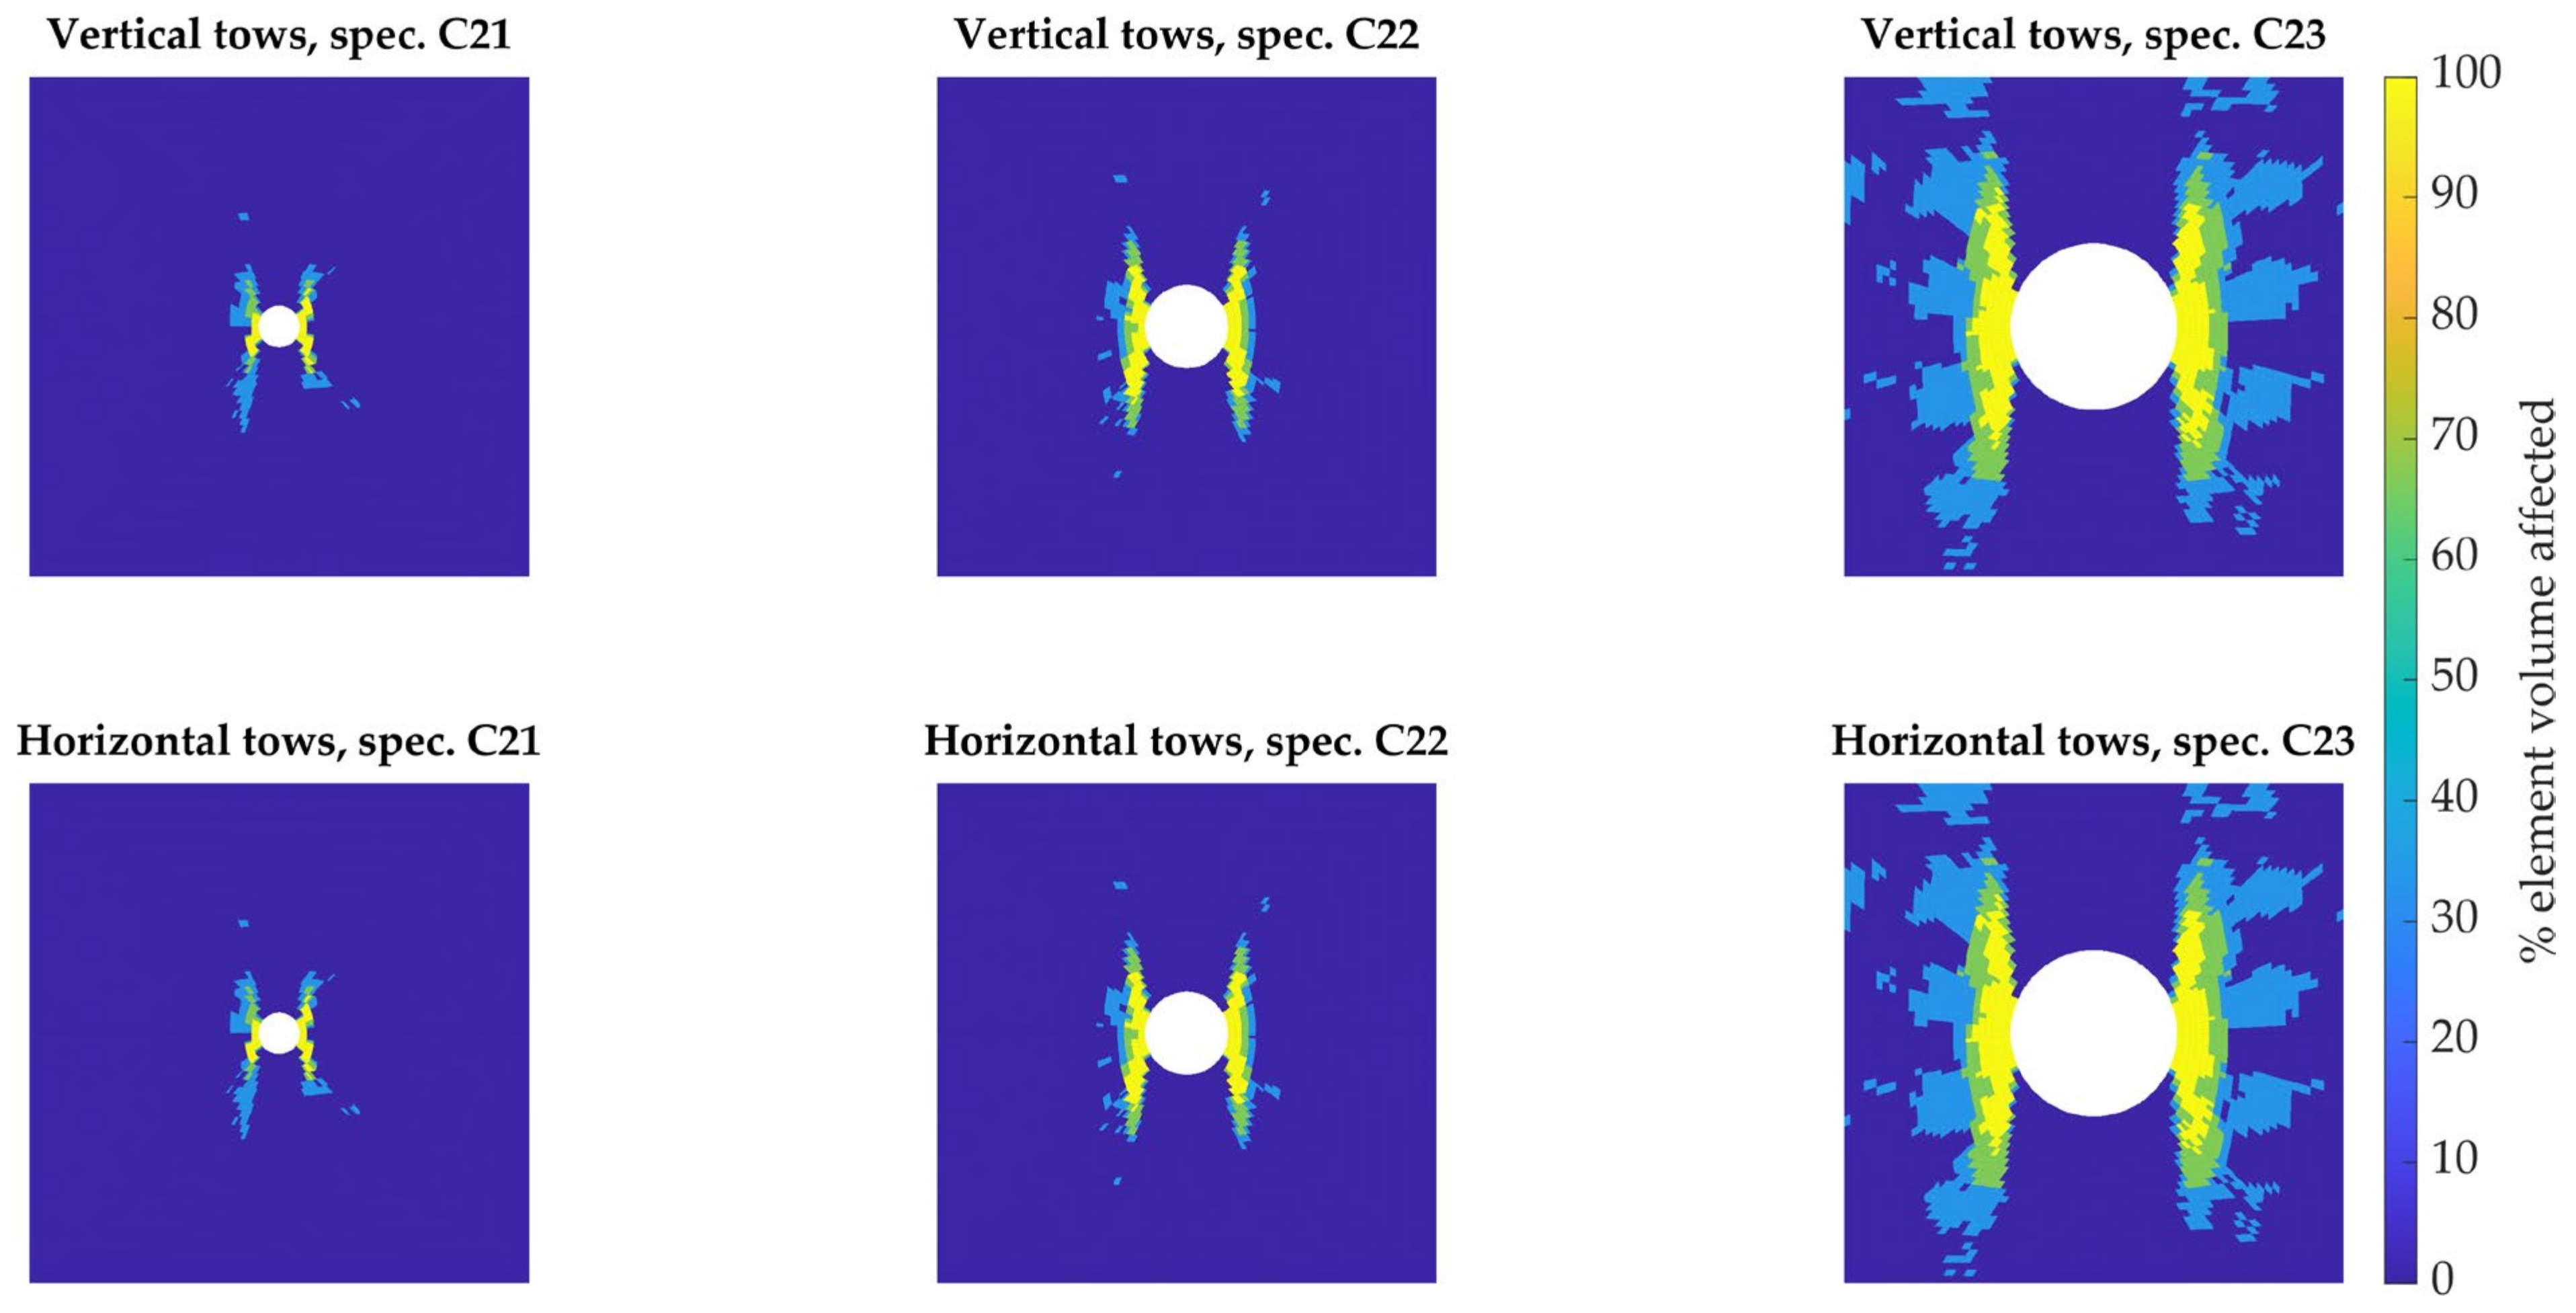
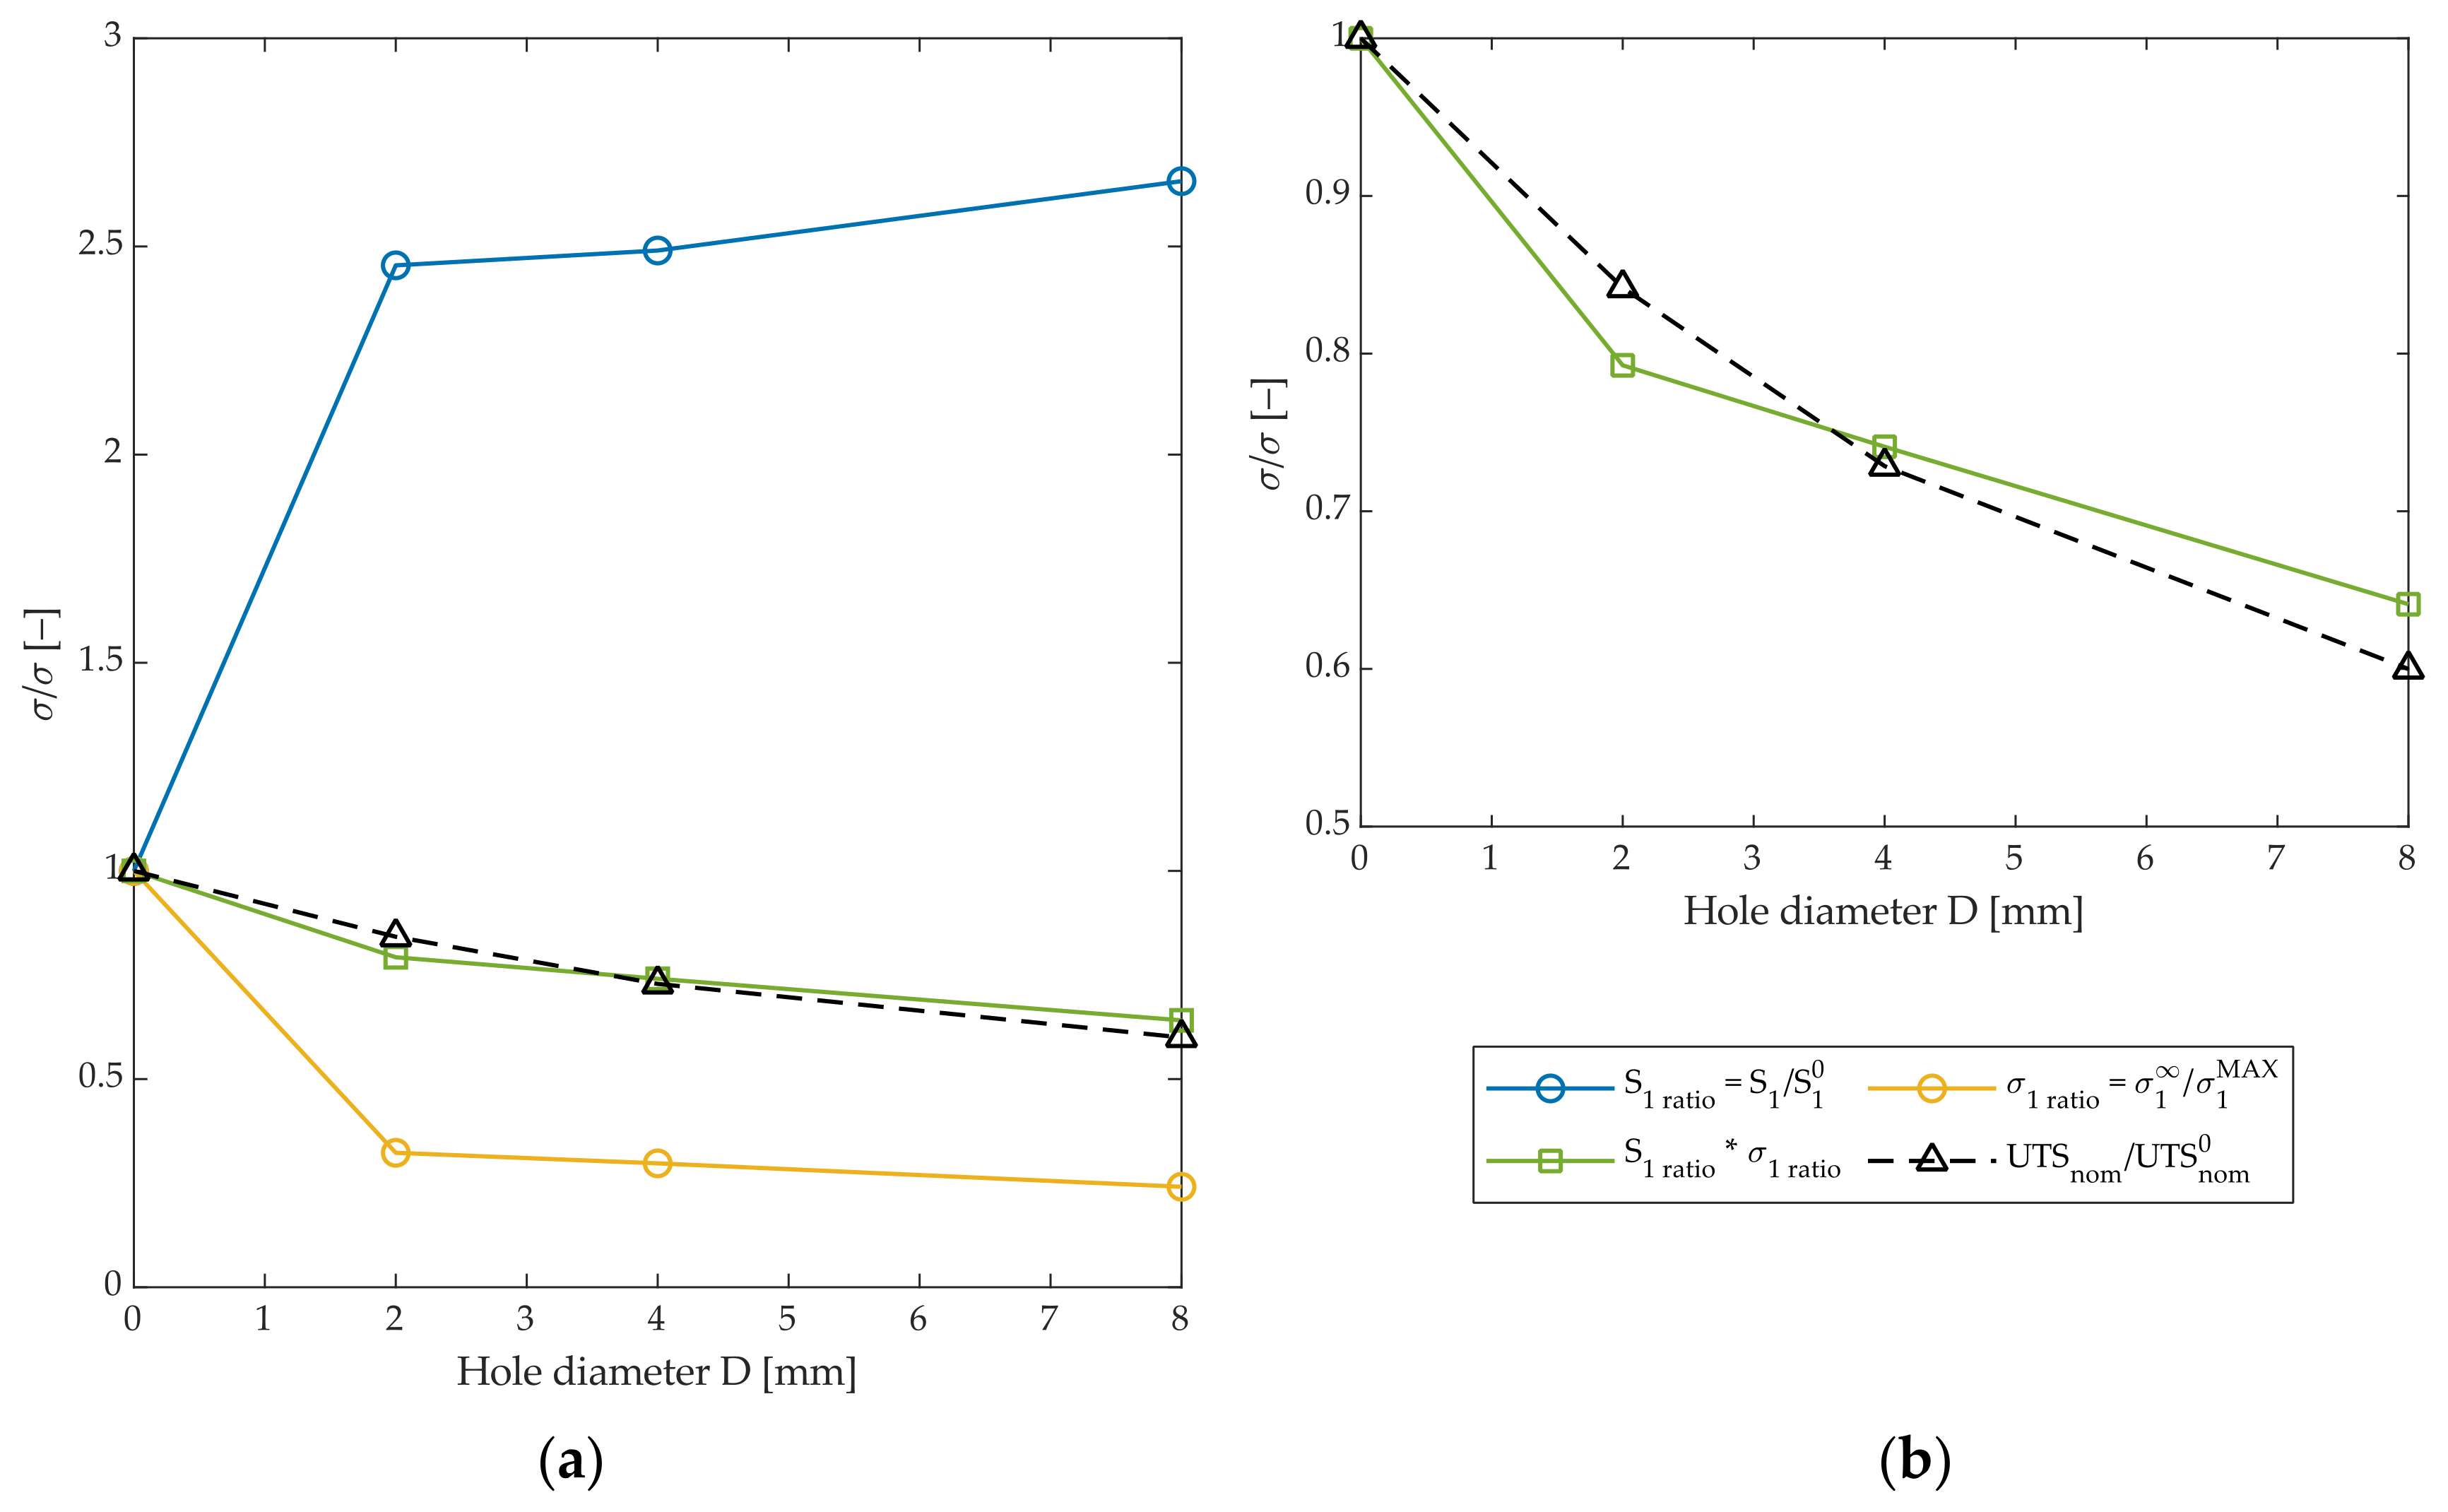
Stress concentration. The affected volume scales up with the hole diameter. This leads to an increased probability of encountering a weak point within the structure that causes premature failure, and, consequently, a decrease in load-bearing capability. Indeed, as observed in Table 3, the nominal strength of the notched specimen, which is the ratio between the maximum force and the nominal notched cross-section, decreases with the hole diameter. This effect can also be quantified by the ratio of the remote longitudinal stress σ 1 —defined earlier—to the maximum longitudinal stress in the entire specimen σ 1 M A X .
2.
Stress localization. Close to the hole, stress sharply rises in a very limited volume. This leads to an observed local increase in material strength. This effect can be described by the ratio between the longitudinal tensile strength of the material in the notched specimens S 1 —determined as per Section 2.3.2—to the same property in the unnotched specimen, indicated as S 1 0 .
The specimen-level tensile behavior results from a superposition of these two effects, one beneficial and the other detrimental. This is highlighted in Figure 10a, where the two effects are plotted as non-dimensional stress ratios for different hole diameters. The yellow curve, σ 1   r a t i o , describes the stress concentration and localization. Increasing hole sizes lead to an intensification of the stress, a larger affected area, and a consequent decrease in the ratio between the remote stress and maximum stress.
On the other hand, looking at the ratio between the notched and unnotched tensile strength of the material S 1   r a t i o (blue curve), a roughly 2.5-fold increase in strength is locally noted in the tow material. In this case, the local strength increases with increasing hole size.
The two effects can be combined by dividing the strength increase by the stress intensification, as represented by the green curve. This curve follows the trend of the reduction in nominal ultimate tensile strength U T S n o m compared to the unnotched value U T S n o m 0 (black dashed line) commonly used in traditional specimen-level assessment of open hole stress concentration. This can be better observed in Figure 10b, where only these two latter curves are plotted. The overlap of these curves can be interpreted as an equivalence between a mesoscale-level and a macroscale-level stress concentration curve.
A decrease in slope in the nominal stress curve is observable with increasing hole diameters, in agreement with traditional semi-empiric models like the point stress and average stress criteria. This change in slope can be now interpreted as a change in the balance between the two effects described above, occurring with size scaling. For increasing hole diameters, the increase in local material strength due to stress localization outweighs the decrease that occurs in parallel due to the larger affected area.

4. Conclusions

In order to study the complex stress field from open hole concentration in a twill composite material, a 2D shell model that describes the material at tow level was developed in this work. The model was found to be effective in representing the complex stress and strain distributions in a woven composite material subject to stress concentration. Thanks to its low computational cost, the model was well-suited to be implemented in parameter optimization and FEMU schemes. An advantage over conventional multiscale methods is that a mesoscale-level stress analysis can be carried out without requiring knowledge of microscale-level material properties. On the contrary, only coupon-level tests need to be performed, fully exploiting the spatial resolution of DIC instead of using smaller-scale tests to obtain a higher level of detail.
A prerequisite for good elastic parameter calibration was found to be a proper separation of the horizontal and vertical tows in the two materials. If this is not achieved, the longitudinal and transverse elastic moduli tend towards an average—the modulus of the homogeneous material. The new approach proposed builds the numerical model from an image of the real specimen, directly captured on the test fixture by the same cameras used for DIC. The spatial correspondence of empirically and numerically determined strain fields is therefore ensured by design, as highlighted in Figure 1. This technique may be handily applied to the numerical study of any problem where considering mesoscale material heterogeneity in woven fiber composites is necessary, such as to analyze the effect of ply shift on open-hole stress concentration.
A curve analogous to the reduction in nominal tensile strength was determined from the tow-level stresses (Figure 10b). The reduction was interpreted as the combination of two mesoscale-level effects: stress concentration, which increases stress in a volume of material with dimensions comparable to the characteristic size of the notch, and stress localization, which dramatically increases the stress in a small volume of material close to the hole. Due to the size effect, the consequences of these two phenomena on material strength are diametrically opposed. The larger affected volume decreases material strength, which can be interpreted as the result of an increased probability of encountering a pre-existing defect in the material large enough to cause failure at the local stress level. On the other hand, stress localization radically increases stress in a very small volume close to the notch, leading to an improvement in local material strength, which favorably scales with hole size.
The combination of these two effects results in a macroscale-level behavior, which is consistent with traditional semi-empiric models like the point stress criterion. The change in slope of the nominal tensile strength versus notch size curve was interpreted as a result of different scaling effects on the detrimental stress concentration and beneficial strain localization effects, with the latter effect being amplified for increasing hole diameters.

Author Contributions

Conceptualization, A.F.; methodology, A.F., C.B.N. and A.C.; investigation, A.F. and R.C.; writing—original draft preparation, A.F.; writing—review and editing, A.F., C.B.N., A.C., D.S.P. and G.B.; supervision, D.S.P. and G.B. All authors have read and agreed to the published version of the manuscript.

Funding

This research received no external funding.

Institutional Review Board Statement

Not applicable.

Informed Consent Statement

Not applicable.

Data Availability Statement

The data presented in this study are available on request from the corresponding author.

Conflicts of Interest

The authors declare no conflict of interest.

References

  1. Hild, F.; Roux, S. Digital Image Correlation: From Displacement Measurement to Identification of Elastic Properties—A Review. Strain 2006, 42, 69–80. [Google Scholar] [CrossRef] [Green Version]
  2. Lanza Di Scalea, F.; Hong, S.S.; Cloud, G.L. Whole-Field Strain Measurement in a Pin-Loaded Plate by Electronic Speckle Pattern Interferometry and the Finite Element Method. Exp. Mech. 1998, 38, 55–60. [Google Scholar] [CrossRef]
  3. Pierron, F.; Green, B.G.; Wisnom, M.R. Full-Field Assessment of the Damage Process of Laminated Composite Open-Hole Tensile Specimens. Part I: Methodology. Compos. Part A Appl. Sci. Manuf. 2007, 38, 2307–2320. [Google Scholar] [CrossRef]
  4. Caminero, M.A.; Lopez-Pedrosa, M.; Pinna, C.; Soutis, C. Damage Monitoring and Analysis of Composite Laminates with an Open Hole and Adhesively Bonded Repairs Using Digital Image Correlation. Compos. B Eng. 2013, 53, 76–91. [Google Scholar] [CrossRef]
  5. Bazant, Z.P. Size Effect on Structural Strength: A Review. Arch. Appl. Mech. 1999, 69, 703–705. [Google Scholar]
  6. Pagnoncelli, A.P.; Tridello, A.; Paolino, D.S. Modelling Size Effects for Static Strength of Brittle Materials. Mater. Des. 2020, 195, 109052. [Google Scholar] [CrossRef]
  7. Awerbuch, J.; Madhukar, M.S. Notched Strength of Composite Laminates: Predictions and Experiments—A Review. J. Reinf. Plast. Compos. 1985, 4, 3–159. [Google Scholar] [CrossRef]
  8. Batista, A.; Tinô, S.; Fontes, R.; Nóbrega, S.; Aquino, E. Analytical, Experimental and Finite Element Analysis of the Width/Diameter Hole Ratio Effect in Vinylester/Carbon Hybrid Twill Weave Composites. Compos. Part C Open Access 2020, 2, 100033. [Google Scholar] [CrossRef]
  9. Tinô, S.R.L.; Fontes, R.S.; De Aquino, E.M.F. Theories of Failure Average Stress Criterion and Point Stress Criterion in Notched Fiber-Reinforced Plastic. J. Compos. Mater. 2014, 48, 2669–2676. [Google Scholar] [CrossRef]
  10. Fontes, R.S.; Bezerra, H.A.D.; De Batista, A.C.M.C.; Tinôa, S.R.L.; De Aquino, E.M.F. Failure Theories and Notch Type Effects on the Mechanical Properties of Jute-Glass Hybrid Composite Laminates. Mater. Res. 2019, 22, e20180269. [Google Scholar] [CrossRef]
  11. Sattar, S.; Pedrazzoli, D.; Zhang, M.; Kravchenko, S.G.; Kravchenko, O.G. Notched Tensile Strength of Long Discontinuous Glass Fiber Reinforced Nylon Composite. Compos. Part A Appl. Sci. Manuf. 2022, 163, 107217. [Google Scholar] [CrossRef]
  12. Ma, Z.; Chen, J.; Yang, Q.; Li, Z.; Su, X. Progressive Fracture Analysis of the Open-Hole Composite Laminates: Experiment and Simulation. Compos. Struct. 2021, 262, 113628. [Google Scholar] [CrossRef]
  13. Hallett, S.R.; Green, B.G.; Jiang, W.G.; Wisnom, M.R. An Experimental and Numerical Investigation into the Damage Mechanisms in Notched Composites. Compos. Part A Appl. Sci. Manuf. 2009, 40, 613–624. [Google Scholar] [CrossRef]
  14. Jočić, E.; Marjanović, M. Progressive Failure Analysis of Open-Hole Composite Laminates Using FLWT-SCB Prediction Model. Int. J. Mech. Sci. 2022, 227, 107407. [Google Scholar] [CrossRef]
  15. Anzelotti, G.; Nicoletto, G.; Riva, E. Mesomechanic Strain Analysis of Twill-Weave Composite Lamina under Unidirectional in-Plane Tension. Compos. Part A Appl. Sci. Manuf. 2008, 39, 1294–1301. [Google Scholar] [CrossRef]
  16. Bruno, L. Mechanical Characterization of Composite Materials by Optical Techniques: A Review. Opt. Lasers Eng. 2018, 104, 192–203. [Google Scholar] [CrossRef]
  17. Réthoré, J.; Muhibullah; Elguedj, T.; Coret, M.; Chaudet, P.; Combescure, A. Robust Identification of Elasto-Plastic Constitutive Law Parameters from Digital Images Using 3D Kinematics. Int. J. Solids. Struct. 2013, 50, 73–85. [Google Scholar] [CrossRef]
  18. Réthoré, J. A Fully Integrated Noise Robust Strategy for the Identification of Constitutive Laws from Digital Images. Int. J. Numer. Methods Eng. 2010, 84, 631–660. [Google Scholar] [CrossRef]
  19. He, T.; Liu, L.; Makeev, A. Uncertainty Analysis in Composite Material Properties Characterization Using Digital Image Correlation and Finite Element Model Updating. Compos. Struct. 2018, 184, 337–351. [Google Scholar] [CrossRef]
  20. Ogierman, W.; Kokot, G. Analysis of Strain Field Heterogeneity at the Microstructure Level and Inverse Identification of Composite Constituents by Means of Digital Image Correlation. Materials 2020, 13, 287. [Google Scholar] [CrossRef] [Green Version]
  21. ASTM D5766/D5766M-11(2018); Standard Test Method for Open-Hole Tensile Strength of Polymer Matrix Composite Laminates. American Society for Testing and Materials: West Conshohocken, PA, USA, 2011; 8p. [CrossRef]
  22. ASTM D3039/D3039M-17; Standard Test Method for Tensile Properties of Polymer Matrix Composite Materials. American Society for Testing and Materials: West Conshohocken, PA, USA, 2011; 13p. [CrossRef]
  23. Schreier, H.; Orteu, J.J.; Sutton, M.A. Image Correlation for Shape, Motion and Deformation Measurements: Basic Concepts, Theory and Applications; Springer Science & Business Media: New York, NY, USA, 2009; ISBN 9780387787466. [Google Scholar]
  24. Gutmann, H.M. A Radial Basis Function Method for Global Optimization. J. Glob. Optim. 2001, 19, 201–227. [Google Scholar] [CrossRef]
Figure 1. Images of one of the notched specimens (C22) on the test fixture, captured with one of the cameras used for DIC: (a) reference image used to build the model; (b) speckle image taken during testing. The DIC area-of-interest is overlayed on both images.
Applsci 13 04300 g001
Figure 2. Progressive abstraction of the 2 × 2 twill weave unit cell: (a) imaging of the specimen during testing; (b) schematic representation, highlighting the vertical (warp) and horizontal (weft) fiber directions; (c) simplified model, with two materials to represent the two orientations and two layers to represent the weave. Global (in black) and local (in orange) material directions are shown. The tensile loading direction is y ; 1 is the “fiber direction”, 2 is the “matrix direction”.
Applsci 13 04300 g002
Figure 3. Stages in the process of building the specimen material map: (a) raw .tiff image captured with DIC cameras, (b) after K-means clustering and filtering, (c) centroid of the tows calculated from the clusters overlaid on the initial image, (d) fitting through optimization of a geometric grid (red circles) to the centroids (blue dots), (e) selection of the vertical tow area, (f) material orientation map used to prepare the FEM model via a Python script.
Applsci 13 04300 g003
Figure 4. Flowchart of the optimization algorithm.
Applsci 13 04300 g004
Figure 5. (a) Load-displacement plot for the four types of specimens. (b) Surface average stress and strains of the tested specimen. Engineering stress value is computed using the gross section of the specimen, and strain value is the average over the whole DIC area of interest. Refer to Table 1 for an explanation of the labels.
Applsci 13 04300 g005
Figure 6. DIC-determined strain fields: (a) longitudinal strain; (b) transverse strain; (c) shear strain.
Applsci 13 04300 g006
Figure 7. (a) Comparison between experimentally and numerically determined stress and strain curves; (b) Example of a comparison between experimentally (left) and numerically determined longitudinal strain maps for Specimen C22.
Applsci 13 04300 g007
Figure 8. Maps showing the percentage of the volume of material per element in the two orientations, the longitudinal stress of which surpasses the remote one, in the proximity of the hole. Remote stress was calculated as the maximum stress in a portion of the specimen away from the stress concentration.
Applsci 13 04300 g008
Figure 9. Plots of the stress state values at the most heavily loaded elements at failure on (a) the σ y y - τ x y plane (fiber direction in the material); (b) the σ x x - τ x y plane (matrix direction in the material). The grey cloud contains all stress states of the elements in the plain specimen at failure.
Applsci 13 04300 g009
Figure 10. The two effects on stress ratios for increasing hole diameters. (a) Curves are the local tensile strength S 1 versus unnotched strength S 1 0 , remote stress versus maximum stress, their superposed effect, and the macro-level trend of ultimate nominal tensile stress; (b) close-up of the last two curves.
Applsci 13 04300 g010
Table 1. Specimen dimensions.
Specimenl [mm]w [mm]D [mm]
C2025024Unnotched
C21250242
C22250244
C23250248
Table 2. Average failure data for three repetitions of the tensile test.
SpecimenUTSnom [MPa]UTSnet [MPa]
MeanSt. Dev.CoV%MeanSt. Dev.CoV%
C2073216.72.28
C216463.00.467043.20.45
C2254314.42.6565217.42.67
C2344512.52.8166818.82.81
Table 3. Average material properties from three successive optimization runs. These values were used in the remainder of the study.
Property E 1 [GPa] E 2 [GPa] G 12 [GPa] υ 12
Mean102.38815.5191.8910.050
St. dev.2.5040.9050.0930.001
CoV%2.455.834.931.15
Table 4. Failure properties.
Specimen S 1 [MPa] S 2 [MPa] S 12 [MPa]
C202131370117
C213623616125
C223676586170
C233922631190
Table 5. Volumes affected by the stress concentration in vertical tows (Volume 1), in horizontal tows (Volume 2), and in the whole specimen.
SpecimenVolume 1 [mm3]Volume 2 [mm3]Total Volume [mm3]
C215.654.339.99
C2215.518.9924.50
C2382.6160.96143.57
Disclaimer/Publisher’s Note: The statements, opinions and data contained in all publications are solely those of the individual author(s) and contributor(s) and not of MDPI and/or the editor(s). MDPI and/or the editor(s) disclaim responsibility for any injury to people or property resulting from any ideas, methods, instructions or products referred to in the content.

