Article

An Improved LSTM-Based Failure Classification Model for Financial Companies Using Natural Language Processing

Computer Science, Hanyang University, Seoul 04763, Republic of Korea
*
Author to whom correspondence should be addressed.
Appl. Sci. 2023, 13(13), 7884; https://doi.org/10.3390/app13137884
Submission received: 7 June 2023 / Revised: 29 June 2023 / Accepted: 3 July 2023 / Published: 5 July 2023

Abstract

:
The Korean e-commerce market represents a large percentage of the global retail distribution market, a market that continues to grow each year, and online payments are rapidly becoming a mainstream payment method. As e-commerce becomes more active, many companies that support electronic payments are increasing the number of franchisees. Electronic payments have become an indispensable part of people’s lives. However, the types of statistical information on the results of electronic payment transactions are not consistent across companies, and it is difficult to automatically determine the error status of a transaction if no one directly confirms the error messages generated during payment. To address these issues, we propose an optimized LSTM model. In this study, we classify the error content in statistical information based on natural language processing to determine the error status of the current failed transaction. We collected 11,865 response messages from various vendors and financial companies and labelled them with an LSTM classifier model to create a dataset. We then trained this dataset with simple RNN, LSTM, and GRU models and compared their performance. The results show that the optimized LSTM model with the attention layer added to the dropout layer and the bidirectional recursive layer achieves an accuracy of about 92% or more. When the model is applied to e-commerce services, any error in the transaction status of the system can be automatically detected by the model.

1. Introduction

Korea is one of the countries in the world with a large share of the e-commerce market. E-commerce is a familiar and common consumption pattern, with online shopping transactions accounting for more than 26% of total retail sales. In addition, the coronavirus outbreak in recent years has accelerated the expansion of the e-commerce market. According to a report published by the United Nations Conference on Trade and Development, South Korea had the largest share of e-commerce among the seven countries surveyed, growing by about 5% during the COVID-19 pandemic [1]. As the e-commerce market has grown, so has the number of companies supporting electronic payment services. When a product is ordered and paid for online, a payment message is generated whether the payment is successful or not; however, the format and type of these messages are inconsistent. As a result, it is difficult for e-commerce companies to automatically detect the cause of payment failure or the type of failure that occurred through system information unless someone checks it each time. As artificial intelligence (AI) technology continues to evolve, the dominant approach today is to detect payment information through intelligent methods. AI technology can automatically process and analyse large amounts of payment information and make decisions quickly, providing greater efficiency and accuracy than manually reviewing payment information, and can use big data and machine learning algorithms to detect fraud and anomalous behaviour. This can effectively prevent fraud, reduce payment risk and protect user funds.
Detecting anomalies in payment information is critical to the operations of financial institutions. Traditional approaches to solving this problem require sophisticated monitoring methods and significant manpower. The most commonly used approach today is the [2] log anomaly detection model, which is based on natural language processing techniques. The model uses part-of-speech (PoS) and named entity recognition (NER) techniques to modify the template vector using the weight vector from NER and analysing the PoS attributes of each word in the log template, thus reducing the cost of manual tagging and helping to better assign weights. Template words tagged with PoS attributes have different importance for anomaly detection. Template words with high importance in the template PoS attributes are found by NER, while template words identified as important by NER are assigned higher weights. Then, the initial template vector is multiplied by this weight vector to generate a composite template vector and fed into the DNN model to obtain the final anomaly detection results. However, this model is computationally expensive, and the log data is usually unstructured and may contain different text formats and noise, so the selection of appropriate clustering algorithms and models requires iterative experimentation and tuning. For example, if log data contains unstructured textual information and structured information such as timestamps and user IDs, a clustering algorithm must be selected that is applicable to the mixed data types. However, in practical applications, there is no universal clustering algorithm that can be adapted to all cases, so it may be necessary to try several algorithms to determine the best choice. Therefore, operations such as text cleaning, word separation, and normalization in the preprocessing stage require complex rules and algorithms to handle log data of different types and formats.
To solve the problem that different data types require different detection methods, a natural language processing-based LSTM model is proposed to detect the payment status, and an optimized LSTM model is designed to determine the current error state of the transaction information and evaluate its performance. The model can help system administrators, software developers, and cybersecurity experts to quickly detect and resolve abnormal events in payments, reduce the workload and time cost of manual processing, and improve system reliability and security. Furthermore, compared with some deep learning models, the results of LSTM models are easier to interpret and understand, and the decision process of the model can be understood by looking at its intermediate states and weights. However, it still needs to be used with caution to ensure data privacy and security, and proper monitoring and auditing to reduce false positives and protect users’ rights.
In Section 2, we present related work and illustrate the advantages and disadvantages of the aforementioned model; in Section 3, we describe the data collection, data labelling, and model implementation process in detail; in Section 4, we evaluate the experimental results and verify the utility and accuracy of the model; finally, in Section 5, we summarize the main ideas of the optimized LSTM and discuss the advantages and disadvantages of the approach, the application areas, and future research directions.

2. Related Works

The underlying models chosen for this study are SRN (simple recurrent network) [3], LSTM (long short-term memory) [4], and GRU (gate recurrent unit) [5]. The SRN proposed by Elman is an recurrent neural network (RNN) with three layers, only one of which is the hidden layer, which may face the problem of gradient disappearance or gradient explosion when dealing with complex long-term dependencies, resulting in degraded model performance. In 1997, Hochreiter et al. proposed LSTM, a special type of RNN, which effectively controls information flow and memory updates through a gating mechanism, overcomes the problem of gradient disappearance and gradient explosion, can better handle long-term dependencies, and has contributed to many breakthroughs in natural language processing, such as anomaly detection [6], text state representation [7], multi-label document classification [8], etc. In 2014, Junyoung Chung et al. proposed GRU, which has a simpler structure and fewer parameters, converges faster, takes less time compared to LSTM, and can speed up the iterative process.
The online payment model of e-commerce has increased the risk of online fraud. Due to the increase in fraud rate, researchers have started to use various machine learning methods to detect and analyse fraud in online transactions. Dornadula et al. proposed a novel fraud detection method [9] for streaming transaction data with the aim of analysing the details of customers’ past transactions and extracting behavioural patterns. Cardholders are clustered into different groups based on the amount of their transactions. The transaction information of cardholders in different groups is then aggregated using a sliding window strategy to extract behavioural patterns for each group separately, using features such as maximum, minimum, and average transaction amounts. The different classifiers are then trained separately to extract the fraud characteristics, and the classifier with the better scores is selected as the best fraud prediction method. However, this method has some drawbacks. In credit card fraud detection, fraudulent transactions are usually very rare, so the dataset usually suffers from category imbalance, i.e., the number of normal transaction samples far exceeds the number of fraudulent transaction samples. This can lead to poor performance of the model in detecting fraudulent transactions. Extracting useful features from the raw transaction data is also a challenge. Proper feature selection and construction is critical to the performance of the model. Improper feature selection can result in the model failing to capture key characteristics of fraudulent transactions.
Mehbodniya et al. used various machine learning and deep learning methods to detect credit card fraud [10], different algorithms such as naive Bayes, logistic regression, K-nearest neighbour (KNN), random forest, and sequential convolutional neural network are used to train other standard and unusual transaction features to detect credit card fraud. All algorithms go through data collection, data preprocessing, data analysis, training with different classifiers separately, and data testing before generating classifiers. In the preprocessing phase, the data are converted into a usable format using a mixture of undersampling (negative class) and oversampling (positive class) techniques. In the training phase, the preprocessed data are fed into the classifier and the test data are evaluated to assess the accuracy of fraud detection, and different models are evaluated based on accuracy and best performance. The results show that KNN performs best. However, the disadvantage of this approach is that the initialization of the weights is very random, which can affect the training process.
Fraud is dynamic and patternless, and therefore not easy to detect. Raghavan et al. tested several machine learning methods [11], such as support vector machines (SVM), and deep learning methods, such as autoencoders, convolutional neural networks (CNN), restricted Boltzmann machines (RBM), and deep belief networks (DBN), using area under the ROC curve (AUC), Mathews correlation coefficient (MCC), and failure cost as evaluation metrics to compare different machine learning and deep learning models on different datasets to detect fraudulent transactions. The study showed that for larger datasets, the best approach to fraud detection is to use SVM and possibly combine it with CNN for a more reliable performance. For smaller datasets, the ensemble approach of SVMs, random forests, and KNNs can provide good improvements. Convolutional neural networks (CNNs) typically outperform other deep learning methods such as autoencoders, RBMs, and DBNs. However, a limitation of this study is that it only dealt with fraud detection in a supervised learning context. Although supervised learning methods such as CNN, KNN, and random forest produce good results, they do not work well in dynamic environments. Fraud patterns tend to change over time and are difficult to detect. New datasets must be collected and machine learning models must be retrained.

3. Design and Implementation

3.1. Data Collection

The data used for this study included responses from five PG companies, 21 banks (including commercial and local banks) and five securities companies that offered payment methods such as card payments, mobile phone payments and bank transfers. The PG data included 620 cases from “NicePay”, 124 from “SettleBank”, 977 from “Fiserve”, 435 from “KSNET”, 1119 from “Toss” and 245 from “Eximbay”, and 8336 cases from 26 banks and securities companies, for a total of 11856 cases used.
To label the data, we used KonNLPy’s OKT (Open Korean Text) morphological analyser to extract nouns, letters, and adjectives only, and used them as keywords to directly label 1000 messages for training. These 1000 labelled messages were used as training data with an LSTM classifier model was built based on the defined labels, and the labelled messages were used to label the rest of the messages. In spite of the above process, there was still unlabelled information; therefore, in order to label this information, the newly labelled information was added to the existing labelled finished information, using the newly labelled information as the learning data and the unlabelled data as the test data re-labelled using the LSTM classifier. This process was repeated, and finally the labelling of 11,865 pieces of information data was completed. The pre-processed information is shown in Figure 1.
These works are based on enterprise perspective considerations to prevent user fraud to reduce enterprise losses, but our proposed model is based on both enterprise and user considerations to detect the specific reasons for classification payment errors to reduce losses for both parties.

3.2. Manually Labelling Data

Since the information collected is primarily used by financial institutions, it tends to have several common categories. In the case of payment errors, they were classified into “user input value error”, “merchant error for PG or financial company”, “franchise store error for PG company”, “source error for financial institution”, “system delay or connection timeout”, and “other” six labels. The distribution of labels is shown in Figure 2.
Using the tokenizer provided by Keras, the refined keywords are tokenized with 785 words and converted to the index of the token using the texts_to_sequences function. Since the integer-encoded input sequence is of variable length, it is converted to a sequence of the same length by padding for matching. The length distribution of the integer-encoded input sequence is shown in Figure 3. The input labels are one-hot-encoded using LabelBinarizer, and the training and validation sets are split 8:2.
By extracting the keywords for each message (keywords are shown in Figure 1), a total of 1000 messages were directly tagged according to the defined tags. Despite the above process, there are still incomplete tagged messages. To label these messages, the newly labelled messages were added to the existing labelled messages as learning data, while the unlabelled data were used as test data and re-labelled using the LSTM classifier. This process was repeated to complete the labelling of 11,856 pieces of information data. The data labelling process is shown in Figure 4.

3.3. Implementation of the Model

3.3.1. Defining the Base Model

Before implementing the model, we first compared and analysed the performance of three models, simple RNN, LSTM, and GRU, all suitable for simple natural language processing.
In this paper, the cyclical learning rate provided by the TensorFlow plugin was used as an optimizer. This approach, introduced in Leslie Smith’s 2015 paper [12], adjusts the learning rate by increasing and decreasing the repetition learning rate. In this case, accuracy may be temporarily reduced, but the overall results will be better [13]. Due to the imbalance between the label distributions, a micro-mean F1-score was used as the scoring function. Out of a total of 11,856 data items, 10,495 messages were finally used after eliminating duplicates, and 3000 of the most frequently used words were marked as used.
The embedding and dense layers were added to simple RNN, LSTM, and GRU. The hidden layer was set to 100, the vocabulary size of the number of keywords to be used was set to 3000, and there were 6 categories of classification, so Dense was set to 6. Since this is a multi-category classification problem, the categorical cross entropy was used as the loss function.
The results of comparing the three models, Simple RNN, LSTM, and GRU, are shown in Figure 5. The learning results using the three models are shown in Table 1. The validation F1-score is 92% and the validation loss is 0.3, the results indicate that the LSTM with the largest number of parameters performs relatively well. Therefore, the LSTM was identified as the base model.

3.3.2. LSTM Model with a Dropout Layer

To avoid overfitting, training was performed after adding a dropout layer [14] to LSTM. As shown in Figure 6, after three epochs, the F1-score and loss of the training set gradually improve, but the validation F1-score does not change, and the validation loss gradually increases, which has been overfitted. After 10 epochs of training, the validation F1-score is 90.76% and the validation loss is 0.4069, and the performance does not improve compared with the basic LSTM model. The model training results are shown in Table 2.

3.3.3. LSTM Model with Dropout and Stacking Recurrent Layers

To improve the performance, the dropout layer and the stacking recurrent layer were added to the basic LSTM model, and the experimental results are shown in Figure 7. The results show that after six epochs, the F1-score and the loss of the learned data gradually improve, but the validation F1-score does not change, and the validation loss gradually increases and has been overfitted. After 10 epochs, the validation F1-score is 90.6% and the validation loss is 0.4053, and the results are shown in Table 3. Despite the addition of another layer, the performance did not improve significantly. It can be confirmed that even the simple use of more parameters does not have much impact on the performance improvement.

3.3.4. LSTM Model with the Dropout and Bidirectional Recurrent Layers

The previous experiments confirmed that simply adding layers had little effect on performance improvement, so the dropout and bidirectional recurrent layers [15], which were considered effective in improving natural language processing performance, were added to the basic LSTM model. As shown in Figure 8, after four epochs, the F1-score and the loss of learned data gradually improved, but again the validation F1-score did not change, and the validation loss gradually increased and overfitted, the results are shown in Figure 7. After 10 epochs, the validation F1-score was 90.9% and the validation loss was 0.4031, the results are shown in Table 4. Although the bidirectional recurrent layer was applied, it did not significantly improve the performance.

3.3.5. LSTM Model with Dropout, Bidirectional Recurrent and Attention Layers

To solve the gradient disappearance problem on the structure as the input sequence becomes longer, the dropout, bidirectional, and attention layers [16], which refer to the input sequence at each output time, were added to the basic LSTM model. As shown in Figure 9, the validation F1-score gradually increased after five epochs. After 10 epochs, the validation F1-score is 91.42% and the validation loss is 0.4072, confirming the performance improvement. The results are shown in Table 5.
To avoid the overfitting caused by this, batch normalization was applied after adding the dropout layer. As shown in Figure 10, after 10 epochs, the validation F1-score is 92.19% and the validation loss is 0.3433, as shown in Table 6, the performance has improved.
The performance was compared in the basic LSTM model by adding the dropout, stacked recurrent, bidirectional recurrent and attention layers. As shown in Table 7, the performance is best when the dropout, bidirectional recurrent and attention layers are added. The final model structure is shown in Figure 11.

4. Performance Evaluation and Discussion

4.1. Performance Evaluation

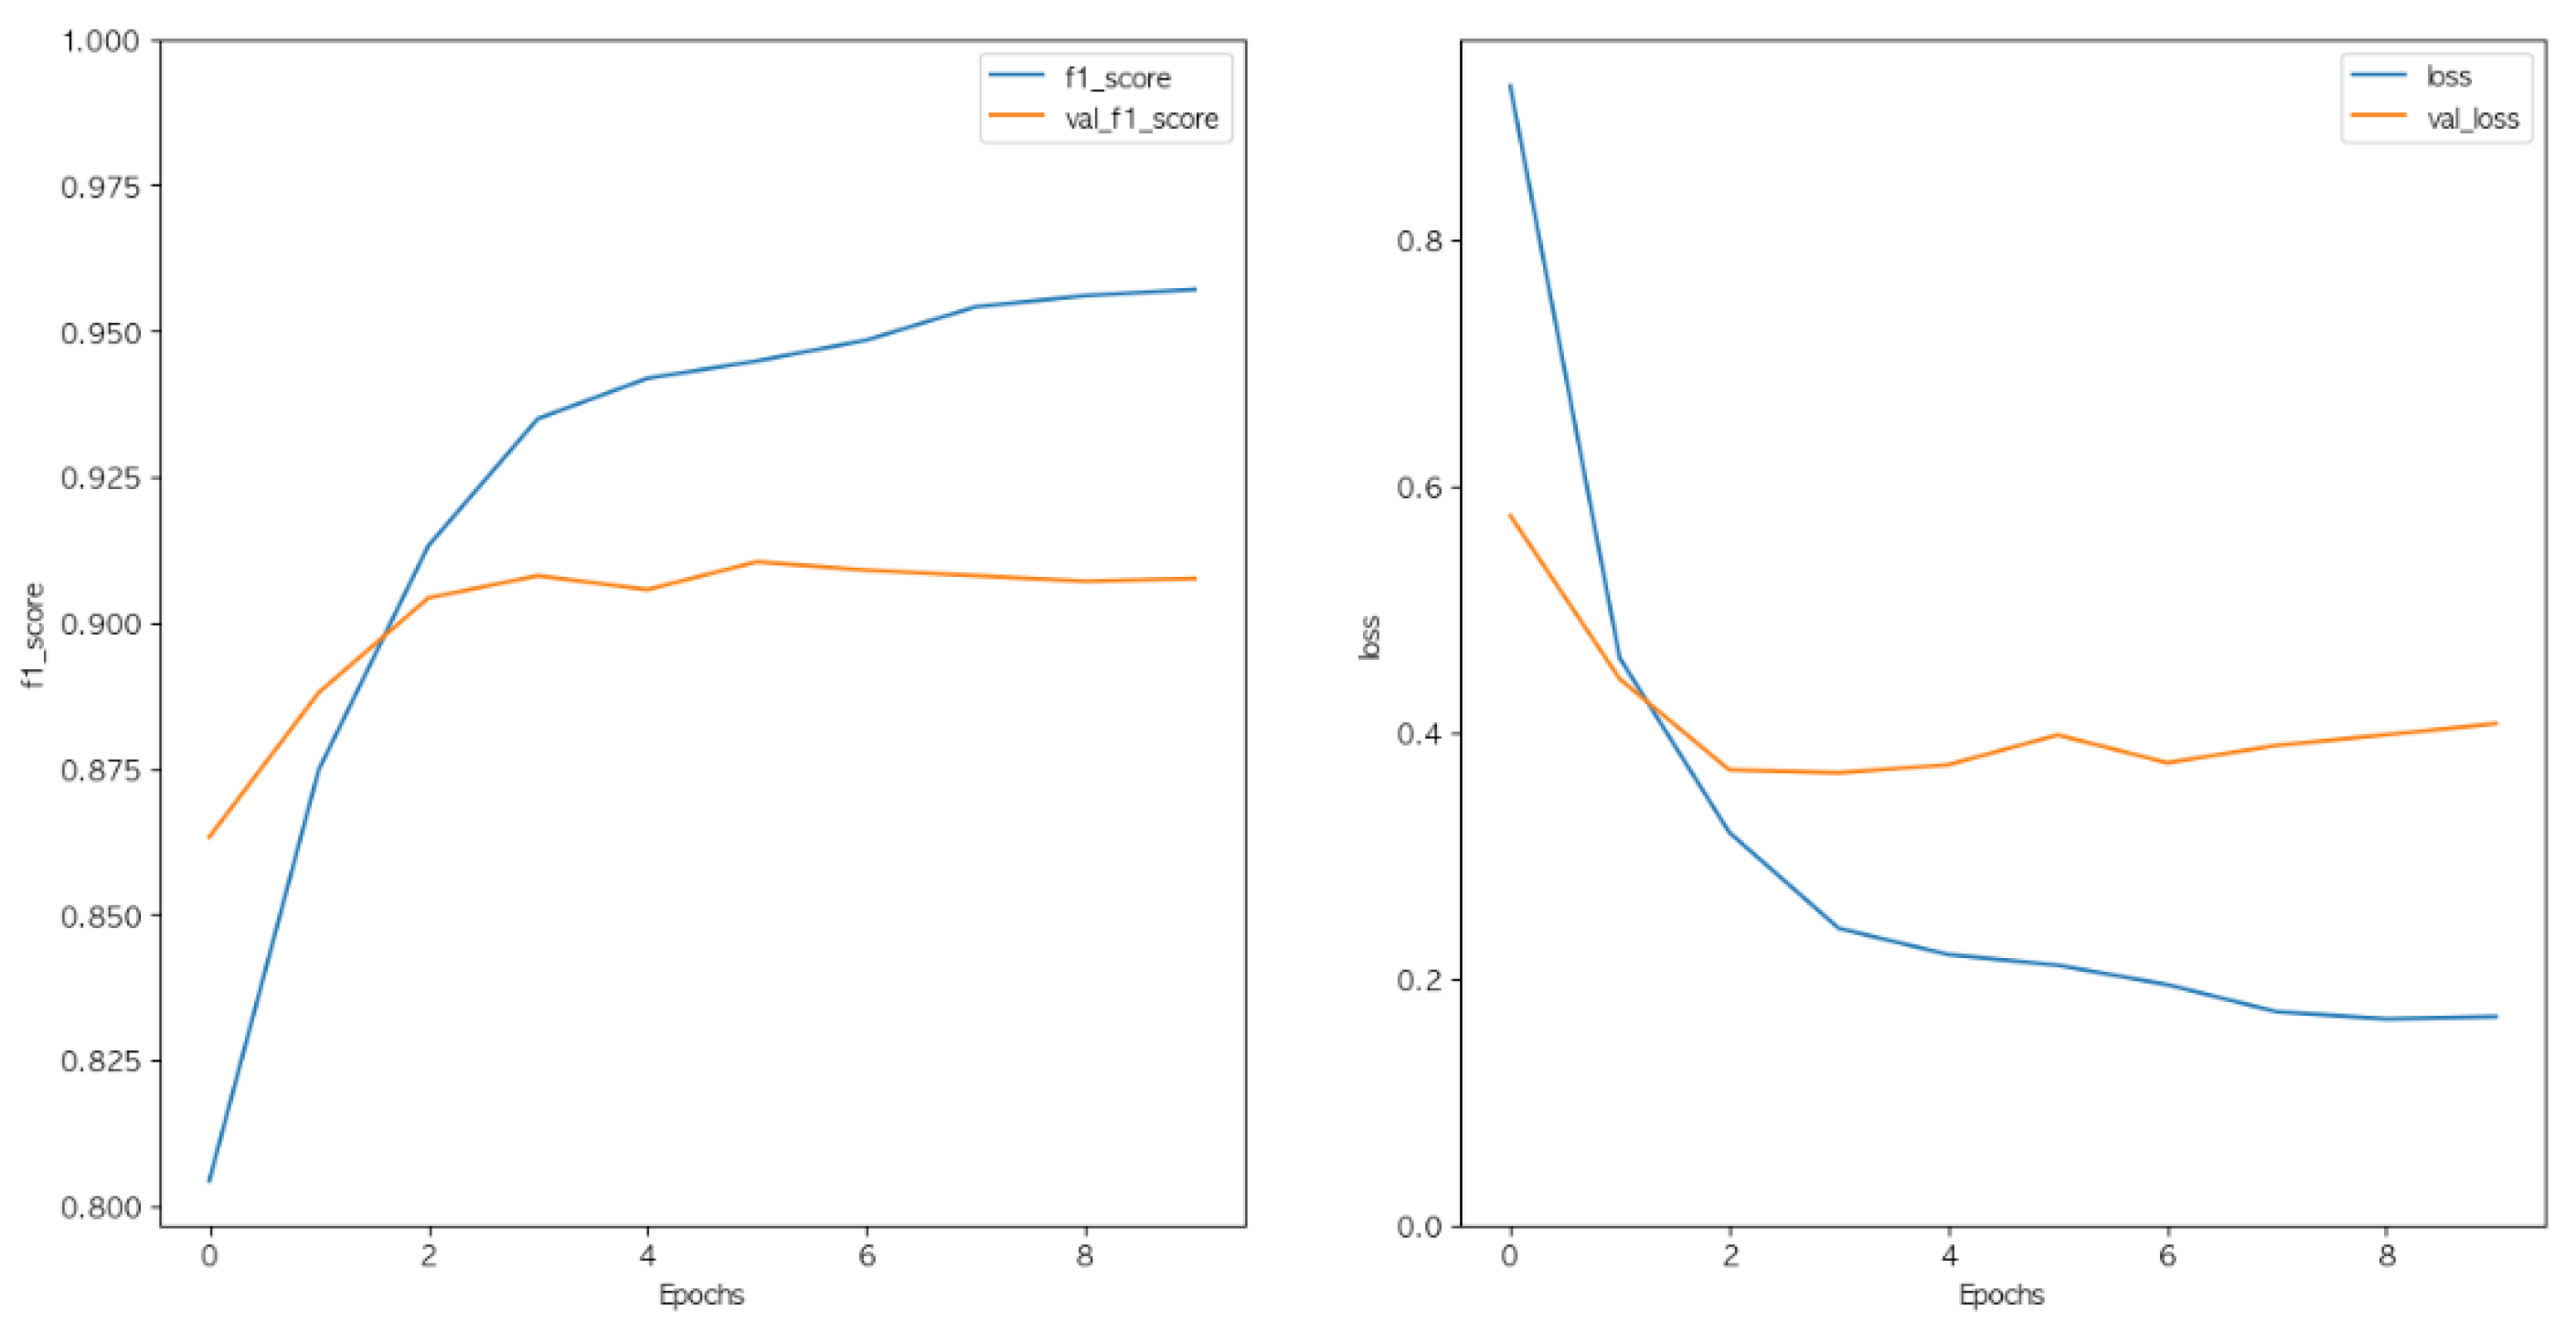
Comparing the experimental models together, there was no increase in validation F1-score or significant change in validation loss even when the learning parameters were simply increased, but there was a significant improvement in performance when the attention layer was added.
Finally, the LSTM model showed the best results after adding the attention layer to the dropout and bidirectional recursion layers and optimizing them, with a validation F1-score of 92.19% and a validation loss of 0.3433, the results are shown in Figure 12. Compared to the basic LSTM model, both the validation F1-score and the validation loss improved, indicating that the model was improved. A comparison of this model with other methods is shown in Table 8.
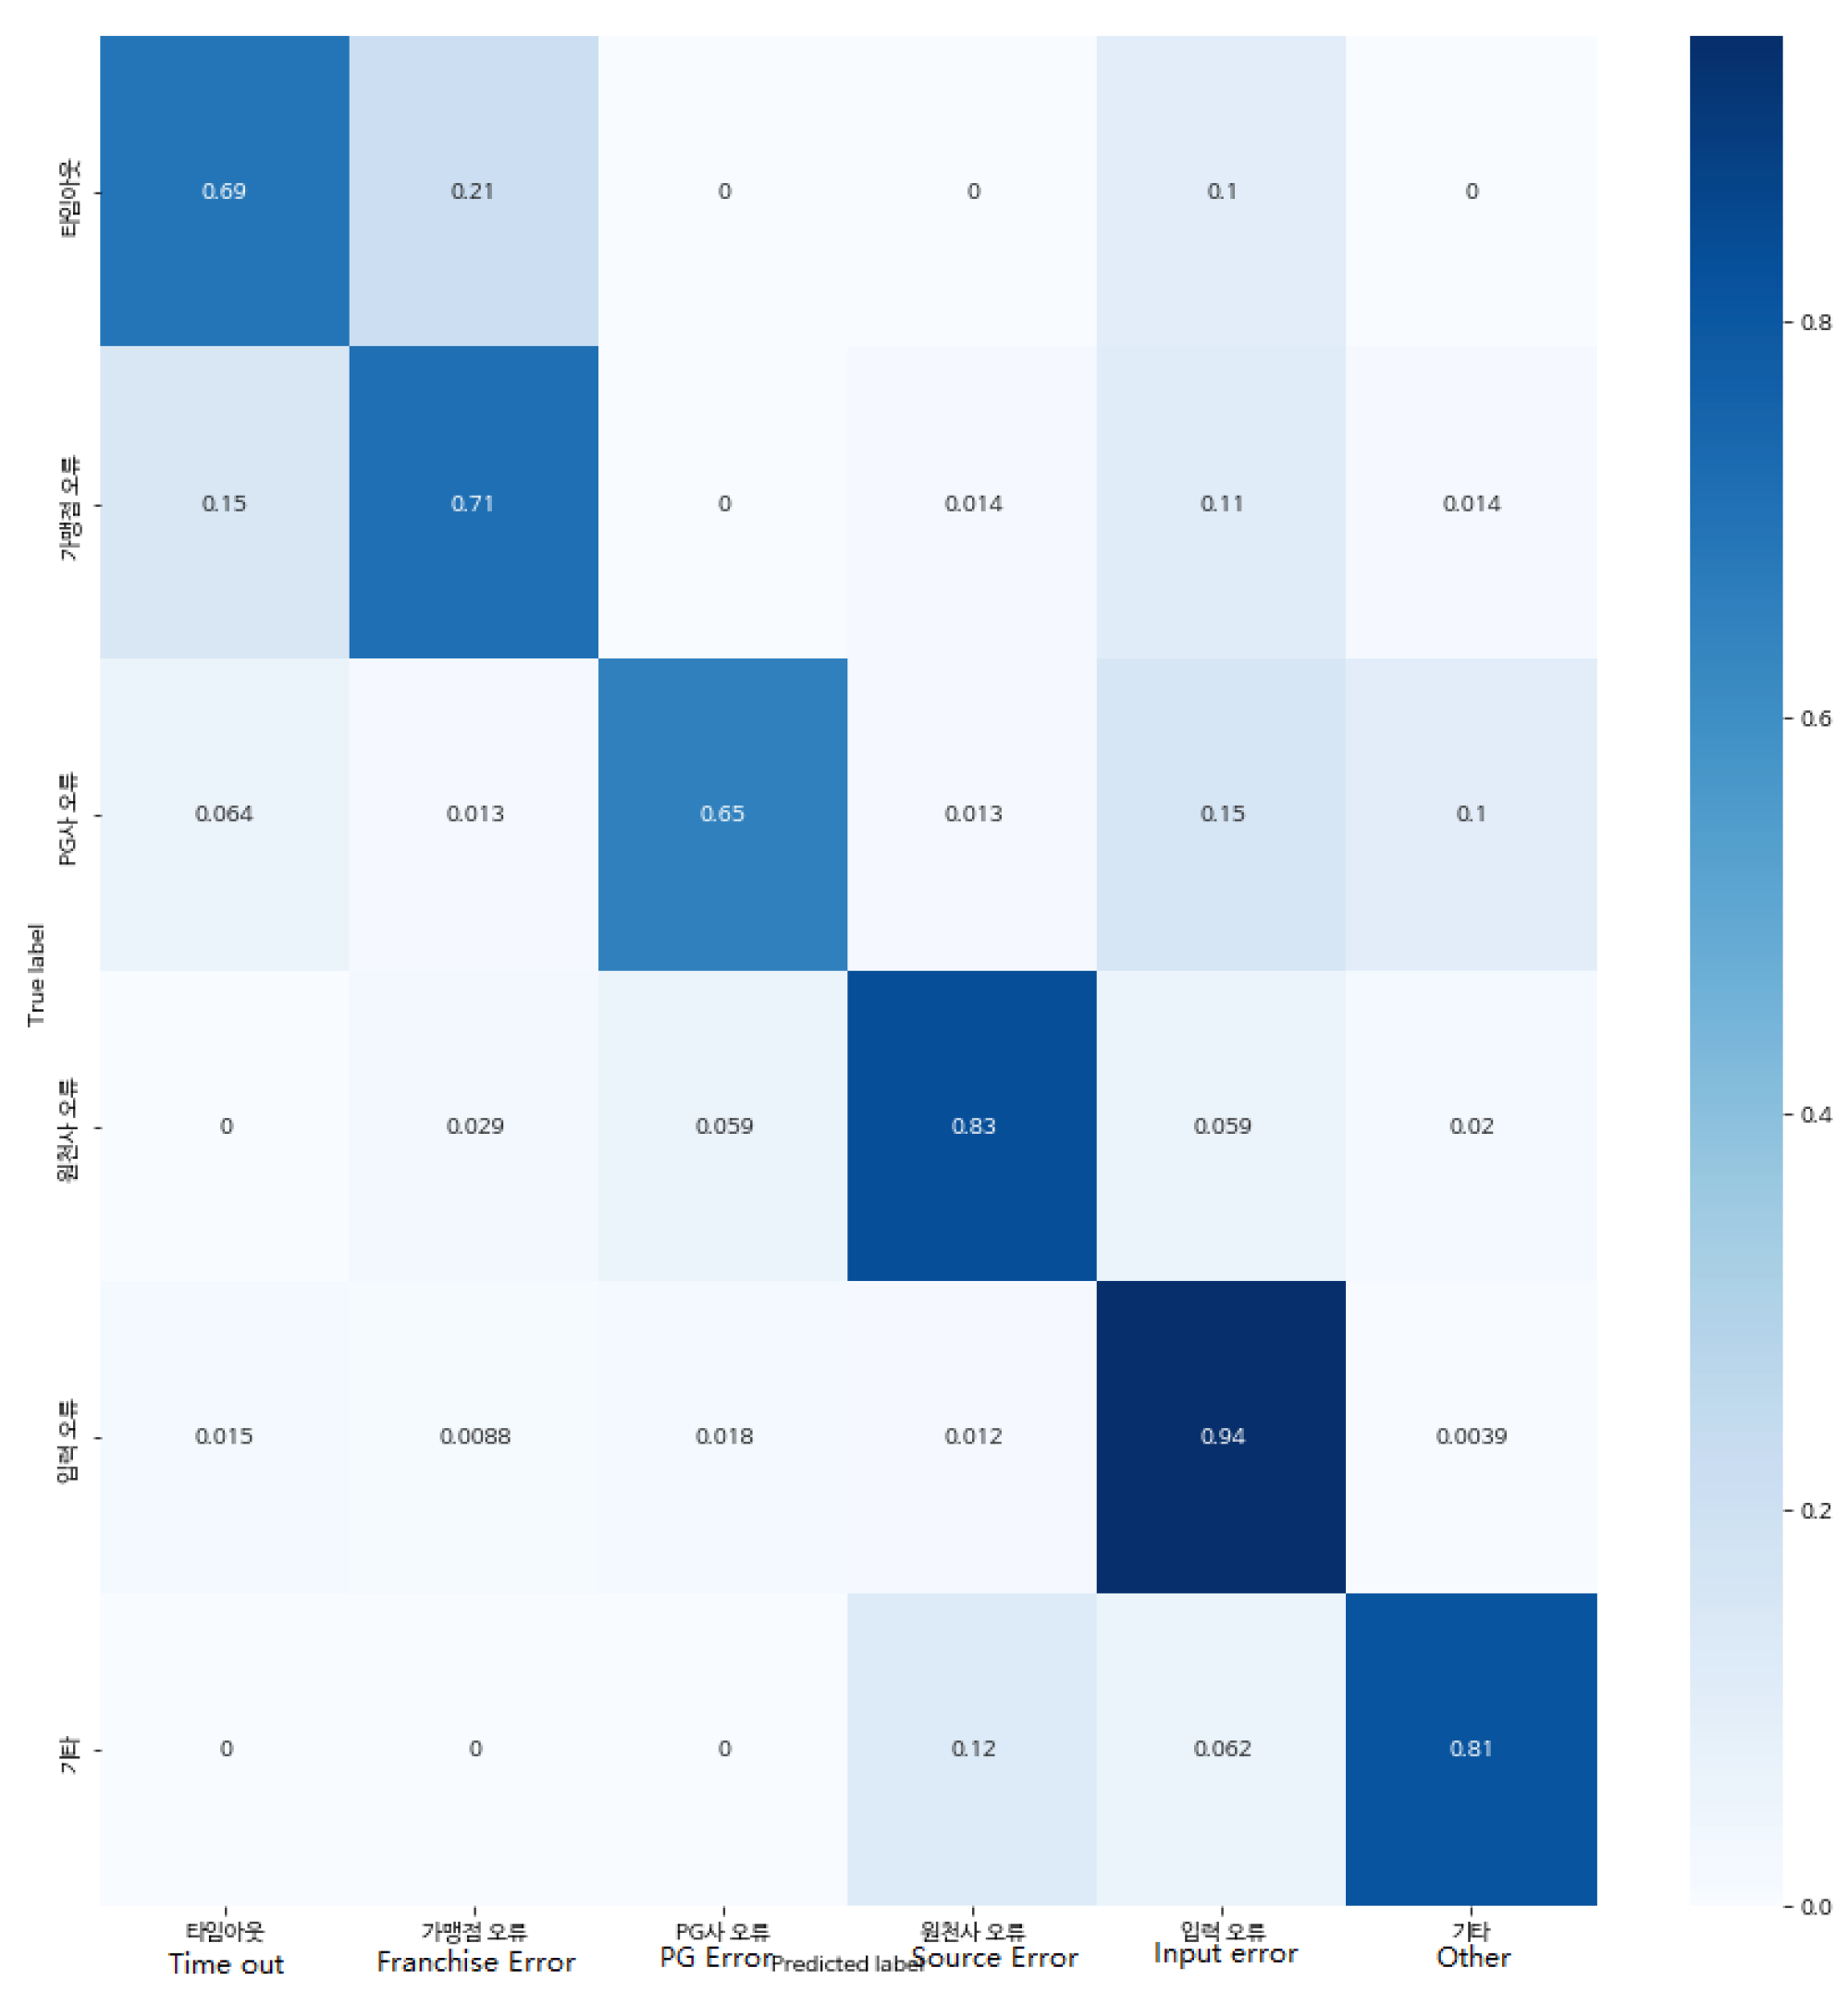
The confusion matrix of the best generated LSTM model is shown in Figure 13. The detection of “input error” has the highest accuracy rate of 94%, followed by “merchant error for PG or financial company”, “other”, and “franchise store error for PG company”. The detection of “PG company error” has the lowest accuracy rate. This is almost of the same order as the distribution of labelled data observed earlier in Figure 8. As the amount of data in the dataset increases, so does the accuracy of the resulting results. This also demonstrates the usability of the model, which will be more accurate in future detection tasks after training with a larger number of datasets.
The high accuracy of 92% for the F1-score is due to the use of price information provided by the financial companies in the dataset. This is information that has a conservative bias compared to other industries and is therefore largely stereotyped, refined, and has the correct sentence structure, allowing for better accuracy than is possible with general linguistic questions. We can therefore expect similar accuracy for information about other financial institutions not used in this study, and if the model were applied to payment systems for e-commerce, we could set up real-time monitoring systems to determine which payment actions are failing based on response values.
In practice, however, an error rate of 8% would have a negative impact on many users. Since most of the data used for learning is automatically tagged data, this error rate could be the result of incorrect data being included in the learning data due to a lack of validation. If humans were directly involved in the data labelling process, constructing the correct learning data and refining the method, a higher level of accuracy could be achieved.
In addition, the more data, the higher the accuracy, so if the data is obtained from fewer cases such as “timeout” or “PG error”, the accuracy of the data will be as high as 94% due to the abundance of data, and it will be possible to create a model that shows a higher level of accuracy.

4.2. Analysis of Reliability and Risks

A reliability and risk analysis based on epistemic uncertainty was performed on the model [17,18,19,20]. Uncertainty modelling was performed using Monte Carlo simulations to model the uncertainty of payment failure by randomly sampling 5000 data from the statistics of payment failure reasons to obtain a sample set of random payment failure reasons. Furthermore, the uncertainty was propagated through the model by introducing randomness into the model, such as using Gaussian noise or random initialization parameters in the LSTM layer or other layers. By introducing randomness or noise, the robustness and stability of the model under different payment failure reasons could be tested and thus the reliability of the model evaluated. The results of the risk analysis are shown in Table 9.
Based on the given probability distribution and risk metrics, a risk index was calculated for each cause of non-payment. The risk index is derived by multiplying the probability by the risk metric and reflects the extent to which each cause contributes to the overall risk. The higher the risk index, the greater the contribution of that cause to the overall risk.
According to the model output results, the risk measure for each cause can be calculated, and then the corresponding decision strategy can be developed based on the risk measure, such as developing a different payment failure handling process or adjusting the payment security policy.

4.3. Discussion

This model can automatically process and analyse a large number of different types of payment data, reducing the effort and time required for manual processing; it can handle variable-length sequence inputs and is suitable for processing payment information text of varying lengths. Furthermore, because the LSTM model models the sequence and time dependence of the input sequence, it is robust to noise and variation in the input data, enabling faster and more accurate detection of payment problem areas.
However, the performance of the model is highly dependent on the quality of the data and the accuracy of the annotations. The accuracy of the model can be affected if there is noise or incorrect annotations in the training dataset, and the distribution of samples in the payment information detection task can be unbalanced, leading to a lower prediction accuracy for models with fewer samples and require certain strategies to deal with the data imbalance.
Privacy and security are very important considerations when processing payment information. Appropriate security measures must be taken to protect users’ payment information to avoid potential data leakage or misuse. Future research should continue to explore how to design more secure and reliable models to prevent data leakage and misuse, introduce more sophisticated LSTM variants or use other model structures to better capture the semantics and context of payment information, and further explore and develop data expansion techniques for payment information detection tasks to extend the training data and improve the robustness of the models.

5. Conclusions

In this paper, we proposed an optimized attention LSTM model to detect the reasons for payment failure through natural language processing of payment result information provided by financial companies. The model provided a detection accuracy of about 92% in the performance evaluations. The model can automatically process and analyse large amounts of text data, reduce the workload and time cost of manual processing, can be applied to multiple languages and types of payment text data, and is robust to noise and changes in the input data. The accuracy of the model will be higher in future recognition tasks after training on a larger dataset.

Author Contributions

Conceptualization, Z.W. and S.K.; methodology, Z.W. and S.K.; software, S.K.; validation, Z.W., S.K. and I.J.; writing—original draft preparation, Z.W. and S.K.; writing—review and editing, Z.W., S.K. and I.J.; visualization, Z.W. and S.K.; supervision, I.J.; project administration, Z.W., S.K. and I.J. All authors have read and agreed to the published version of the manuscript.

Funding

This work was supported by the Institute of Information & Communications Technology Planning & Evaluation (IITP) grant funded by the Korea government (MSIT) (No. 2020-0-00107, Development of the technology to automate the recommendations for big data analytic models that define data characteristics and problems).

Institutional Review Board Statement

Not applicable.

Informed Consent Statement

Not applicable.

Data Availability Statement

The datasets generated during and/or analysed during the current study are available from the corresponding author on reasonable request.

Conflicts of Interest

The authors declare no conflict of interest.

Abbreviations

The following abbreviations are used in this manuscript:
AIArtificial intelligence
SRNSimple recurrent network
RNNRecurrent neural network
LSTMLong short-term memory
GRUGate recurrent unit
PoSPart of speech
NERNamed entity recognition
KNNK-nearest neighbours
SVMSupport vector machines
CNNConvolutional neural network
RBMRestricted Boltzmann machines
DBNDeep belief networks
AUCArea under curve
MCCMathews correlation coefficient
OKTOpen Korean text

References

  1. Yunhap News Agency. United Nations, Increases E-Commerce Due to COVID-19…Korea’s Largest Portion of the Survey Subjects. Available online: https://www.yna.co.kr/view/AKR20210503145200088 (accessed on 3 May 2021).
  2. Tobias, E.S.; Demuth, W. Leveraging Clustering and Natural Language Processing to Overcome Variety Issues in Log Management. In Proceedings of the 12th International Conference on Agents and Artificial Intelligence (ICAART 2020), Valletta, Malta, 22–24 February 2020; Available online: https://www.scitepress.org/Papers/2020/88566/88566.pdf (accessed on 11 May 2021).
  3. Elman, J.L. Finding structure in time. Cogn. Sci. 1990, 14, 179–211. [Google Scholar] [CrossRef]
  4. Graves, A.; Graves, A. Long short-term memory. Neural Computation. 1997, 385, 1735–1780. [Google Scholar]
  5. Chung, J.; Gulcehre, C.; Cho, K.; Bengio, Y. Empirical evaluation of gated recurrent neural networks on sequence modeling. arXiv 2014, arXiv:1412.3555. [Google Scholar]
  6. Malhotra, P.; Ramakrishnan, A.; Anand, G.; Vig, L.; Agarwal, P.; Shroff, G. LSTM-based encoder-decoder for multi-sensor anomaly detection. arXiv 2016, arXiv:1607.00148. [Google Scholar]
  7. Zhang, Y.; Liu, Q.; Song, L. Sentence-state lstm for text representation. arXiv 2018, arXiv:1805.02474. [Google Scholar]
  8. Yan, Y.; Wang, Y.; Gao, W.C.; Zhang, B.W.; Yang, C.; Yin, X.C. LSTM2: Multi-Label Ranking for Document Classification. Neural Process. Lett. 2018, 47, 117–138. [Google Scholar] [CrossRef]
  9. Dornadula, V.N.; Geetha, S. Credit card fraud detection using machine learning algorithms. Procedia Comput. Sci. 2019, 165, 631–641. [Google Scholar] [CrossRef]
  10. Mehbodniya, A.; Alam, I.; Pande, S.; Neware, R.; Rane, K.P.; Shabaz, M.; Madhavan, M.V. Financial fraud detection in healthcare using machine learning and deep learning techniques. Secur. Commun. Netw. 2021, 2021, 9293877. [Google Scholar] [CrossRef]
  11. Raghavan, P.; El Gayar, N. Fraud detection using machine learning and deep learning. In Proceedings of the 2019 International Conference on Computational Intelligence and Knowledge Economy (ICCIKE), Dubai, United Arab Emirates, 11–12 December 2019. [Google Scholar]
  12. TensorFlow Addons Optimizers: CyclicalLearningRate. Available online: https://www.tensorflow.org/addons/tutorials/optimizers_cyclicallearningrate (accessed on 28 July 2022).
  13. Smith, L.N. Cyclical learning rates for training neural networks. In Proceedings of the 2017 IEEE Winter Conference on Applications of Computer Vision (WACV), Santa Rosa, CA, USA, 24–31 March 2017. [Google Scholar]
  14. Hinton, G.E.; Srivastava, N.; Krizhevsky, A.; Sutskever, I.; Salakhutdinov, R.R. Improving neural networks by preventing co-adaptation of feature detectors. arXiv 2012, arXiv:1207.0580. [Google Scholar]
  15. Schuster, M.; Paliwal, K.K. Bidirectional recurrent neural networks. IEEE Trans. Signal Process. 1997, 45, 2673–2681. [Google Scholar] [CrossRef] [Green Version]
  16. Bahdanau, D.; Cho, K.; Bengio, Y. Neural machine translation by jointly learning to align and translate. arXiv 2014, arXiv:1409.0473. [Google Scholar]
  17. Zaitseva, E.; Levashenko, V.; Rabcan, J. A new method for analysis of Multi-State systems based on Multi-valued decision diagram under epistemic uncertainty. Reliab. Eng. Syst. Saf. 2023, 229, 108868. [Google Scholar] [CrossRef]
  18. Yang, J.; Xing, L.; Wang, Y.; He, L. Combinatorial Reliability Evaluation of Multi-State System with Epistemic Uncertainty. Int. J. Math. Eng. Manag. Sci. 2022, 7, 312–324. [Google Scholar] [CrossRef]
  19. Wang, W.; Xue, H.; Gao, H. An effective evidence theory-based reliability analysis algorithm for structures with epistemic uncertainty. Qual. Reliab. Eng. Int. 2021, 37, 841–855. [Google Scholar] [CrossRef]
  20. Zhang, Z.; Chen, Z.; Jiang, C. Enhanced reliability analysis method for multistate systems with epistemic uncertainty based on evidential network. Qual. Reliab. Eng. Int. 2021, 37, 262–283. [Google Scholar] [CrossRef]
Figure 1. Example results of message preprocessing.
Applsci 13 07884 g001
Figure 2. Distribution of labelled data.
Applsci 13 07884 g002
Figure 3. Length distribution of integer-encoded input sequences.
Applsci 13 07884 g003
Figure 4. Tagging process of data.
Applsci 13 07884 g004
Figure 5. F1-score and loss for each epoch of each model.
Applsci 13 07884 g005
Figure 6. Training results of the LSTM model with a dropout layer.
Applsci 13 07884 g006
Figure 7. Training results of the LSTM model with the dropout and stacking recurrent layers.
Applsci 13 07884 g007
Figure 8. Training results of the LSTM model with the dropout and bidirectional recurrent layers.
Applsci 13 07884 g008
Figure 9. Training results of the LSTM model with the dropout, bidirectional recurrent and attention layers.
Applsci 13 07884 g009
Figure 10. Final model training results.
Applsci 13 07884 g010
Figure 11. Optimized LSTM model.
Applsci 13 07884 g011
Figure 12. F1-score and loss for each epoch of each model.
Applsci 13 07884 g012
Figure 13. Confusion matrix for the final LSTM model.
Applsci 13 07884 g013
Table 1. Comparison results by model.
Evaluation MethodSimple RNNLSTMGRU
F1-score0.966290.960340.91377
Loss0.129950.153060.30122
Validation F1-score0.905670.907570.88709
Validation loss0.447440.418660.44360
Table 2. Training results of the LSTM model with a dropout layer.
F1-ScoreLossValidation F1-ScoreValidation Loss
0.95710.16920.90760.4069
Table 3. Training results of the LSTM model with the dropout and stacking recurrent layers.
F1-ScoreLossValidation F1-ScoreValidation Loss
0.94890.19150.90610.4053
Table 4. Training results of the LSTM model with the dropout and bidirectional recurrent layers.
F1-ScoreLossValidation F1-ScoreValidation Loss
0.95760.16470.90900.4031
Table 5. Training results of the LSTM model with the dropout, bidirectional recurrent and attention layers.
F1-ScoreLossValidation F1-ScoreValidation Loss
0.95120.18780.91420.4072
Table 6. Final model training results.
F1-ScoreLossValidation F1-ScoreValidation Loss
0.94010.22500.92190.3433
Table 7. Comparison of the performance of each model.
F1-ScoreLossValidation F1-ScoreValidation Loss
Dropout0.95710.16920.90760.4069
Stacked Recurrent0.94890.19150.90610.4053
Bidirectional Recurrent0.95760.16470.90900.4031
Bidirectional Attention0.95120.18780.91420.4072
Optimized Bidirectional Attention0.94010.22500.92190.3433
Table 8. Comparison results by model.
Simple RNNLSTMGRUImproved LSTM
F1-score0.96630.96030.91380.9401
Loss0.13000.15310.30120.2250
Validation F1-score0.90570.90760.88710.9219
Validation loss0.44740.41870.44360.3433
Table 9. Analysis of the reliability and risks.
CategoryProbabilityRisk Measurement IndicatorsRisk Index
Input error73.4%0.40.2936
Financial company error7.6%0.60.0456
Other6.8%0.80.0544
Store error5.3%0.70.0371
PG error5.7%0.70.0399
Time out1.2%0.30.036
Disclaimer/Publisher’s Note: The statements, opinions and data contained in all publications are solely those of the individual author(s) and contributor(s) and not of MDPI and/or the editor(s). MDPI and/or the editor(s) disclaim responsibility for any injury to people or property resulting from any ideas, methods, instructions or products referred to in the content.

