Article

The Use of Augmented Reality for the Management of Equipment Ageing with a Virtual Sensor

1
Dipartimento di Ingegneria, University of Messina, 98166 Messina, Italy
2
Dipartimento di Ingegneria, Università Campus Biomedico, 00128 Roma, Italy
3
Dipartimento di Scienze Matematiche e Informatiche, Scienze Fisiche e Scienze della Terra, University of Messina, 98166 Messina, Italy
*
Author to whom correspondence should be addressed.
Appl. Sci. 2023, 13(13), 7843; https://doi.org/10.3390/app13137843
Submission received: 30 April 2023 / Revised: 21 June 2023 / Accepted: 29 June 2023 / Published: 4 July 2023

Abstract

:
Much of the equipment that is used in the chemical and process industry and for handling or treating hazardous substances is subject to deterioration. To manage the risk of major accidents due to this deterioration, the current legislation requires periodic controls that must be carried out to verify the health conditions (ageing). To support the inspectors performing this task, a virtual sensor has been designed and developed. It is a system composed of hardware and software that uses mathematical models and augmented reality to assist in on-field inspections for monitoring and predicting equipment ageing. Currently, there are no AR devices to perform inspections aimed at verifying the integrity of equipment. The virtual sensor collects ageing-related information and returns the corrosion rate, the probability of the critical pit, the corrosion evolution through iso-contour corrosion maps, and the RUL; finally, it allows visualising the equipment condition through augmented reality, (e.g., by means of thickness maps and tables that overlay the equipment). The aim of this paper is to present the graphical interface of the software application, which has been improved to minimise errors due to human–machine interaction. A large diesel storage tank has been used to show how the virtual sensor works.

1. Introduction

Innovative technologies, such as the Internet of Things, artificial intelligence, big data, cloud computing, cyber–physical systems, interconnectivity, augmented reality, etc., characterise the development of Industry 4.0 by means of the integration of physical and digital systems. They bring many advantages throughout the industrial sector, which take the form of increasing efficiency, profitability, innovation, customisation, and performance [1]. Another important aspect to note, as a strength element for Industry 4.0, is the potential support in the improvement of the safety management, even if, currently, there are only a few studies that analyse the integration of safety management and Industry 4.0 [2]. Among them, Gisbert et al. [3] considered that information technology and wireless communication allow for continuous and effective detection of workplace hazards, while Beetz et al. [4] stated that the development of robots dedicated to safety may be able to recognise actions that can cause injury to workers. Podgorski et al. [5] observed that personal protective equipment (PPE) supplied with automation technology is being adopted in smart factories to achieve better safety management. Other authors instead highlighted that artificial intelligence and its applications have a lot of potential, especially as regards predictive maintenance, for example, by improving the diagnostics of critical equipment failures [6,7] and of rotating machines [8] or transport systems [9] by reducing or eliminating threats to the safety of people, goods, and the environment.
Industry 4.0 aims to digitise production by sharing and analysing information as well as connecting humans and machines [10]. The machine–machine and human–machine interactions represent fundamental aspects of this digitalisation process [2], but these are not free from having disadvantages. Emerging and experimental technologies cause a deep change in society, which needs time to adapt and normalise itself through new paradigms, procedures, and labour laws. This requires companies to continuously update, but it often becomes unsustainable for most of them, especially for small and medium ones. Another aspect to be considered is that these systems create absolute dependence on the technology since within these interactions, the machines no longer only represent the arm that carries out the heavy, repetitive, and/or dangerous work, but increasingly play a decision-making role [11]. Particular attention must be given to these technologies, especially when they are involved in safety. In many cases, technology improves safety, but it can also add new industrial and occupational risks to the traditional ones, in which the human factor can be considered the main link between both types of risk [12]. Siemieniuch et al. [13] also highlight that safety management, in the context of Industry 4.0, requires more research efforts on human factors and ergonomics. In this context, particular attention must be given to the establishments under the Seveso Directive [14], in which the release of hazardous materials could be the cause of severe accidents, the so-called major accident hazards (e.g., fires, explosions, and toxic dispersions) impacting people and the environment. Seveso establishments include refineries, petrochemical plants, and oil-derived depots. All these sites feature several large aboveground storage tanks, which are always critical for the control of major accident hazards.
Some scholars have discussed the potential of smart systems for improving the control of major accident hazards due to the use of hazardous materials in different industries (energy, chemical and manufacturing sectors, oil and gas, transportation, etc.) [15]. Some innovative solutions have been presented in the literature: Bragatto et al. [16] defined RFID technology supporting effective risk management in chemical warehouses; Ancione et al. [17] developed a real-time visual guidance system for cranes to manage risks due to collisions during the lifting of loads in working places; Gnoni et al. [18] defined an IOT-based system to prevent injuries in assembling line production systems; Mennuti et al. [19] used wireless sensor networks based on acoustic emissions to monitor some damages in various structures. As regards the use of innovative technologies, evidence justifies a particular interest towards augmented reality (AR) in the industrial context. These works highlight the increasing request to make industrial activities more efficient, safe, and economic. In this context, coupled with other technologies, AR contributes to the achievement of this goal.
The literature outlines the main applications of AR, referring to various industrial sectors. However, there are some limitations that are mainly related to human–machine interactions [20]. Egger and Masood [21] described the recent spread of AR technologies and stated that these are not yet ready for industrial implementation in some areas, whereas they are in other sectors. The most common applications of AR concern training for the management of operations [22,23,24] and assisting in the routine maintenance of industrial equipment by following visual instructions and interactive guides superimposed on the real equipment for a more effective workflow, even with remote assistance [25,26,27,28,29]. Yang et al. [30] described how AR, combined with instant messaging and image recognition technologies, could greatly assist chemical plant inspections to solve the problems associated with low efficiency and poor standardisation.
The use of AR in the inspection sector appears as one of the most important in the industrial context, where AR represents a promising technique for improving the transfer of information from the digital to the operator in a smart and non-intrusive way [31,32]. Depending on the industrial sector and the scope, inspections could typically involve controls to be performed on products [33,34] or equipment; in the first case, it concerns the detection of design discrepancies, while in the second one, it is used to intercept possible causes of malfunction. The execution of this activity is therefore essential in the manufacturing process, especially where many factors, such as the complexity of the products and the inability of the operator to comply with certain assembly sequences, can potentially lead to mistakes or design changes. The control of the equipment for maintenance purposes or due to malfunctions is important for the production continuity and safety purposes, especially in the chemical industry due to the reasons discussed above. A critical aspect related to the inspections concerns the annotation and formalisation of detected errors and design changes, and the subsequent sharing of the information with the technical office; these activities require a high mental workload [35].
In the context of major accident hazard industries, it is possible to find applications of AR for the following scopes:
  • to overcome the limit of using paper-based checklists during on-site inspections. The use of AR technologies makes the inspection more efficient and advanced than the conventional approaches [36,37];
  • to help operators in performing tasks and operations by means of man–machine interaction through the addition of information to the real work environment [32,34,38,39] (such as live video streams, pictures, or instructions);
  • to support education for managers and employees with computer-generated 3D environments [40,41] and train in hazardous materials handling by means of simulations [38].
Therefore, the literature shows that currently, this technology is not mature enough to perform inspections aimed at verifying the integrity of equipment and visualising the deterioration level. As part of a recently concluded research project [42], a virtual sensor has been developed to elaborate and visualise information relating to the deterioration of critical equipment; it also produces prognostic estimates of the corrosion rate, the critical pit probability, the evolution of the material corrosion, and the residual useful life (RUL) of the equipment. The virtual sensor supports on-field inspections by visualising the information in AR via a mobile device display, such as a smartphone or a tablet or via wearable device (e.g., smart glasses). During the first phase of the development of this virtual sensor, greater importance has been given to the optimisation of the processes for the implementation of the mathematical models that use several different types of input data. In this manuscript, the investigation of the human–machine interaction (HMI) in using this device is presented; this work resulted in a user-friendly interface, which improved the usability of the software, making it accessible even to personnel that are not experts in advanced technologies. The manuscript is organised as follows. Section 2 provides a short description of the models and the software that represents the virtual sensor; Section 3 describes the methodology for the development of a user-friendly interface of the virtual sensor, reducing the errors due to HMI; Section 4 illustrates the results, discusses them, and presents some future improvements; finally, Section 5 gives the conclusions of this work.

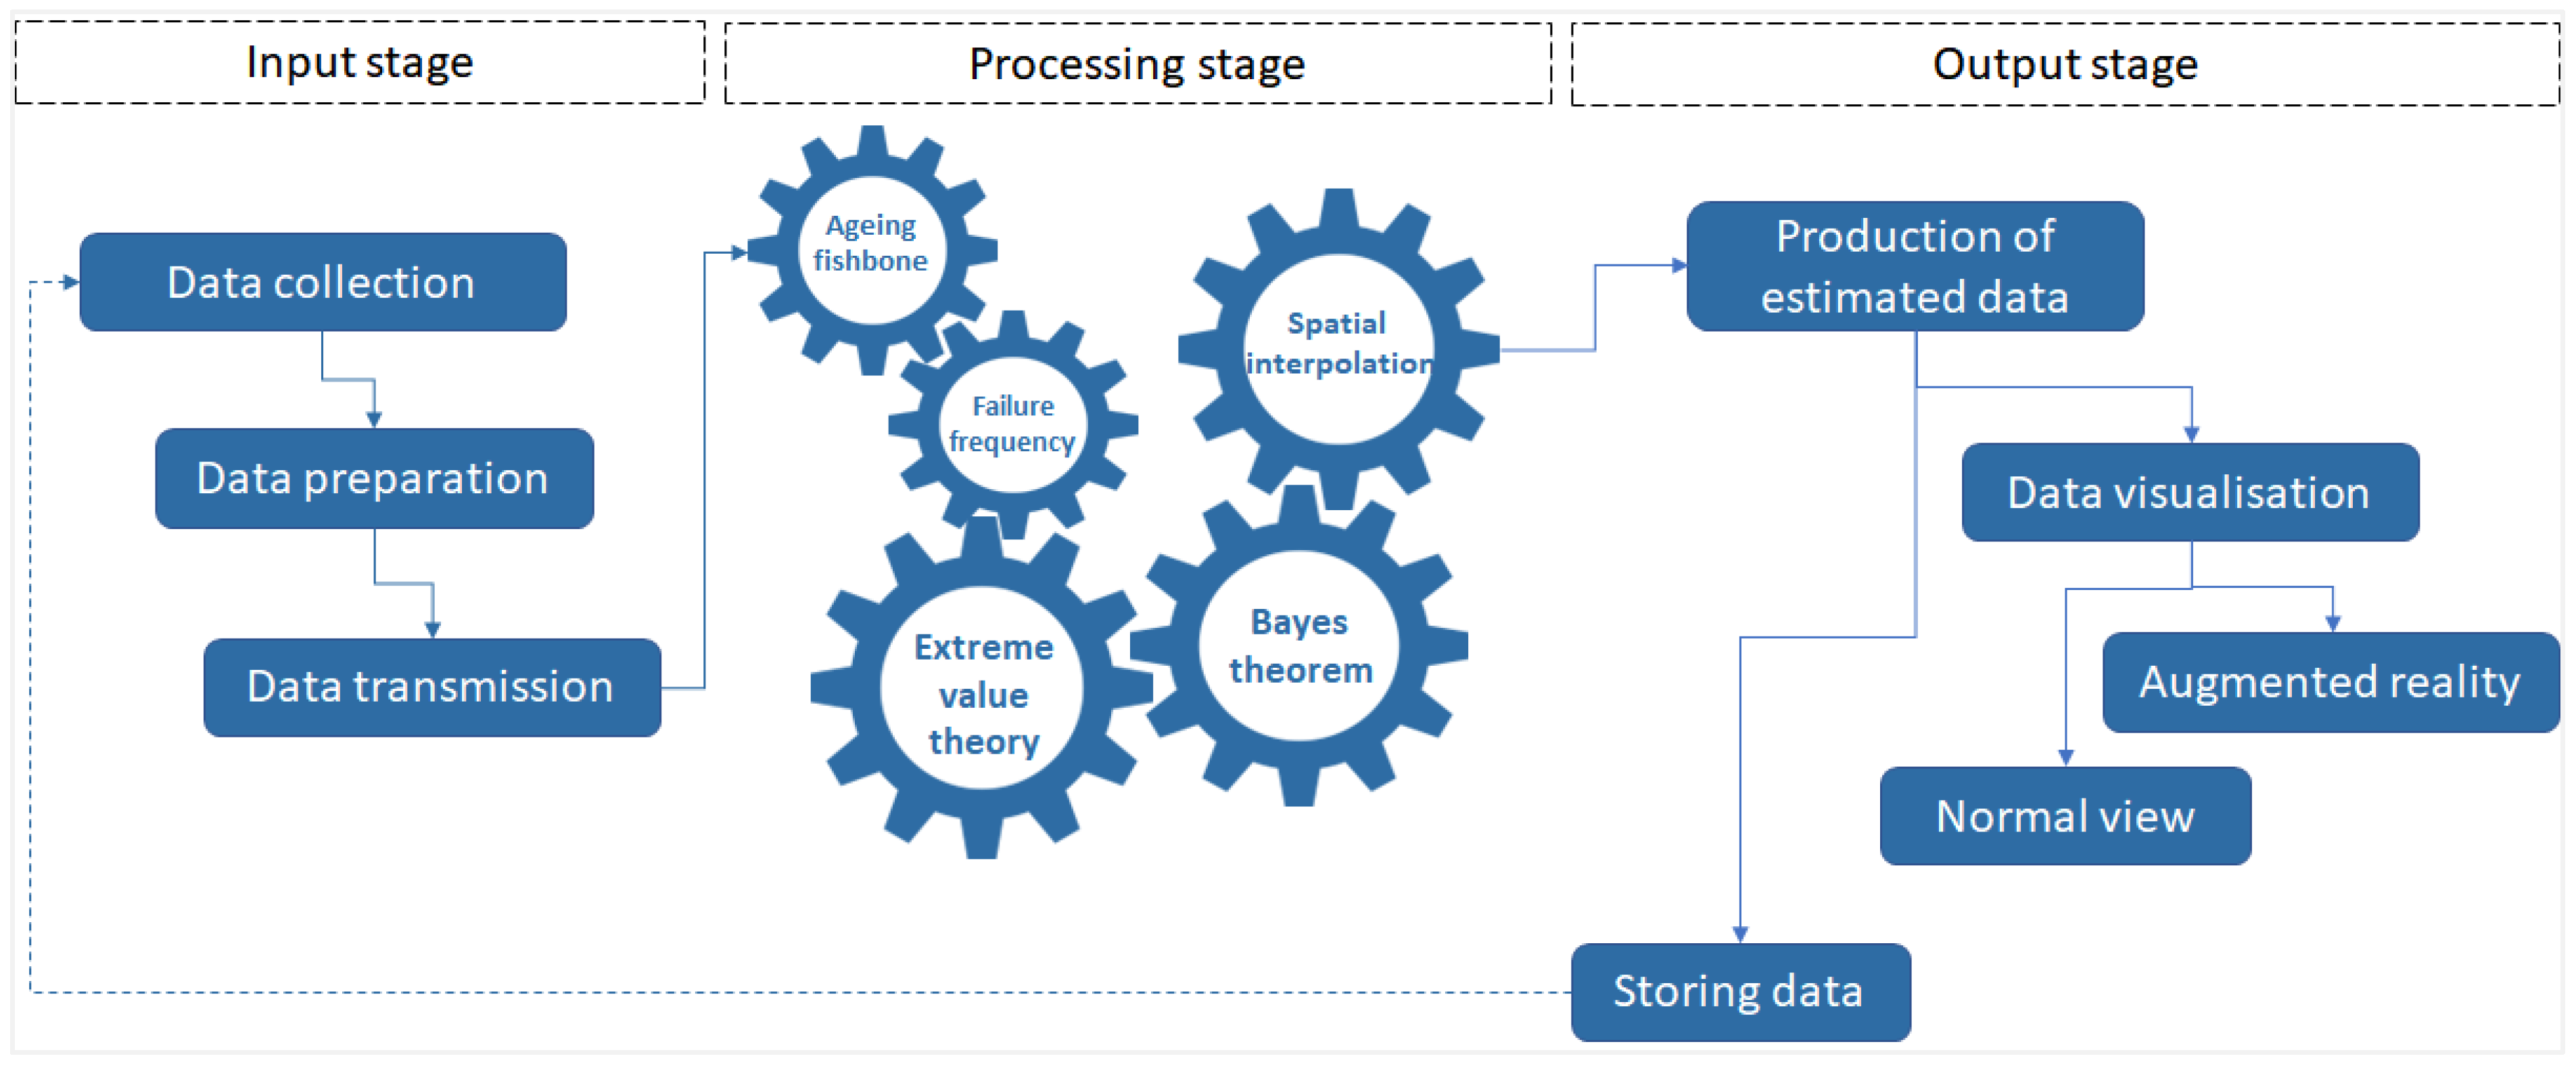
2. Architecture of the Virtual Sensor

A virtual sensor for ageing management is a tool supporting inspectors in major accident hazard establishments. Inspectors usually need to understand the actual deterioration level of critical equipment, acquire information that cannot be found with a visual inspection, and finally, elaborate the metrics related to the ageing status and about the adequacy of the ageing management.
The system has been designed to collect various information, process the acquired data, produce prognostic estimates regarding the corrosion rate, the critical pit probability, the evolution of the corrosion surface, and the RUL of the equipment, and finally, it allows visualising the results by using AR. Therefore, the sensor is composed of four elements: the dataset, which is fed through the collection of information about the equipment to be analysed; the set of the models; the software for the management of the data and the elaboration of ageing-related metrics; the tool for the visualisation of the results in AR.
The models used by the virtual sensor are:
  • the ageing fishbone model for the estimation of the overall adequacy index (also simply named ageing index) [43];
  • the failure frequency model for the quantification of the failure frequency due to the equipment deterioration by taking into account the ageing management;
  • the model for the identification of the probability of the critical pit, based on the extreme values theory (Gumbel distribution model) [44];
  • the model for the calculation of the residual useful lifetime based on a combination of the Gumbel distribution and the Bayes theorem [45];
  • an advanced spatial interpolation technique of the thickness data to produce corrosion maps (the kriging interpolation model) [46].
More details about these models are given by Ancione et al. [42].
The virtual sensor is made up of an “App Desktop” that acquires and processes inputs (the equipment information) and an “App Mobile” for the AR visualisation of the acquired and processed data.

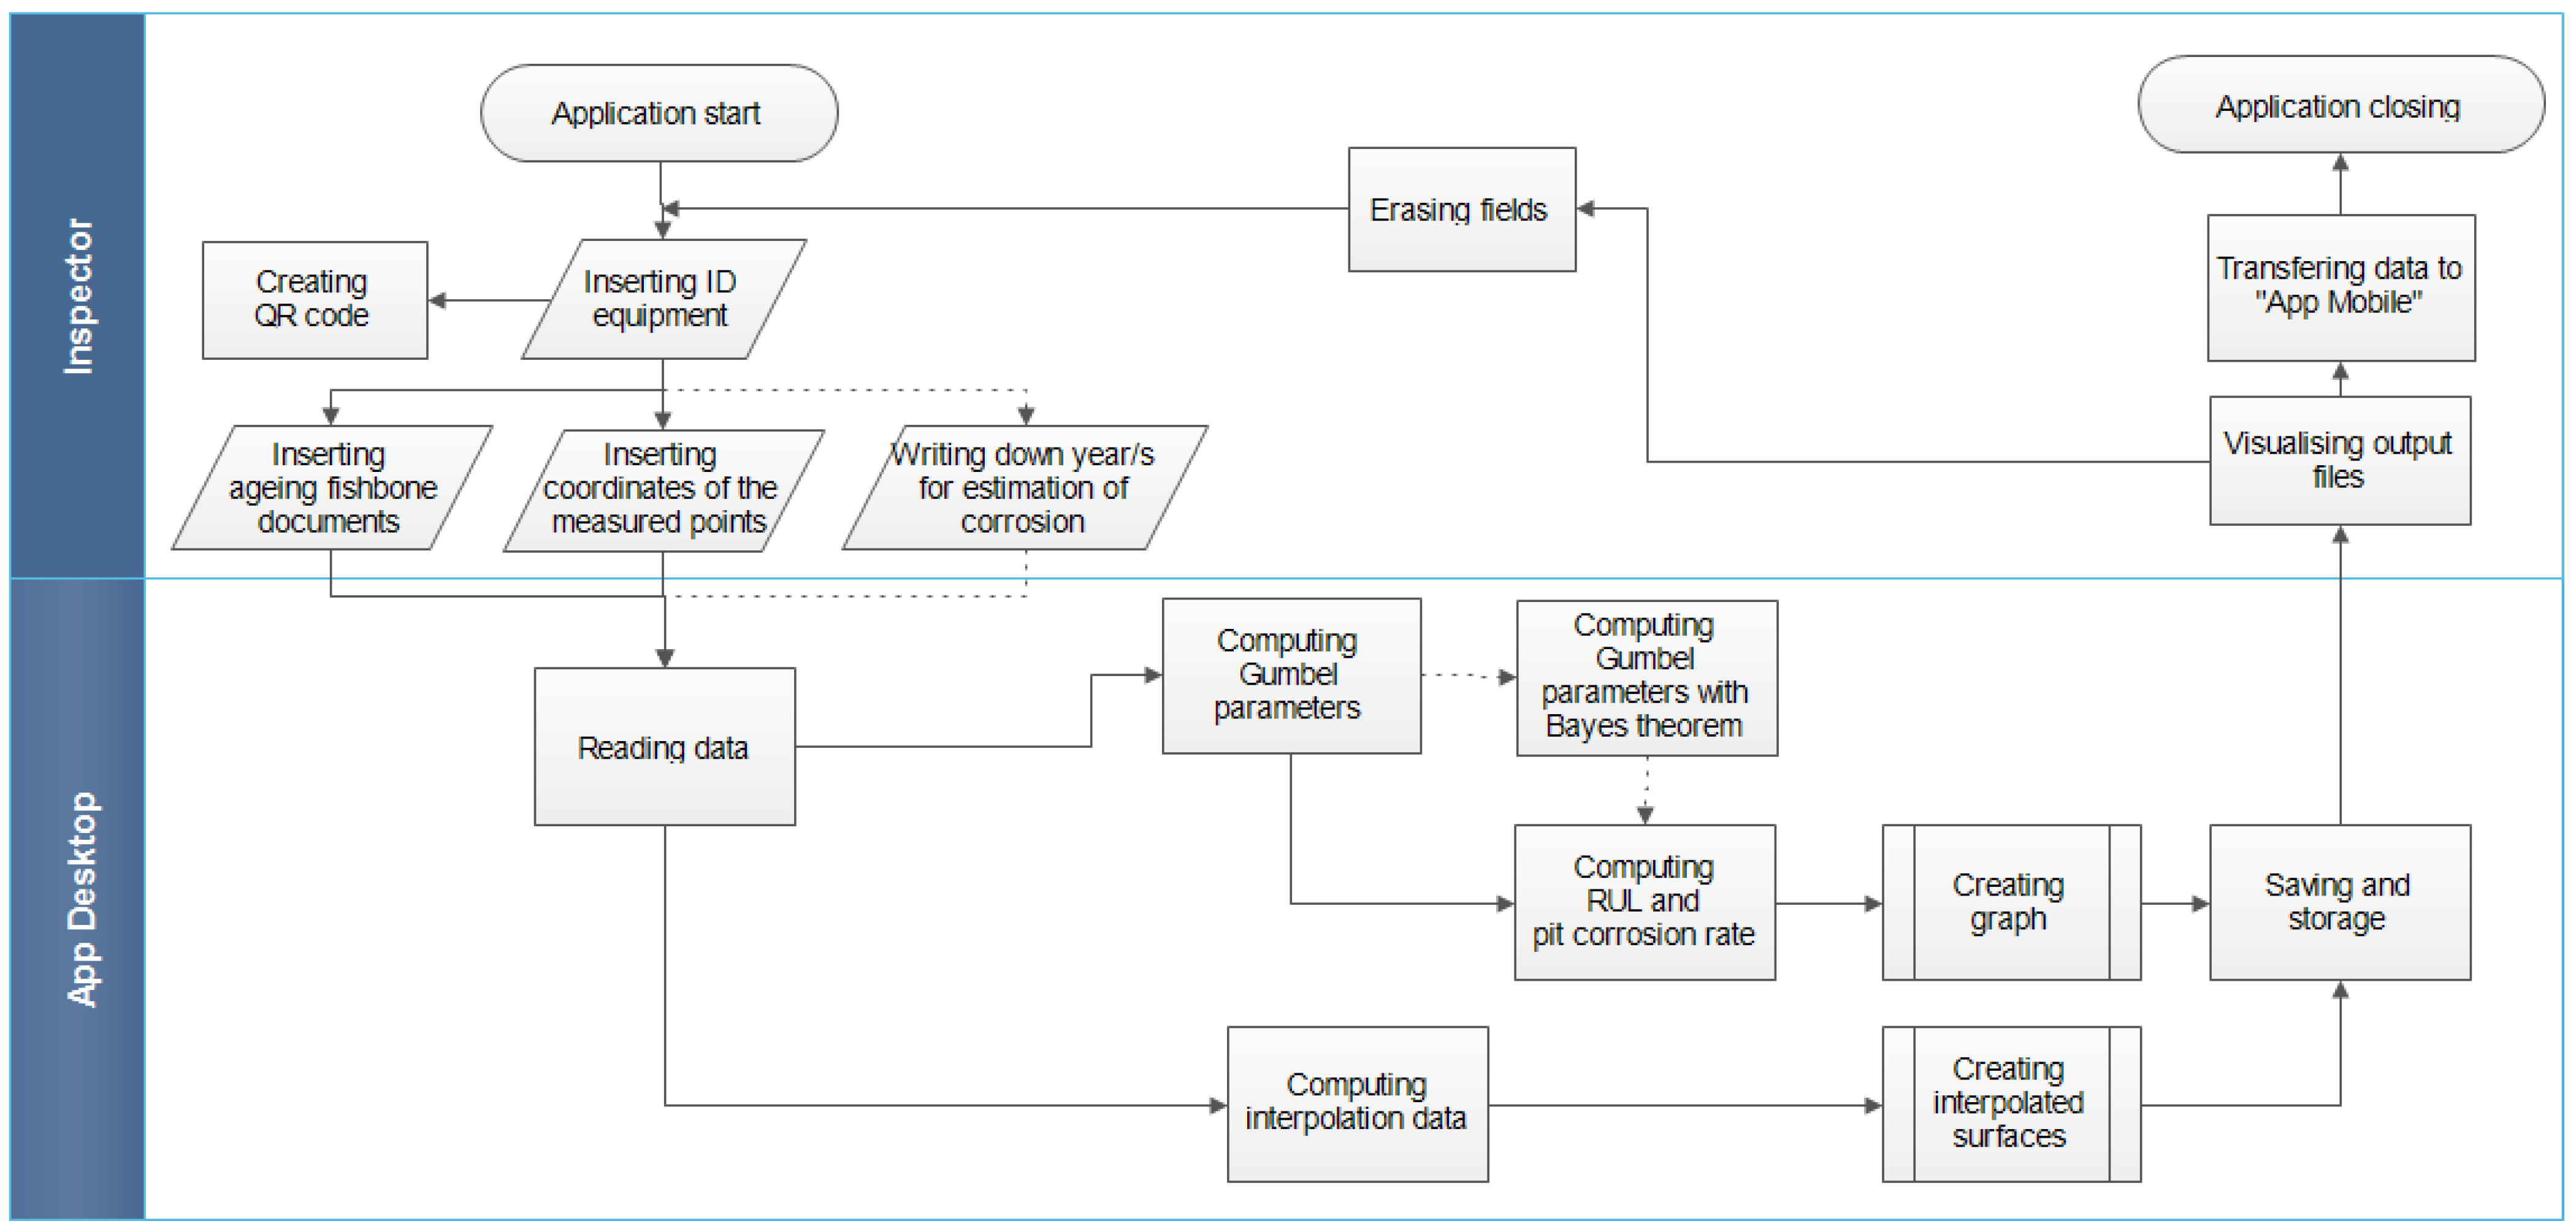
2.1. Methodology for Ageing Monitoring and Prediction

The methodology for the ageing monitoring and prediction consists of the three steps, shown in Figure 1. In the first phase, the data for the definition of the ageing conditions of the equipment are collected from various sources (e.g., thickness measurements of the material’s equipment, accelerating and slowing down factors with respect to the ageing, etc.). After being acquired, these data are pre-processed (second phase) to be ready for the subsequent phase (processing). The data processing (third phase) consists of the execution of the above-mentioned models.
The outputs of these models can be displayed by using a PC, which is the common way to view the results, or by means of a smartphone, a tablet, or finally, by a wearable device, such as smart glasses. A QR code (placed on the equipment) is used as marker for the equipment identification and to associate the elaborated outcomes. Smart glasses allow an increased view of the produced information to be displayed by overlapping the iso-level corrosion maps on the surface of the corresponding equipment (augmented reality); other outputs are accessible through tables and graphs and shown on the sides of the equipment. The third phase includes the data storage.

2.2. Hardware

The hardware used for the construction of the virtual sensor includes:
  • PC with CPU: Intel® Core™ i5 (3 GHz); RAM DDR4: 16 GB, connectivity: USB Type C™, Wi-Fi 6, Bluetooth® 5; operative system: Windows 10 pro 64 bit;
  • Smartphone with operating system: Android v.11, compatible with Google Play Service for AR;
  • Smart glasses: Epson Moverio BT-40S.

2.3. Software

The programming language used to create the App Desktop was Python [47], along with some of its support libraries such as Matplotlib [48] for the creation of graphs, Numpy [49] and Pandas [50] for data processing, and PyKrige [51] for data interpolation through the kriging technique. Several different types of technology were used to realise the mobile application:
  • Unity 2021.1.13.f1, which is a multiplatform graphic engine, allowed us to create interactive content and live 3D visualisation [52];
  • The C# programming language was used within Unity to make the content dynamic and allow the user to interact with it;
  • Blender 2.93 [53] was used as software for modelling and was chosen to reproduce the equipment to study and upload the 3D model on Unity.

3. Development of a User-Friendly Interface of the Virtual Sensor

The development of the interface for the virtual sensor is based on a procedure that aims at the reduction in errors due to HMI. It consists of:
  • Virtual sensor testing;
  • Assessment of human–machine interaction and identification of criticalities in human–machine interaction;
  • Interface development;
  • Virtual sensor testing.

3.1. Human–Machine Interaction

Figure 2 shows the flow diagram of the interaction between the inspector (user) and the App Desktop. The dotted line indicates a path that can be omitted, i.e., the case when the user does not elaborate future estimates but only visualises the corrosion surface and the parameters related to the current and past inspections. Figure 3 illustrates the interaction between the inspector and the App Mobile.
To use the virtual sensor, the inspector starts the App Desktop and enters the equipment ageing data. This requires that he/she uploads:
  • the Excel files of the inspection carried out by means the ageing fishbone model [21] (ageing index method, whose application is suggested by the Italian Ministry of the Environment);
  • the text files containing the thickness measurements sampled during the inspections with the relative spatial coordinates.
Finally, the inspector can choose whether to elaborate information relating only to the current state of the equipment, to the past, or to the future, i.e., by referring to the dates of the previous inspections or selecting from 1 to 5 different future years. He/she can choose to also produce the estimates of the ageing-related metrics (critical pit probability, RUL, corrosion rate, etc.) and the corrosion surfaces at the same time.
Then, the application reads and codes these data, processes them according to the implemented models (see Section 2.1), and creates graphs and tables of the ageing parameters for a selected year. Once the processing is complete, the application automatically stores the documents in the defined path. Next, the inspector can visualise the information produced to migrate it to the App Mobile, or reset the interface fields to make a new entry and perform a new process. A further operation that the inspector can perform by using the App Desktop, after entering the name of the equipment, is the generation of the QR code to be placed close to the equipment to be examined if it has not been coded yet. The final step is to exit the App Desktop and then start the App Mobile.

3.2. Interface Testing

To test the virtual sensor, a hydrocarbon storage tank included in a tank farm was selected. The vessel is an atmospheric tank with a fixed roof made of carbon steel and containing diesel. It has been operating for over 55 years. Two bottom inspection datasets from different years were available (1990 was the first inspection year and 2019 the second one). During both inspections, the thickness was measured at a number of points. The nominal thickness of the bottom is 8 mm, while the minimum detected thickness was 6.1 mm in 1990 and 2.8 mm in 2019. Figure 4 shows the location of the sampled points on the tank bottom.
A 3D model of the vessel was created as a basic support for the AR, and was adapted to be overlapped on a miniature of the storage tank that is available in the laboratory of the TREES-MAT (Technology and Research on Energy, Environment and Safety Materials) Group of the University of Messina. Figure 5 shows the 3D model created.
A safety walk was carried out in order to observe the inside of the tank in AR. A “safety walk” is an inspection of a unit of an establishment, which has the aim of checking the conditions from a safety point of view. In this manuscript, the AR results are shown by overlapping them on a photograph of the tank in its real location.

4. Results

4.1. Identification of Criticalities in Human–Machine Interaction

The tests were carried out by at least 40 users by using the miniature of the tank described in [42]. The results were homogenous by referring to three groups classified as follows: group 1 users with a strong background in computer science but no background in safety, group 2 users with only knowledge of safety and chemical plants, and group 3 users with solid experience in computers science and safety. The usability tests were conducted by carrying out a safety walk in the laboratory and asking participants to list the critical issues that emerged during the use of the virtual sensor.
The following criticalities were highlighted:
  • the migration from the App Desktop to the App Mobile was complex and possible only for experts in informatics;
  • the App Mobile had a very crowded interface, with limited space for AR visualisation;
  • the use of a mobile phone to give instructions to the virtual sensor caused the distraction of the user.

4.2. Interface Development

The critical issues highlighted led to the development of a user-friendly interface. Figure 6 illustrates a preview of the main elements, included in the interface of both the desktop and the Mobile applications, in order to manage the criticalities highlighted during the testing of the virtual sensor.
The GUI of the App Desktop is used to generate the information, which is subsequently overlapped via AR. It allows the creation of a dedicated space for the data storage of the equipment to be inspected, i.e., a folder identified with the name or the code of the equipment. It has a section dedicated to entering the historical data about ageing, i.e., the ageing fishbone files and the collected thicknesses at the different points from previous inspections. A box where it is possible to enter the year (or years) for which the parameters related to deterioration are expected to be estimated is included, as well as a section dedicated to the calculation.
The GUI of the App Mobile was designed to be very minimalist to leave as much free space as possible on the display to frame the objects by means of the camera. This view also allows other information to be shown by AR.
The App Desktop performs the data processing and management. It enables the user to load the input data in the system and to migrate them to the model, then to elaborate and store the outputs.
The interface of the App Desktop (Figure 7a) includes six fields to enter text and eight buttons acting as described below. The interface of the App Mobile essentially has only three buttons (Figure 7b), to leave the screen free from useless elements that could interfere with the AR vision. AR consists of the overlapping of the outputs on the reality framed by the camera in the right position.
Table 1 reports the description of the functionalities for each button (or input box) included in the App Desktop interface.
Before using the app, other configurations must be made directly in the “config_vs” file (located in the software folder); these are (i) the substance contained in the equipment; (ii) the nominal thickness of the equipment material (bottom of the tank), (iii) the knowledge derived from previous inspections of similar equipment (i.e., the parameters of the probability distribution function, for details see [42]); (iv) the number of inspections carried out for the tank.
The App Mobile allows the visualisation of the outputs, also in augmented reality, on-field (during a safety walk). The app permits recognising the equipment and superimposing the iso-contour corrosion maps, the table containing the ageing parameters, and other general information about the equipment (such as name, identification code, substance contained, year of commissioning or reconditioning). As mentioned above, its GUI has only three buttons, since the sensors of the mobile device (e.g., position sensor, etc.), allow, following the physical movement of the inspector, the exploration of the equipment in a fluid and immersive way. The buttons, on the other hand, permit the selection of the year for which the inspector wants to know the ageing metrics and the corrosion map, to make the equipment parts transparent (those not analysed), and finally, to choose the graph to be visualised.
After the improvement of the GUI, the virtual sensor was tested again by the same users. The data migration step was automatised and the elements of the App Mobile were reduced in number and dimensions (according to the users’ suggestions). The users found the new version very user-friendly. The issue related to the use of a mobile device to give instructions to the virtual sensor is still not solved because this requires the introduction of other technologies or a further improvement of the software. (i.e., the finger on the screen of the mobile device should leave a trace in such a way that the inspector, while looking at the smart glasses, is aware about the position of his/her finger on the screen). Voice command could be another potential way to manage the graphical interface. The use of vocal registrations could be another possible implementation to collect useful information on-field. The consideration above is not an obstacle to the adoption of the technology for the proposed scope, but it represents a potential future development of this research.

4.3. Augmented Reality Results

Figure 8 shows some screenshots of the results provided by the virtual sensor during an inspection made for the case study. The first operation to be carried out to use the virtual sensor is to frame the QR code of the equipment (Figure 8a). The code is positioned at a certain distance and at a certain height, depending on the orography of the territory as well as the arrangement of the unit of the establishment, to allow an easy overview during the walk of the inspector inside the plant. The device instantly recognises the vessel and shows the 3D model of the tank on the display in AR (Figure 8b). The colour of the equipment depends on its ageing state, i.e., the value of the ageing index during the last inspection; a legend to identify this state is available above the tank. Subsequently, by clicking on the “Visualizza fondo” (which translates to “View bottom”) button at the top of the interface (Figure 8c), all the slabs making up the mantle and roof of the 3D model become transparent, even if the structure of the tank remains visible; at the same time, an iso-contour map is overlapped on the bottom, which represents the corrosion surface associated with the last performed inspection. The next step is to choose the year (past or future) for which the corrosion trend must be estimated (Figure 8d); this can be chosen by means of a pop-up menu on the bottom left button. For the same year, the ageing-related metrics (the corrosion rate, the pit density, the RUL, the probability of the critical pit, the ageing index, and the updated failure rate) and other general equipment information (name of the tank and the stored substance) are also displayed in a table placed on the right side of the equipment (Figure 8e). Finally, the last step of the use of the App Mobile concerns the visualisation of the graphs showing the trend of the ageing index, the corrosion rate, and the failure frequency vs. the time (year); this can be achieved by using a small pop-up menu on the “Graphics” button at the bottom right of the GUI (Figure 8f).
For each movement of the inspector (i.e., the movement of the camera), the AR view updates according to the movement; for example, it allows zooming when he/she is approaching the framed area or shrinking if he/she moves away.
The dots that can be observed on the tank bottom maps in Figure 8f are not the sampled points, but a graphical representation of the pit density, which increases over time due to the worsening of the material due to the corrosion [42]. The number of points displayed is correlated with the scale parameter of the distribution probability function used to model the phenomenon (note that for each 0.1 increment in the scale parameter, there is an increase of 50 points randomly scattered and displayed on the map).
Some considerations must be made about the image resolution. It is certainly conditioned by the number of sampled points (points where the measurement was made during the last inspections). To obtain better results, a geostatistical technique (i.e., kriging) was used to interpolate or predict values at unsampled places in space [54]. This technique is based on a statistical model that evaluates the spatial autocorrelation of the data and estimates the value of a variable at a given location by combining nearby measured values of that variable and assigning them weights based on the spatial correlation between them. Weights are determined using a variogram or covariance function.
The accuracy of the AR overlay depends on the technique used to implement AR in the virtual sensor. The tracking Image technique (contained within Unity) was used. For this purpose, a grid composed of a large set of vertices was created. The grid is a circumference with its centre at the origin of the axes (0, 0), which coincides with the centre of the bottom of the tank, and has a radius of 1. The dimensions of the real bottom are readapted to this grid. This allows the sampled points to be inserted inside the image in the correct position with respect to the centre.
The accuracy of the RUL estimation is related to the corrosion model. It is derived from experimental tests when numerous inspection data are not available. These tests reproduce the conditions inside the tanks for the specific case study (i.e., fuel, impurity, trend of temperature, bottom material, etc.). The corrosion rate is correlated with the measure of the thickness of the samples of the bottom tank carried out in the laboratory. A microscope was used to measure the depth of the pits, but clearly, in a real case (i.e., tank miniature and large storage tank), it is not possible to use such an instrument and the accuracy is related to techniques applied (i.e., ultrasound or magnetic flux leakage).
The visualisation of the corrosion map, combined with the estimation of the RUL and the other ageing-related parameters, allows the inspector to focus attention on the critical points when he/she is on-field. The whole system (virtual sensor) makes it possible to combine visual deductions with forecasts obtained from the models in order to understand the real expected evolution of the phenomenon, also on the basis of how it is managed.

4.4. Discussion

A comparison with other solutions that use AR in the inspection sector has been made. The virtual sensor allows the equipment integrity to be controlled, while other widespread systems support checking the correct connection of fittings and performing routine maintenance by using information superimposed on the equipment. The developed sensor shows the information that is useful for quantifying ageing metrics and permits the integration of new information acquired on-field. In this way, new information can be annotated without using a paper notebook, and such information is included in the application, which appropriately organises the input file for the models. then, it is also possible to process input data in order to elaborate ageing indexes and generate iso-corrosion maps. The advantage is having a lot of information, in tabular and visual form, through a minimalist and intuitive interface. This availability would not otherwise be possible on-field because this information is generally archived on paper.
In summary, the comparison with AR solutions reported in the literature shows similarities with the use of AR in the virtual sensor. These are related to the opportunity to overcome the limit of using paper-based annotations during inspections and to help operators in performing tasks and operations by the addition of information to the real work environment. This is possible without adding new risks for the worker. As regards the monitoring and assessment of equipment ageing, the virtual sensor appears to use AR in an innovative way within the inspection sector.
Based on what has been discussed above, the virtual sensor appears innovative as there are no AR-based tools for the monitoring and assessment of equipment ageing. This allows the virtual sensor to be positioned within the broader context of existing systems but with this specific peculiarity. The virtual sensor helps in running numerical models for ageing assessment, the application of some of which is useful to the establishment operator in order to comply with the Seveso legislation. The evaluation of the adequacy of ageing management is a crucial matter, especially when the equipment is close to the end of its lifetime. Therefore, having tools that help in the acquisition and management of input data to the models represents a valid support for the operator. Unfortunately, the use of these tools requires experimental validation tests in the laboratory to ensure that their development does not introduce new risks, such as those associated with human–machine interaction. The test results of the virtual sensor demonstrated the effectiveness of the support provided by the system to the inspector. This effectiveness was quantified through interviews with the users. The questions led to the following evidence: (1) the system allows the operator to be able to manage a lot of information and to combine visual deductions with forecasts obtained from the models, in order to understand the real expected evolution of the phenomenon, also on the basis of how it is managed. (2) the developed interface allows the information to be managed without creating confusion for the user.

5. Conclusions

The scientific literature and websites of various companies developing AR technologies to support industrial activities do not mention the use of the technology for ageing inspections of critical equipment. Current AR applications are designed for the training of workers. In addition, AR is commonly used in equipment maintenance and repair, which can be through displaying guides and operative instructions concerning assembly/disassembly especially in places that are difficult to access. Based on this evidence, AR use proposed in this work is definitely innovative.
The virtual sensor is a useful tool for the inspector as well as for the establishment operator to access information that could be needed on-field during inspections. AR provides information about the condition of parts of the equipment that cannot be captured during a visual inspection. Other advantages are related to the elaboration of ageing-related metrics, and their update and storage. The virtual sensor supports performing these operations for all the equipment included in the establishment.
In this work, the system, which was developed in a previous version, was improved to make its GUI more user-friendly. The investigation of the HMI supported the implementation process and allowed the improvement of the usability of the software by making it accessible, even to personnel that are not experts in advanced technologies.
Currently, the virtual sensor is designed to inspect very large storage tanks for the management of the integrity of some parts of this type of equipment. In particular, the bottom of the tank is not easy to monitor, as its inspection requires the vessel to be emptied and then cleaned to carry out the thickness measurements. These activities are executed at long time intervals to avoid extended stops and repeated exposure of the inspector to unhealthy environments. The use of this system aims to extend the inspection interval by means of the estimation of the expected conditions. The virtual sensor is a particularly useful tool for the inspector, who can benefit from further information during a safety walk, beyond that captured through a direct observation.
In addition, the current experimentation has been carried out in the laboratory. Therefore, to address how the terrain and the weather conditions could affect the accuracy and effectiveness of the use of the technology, it is necessary to test it in a real establishment (future development of the system).
By means of the laboratory tests, it has been possible to improve the system and its GUI. However, larger-scale implementation requires further improvements. Using mobile devices suitable for difficult environments (e.g., explosive atmospheres) and the ability to work without using wireless connections are both necessary. There may be problems related to scalability, i.e., related to the framing of very extensive equipment, for which it will be necessary to study appropriate solutions. The use of more recent models of smartphones and smart glasses will improve the performance. However, it becomes necessary to update the part of the software that manages the transfer between the App Desktop and the App Mobile. As far as costs are concerned, a preliminary estimate suggests a total expense that includes the cost of smartphones, smart glasses, and software and its maintenance. There are limitations associated with different types of equipment, mainly related to the geometry and complexity of the systems, where it may be difficult to distinguish one piece of equipment from another. The complexity refers to systems with multiple walls or undulating surfaces or with complex intersections, which causes a crowded view. In addition, the virtual sensor appears especially significant in cases where it is difficult to interrupt system operating to monitor a part of it (as in the case of tank bottoms).

Author Contributions

Conceptualisation, G.A., R.S., G.F., P.B. and M.F.M.; methodology, G.A., R.S. and M.F.M.; software, R.S.; validation, M.F.M., G.F. and P.B.; formal analysis, G.A. and R.S.; investigation, G.A. and R.S.; resources, M.F.M.; data curation, G.A. and R.S.; writing—original draft preparation, G.A.; writing—review and editing, M.F.M.; visualisation, R.S. and G.A.; supervision, G.F., P.B. and M.F.M.; project administration, M.F.M.; funding acquisition, M.F.M. All authors have read and agreed to the published version of the manuscript.

Funding

This research was funded by INAIL, project DYN-RISK (BRiC 2019/ID2).

Institutional Review Board Statement

Not applicable.

Informed Consent Statement

Not applicable.

Data Availability Statement

Not applicable.

Conflicts of Interest

The authors declare no conflict of interest.

References

  1. Brettel, M.; Friederichsen, N.; Keller, M.; Rosenberg, M. How virtualization, decentralization and network building change the manufacturing landscape: An Industry 4.0 perspective. Int. J. Inf. Commun. Eng. 2014, 8, 37–44. [Google Scholar]
  2. Liu, Z.; Xie, K.; Li, L.; Chen, Y. A paradigm of safety management in Industry 4.0. Syst. Res. Behav. Sci. 2020, 37, 632–654. [Google Scholar] [CrossRef]
  3. Gisbert, J.R.; Palau, C.; Uriarte, M.; Prieto, G.; Palazón, J.A.; Esteve, M.; Moyano, A. Integrated system for control and monitoring industrial wireless networks for labor risk prevention. J. Netw. Comput. Appl. 2014, 39, 233–252. [Google Scholar] [CrossRef]
  4. Beetz, M.; Bartels, G.; Albu-Schäffer, A.; Bálint-Benczédi, F.; Belder, R.; Beßler, D.; Haddadin, S.; Maldonado, A.; Mansfeld, N.; Wiedemeyer, T.; et al. Robotic agents capable of natural and safe physical interaction with human co-workers. In Proceedings of the 2015 IEEE/RSJ International Conference on Intelligent Robots and Systems (IROS), Hamburg, Germany, 28 September–2 October 2015; pp. 6528–6535. [Google Scholar]
  5. Podgorski, D.; Majchrzycka, K.; Dąbrowska, A.; Gralewicz, G.; Okrasa, M. Towards a conceptual framework of OSH risk management in smart working environments based on smart PPE, ambient intelligence and the Internet of Things technologies. Int. J. Occup. Saf. Ergon. 2017, 23, 1–20. [Google Scholar] [CrossRef] [Green Version]
  6. Zhang, Y. Diagnosis and Detection Method of Critical Equipment Failure Based on Electronic Nose Technology. Chem. Eng. Trans. 2018, 68, 241–246. [Google Scholar]
  7. Nadai, N.; Melani, A.H.A.; Souza, G.F.M.; Nabeta, S.I. Equipment failure prediction based on neural network analysis incorporating maintainers inspection findings. In Proceedings of the Annual Reliability and Maintainability Symposium (RAMS), Orlando, FL, USA, 23–26 January 2017. [Google Scholar]
  8. Liu, R.; Yang, B.; Zio, E.; Chen, X. Intelligenza artificiale per la diagnosi dei guasti delle macchine rotanti: Una revisione. Sist. Mecc. Ed Elabor. Del Segnale 2018, 108, 33–47. (In Italian) [Google Scholar]
  9. Ersöz, O.Ö.; Inal, A.F.; Aktepe, A.; Türker, A.K.; Ersöz, S. A Systematic Literature Review of the Predictive Maintenance from Transportation Systems Aspect. Sustainability 2022, 14, 14536. [Google Scholar] [CrossRef]
  10. Wee, D.; Kelly, R.; Cattel, J.; Breunig, M. Industry 4.0-How to Navigate Digitization of the Manufacturing Sector; McKinsey & Company: Munich, Germany, 2015; p. 58. [Google Scholar]
  11. Carra, S.; Monica, L.; Vignali, G. Decision Making Approaches for Safety Purposes in Working Environments with Human-Technology Interaction. In Proceedings of the 31st European Safety and Reliability Conference, Angers, France, 19–23 September 2021. [Google Scholar]
  12. Brocal, F.; González, C.; Komljenovic, D.; Katina, P.F.; Miguel, A.; Sebastián, M.A. Emerging risk management in Industry 4.0: An approach to improve organizational and human performance in the complex systems. Complex. Manuf. Process Syst. 2019, 2019, 2089763. [Google Scholar] [CrossRef] [Green Version]
  13. Siemieniuch, C.E.; Sinclair, M.A.; Henshaw, M.D. Global drivers, sustainable manufacturing and systems ergonomics. Appl. Ergon. 2015, 51, 104–119. [Google Scholar] [CrossRef] [Green Version]
  14. EU Council. Directive 2012/18/EU on the control of major-accident hazards involving dangerous substances. Off. J. Eur. Union 2012, L197, 1–37. [Google Scholar]
  15. Ansaldi, S.M.; Agnello, P.; Bragatto, P.A. Smart safety systems: Are they ready to control the hazard of major accidents? WIT Trans. Built Environ. 2018, 174, 169–180. [Google Scholar]
  16. Bragatto, P.A.; Pirone, A.; Gnoni, M.G. Application of RFID technology for supporting effective risk management in chemical warehouses. In Safety, Reliability and Risk Analysis: Beyond the Horizon; Taylor & Francis Group: London, UK, 2014. [Google Scholar]
  17. Ancione, G.; Kavasidis, I.; Merlino, G.; Milazzo, M.F. Real-time guidance system for cranes to manage risks due to releases of hazardous materials. In Risk, Reliability and Safety: Innovating Theory and Practice; Taylor & Francis Group: London, UK, 2017. [Google Scholar]
  18. Gnoni, M.G.; Elia, V.; Bragatto, P.A. An IOT based system to prevent injuries in assembly line production systems. In Proceedings of the IEEE International Conference on Industrial Engineering and Engineering Management (IEEM), Bali, Indonesia, 4–7 December 2016; pp. 1889–1892. [Google Scholar]
  19. Mennuti, C.; Augugliaro, G.; De Petris, C.; Cardarilli, G.; Di Nunzio, L.; Fazzolari, R. Tecniche per la localizzazione di danni strutturali per mezzo di AE: Algoritmi e possibili soluzioni HW per WSN. In Proceedings of the SAFAP Conference, Milan, Italy, 15–6 November 2016. (In Italian). [Google Scholar]
  20. Arena, F.; Collotta, M.; Pau, G.; Termine, F. An Overview of Augmented Reality. Computers 2022, 11, 28. [Google Scholar] [CrossRef]
  21. Egger, J.; Masood, T. Augmented reality in support of intelligent manufacturing—A systematic literature review. Comput. Ind. Eng. 2020, 140, 106195. [Google Scholar] [CrossRef]
  22. Lu, X.; Zhang, J.; Chen, K.; Ma, D.; Zhang, Y.; Wan, Y. Efficiency and Safety Improvement of Power Equipment Smart Inspection and Operation via Augmented Reality Glasses based on AI Technology. In Proceedings of the 4th World Symposium on Artificial Intelligence (WSAI), Jilin, China, 23–25 June 2022; pp. 18–23. [Google Scholar]
  23. Garcia, C.A.; Naranjo, J.E.; Ortiz, A.; Garcia, M.V. An Approach of Virtual Reality Environment for Technicians Training in Upstream Sector. IFAC-PapersOnLine 2019, 52, 285–291. [Google Scholar] [CrossRef]
  24. Salman, N.; Colombo, S.; Manca, D. Testing and Analyzing Different Training Methods for Industrial Operators: An Experimental Approach. In Computer Aided Chemical Engineering; Kraslawski, A., Turunen, I., Eds.; European Symposium on Computer Aided Process Engineering; Elsevier: Amsterdam, The Netherlands, 2013; Volume 32, pp. 667–672. [Google Scholar]
  25. Koteleva, N.I.; Zhukovskiy, Y.L.; Valnev, V. Augmented Reality Technology as a Tool to Improve the Efficiency of Maintenance and Analytics of the Operation of Electromechanical Equipment. J. Phys. Conf. Ser. 2021, 1753, 012058. [Google Scholar] [CrossRef]
  26. Website Infosys.com. ‘AR & VR Technology-Solving Many Core Oil & Gas Challenges’. Available online: https://www.infosys.com/insights/industry-stories/ar-vr-in-oil-gas.html (accessed on 10 May 2023).
  27. Website Nsflow.com. ‘Augmented Reality (AR) Training Platform in Oil and Gas Industry’. Available online: https://nsflow.com/industries/augmented-reality-in-the-oil-gas-industry#industry (accessed on 10 May 2023).
  28. Website www.fusionvr.in. ‘Augmented Reality Solutions for Chemicals, Oil & Industries’. Available online: https://www.fusionvr.in/ar-chemicals-oil-and-gas (accessed on 10 May 2023).
  29. Website of Council of Petroleum Accountants Societies. ‘The Use of Augmented Reality in the Oil and Gas Industry’. Available online: https://copas.org/augmented-reality-oil-and-gas-industry/ (accessed on 10 May 2023).
  30. Yang, L.I.Z.; Zhang, D.S.; Bang, D.U.Y. An Intelligent Safety Inspection System Based on AR Technology. J. Beijing Univ. Chem. Technol. 2022, 49, 59. [Google Scholar]
  31. Romero, D.; Stahre, J.; Taisch, M. The Operator 4.0: Towards socially sustainable factories of the future. Comput. Ind. Eng. 2020, 139, 106128. [Google Scholar] [CrossRef]
  32. Marino, E.; Barbieri, L.; Colacino, B.; Kum Fleri, A.; Bruno, F. An Augmented Reality inspection tool to support workers in Industry 4.0 environments. Comput. Ind. 2021, 127, 103412. [Google Scholar] [CrossRef]
  33. Chen, Y.J.; Lai, Y.S.; Lin, Y.H. BIM-based augmented reality inspection and maintenance of fire safety equipment. Automat. Constr. 2020, 110, 103041. [Google Scholar] [CrossRef]
  34. Shin, D.H.; Dunston, P.S. Evaluation of Augmented Reality in steel column inspection. Automat. Constr. 2009, 18, 118–129. [Google Scholar] [CrossRef]
  35. Wickens, C.D.; Hollands, J.G.; Banbury, S.; Parasuraman, R. Engineering Psychology & Human Performance; Psychology Press: New York, NY, USA, 2015. [Google Scholar]
  36. Lee, K. Augmented Reality in Education and Training. TechTrends 2012, 56, 13–21. [Google Scholar] [CrossRef]
  37. Ramakrishna, P.; Hassan, E.; Hebbalaguppe, R.; Sharma, M.; Gupta, G.; Vig, L.; Sharma, G.; Shroff, G. An AR Inspection Framework: Feasibility Study with Multiple AR Devices. In Proceedings of the 2016 IEEE International Symposium on Mixed and Augmented Reality (ISMAR-Adjunct), Merida, Mexico, 19–23 September 2016; pp. 221–226. [Google Scholar]
  38. Vignali, G.; Bertolini, M.; Bottani, E.; Di Donato, L.; Ferraro, A.; Longo, F. Design and Testing of an Augmented Reality Solution to Enhance Operator Safety in the Food Industry. Int. J. Food Eng. 2018, 14, 20170122. [Google Scholar] [CrossRef]
  39. Fjeld, M.; Voegtli, B.M. Augmented chemistry: An interactive educational workbench. In Proceedings of the International Symposium on Mixed and Augmented Reality (ISMAR ’02), Darmstadt, Germany, 1 October 2002. [Google Scholar]
  40. Husár, J.; Knapčíková, L. Implementation of Augmented Reality in Smart Engineering Manufacturing: Literature Review. In Mobile Networks and Applications; Springer: Berlin/Heidelberg, Germany, 2023. [Google Scholar]
  41. Lester, S.; Hofmann, J. Some pedagogical observations on using augmented reality in a vocational practicum. Br. J. Educ. Technol. 2020, 51, 645–656. [Google Scholar] [CrossRef]
  42. Ancione, G.; Saitta, R.; Bragatto, P.; Fiumara, G.; Milazzo, M.F. An Advanced System for the Visualisation and Prediction of Equipment Ageing. Sustainability 2022, 14, 6156. [Google Scholar] [CrossRef]
  43. Ministero dell’Ambiente e della Sicurezza Energetica. Valutazione Sintetica Dell’adeguatezza del Programma di Gestione dell’ Invecchiamento Delle Attrezzature Negli Stabilimenti Seveso. Available online: https://www.mase.gov.it/notizie/valutazione-sintetica-dell-adeguatezza-del-programma-di-gestione-dell-invecchiamento-delle (accessed on 17 April 2023).
  44. Gumbel, E.J. Statistical Theory of Extreme Values and Some Practical Applications. US Department of Commerce, National Bureau of Standards. Appl. Math. Ser. 1954, 33, 1–51. [Google Scholar]
  45. Milazzo, M.F.; Ancione, G.; Bragatto, P.; Mennuti, C. Simplified modelling of the remaining useful lifetime of atmospheric storage tanks in major hazard establishments. Chem. Engineer. Trans. 2020, 82, 175–180. [Google Scholar]
  46. Bailey, T.C.; Gatrell, A.C. Interactive Spatial Data Analysis; Longman Scientific & Technical: Essex, UK, 1995. [Google Scholar]
  47. Website “Python Software Foundation”. Available online: https://www.python.org/ (accessed on 20 January 2023).
  48. Hunter, J.D. Matplotlib: A 2D Graphics Environment. Comput. Sci. Eng. 2007, 9, 90–95. [Google Scholar] [CrossRef]
  49. Harris, C.M. Array programming with NumPy. Nature 2020, 585, 357–362. [Google Scholar] [CrossRef]
  50. McKinney, W. Data structures for statistical computing in python. In Proceedings of the 9th Python in Science Conference, Austin, TX, USA, 28 June–3 July 2010; Volume 445, pp. 9951–9956. [Google Scholar]
  51. Murphy, B.; Müller, S.; Yurchak, R. GeoStat-Framework/PyKrige: v1.6.1. Zenodo 2021. [Google Scholar] [CrossRef]
  52. Haas, J.K. A History of the Unity Game Engine; Worcester Polytechnic Institute: Worcester, MA, USA, 2014. [Google Scholar]
  53. Blender Online Community. A 3D Modelling and Rendering Package; Stichting Blender Foundation: Amsterdam, The Netherlands, 2018; Available online: http://www.blender.org (accessed on 1 February 2023).
  54. Ancione, G.; Bragatto, P.; Milazzo, M.F. Visualization of the Bottom Deterioration of Atmospheric Storage Tanks by Combining Prediction and Interpolation Models. Chem. Eng. Trans. 2022, 91, 271–276. [Google Scholar]
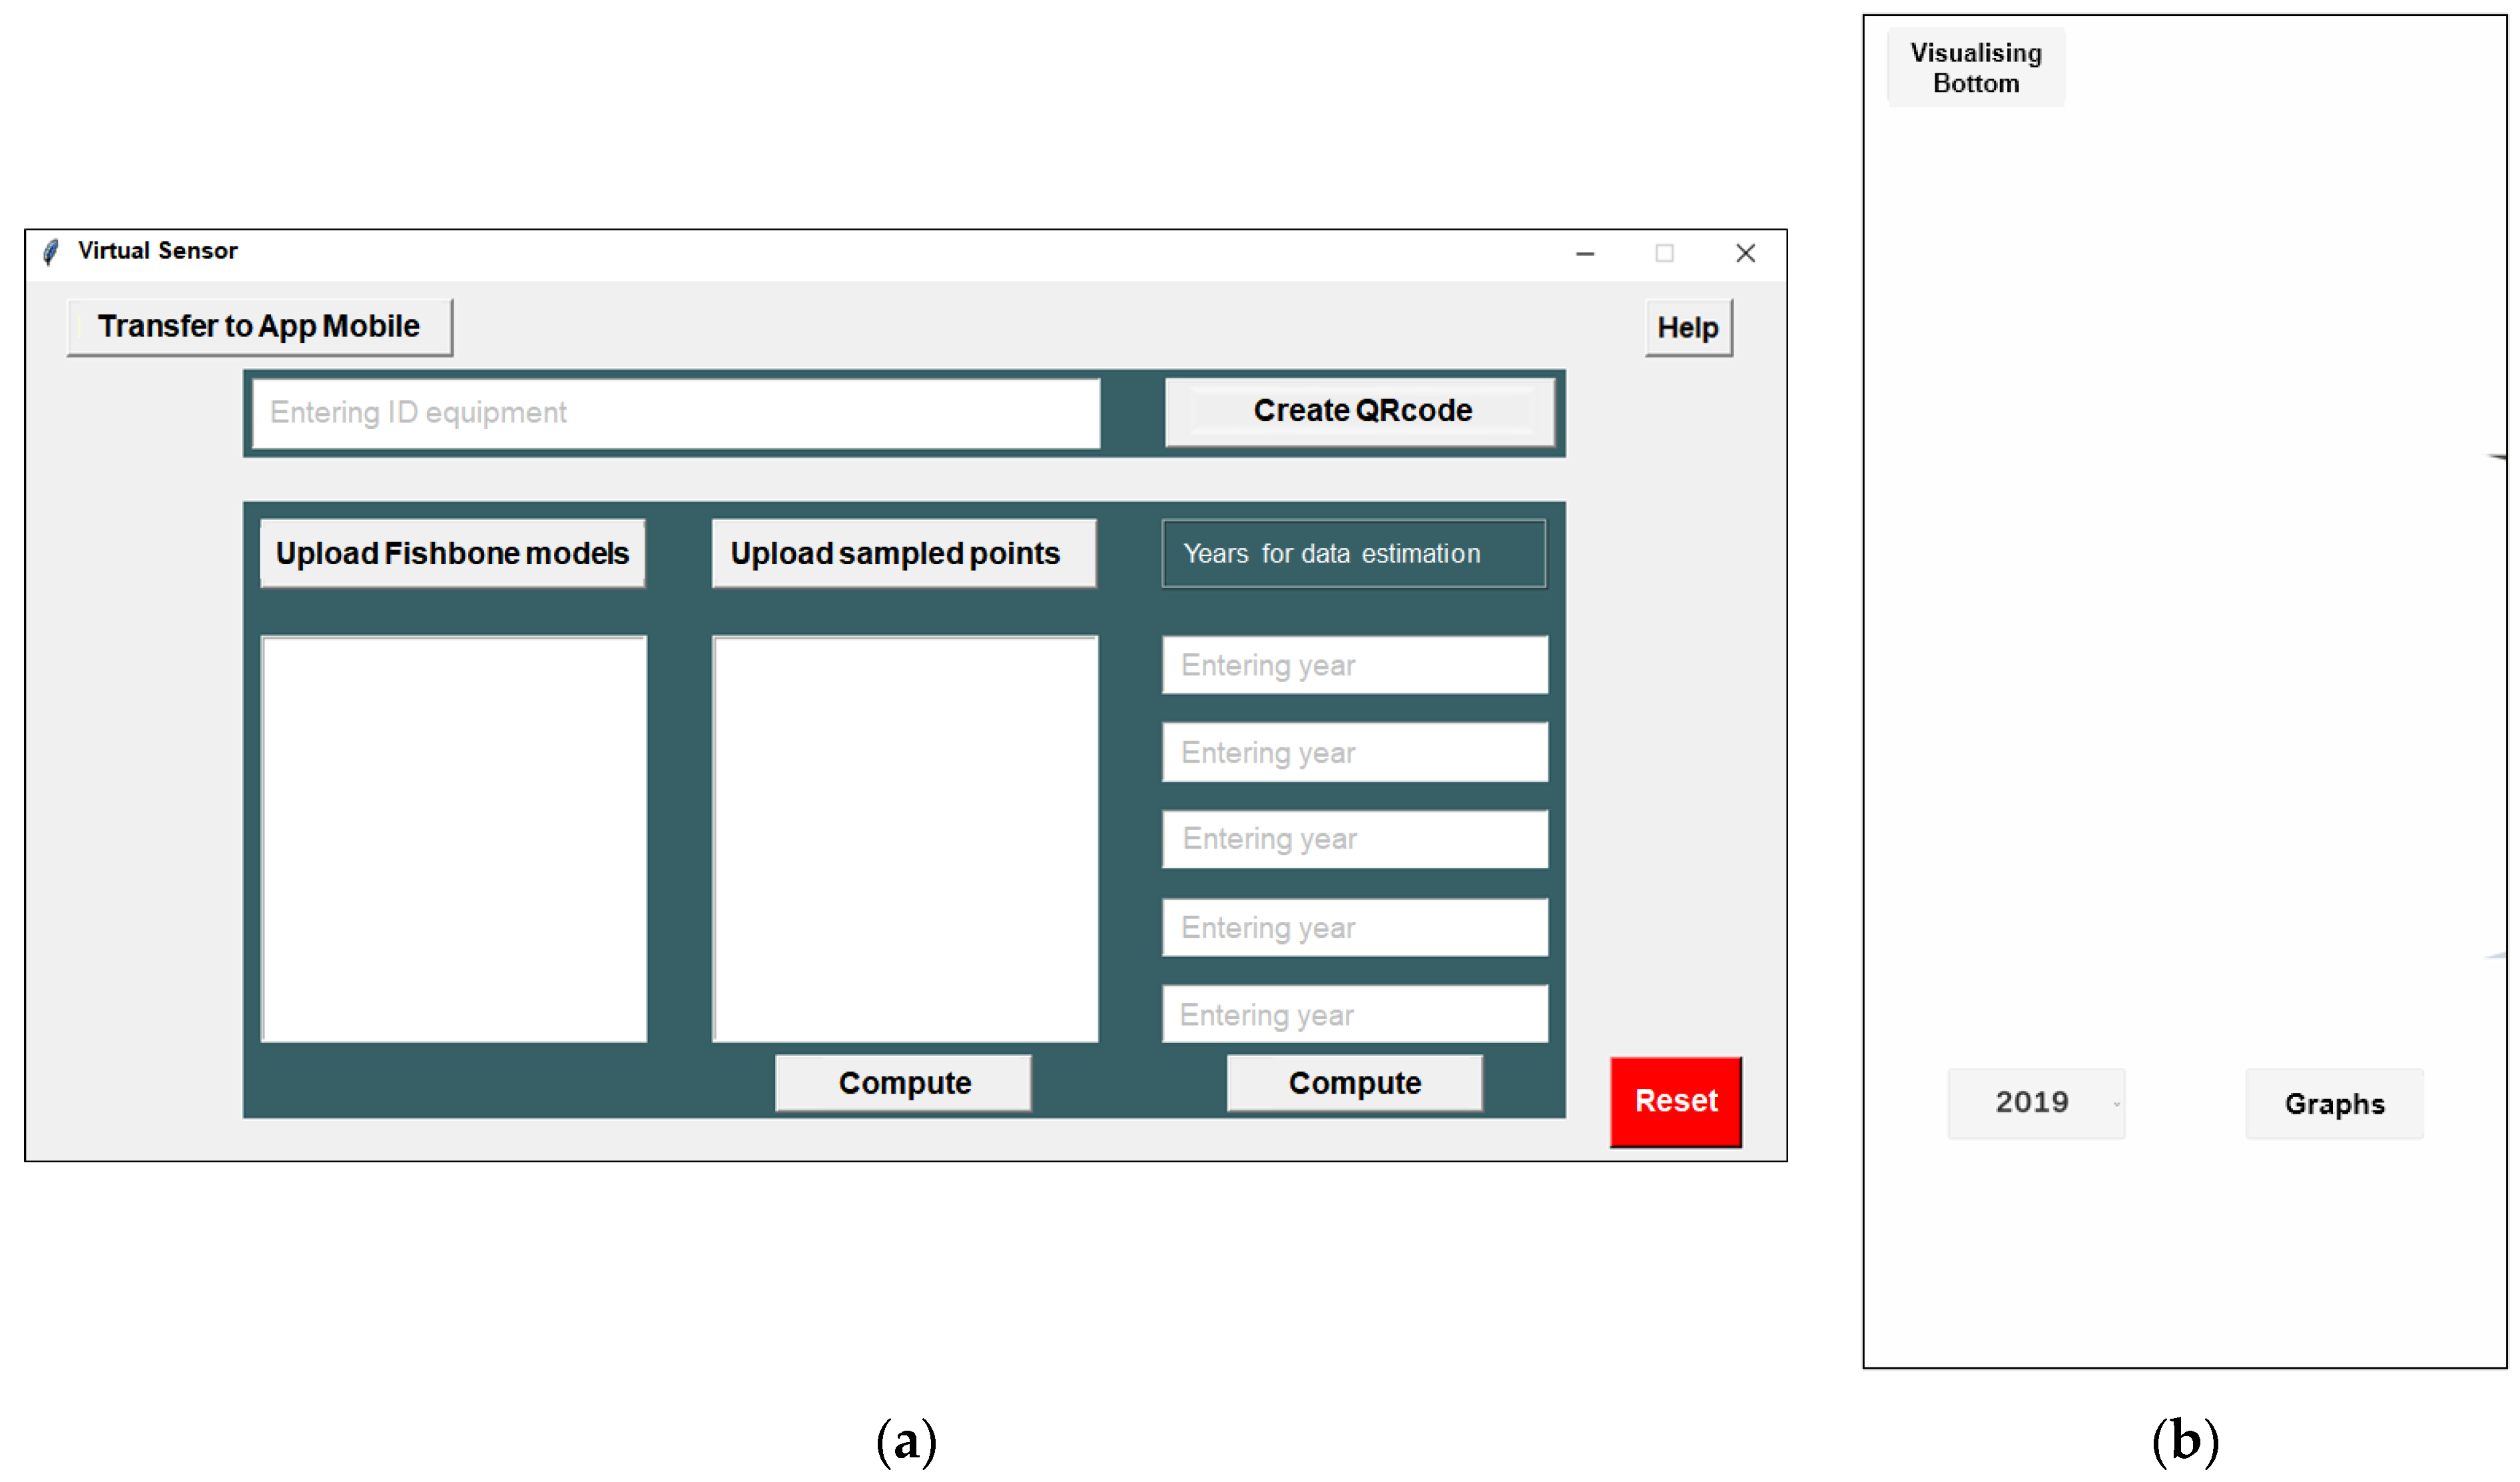
Figure 1. Methodology of data elaboration of the virtual sensor.
Applsci 13 07843 g001
Figure 2. Flow diagram interaction between the inspector and the App Desktop.
Applsci 13 07843 g002
Figure 3. Flow diagram interaction between the inspector and the App Mobile.
Applsci 13 07843 g003
Figure 4. Spatial distribution of sampled points.
Applsci 13 07843 g004
Figure 5. 3D model of the atmospheric storage tank.
Applsci 13 07843 g005
Figure 6. Scheme of the interface: (a) App Desktop, (b) App Mobile.
Applsci 13 07843 g006
Figure 7. GUI of the (a) App Desktop (b) and App Mobile.
Applsci 13 07843 g007
Figure 8. Screenshots of the mobile display visualising augmented reality during a simulated safety walk in the establishment. (a) holistic view of equipment; (b) overlay 3D model; (c) bottom thickness map; (d) thickness map enlargement and scrolling of a pop-up menu; (e) table box information; (f) example of graph given and scrolling of the graphs pop-up menu. Below the translation is given for all the words (or phrases) that appear in this Figure: Visualizza fondo = View bottom. Molto carente = Very lack. carente = lack. Migliorabile = Improvable. adeguato = Adequate. Indice di invecchiamento = Ageing index. Grafici = Graphs. Tra = Between. Anni = Years. Nome serbatoio = Tank name. Sostanza contenuta = Substance contained. Gasolio = Diesel. Anno ispezione = Inspection year. Probabilità di pit critico = Critical pit probability. Velocità di corrosione = Corrosion rate. Indice di pit = Pit index. Chiudi = Close.
Applsci 13 07843 g008
Table 1. Functionality of the buttons included in the App Desktop.
Button (or Text Box)Functionality Description
Transfer to App MobileOutput migration (together with the 3D model of the equipment) from the App Desktop to the mobile device.
HelpTo provide explanation about how to use the app.
Upload fishbone modulesUploading fishbone modules of the equipment. These modules must be uploaded in chronological order.
Upload sampled points (inspection data)Uploading thickness measurements carried out on the equipment associated with the relative spatial coordinates. Files must be uploaded in chronological order.
Create QR codeGeneration of the QR code of the equipment.
Compute (on the GUI’s centre)Calculation of the current condition of the equipment.
Compute (on the GUI’s right)Calculate future condition of the equipment.
ResetTo remove data from all fields.
Entering ID equipmentTo enter the name of the equipment being analysed (this text box must always be filled in).
Year for data estimationTo enter the years for the prediction of the equipment condition.
Disclaimer/Publisher’s Note: The statements, opinions and data contained in all publications are solely those of the individual author(s) and contributor(s) and not of MDPI and/or the editor(s). MDPI and/or the editor(s) disclaim responsibility for any injury to people or property resulting from any ideas, methods, instructions or products referred to in the content.

