Article

The Effect of Red Potato Pulp Preparation and Stage of Its Incorporation into Sourdough or Dough on the Quality and Health-Promoting Value of Bread

1
Department of Carbohydrate Technology and Cereal Processing, Faculty of Food Technology, University of Agriculture in Krakow, 122 Balicka St., 30-149 Krakow, Poland
2
Department of Engineering and Machinery for Food Industry, Faculty of Food Technology, University of Agriculture in Krakow, 122 Balicka St., 30-149 Krakow, Poland
3
Department of Food Storage and Technology, Faculty of Biotechnology and Food Science, Wroclaw University of Environmental and Life Sciences, 37 Chełmońskiego St., 51-630 Wrocław, Poland
*
Author to whom correspondence should be addressed.
Appl. Sci. 2023, 13(13), 7670; https://doi.org/10.3390/app13137670
Submission received: 11 May 2023 / Revised: 19 June 2023 / Accepted: 27 June 2023 / Published: 28 June 2023
(This article belongs to the Special Issue Functional Foods: Bioactivity and Potential Health Effects)

Abstract

:
The quality and health-promoting properties of enriched bread depend not only on the composition of the additive but also on the baking technology. In this study, the preparation (rice flour, maltodextrin, and red potato pulp) was used in the amount of 5% of the flour in the recipe at various stages of bread production, i.e., during sourdough fermentation or dough kneading. The aim of the study was to analyze the effect of adding the preparation containing red potato pulp on the content of polyphenols and the ability to neutralize free radicals, nutritional composition, physical parameters, and quality of wheat–rye bread using two different baking technologies. The preparations made with red potato pulp are an excellent source of bioactive compounds. The breads with preparations added to the sourdough were characterized by greater volume and lower hardness, and higher levels of minerals and dietary fiber than breads with preparations added to the dough. It was found that the breads with preparations added to the dough were characterized by up to 4.5 times more polyphenols, 3.5 times more flavonoids, and 6 times more phenolic acids and flavonols than breads with preparations added to sourdough, which translated into their greater antioxidant potential.

Graphical Abstract

1. Introduction

Many individuals rely on bread as a valuable source of energy and an indispensable staple in their diet. It has been claimed that bread is the basic key element of human nutrition [1,2,3]. Wheat bread is regarded as a basis of human nutrition in many countries. Nevertheless, because of the multiple benefits of rye, there is a range of studies focused on bread prepared with rye sourdough [4]. Bakery products of this type have longer shelf-life, higher nutritional value, and usually better organoleptic properties, including smell and taste [4,5,6,7].
Utilizing sourdough enables the creation of products that possess a more robust aroma, attributed to the metabolic action of lactic acid bacteria, which, in addition to lactic acid, also produce acetic acid, succinic acid, ethyl alcohol, acetoin, diacetyl, acetone, 2,3-butyleneglycol, carbon dioxide, and hydrogen. All these compounds influence the formation of the appropriate structure of the dough, control the enzymatic processes, and enhance the desired flavor and aroma of the bread [8].
The last decade has seen a global trend to use natural substances that are rich in antioxidants to fortify bread. Enriching bread with bioactive ingredients contributes to the pro-health properties of the bread. The most commonly used bioactive ingredients in the production of bread are blackcurrant extract, grape seed extract, ground onion (Allium cepa), ground green coffee beans, red/purple potato flour, sugar beet molasses, pomegranate peel powder, banana pseudo stem flour, yam flour, and apple pectin [3,9,10,11,12,13,14,15,16].
In recent times, there has been an increasing utilization of by-products generated from the processing of fruits and vegetables [17,18,19,20,21], because they are rich in bioactive compounds, and their recycling fits well into the zero-waste trend, occurring recently throughout the world. Among such fruit and vegetable by-products, special attention should be paid to colored potato pulp, remaining after starch processing. Such pulp contains phenolic acids (chlorogenic acid, gallic acid, ferulic acid, and protocatechuic and caffeic acids), flavonoids (catechin, epicatechin, quercetin, rutin, myricetin, and kaempferol), and the anthocyanins acylated with phenolic acids mentioned above, which are more stable in comparison with anthocyanins present in colored fruit pomace [22,23]. Pulp derived from purple potatoes contains petunidin- and malvidin-3-rutinoside-5-glucosides acylated with p-coumaric and ferulic acid, whereas pulp from red potatoes is rich in pelargonidin and peonidin-3-rutinoside-5-glycosides acylated with p-coumaric and ferulic acid [24,25]. The mentioned ingredients encompass a variety of polyphenols, which serve as antioxidants and exhibit numerous health benefits. These include regulating blood sugar levels, lowering cholesterol, preventing cancer, reducing post-meal blood sugar spikes and hypertension, possessing anti-inflammatory, antiviral, antimicrobial, and anti-allergenic properties, as well as acting as anticoagulants. Additionally, they help lower the risk of conditions such as atherosclerosis, cardiovascular diseases, diabetes, genetic damage, bone degeneration, and neurodegenerative diseases such as Alzheimer’s disease [26,27]. These properties may contribute to the health-promoting features of bread.
It should be noted, however, that bread manufacture is a set of processes in which the dough (consisting of flour, water, salt, and yeast) is mixed, kneaded, proofed, and baked, and at each of these stages there may be quantitative changes and variation in the bioavailability of phenolic compounds added in the form of plant materials. During baking, an increase in temperature contributes to the formation of crosslinks in this group of compounds. Furthermore, the gelatinized starch granules and the gluten network interact, leading to a dissipation of kinetic energy and a consequent rise in firmness. It should also be emphasized that supplementing the dough with health-promoting ingredients (polyphenols) will contribute to significant changes in the ingredients of bread, which will affect the bioavailability and assimilation of nutrients and their nutraceutical potential [3].
Therefore, it is extremely important whether the raw materials are simply natural substances rich in polyphenols, by-products rich in polyphenols, or if they are produced from by-products rich in polyphenols by encapsulation in carbohydrate-rich food matrices. Moreover, the quantity of the addition, and the stage at which they are introduced into the bread manufacturing process, play a very important role. Most publications on bread fortification focus on the amount of additive (raw materials—fruit or fruit pomace) that is applied to the dough [3,9,10,11,12,13,14,15,16]. There are no studies that apply the additive in two independent stages of baking (dough or sourdough). Therefore, there is a lack of published studies investigating the impact of incorporating the additive at two distinct stages of bread production on the nutritional value, health-promoting properties, and overall quality of the final product. An important element will therefore be the prior encapsulation of polyphenol-rich by-products in carbohydrate matrices, due to the fact that polyphenols are degraded. Polyphenols quite often degrade as a result of thermal treatment occurring during industrial processing, and therefore they partially lose their health-promoting properties [28]. According to Świeca et al. [3], their antioxidative potential is also lowered by the formation of indigestible complexes with proline-rich protein. That is why the encapsulation process could be one of the methods of their protection, so that they can still fulfill the above-mentioned health-promoting functions. Therefore, in our research, we used a preparation of rice flour and maltodextrin with or without red potato pulp, which was encapsulated by extrusion, and is the novelty of this study. The preparation was used in the amount of 5% (w/w) of the flour at various stages of bread manufacture, for sourdough or dough. So far, there has been no research on this topic. Therefore, this work focuses on two new aspects: first, encapsulated preparations with red pulp potato, a valuable source of health-promoting substances (polyphenols), which, in this form, are protected against adverse factors during industrial processing (baking); and second, on the possibility of bread fortification with the above-mentioned preparations at two stages (dough and sourdough), in order to show which of these stages is more beneficial for applying health-promoting preparations. The objective of the study was therefore to analyze the effect of the addition of the preparation containing red potato pulp at various stages of bread production (dough or sourdough) on the content of polyphenols and the antioxidant potential, nutritional composition, physical parameters, and quality of wheat–rye bread.

2. Materials and Methods

Wheat–rye breads with the addition of red potato preparations were obtained using two different technologies. (T1 and T2). In the first technology, the addition of red potato preparations was used at the stage of kneading the dough, and in the second technology, it was used at the stage of souring rye flour (sourdough preparation). The preparation was added in the amount of 5% in relation to the amount of flour. The content of the bioactive ingredient (red potato pulp) in the preparation was 0%, 30%, or 40%. A simplified diagram of the procedure is presented in Figure 1.

2.1. Red Potato Preparations

The production of preparations from rice flour and maltodextrins (DE = 18) in the mass ratio of 1:1 with red potato pulp (Magenta Love variety) in the proportions 0%, 30%, 40% w/w was carried out by the extrusion process. Before extrusion, the raw materials, after prior mixing, were brought to a moisture content of 34% and conditioned (12 h). The extrusion process was carried out in extruder with a single screw (type 20DN) (Brabender, Duisburg, Germany), with a compression ratio of 1:3, and a nozzle with a diameter of 4 mm. The extrusion process was conducted in three different temperature zones (zone I 80 °C, zone II 90 °C, zone III 110 °C). The preparations were encoded as follows: E0PP (rice flour and maltodextrin (1:1) without red potato pulp), E30PP (rice flour and maltodextrin (1:1) with 30% red potato pulp), E40PP (rice flour and maltodextrin (1:1) with 40% red potato pulp).

2.2. Preparation of the Sourdough

The standard sourdough was prepared a total of eight times, following the subsequent procedure: 120 g of rye flour and 1.5 g of commercial starter cultures—LV2 (Saccharomyces chevalieri, Lactobacillus brevis—SAF LEVAIN; Lesaffre, Marcq-en-Barœul, France)—were mixed together with 120 mL of water. Afterward, the sourdoughs were fermented at 30 °C for 24 h in a laboratory incubator (IPS, Memmert GmbH & Co. KG, Schwabach, Germany). After that, 120 g of rye flour and 72 mL of water were added and fermentation was carried out for another 24 h at 30 °C. In breads in which the preparation was used at the stage of sourdough (Figure 1), the sourdough was prepared twice for each preparation, using the following procedure: 105 g of rye flour, 15 g of the preparation: (E0PP, E30PP, E40PP, respectively) and 1.5 g of commercial starter cultures—LV2 (Saccharomyces chevalieri, Lactobacillus brevis—SAF LEVAIN; Lesaffre)—were mixed together with 120 mL of water. Sourdough was fermented at 30 °C for 24 h in a laboratory incubator. After that, 105 g of rye flour, 15 g of suitable preparation, and 72 mL of water were added and fermented for the next 24 h.
After 48 h of fermentation, the sourdough was used to prepare bread dough.

2.3. Determination of pH and Total Titratable Acidity of the Dough

The pH of the dough/sourdough was determined by employing a pH meter model CPC-505 (Elmetron, Zabrze, Poland) with a dough sample electrode ERH-12-6 (Hydromet, Poland), both prior to and following the fermentation process.
For the assessment of total titratable acidity (TTA), a mixture of 5 g of the dough/sourdough and 100 mL of distilled water was prepared. The resulting suspension was subsequently titrated with 0.1 M NaOH solution using phenolphthalein as an indicator. The volume of NaOH required for titration was quantified in TTA units (mL NaOH/100 g of the dough/sourdough).

2.4. Wheat–Rye Bread Production

Ingredients according to the recipe in Table 1 were combined in the spiral mixer (type SP12, Diosna Dierks & Söhne GmbH, Osnabrück, Germany). After the end of mixing, the dough was left at 40 °C for 30 min. Then, 100 g dough pieces were then formed and finally fermented for 70 min in a proofer oven (MIWE Condo type CO 2.0608 electric oven, MIWE GmbH, Arnstein, Germany). The bread was baked at 210 °C for 30 min in an electrically heated deck oven (MIWE Condo, Germany). The resulting breads were coded as follows: SB—standard bread; E0PP_T1 (or E30PP_T1; E40PP_T1)—bread with E0PP (or E30PP; E40PP) preparation obtained according to technology 1; E0PP_T2 (or E30PP_T2; E40PP_T2)—bread with E0PP (or E30PP; E40PP) preparation obtained according to technology 2 (Figure 1). All kinds of breads were baked at least twice. The results are presented as an average of repetitions and different batches of bread.

2.5. Bread Quality Analysis

After 2 h of cooling, the following analyses were performed:

2.5.1. Loaf Mass and Bread Yield and Baking Loss

Loaf mass was determined using a laboratory scale. Bread yield was calculated as follows:
Bread yield = mb/mf × 100
The calculation of baking loss was carried out using the following formula.
Baking loss = (md − mb)/md × 100
where md = weight of dough formed for baking; mb = weight of cold bread; mf = weight of flour used to prepare dough formed for baking (md)

2.5.2. Total Titratable Acidity of Bread Crumb

Total titratable acidity (TTA) of bread crumb was determined according to PN-A-74108:1996 [29]. The extraction of acids from a 15 g sample was performed by immersing it in 100 mL of distilled water for a duration of 1 h. Subsequently, a 50 mL portion of the filtrate was titrated with 0.1 M NaOH solution using phenolphthalein as an indicator. The volume of NaOH consumed during titration was recorded and expressed in TTA units (mL NaOH/100 g of the bread).

2.5.3. Bread Volume

The measurement of bread volume was conducted using a precise, low-frequency laser-based three-dimensional analysis instrument called the Volscan Profiler (Stable Microsystems, Godalming, UK). To assess the bread size in this study, a vertical step size of 2 mm and a rotational speed of 0.5 revolutions per second (rps) were utilized.

2.5.4. Moisture of the Bread Crumb

Moisture of the bread crumb was established by drying the sample for 60 min at 130 °C, according to AOAC method 925.10 (AOAC 2006) [30].

2.5.5. Analysis of Texture Parameters

Texture parameters were evaluated using a TA.XT Plus texture analyzer (Stable Microsystems, UK) following a standard program, employing a compression rate of 5 mm/s. A 15 mm high sample of sliced bread crumb, taken from the central section of the loaf, was compressed to reach 50% of its initial height using a P/20 aluminum compression plate. This compression process was repeated twice, with a 5 s interval between cycles. The resulting texture profile analysis parameters, including hardness, cohesiveness, chewiness, and crumb resilience, were considered indicators of textural properties. The calculations were performed using the accompanying software Texture Exponent version 6.1.16.0 (Stable Microsystems, Godalming, UK).

2.5.6. Color Analysis

The color of both the crust and crumb was assessed following the guidelines of the International Commission of Illumination [31] using a CM-5 spectrophotometer (Konica Minolta, Inc., Osaka, Japan). Color reflectance values were recorded in the CIE Lab* color coordinate system, with D65 illuminant and a 10° observer angle.

2.6. Analysis of Basic Chemical Composition of Bread and Preparations

The chemical composition of bread was determined according to the AOAC methods (2006) [30]. Dry mass was determined using the laboratory oven set to 105 °C (UF 55, Memmert, Germany), according to AOAC method No. 925.10. Total protein content was measured using a Kjeltec 2200 unit (FOSS, Hillerød, Denmark), according to AOAC method no. 950.36. Total dietary fiber, including soluble and insoluble fractions, was evaluated based on enzymatic-gravimetric AOAC method no. 935.38 with MEGAZYME enzymes (K-TDFR-200A). Evaluation of the raw fat content was carried out using a Soxtec Avanti extractor (2055, FOSS, Denmark) following AOAC method no. 930.05. Total ash content was determined using laboratory stove model SM-2002 (Czylok, Jastrzębie-Zdrój, Poland), following AOAC method no. 930.05 [30].

2.7. Antioxidants Content and Antiradical Activity of Bread and Preparations

2.7.1. Extraction Procedure

The content of antioxidants and antiradical activity were assessed in ethanol extracts. In summary, 0.6 g of the sample was dissolved in 30 mL of 80% ethanol. The mixture was then shaken in the dark for 120 min using an electric shaker (type WB22, Memmert, Schwabach, Germany) and subsequently separated by centrifugation (at 1050× g for 15 min) using a centrifuge (type MPW-350, MPW MED Instruments, Warsaw, Poland). The resulting supernatant was carefully decanted and stored at −20 °C for further analysis [32].

2.7.2. Total Polyphenol Content

The total polyphenol content (TPC) was assessed using two spectrophotometric methods. The first method involved the utilization of Folin–Ciocalteu reagent, as outlined by Singleton et al. [33]; and the second without Folin–Ciocalteu reagent, according to Mazza et al. [34], with modification by Oomah et al. [35].
In the first method, a 5 mL portion of the extract was diluted with distilled water, resulting in a final volume of 50 mL. Next, 5 mL of the diluted extract was mixed with 0.25 mL of Folin–Ciocalteu reagent and 0.5 mL of 7% Na2CO3. The mixture was vigorously vortexed using a WF2 vortex mixer (Janke & Kunkel, Staufen, Germany) and then kept shielded from light for 30 min. The absorbance of the resulting solution was measured at a wavelength of 760 nm using a Helios Gamma 100–240 spectrophotometer (Runcorn, UK). The obtained results were expressed as milligrams (mg) of catechin per 100 grams (g) of dry matter (DM).
Content of total polyphenols (without Folin–Ciocalteu reagent) was determined as follows. A test tube containing 0.1 mL of the extract was combined with 2.4 mL of 2% HCl in 75%. The mixture was thoroughly vortexed, and the absorbance was measured at a wavelength of 280 nm. The total polyphenol content (TPC) was reported in milligrams (mg) of catechin per 100 grams (g) of dry matter (DM).

2.7.3. Content of Phenolic Acids, Flavonols, and Anthocyanins

The contents of phenolic acids, flavonols, and anthocyanins were measured by the spectrophotometric method according to Mazza et al. [34], with a modification by Oomah et al. [35]. The extract (0.1 mL) was mixed with 2.4 mL of 2% HCl in 75% in a test tube. The contents were vortexed and the absorbance was measured at the wavelengths λ = 320 nm (phenolic acids), λ = 360 nm (flavonols), and λ = 520 nm (anthocyanins). Phenolic acids in mg of gallic acid/100 g DM, flavonols in mg quercetin/100 g DM, anthocyanins in mg glycoside-3-cyanidin/100 g DM.

2.7.4. Content of Flavonoids

The determination of flavonoid content was performed using the spectrophotometric method described by El Hariri et al. [36]. In a test tube, 0.5 mL of the extract was combined with 1.8 mL of distilled water and 0.2 mL of 2-aminoethyldiphenylborate reagent. The mixture was vortexed, and the absorbance was measured at a wavelength of 404 nm. The content of flavonoids was reported in milligrams (mg) of rutin per 100 grams (g) of dry matter (DM).

2.7.5. Antioxidant Activity

The evaluation of antioxidant activity was performed using the ABTS analytical method [37]. A 7 mM concentration of ABTS was prepared by dissolving it in water. The ABTS radical cation (ABTS+•) was generated by mixing the ABTS stock solution with 2.45 mM potassium persulfate (final concentration) and allowing the mixture to stand in the dark at room temperature for 12–16 h before use. The reduction of ABTS+• in the presence of the sample was measured at 734 nm using a Helios Gamma 100–240 spectrophotometer (Runcorn, UK). To analyze the extracts, the ABTS+• solution was diluted in PBS buffer (pH 7.4) to achieve an absorption value of 0.700 ± 0.05. A volume of 2.00 mL of the ABTS+• solution and the corresponding extract in PBS buffer were used for the measurement. The bleaching of ABTS+• was monitored at 30 °C, and the decolorization after 6 min was utilized as the indicator of antioxidant activity. The radical scavenging activity was expressed as Trolox equivalents antioxidant capacity (mM of Trolox per kg of sample). For the calibration curve, Trolox solutions in the concentration range of 0–2.5 mM (R2 = 0.9957) were used.

2.8. Molecular Parameters of Polysaccharide Matrix in Bread

2.8.1. Sample Preparation

Bread crumb (10 g) was poured with 40 mL of distilled water at room temperature, mixed, and left to swell for 5 min. In the next stage, the sample was homogenized for 5 min in a homogenizer (the crumb from the grinder was rinsed with 15 mL of distilled water). The homogenate was mixed for 20 min with a laboratory stirrer at 750 rpm and the stirrer was rinsed with 10 mL of distilled water. The obtained suspension was centrifuged in a laboratory centrifuge for 10 min at a speed of 4000 rpm [38]. The supernatant fluid was decanted into a volumetric flask with a capacity of 100 mL and deproteinized by adding 5 mL of Carrez I and 5 mL of Carrez II. The suspension was filtered through a fluted filter. The supernatant was used for chromatographic analysis.

2.8.2. Chromatographic Analysis

The determination of average molecular masses and their distributions was conducted using gel permeation chromatography (GPC) [39]. A series-connected system of three columns, namely, Ultrahydrogel-2000, Ultrahydrogel-500, and Ultrahydrogel-120, all manufactured by Waters (USA), was utilized. The system was equipped with a refractive index (RI) detector from Knauer (Germany). The eluent used was a mixture of 0.1 M NaNO3 and 0.02% NaN3 solution in water. The flow rate was set at 0.6 mL·min−1, and the sample volume injected was 100 mL. The sample concentration was approximately 5 mg·mL−1. Prior to analysis, the samples were dissolved in 1 M NaOH and neutralized with the addition of 1 M HCl, with phenolphthalein used as an indicator. Calibration was performed using pullulan standards from Shodex (Tokyo, Japan).

2.8.3. Statistical Analysis

All bread analyses were conducted in duplicate or more, and the obtained results were subjected to two-way analysis of variance (ANOVA) using the Statistica 13 version 13.3.721.1 statistical software package (StatSoft, TIBCO Software Inc., Palo Alto, CA, USA). The samples were categorized based on the type of preparation and its application location. The significance of differences between the mean values was assessed using Duncan’s test at a significance level of α ≤ 0.05. Additionally, Pearson correlation was calculated using MS Excel, and the correlation coefficient was determined using Statistica 8.0PL software.

3. Results and Discussion

3.1. Characteristics of Obtained Preparations

Extruded preparations mainly consist of starch and other carbohydrates, since a significant component of this formulation was rice flour rich in starch, maltodextrin, and red potato pulp starch. As the proportion of red potato pulp increased, there was a reduction in the content of starchy carbohydrates. At the same time, the content of fiber fractions and total dietary fiber, ash, fat, and protein increased (Table 2). The total content of fiber and the fractions of soluble and insoluble fiber, ash, fat, and protein increased with the increase in the proportion of potato pulp (preparations E30PP and E40PP) 100-fold, 60-fold, 45-fold, and 18-fold, respectively, and 11-fold compared to the E0PP formulation (Table 2).
Considering the total phenolic content (TPC) of extruded rice flour and maltodextrin preparations with or without red potato pulp, a significant amount of these compounds was found, especially in formulations containing 30 and 40% of pulp in comparison to the reference preparation (E0PP). The content of TPC in the 30 and 40% pulp preparations was 12 and 15 times higher, respectively, compared to the non-pulp preparation (E0PP) (Table 2). For the E0PP preparation, the determination of total polyphenol content (TPC) using Singleton et al.’s [33] method was crucial as the Folin–Ciocalteu (F-C) reagent reacts not only with polyphenols but also with other compounds such as ascorbic acid, glycoalkaloids, sugars, and amino acids [40,41]. Importantly, the latter two components form the Maillard reaction products, which greatly increase the “apparent” amount of TPC in the sample. Therefore, TPC was also determined by the method of Mazza et al. [34] as modified by Oomah et al. [35]. The results of this analysis show lower TPC values, but the trend in the range of all samples is convergent. It should be emphasized that the amount of polyphenols in these preparations increased significantly after the use of pulp containing red potato polyphenols (mainly chlorogenic acid, neo- and cryptochlorogenic acids, ferulic acid, gallic acid, p-coumaric acid, and pelargonidin and acylated peonidin derivatives) [23,42,43]. It is important to acknowledge that the spectrophotometric determination of total polyphenol content (TPC) using the Folin–Ciocalteu reagent (Singleton et al. [33] method) provides a valuable metric for establishing a correlation between the content of phenolic compounds and their antioxidant activity.
The amount of flavonoids in E0PP was small, but increased significantly with the proportion of red potato pulp. In the case of E0PP, no phenolic acids, flavonols, or anthocyanins were found due to the lack of a bioactive component, i.e., red potato pulp. The E40PP preparation was characterized by a higher content of phenolic acids, flavonols, and anthocyanins by 30, 46, and 55%, respectively, compared to the E30PP preparation (Table 2). The presence of these compounds results in very high antioxidant activity of these preparations, which is 5.3 times greater than that of the preparation made without potato pulp, i.e., E0PP (Table 2), which was confirmed by a strong correlation between TPC and ABTS (r = 0.995).

3.2. Characterization of Sourdough, Dough, and Bread with the Participation of the Tested Preparations in Terms of Changes in Acidity

Proper preparation of the sourdough affects the final quality of baking bread. The use of appropriate quality sourdough affects the rheological properties of the dough, improving its texture, but also influences the development of the desired taste and aroma in the finished product [5,44].
Significant differences were observed in the initial acidity (both pH and titratable acidity) of the sourdough before starting the fermentation process. The lowest titratable acidity and the highest pH (Table 3) immediately after preparation were found in the standard sourdough made exclusively from rye flour. The use of all preparations in sourdough significantly increased total titratable acidity. On the other hand, the use of potato-based preparations resulted in a much lower pH of the sourdough. The observed variations can be attributed to variances in the chemical composition of the raw materials employed in the production of the sourdough (Table 1). The use of pure E0PP caused an increase in the initial titratable acidity of this sourdough, but did not contribute to a change in pH compared to the standard sourdough, which should be attributed to the presence of ingredients contained in the formulation reacting with NaOH. Sourdoughs containing potato pulp preparations (30% and 40%) were characterized by a significantly lower initial pH, which decreased with the increasing proportion of potato pulp in the preparation. This can be attributed to the increasing content of polyphenols, including phenolic acids.
The pH of all sourdoughs decreased statistically significantly with the fermentation time, and their acidity increased statistically significantly in all types of sourdough (Table 3). The decrease in pH was particularly intense during the first 24 h, during which the pH dropped by approximately 30–35% from the initial pH. After 48 h, a further 2 to 4% drop in pH was observed. However, no significant differences in pH were observed between the sourdoughs, after either 24 or 48 h of fermentation. This is related to the pH reaching the level of 3.6–3.8, at which the growth and metabolism of lactic acid bacteria cease, and some other enzymes are activated, which influences further changes in the sourdough [45,46].
As in the case of pH after 24 and 48 h of fermentation, no significant differences were observed in the titratable acidity of the sourdough. The exception was the sourdough with the preparation in which the potato pulp was added in the amount of 40%, which, immediately after making, was characterized by the highest acidity. It may testify to a greater distribution of macronutrients contained in the sourdough [46,47], which were supplied with the preparation in the greatest amounts (Table 2).
After fermentation for all sourdoughs obtained, a pH of about 3.9 and an acidity of about 15 TTA were reached. According to other authors, these values indicate quite high acidification of sourdough [45,46,48]. The optimal pH and acidity of wheat and rye sourdough used for the production of bread depend on the customer’s preferences and the geographical region in which the bread is prepared [49].
The obtained sourdoughs were used directly to prepare the dough. The highest initial pH was observed in dough with E40PP added to dough or sourdough, irrespectively, and in dough with E0PP added to sourdough. These doughs were also characterized by the lowest titratable acidity (Table 4 and Table S1). As a result of the fermentation of the dough, slight changes in the pH of the dough were observed, but these differences were small, which may be due to the short fermentation time of the dough (70 min). The values of the initial titratable acidity did not differ so clearly; only the dough with E0PP added directly to the dough was characterized by a much higher initial titratable acidity, while differences were observed in the parameters of the titratable acidity of the dough after fermentation.
The titratable acidity of the standard dough increased by about 0.5 TTA units during fermentation. In the case of the dough to which the preparation was added at the dough stage only, the increase was greater and ranged between 0.7 and 2.0 TTA units, while the dough with the E0PP preparation showed the smallest increase in acidity (0.74 TTA units). The greatest increase in acidity during fermentation was observed after adding the preparation to the sourdough (by 0.98–2.3 TTA units), especially in the case of E30PP and E40PP. Therefore, it can be inferred that the addition of the tested preparations accelerates its acidification. In the tested preparations, maltodextrin constituted a significant proportion, which in the context of the extrusion process resulted in higher availability for microorganisms [50]. The use of pomace additionally increased the acidification of the dough. Greater acid synthesis may be associated with the supply of proteins, minerals, and vitamins within the pomace, which promotes the growth of bacteria [51]. It could be expected that the TTA of the dough would increase due to the decreasing pH of the product. The additional apparent increase in acidity after fermentation could be related not only to the acidification directly influencing the pH, but also to the increase in the content of weakly acidic NaOH-reactive compounds; hence, the change in the TTA of the dough during proofing is evident [52].
It should be noted, however, that the most acidic dough was obtained when using preparation E30PP (Table S1). Probably, this composition of the preparation was the optimal substrate for bacteria growth, which resulted in better acidification of the dough. Regardless of the titratable acidity of the dough, the titratable acidity of the bread crumb has changed. These values are not proportional because the final acidity depends on the amount of compounds that are retained in the bread and, like the acidity of the sourdough, it varies widely and depends both on the type of bread and the geographical area [49]. The acidity of the crumb was significantly lower in the case of SB and E0PP_T1 bread as compared to the other bread samples. In this group, the lowest acidity was found in the E40PP_T2 bread. This can be explained by the release of significant amounts of polyphenols during fermentation, which had a hindering effect on the development of acidifying microflora.

3.3. Quality of Bread Made Using Preparations

There were no notable alterations in the physical parameters of the bread, which could impact the quality of the products, such as bread weight or bread yield, as indicated in Table 5. Statistically significant differences were only observed between the standard bread and the bread prepared with the E0PP additive incorporated into the sourdough (E0PP_T2). This particular bread exhibited the lowest weight and, consequently, the lowest yield. (Table 5) among the examined samples. On the other hand, the highest parameters were shown by standard bread. The use of a pure (unenriched) preparation without potato pulp (E0PP) significantly accelerated the fermentation process, as this preparation provided the largest amount of carbohydrates (Table 2), and these breads had the largest volume (Table S2).
Large differences were also observed between the volumes of the bread. The breads with preparations added at the sourdough fermentation stage were distinguished by a much larger volume compared to standard bread and bread to which the preparation was added at the dough kneading stage. This effect was observed regardless of the type of preparation used (Table S2). Probably, in these breads, the microorganisms proliferated better, as evidenced by the higher acidity of the dough after fermentation (Table 4).
At the same time, an influence of the type of preparation on the volume of bread was observed. The preparation consisting of maltodextrin and rice flour 50/50 (E0PP) had the most favorable effect on the bread volume regardless of the technology used (T1 or T2) (Table S2). These changes may be related to the lower carbohydrate content in these preparations, which significantly facilitates fermentation, the presence of a greater content of dietary fiber in these preparations (Table 2), or in limiting the production of carbon dioxide by microorganisms due to the addition of preparations containing polyphenols. Dietary fiber generally negatively affects the volume of bread and texture characteristics; therefore, searching for new possibilities of adding high-fiber products to bread without reducing their quality, often using a fermentation process, is a current requirement [53,54,55,56]. In addition, the greater volume of E0PP bread may result from the supply of greater amounts of maltodextrins with a DE of 18-19, because, as demonstrated by Witczak et al. [57], the addition of maltodextrins with saccharification of above 18 DE has a positive effect on the volume and texture of gluten-free bread, as previously demonstrated by Miyazaki et al. [58].
Incorporating the preparation either as an additive to the dough or to the sourdough led to alterations in the color of the crumb and crust of the resulting bread (refer to Table 6 and Table S3). The crumb of the bread containing E0PP in the sourdough exhibited an L* coefficient value similar to the standard (Table S3), while the other bread samples had a darker crumb color, indicated by lower L* values. Furthermore, an increase in the proportion of potato pulp in the preparation resulted in a darker crumb, which results from the greater presence of coloring compounds, and thus the greater content of bioactive compounds. In addition, taking into account the color difference (ΔE) values, the influence of the type of preparation on the crumb color was observed. It should be noted that the only bread crumbs that should not differ from the control to the consumers were those baked with E0PP, where the color difference was below 1.5. In view of the fact that the average observer notices differences only at a ΔE level above two, and two different colors are identified at a ΔE above five [59], it can be concluded that the crumb of breads with pomace preparations differed completely from the standard bread in color. In the case of food products, color differences of up to three are acceptable [60]. The negative effect of phenolic compounds on the color of the crumb and crust was observed by Pasqualone et al. [61] and Taranto et al. [62]. Long fermentation of sourdough using the tested preparations contributed to the lightening of the bread crumb, and although the differences were not significant during the statistical analysis of mixed factors, in the case of the two-factor analysis of variance, the influence of the preparation method turned out to be statistically significant. Therefore, it can be concluded that the stage of the incorporation of the apple pomace preparation has a notable impact on the crumb color, as its addition to the sourdough contributes to a lighter-colored crumb.
The type of preparation also influenced the color of the crumb. The value of the a* and b* components changed inversely to the L* component, which proves greater accumulation of red and yellow compounds, respectively, with the dominant yellow saturation.
The color coefficients of the bread crust changed in a similar way, but this relationship was not as clear as before. Significant differences in crust color represented by the ΔE factor could be clearly observed among the samples (Table 6 and Table S3) This is probably the result of different Maillard reactions taking place in the crust of the bread, despite maintaining the same technological parameters while preparing the dough, fermentation, and baking. It was observed that the E0PP_T2 breads had the highest value of the L* component of the crust compared to all other breads, while the lowest value of the L* component was recorded in the case of E30PP_T2 and E40PP_T1. Parameters a* and b*, indicating the color of the crust, also changed slightly, and it was observed that their value changed inversely with the value of the L* component. Together with the darker color of the crust, more intense saturation with yellow and red colors was observed (Table 6).
Statistically significant differences were observed during the analysis of the moisture content of the bread crumb, both on the baking day and after storage (Table 7). On the day of baking, the crumb of bread with the addition of the preparation (regardless of the stage of its administration) had significantly lower moisture than standard bread (Table 7 and Table S4), while the crumb moisture of bread obtained with the T1 technology was significantly higher than that of the crumb of bread obtained with the T2 technology. During storage, a decrease in crumb moisture in all breads was observed. This phenomenon can be attributed to the well-known process of water migration from the crumb to the crust. The structural integrity and moisture content of bread have a direct influence on its overall quality, including characteristics such as crumb hardness, mouthfeel, and chewiness [63,64]. Similar to the day of baking, the moisture after 48 h of storage was the highest for standard bread. In this case, moisture was significantly higher than that of all breads with the preparation dosed into the dough (T1 technology), and comparable to the majority of breads with the preparation added to the sourdough (T2 technology), with the exception of bread with E0PP. The addition of preparations with potato pulp (E30PP, E40PP) to the sourdough significantly slowed down the loss of moisture by the crumb, because, during the entire storage period, these breads lost less than 1% of water. For the remaining breads, the observed loss was 1.5% (E0PP_T2), 1.9% (SB), and 2.2% or more when the formulations were applied to the dough. Additionally, changes in the crumb moisture were observed during storage, and differences were observed between different preparations and applied technologies (Table S3). Nevertheless, such slight variations should not be perceptible in the organoleptic assessment, and the crumb moisture of wheat–rye bread is above 40% [49].
Crumb hardness is the parameter most often determined in bread texture studies, allowing one to estimate the bread aging rate, which is related to the retrogradation of starch [63,65]. The addition of E0PP and E30P to the sourdough significantly lowered the hardness of the crumb on the baking day compared to the standard bread, but no significant differences were observed between the other tested breads (Table 8 and Table S5). Taking into account that the bread with the addition of preparation to the sourdough was characterized by the highest volume, it can be concluded that the hardness and volume changed in direct proportion. The addition of the preparation did not statistically significantly affect the hardness of the crumb after storage, and thus the proportion of stale bread. All tested breads were characterized by an increase in crumb hardness by an average of 16N compared to the day of baking. Thus, the use of sourdough preparations only had an effect on the fermentation of the dough, thus obtaining a greater volume and lower hardness compared to other breads, while the greater proportion of low-molecular carbohydrates did not reduce the staling process. The textural properties are also described by crumb cohesiveness, which is a measure of the degree of decay of the sample after deformation. By examining the cohesiveness, the strength of its internal bonds in the product, i.e., the degree to which the sample can be deformed before it is damaged, was determined [65]. No clear effect of the preparation proportion on crumb cohesiveness was observed; a slight beneficial effect on crumb cohesiveness was noted after the application of the E40PP preparation directly to the dough and all the preparations dispensed for the sourdough (Table 8 and Table S6). The standard bread did not differ significantly from the other products; therefore, it can be concluded that neither the stage of adding the preparation nor the type of preparation significantly affects the consistency of the bread on the baking day and during its storage (Table S6).

3.4. Chemical Composition of Investigated Breads

The preparations used in the research differed significantly in their chemical composition (Table 2), which resulted in differences in the chemical composition of bread produced with the preparations as a 5% addition in terms of the weight of flour (Table 9 and Table S7). It was observed that with the increase in ash and fiber content in the preparation, the content of these components in bread with the preparation added increased as well. Hence, the breads containing E40PP are characterized by the highest content of dietary fiber, including both soluble and insoluble fractions and ash. The addition of E0PP and E30PP to the dough did not increase the protein content in these breads compared to the standard. It should be noted that the protein content in the other raw materials used to prepare the dough (flours, yeast) was much higher; hence, the effect of the addition of preparations was not important in terms of the protein content, as expected (Table 9 and Table S7).
It was observed that the chemical composition was greatly influenced by the moment of using the preparation because the content of most of the determined macronutrients (except for fat) was higher in the breads obtained according to technology T2 (Table S7). It can therefore be assumed that these breads contain much smaller amounts of carbohydrates that were used during the fermentation process.
The inclusion of the extruded preparation in the dough directly influences the structural characteristics of starch in the bread crumb, primarily increasing the molecular weight distribution (ƉƉ) (Table 10). It is most likely related to the degradation of polysaccharide chains during the preparation itself (extrusion, hydrothermal phenomena) [66], as well as the composition of the preparation in which one of the ingredients was maltodextrin, with a much lower molecular weight compared to flour starch. Additionally, it is known that fermentation and the bread-making process influence molecular parameters of starch and other polysaccharides by means of shortening the macromolecular chains as well as broadening molecular mass distribution [67]. The addition of an extruded preparation containing rice flour and maltodextrin to the dough slightly decreased the weight average molecular weight (Mw) while increasing the dispersibility of the system. This means that a low molecular weight fraction appears in the sample (maltodextrin)—Figure 2a–c. In the case of preparations containing the potato pulp in the amounts of 30 and 40%, a decrease in both structural parameters was observed (the number and weight average molecular weight), but, above all, a significant increase in dispersibility was noted. This phenomenon was particularly visible in the differential molecular weight distributions. Basically, in all cases, the weight distribution was trimodal; however, in the case of systems containing the added red potato pulp, a change (increase) in the weight fraction of the lowest molecular fraction (maximum around 104 g·mol−1) in relation to the medium molecular fraction (maximum around 105 g·mol−1) can be observed.
A comparable situation was noted in relation to bread in which the extruded preparation was added to the sourdough (Figure 1). In this case, the structural parameters in the samples containing potato fractions are similar to those discussed above, with the molecular weight dispersion being slightly greater. Similarly, for bread prepared with the incorporation of a formulation consisting solely of rice flour and maltodextrin (E0PP_T2), an increase in the average molecular weight was observed. However, in this case, it results in a reduction in dispersion, which may mean that the fermentation was faster/easier for low molecular weight fractions (e.g., maltodextrin) and its products were mono- or oligosaccharides; i.e., they were undetectable in the analytical system used. A comparison of the sample containing rice flour and maltodextrin with samples containing an additional 30 and 40% of red potato pulp may indicate greater availability for microorganisms (fermentation) of the higher molecular fraction of the preparation or specific synergistic effects that require further research [68].

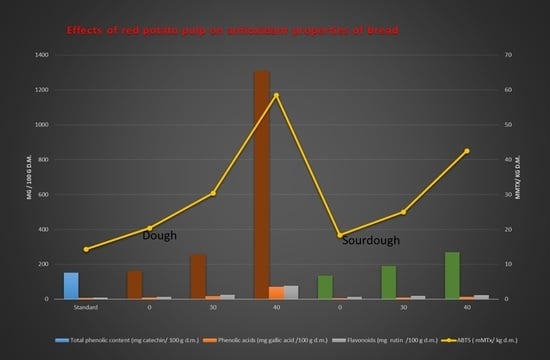
3.5. Polyphenol Content and Antioxidant Activity of Bread Supplemented with Preparations Extruded from Red Potato Pulp

According to many authors [15,69,70], the determined antioxidant activity of fortified breads primarily originated from phenolic compounds rather than other constituents found in bread. Therefore, the bioaccessibility of these phenolics plays a crucial role in determining the potential health benefits of the food. Most studies on polyphenol transformations during technological operations, e.g., baking, confirm the destructive effect of temperature on nutrients and bioactive compounds, including polyphenols, due to their lack of resistance to high temperature [70]. Therefore, in this research, extruded preparations of rice flour and maltodextrin with red potato pulp as a source of polyphenols were used to enrich bread with bioactive compounds. The extrusion was performed to create a shell of rice flour and maltodextrin, which makes it possible to protect the bioactive part of the preparation, which was the source of polyphenols, i.e., red potato pulp. The aforementioned preparations exhibited a rich content of beneficial compounds and demonstrated significant antioxidant activity, making them excellent sources of health-promoting substances. As already mentioned, the antioxidant status of the finished product depends on the form of the additive, its quantity, and the stage of its application during breadmaking. In this publication, extruded preparations were added directly to the dough or applied in the sourdough fermentation step. Breads enriched with a 5% addition of the extruded preparation showed a significant increase in total polyphenol content (TPC) ranging from 6% to 750% compared to the standard bread, irrespective of the TPC determination method used (as shown in Table 11). Similarly, there was a notable increase in the content of flavonoids in these breads, ranging from 57% to 850% compared to the standard (as indicated in Table 12). However, when comparing the bread with the addition of this preparation to the dough to the sourdough, it was unequivocally found that the breads where the preparation was added to the dough were characterized by a greater amount of TPC and flavonoids. Preparations E0PP, E30PP, and E40PP added to the sourdough contributed to the reduction in TPC by 18%, 25%, and 80%, respectively, compared to breads where they were added directly to the dough at the kneading stage. In the case of flavonoids, E30PP and E40PP added to the sourdough contributed to a reduction in the amount of these compounds by 24% and 70%, respectively, compared to bread where they were added to the dough. The exception was E0PP, which guaranteed the same level of flavonoids regardless of the stage of its application in breadmaking.
Breads with the preparations added to the dough exhibited a greater amount of phenolic acid (up to six times) and flavonols (up to four times) compared to bread where the additives were applied at the sourdough stage (Table 12).
It was noted that in the case of anthocyanins, the extruded preparations did not bring the intended results in the fortified bread, as they were practically absent in the final product. This could be attributed to the instability of these compounds, particularly anthocyanins, which are known to be highly sensitive to various factors such as temperature, pH, and enzymatic activity during processing [71]. Therefore, it can be suggested that the lack of anthocyanin increase in breads with pulp preparations is caused, apart from thermal degradation, also by the use of wheat and rye flour, which contains enzymes, and sourdough, with low pH.
The antioxidant potential of the breads enriched with the extruded preparations was significantly greater than the standard (from 30 to 310%), while the addition of the extruded preparation at the dough stage was more favorable than at the sourdough stage in terms of the antioxidant activity of enriched breads. A significant correlation was found between TPC and ABTS, indicating a strong relationship between the total phenolic content and the antioxidant capacity of the samples (r = 0.862). It is important to note that apart from phenolic compounds, other substances present in the breads may have contributed to their antiradical capacity. For instance, high-temperature Maillard reaction products formed during the baking process are known to possess antioxidant properties. Additionally, other antioxidant components such as carotenoids and glutathione, which were not assessed in this study, could have also contributed to the overall antioxidant activity of the breads [72,73].
Many authors have reported the loss of polyphenols during baking [74,75,76] as a result of their thermolability, and in the case of phenolic acids, the effect of thermal decarboxylation of these compounds to, e.g., 4-vinyl guaiacol [74]. Losses of polyphenols, mainly flavonoids, may also be the result of a combination of several processes, i.e., oxidation, isomerization, epimerization, and their degradation, both during baking [76] and at other stages of bread production [75]. In addition, the losses of these phenolic compounds may be caused by the formation of complexes with polysaccharides and proteins [76,77]. This is confirmed by research by Świeca [3], who observed the formation of polyphenol–protein and polyphenol–polysaccharides complexes, which results in lower antioxidant activity of enriched breads. That is why the form of the supplement, its quantity, and the stage of application are so important. The research in this study showed that only a 5% addition of extruded preparation from rice flour and maltodextrin with the inclusion of red potato pulp increased the content of total polyphenols and all their groups, from low-molecular phenolic acid to high-molecular flavonoids. It can therefore be speculated that this form of added preparation resulted in a certain elimination of polyphenol–protein and polyphenol–polysaccharide combinations, where polysaccharides and proteins were derived from the wheat and rye flour used for baking bread. The extruded formulation, consisting of rice flour and maltodextrin, acted as a protective coating for the polyphenols derived from potato pulp. This protective coating prevented the interaction of phenolic antioxidants with proteins and polysaccharides present in the bread through various mechanisms, including hydrophobic and ionic interactions, as well as hydrogen and covalent binding. As a result, the phenolic antioxidants were effectively preserved and retained in the bread, contributing to its overall antioxidant activity [78,79]. However, taking into account the stage of application of the additive for the content of antioxidants and the antioxidant status of enriched breads, it was observed that the application of the additive to the dough is more advantageous than its addition to the sourdough. Most likely, the addition of the extruded preparation to the sourdough could cause hydrolysis of the coating of this preparation made of maltodextrin and rice flour by the enzymes, which results in a high concentration of sugars, rapid fermentation, and the possibility of the formation of indigestible complexes of polyphenols from the red potato pulp of these preparations with protein present in breads. Hence, the antioxidant activity of breads with preparations added to the sourdough is lower than when such preparations are added to the dough. This antioxidant activity is 3.5 times lower in breads with preparations added to the sourdough than to the dough. This would confirm an earlier study by Świeca et al. [3], who see the main reason for the low antioxidant activity of the products as the complexation of polyphenols with proteins into insoluble compounds.

4. Conclusions

The conducted research shows that the stage at which a preparation with red potato pulp in the composition was added during bread manufacture was an important factor affecting the quality and nutritional and health-promoting value of the product.
We concluded that in order to obtain breads of better quality (greater volume and lower hardness) and higher nutritional value, the preparations with red potato pulp should be added at the sourdough fermentation stage rather than directly to the dough at the kneading step. In contrast, for elevating the health-promoting value of bread, one should add preparations with red potato pulp directly to the dough, rather than fermented at the stage of sourdough formation. In this research, it was found that breads with red potato pulp added to the dough were characterized by 4.5 times more polyphenols (3.5 times more flavonoids, 6 times more phenolic acids, and 4.5 times more flavonols) and greater antioxidant activity as compared to breads with these preparations added to the sourdough.

Supplementary Materials

The following supporting information can be downloaded at: https://www.mdpi.com/article/10.3390/app13137670/s1, Figure S1: SB. Figure S2: E0PP_T1. Figure S3: E30PP_T1. Figure S4: E40PP_T1. Figure S5: E0PP_T2. Figure S6: E30PP_T2. Figure S7: E40PP_T2. Table S1: Results of pH and acidity determinations for dough and bread crumb. Table S2: Quality features of bread with the use of the tested preparations. Table S3: Color parameters for obtained bread. Table S4: Changes in the moisture content of the tested bread during storage. Table S5: Changes crumb hardness of the tested bread during storage. Table S6: Changes crumb cohesiveness of the tested bread during storage. Table S7: Chemical composition of obtained breads.

Author Contributions

Conceptualization, D.L. and D.G.; methodology D.L., D.G., M.Ł. and T.Z.; validation, D.L., D.G., T.Z. and S.K.; formal analysis, D.L., D.G., M.Ł. and T.Z.; investigation, D.L., D.G., M.Ł. and T.Z.; resources, D.L., D.G. and T.Z.; data curation, D.L. and D.G.; writing—original draft preparation, D.L., D.G., M.Ł., T.Z. and S.K.; writing—review and editing, D.L., D.G. and S.K.; visualization, D.L., D.G., M.Ł. and S.K.; supervision, D.L. and D.G.; project administration, D.L. and D.G. All authors have read and agreed to the published version of the manuscript.

Funding

This research received no external funding.

Data Availability Statement

The data used to support the findings of this study are available from the corresponding author upon request.

Acknowledgments

This work was supported by the Ministry of Science and Higher Education of the Republic of Poland.

Conflicts of Interest

The authors declare no conflict of interest.

Sample Availability

Samples of the compounds are available from the authors.

References

  1. Meral, R.; Köse, Y.E. The effect of bread-making process on the antioxidant activity and phenolic profile of enriched breads. Qual. Assur. Saf. Crops Foods 2019, 11, 171–181. [Google Scholar] [CrossRef]
  2. Škrbić, B.; Filipčev, B. Nutritional and sensory evaluation of wheat breads supplemented with oleic-rich sunflower seed. Food Chem. 2008, 108, 119–129. [Google Scholar] [CrossRef]
  3. Swieca, M.; Gawlik-Dziki, U.; Dziki, D.; Baraniak, B.; Czyż, J. The influence of protein-flavonoid interactions on protein digestibility in vitro and the antioxidant quality of breads enriched with onion skin. Food Chem. 2013, 141, 451–458. [Google Scholar] [CrossRef] [PubMed]
  4. Sluková, M.; Jurkaninová, L.; Švec, I.; Skřivan, P. Rye—The nutritional and technological evaluation in Czech cereal technology—A review: Grain and flours. Czech J. Food Sci. 2021, 39, 3–8. [Google Scholar] [CrossRef]
  5. Fernández-Peláez, J.; Paesani, C.; Gómez, M. Sourdough Technology as a Tool for the Development of Healthier Grain-Based Products: An Update. Agronomy 2020, 10, 1962. [Google Scholar] [CrossRef]
  6. Taglieri, I.; Macaluso, M.; Bianchi, A.; Sanmartin, C.; Quartacci, M.F.; Zinnai, A.; Venturi, F. Overcoming bread quality decay concerns: Main issues for bread shelf life as a function of biological leavening agents and different extra ingredients used in formulation. A review. J. Sci. Food Agric. 2021, 101, 1732–1743. [Google Scholar] [CrossRef]
  7. Torrieri, E.; Pepe, O.; Ventorino, V.; Masi, P.; Cavella, S. Effect of sourdough at different concentrations on quality and shelf life of bread. LWT Food Sci. Technol. 2014, 56, 508–516. [Google Scholar] [CrossRef]
  8. Corsetti, A.; Settanni, L. Lactobacilli in sourdough fermentation. Food Res. Int. 2007, 40, 539–558. [Google Scholar] [CrossRef]
  9. Altunkaya, A.; Hedegaard, R.V.; Brimer, L.; Gökmen, V.; Skibsted, L.H. Antioxidant capacity versus chemical safety of wheat bread enriched with pomegranate peel powder. Food Funct. 2013, 4, 722–727. [Google Scholar] [CrossRef]
  10. Filipčev, B.; Lević, L.; Bodroža-Solarov, M.; Mišljenović, N.; Koprivica, G. Quality Characteristics and Antioxidant Properties of Breads Supplemented with Sugar Beet Molasses-Based Ingredients. Int. J. Food Prop. 2010, 13, 1035–1053. [Google Scholar] [CrossRef] [Green Version]
  11. Ho, L.-H.; Abdul Aziz, N.A.; Azahari, B. Physico-chemical characteristics and sensory evaluation of wheat bread partially substituted with banana (Musa acuminata × balbisiana cv. Awak) pseudo-stem flour. Food Chem. 2013, 139, 532–539. [Google Scholar] [CrossRef] [PubMed]
  12. Hsu, C.-L.; Hurang, S.-L.; Chen, W.; Weng, Y.-M.; Tseng, C.-Y. Qualities and antioxidant properties of bread as affected by the incorporation of yam flour in the formulation. Int. J. Food Sci. Technol. 2004, 39, 231–238. [Google Scholar] [CrossRef]
  13. Peng, X.; Ma, J.; Cheng, K.-W.; Jiang, Y.; Chen, F.; Wang, M. The effects of grape seed extract fortification on the antioxidant activity and quality attributes of bread. Food Chem. 2010, 119, 49–53. [Google Scholar] [CrossRef]
  14. Sivam, A.S.; Sun-Waterhouse, D.; Perera, C.O.; Waterhouse, G.I.N. Application of FT-IR and Raman spectroscopy for the study of biopolymers in breads fortified with fibre and polyphenols. Food Res. Int. 2013, 50, 574–585. [Google Scholar] [CrossRef]
  15. Sivam, A.S.; Sun-Waterhouse, D.; Perera, C.O.; Waterhouse, G.I.N. Exploring the interactions between blackcurrant polyphenols, pectin and wheat biopolymers in model breads; a FTIR and HPLC investigation. Food Chem. 2012, 131, 802–810. [Google Scholar] [CrossRef]
  16. Zhu, F.; Sun, J. Physicochemical and sensory properties of steamed bread fortified with purple sweet potato flour. Food Biosci. 2019, 30, 100411. [Google Scholar] [CrossRef]
  17. Gumul, D.; Korus, J.; Ziobro, R.; Kruczek, M. Enrichment of wheat bread with apple pomace as a way to increase pro-health constituents. Qual. Assur. Saf. Crops Foods 2019, 11, 231–240. [Google Scholar] [CrossRef]
  18. Gumul, D.; Korus, J.; Surma, M.; Ziobro, R. Pulp obtained after isolation of starch from red and purple potatoes (Solanum tuberosum L.) as an innovative ingredient in the production of gluten-free bread. PLoS ONE 2020, 15, e0229841. [Google Scholar] [CrossRef]
  19. Sharma, H.K.; Kumar, N. Utilization of Carrot Pomace. In Food Processing By-Products and Their Utilization; John Wiley & Sons, Ltd.: Hoboken, NJ, USA, 2017; pp. 207–229. ISBN 978-1-118-43292-1. [Google Scholar]
  20. Santos, D.; Pintado, M.; Lopes da Silva, J.A. Potential nutritional and functional improvement of extruded breakfast cereals based on incorporation of fruit and vegetable by-products—A review. Trends Food Sci. Technol. 2022, 125, 136–153. [Google Scholar] [CrossRef]
  21. Martins, Z.E.; Pinho, O.; Ferreira, I.M.P.L.V.O. Food industry by-products used as functional ingredients of bakery products. Trends Food Sci. Technol. 2017, 67, 106–128. [Google Scholar] [CrossRef]
  22. Brown, C.R.; Wrolstad, R.; Durst, R.; Yang, C.P.; Clevidence, B. Breeding Studies in Potatoes Containing High Concentrations of Anthocyanins. Am. J. Potato Res. Off. Publ. Potato Assoc. Am. 2003, 80, 241–249. [Google Scholar] [CrossRef]
  23. Lachman, J.; Hamouz, K.; Šulc, M.; Orsák, M.; Pivec, V.; Hejtmánková, A.; Dvořák, P.; Čepl, J. Cultivar differences of total anthocyanins and anthocyanidins in red and purple-fleshed potatoes and their relation to antioxidant activity. Food Chem. 2009, 114, 836–843. [Google Scholar] [CrossRef]
  24. Nara, K.; Miyoshi, T.; Honma, T.; Koga, H. Antioxidative activity of bound-form phenolics in potato peel. Biosci. Biotechnol. Biochem. 2006, 70, 1489–1491. [Google Scholar] [CrossRef] [PubMed]
  25. Reyes, L.F.; Miller, J.C.; Cisneros-Zevallos, L. Antioxidant capacity, anthocyanins and total phenolics in purple-and red-fleshed potato (Solanum tuberosum L.) genotypes. Am. J. Potato Res. 2005, 82, 271–277. [Google Scholar] [CrossRef]
  26. Makarova, E.; Górnaś, P.; Konrade, I.; Tirzite, D.; Cirule, H.; Gulbe, A.; Pugajeva, I.; Seglina, D.; Dambrova, M. Acute anti-hyperglycaemic effects of an unripe apple preparation containing phlorizin in healthy volunteers: A preliminary study. J. Sci. Food Agric. 2015, 95, 560–568. [Google Scholar] [CrossRef]
  27. Rodríguez-Muela, C.; Rodríguez, H.E.; Arzola, C.; Díaz-Plascencia, D.; Ramírez-Godínez, J.A.; Flores-Mariñelarena, A.; Mancillas-Flores, P.F.; Corral, G. Antioxidant activity in plasma and rumen papillae development in lambs fed fermented apple pomace. J. Anim. Sci. 2015, 93, 2357–2362. [Google Scholar] [CrossRef] [PubMed] [Green Version]
  28. Zhu, F. Encapsulation and delivery of food ingredients using starch based systems. Food Chem. 2017, 229, 542–552. [Google Scholar] [CrossRef] [PubMed]
  29. PN-A-74108:1996; Bread—Research Methods. Polski Komitet Normalizacyjny: Warsaw, Poland, 1996. Available online: https://sklep.pkn.pl/pn-a-74108-1996p.html (accessed on 12 January 2023).
  30. Official Methods of Analysis of AOAC International—18th Edition, Revision 3. Available online: https://www.techstreet.com/standards/official-methods-of-analysis-of-aoac-international-18th-edition-revision-3?product_id=1678986 (accessed on 15 February 2021).
  31. International Commission on Illumination. Colorimetry, 3rd ed.; Commission Internationale de l’Eclairage: Vienna, Austria, 2004. [Google Scholar]
  32. Gumul, D.; Kruczek, M.; Ivanišová, E.; Słupski, J.; Kowalski, S. Apple Pomace as an Ingredient Enriching Wheat Pasta with Health-Promoting Compounds. Foods 2023, 12, 804. [Google Scholar] [CrossRef] [PubMed]
  33. Singleton, V.L.; Orthofer, R.; Lamuela-Raventós, R.M. [14] Analysis of total phenols and other oxidation substrates and antioxidants by means of folin-ciocalteu reagent. In Methods in Enzymology; Oxidants and Antioxidants Part A; Academic Press: Cambridge, MA, USA, 1999; Volume 299, pp. 152–178. [Google Scholar]
  34. Mazza, G.; Fukumoto, L.; Delaquis, P.; Girard, B.; Ewert, B. Anthocyanins, Phenolics, and Color of Cabernet Franc, Merlot, and Pinot Noir Wines from British Columbia. J. Agric. Food Chem. 1999, 47, 4009–4017. [Google Scholar] [CrossRef]
  35. Oomah, B.D.; Cardador-Martínez, A.; Loarca-Piña, G. Phenolics and antioxidative activities in common beans (Phaseolus vulgaris L). J. Sci. Food Agric. 2005, 85, 935–942. [Google Scholar] [CrossRef]
  36. El Hariri, B.; Sallé, G.; Andary, C. Involvement of flavonoids in the resistance of two poplar cultivars to mistletoe (Viscum album L.). Protoplasma 1991, 162, 20–26. [Google Scholar] [CrossRef]
  37. Re, R.; Pellegrini, N.; Proteggente, A.; Pannala, A.; Yang, M.; Rice-Evans, C. Antioxidant activity applying an improved ABTS radical cation decolorization assay. Free Radic. Biol. Med. 1999, 26, 1231–1237. [Google Scholar] [CrossRef] [PubMed]
  38. Neukom, H.; Rutz, W. Observations on starch retrogradation and bread stuffing. Lebensm. Wiss. Technol. Food Sci. Technol. 1981, 14, 292–295. [Google Scholar]
  39. Lukasiewicz, M.; Kowalski, S. Low power microwave-assisted enzymatic esterification of starch. Starch Stärke 2012, 64, 188–197. [Google Scholar] [CrossRef]
  40. Kusznierewicz, B.; Wolska, L.; Bartoszek, A.; Namiesnik, J. Charakterystyka polifenoli: Wystepowanie, wlasciwosci, przeglad metod analitycznych. Bromatol. Chem. Toksykol. 2005, 38, 81–92. [Google Scholar]
  41. Gallardo, C.; Jiménez, L.; García-Conesa, M.-T. Hydroxycinnamic acid composition and in vitro antioxidant activity of selected grain fractions. Food Chem. 2006, 3, 455–463. [Google Scholar] [CrossRef]
  42. Kita, A.; Bąkowska-Barczak, A.; Hamouz, K.; Kułakowska, K.; Lisińska, G. The effect of frying on anthocyanin stability and antioxidant activity of crisps from red- and purple-fleshed potatoes (Solanum tuberosum L.). J. Food Compos. Anal. 2013, 2, 169–175. [Google Scholar] [CrossRef]
  43. Nemś, A.; Pęksa, A.; Kucharska, A.Z.; Sokół-Łętowska, A.; Kita, A.; Drożdż, W.; Hamouz, K. Anthocyanin and antioxidant activity of snacks with coloured potato. Food Chem. 2015, 172, 175–182. [Google Scholar] [CrossRef]
  44. Petrova, P.; Petrov, K. Lactic Acid Fermentation of Cereals and Pseudocereals: Ancient Nutritional Biotechnologies with Modern Applications. Nutrients 2020, 12, 1118. [Google Scholar] [CrossRef] [Green Version]
  45. Casado, A.; Álvarez, A.; González, L.; Fernández, D.; Marcos, J.L.; Tornadijo, M.E. Effect of fermentation on microbiological, physicochemical and physical characteristics of sourdough and impact of its use on bread quality. Czech J. Food Sci. 2017, 35, 496–506. [Google Scholar] [CrossRef] [Green Version]
  46. Gänzle, M.G. Enzymatic and bacterial conversions during sourdough fermentation. Food Microbiol. 2014, 37, 2–10. [Google Scholar] [CrossRef]
  47. Lopez, H.W.; Krespine, V.; Guy, C.; Messager, A.; Demigne, C.; Remesy, C. Prolonged Fermentation of Whole Wheat Sourdough Reduces Phytate Level and Increases Soluble Magnesium. J. Agric. Food Chem. 2001, 49, 2657–2662. [Google Scholar] [CrossRef]
  48. Banu, I.; Vasilean, I.; Constantin, O.E.; Aprodu, I. Prediction of rye dough behaviour and bread quality using response surface methodology. Ir. J. Agric. Food Res. 2011, 50, 239–247. [Google Scholar]
  49. Stear, C.A. Handbook of Breadmaking Technology; Elsevier: London, UK, 1990. [Google Scholar]
  50. Gänzle, M.; Ripari, V. Composition and function of sourdough microbiota: From ecological theory to bread quality. Int. J. Food Microbiol. 2016, 239, 19–25. [Google Scholar] [CrossRef]
  51. König, H.; Unden, G.; Fröhlich, J. Biology of Microorganisms on Grapes, in Must and in Wine, 2nd ed.; Springer: Cham, Switzerland, 2018; ISBN 978-3-319-86760-1. [Google Scholar]
  52. Bjerrum, N. Zur Theorie der chemischen Reaktionsgeschwindigkeit. Z. Phys. Chem. 1924, 108, 82–100. [Google Scholar] [CrossRef]
  53. Ortiz de Erive, M.; Wang, T.; He, F.; Chen, G. Development of high-fiber wheat bread using microfluidized corn bran. Food Chem. 2020, 310, 125921. [Google Scholar] [CrossRef] [PubMed]
  54. Huang, G.; Guo, Q.; Wang, C.; Ding, H.H.; Cui, S.W. Fenugreek fibre in bread: Effects on dough development and bread quality. LWT Food Sci. Technol. 2016, 71, 274–280. [Google Scholar] [CrossRef]
  55. Özkaya, B.; Baumgartner, B.; Özkaya, H. Effects of concentrated and dephytinized wheat bran and rice bran addition on bread properties. J. Texture Stud. 2018, 49, 84–93. [Google Scholar] [CrossRef] [PubMed]
  56. Rezaei, S.; Najafi, M.A.; Haddadi, T. Effect of fermentation process, wheat bran size and replacement level on some characteristics of wheat bran, dough, and high-fiber Tafton bread. J. Cereal Sci. 2019, 85, 56–61. [Google Scholar] [CrossRef]
  57. Witczak, M.; Korus, J.; Ziobro, R.; Juszczak, L. The effects of maltodextrins on gluten-free dough and quality of bread. J. Food Eng. 2010, 96, 258–265. [Google Scholar] [CrossRef]
  58. Miyazaki, M.; Maeda, T.; Morita, N. Effect of various dextrin substitutions for wheat flour on dough properties and bread qualities. Food Res. Int. 2004, 1, 59–65. [Google Scholar] [CrossRef]
  59. Bialowas, B.; Szymanowski, K. Cutting forces during drilling and selected physical and mechanical properties of the finish coating based on epoxy resin. Ann. Wars. Univ. Life Sci. SGGW For. Wood Technol. 2020, 111, 106–115. [Google Scholar] [CrossRef]
  60. Hutchings, J.B. Food Colour and Appearance; Springer: New York, NY, USA, 1994; Volume 513. [Google Scholar]
  61. Pasqualone, A.; Laddomada, B.; Centomani, I.; Paradiso, V.M.; Minervini, D.; Caponio, F.; Summo, C. Bread making aptitude of mixtures of re-milled semolina and selected durum wheat milling by-products. LWT Food Sci. Technol. 2017, 78, 151–159. [Google Scholar] [CrossRef]
  62. Taranto, F.; Delvecchio, L.N.; Mangini, G.; Faro, L.D.; Blanco, A.; Pasqualone, A. Molecular and physico-chemical evaluation of enzymatic browning of whole meal and dough in a collection of tetraploid wheats. J. Cereal Sci. 2012, 3, 405–414. [Google Scholar] [CrossRef]
  63. Aguirre, J.F.; Osella, C.A.; Carrara, C.R.; Sánchez, H.D.; Buera, M.d.P. Effect of storage temperature on starch retrogradation of bread staling. Starch Stärke 2011, 63, 587–593. [Google Scholar] [CrossRef]
  64. Ding, S.; Yang, J. The effects of sugar alcohols on rheological properties, functionalities, and texture in baked products—A review. Trends Food Sci. Technol. 2021, 111, 670–679. [Google Scholar] [CrossRef]
  65. Arendt, E.K.; Ryan, L.A.M.; Dal Bello, F. Impact of sourdough on the texture of bread. Food Microbiol. 2007, 24, 165–174. [Google Scholar] [CrossRef]
  66. Guha, M.; Zakiuddin Ali, S. Molecular Degradation of Starch During Extrusion Cooking of Rice. Int. J. Food Prop. 2002, 5, 509–521. [Google Scholar] [CrossRef]
  67. Mihhalevski, A.; Heinmaa, I.; Traksmaa, R.; Pehk, T.; Mere, A.; Paalme, T. Structural Changes of Starch during Baking and Staling of Rye Bread. J. Agric. Food Chem. 2012, 60, 8492–8500. [Google Scholar] [CrossRef]
  68. De Vuyst, L.; Comasio, A.; Kerrebroeck, S.V. Sourdough production: Fermentation strategies, microbial ecology, and use of non-flour ingredients. Crit. Rev. Food Sci. Nutr. 2021, 63, 2447–2479. [Google Scholar] [CrossRef]
  69. Han, H.-M.; Koh, B.-K. Antioxidant activity of hard wheat flour, dough and bread prepared using various processes with the addition of different phenolic acids. J. Sci. Food Agric. 2011, 91, 604–608. [Google Scholar] [CrossRef] [PubMed]
  70. Alvarez-Jubete, L.; Arendt, E.K.; Gallagher, E. Nutritive value and chemical composition of pseudocereals as gluten-free ingredients. Int. J. Food Sci. Nutr. 2009, 60 (Suppl. 4), 240–257. [Google Scholar] [CrossRef] [PubMed]
  71. Enaru, B.; Drețcanu, G.; Pop, T.D.; Stǎnilǎ, A.; Diaconeasa, Z. Anthocyanins: Factors Affecting Their Stability and Degradation. Antioxidants 2021, 10, 1967. [Google Scholar] [CrossRef]
  72. Kim, K.-H.; Tsao, R.; Yang, R.; Cui, S.W. Phenolic acid profiles and antioxidant activities of wheat bran extracts and the effect of hydrolysis conditions. Food Chem. 2006, 95, 466–473. [Google Scholar] [CrossRef]
  73. Stojceska, V.; Ainsworth, P.; Plunkett, A.; İbanoğlu, Ş. The effect of extrusion cooking using different water feed rates on the quality of ready-to-eat snacks made from food by-products. Food Chem. 2009, 114, 226–232. [Google Scholar] [CrossRef]
  74. Maillard, M.-N.; Berset, C. Evolution of Antioxidant Activity during Kilning: Role of Insoluble Bound Phenolic Acids of Barley and Malt. J. Agric. Food Chem. 1995, 43, 1789–1793. [Google Scholar] [CrossRef]
  75. Rupasinghe, H.P.V.; Wang, L.; Huber, G.M.; Pitts, N.L. Effect of baking on dietary fibre and phenolics of muffins incorporated with apple skin powder. Food Chem. 2008, 107, 1217–1224. [Google Scholar] [CrossRef]
  76. Sivam, A.S.; Sun-Waterhouse, D.; Quek, S.; Perera, C.O. Properties of Bread Dough with Added Fiber Polysaccharides and Phenolic Antioxidants: A Review. J. Food Sci. 2010, 75, R163–R174. [Google Scholar] [CrossRef] [Green Version]
  77. Renard, C.M.; Baron, A.; Guyot, S.; Drilleau, J.F. Interactions between apple cell walls and native apple polyphenols: Quantification and some consequences. Int. J. Biol. Macromol. 2001, 29, 115–125. [Google Scholar] [CrossRef]
  78. Rohn, S.; Rawel, H.M.; Kroll, J. Inhibitory effects of plant phenols on the activity of selected enzymes. J. Agric. Food Chem. 2002, 50, 3566–3571. [Google Scholar] [CrossRef]
  79. Zhang, L.; Yang, X.; Li, S.; Gao, W. Preparation, physicochemical characterization and in vitro digestibility on solid complex of maize starches with quercetin. LWT Food Sci. Technol. 2011, 44, 787–792. [Google Scholar] [CrossRef]
Figure 1. Simplified diagram of bread manufacture process used in the study.
Applsci 13 07670 g001
Figure 2. (a) Differential molecular mass distributions of preparations. (b) Differential molecular mass distributions of polysaccharide fractions from bread crumb where preparations were added to the dough. (c) Differential molecular mass distributions of polysaccharide fractions from bread crumb where preparations were added to the sourdough.
Applsci 13 07670 g002aApplsci 13 07670 g002b
Table 1. Bread formulations.
Bread TypeSourdoughWheat FlourRye FlourWaterBaker’s YeastSaltPreparation
(g)
SB289 (rye flour)2004013128-
E0PP_T1289 (rye flour)190301312820 (E0PP)
E30PP_T1289 (rye flour)190301312820 (E30PP)
E40PP_T1289 (rye flour)190301312820 (E40PP)
E0PP_T2289 (rye flour),
30 (E0PP)
1905013128-
E30PP_T2289 (rye flour),
30 (E30PP)
1905013128-
E40PP_T2289 (rye flour),
30 (E40PP)
1905013128-
Table 2. Basic chemical characteristics of obtained preparations.
Sample nameChemical Composition
ProteinFatStarchAshCarbohydrates
(g/100 g DM)
E0PP0.28 c ± 0.030.39 c ± 0.0189.27 a ± 0.080.12 a ± 0.0010.44 a ± 0.02
E30PP2.81 b ± 0.000.45 b ± 0.0075.74 b ± 0.151.95 b ± 0.008.55 b ± 0.02
E40PP3.64 a ± 0.040.52 a ± 0.0173.66 c ± 0.082.35 c ± 0.005.67 c ± 0.02
Dietary fiber
Soluble fractionInsoluble fractionTotal
(g/100 g DM)
E0PP0.02 c ± 0.020 c ± 00.02 c ± 0.02
E30PP1.09 b ± 0.050.70 b ± 0.041.79 b ± 0.01
E40PP1.21 a ± 0.021.14 a ± 0.032.35 a ± 0.05
Total phenolic content—with F-C (mg catechin/100 g DM)Total phenolic content—without F-C (mg catechin/100 g DM)ABTS (mMTx/kg DM)
E0PP73.95 c ± 0.548.58 c ± 0.4313.67 c ± 0.02
E30PP905.98 b ± 1.6651.26 b ± 2.0270.48 b ± 0.67
E40PP1135.69 a ± 1.63807.93 a ± 1.2678.33 a ± 0.41
The other phenolic compounds
Phenolic acids (mg gallic acid/100 g DM)Flavonols
(mg quercetin/100 g DM)
Anthocyanins
(mg cyanidin-3-glucoside/100 g DM)
Flavonoids
(mg rutin/100 g DM)
E0PP0.00 c ± 0.000.00 c ± 0.000.00 c ± 0.001.22 c ± 0.07
E30PP89.50 b ± 2.8231.31 b ± 1.742.64 b ± 0.06266.44 b ± 0.91
E40PP116.6 a ± 6.4045.93 a ± 2.004.10 a ± 0.01358.56 a ± 1.03
The data are expressed as the mean ± standard deviation, with a minimum sample size of 2 (values denoted by the same letters in respective columns and within the analyzed parameter do not show statistically significant differences at the 0.05 level).
Table 3. Total titratable acidity (TTA) and pH of rye sourdough (standard) and sourdough with selected preparations.
Type of SourdoughpHTTA [mL 1 M NaOH/100 g Sample]
024 h48 h024 h48 h
standard6.11 cC ± 0.023.96 aB ± 0.053.89 aA ± 0.041.02 aA ± 0.1210.31 aB ± 0.3814.64 aC ± 0.65
E0PP6.10 cC ± 0.023.98 aB ± 0.013.83 aA ± 0.011.73 abA ± 0.109.84 aB ± 0.1414.77 abC ± 0.29
E30PP5.85 bC ± 0.013.95 aB ± 0.013.89 aA ± 0.011.71 bA ± 0.039.87 aB ± 0.0415.18 abC ± 0.58
E40PP5.78 aC ± 0.014.00 aB ± 0.013.85 aA ± 0.012.27 cA ± 0.1011.89 bB ± 0.0315.93 bC ± 0.21
The data are reported as the mean ± standard deviation, with a minimum sample size of 4 (values denoted by the same lowercase letters within respective columns are not statistically significant at the 0.05 level; values denoted by the same uppercase letters within respective rows are not statistically significant at the 0.05 level).
Table 4. Results of pH and acidity determinations for dough and bread crumb.
Type of Dough and BreadInitial pH of DoughpH of Dough after FermentationInitial TTA of DoughDough TTA after FermentationTTA of Bread Crumb
mL 1 M NaOH/100 g Sample
SB4.33 b ± 0.014.28 c ± 0.016.65 bc ± 0.657.11 c ± 0.185.95 b ± 0.26
E0PP_T14.29 c ± 0.004.28 c ± 0.017.39 a ± 0.478.13 b ± 0.075.96 b ± 0.01
E30PP_T14.32 b ± 0.014.35 a ± 0.016.65 bc ± 0.378.62 ab ± 0.136.49 a ± 0.15
E40PP_T14.37 a ± 0.014.33 ab ± 0.016.27 c ± 0.388.04 b ± 0.426.60 a ± 0.0
E0PP_T24.38 a ± 0.014.34 a ± 0.015.86 c ± 0.236.84 c ± 0.466.59 a ± 0.0
E30PP_T24.32 b ± 0.014.34 a ± 0.016.77 bc ± 0.158.98 a ± 0.076.50 a ± 0.14
E40PP_T24.37 a ± 0.014.31 b ± 0.016.32 c ± 0.068.62 ab ± 0.416.10 b ± 0.15
The data are presented as the mean ± standard deviation, with a minimum sample size of 4 (values denoted by the same letters within respective columns are not statistically significant at the 0.05 level).
Table 5. Qualitative features of bread made using the tested preparations.
Type of
Bread
Weight of Loaf
(g)
Volume (cm3)Yield (%)Baking Loss (%)
SB83.7 a ± 0.9198.13 b ± 1.83140.26 a ± 1.5116.26 b ± 0.90
E0PP_T182.98 ab ± 0.52192.16 d ± 1.91139.00 ab ± 0.8817.01 ab ± 0.52
E30PP_T183.04 ab ± 0.67189.21 e ± 2.25139.10 ab ± 1.1316.96 ab ± 0.68
E40PP_T183.11 ab ± 0.32189.39 e ± 0.89139.22 ab ± 0.5316.89 ab ± 0.32
E0PP_T282.59 b ± 0.24206.68 a ± 1.16138.33 b ± 0.4017.41 a ± 0.24
E30PP_T283.25 ab ± 0.53197.89 b ± 0.77139.45 ab ± 0.8916.75 ab ± 0.53
E40PP_T283.05 ab ± 0.11195.17 c ± 2.16139.10 ab ± 0.1916.95 ab ± 0.11
The data are presented as the mean ± standard deviation, with a minimum sample size of 6 (values denoted by the same letters within respective columns are not statistically significant at the 0.05 level).
Table 6. Color parameters for obtained bread.
Type of
Bread
CrumbCrust
L*a*b*ΔEL*a*b*ΔE
SB60.70 a ± 0.394.00 f ± 0.0319.25 de ± 0.06-52.62 b ± 0.3216.82 b ± 0.1936.82 a ± 0.14-
E0PP_T159.27 b ± 0.354.14 e ± 0.0519.42 d ± 0.141.46 c ± 0.3348.18 c ± 0.2717.54 a ± 0.0933.60 d ± 0.155.53 d ± 0.31
E30PP_T153.43 c ± 0.167.23 c ± 0.0424.62 b ± 0.069.60 b ± 0.1145.06 e ± 0.1414.37 c ± 0.1625.19 e ± 0.4014.09 a ± 0.41
E40PP_T150.99 d ± 0.307.96 b ± 0.0625.46 a ± 0.1412.19 d ± 0.1743.91 f ± 1.1017.54 a ± 0.5230.09 c ± 0.4311.04 b ± 1.16
E0PP_T260.71 a ± 0.243.97 f ± 0.0619.13 e ± 0.150.28 d ± 0.0955.96 a ± 0.299.78 d ± 0.0824.71 f ± 0.1714.40 a ± 0.19
E30PP_T253.37 c ± 0.347.10 d ± 0.0524.09 c ± 0.309.32 b ± 0.3743.81 f ± 0.5017.16 b ± 0.3929.03 d ± 0.4811.78 b ± 0.56
E40PP_T250.82 d ± 0.328.04 a ± 0.0524.74 b ± 0.1212.01 d ± 0.2147.02 d ± 1.0415.88 c ± 0.3928.94 d ± 0.569.75 c ± 0.85
The data are presented as the mean ± standard deviation, with a minimum sample size of 6 (values denoted by the same letters within respective columns are not statistically significant at the 0.05 level).
Table 7. Changes in the moisture content of the tested bread during storage.
Type of
Preparation Used
Crumb Moisture (g/100 g)
Baking DayAfter 24 hAfter 48 h
SB43.14 Ab ± 0.5141.75 aA ± 0.3641.20 aA ± 0.14
E0PP_T142.34 bB ± 0.3240.50 cA ± 0.4440.20 bA ± 0.08
E30PP_T142.44 bC ± 0.2340.96 bcB ± 0.2639.07 cA ± 0.02
E40PP_T142.37 bB ± 0.4041.72 aB ± 0.4040.11 bA ± 1.09
E0PP_T241.54 cC ± 0.3540.96 bcB ± 0.1140.03 bA ± 0.34
E30PP_T241.53 cB ± 0.2941.37 abB ± 0.1040.60 abA ± 0.21
E40PP_T242.05 bcB ± 0.3841.85 aA ± 0.2441.15 aA ± 0.21
The data are expressed as the mean ± standard deviation, with a minimum sample size of 4. Within each column, values sharing the same lower-case letters are not statistically significant at the 0.05 level. Likewise, within each row, values sharing the same upper-case letters are not statistically significant at the 0.05 level.
Table 8. Changes in textural characteristics of the tested bread during storage.
Type of BreadHardness (N)Cohesiveness (-)
Baking DayAfter 24 hAfter 48 hBaking DayAfter 24 hAfter 48 h
SB10.20 abA ± 1.2719.98 cdB ± 0.0927.16 aC ± 0.120.77 abC ± 0.020.60 abB ± 0.010.52 abA ± 0.0
E0PP_T111.34 aA ± 1.1222.45 aAB ± 0.3030.79 aB ± 8.250.75 cC ± 0.010.61 abB ± 0.010.51 abA ± 0.01
E30PP_T110.50 aA ± 0.9020.65 bB ± 0.1424.80 aC ± 0.020.79 bcC ± 0.010.63 bB ± 0.000.51 abA ± 0.02
E40PP_T19.81 abcA ± 0.1421.09 abB ± 0.2626.97 aB ± 3.780.80 aC ± 0.010.62 aB ± 0.020.53 aA ± 0.02
E0PP_T28.10 cA ± 0.1215.42 dB ± 0.5923.24 aC ± 1.070.77 abcC ± 0.000.58 bB ± 0.020.49 abA ± 0.03
E30PP_T28.08 cA ± 0.4618.52 cB ± 0.8022.51 aB ± 2.050.79 abC ± 0.000.59 abB ± 0.000.51 abA ± 0.00
E40PP_T28.52 bcA ± 0.0119.73 bcB ± 1.3023.18 aC ± 0.190.78 abcC ± 0.000.60 abB ± 0.010.47 bA ± 0.03
The data are expressed as the mean ± standard deviation, with a minimum sample size of 4. Within each column, values sharing the same lower-case letters are not statistically significant at the 0.05 level. Likewise, within each row, values sharing the same upper-case letters are not statistically significant at the 0.05 level.
Table 9. Chemical composition of obtained breads.
Type of BreadProteinFatAshDietary Fiber
InsolubleSolubleTotal
(g/100 g DM)
SB10.69 d ± 0.031.92 a ± 0.022.77 c ± 0.012.49 e ± 0.062.28 f ± 0.034.77 g ± 0.03
E0PP_T110.68 d ± 0.111.96 a ± 0.032.76 c ± 0.022.68 d ± 0.032.41 c ± 0.025.09 f ± 0.02
E30PP_T110.73 cd ± 0.051.72 bc ± 0.022.81 b ± 0.002.98 c ± 0.022.87 b ± 0.015.84 d ± 0.02
E40PP_T110.86 b ± 0.021.96 a ± 0.042.87 a ± 0.003.46 b ± 0.023.07 a ± 0.016.53 b ± 0.01
E0PP_T210.93 da ± 0.011.68 c ± 0.052.78 c ± 0.002.75 d ± 0.022.48 c ± 0.055.22 e ± 0.03
E30PP_T210.84 bc ± 0.041.89 a ± 0.022.82 b ± 0.013.08 c ± 0.052.87 b ± 0.055.95 c ± 0.00
E40PP_T210.83 bc ± 0.021.78 b ± 0.022.92 a ± 0.003.55 a ± 0.023.14 b ± 0.046.69 a ± 0.02
The data are presented as the mean ± standard deviation, with a minimum sample size of 2. Within each column, values sharing the same letters are not statistically significant at the 0.05 level.
Table 10. Structural parameters of tested samples.
SampleMn·10−3Mw·10−5ƉƉ
(g·mol−1)
E0PP61.7811.3918.4
E30PP51.138.7317.1
E40PP52.698.1215.4
SB47.289.2019.45
E0PP_T145.719.7021.20
E30PP_T135.008.7124.85
E40PP_T136.418.6423.75
E0PP_T258.4210.5718.15
E30PP_T235.698.6524.30
E40PP_T234.818.7025.0
Table 11. Phenolic compounds and antioxidant activity of enriched breads.
Type of
Bread
Total Phenolic Content
(mg Catechin/100 g DM)
ABTS
(mMTx/kg DM)
with F-Cwithout F-C
SB151.82 f ± 0.77149.49 de ± 2.4414.31 f ± 0.00
E0 PP_T1161.51 e ± 2.33147.76 e ± 9.7720.35 e ± 1.20
E30PP_T1255.18 c ± 0.0223.75 b ± 9.7730.39 c ± 1.64
E40PP_T11308.36 a ± 0.0975.07 a ± 7.3358.48 a ± 1.06
E0PP_T2133.85 g ± 0.78137.39 e ± 0.018.33 e ± 1.08
E30PP_T2189.72 d ± 1.55163.30 d ± 2.4524.97 d ± 0.76
E40PP_T2269.41 b ± 3.10204.76 c ± 2.4442.52 b ± 1.28
The data are presented as the mean ± standard deviation, with a minimum sample size of 3. Within each column, values sharing the same letters are not statistically significant at the 0.05 level.
Table 12. Content of other phenolic compounds in enriched breads.
Type of
Bread
Phenolic Acids
(mg Gallic Acid/100 g DM)
Flavonols
(mg Quercetin/100 g DM)
Anthocyanins (mg Cyanidin-3-Glucoside/100 g DM)Flavonoids
(mg Rutin/100 g DM)
SB7.16 e ± 0.332.11 c ± 0.401.8 b ± 1.18.04 e ± 0.0
E0PP_T18.35 de ± 0.680.00 d ± 0.00.0 c ± 0.012.69 d ± 0.60
E30PP_T115.76 b ± 1.016.94 b ± 0.818.0 a ± 1.124.94 b ± 1.20
E40PP_T170.24 a ± 0.3424.87 a ± 1.200.0 c ± 0.076.91 a± 2.98
E0PP_T25.24 f ± 0.340.97 cd ± 0.400.0 c ± 0.012.69 d ± 0.60
E30PP_T28.59 d ± 0.341.82 c ± 0.00.0 c ± 0.019.03 c ± 1.20
E40PP_T213.13 c ± 0.05.80 b ± 0.812.6 b ± 0.022.41 b ± 1.20
The data are presented as the mean ± standard deviation, with a minimum sample size of 3. Within each column, values sharing the same letters are not statistically significant at the 0.05 level.
Disclaimer/Publisher’s Note: The statements, opinions and data contained in all publications are solely those of the individual author(s) and contributor(s) and not of MDPI and/or the editor(s). MDPI and/or the editor(s) disclaim responsibility for any injury to people or property resulting from any ideas, methods, instructions or products referred to in the content.

