
CDF-LS: Contrastive Network for Emphasizing Feature Differences with Fusing Long- and Short-Term Interest Features
 and
and
Abstract
:1. Introduction
- Q1.
- Why train the long and short interest models separately?
- Q2.
- How does the integration module correct for interest bias?
- Q2.
- What is the versatility of our approach?
- A plug-and-play user long and short interest fusion module is designed, which can effectively and quickly fuse long and short interests using the shared attention mechanism, thus improving the model accuracy;
- The sources of interest bias are analyzed experimentally, and an improved ternary contrast loss function is introduced to accelerate the convergence of the model by using the bias between features as the index of the loss function;
- The effectiveness and generality of our proposed method is demonstrated by combining and experimenting several different long and short interest models on several different domain datasets with data of different sequence lengths as input.
2. Related Work
2.1. Entanglement Training
2.2. Disentanglement Training
2.3. Feature Fusion
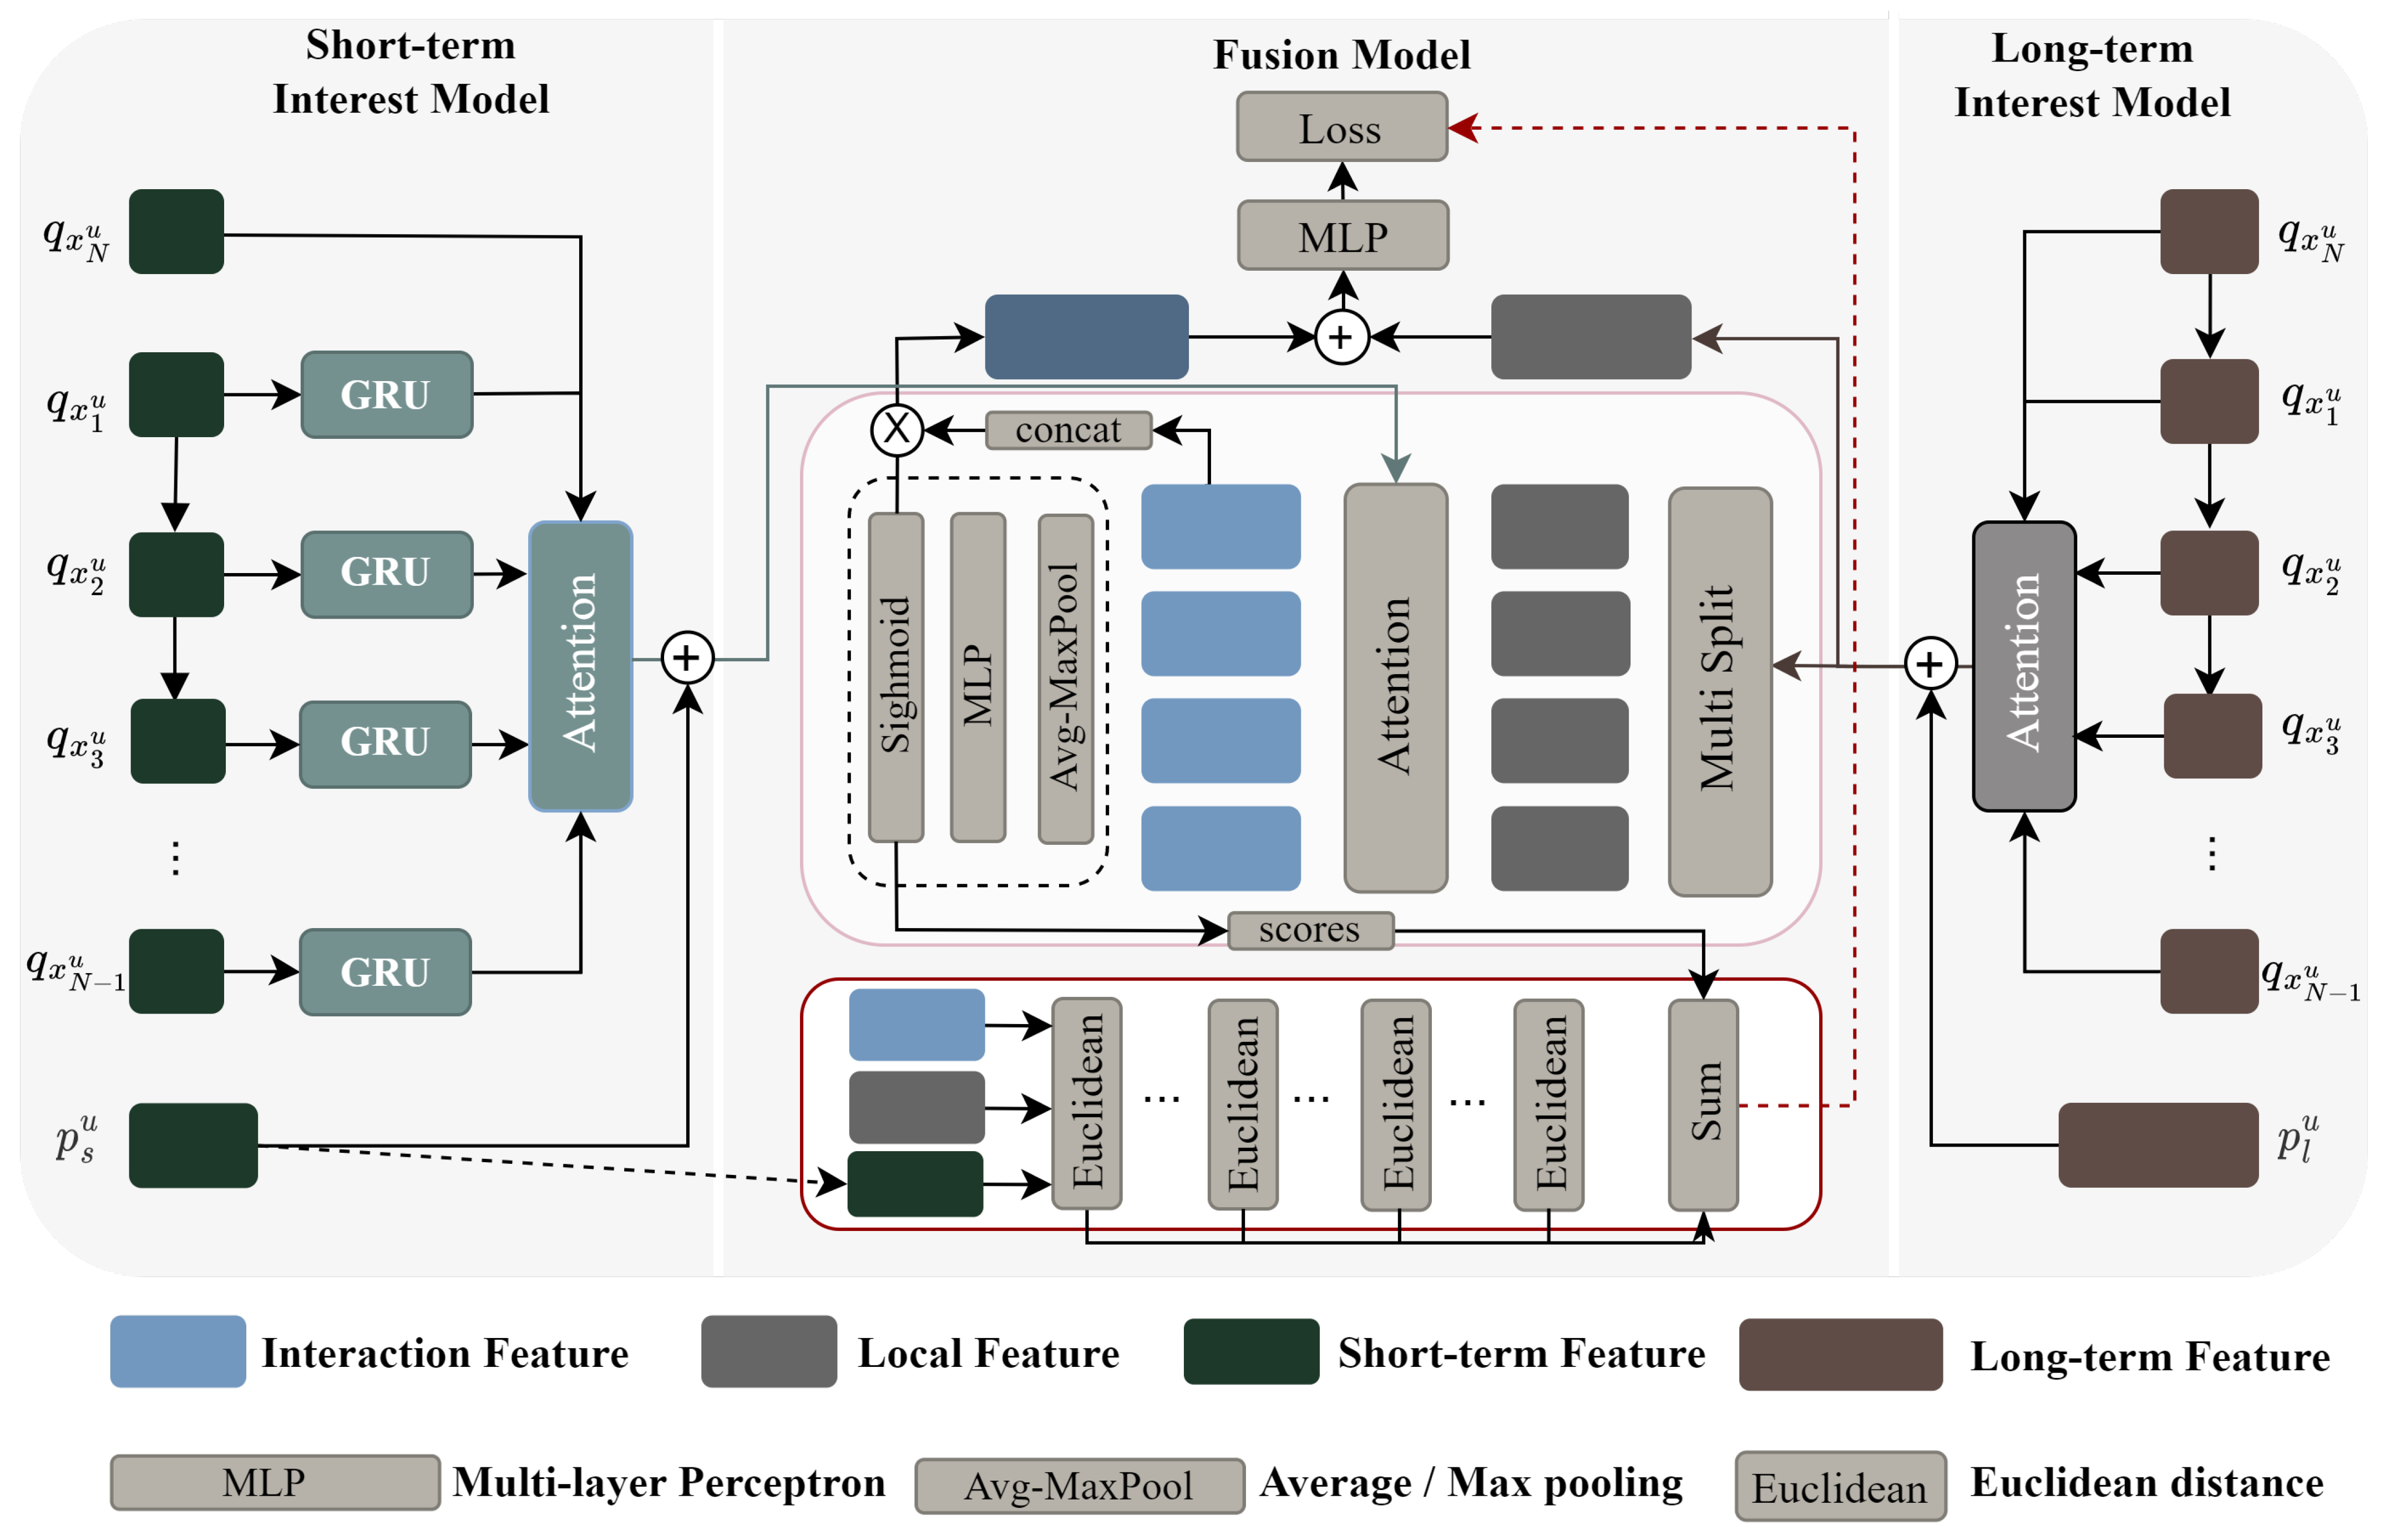
3. Our Approach
3.1. LS Interest Modeling
3.2. Fusion Module
3.3. Dynamic Decouple Loss
4. Experiments
- RQ1: How do our modules perform in practice?
- RQ2: What is the individual contribution of each component in our model?
- RQ3: Can our model effectively handle the complexity of sequence data with varying lengths across different scenarios?
4.1. Datasets and Experimental Setup
4.2. Competitors
4.3. Experimental Metrics
4.4. Overall Performance Comparison (RQ1)
- The overall performance of the short-term interest model is better. From the overall results, the short-term interest model is better overall than the long-term interest model because it can capture the actual by-sequence information of user interaction well. The results from DIN, PACA, and RCNN show that the length interest features are more informative, and if more effective methods can be used to fit the long-term interest features, the improvement of the models’ effectiveness is significant.
- The long-term interest model has the advantage of playing in two situations: a large variety of products and a long time span of user clicks. Although the short-term interest model is generally better, the short-term model does not necessarily outperform the long-term model for the two cases of large variety of items and long click time span. The RCNN and CASER models also use CNN networks, but CASER is slightly less effective than the RCNN model, but there is a large gap between them and FMLP, which indicates that the user’s pre-click data helps the model to capture long-term interest, but the short-term interest weight is generally larger than the long-term interest weight. The cold start problem is a difficult problem for both models, and the best results for the Yelp dataset are lower than the remaining three datasets, and there is a large gap between the long-term and short-term models, which verifies that fitting to the length of the sequence data and effective extraction of the sequence data are the keys to improve the performance.
- Joint modeling of long and short interests is a generally effective approach. Joint modeling of models somewhat alleviates the poor performance of independent models in cold starts, large span of user clicks, and many types of user clicks, but it is not always effective. NARM, LUTUTR, and SLIREC are trained by entangling long and short interests with each other, which somewhat increases the redundancy of the models, and the performance of SLIREC in ACC and F1 which are inadequate. In contrast, CLSR decouples the calculation of long and short interests, and the adaptive weighting fuses the long and short interest weights, which alleviates the training volume of the model, which makes up for the lack of realizations of SLIREC on Taobao.
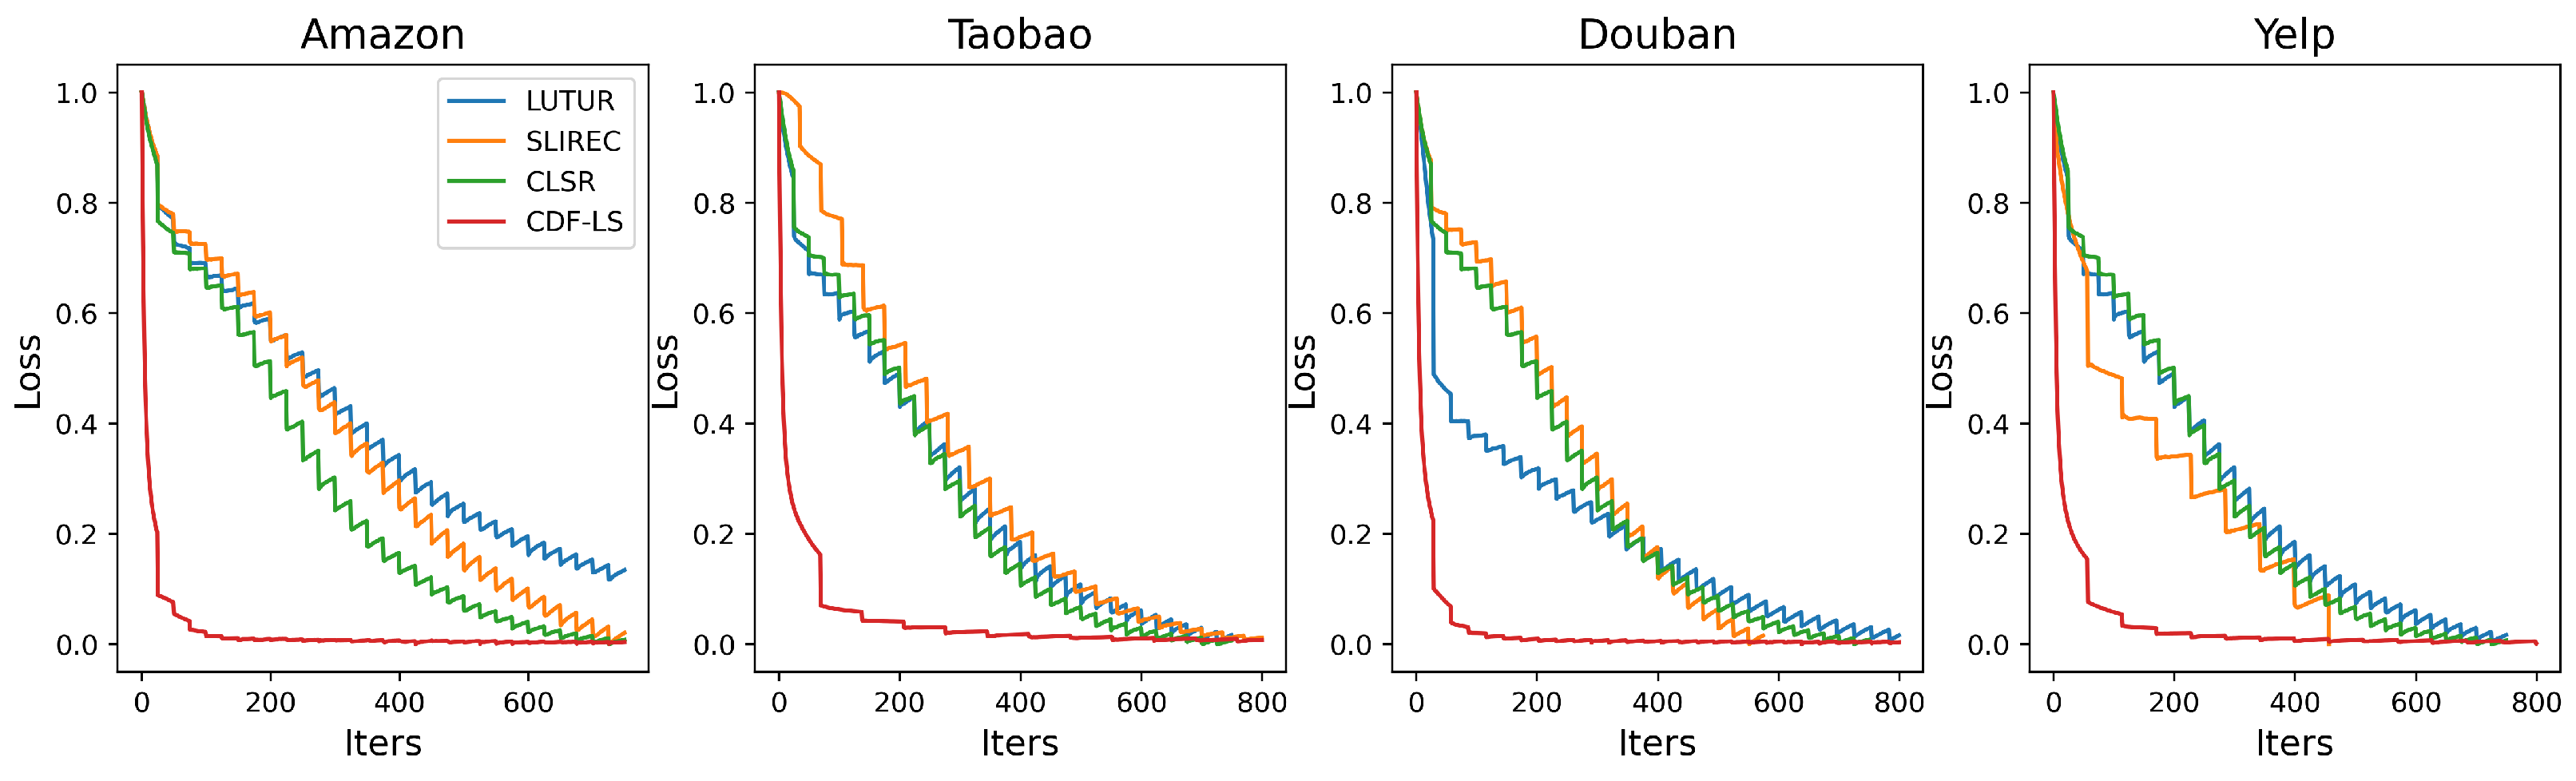
- Contrast learning and feature enhancement can effectively improve model performance. Our model differs slightly from the best comparison model CLSR on the data-rich dataset Taobao, but improves AUC by almost 0.01 on Douban, which has a much smaller variety of products, and for the cold-start case, our model leads CLSR in all metrics, and has into 1.3% improvement on the long time span Taobao dataset. The results from Table 3 also show that CDF-LS achieves a better balance in terms of computational cost. These all validate the effectiveness of contrast loss and feature enhancement.
4.5. Results of Ablation Experiments(RQ2)
4.5.1. Contrast Loss
4.5.2. Feature Fusion
4.6. Robustness Test Experimental Results (RQ3)
5. Conclusions
Author Contributions
Funding
Data Availability Statement
Conflicts of Interest
References
- An, M.; Wu, F.; Wu, C.; Zhang, K.; Liu, Z.; Xie, X. Neural news recommendation with long-and short-term user representations. In Proceedings of the 57th Annual Meeting of the Association for Computational Linguistics, Florence, Italy, 28 July–2 August 2019; pp. 336–345. [Google Scholar]
- Zhou, G.; Zhu, X.; Song, C.; Fan, Y.; Zhu, H.; Ma, X.; Yan, Y.; Jin, J.; Li, H.; Gai, K. Deep interest network for click-through rate prediction. In Proceedings of the 24th ACM SIGKDD International Conference on Knowledge Discovery & Data Mining, London, UK, 19–23 August 2018; pp. 1059–1068. [Google Scholar]
- Zhou, G.; Mou, N.; Fan, Y.; Pi, Q.; Bian, W.; Zhou, C.; Zhu, X.; Gai, K. Deep interest evolution network for click-through rate prediction. In Proceedings of the AAAI Conference on Artificial Intelligence, Honolulu, HI, USA, 27 January–1 February 2019; Volume 33, pp. 5941–5948. [Google Scholar]
- Covington, P.; Adams, J.; Sargin, E. Deep neural networks for youtube recommendations. In Proceedings of the 10th ACM Conference on Recommender Systems, Boston, MA, USA, 15–19 September 2016; pp. 191–198. [Google Scholar]
- He, X.; Liao, L.; Zhang, H.; Nie, L.; Hu, X.; Chua, T.S. Neural collaborative filtering. In Proceedings of the 26th International Conference on World Wide Web, Perth, Australia, 3–7 April 2017; pp. 173–182. [Google Scholar]
- Xu, G.; Wu, Z.; Zhang, Y.; Cao, J. Social networking meets recommender systems: Survey. Int. J. Soc. Netw. Min. 2015, 2, 64–100. [Google Scholar] [CrossRef]
- Koren, Y.; Bell, R.; Volinsky, C. Matrix factorization techniques for recommender systems. Computer 2009, 42, 30–37. [Google Scholar] [CrossRef]
- Chen, P.; Liu, H.; Xin, R.; Carval, T.; Zhao, J.; Xia, Y.; Zhao, Z. Effectively detecting operational anomalies in large-scale IoT data infrastructures by using a gan-based predictive model. Comput. J. 2022, 65, 2909–2925. [Google Scholar] [CrossRef]
- Liu, M.; Deng, J.; Yang, M.; Cheng, X.; Liu, N.; Liu, M.; Wang, X. Cost Ensemble with Gradient Selecting for GANs. In Proceedings of the Thirty-First International Joint Conference on Artificial Intelligence, IJCAI, Vienna, Austria, 23–29 July 2022; pp. 1194–1200. [Google Scholar] [CrossRef]
- Xie, T.; Cheng, X.; Wang, X.; Liu, M.; Deng, J.; Zhou, T.; Liu, M. Cut-thumbnail: A novel data augmentation for convolutional neural network. In Proceedings of the 29th ACM International Conference on Multimedia, Chengdu, China, 20–24 October 2021; pp. 1627–1635. [Google Scholar]
- Li, N.; Liu, Y.; Wu, Y.; Liu, S.; Zhao, S.; Liu, M. Robutrans: A robust transformer-based text-to-speech model. In Proceedings of the AAAI Conference on Artificial Intelligence, New York, NY, USA, 7–12 February 2020; Volume 34, pp. 8228–8235. [Google Scholar]
- Lv, F.; Jin, T.; Yu, C.; Sun, F.; Lin, Q.; Yang, K.; Ng, W. SDM: Sequential deep matching model for online large-scale recommender system. In Proceedings of the 28th ACM International Conference on Information and Knowledge Management, Beijing, China, 3–7 November 2019; pp. 2635–2643. [Google Scholar]
- Li, J.; Ren, P.; Chen, Z.; Ren, Z.; Lian, T.; Ma, J. Neural attentive session-based recommendation. In Proceedings of the 2017 ACM on Conference on Information and Knowledge Management, Singapore, 6–10 November 2017; pp. 1419–1428. [Google Scholar]
- Hidasi, B.; Karatzoglou, A.; Baltrunas, L.; Tikk, D. Session-based recommendations with recurrent neural networks. arXiv 2015, arXiv:1511.06939. [Google Scholar]
- Pi, Q.; Bian, W.; Zhou, G.; Zhu, X.; Gai, K. Practice on long sequential user behavior modeling for click-through rate prediction. In Proceedings of the 25th ACM SIGKDD International Conference on Knowledge Discovery & Data Mining, Anchorage, AK, USA, 4–8 August 2019; pp. 2671–2679. [Google Scholar]
- Pi, Q.; Zhou, G.; Zhang, Y.; Wang, Z.; Ren, L.; Fan, Y.; Zhu, X.; Gai, K. Search-based user interest modeling with lifelong sequential behavior data for click-through rate prediction. In Proceedings of the 29th ACM International Conference on Information & Knowledge Management, Virtual, 19–23 October 2020; pp. 2685–2692. [Google Scholar]
- Chang, J.; Gao, C.; Zheng, Y.; Hui, Y.; Niu, Y.; Song, Y.; Jin, D.; Li, Y. Sequential recommendation with graph neural networks. In Proceedings of the 44th International ACM SIGIR Conference on Research and Development in Information Retrieval, Virtual, 11–15 July 2021; pp. 378–387. [Google Scholar]
- Xu, C.; Zhao, P.; Liu, Y.; Xu, J.; Sheng, V.S.S.; Cui, Z.; Zhou, X.; Xiong, H. Recurrent convolutional neural network for sequential recommendation. In Proceedings of the The World Wide Web Conference, San Francisco, CA, USA, 13–17 May 2019; pp. 3398–3404. [Google Scholar]
- Zhao, W.; Wang, B.; Ye, J.; Gao, Y.; Yang, M.; Chen, X. PLASTIC: Prioritize Long and Short-term Information in Top-n Recommendation using Adversarial Training. IJCAI 2018, 3676–3682. [Google Scholar] [CrossRef] [Green Version]
- Song, Y.; Xin, R.; Chen, P.; Zhang, R.; Chen, J.; Zhao, Z. Identifying performance anomalies in fluctuating cloud environments: A robust correlative-GNN-based explainable approach. Future Gener. Comput. Syst. 2023, 145, 77–86. [Google Scholar] [CrossRef]
- Zheng, Y.; Gao, C.; Li, X.; He, X.; Li, Y.; Jin, D. Disentangling user interest and conformity for recommendation with causal embedding. In Proceedings of the Web Conference 2021, Ljubljana, Slovenia, 19–23 April 2021; Association for Computing Machinery: New York, NY, USA, 2021; pp. 2980–2991. [Google Scholar]
- Dong, D.; Zheng, X.; Zhang, R.; Wang, Y. Recurrent Collaborative Filtering for Unifying General and Sequential Recommender. IJCAI 2018, 3350–3356. [Google Scholar] [CrossRef] [Green Version]
- Bai, T.; Du, P.; Zhao, W.X.; Wen, J.R.; Nie, J.Y. A long-short demands-aware model for next-item recommendation. arXiv 2019, arXiv:1903.00066. [Google Scholar]
- Hu, L.; Li, C.; Shi, C.; Yang, C.; Shao, C. Graph neural news recommendation with long-term and short-term interest modeling. Inf. Process. Manag. 2020, 57, 102142. [Google Scholar] [CrossRef] [Green Version]
- Ma, M.; Wang, G.; Fan, T. Improved DeepFM Recommendation Algorithm Incorporating Deep Feature Extraction. Appl. Sci. 2022, 12, 1992. [Google Scholar] [CrossRef]
- Shao, J.; Qin, J.; Zeng, W.; Zheng, J. Multipointer Coattention Recommendation with Gated Neural Fusion between ID Embedding and Reviews. Appl. Sci. 2022, 12, 594. [Google Scholar] [CrossRef]
- Ho, T.L.; Le, A.C.; Vu, D.H. Multiview Fusion Using Transformer Model for Recommender Systems: Integrating the Utility Matrix and Textual Sources. Appl. Sci. 2023, 13, 6324. [Google Scholar] [CrossRef]
- Zuo, Y.; Liu, S.; Zhou, Y.; Liu, H. TRAL: A Tag-Aware Recommendation Algorithm Based on Attention Learning. Appl. Sci. 2023, 13, 814. [Google Scholar] [CrossRef]
- Liang, N.; Zheng, H.T.; Chen, J.Y.; Sangaiah, A.K.; Zhao, C.Z. TRSDL: Tag-Aware Recommender System Based on Deep Learning–Intelligent Computing Systems. Appl. Sci. 2018, 8, 799. [Google Scholar] [CrossRef] [Green Version]
- Kang, W.C.; McAuley, J. Self-attentive sequential recommendation. In Proceedings of the 2018 IEEE International Conference on Data Mining (ICDM), Singapore, 17–20 November 2018; pp. 197–206. [Google Scholar]
- Ma, C.; Ma, L.; Zhang, Y.; Sun, J.; Liu, X.; Coates, M. Memory augmented graph neural networks for sequential recommendation. In Proceedings of the AAAI Conference on Artificial Intelligence, New York, NY, USA, 7–12 February 2020; Volume 34, pp. 5045–5052. [Google Scholar]
- He, K.; Zhang, X.; Ren, S.; Sun, J. Deep residual learning for image recognition. In Proceedings of the IEEE Conference on Computer Vision and Pattern Recognition, Las Vegas, NV, USA, 27–30 June 2016; pp. 770–778. [Google Scholar]
- Srivastava, N.; Salakhutdinov, R.R. Multimodal learning with deep boltzmann machines. Adv. Neural Inf. Process. Syst. 2012, 25, 2222–2230. [Google Scholar]
- Volpi, R.; Morerio, P.; Savarese, S.; Murino, V. Adversarial feature augmentation for unsupervised domain adaptation. In Proceedings of the IEEE Conference on Computer Vision and Pattern Recognition, Salt Lake City, UT, USA, 18–23 June 2018; pp. 5495–5504. [Google Scholar]
- Feng, Y.; Lv, F.; Shen, W.; Wang, M.; Sun, F.; Zhu, Y.; Yang, K. Deep session interest network for click-through rate prediction. arXiv 2019, arXiv:1905.06482. [Google Scholar]
- Zhang, J.; Ma, C.; Mu, X.; Zhao, P.; Zhong, C.; Ruhan, A. Recurrent convolutional neural network for session-based recommendation. Neurocomputing 2021, 437, 157–167. [Google Scholar] [CrossRef]
- Yu, Z.; Lian, J.; Mahmoody, A.; Liu, G.; Xie, X. Adaptive User Modeling with Long and Short-Term Preferences for Personalized Recommendation. IJCAI 2019, 7, 4213–4219. [Google Scholar]
- Zhou, K.; Yu, H.; Zhao, W.X.; Wen, J.R. Filter-enhanced MLP is all you need for sequential recommendation. In Proceedings of the ACM Web Conference 2022, Lyon, France, 25–29 April 2022; pp. 2388–2399. [Google Scholar]
- Tang, J.; Wang, K. Personalized top-n sequential recommendation via convolutional sequence embedding. In Proceedings of the Eleventh ACM International Conference on Web Search and Data Mining, Los Angeles, CA, USA, 5–9 February 2018; pp. 565–573. [Google Scholar]


| DIN Model | User Histories | Sequences | Categories | Time Span | |||
|---|---|---|---|---|---|---|---|
| Length | Thread | ≤5 | ≥50 | ≤2 | ≥20 | ≤1 | ≥3300 |
| class | 31 | 34 | 2 | 67 | 41 | 39 | |
| 10 | popu | 0.016 | 0.005 | 0.000 | 0.008 | 0.010 | 0.005 |
| cross | 0.027 | 0.333 | 0.384 | 0.176 | 0.015 | 0.034 | |
| class | 67 | 87 | 52 | 41 | 47 | 64 | |
| 20 | popu | 0.010 | 0.008 | 0.004 | 0.016 | 0.032 | 0.012 |
| cross | 0.027 | 0.276 | 0.014 | 0.208 | 0.040 | 0.120 | |
| class | 145 | 165 | 164 | 144 | 201 | 193 | |
| 40 | popu | 0.014 | 0.005 | 0.007 | 0.010 | 0.003 | 0.005 |
| cross | 0.064 | 0.202 | 0.014 | 0.096 | 0.026 | 0.082 | |
| class | 189 | 98 | 202 | 89 | 141 | 133 | |
| 50 | popu | 0.018 | 0.001 | 0.008 | 0.010 | 0.009 | 0.012 |
| cross | 0.025 | 0.330 | 0.011 | 0.173 | 0.028 | 0.085 | |
| Datasets | Users | Items | Average Click Sequence | Average Click Categories | Average Click Time Span |
|---|---|---|---|---|---|
| Amazon | 19,240 | 63,001 | 8.780 | 8.780 | 1.050 |
| Taobao | 104,693 | 1,592,919 | 102.170 | 24.385 | 0.009 |
| Douban | 52,539 | 140,502 | 6.321 | 2.726 | 0.418 |
| Yelp | 1,542,656 | 209,393 | 3.956 | 3.025 | 0.324 |
| Model | Taobao | Yelp | ||||
|---|---|---|---|---|---|---|
| Params (G) | FLOPs (G) | Throughput (Samples/s) | Params (G) | FLOPs (G) | Throughput (Samples/s) | |
| LUTUR | 29.02 | 1.28 | 250,246.81 | 52.79 | 0.64 | 248,976.63 |
| SLIREC | 28.98 | 2.37 | 64,913.81 | 52.75 | 2.54 | 70,198.13 |
| CLSR | 29.0 | 1.62 | 98,586.71 | 52.77 | 1.62 | 102,487.96 |
| CDF-LS | 31.57 | 1.20 | 79,161.06 | 54.84 | 1.21 | 84,611.67 |
| Category | Long-Term | Short-Term | LS-Term | ||||||||||
|---|---|---|---|---|---|---|---|---|---|---|---|---|---|
| Dataset | Model | DIN | PACA | NARM | RCNN | CASER | GRU4REC | DIEN | FMLP | LUTUR | SLIREC | CLSR | CDF-LS |
| ACC | 0.7148 | 0.7057 | 0.7364 | 0.7698 | 0.7665 | 0.7747 | 0.7805 | 0.7881 | 0.7924 | 0.8002 | 0.8046 | 0.8014 | |
| Amazon | AUC | 0.8095 | 0.8154 | 0.8340 | 0.8465 | 0.8415 | 0.8574 | 0.8636 | 0.8716 | 0.8786 | 0.8773 | 0.8857 | 0.8824 |
| F1 | 0.7167 | 0.7096 | 0.7310 | 0.7668 | 0.7633 | 0.7789 | 0.7774 | 0.7830 | 0.7911 | 0.7973 | 0.8077 | 0.8096 | |
| ACC | 0.6895 | 0.7033 | 0.7021 | 0.7174 | 0.7122 | 0.7189 | 0.7296 | 0.7374 | 0.7561 | 0.7543 | 0.7607 | 0.7724 | |
| Taobao | AUC | 0.7624 | 0.7761 | 0.7723 | 0.8084 | 0.7096 | 0.8087 | 0.8390 | 0.8389 | 0.8391 | 0.8318 | 0.8388 | 0.8392 |
| F1 | 0.6941 | 0.7097 | 0.7029 | 0.7218 | 0.7145 | 0.7187 | 0.7279 | 0.7448 | 0.7719 | 0.7693 | 0.7691 | 0.7710 | |
| ACC | 0.8549 | 0.8440 | 0.8699 | 0.8740 | 0.8710 | 0.8811 | 0.8951 | 0.8941 | 0.9066 | 0.9018 | 0.9132 | 0.9134 | |
| Douban | AUC | 0.8974 | 0.8838 | 0.9174 | 0.9281 | 0.9204 | 0.9168 | 0.9286 | 0.9378 | 0.9454 | 0.9463 | 0.9481 | 0.9567 |
| F1 | 0.8577 | 0.8369 | 0.8787 | 0.8817 | 0.8763 | 0.8837 | 0.8938 | 0.8869 | 0.9010 | 0.9086 | 0.9047 | 0.9079 | |
| ACC | 0.6566 | 0.6610 | 0.6834 | 0.7093 | 0.7307 | 0.7399 | 0.7524 | 0.7580 | 0.7630 | 0.7719 | 0.7818 | 0.7907 | |
| Yelp | AUC | 0.7035 | 0.7271 | 0.7319 | 0.7504 | 0.7809 | 0.7807 | 0.8036 | 0.8073 | 0.8098 | 0.8122 | 0.8164 | 0.8204 |
| F1 | 0.6589 | 0.6683 | 0.6803 | 0.7017 | 0.7393 | 0.7271 | 0.7513 | 0.7515 | 0.7641 | 0.7783 | 0.7730 | 0.7943 | |
| Model | Contrast | Weights | Amazon | Yelp | ||
|---|---|---|---|---|---|---|
| AUC | F1 | AUC | F1 | |||
| LUTUR | ✔ | 0.8804 + 0.0018 | 0.8013 + 0.0102 | 0.8149 + 0.0051 | 0.7736 + 0.0095 | |
| ✔ | ✔ | 0.8820 + 0.0034 | 0.8049 + 0.0136 | 0.8157 + 0.0059 | 0.7746 + 0.0105 | |
| SLIREC | ✔ | 0.8853 + 0.0080 | 0.8051 + 0.0078 | 0.8166 + 0.0044 | 0.7804 + 0.0021 | |
| ✔ | ✔ | 0.8861 + 0.0088 | 0.8064 + 0.0091 | 0.8171 + 0.0049 | 0.7847 + 0.0063 | |
| CLSR | ✔ | ✔ | 0.8859 + 0.0002 | 0.8101 + 0.0024 | 0.8217 + 0.0053 | 0.7881 + 0.0151 |
| Model | Fusion | Amazon | Yelp | ||
|---|---|---|---|---|---|
| AUC | F1 | AUC | F1 | ||
| DIN + CASER | ✗ | 0.8640 + 0.0225 | 0.7811 + 0.0178 | 0.7988 + 0.0179 | 0.7439 + 0.0046 |
| ✔ | 0.8715 + 0.0300 | 0.7866 + 0.0233 | 0.8123 + 0.0314 | 0.7501 + 0.0118 | |
| NARM + DIEN | ✗ | 0.8695 + 0.0059 | 0.7854 + 0.0008 | 0.8101 + 0.0065 | 0.7613 + 0.0100 |
| ✔ | 0.8763 + 0.0127 | 0.7878 + 0.0104 | 0.8160 + 0.0124 | 0.7729 + 0.0216 | |
| PACA + GRU4REC | ✗ | 0.8641 + 0.0067 | 0.7811 + 0.0022 | 0.8010 + 0.0203 | 0.7684 + 0.0413 |
| ✔ | 0.8720 + 0.0146 | 0.7869 + 0.0080 | 0.8103 + 0.0296 | 0.7700 + 0.0429 | |
| RCNN + FMLP | ✗ | 0.8740 + 0.0024 | 0.7846 + 0.0016 | 0.8074 + 0.0001 | 0.7517 + 0.0002 |
| ✔ | 0.8809+ 0.0093 | 0.7903+ 0.0073 | 0.8166+ 0.0093 | 0.7624+ 0.0109 | |
| Model | Sequences | Amazon | Yelp | |||||
|---|---|---|---|---|---|---|---|---|
| 20 | 30 | 40 | 50 | AUC | F1 | AUC | F1 | |
| DIN + CASER | ✔ | ✔ | 0.8427 | 0.7696 | 0.7909 | 0.7415 | ||
| ✔ | ✔ | 0.8715 | 0.7866 | 0.8123 | 0.7501 | |||
| ✔ | ✔ | 0.8753 | 0.7917 | 0.8149 | 0.7553 | |||
| ✔ | ✔ | 0.8631 | 0.7898 | 0.8077 | 0.7430 | |||
| ✔ | ✔ | 0.8649 | 0.7910 | 0.8083 | 0.7431 | |||
| ✔ | ✔ | 0.8548 | 0.7704 | 0.7905 | 0.7257 | |||
| FMLP + RCNN | ✔ | ✔ | 0.8701 | 0.7792 | 0.8075 | 0.7547 | ||
| ✔ | ✔ | 0.8809 | 0.7903 | 0.8166 | 0.7724 | |||
| ✔ | ✔ | 0.8847 | 0.7953 | 0.8189 | 0.7764 | |||
| ✔ | ✔ | 0.8703 | 0.7765 | 0.8086 | 0.7561 | |||
| ✔ | ✔ | 0.8761 | 0.7846 | 0.8137 | 0.7704 | |||
| ✔ | ✔ | 0.8602 | 0.7739 | 0.8060 | 0.7433 | |||
Disclaimer/Publisher’s Note: The statements, opinions and data contained in all publications are solely those of the individual author(s) and contributor(s) and not of MDPI and/or the editor(s). MDPI and/or the editor(s) disclaim responsibility for any injury to people or property resulting from any ideas, methods, instructions or products referred to in the content. |
© 2023 by the authors. Licensee MDPI, Basel, Switzerland. This article is an open access article distributed under the terms and conditions of the Creative Commons Attribution (CC BY) license (https://creativecommons.org/licenses/by/4.0/).
Share and Cite
Liu, K.; Wang, W.; Wang, R.; Cui, X.; Zhang, L.; Yuan, X.; Li, X. CDF-LS: Contrastive Network for Emphasizing Feature Differences with Fusing Long- and Short-Term Interest Features. Appl. Sci. 2023, 13, 7627. https://doi.org/10.3390/app13137627
Liu K, Wang W, Wang R, Cui X, Zhang L, Yuan X, Li X. CDF-LS: Contrastive Network for Emphasizing Feature Differences with Fusing Long- and Short-Term Interest Features. Applied Sciences. 2023; 13(13):7627. https://doi.org/10.3390/app13137627
Chicago/Turabian StyleLiu, Kejian, Wei Wang, Rongju Wang, Xuran Cui, Liying Zhang, Xianzhi Yuan, and Xianyong Li. 2023. "CDF-LS: Contrastive Network for Emphasizing Feature Differences with Fusing Long- and Short-Term Interest Features" Applied Sciences 13, no. 13: 7627. https://doi.org/10.3390/app13137627