1. Introduction
The process of rapid urbanization in the last few decades has increased the urban density. In most cases, new buildings and urban blocks are not built with consideration for effective ventilation inside them. Air pollutants cannot be diluted quickly enough and this can cause problems for the populations living in these areas. Failing to provide high-quality air can put people at risk of respiratory disease and other health issues [
1,
2]. Air pollution is worsening in most cities worldwide. More than half of the urban population lives in places that have more than six-times higher levels of air contamination compared to the levels recommended in the WHO air quality guidelines [
3].
Evaluation of the air conditions in an urban environment is paramount for air quality management. Outdoor air quality directly impacts indoor air quality through natural or mechanical ventilation. Stagnant outdoor airflow near windows can influence the natural ventilation capacity inside the building and increase the density of air pollutants. The airflow that is observed as stagnant does not have to have a velocity value of 0 m/s. Very slow velocities can have similar effects, and those are common in outdoor urban environments.
An urban city block’s density and its morphological characteristics are crucial for the local ventilation performance and pollutant dispersion [
4]. Airflow simulations in an urban environment are usually limited to representing only how wind intensity and direction influence the outdoor space of the buildings. More research needs to be done in order to highlight the problematic areas in terms of air quality around individual houses or apartments. The geometrical characteristics of the block can change, but most parts are immutable. It is possible to change the type of ventilation in critical areas from natural to mechanical, even in cases where there is no possibility of removing structures inside the block. Developing a method for low air-quality area analysis is very important. Methods used for the detection of critical stagnant air areas have complexity regarding wind velocities and directions. The issue cannot be solved by simulation of one wind-tunnel scenario. Multiple wind direction simulations on one urban block or building are well studied in the literature; however, to our knowledge, there are no published papers with the goal of presenting the results synthesized from multiple simulations that account for conditions throughout the year. The method described in our paper addresses this issue. Assessment of air quality should address all possible wind directions and every velocity for every day throughout the year. This could be interpreted as a task requiring hundreds of simulations for each variation. Because this is a time-consuming task, some simplification is required regarding the number of analyses. To overcome the issues related to the previously stated problems, we propose a novel method that can identify areas with the most stagnant air in an urban block environment directly on the 3D mesh. This method presents the results in a form where stagnant air areas are highlighted from data that represent the wind conditions from most of the year.
The paper is structured as follows:
Section 2 presents related work and the literature review on the CFD simulations used in the context of urban airflow. In
Section 3, the overview of the framework for the proposed method is outlined. In the same section, the procedures of the method are described in detail.
Section 4 presents the results of the method described in this paper in respect of 8 blocks with different urban morphologies. The discussion of the results is included in the same section.
Section 5 describes the main findings, suggestions for further research, and some limitations of the study.
2. Related Work
There are multiple studies on natural ventilation, including theoretical, analytical, and experimental approaches, and using computational fluid dynamics (CFD). The CFD method represents a computer simulation method that can analyze air flows using numerical analysis and data structures. CFD simulation accounts for about 70% of the scientific research on natural ventilation [
5]. CFD analysis is fast and relatively low-cost compared to other methods, but the results are less accurate. Comparative studies of different methods describe this method as having a high level of accuracy [
6,
7] and being suitable for scientific model experiments. In recent decades, this has been achieved by developing more accurate turbulence models, increasing the power of computer hardware, and producing guidelines for best practice [
8,
9].
One of the aspects of CFD simulation represents the quality of 3D models of urban environments. The studies in a number of cases simplify the urban block geometry to cubical form [
10,
11,
12,
13]. These studies are mostly conducted to obtain results that are general in nature in order to observe the influence of external conditions on the temperature, pressure, turbulence, or velocity in a generic urban environment. Simulations on real-life urban blocks [
14,
15,
16], in contrast, are used in order to study urban environments in detail.
It is necessary to test scenarios with different wind directions for natural ventilation analysis. Teittel et al. [
17] experimented with the airflow from four clustered directions. The building in this study was an open-terrain greenhouse, and the researchers found a significant effect of the wind direction on the flow patterns inside the house. Norton et al. [
18] performed CFD simulation in similar conditions in an open field. They studied various situations by changing the wind direction from 0 to 90 degrees in intervals of 10 degrees. The results show a correlation between the air exchange rate from the outdoor to the indoor space and the wind direction. Horan and Finn [
19] studied natural ventilation using CFD simulation with a model of a simple cubic building. Four different wind directions were studied, and they concluded that wind direction has a high impact on the natural ventilation rate. All three examples used only one building for the experiment.
Hooff et al. [
15] performed CFD simulations on a stadium building with and without surrounding buildings. The eight wind directions, represented as all cardinal and ordinal directions, were used as boundary conditions with one velocity. The study showed that surrounding structures can influence the airflow results by up to 96% and concluded that natural ventilation performance should be studied in a larger urban area. This study also showed that 2 wind directions can have a difference in airflow up to 152%, so the choice of directions inside the wind tunnel has a high impact on the final results. Research by Wiren [
20] also included surrounding buildings in the CFD simulation. Wiren concluded that wind pressure distributions and ventilative heat losses were influenced considerably if more than one building was included in the research. Costola et al. [
21], in their review paper, stated that very little data exist on urban surroundings and the related sheltering effect. This observation was further supported by Hooff et al. [
15], who stated that detailed studies on the effect of the wind direction and surrounding buildings on indoor natural ventilation in an urban environment are not commonly performed. In studies of natural ventilation, there are two main approaches in regard to indoor and outdoor air simulations. The coupled outdoor and indoor air flows are mixed in CFD simulations. There are multiple studies using this approach [
10,
15,
22]. The decoupled approach observes indoor and outdoor spaces separately and performs simulations on different geometries. This approach has an advantage for larger systems where the potential of natural ventilation is calculated. Weerasuriya et al. [
23] used building information modeling (BIM) to estimate the potential of natural ventilation of high-rise structures using the decoupled approach. Gan et al. [
24] also used this approach in their research. They conducted CFD simulations on five buildings with complex shapes to calculate the wind pressure on the exterior surfaces and used data as input for the deep neural network model. The results predicted air change rates for different apartments inside the structures. Although the coupled approach can give higher accuracy results, this approach is harder to implement when multiple windows and doors can be opened or closed in simulations.
3. Model for Urban Area Air Quality Analysis Based on CFD Simulations
The main focus of this research was to generate a complex analysis containing crucial data that can easily be interpreted by urban designers. Frameworks such as those presented by Perisić et al. [
25] propose systems in which multiple simulations from different fields of study, such as wind analysis, illumination, or energy efficiency, can be performed on an urban block environment. The models of buildings would be uniformly represented, and the results of the simulations would be read in a way that can identify critical areas which are not suitable for windows or living spaces. In this paper, buildings inside the analyzed block are represented without windows and doors. Every vertical surface of the analyzed geometry is a potential location for a window. This assumption is made in order to assess the domain that cannot be easily changed by urban developers or inhabitants. If the area with stagnant air is detected near windows used for the natural ventilation of living spaces, the new opening can be placed in a more suitable location. Excluding windows and doors can change the air flow, but mostly when the circulation is provided inside of the building. In order to reduce the complexity of the simulations, we excluded natural ventilation potential from inside the buildings, although we acknowledge the recent adoption of BIM technologies in the construction industry and the potential that most of the interior space of urban block buildings could be fully represented and available in the future. Another problem for urban block natural ventilation assessment is that simulations can give different results if only certain doors and windows are opened. The results can be different in scenarios where all the doors and windows are opened, all are closed, or when combinations of dozens or hundreds of doors and windows inside the block are opened or closed. For each combination, a new model must be prepared. Although the results will not reflect the complexity of real conditions in every aspect, the model presented in this paper reduces the complexity of certain aspects of geometry. This is done in order to significantly reduce the computational time.
Several studies [
26,
27,
28] have made a connection between stagnant air outside of buildings with higher air pollution and human health issues for the inhabitants of an urban area. In this regard, in this study, we consider air stagnation in the urban block environment in close proximity to windows as the air of low quality. In this research, air quality is a parameter that can have either a high or a low value. A low value is considered for air velocities that do not meet the minimum requirement for air circulation, which is 0.15 m/s. This threshold was chosen based on several studies [
29,
30,
31]. The number is a variable that can be changed based on research preferences. The results are a graphical representation of the areas with stagnant air on surfaces of the 3D model of the analyzed urban block. The problem is presented in respect of not just one, but eight wind directions in order to provide results that can illustrate to users more accurate data in respect of natural ventilation throughout the year. The surfaces representing the walls of buildings do not have velocity parameters, so in order to represent the results, the assumption is made that if the area that is 1 m away from a part of a wall has an average velocity lower than the threshold, that part of the wall is labeled as a stagnant air area.
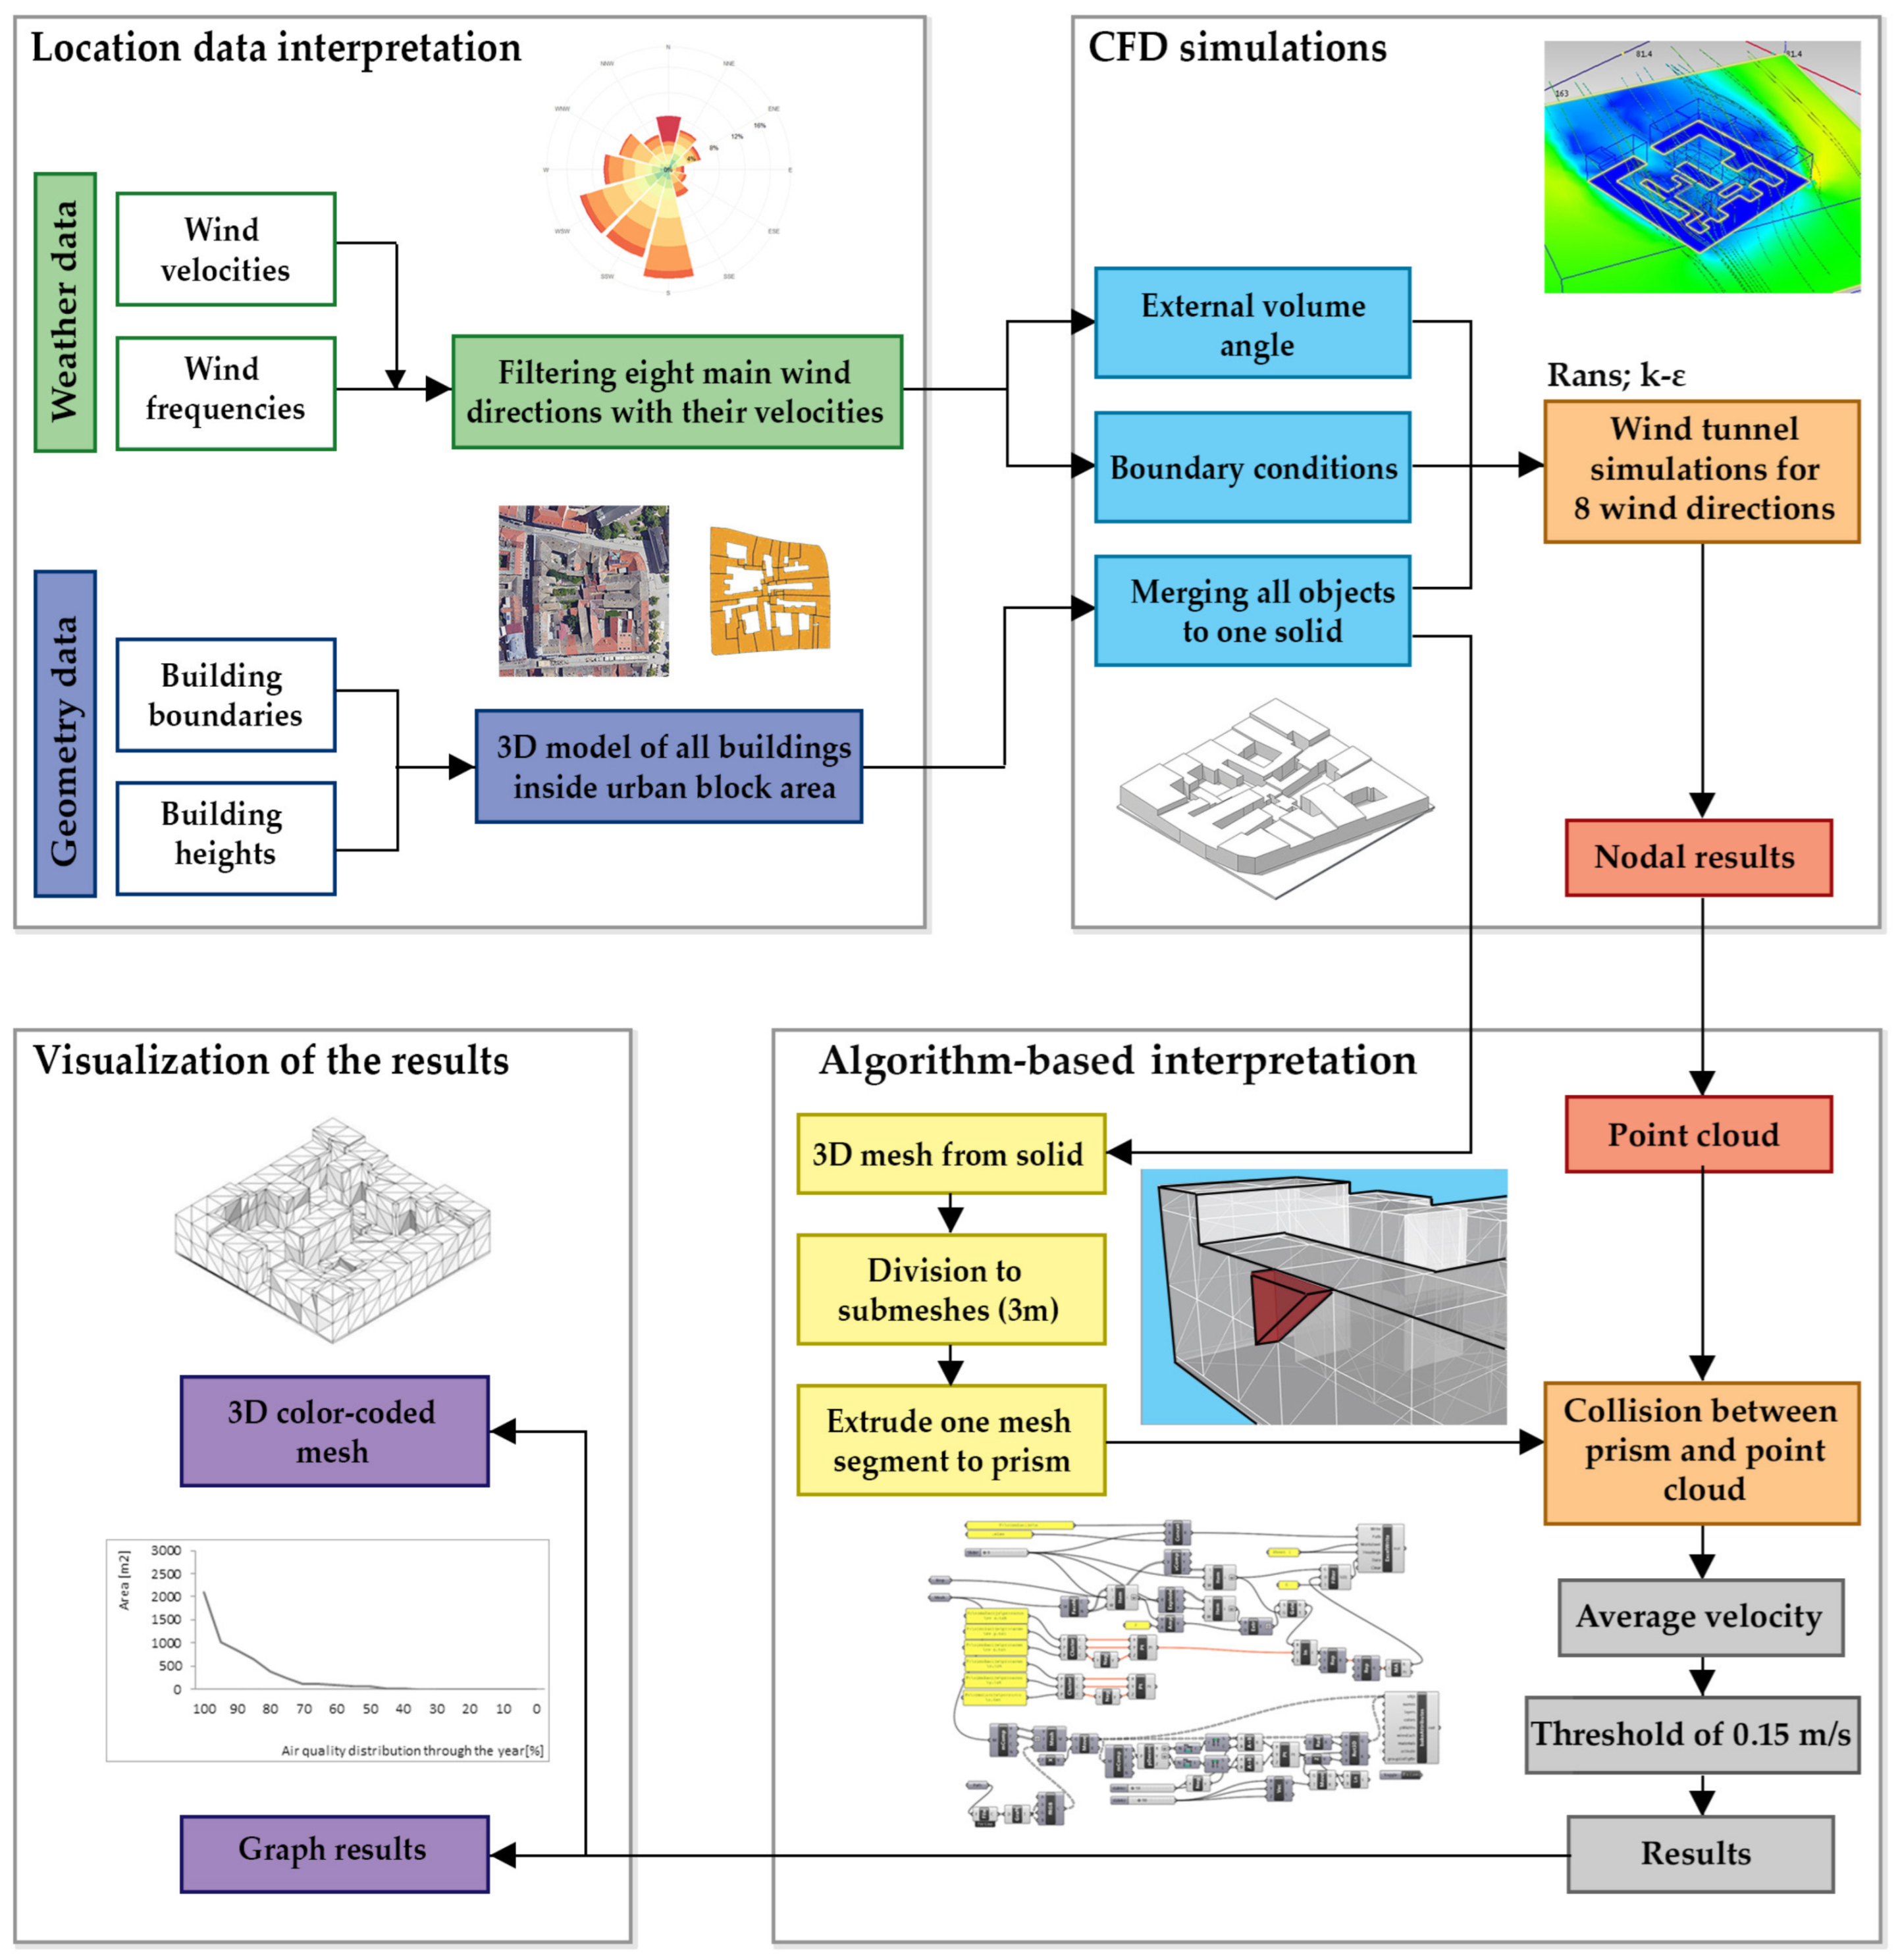
Our framework consists of the following procedures:
First, the geometry of the 3D models representing the urban environment are optimized (
Section 3.1). Second, the main wind directions are chosen for the simulation (
Section 3.2). Third, simulations in CFD software are performed (
Section 3.3). Fourth, the algorithm is used to interpret the results (
Section 3.4). Fifth, visualization of the results are conducted (
Section 3.5).
Figure 1 shows the process of the method used to perform the air quality analysis of an urban block based on CFD simulations.
This method has two main input parameters. The first parameter is the geometry of the buildings and the second is location. The geometry of the urban block is extracted from the geospatial data from the chosen location. The graphical outputs of this method visualize highlighted areas on the 3D mesh representing the problematic area and graph results.
3.1. Geometry Optimization
The geometry of objects in CFD simulations is usually optimized, especially on models representing urban blocks. It is possible to construct models automatically or semi-automatically using geospatial data [
32,
33]. The manual 3D modeling approach is also possible with consideration of the real object represented. In this study, the manual approach is used, and it has several constraints:
- (a)
buildings are modeled individually from a reliable source;
- (b)
the ground shape of the buildings is extruded;
- (c)
roof slopes are not modeled, because of complexity;
- (d)
the smallest edge in the model is 30 cm;
- (e)
vegetation is not modeled;
- (f)
only areas that exceed 150 cm on the facade are modeled;
- (g)
buildings are merged into one solid object for simulation optimization.
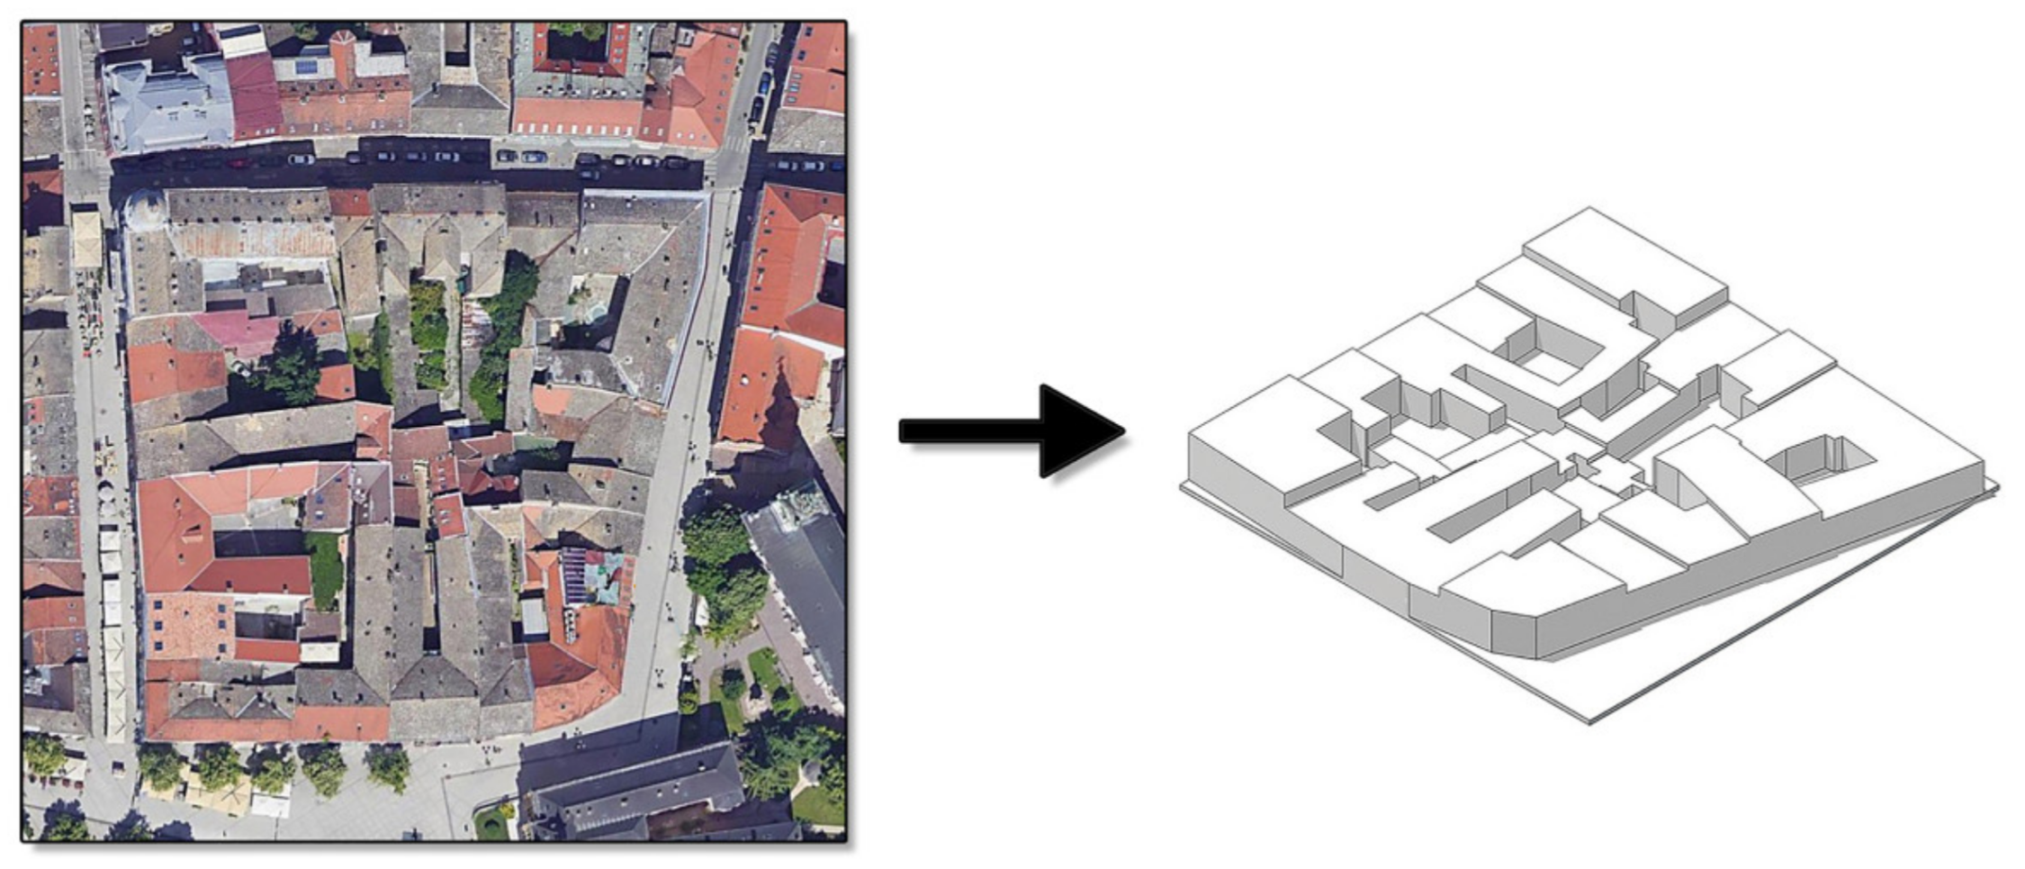
In
Figure 2, the real-world block and the block model are presented.
The geometrical model was loaded into the CFD software for the analysis. It was also triangulated for the further analysis described in
Section 3.4. The surface of the model was divided into sub surfaces no more than 3 m by 3 m, and then triangulated.
3.2. Wind Directions
Before the CFD simulations were run, the main wind directions and velocities were calculated. There are 16 cardinal, ordinal, and intercardinal wind directions, and most measurements represent their velocities and frequencies. Using all of the wind directions is possible, but it is very time-consuming. We excluded eight directions from the analysis to simplify the model and lower the computing time by half. Winds were excluded based on frequency criteria, which represent the following process: (1) finding relative frequencies of all wind directions during the year for a given location; (2) sorting the data based on the highest number of relative frequencies; (3) including the first eight wind directions, which will provide data for most of the time throughout the year.
In
Table 1, an example is shown for the city of Novi Sad, Serbia. The 8 most frequent directions represent data for 57% of all situations per year. The data also show that, on average, for 87% of the year no wind is detected at the location. In windless conditions, the results will show velocities of 0 m/s inside the urban block and poor ventilation conditions. From the perspective of our research, 65.8% of all wind conditions are included in this example. For the cities Belgrade, Smederevska Palanka, and Sjenica, the values would be 76%, 76%, and 80%, respectively. The percentage of relative frequencies of the excluded wind directions is not insignificant, but it can be a valid way of considering the setup and computational time for the analyses.
The directions and their corresponding velocities are the basic conditions for wind tunnel simulation in CFD software.
3.3. CFD Simulations
The software used in this study was Autodesk CFD [
35], but the method is not limited to specific software. The Reynolds-averaged Navier–Stokes (RANS) model and the Chen–Kim k–ε turbulence model [
36] were adopted for the computation. These models are used in most research on fluid dynamics in built environments [
4,
37,
38] for their relative precision and speed. The finite element method was used for numerically solving differential equations, and the modified Petrov–Galerkin method was used as the upwind method. The mesh resolution was set to 0.5 m and the mesh was divided into hexahedral elements. The material used for the fluid was standard air material and the analysis was set as steady state. The building and ground material was set as generic concrete material. The computational domain and boundary conditions were based on the Architectural Institute of Japan standards and the COST group guidelines [
39,
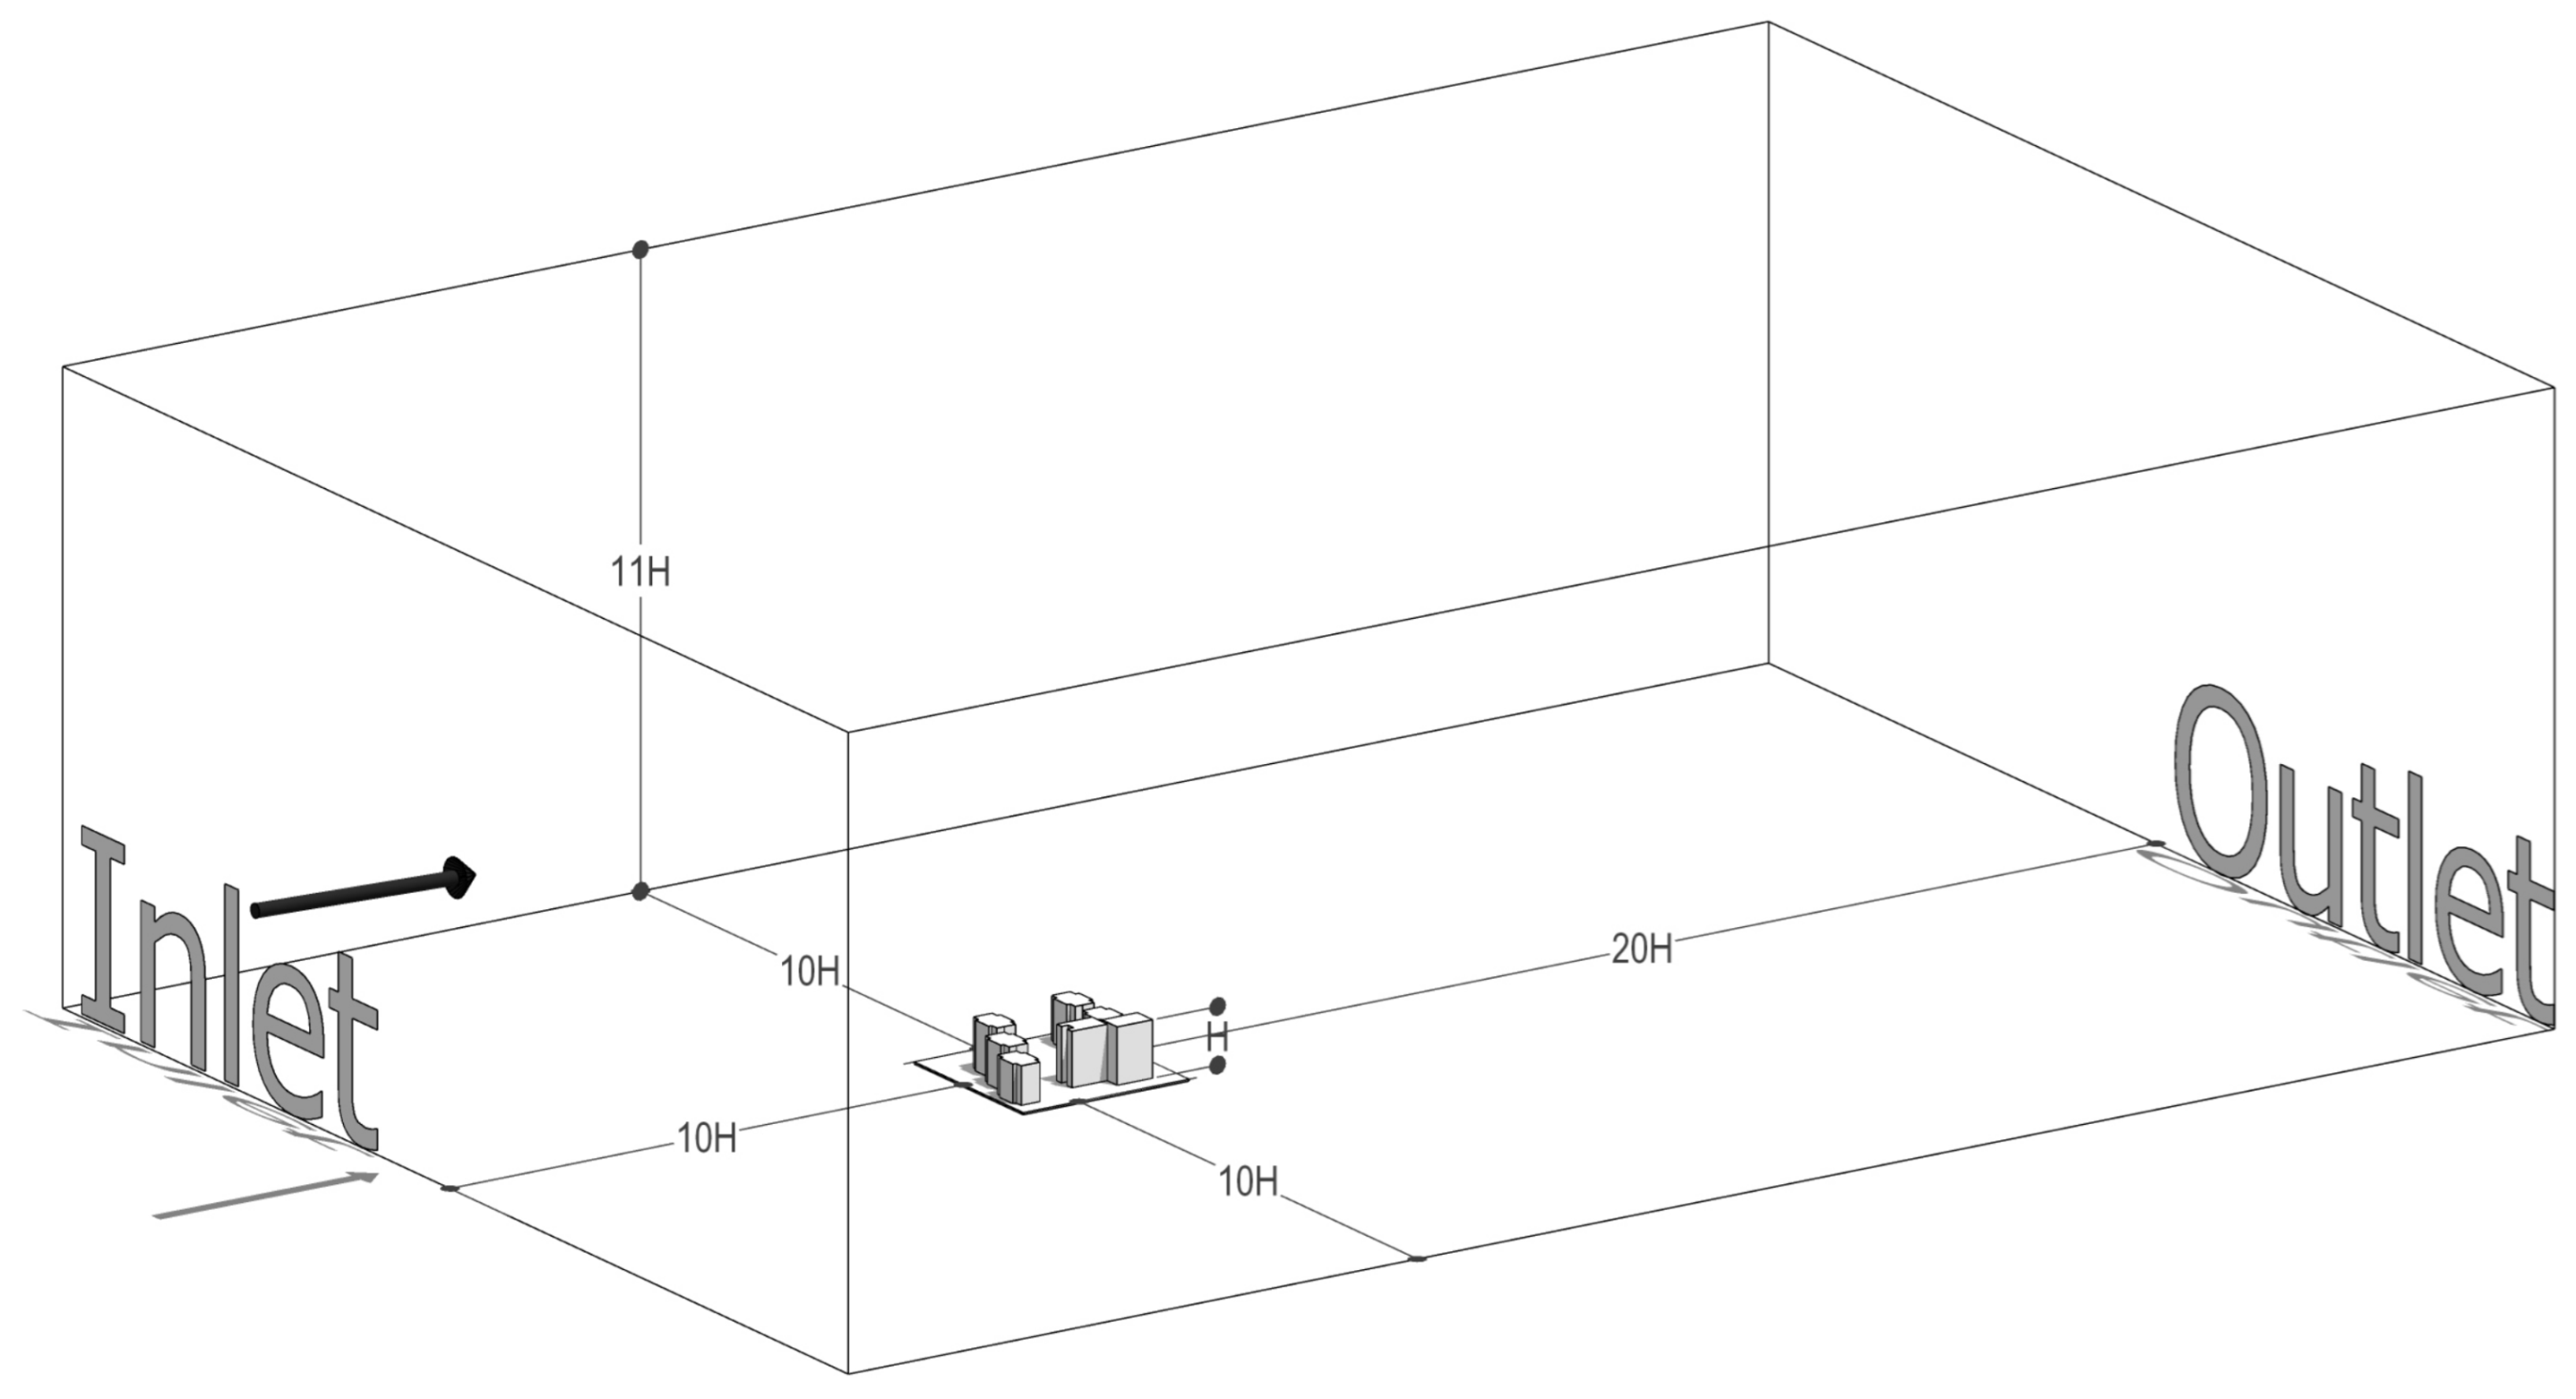
40]. In
Figure 3, the domain configuration is illustrated. Parameter H represents the height of the tallest building of the urban block. The vertical and lateral extent is 10H, except for the side toward the outlet. The wind speed boundary condition is defined at the inlet. The outlet is set to uniform zero-gradient conditions. The geometry of the urban block and ground have a no-slip condition assigned. Possible wind angles were set from 0 to 337.5 degrees with an increment of 22.5 degrees. Each wind direction corresponds to a specific air velocity as an input parameter. The turbulence kinetic energy (TKE) tolerance was set to 10
−4. Eight RANS simulations were performed for each urban block based on wind direction and velocity. On average, the mesh was divided into 150 k hexahedral elements, and the value for parameter H ranged from 10 to 109 m.
3.4. Algorithm-Based Interpretation of the CFD Analysis
For the interpretation of the results, different 3D software is used. After solving eight analyses, the results are exported as a point cloud, where each point is represented with various properties such as temperature, velocity, pressure, and more. Out of these properties, our method only considers velocity values calculated from x, y, and z vectors. These point clouds are then imported into McNeel Rhinoceros 3D [
41]. The software has a built-in plug-in named Grasshopper, further enhancing its capacity for analyzing and representing the results.
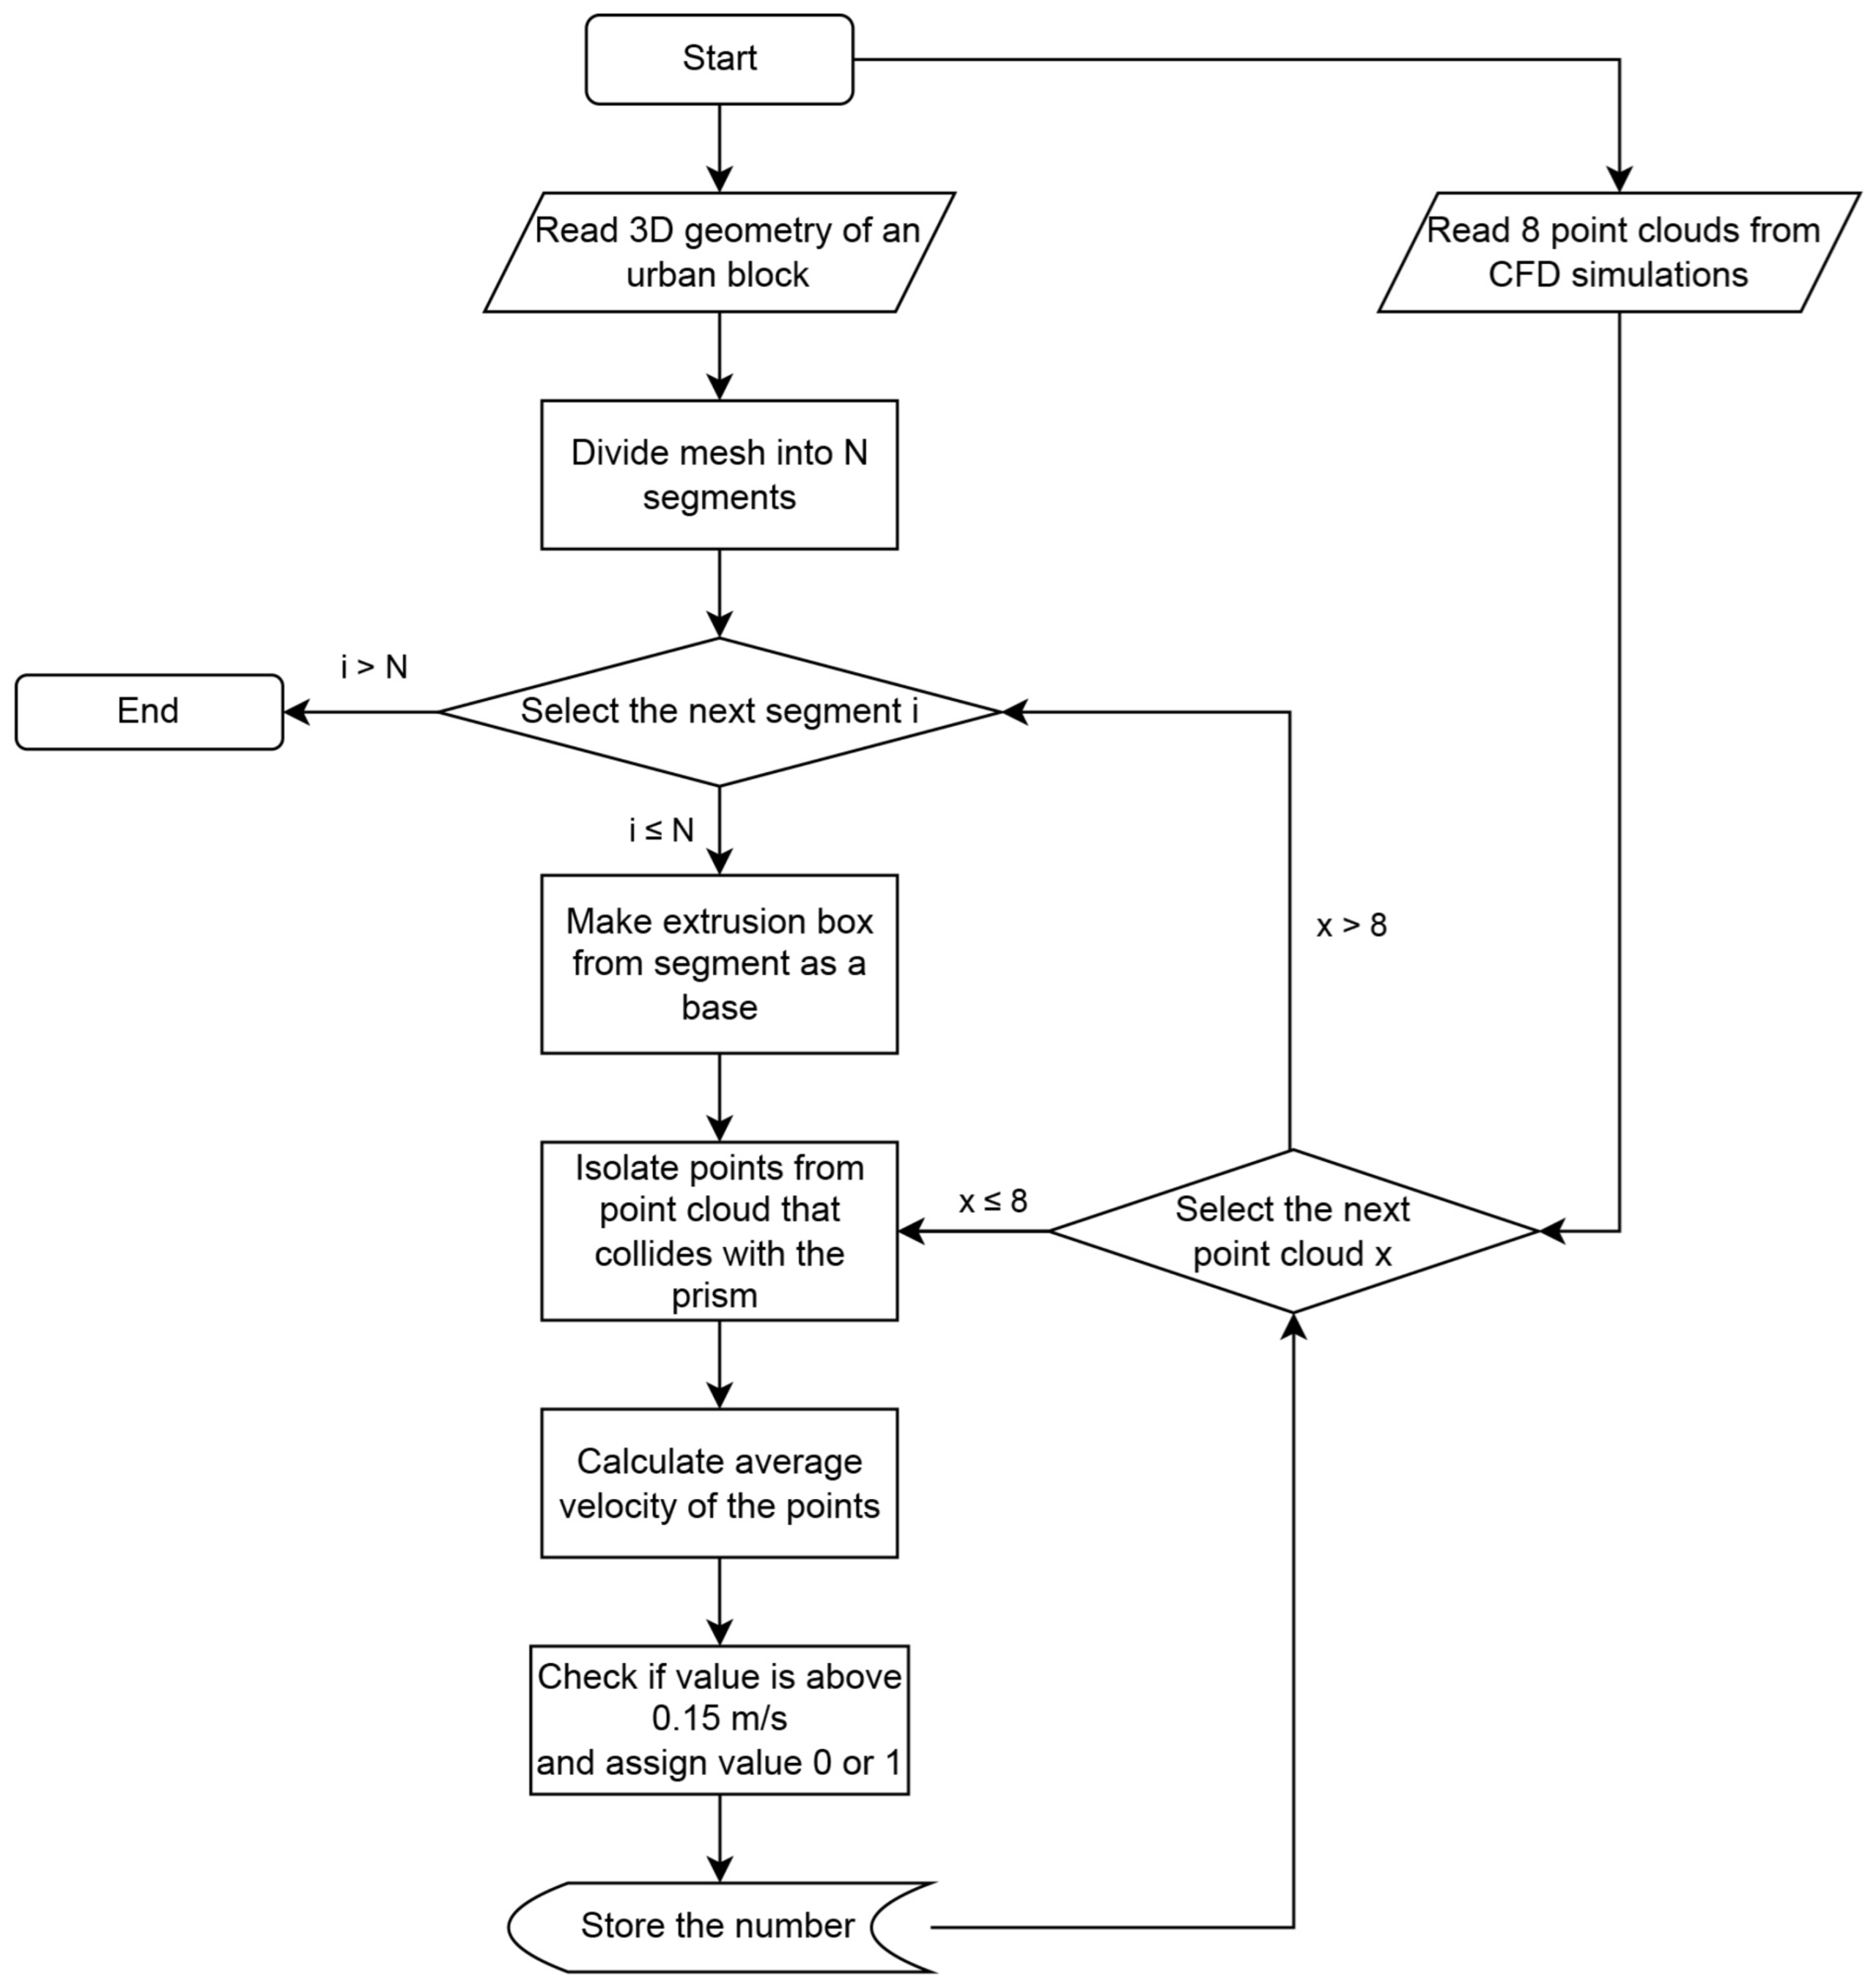
The surface envelope of the urban block is divided into smaller parts. Parts of 3D mesh marked as suitable for windows of the object are divided into rectangular polygons and from each of the polygons, a box is created. The base of the box is the polygon itself and the height of the box is 1 m in front of the polygon. This box represents the potential for natural ventilation for windows hosted by the observed wall. The results of operations inside the box are interpreted as results that are assigned to the contact segment of the mesh. The algorithm for the process is presented in
Figure 4.
The next step involves the observation of points with velocity information that we acquired earlier. For each wind direction, collisions are checked for each box and the point cloud. Points inside the box are considered for further calculation. From their velocities, the average speed is calculated for each box and for each wind direction. If the value is a smaller value than 0.15 m/s, then it is marked as 0, and it is marked with 1 in other cases. It is represented as 8 binary numbers for each mesh segment; these are formulated as a set Si = [1, 2, 3, 4, 5, 6, 7, 8] for segment Mk.
If all numbers are 0, the overall performance is 0. If all numbers are 1, the overall performance is 1. In other cases, the performance is calculated from the wind direction using the following equations.
In Equation (1), φ
i represents the relative percentage of the wind direction frequency. It is calculated once per location. A variable represents relative frequencies of wind directions that are obtained through weather data such as in
Table 1. R
k is a percentage of the stagnant air distribution throughout the year for mesh segment M
k. A percentage value of 100 can be translated as perfect airflow through most of the year near the observed mesh. This result is then assigned to the part of the surface mesh segment connected to the box.
3.5. Representation of the Results
The results are presented as graphs directly on the 3D models of the urban blocks. On the models, surfaces representing possible natural ventilation problems are color-coded in grayscale. A white color on the surface represents which windows in this area can provide good natural ventilation throughout most of the year, and a black color means a complete lack of natural ventilation according to the standards discussed in
Section 3.4. The color for mesh segment M
k is calculated using the following equation:
where
represents the RGB values of a color. The mesh is then presented from two opposite axonometric views. For the graph view, we divide the scale for the air quality distribution throughout the year from 0 to 100 by an increment of 5. Results for each mesh segment are then placed on the scale into groups and the area sums for all groups are calculated.
4. Results and Discussion
The results for eight individual blocks are presented for the city of Novi Sad. The same wind conditions were applied to all of the examples shown in this section. Wind directions and intensities used in this study are from reliable sources [
34]. Urban blocks were carefully chosen to represent different urban morphologies that are typical for the area of Novi Sad. All urban blocks have a total area of around 10,000 m
2 to represent similar location potential. Some of them were slightly modified to represent similar external conditions for all the examples. Graphical results for corresponding blocks are also presented. Ideal graph results for the urban block would have only values of 100 in respect of the stagnant air area of the building envelope throughout the year. More values to the right side of the graph represent problems in geometry.
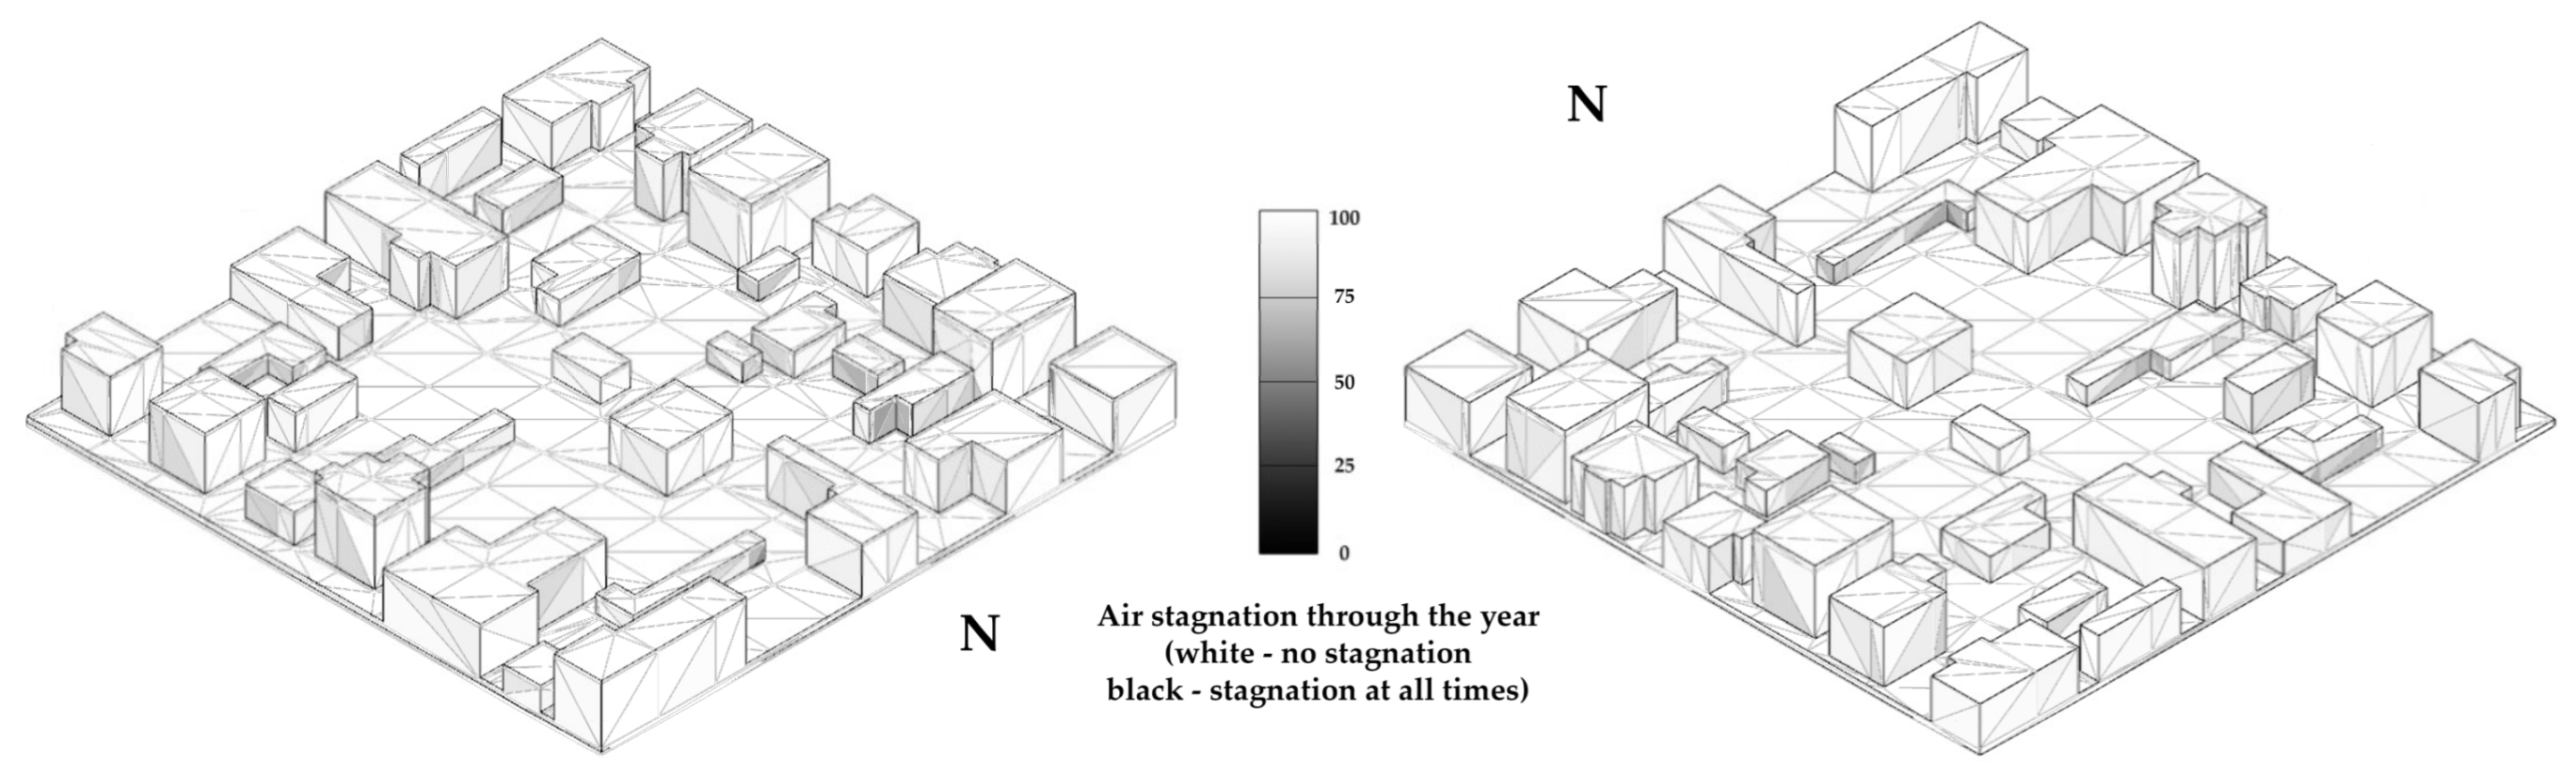
The first morphology represents an urban block comprising one-family residential buildings. In
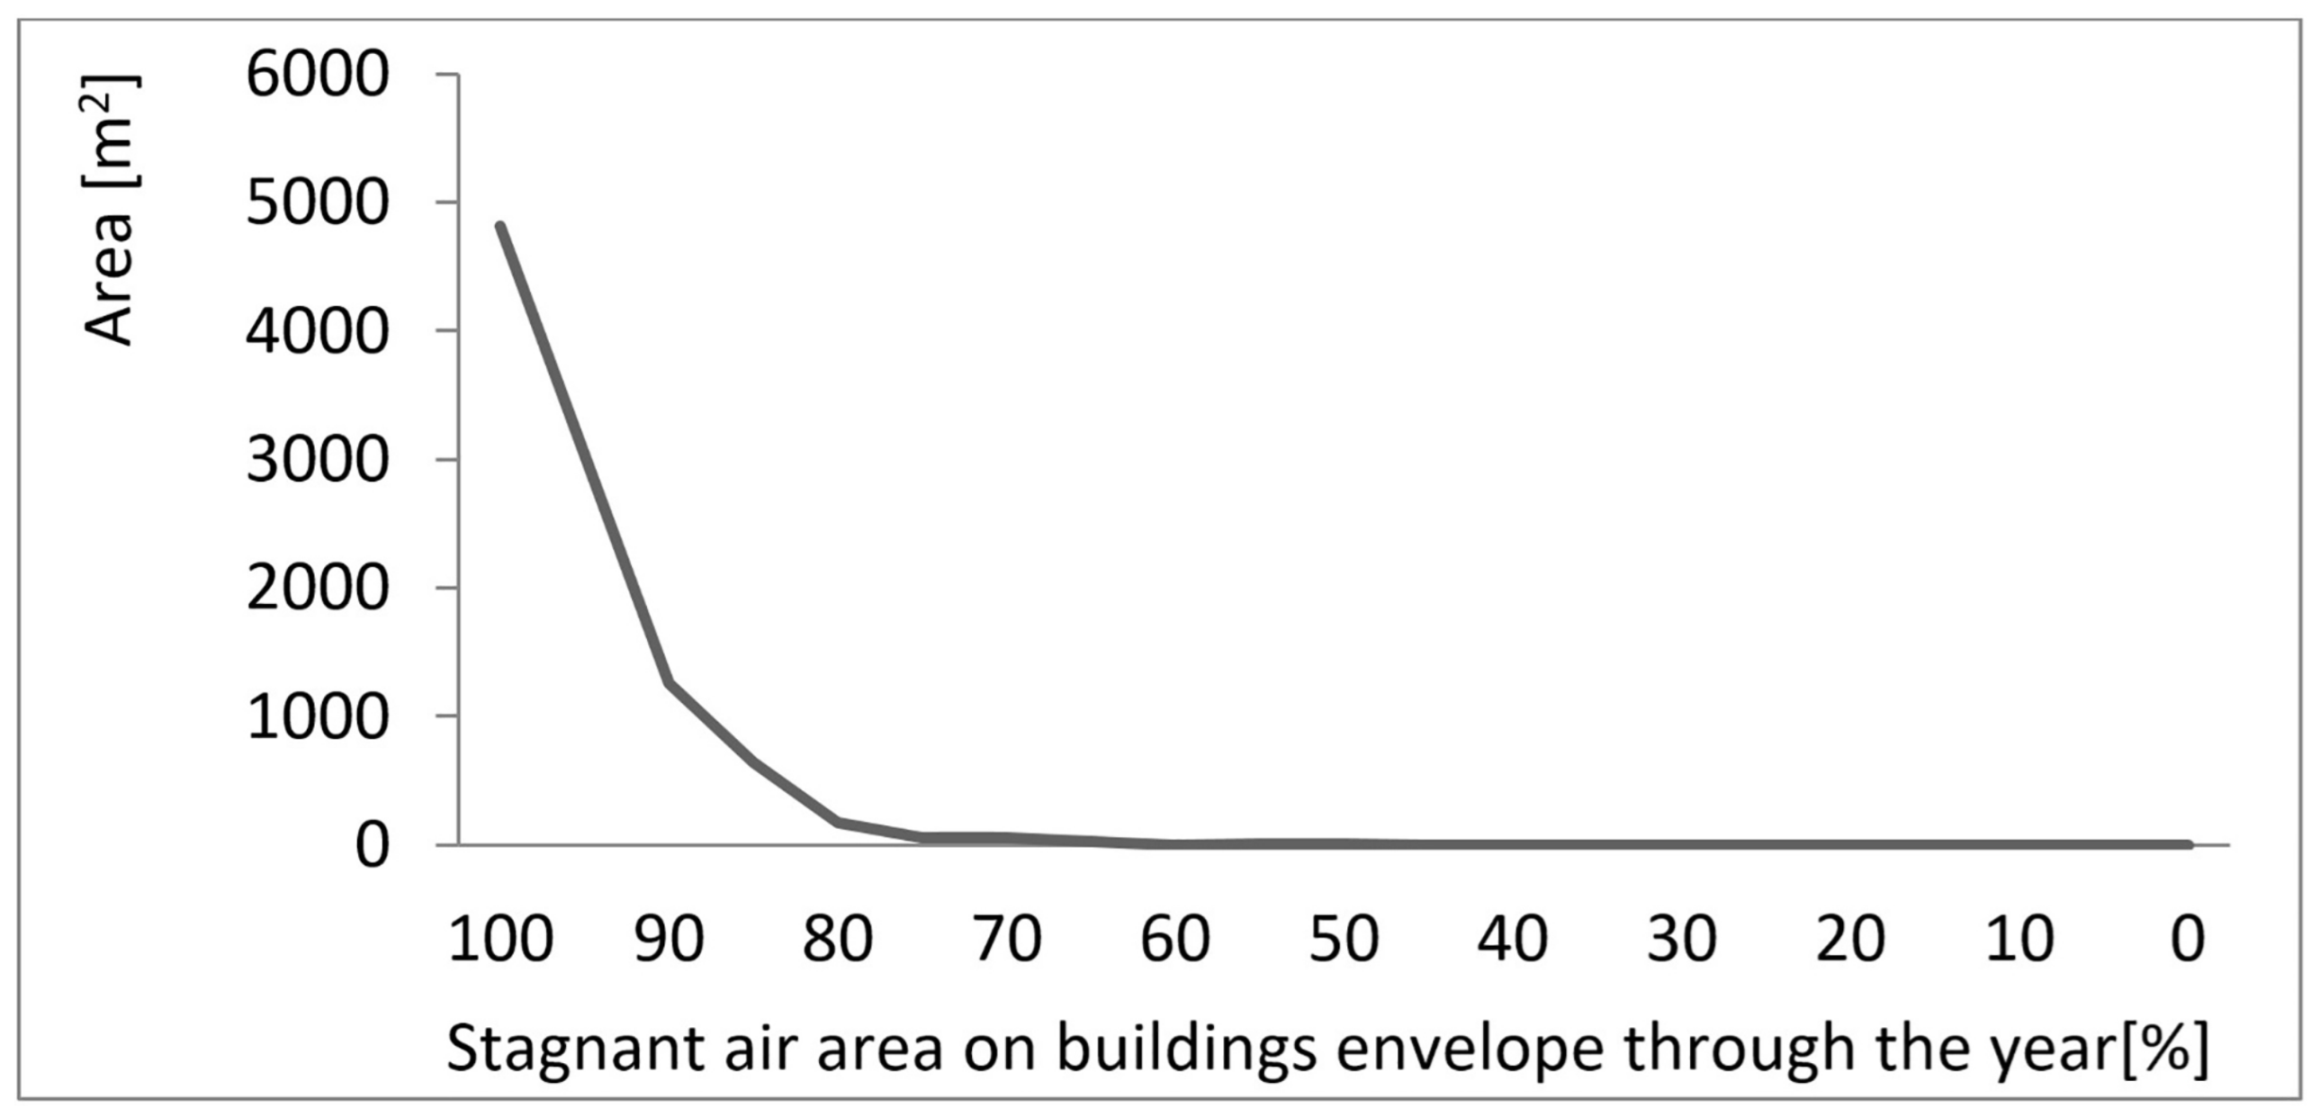
Figure 5, the results of the method presented in this paper have been applied. Vertical areas with stagnant air are shown graphically. East- and west-oriented faces of the structures have results that are worse than north and south faces. This problem is most visible in the structures in the 3D model that are in close proximity to each other. A graphical representation of the analysis (
Figure 6) shows that this type of block is moderately ventilated. The curve is set to a
y-axis value of 0 near 85% of the
x-axis. This should be interpreted that the most critical areas of this block have 15% air stagnation situations throughout most of the year.
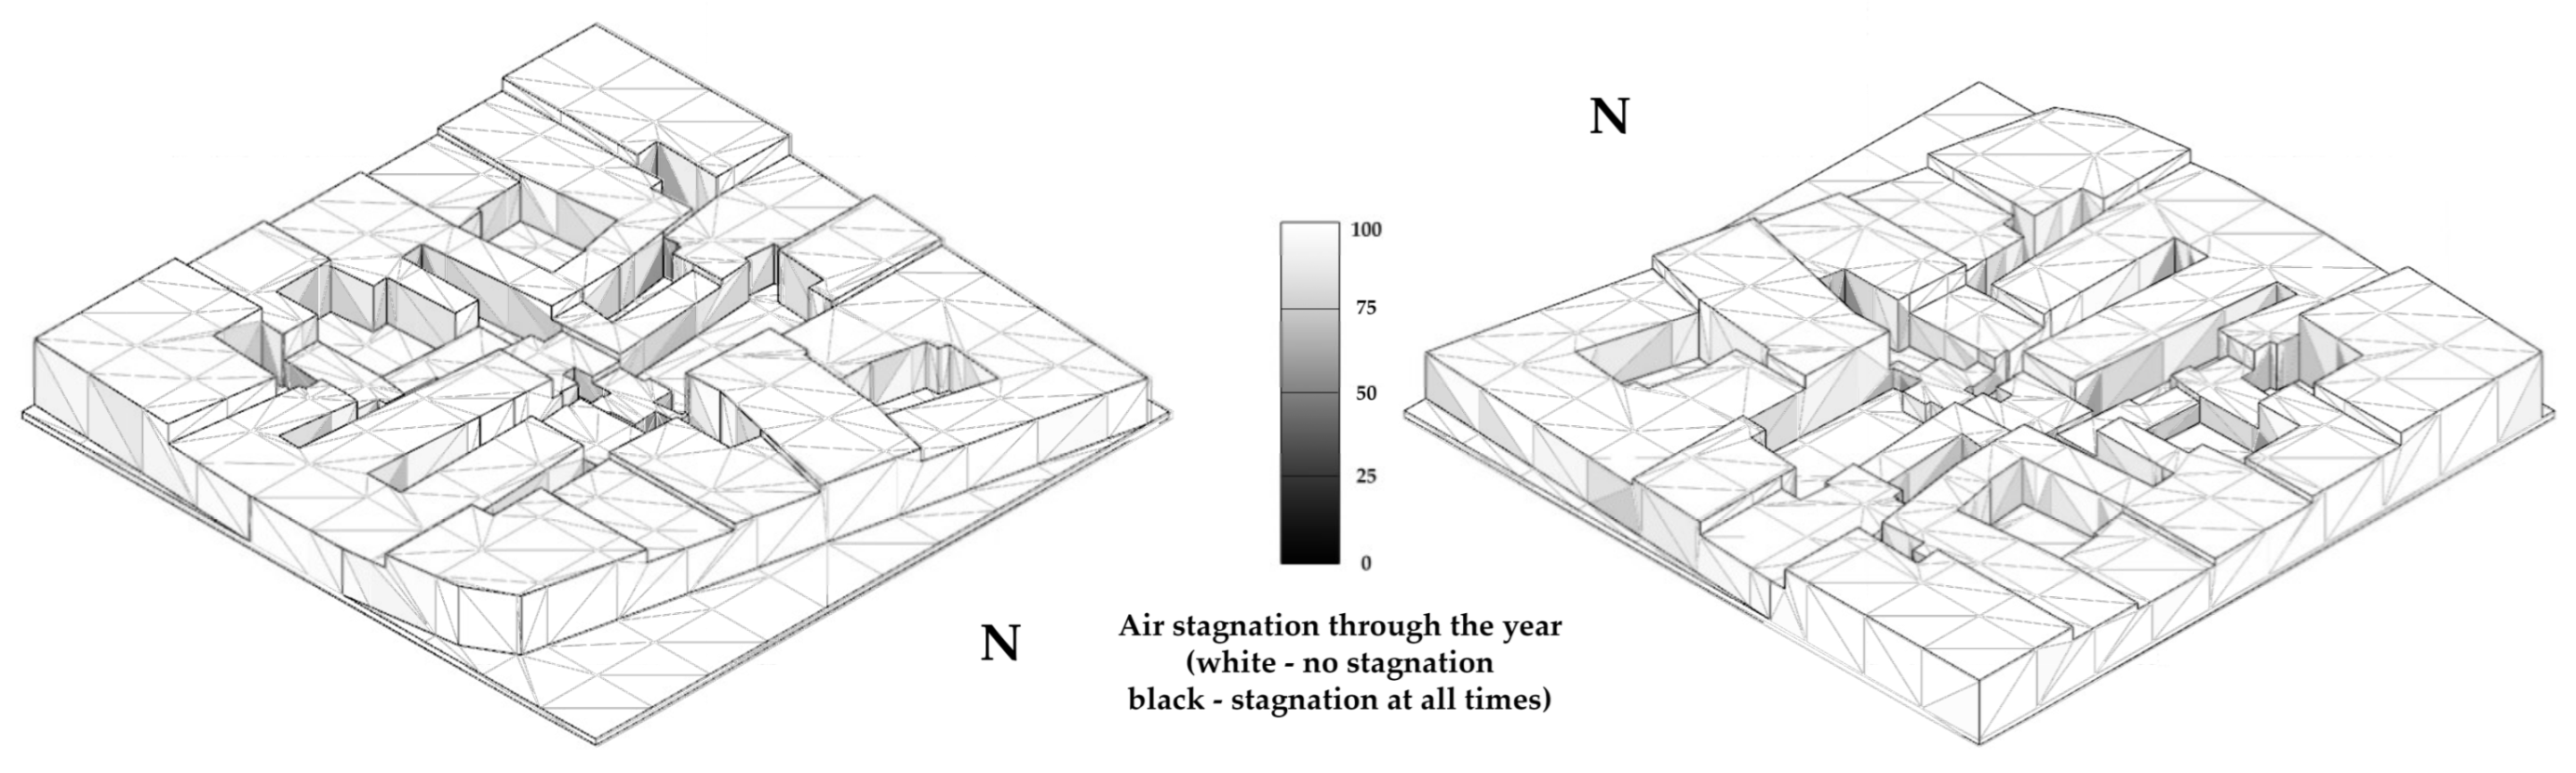
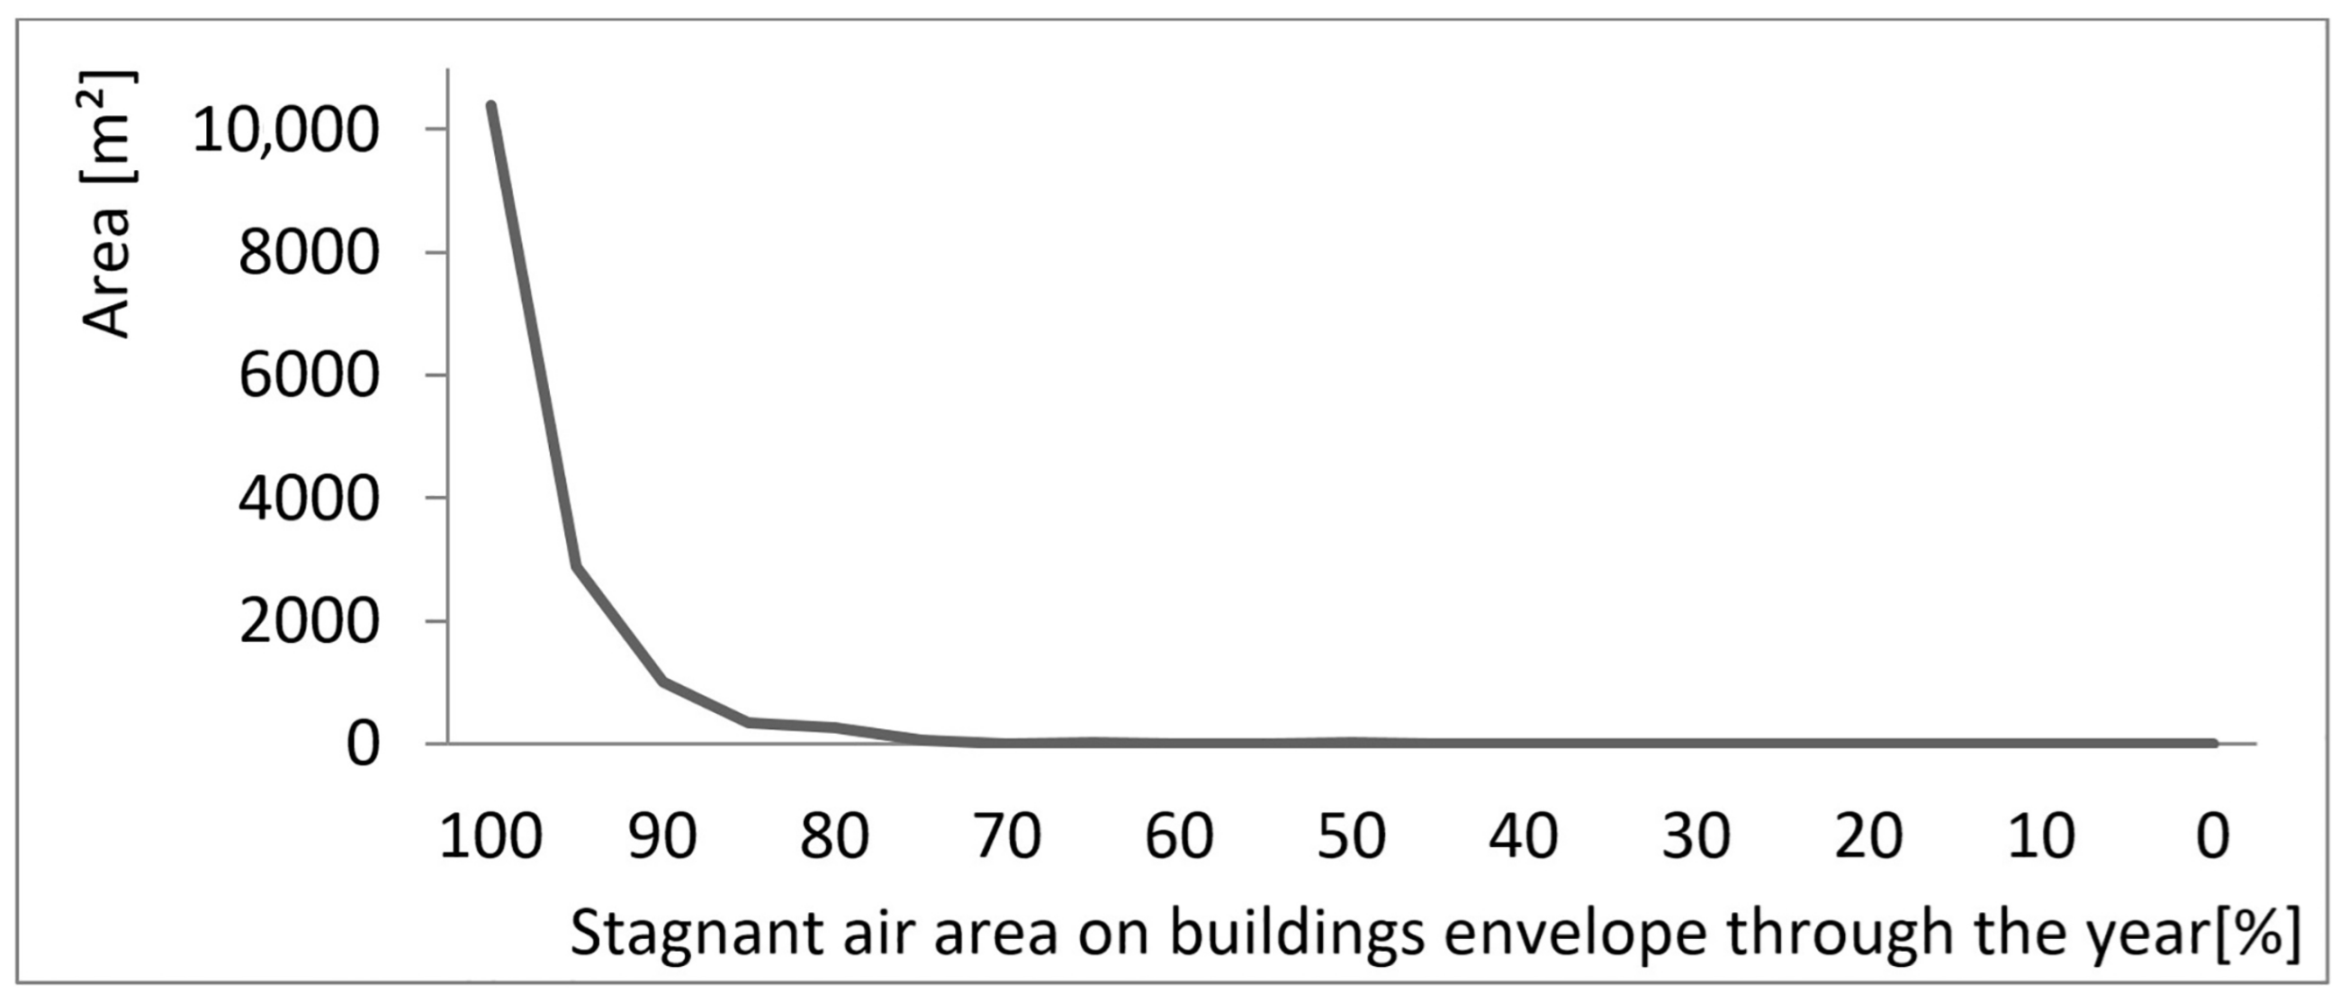
The second morphology analyzed in this paper is the traditional urban block. This type of block is typically located in old city centers. Most of the areas inside the block are not properly ventilated (
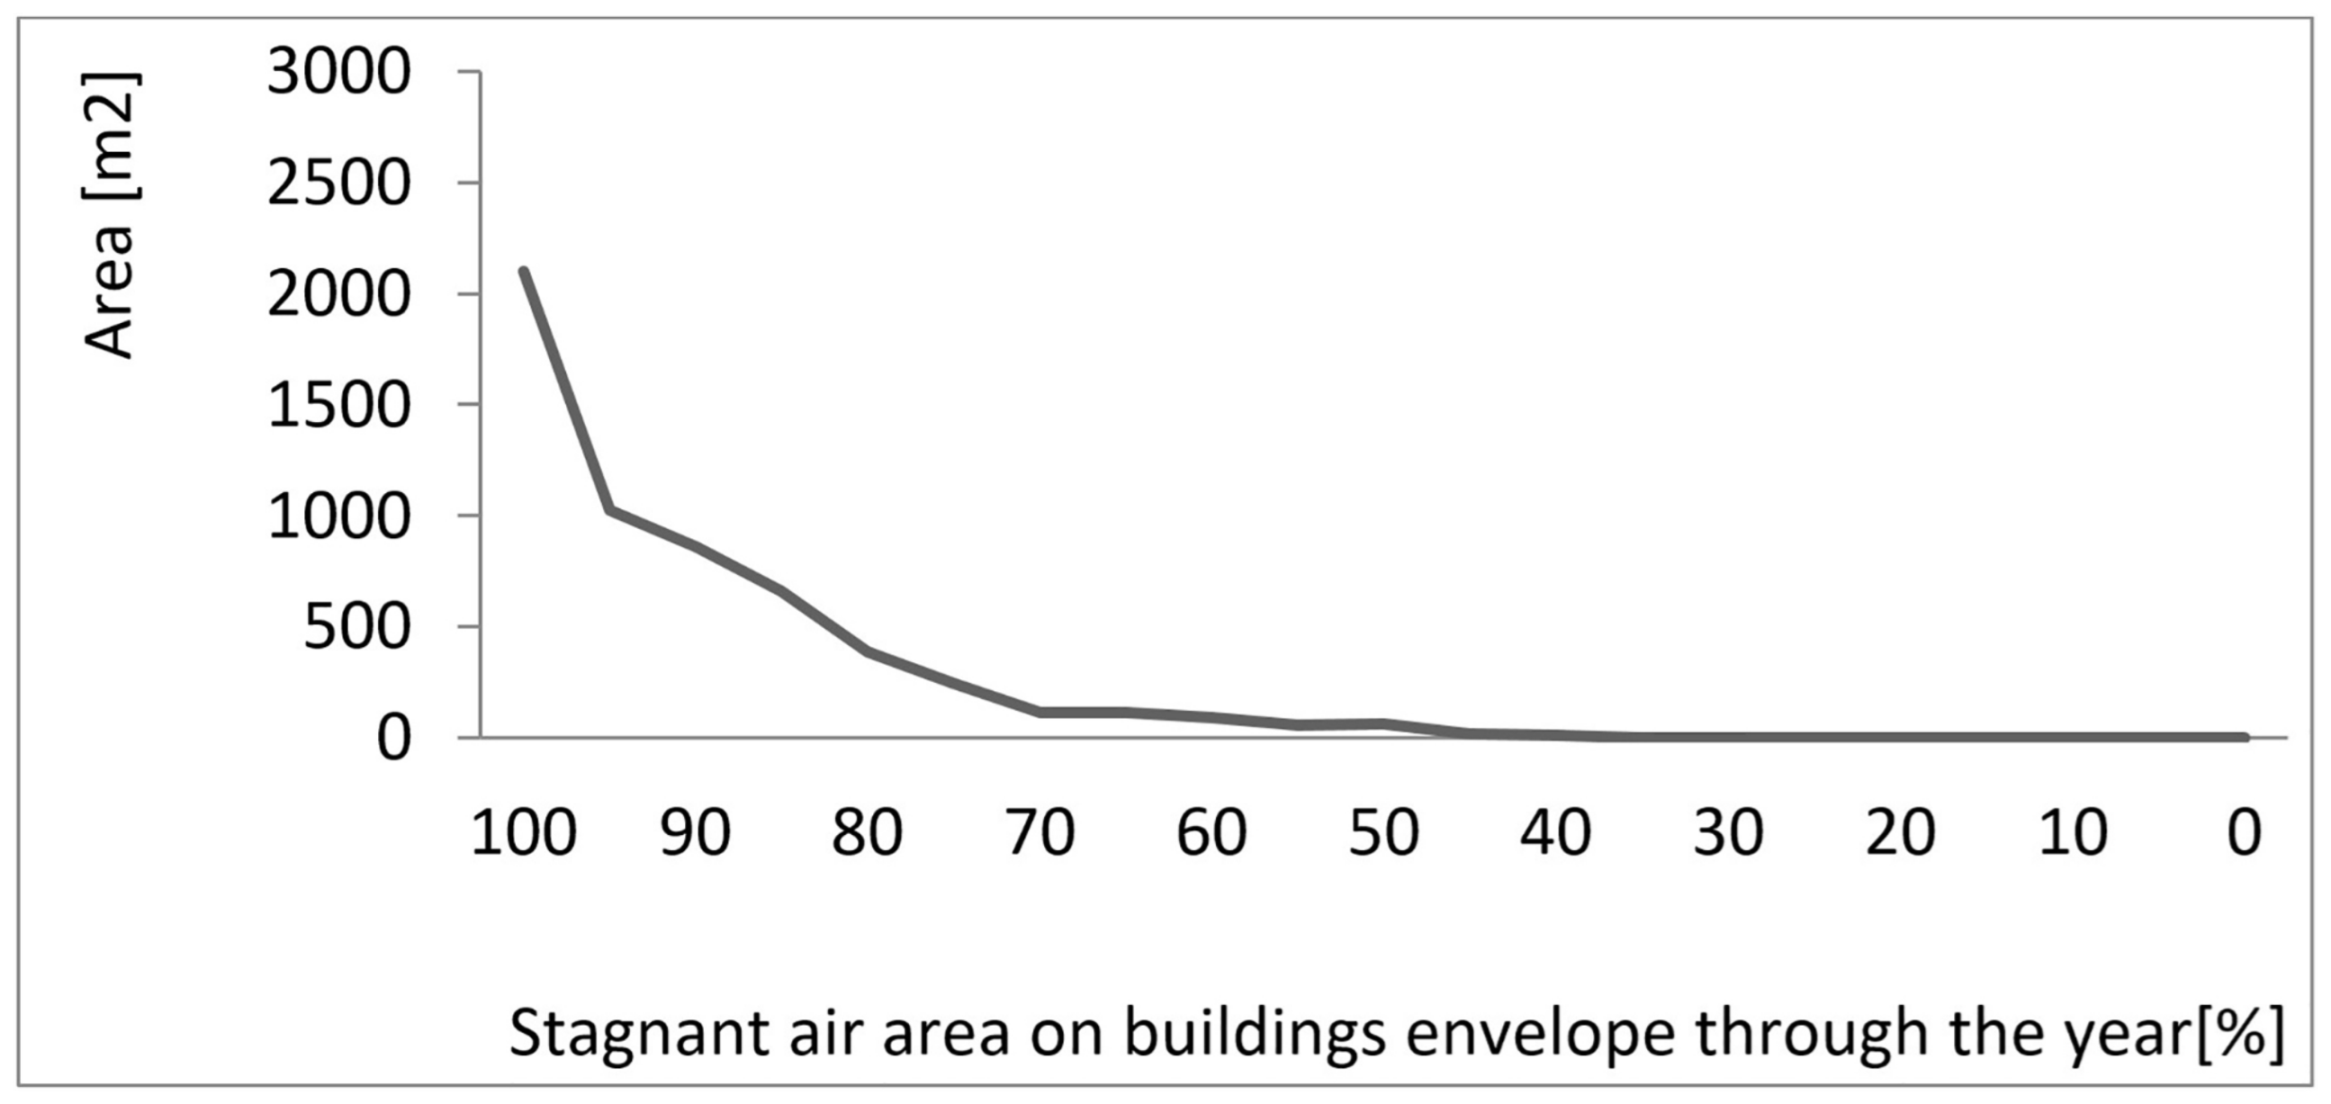
Figure 7). The close proximity of buildings in the inner courtyard is the main reason for this. This can result in the deterioration of health conditions in the housing area. The graphical analysis (
Figure 8) shows lower levels of ventilation than for previously analyzed urban blocks. From all vertical surfaces, 19% of their calculated area has less than 85% air quality distribution throughout the year. The gradual shape of the curve suggests a high percentage of the vertical surfaces are not suitable for windows in regard to natural ventilation. The 0 value on the
x-axis is reached at 45%, and if those surfaces host windows, stagnant air is present for most of the year.
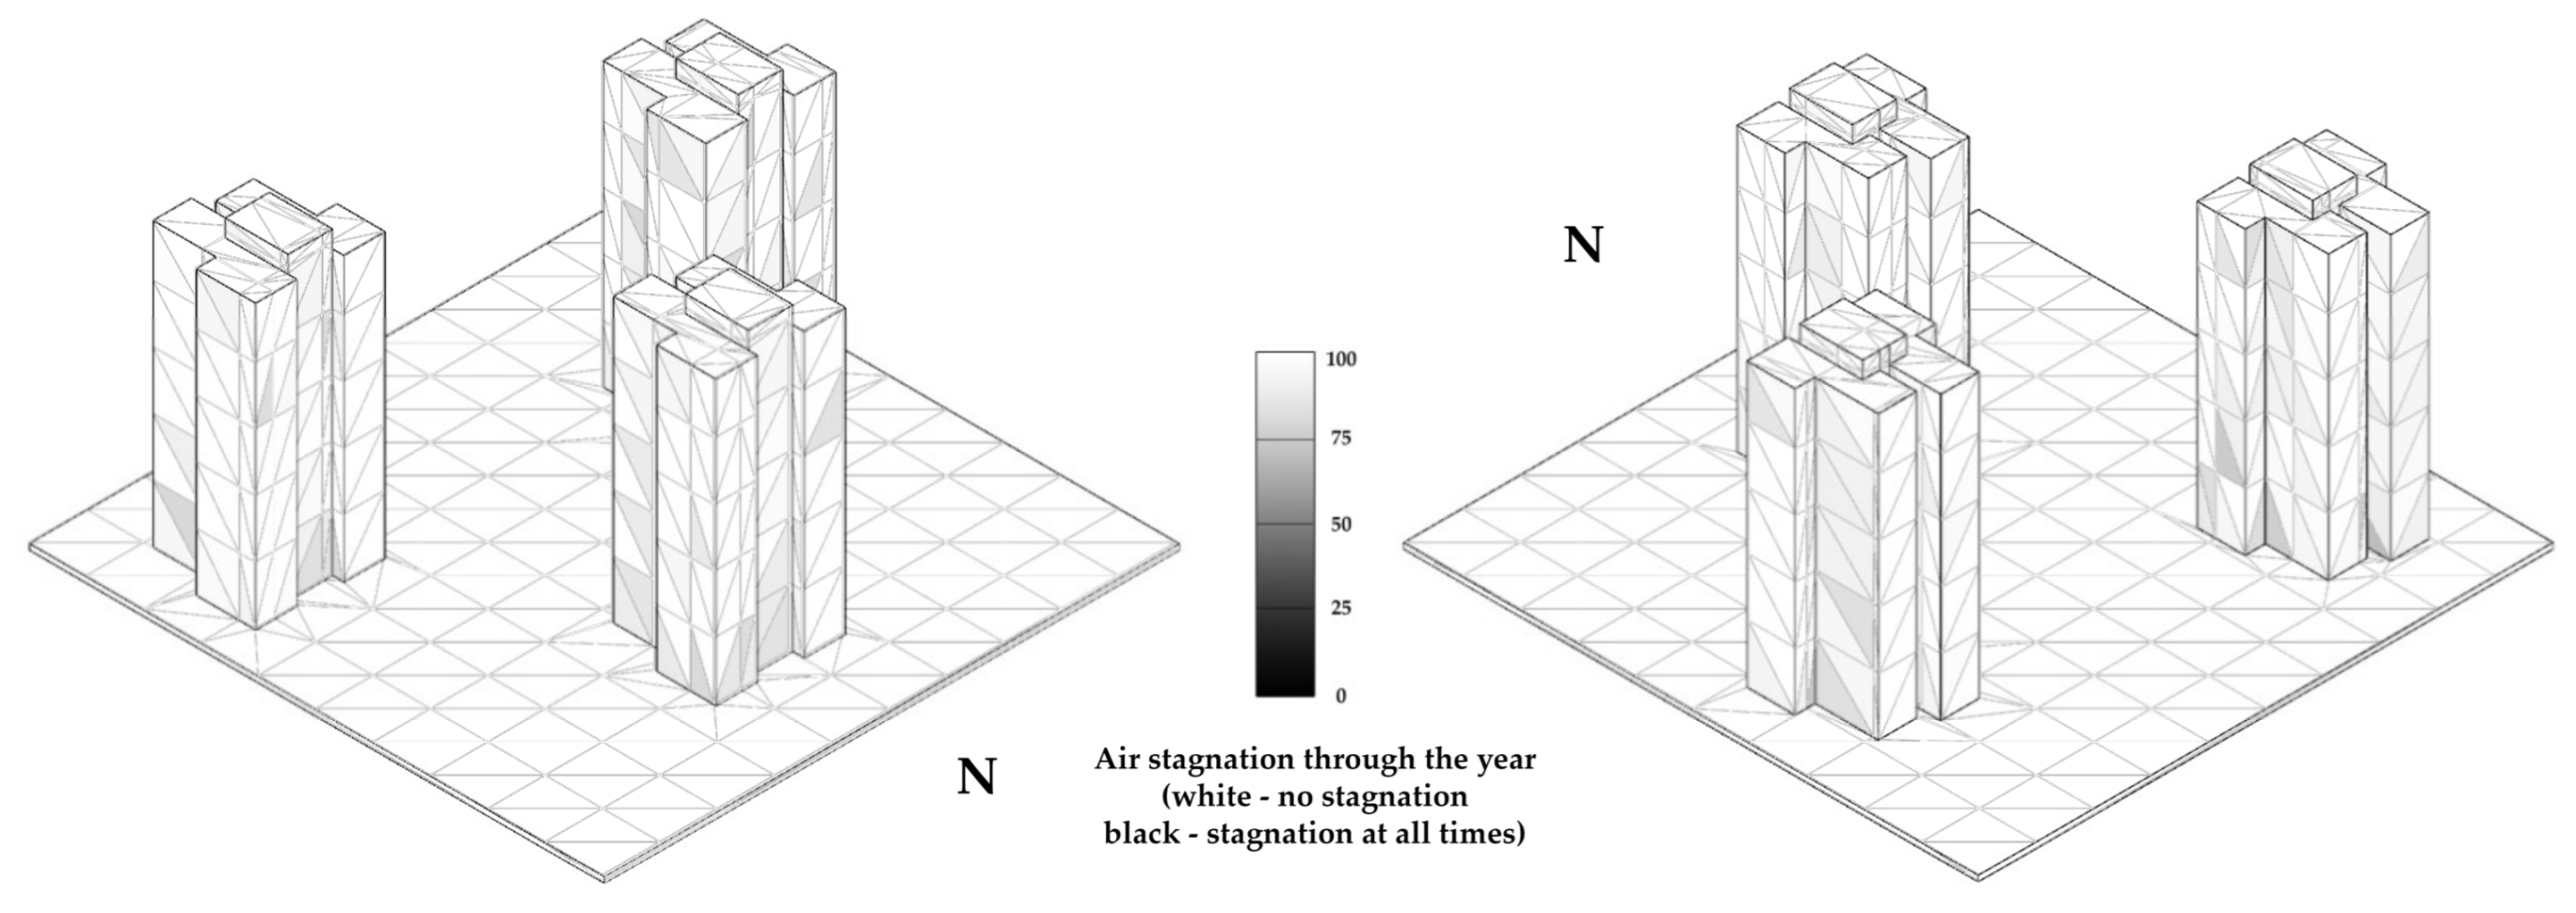
The third urban morphology that was analyzed is an urban block with multiple towers, typically built in the second half of the 20th century in Europe. From the results of the analysis in
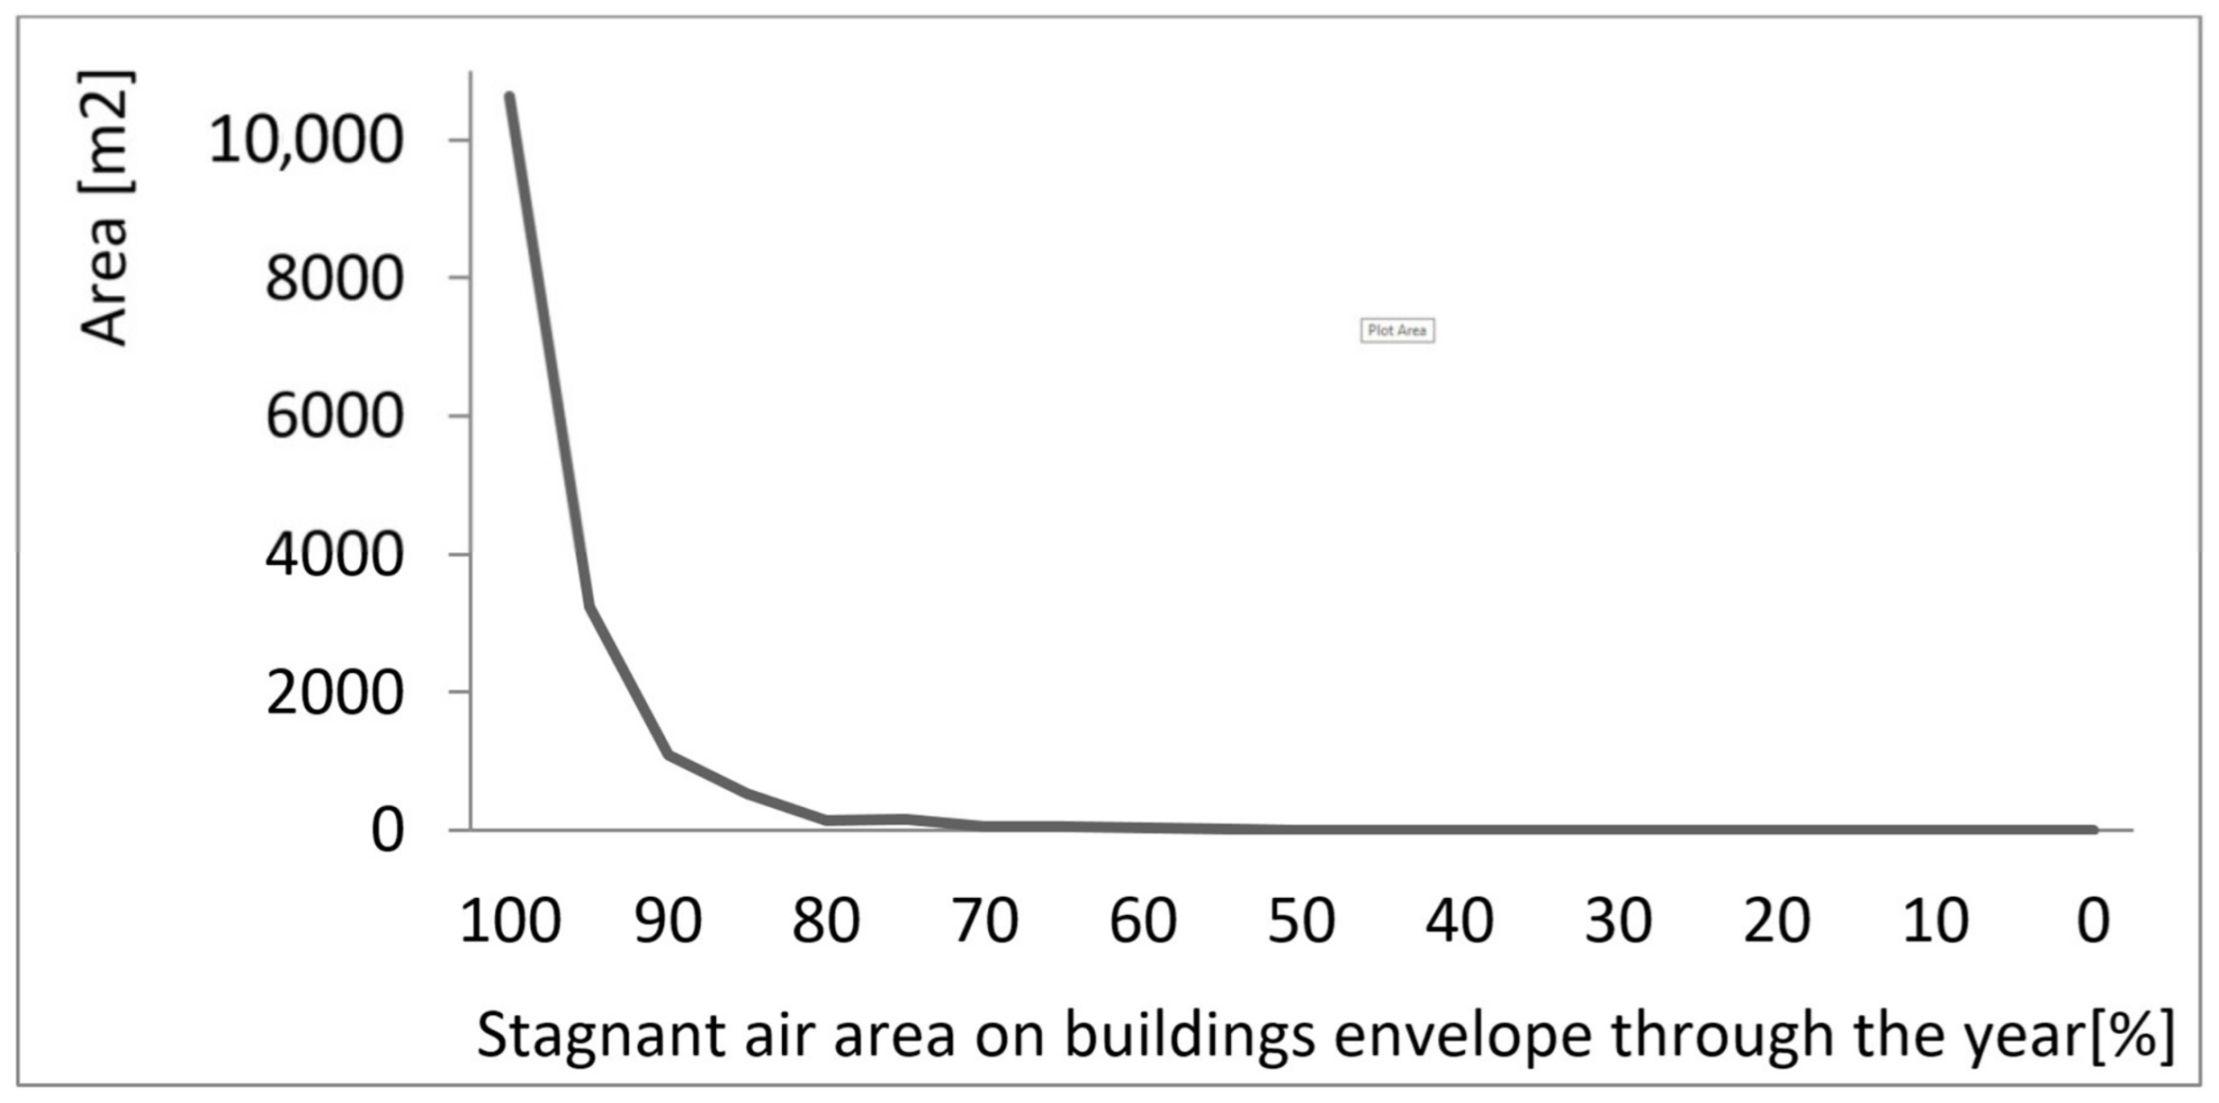
Figure 9, only small parts of the surfaces have problems with ventilation. A low build density has an influence on wind intensity in the whole area. There are surfaces with lower ventilation, but they are created because of the turbulence effect. A graphical representation of the results (
Figure 10) shows that the air quality distribution throughout the year is very good. Only 13% of all vertical surfaces have values of air quality distribution that are below 95% throughout the year. The highest value on the
y-axis suggests that the ideal area for window placement is much higher than that in previous urban blocks.
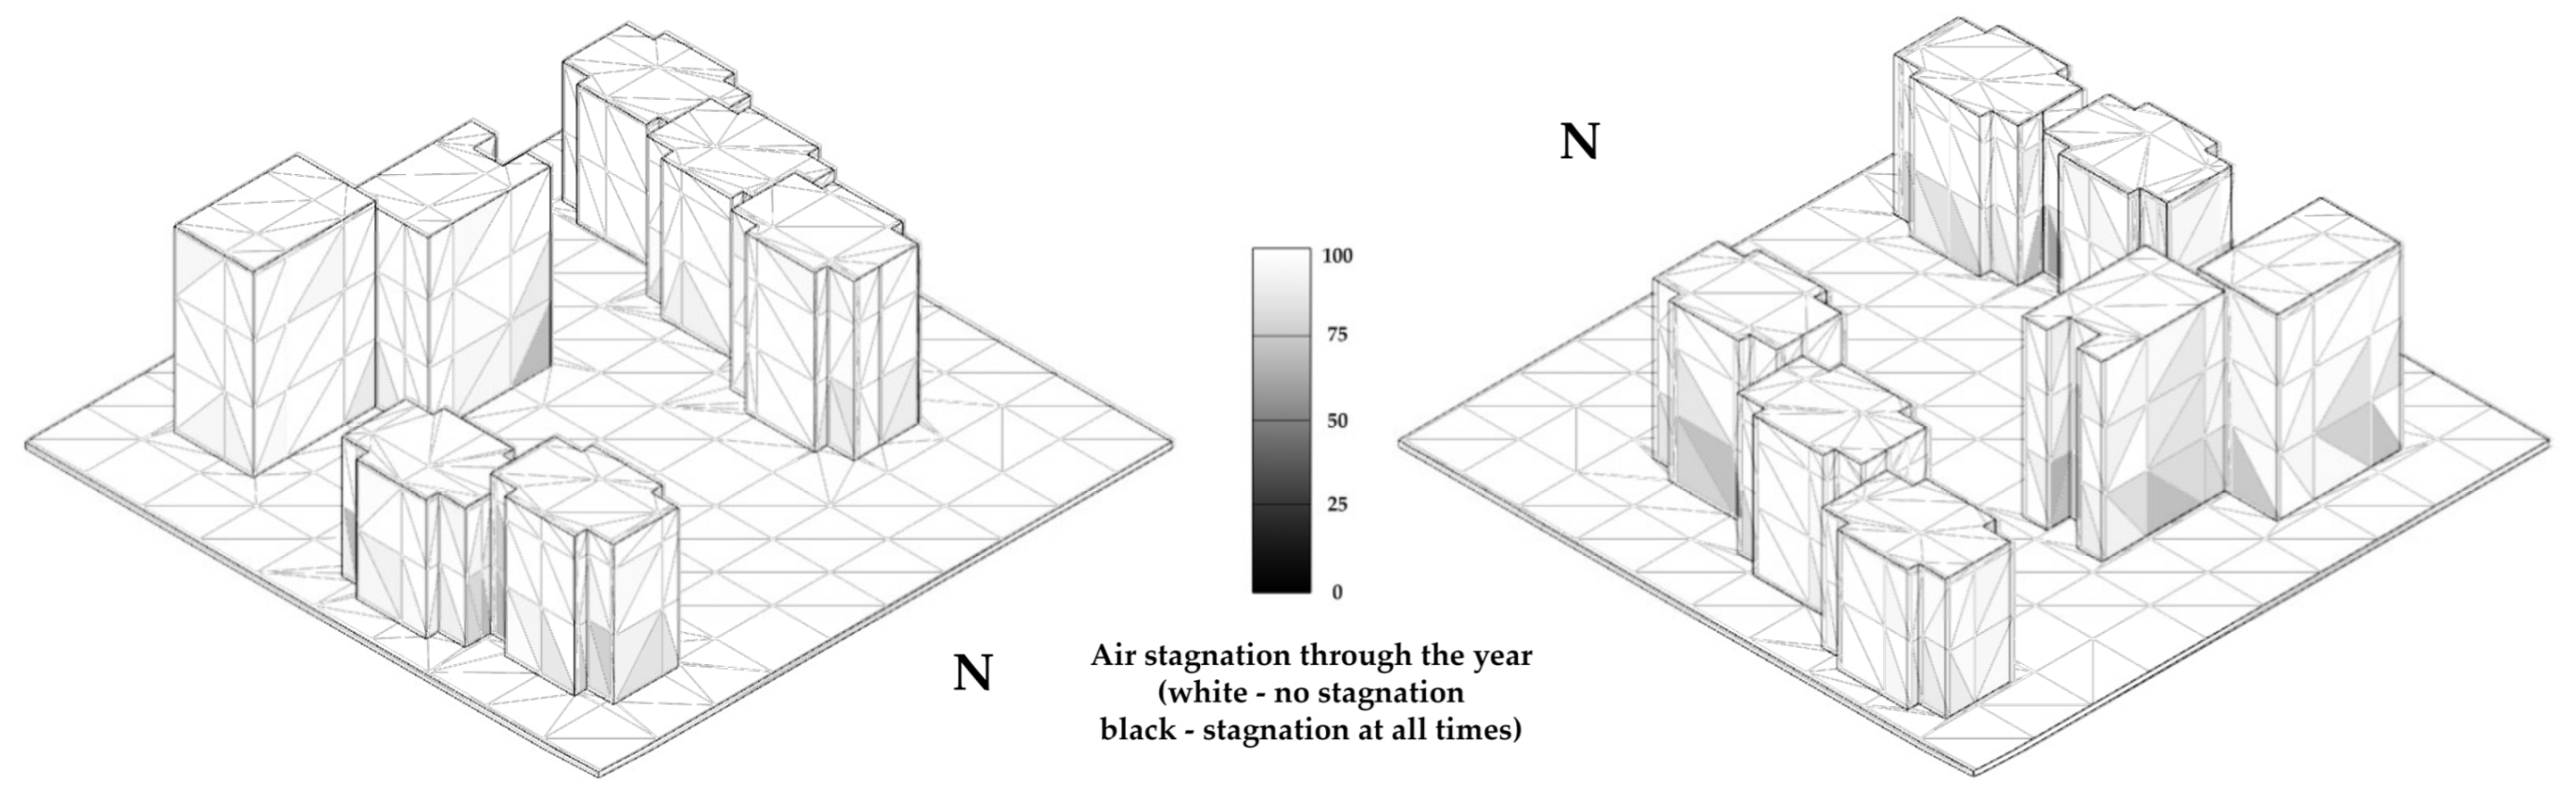
The fourth urban morphology is a slab city block type. This is similar to the previous morphology, but with a lower building height and increased land cover (
Figure 11). The buildings are freestanding, and their disposition influences the airflow direction inside the urban block. Through strategic urban planning, it is possible to create better air quality distribution in the entire area of the block. The most surfaces that correspond to air stagnation problems are at the ground floor level.
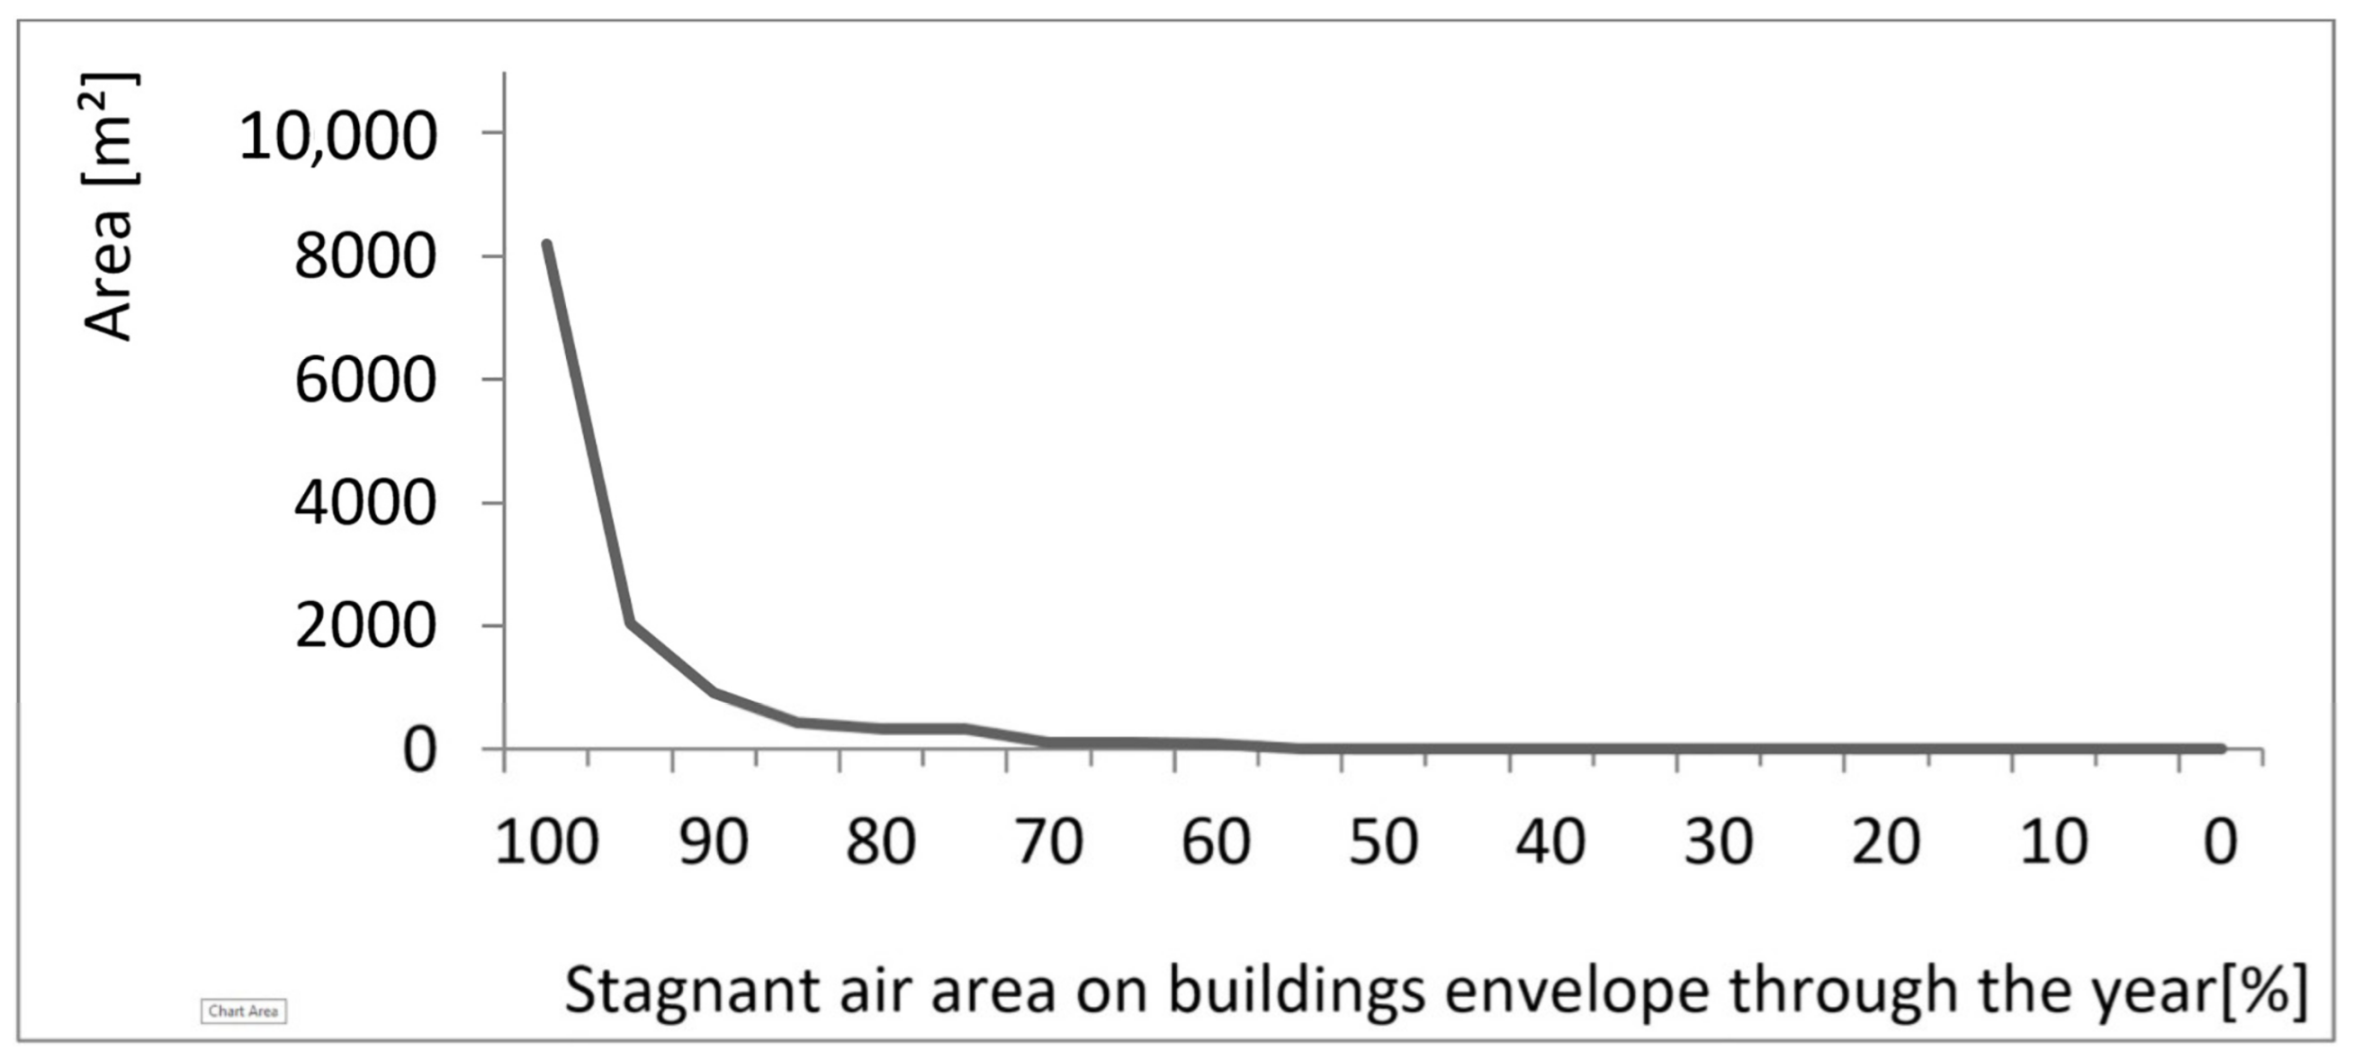
Figure 12 shows good results for air quality distribution throughout the year, similar to the results from the previous example. The area between 70% and 80% on the
x-axis is more prominent, which can be seen in
Figure 11 where darker shades of gray are present. The main reason for this result is the disposition of the blocks and their correlation to the most frequent wind directions for the location.
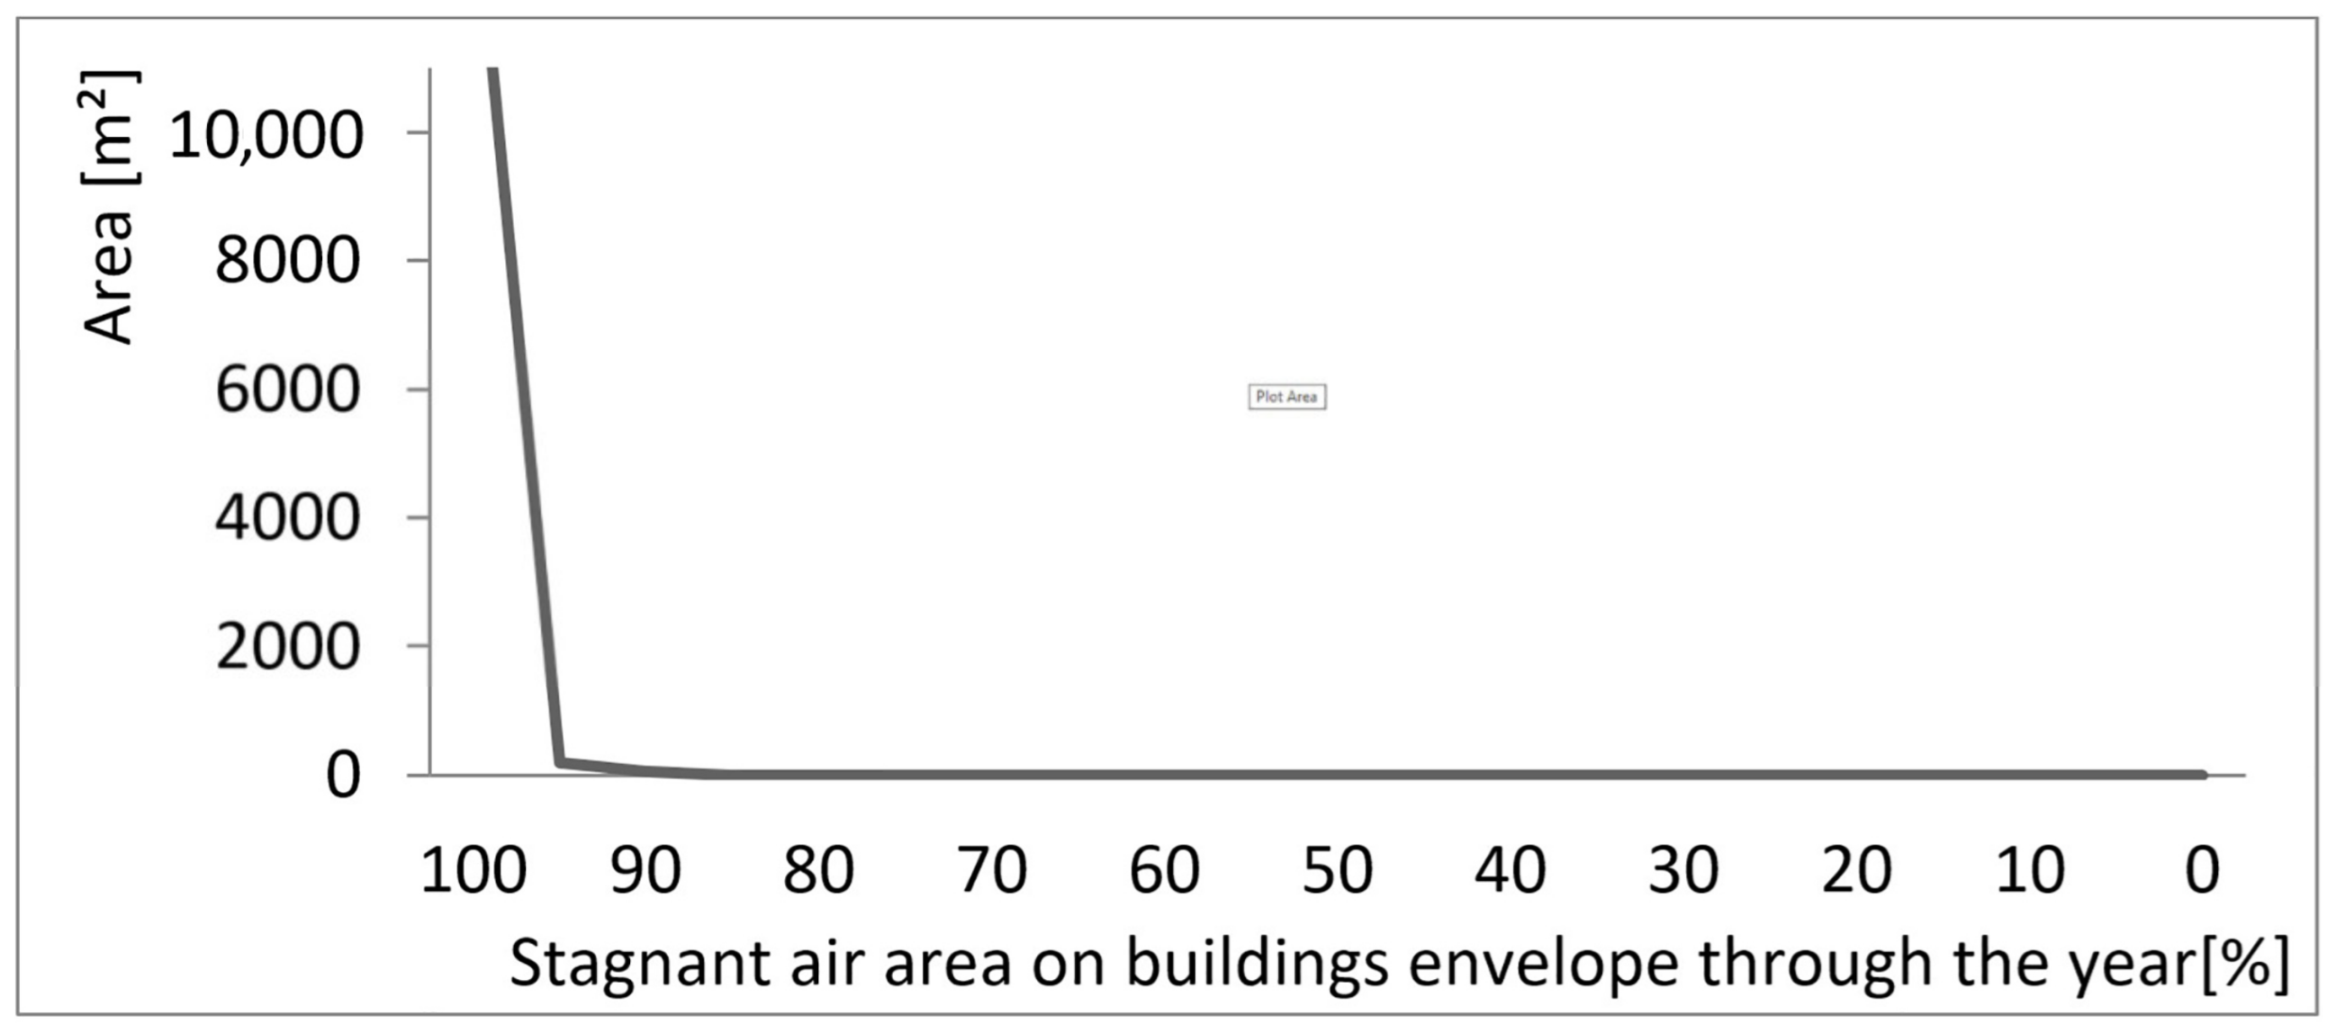
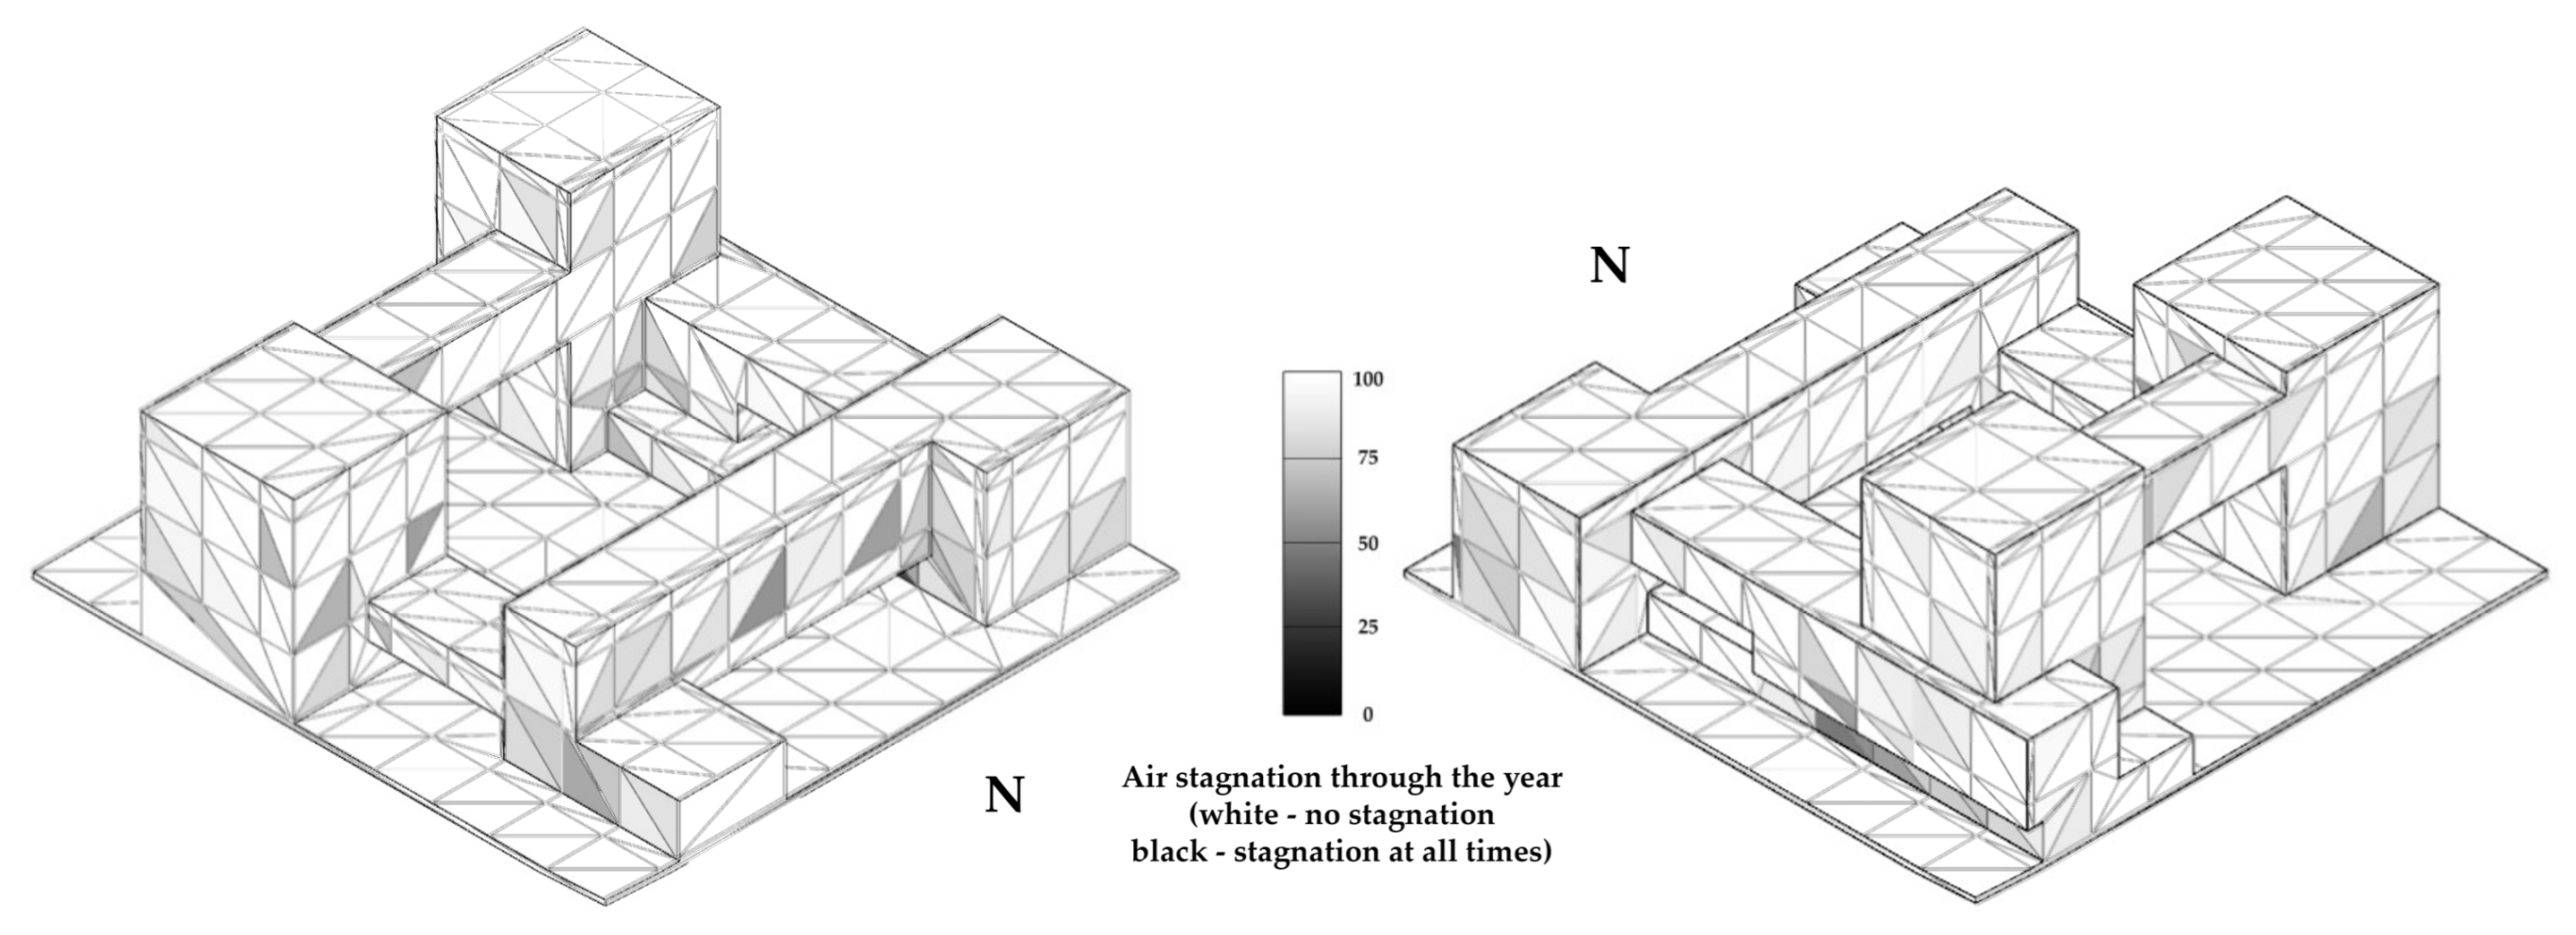
The fifth example is a U-shaped city block. The position of the open side of the block in the context of important wind directions can give different results. The real-life urban block that was used as an input for the geometry is orientated towards two opposite directions. In this example (
Figure 13), the wind flow is well balanced from all directions and the results of the analysis are good. Areas with less than 75% air distribution quality are not detected (
Figure 14). The curve of the graph Is relatively smooth in contrast to our expectations. The highest number on the
y-axis is around 8000; this is significantly lower than that for the multiple tower block, which is similar in volume to the U-shaped block.
The sixth urban morphology is the densely populated perimeter city block. This block is typical of the urban blocks that developed from single-family housing to collective buildings in recent decades in Novi Sad. The results (
Figure 15 and
Figure 16) show that most of the problems detected are inside the urban block. The graph shows that area from 70% to 80% air quality distribution is prominent, compared to most other examples. These values are representations of the area that is not suitable for window placement for natural ventilation of the building. The graph curve gradually reaches 0 between 40% and 50%, suggesting that inside of the block there are surfaces near which there is stagnant air present for most of the year.
A one-tower urban block is the seventh example of urban block geometry. The height of the building is 109 m, and the area around the object is flat. This type of block is historically usually built so natural ventilation and daylight illumination are provided for all of its inhabitants. Less than 0.7% of all surfaces have values below 95%. The results are presented in
Figure 17 and
Figure 18. The graph curve is steepest for all the examples, presenting almost perfect results in regard to natural ventilation potential. This result is predictable considering the surrounding of the one-block building.
The eighth example represents a hybrid urban block. This urban block type does not have a specific form and can have higher variety compared to previously examined blocks. The wind flow is slower in the east–west direction, as shown in
Figure 19. North-facing surfaces and surfaces in the west are locations that have lower values of air velocity. The values are similar to results of the U-shaped block, but with more problematic areas for values under 75% air quality distribution. For those areas, the hybrid block has 1.1% of all surfaces compared to 0% for the U-shaped block. The graphical results are presented in
Figure 20. The graph curve shows variation around 50% and 65% on the
x-axis. This shows small areas with stagnant air in close proximity to the building surface.
The results can be seen comparatively between different urban morphologies. In
Table 2, the results of all the examples are presented. It can be concluded that different morphologies produce different measurable conditions in regard to air quality with the method described in this paper. Urban blocks are modeled without surrounding blocks and trees, and thus, the maximal potential for urban blocks can be observed through this study. In cases that represent a more detailed approach, less favorable results can be expected.
The highest-ranking results obtained from the tower urban block morphology, measuring 99.3% of all of its vertical surfaces, have the uppermost values for air quality distribution throughout the year. U-shaped blocks have no surfaces below 70% air quality. The lowest ranking is for the traditional urban block; the distances between buildings are short and very densely distributed. Only 54.45% of surfaces have adequate wind conditions for natural ventilation. Most of them are on the outer facades of the block. The recommendation for most inner areas is to install mechanical ventilation systems. Results for the perimeter block also show only 69% of surfaces with the highest rating. Traditional and perimeter blocks are the only ones that contain surfaces with a rating of less than 55%. Considering that the perimeter block has double the volume of the traditional block, more people living in it can be affected.
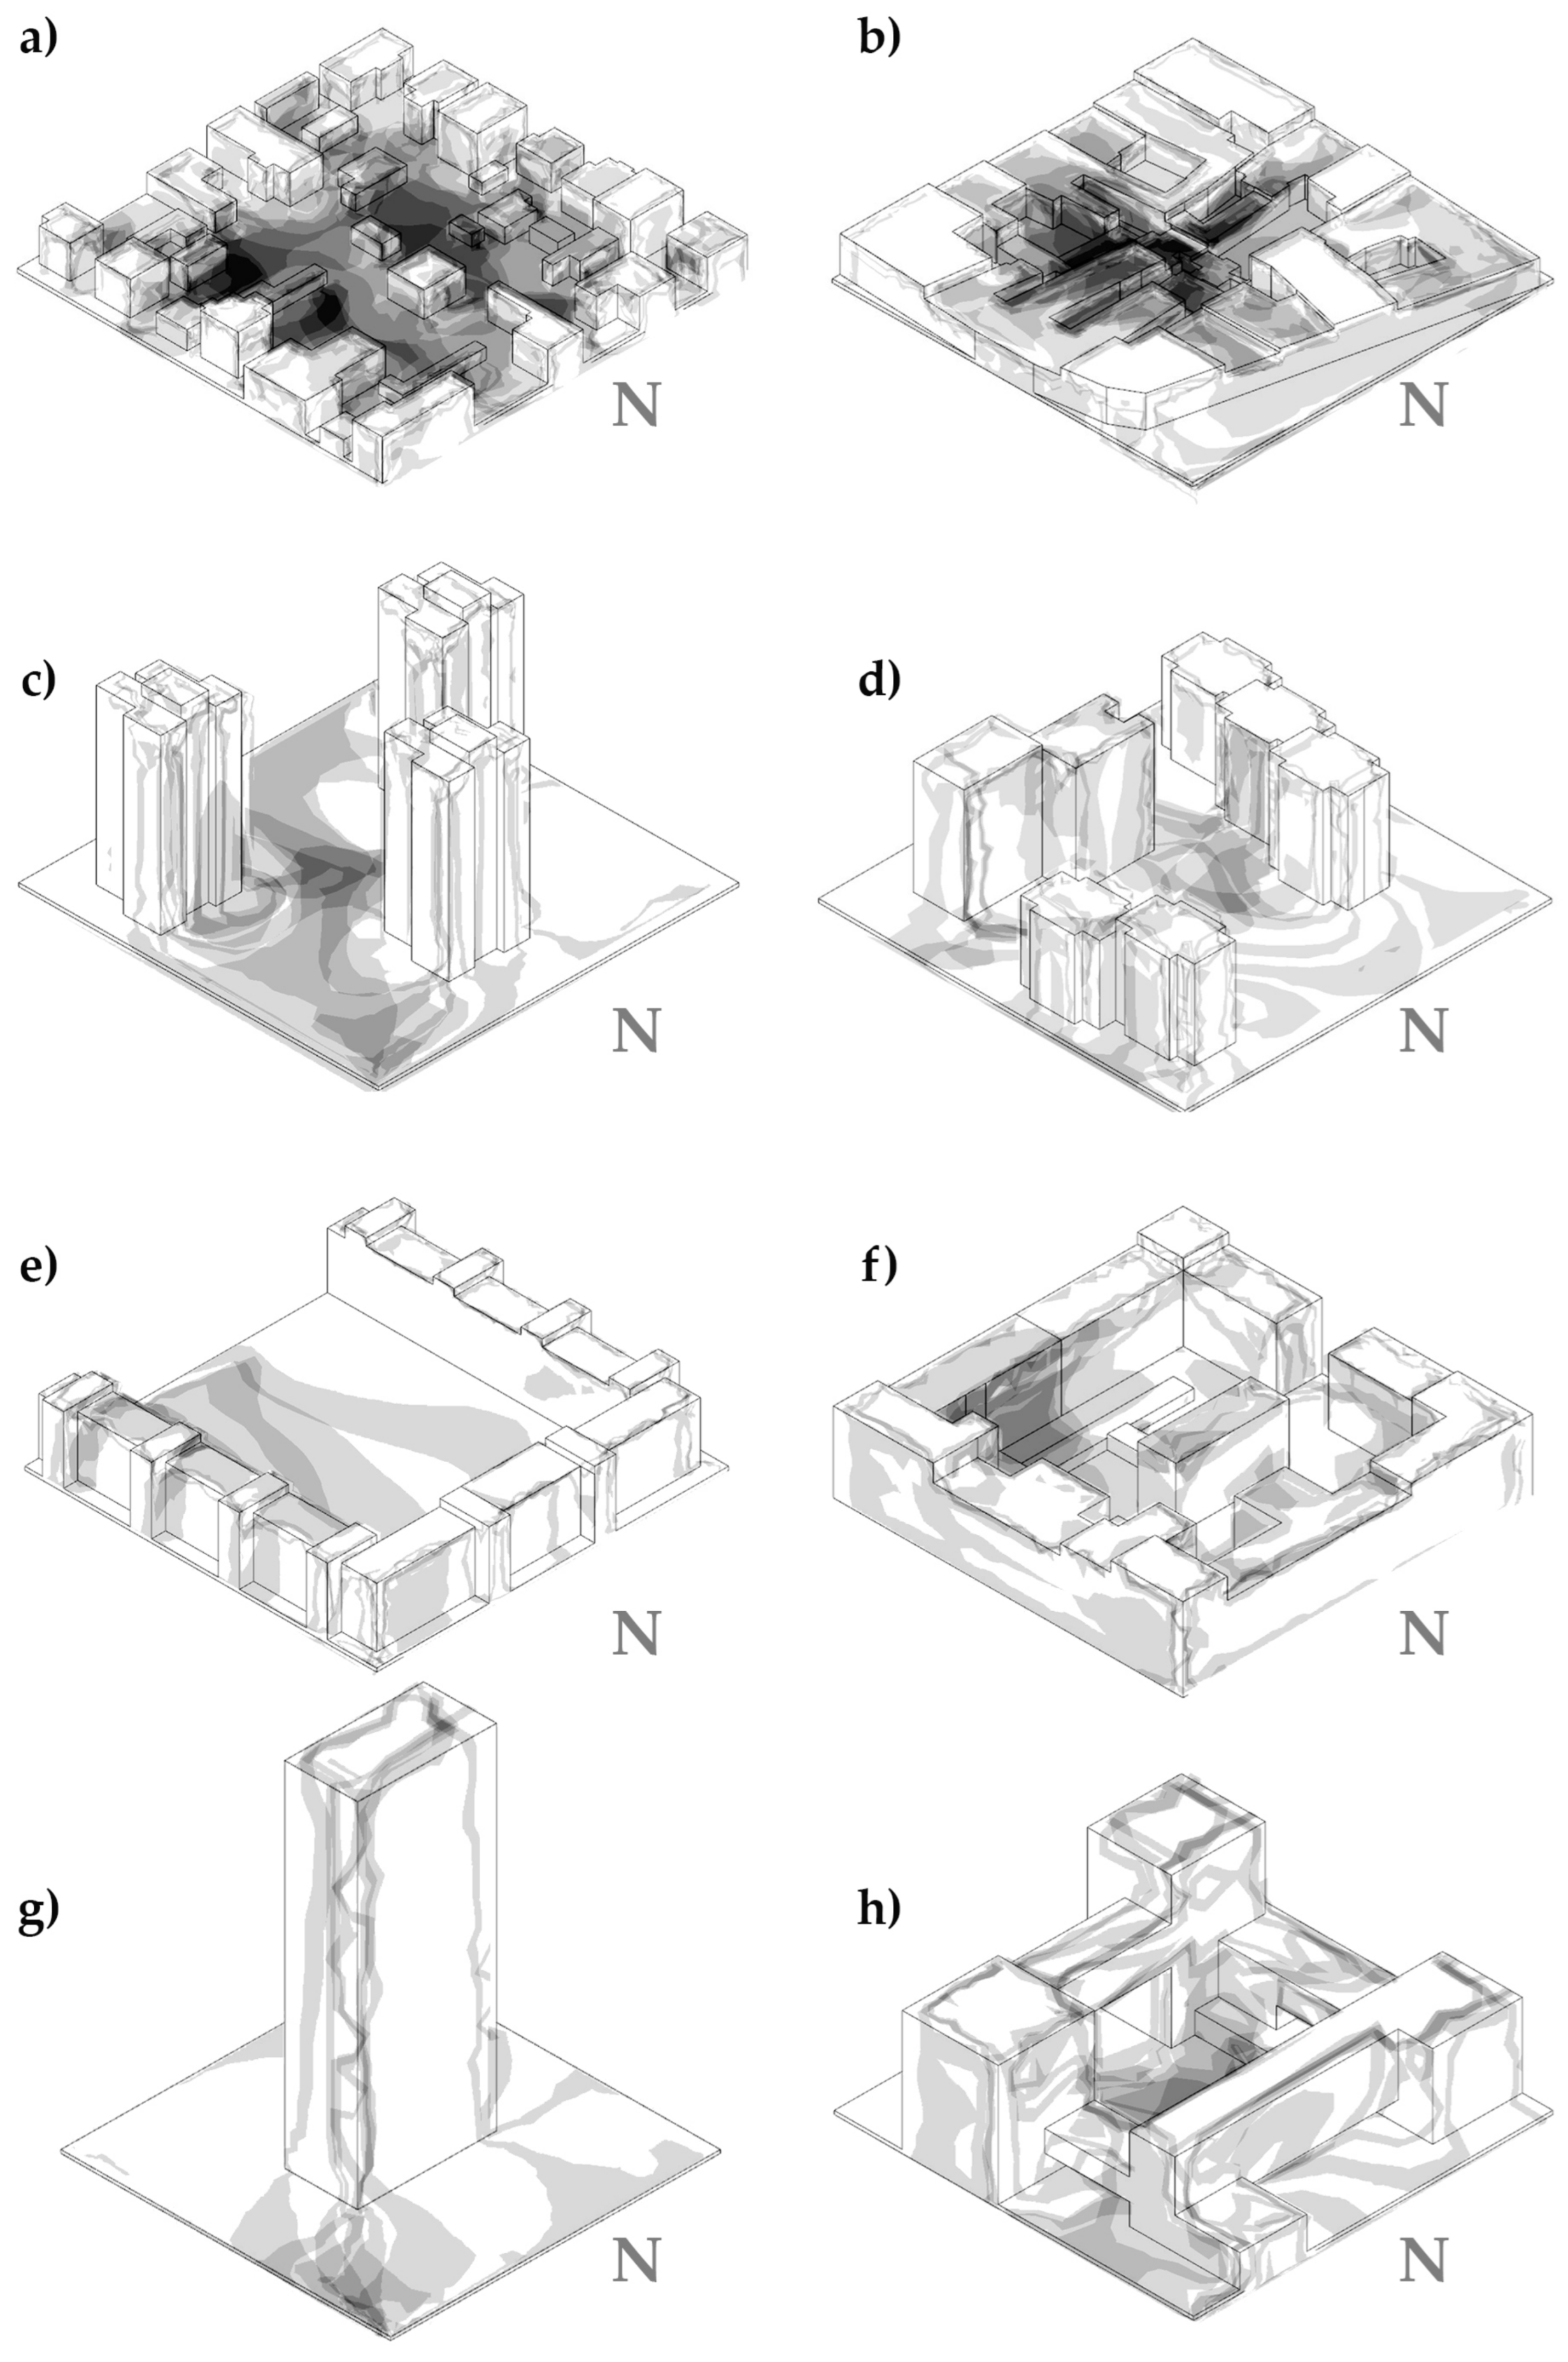
For comparison, the results of the static pressure from CFD simulations were exported. Low absolute values of pressure under 0.3 Pa are colored in black, and higher values, up to 11 Pa in some cases, are colored in white. The value of 0.3 Pa does not represent the threshold for experiments, but the measure for which low pressure results can easily be seen. The results are shaded according to the wind frequencies, similar to Equations (1) and (2). The results are presented with the ground plane and can be seen in
Figure 21. Several similarities between the results of velocities and pressure levels can be observed. Bad air flow is detected in the courtyards of the first and second urban blocks. The perimeter dense block and hybrid block show results that suggest slower movement of air around them. The best results are show for the one-building block, as in
Figure 17.
5. Conclusions
In this paper, a novel method for natural ventilation capacity assessment in urban areas was presented using average yearly data for multiple wind directions. This enabled automation and color-coding of the surfaces areas of urban blocks that have problems with ventilation and visualization on a single 3D model for most of the annual data. To our knowledge, this problem has not been considered by other researchers. The proposed method consists of a four-step process: location data interpretation, CFD simulation, synthesis of the results, and visualization. Location data were used for building creation and wind direction and velocity data interpretation. Buildings were 3D modeled without a roof. Simulations were conducted for eight main wind directions for the location. These simulations were synthesized by an algorithm that labeled stagnant air areas near the surfaces of the buildings. Results were represented in 3D form and as graphs.
The method was used for the analysis of eight different urban building morphologies from the city of Novi Sad, Serbia. The weather data were obtained from reliable sources. The results show that natural ventilation can be influenced significantly by urban morphology. Urban block types such as the one-tower block type showed the best results, and the worst results were obtained for traditional urban blocks from old city centers. The best results show that all of the vertical surfaces of the block are suitable for windows if the object is naturally ventilated.
The findings from this study make an important contribution to the field of CFD simulation of urban environments, providing solutions for natural ventilation analysis of urban blocks by analyzing multiple wind direction conditions. The results are represented in an easy-to-read format for urban block evaluation.
Our procedure can be augmented in a number of ways. First, the surrounding blocks can have a great impact on the results of CFD simulations. Our tests were conducted in order to compare the results. For studying real-world urban blocks, the surrounding geometry is necessary for better results. Second, trees were not part of the 3D model, and their influence on wind flow is well-established in the literature. Third, different turbulence models could be used for the analysis. Large-eddy simulation (LES) is considered a higher accuracy model than RANS, which was used in this study. Further, the system can be directly implemented in software solutions where most of the processes would be automated. This could help experts from the field of urban design in making better decisions.


