Article

The Hypoplastic Constitutive Model for Sandy Soil Considering the Rotation of the Principal Stress Axis

1
School of Physics and Electronic-Electrical Engineering, Ningxia University, Yinchuan 750021, China
2
Solid Mechanics Institute, Ningxia University, Yinchuan 750021, China
*
Author to whom correspondence should be addressed.
Appl. Sci. 2023, 13(12), 6993; https://doi.org/10.3390/app13126993
Submission received: 4 May 2023 / Revised: 31 May 2023 / Accepted: 7 June 2023 / Published: 9 June 2023

Abstract

:
Considering the influence of fabric on the critical state of sandy soil, an anisotropic hypoplastic constitutive model is developed by introducing the anisotropic critical state line that takes into account the rotation of the principal stress axes. With the introduction of new anisotropic state variables defined by the joint invariants of the stress tensor and fabric tensor, the critical state equation of sandy soil is established to describe the effects of three factors, namely, anisotropic parameters, stress states, and the relationship between principal stresses and fabric directions, on the critical state. The mechanical response of sandy soil under different deposition angles can be described by considering the rotation of principal stresses relative to the fabric. The application range of Wu et al.’s isotropic hypoplastic model (2017) is extended by incorporating the effect of principal stress rotation on the stress–strain relationship of sandy soil. Based on a series of Toyoura sand plane strain tests, the effects of void ratio, confining pressure, and principal stress axis rotation angle on anisotropic strength and deformation characteristics are simulated under low confining pressure. Furthermore, a comparison with Wu’s transversely isotropic hypoplastic model (1998) is made regarding their simulation performances. The proposed model exhibits a balanced performance when simulating the variation of anisotropy in both strength and deformation with respect to the rotation angle, without being overestimated within a certain range of rotation angles. The prediction results demonstrate, to a certain degree, the validity and effectiveness of the proposed model.

1. Introduction

The presence of anisotropy in the microstructure of sand causes notable variations in the mechanical response regarding the rotation and immobilization of the principal stress axis, particularly under complex loads such as earthquakes, traffic, and waves. Due to this, it has been the subject of extensive research by scholars globally [1,2,3].
Rotation of the principal effective stress axes with respect to the anisotropic fabric causes anisotropic behavior in sand. Research studies conducted by Arthur (1972), Oda (1972, 1999), and Yamada (1979) have found that the stochastic arrangement of non-spherical sand particles in space exhibits statistically significant characteristics known as microstructures which can be described using a second-order symmetric tensor [4,5,6,7]. The preferred distribution of contact direction, particle morphology, and pore space of sand particles results in different anisotropic microstructures. Thus, Li et al. (2010, 2016, 2017) comprehensively investigated the normal contact fabric, porosity fabric, and particle morphology fabric [8,9,10,11,12,13,14,15]. Furthermore, the analytical method has also demonstrated its efficiency in describing the crack fabric of rocks [16]. The rotation effect of the principal stress axis can be attributed to the existence of anisotropic microstructures, and the principal stress axis rotation causes the development of sand particle contact, morphology, and pore space, contributing to the anisotropic evolution of the microstructure [17]. Consequently, an increasing number of researchers have become interested in these characteristics. Gao (2010), Lade (2008), and the author (2010) previously considered the micro-characteristics of particles and proposed using the fabric tensor to establish an anisotropic strength criterion [8,18,19]. In the research of Guo et al. (2008), the authors demonstrated the significant effect of sand fabric rearrangement on its shear strength [20]. Moreover, the authors showed that when the principal stress axis rotates, there is a more significant relationship between the strength of the sand soil and its variations. Ruan et al. (2021) utilized finite element analysis to investigate the variation in strength parameters caused by the rotation of the principal stress axis during tunnel excavation [1]. The results indicate that the principal stress rotation angle gradually increases during soil construction. Additionally, Liu et al. (2022) investigated the deformation properties of fiber-reinforced aeolian sand under traffic loads using a small-strain hollow cylindrical torsion shear device [2]. The authors found that continuous rotation of the principal stress axis leads to non-coaxial deformation. Since the establishment of the soil mechanics theory regarding the critical state, the non-coaxial behavior of soil has attracted significant attention from numerous scholars [21,22,23]. Wang (2022) examined the seismic settlement deformation of soft soil foundations, considering the effect of principal stress axis rotation, and developed a soft soil model under earthquake loading [3]. As a result, it can be observed that actual engineering practices often involve the effect of the principal stress axis rotation. This effect can lead to anisotropic differences in the mechanical properties of soil in different directions, which are specifically involved in engineering problems such as slope stability and foundation bearing capacity. The importance of this effect is evident. Neglecting this characteristic while establishing the constitutive model of soils and applying them to engineering practice may lead to an improper evaluation of the actual stress state in soils, which can further potentially cause engineering disasters.
In addition to the rotation of the principal stress axis, plane strain problems are also common in the process of engineering construction, such as retaining wall instability, foundation instability, slope slippage [24,25,26], etc. Research indicates that the strength estimated under plane strain conditions is generally 10 to 20% higher compared to strength measured under conventional triaxial conditions [27]. If the calculation employs plane strain parameters, a substantial amount of the engineering cost could be reduced. Past studies by Oda (1978), Finno (1997), Alshbill (2003), and Chu (2001) furnish valuable insights into the impact of confining pressure, compactness, drainage conditions, loading paths, and other factors on the mechanical properties of soil in a plane strain test, and the results of the experimental research are significant [27,28,29,30].
The literature offers limited reports on soil response under both rotations of the principal stress axis and plane strain conditions. Currently, only a few researchers, such as Oda (1978) and Tatsuoka and Sakamoto (1986), have conducted anisotropic experiments that consider the effects of changes in the deposition angle (rotation of the principal stress axis relative to the fabric direction) under plane strain conditions [27,31]. The scarcity of reports on anisotropic testing is due to sample preparation difficulties and considerable artificial effects during the experimental phase. Consequently, to gain a more profound comprehension of the mechanical properties of soil under plane strain conditions with the rotation of the principal stress axis, it is essential to augment our understanding via numerical simulations, constitutive modeling, and other approaches. This paper aims to further investigate this issue from a constitutive modeling viewpoint.
The introduction of hypoplastic constitutive models in soil mechanics research has provided a novel perspective for the investigation of soil constitutive models. Hypoplastic models do not involve complex concepts, such as yield functions, hardening rules, and elastic–plastic strain separation, which are present in the theory of elastoplasticity. The fundamental concept of hypoplasticity was first proposed by Kolymbas (1991), who used a rate-independent non-linear tensor function to describe the non-elastic material characteristics [32]. Wu and Bauer (1994) presented the first simple and general four-parameter hypoplastic constitutive model [33] based on the general equation of hypoplastic constitutive models proposed by Wu and Kolymbas (1990) [34]. Wolffersdorff (1996) extended the previous model by incorporating the SMP criterion to propose an eight-parameter model [35]. Wu and Lin (2017) revised the original four-parameter model by introducing new tensor terms to ensure that the constitutive response could still reach the critical state even under large strains [36]. Over the past decade, the studies of hypoplastic theory have undergone exponential development [37,38,39,40]. It can be observed that most of the developments of the aforementioned hypoplastic models have been based on the isotropy assumption of the materials. The isotropic models cannot explain the differences in the mechanical properties of soils with varying directions, while anisotropic elastoplastic models can effectively clarify this phenomenon and accurately predict the constitutive response of soils. Their simulation results are more consistent with the measured results from indoor tests and engineering practice. In geotechnical research, these models can be used to analyze the stability and bearing capacity of soils, and therefore to guide engineering design and construction, while anisotropic models that take into account the effect of principal stress axis rotation have seldom been reported.
Considering the simplicity and engineering application of the constitutive model, this paper will integrate the effect of principal stress axis rotation into hypoplastic constitutive models. We will consider the transformational relationship between the principal stress axis and the fabric direction based on fabric tensor. To establish an anisotropic hypoplastic constitutive model, this paper will introduce newly defined anisotropic state variables into the constitutive equations using the macro–micro combined method. The model can comprehensively analyze the strength and deformation anisotropy under various deposition angles. The proposed model provides a modeling approach for how to expand isotropic models into anisotropic models through a simple method, while also providing a prerequisite for the finite element development and engineering application of the model. Additionally, the simulation and verification analysis in this paper will be based on the Toyoura sand plane strain test.

2. The Critical State Line Considering the Effect of Principal Stress Axis Rotation

2.1. Anisotropic State Variables

Conventional methods for examining the effect of the principal stress axis rotation, such as rotating the failure planes to investigate soil anisotropy, fail to effectively describe the impact of principal stress axis rotation on the capacity for shear resistance. In this paper, we introduce a new anisotropic state variable based on the microscopic fabric [11,13,41], which provides a practical solution to this problem. Based on a literature review, Norouzi et al. (2021) proposed a normalized stress ratio-dependent second-order fabric tensor, while Hu et al. (2020) used a back stress-modified yield surface proportional to the fabric tensor, both achieving fabric anisotropic function [42,43]. However, the updating of the fabric tensor in these methods must be correlated with plastic strain rate.
The anisotropic state variables used in this paper are defined through the joint invariants of the stress tensor and the fabric tensor. In comparison to the previous approach, the concept of elastic–plastic differentiation is not required, and the number of parameters is reduced. This makes both the form and programming implementation relatively simple. However, it should be noted that this paper does not take into account the evolution of the fabric tensor, which may limit its ability to simulate complex stress paths. The concrete expression of the fabric tensor is as follows:
F = F 11 0 0 0 F 22 0 0 0 F 33 = 1 + a 1 + a 2 + a 1 a 2 3 + a 1 + a 2 a 1 a 2 0 0 0 1 + a 1 a 2 a 1 a 2 3 + a 1 + a 2 a 1 a 2 0 0 0 1 a 1 + a 2 a 1 a 2 3 + a 1 + a 2 a 1 a 2 .
a1 and a2 represent the fabric magnitude parameters of anisotropic materials, which is a physical quantity used to describe the degree of anisotropy on the orthogonal plane [12,15]. It is worth noting that axes 1 to 3 are defined based on the bedding plane and they exhibit an orthogonal relationship between any two axes. Axis 1 is oriented perpendicular to the bedding plane (i.e., normal direction), while axes 2 and 3 are oriented parallel to the bedding plane (i.e., tangential direction). Rotation of the principal stress axis causes a change in the angle between the principals of the effective stress and fabric tensors, leading to changes in the anisotropic state variables A. At this time, the transformation tensor is given by [8,9]
C k i = cos α 0 sin α 0 1 0 sin α 0 cos α . .
α refers to the angle between the principal stress axis and the principal direction of the fabric tensor. The rotated fabric tensor F can be expressed as follows:
F i j = C k i C l j F i j = F 11 + F 33 2 + F 11 F 33 2 cos 2 α 0 F 33 F 11 2 sin 2 α 0 F 22 0 F 33 F 11 2 sin 2 α 0 F 11 + F 33 2 F 11 F 33 2 cos 2 α .
The corresponding anisotropic state variable A is transformed as follows:
A = σ i j σ m F i j A 0 .
A0 is the reference point and can be determined by the stress state at conventional triaxial compression.

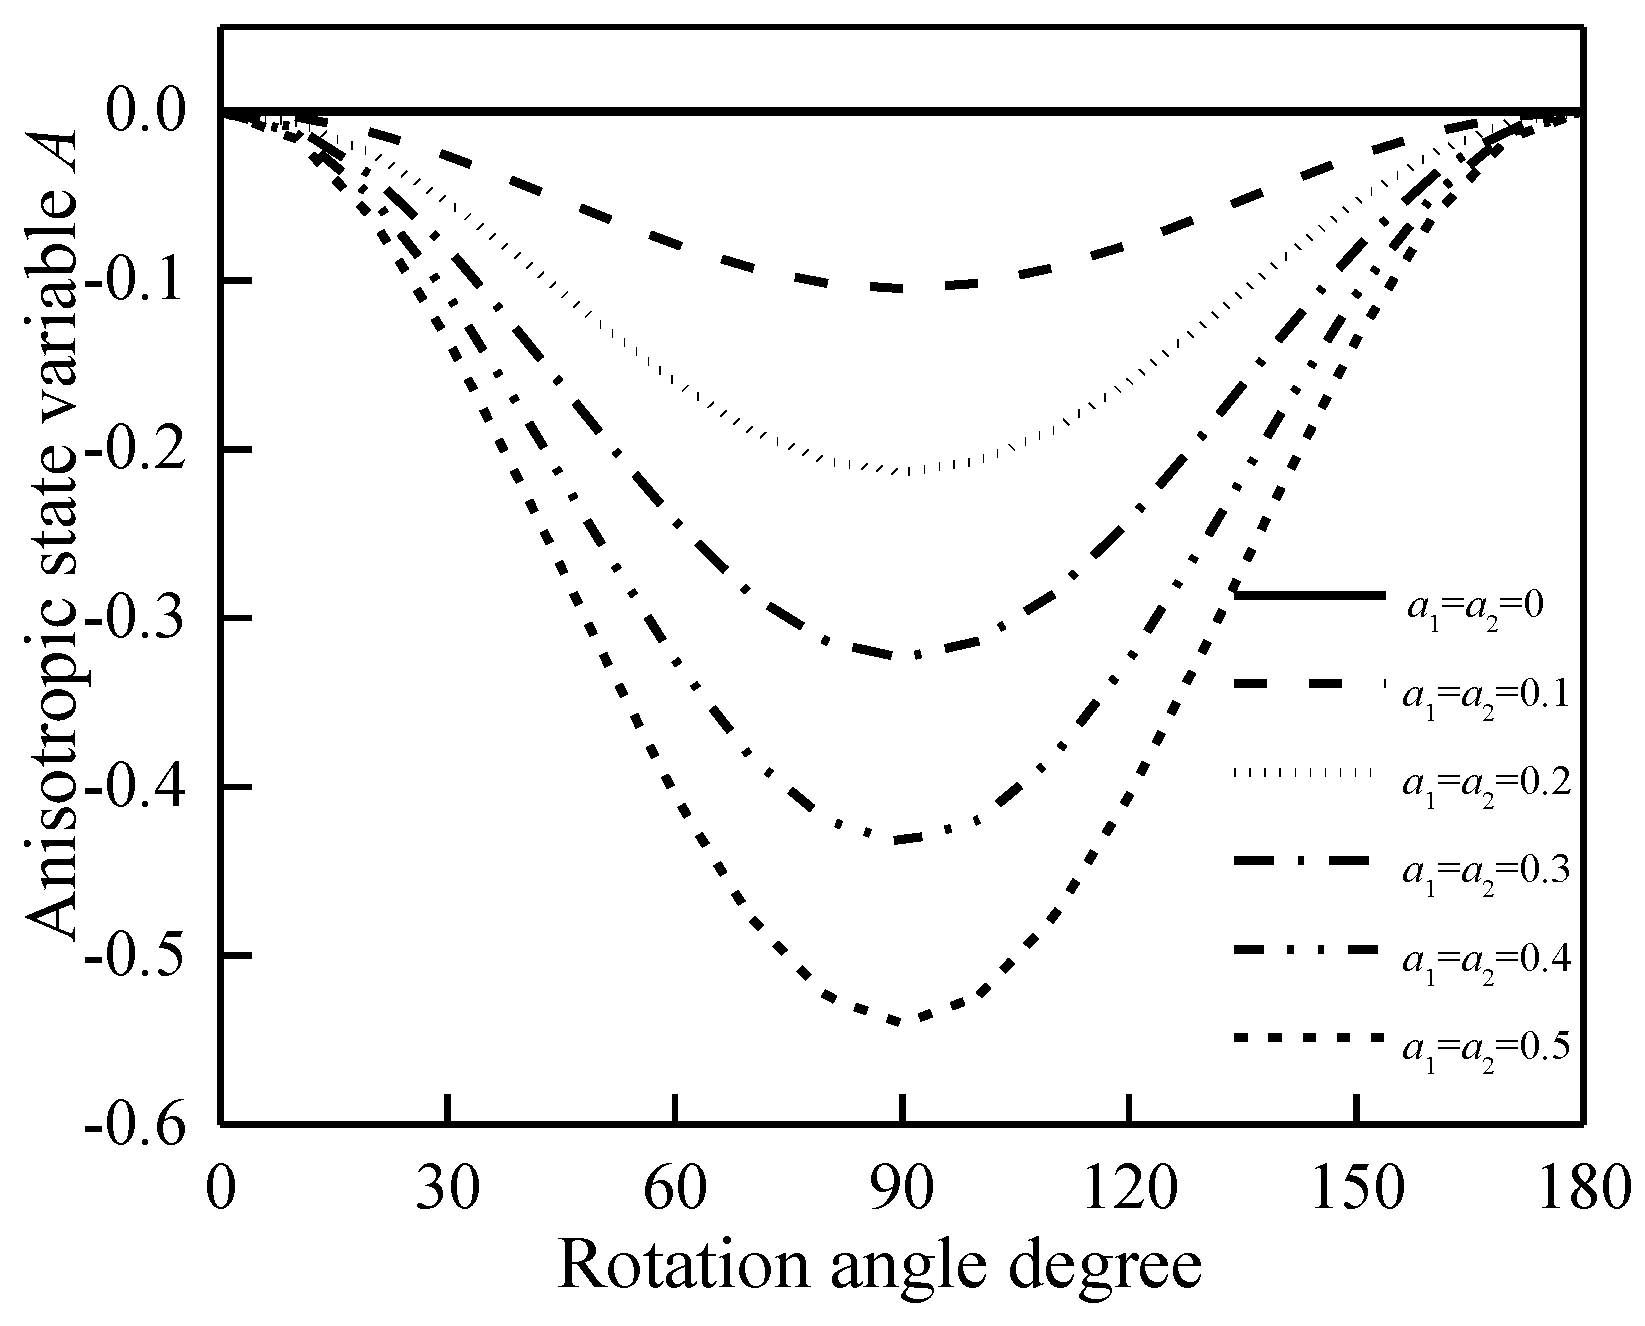
2.2. The Influence of Principal Stress Axes Rotation on the Anisotropic State Variables

When the principal stress axis rotates from 0 to 180 degrees, the corresponding anisotropic state variable A changes systematically. The following curve depicts the relationship between the rotation angle and A under different anisotropic conditions (with different values of A).
Figure 1 depicts the effect of the rotation angle on A when a1 = a2. The calculations are conducted using an intermediate principal stress coefficient of b = 0.5, a failure stress ratio Mf of 1.25, and a confining pressure of 100 kPa. Notably, A remains consistently 0 when a1 = a2 = 0, implying isotropic material behavior. In this particular scenario, the rotation of the principal stress axis has no effect on A, and by extension, it does not alter the failure strength. Conversely, when a1 = a2 ≠ 0, A varies monotonically within the 0 to 90 degrees range, highlighting the anisotropic nature of the material. The failure strength changes in accordance with the rotation angle, and the magnitude of this variation is proportional to the magnitude of the change in A value.
Figure 2 shows the impact of the rotation angle on A when a1 is not equal to a2. Figure 2a,b represent the influence of varied a2 on A while a1 remains constant (for example, when a1 equals 0.1 or 0.5). It is evident that there is a gradual increase in A with an increase in a2, albeit the amplitude of the rise is relatively minor. On the other hand, Figure 2c,d displays the influence of varied a1 on A while a2 remains constant (for instance, when a2 equals 0.1 or 0.5). The changes are comparable to those seen with a2 variation—i.e., there is an increase in the anisotropic state variables with an increase in a2. However, a1 has a more significant impact than a2.
Based on the analysis, the following conclusions can be drawn: A varies with the change in rotation angle, and its absolute value monotonically increases from 0° to 90°; additionally, A increases as amplitude parameters a1 and a2 increase, with a1 having a greater impact than a2.

2.3. The Effect of the Rotation of Principal Stress Axis on the Critical State Line

The original model, i.e., without introducing a critical state line, cannot reflect the influence of density and stress levels on the constitutive response, nor can it demonstrate the strain softening characteristics of strength. The introduction of a critical state line can improve the above shortcomings, and a single set of parameters can be used to describe the constitutive relationship of soil within a wide range of density and stress levels.
The critical state line definition by Wu et al. (1996) and the author’s prior research (2015, 2016) guide the introduction of anisotropic state variables into it [10,11,44]. This paper adopts the critical state line form as follows:
f ( e ) = e e m i n e c r t e m i n a .
The dimensionless parameter, a, controls the degree of stress softening and is assigned a value of 0.1 based on actual conditions. E represents the current void ratio, while emin, the minimum void ratio, is set at 0.32 in this paper. ecrt, the critical void ratio, is expressed as e c r t = e Γ λ c ( P / P a ) ζ + t A , which is a function of A and the average principal stress P. Atmospheric pressure is denoted by Pa, while eΓ, λc, and ζ are material parameters that determine the critical state line and t is a state parameter [10]. Recommended parameter values from reference [10] include eΓ = 0.934, λc = 0.019, ζ = 0.7, and t = 0.26.
After the rotation of the principal stress axis, A undergoes changes that, in turn, affect ecrt and consequently influence the critical state line, also altering the stress history and thereby causing a change in the strength during the loading process.
Figure 3 depicts the impact of principal stress rotation angle on the critical state line under conditions of a1 = a2. The outcomes evince that for anisotropic materials (a1, a2 ≠ 0), the critical state line undergoes variation with respect to the rotation angle, displaying a monotonically ascending tendency within the 0 to 90 degrees range. As a1 and a2 increase, the critical state line’s variation range also increases.
In Figure 4, the influence of the principal stress rotation angle on the critical state line is presented for a1a2. Specifically, Figure 4a,b shows the impact of varying a2 on the critical state line under a constant a1 (e.g., a1 values of 0.1 and 0.5). Likewise, Figure 4c,d portrays the impact of varying a1 on the critical state line under a constant a2 (e.g., a2 values of 0.1 and 0.5). Our analysis reveals that an increase in a1 and a2 results in a higher value of the critical state line, while a1 exerts a more pronounced effect compared to a2.
Furthermore, the essential reason for the influence of the principal stress axis rotation on the behavior of soils can be summarized as follows: as the rotation angle of the principal stress changes, the components of the principal stress decomposed into the normal and tangential directions of the bedding plane will also change, thus affecting the stress state of the soil and causing differences in strength and deformation characteristics, leading to an impact on the soil’s behavior.

3. Simulation of Sand Plane Strain Test

In this section, the newly developed hypoplastic constitutive model integrates the rotation of principal stress axes to simulate sand plane strain tests while accounting for the impact of the deposition angle. The experimental results showed relatively good agreement with the practical application of engineering principles.

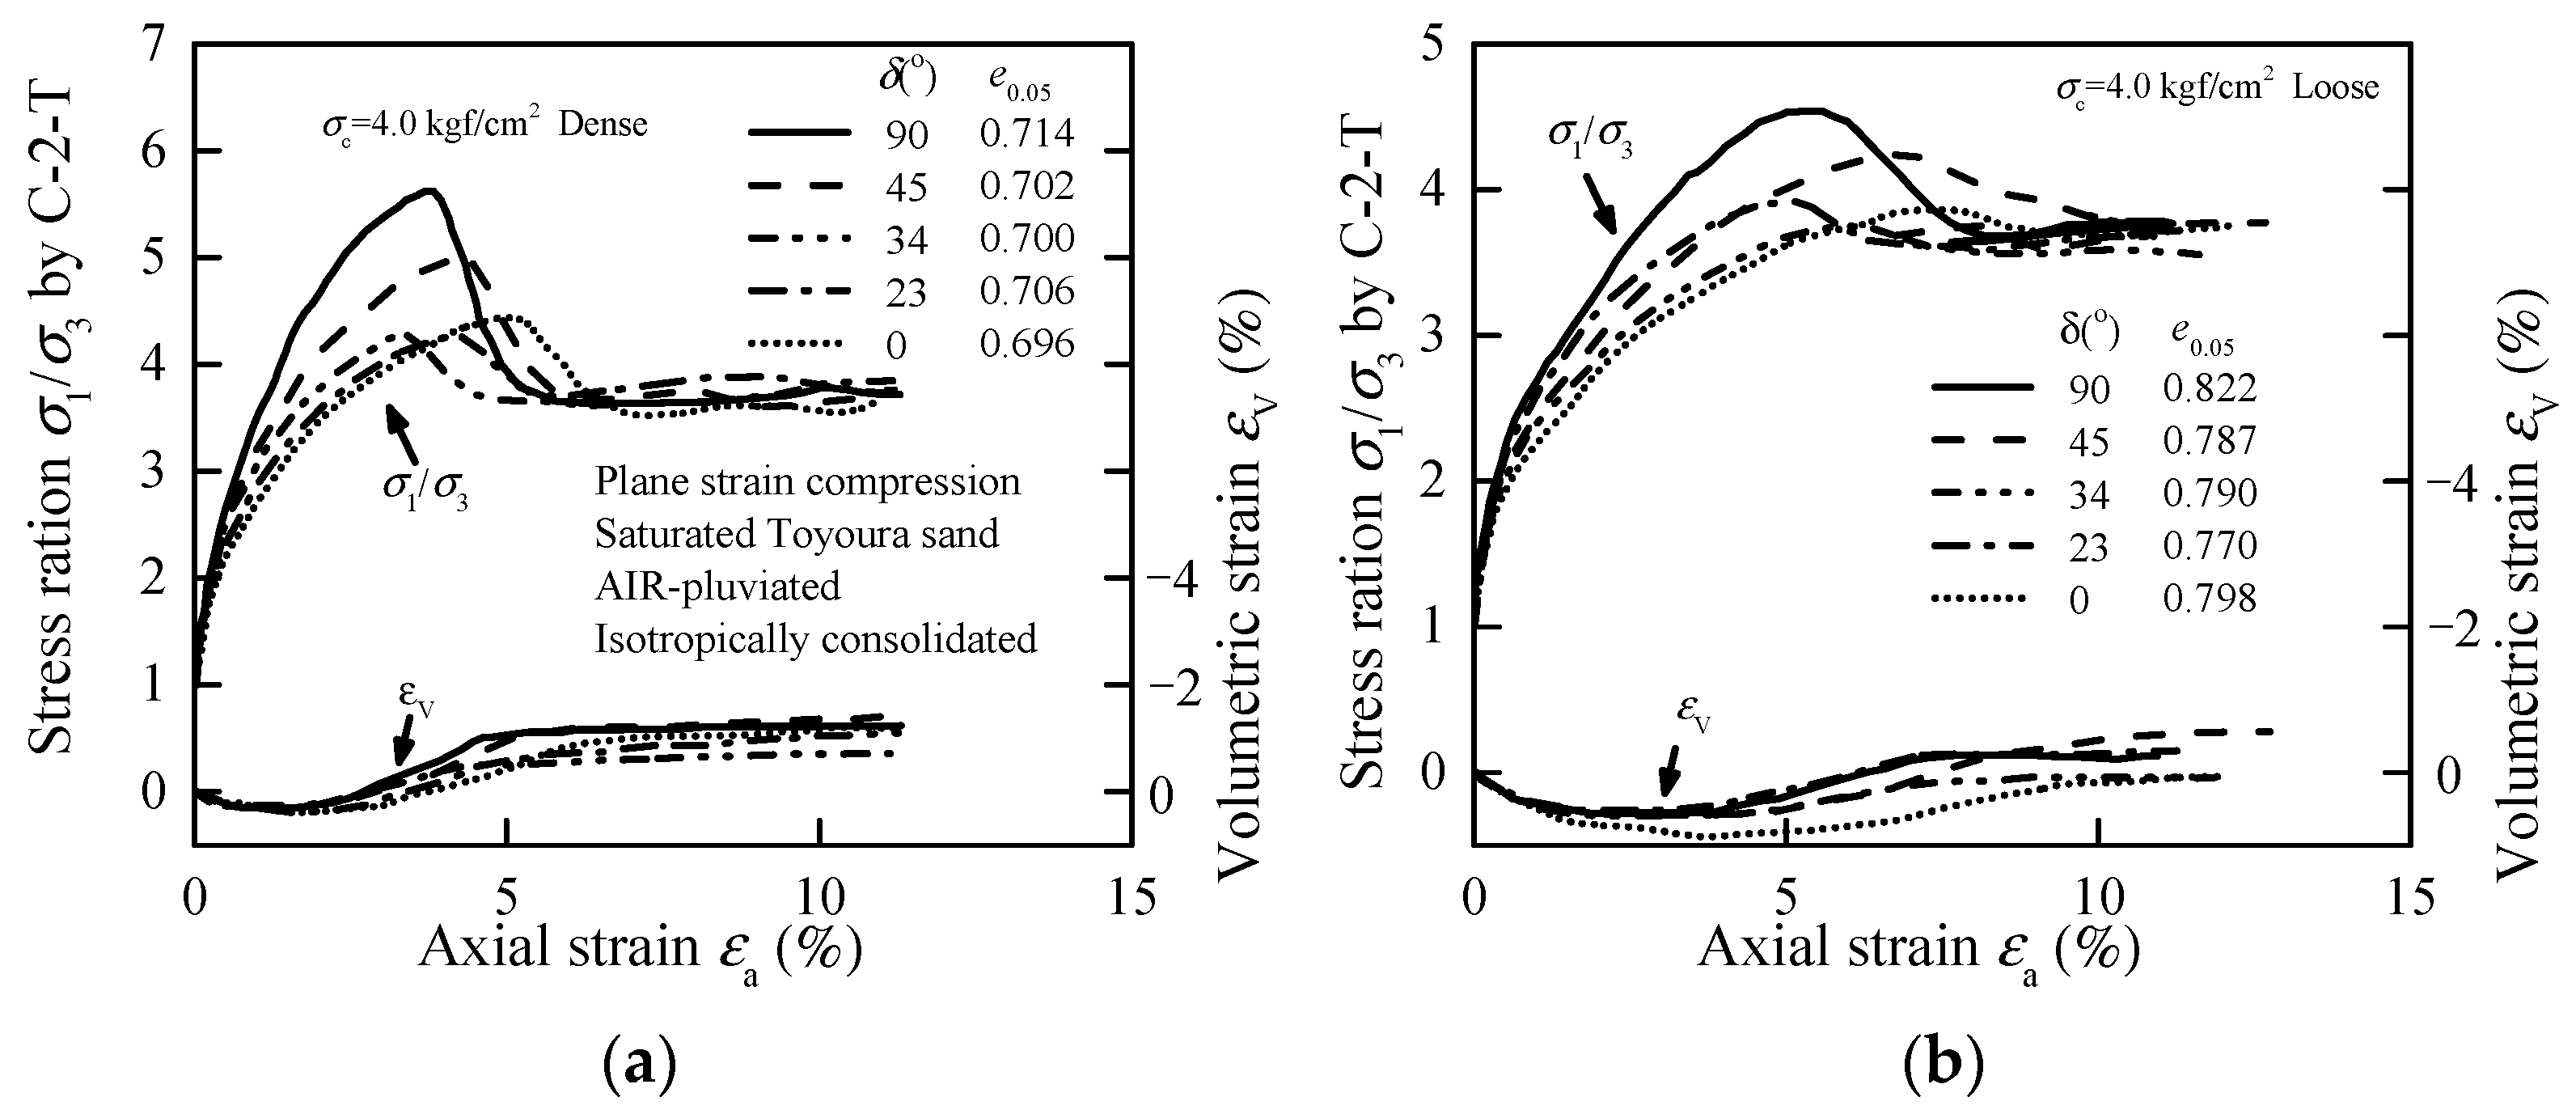
3.1. Introduction to Experiment

Arthur (1977) and Oda (1978) discovered that anisotropy has a greater effect on the mechanical properties of sand under plane strain conditions than under triaxial compression conditions [27,45]. In Oda’s experiments, the friction angle φ reached its minimum value when the confining pressure was 2.0 or 4.0 kgf/cm2 (corresponding to 200 and 400 kPa) and the deposition angle δ was between 24° and 30°. (In this paper, the deposition angle δ is defined as the angle between the bedding plane and the direction of the major principal stress, as shown in Figure 5a.) This has been confirmed by Matsuoka (1987) [46]. However, Oda’s experimental data are not clear under lower confining pressures, such as 50 and 100 kPa. Therefore, Tatsuoka and Sakamoto (1986) conducted a series of plane strain tests under drained conditions to study the variation of shear strength of saturated Toyoura sand with different δ under low confining pressures [31]. The range of confining pressure was 0.05–4.0 kgf/cm2 (5–400 kPa), and the sand samples were saturated Toyoura sand. δ varied from 0° to 90°, and the corresponding stress paths for δ of 0° and 90° are shown in Figure 5b.
The deposition angle described in the aforementioned experiments is consistent with the rotation angle of the principal stress axis in the constitutive model, both of which describe the angle between the principal stress and fabric.
The test scheme for this study is presented in Table 1. In the following table, the void ratios e ≈ 0.7 and e ≈ 0.8 correspond to dense sand and loose sand, respectively.

3.2. Determination of Model Parameters

The general form of hypoplastic model is as follows:
σ o = L ( σ , ε ˙ ) + N ε ˙ .
The symbols L and N in the equation represent, respectively, the linear and nonlinear terms of the hypoplastic model, which together describe the nonlinear mechanical behavior of soil. Meanwhile, ε ˙ represents the Euclidean norm of the strain rate, namely, the modulus of strain rate.
Based on an anisotropic state variable that considers the rotation of axes of principal stress, a critical state line is established and introduced into the hypoplastic constitutive model proposed by Wu (2017), resulting in an anisotropic hypoplastic constitutive model that considers the effects of axes of principal stress rotation [36]:
σ o = C 1 tr ( σ ) ε ˙ + C 2 tr ( ε ˙ ) σ + C 3 tr σ ε ˙ tr σ σ + C 4 f ( e ) ( σ + σ * ) ε ˙
f ( e ) = ( e e m i n e Γ λ c ( P / P a ) ζ + t A e m i n ) a .
We can introduce the critical state line by simply multiplying f(e) in the nonlinear term. In Equation (8), A′ represents the anisotropic state variables that consider the rotation of principal stress axes. Additionally, the literature has explained the basic parameters [44].
The parameters Ci (i = 1~4) in the hypoplastic constitutive model discussed above can be determined via triaxial compression tests conducted under constant confining pressure. Several papers have explained the detailed calculation method for Ci [33,44]. It is important to note that if void ratio related terms exist in hypoplastic constitutive models, the corresponding dilatancy angle should be set to zero. Additionally, the model parameters and test parameters should remain consistent. The calculated model parameters are presented in Table 2.

3.3. Simulation Result

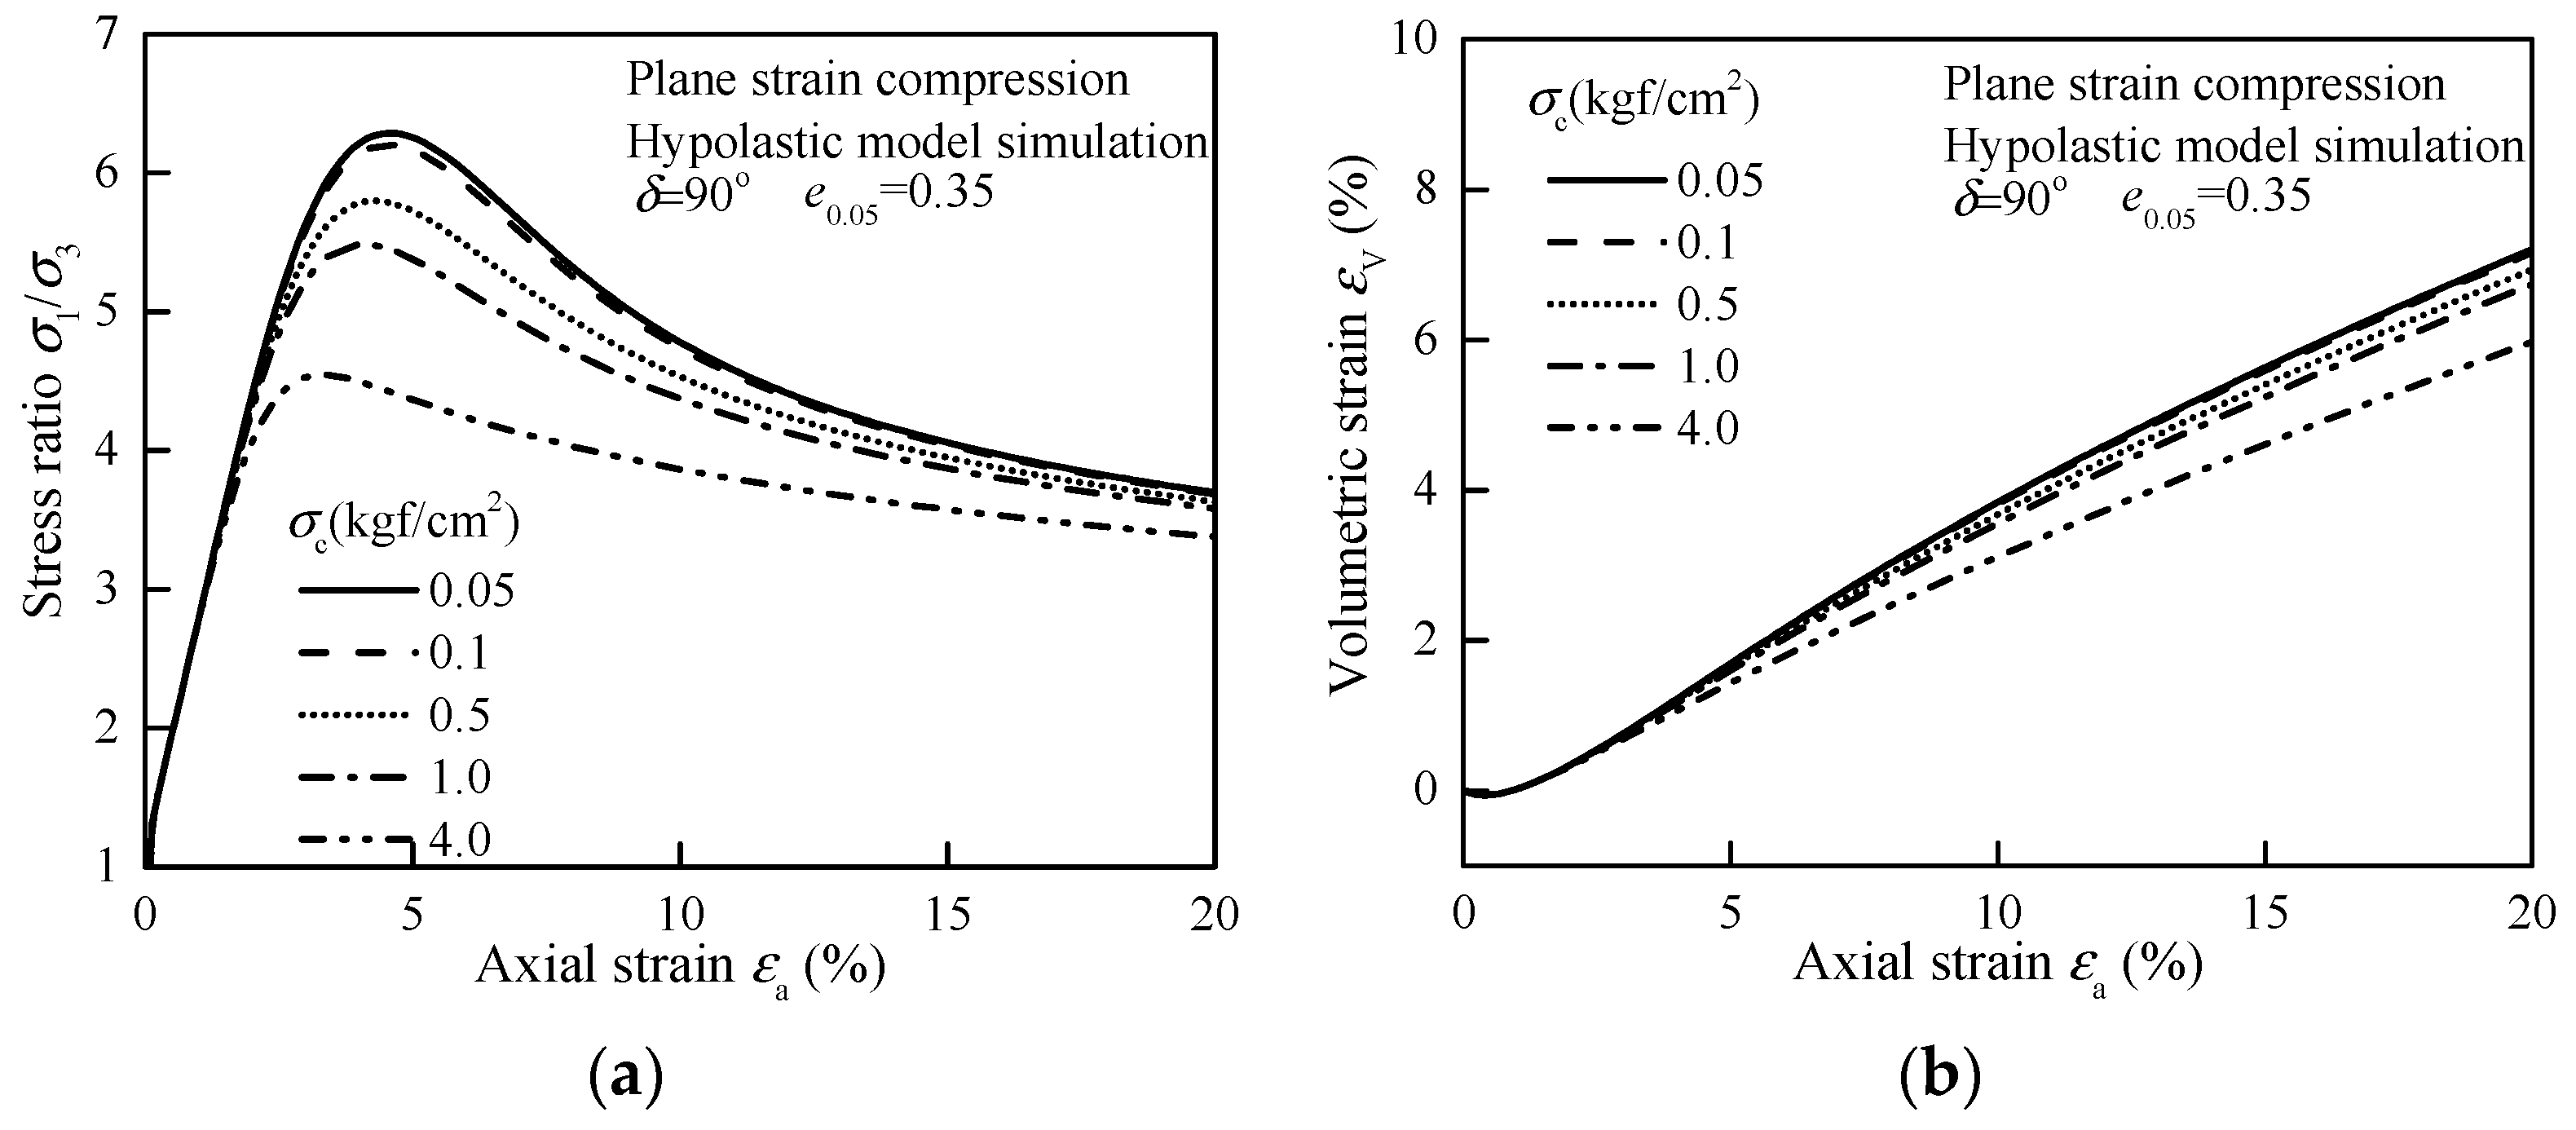
3.3.1. Influence of Confining Pressure on Strength and Deformation

Figure 6 displays the relationship between the stress ratio (σ1/σ3) and volume strain (εv), with axial strain (εa) obtained from physical experiments (reference [31]). The experiments were conducted under different pressure levels, where the void ratio e was approximately 0.75 and δ was set at 90° to investigate the effect of confining pressure (σc) on deformation characteristics. Three conclusions can be drawn from the results: First, prior to reaching peak stress, the ratio of the increment in stress ratio divided by the increment in axial strain (d(σ1/σ3)/dεa values) declines with the rise of σc under constant σ1/σ3 conditions. The axial strain (εa) at peak stress increases with the rise of confining pressure (σc), and this trend becomes more prominent when σ3 exceeds 0.5 kgf/cm2. In addition, after reaching peak stress, −d(σ1/σ3)/dεa increases with the increase in σc. Finally, both σ1/σ3 and εv decrease with the increase in σc when the samples reach a higher strain state (5~10%). When the confining pressure σc is 0.5, 1.0, 4.0 (kgf/cm2), the increment of volumetric strain dεv corresponding to axial strain of 5~10% is nearly zero, and the corresponding σ1/σ3 is about 3.5. This finding indicates that some of the samples have reached the residual stress state under the existing confining pressure. In contrast, when the σc is 0.05 kgf/cm2 and εa reaches 5~10%, the corresponding dεv is not zero and the stress ratio σ1/σ3 is greater than 3.5, indicating that under this confining pressure level, the specimen has not yet entered the residual stress state and will still undergo further deformation.
The results of the hypoplastic constitutive model simulation are presented in Figure 7. First, it is important to clarify that this article focuses on qualitatively elucidating the capability of the proposed model to simulate anisotropy. The objective is to establish a correlation between the simulation results and the trends observed in experimental data. However, a thorough quantitative comparison with experimental results is not performed. The void ratio in the hypoplastic constitutive simulation was set at e = 0.35 to emphasize the stress softening aspect, while keeping all the other conditions the same as in the experiment. The simulation and experimental results exhibit similar trends, with reductions in stress ratio and εv as the confining pressure increases. The maximum values of σ1/σ3 and εv were obtained at the minimum confining pressure condition, σc = 0.05 kgf/cm2. The peak stress ratio and residual stress ratio from the constitutive model simulations were approximately 6.3 and 4.0, respectively, closely matching the physical experiment results of 6.0 and 4.5, respectively. At εa of 10%, the corresponding εv was 4%, which was slightly greater than that of the physical sample. When σc was 4.0 kgf/cm2, the constitutive model simulations yielded peak stress ratio and residual stress ratio values of 4.5 and 3.8, respectively; whereas the physical experiment showed values of 5.1 and 4.0, respectively. At εa of 10%, the corresponding εv was 3%.
The results indicate relatively fine agreement between the hypoplastic constitutive model and physical testing trends, which can broadly reflect the strength and deformation characteristics of soil under different confining pressures, especially stress ratio. The curve of axial strain versus volumetric strain can also reflect the overall evolution law corresponding to physical testing.

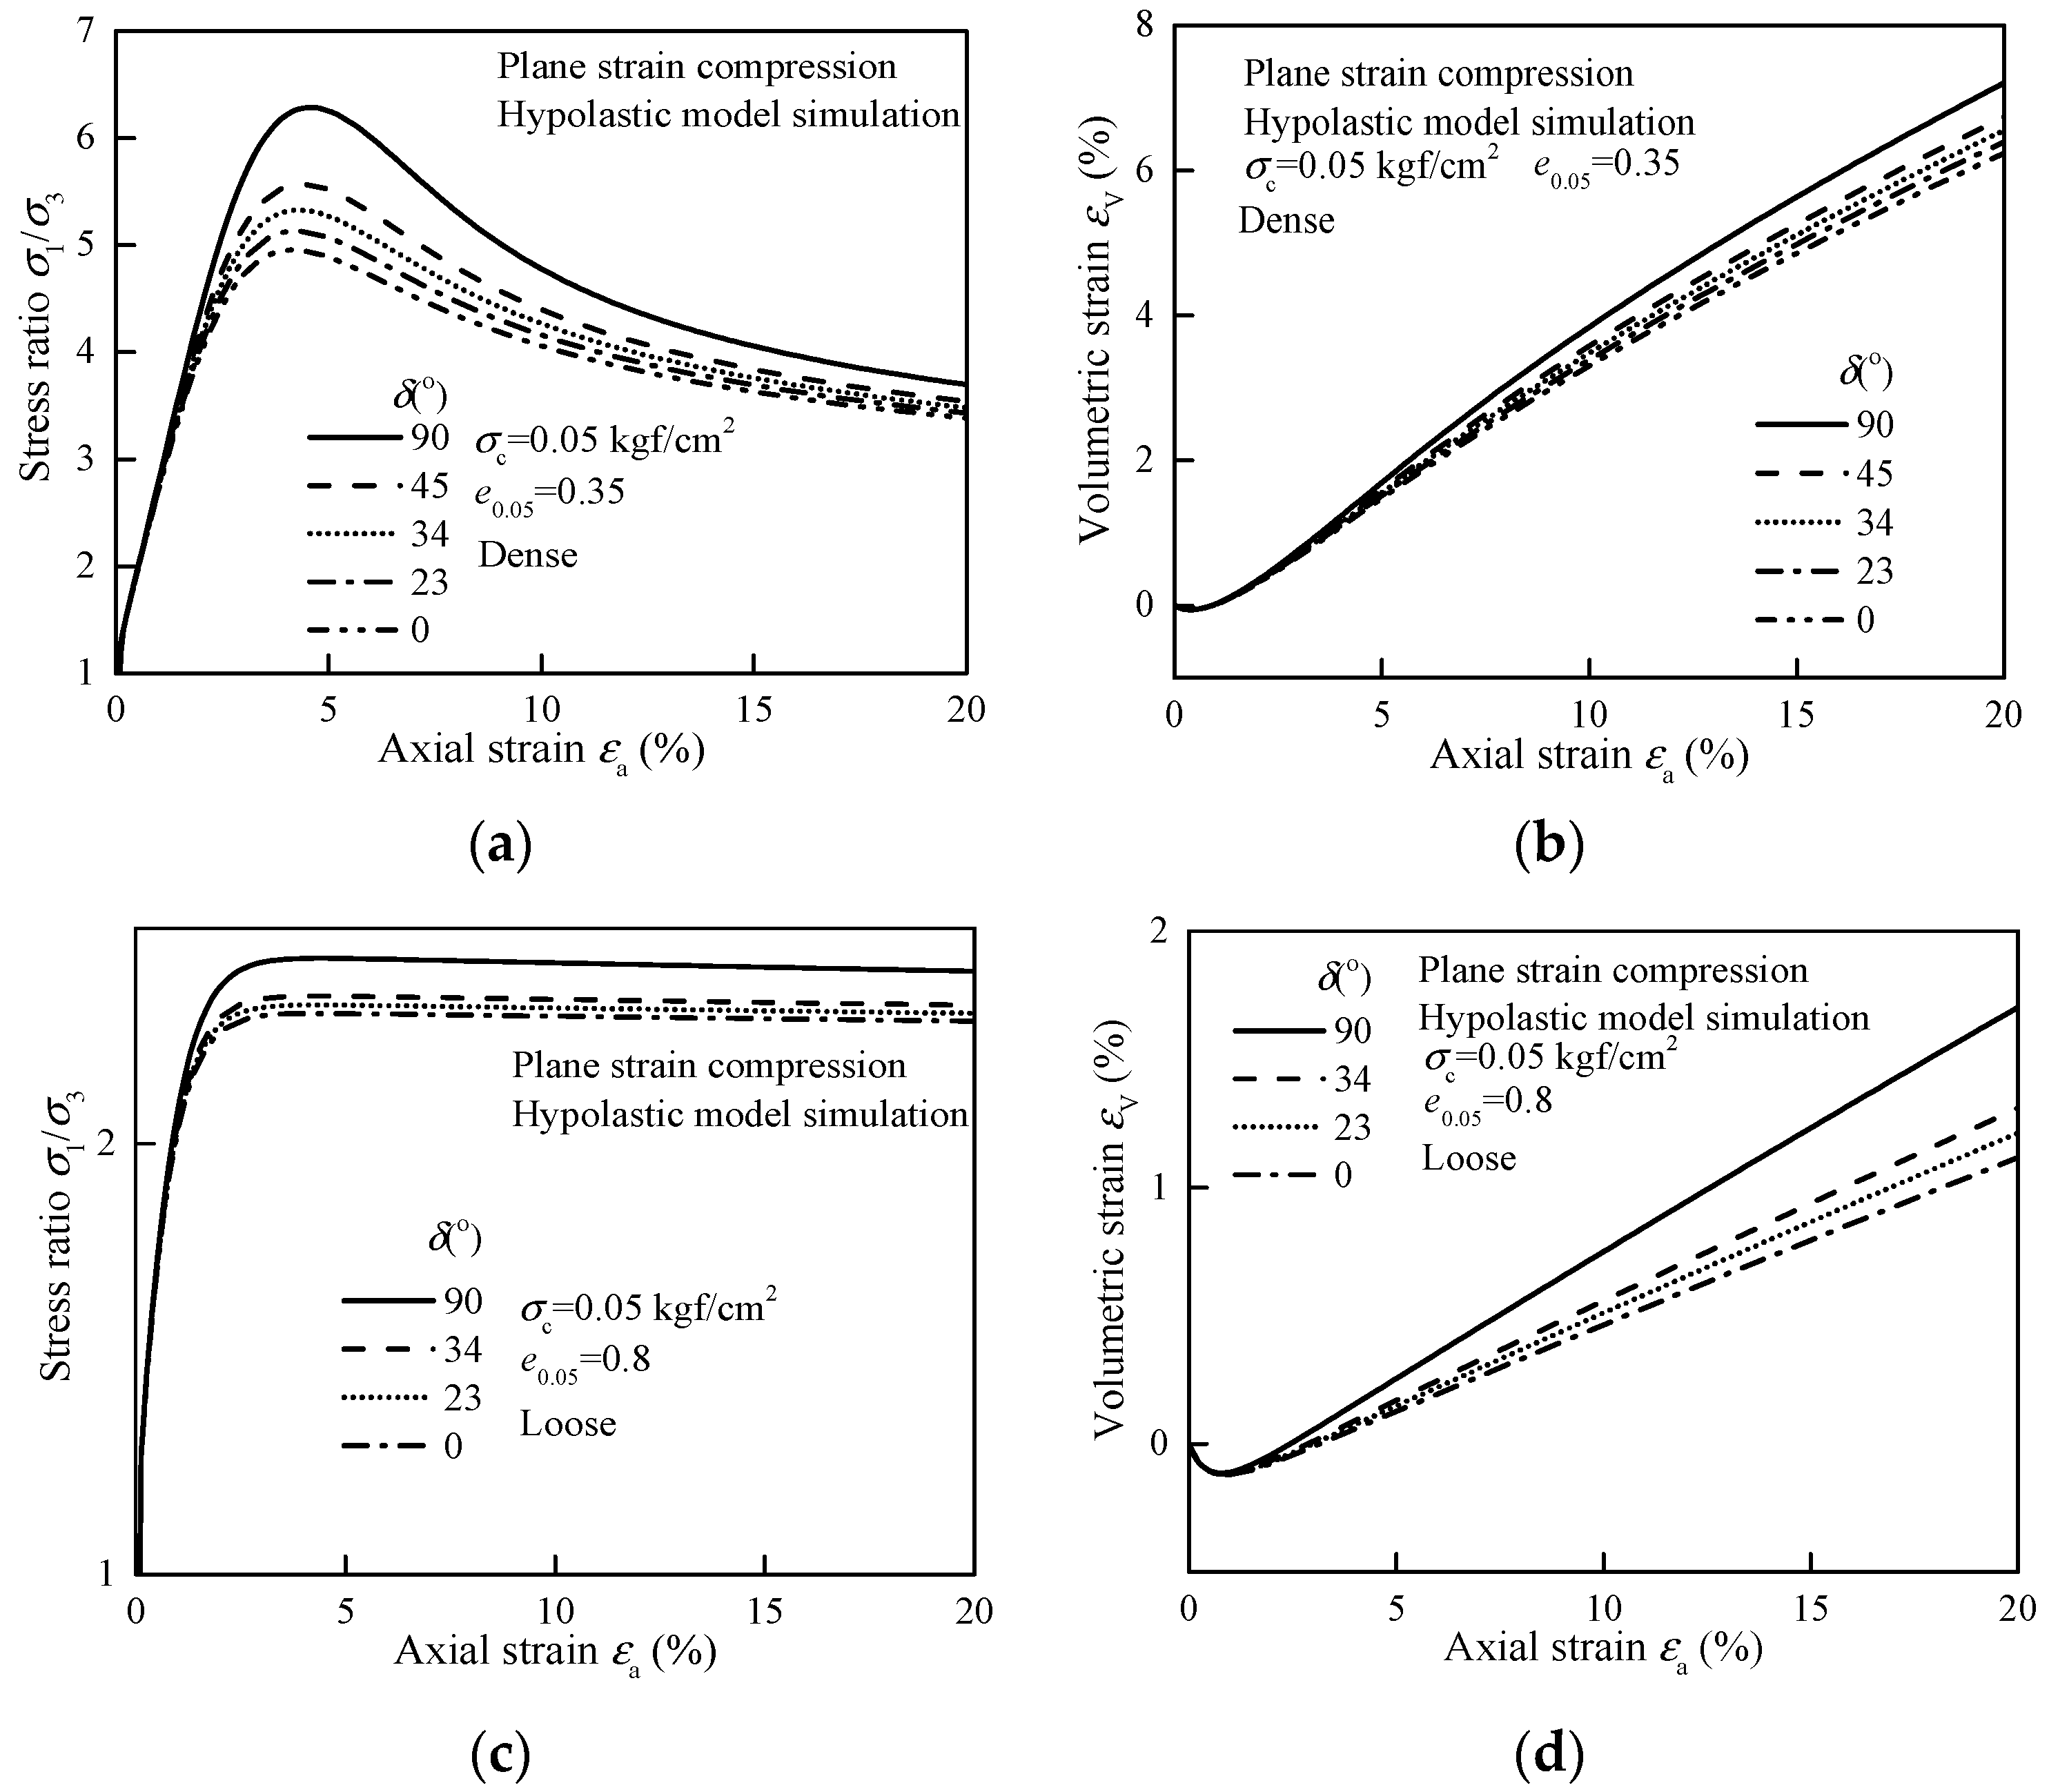
3.3.2. Influence of Principal Stress Rotation on Strength and Deformation

According to the experimental results of Tatsuoka et al. [31], the σ1/σ3-εa curve and the εv-εa curve of the rotation angle of the principal stress axis, i.e., the deposition angle δ from 0° to 90° under confining pressures of σc = 0.05 kgf/cm2 and σc = 4.0 kgf/cm2, are shown in Figure 8 and Figure 9, respectively.
The test results demonstrate that dense and loose sand exhibit prominent strength and deformation anisotropy at different confining pressure levels. When the rotation angle of the major principal stress axis is 90°—that is, perpendicular to the principal fabric direction—the sand sample exhibits the maximum peak shear strength, and then the peak shear strength shows a decreasing trend with the decreasing rotation angle of the major principal stress axis, reaching the minimum value at 23°, and subsequently gradually increases, indicating a trend of first decreasing and then increasing overall, but the strength at a rotation angle of 0° is not as robust compared to 90°. On the other hand, the deformation (εv) of the sand under a confining pressure of σc = 4.0 kgf/cm2 is insensitive to the initial fabric; under larger deformations, which correspond to an axial strain of 7.5~10%, the dεv is extremely small, while the stress ratio at different deposition angles gradually reaches a nearly identical state.
Figure 10a,b depicts the σ1/σ3-εa and εv-εa curves of dense sand simulated by the hypoplastic model at σc = 0.05 kgf/cm2 (5 kPa). Simulation results demonstrate that dense sand undergoes stress softening after its σ1/σ3 reaches its peak value at εa = 4%. The σ1/σ3 value gradually reaches a fixed value, consistent with experimental results, as εa approaches 10% after experiencing a significant amount of deformation. The maximum stress ratio of 6.3 occurs at δ of 90°, followed by a monotonically decreasing trend in the peak stress ratio as δ decreases and reaches its minimum value of 5.0 at δ of 0°. A discrepancy compared to the experimental result is observed with the minimum stress ratio occurring at 23°. As shown in Figure 10b, as δ decreases, εv also decreases, indicating weakened dilatancy.
Loose sand undergoes strain hardening during shearing. As shown in Figure 10c, there is no decrease in the stress ratio when εa reaches about 4%, and the stress ratio remains constant during the subsequent shearing process. Moreover, the value of σ1/σ3 decreases compared with the dense sand, and different rotation angles of the principal stress axis, which are from 0 to 90 degrees, bring about a certain degree of strength anisotropy, although the degree of anisotropy is slightly weaker than that of dense sand. The dilation tendency is similarly weaker in loose sand, as indicated by Figure 10d.
Simulation results of the σ1/σ3-εa and εv-εa under σc of 4.0 kgf/cm2 (400 kPa) are presented in Figure 11. As the confining pressure increases to 400 kPa, both loose and dense sand stress–strain curves reflect a decreasing trend in the overall stress ratio and volumetric strain, while exhibiting similar behavior to that observed at 0.05 kgf/cm2.
In order to explore the differences and connections in simulating anisotropic capabilities between the anisotropic hypoplastic model proposed in this paper and the existing mature models, the present study compares the simulation results with the transversely isotropic hypoplastic model developed by Wu (1998) [47]. Wu’s model considers the effect of variation in the principal stress loading direction (deposition angle), and the constitutive equation is expressed in Equations (9)–(12). Both models consider the impact of principal stress axis rotation. Wu’s model takes the anisotropic parameters as α = 0.9, β = 1.0, and γ = 1.04, with a maximum void ratio of 0.85, a minimum void ratio of 0.3, and confining pressure of σc = 4.0 kgf/cm2 (400 kPa), and A represents the second-order tensor related to the angle between the principal stress and the principal fabric direction. The remaining model parameters are listed in Table 2.
σ o = L ( σ , ε ˙ ) + M ( A , N ) ε ˙
M ( A , N ) = ( α + γ 2 β ) tr ( A · N ) + γ N + ( β γ ) ( A · N + N · A )
The linear term L and the nonlinear term N are defined as follows, and the form of f(e) is shown in Formula (4):
L = C 1 tr ( σ ) ε · + C 2 tr ( ε · ) σ + C 3 tr σ ε · tr σ σ
N = C 4 f ( e ) ( σ + σ * ) ε · .
The simulation results of Wu’s anisotropic model are presented in Figure 12. The strength of the model for dense sand shows a trend of decreasing first and then increasing as δ decreases, and the minimum shear strength corresponds to δ of approximately 34° and the maximum strength to 90°, which is consistent with the experimental results mentioned above. The strength of loose sand shows a trend of decreasing first and then increasing as δ advances from 90° to 0°, but the trend is less significant, and the contraction deformation increases with the changing of δ.
Figure 13 and Figure 14 illustrate the relationship between peak friction angle φ and δ at a confining stress of σc = 1.0 kgf/cm2 (100 kPa). Figure 13 represents the correlation between φ and δ, and Figure 14a illustrates the curves of φ(δ)/φ(δ = 90°)-δ under plane strain and triaxial compression tests. Figure 14b exhibits the curves of φ(δ)/φ(δ = 90°)-δ simulated by the model.
The results in Figure 13a,b depict the simulated response of the model presented in this paper. It can be observed that the variation of peak friction angle φ with the principal stress axis rotation angle δ have similar patterns for both dense sand (e = 0.35) and loose sand (e = 0.8). The maximum value of φ corresponds to a rotation angle of δ = 90°, followed by a decreasing trend as δ decreases. The slope of the φδ curve in the range of 90° to 30° is relatively steep, indicating that the influence of δ on the strength is significant in this range. In contrast, the slope of the φ–δ curve in the range of 30° to 0° is relatively gentle, implying that δ has a minor impact on strength in this range.
The simulated results of the proposed model are compared with Wu’s anisotropic model in Figure 13c,d. Wu’s model shows that φ first decreases and then increases with δ within the range of 90° to 0°, and the strength at 0° is lower than that of 90°. The minimum strength is achieved at a rotation angle of approximately 30°.
Figure 14a illustrates the variation of the internal friction angle φ with δ (from 90° to 0°) showing a tendency to decrease initially and then subsequently increasing. The minimum value of φ is observed at δ = 34°, and it gradually increases as δ approaches 0°. As δ approaches 0°, φ(δ)/φ(δ = 90°) varies from 0.88 to 0.90. The variation of φ under triaxial compression conditions is similar to that under plane strain conditions, but the degree of anisotropy is lower, and the tendency of an initial decrease followed by an increase is less pronounced. Figure 14b presents the simulation results obtained under plane strain conditions using the hypoplastic constitutive model derived in this paper. φ changes considerably within the range of 90° to 30° as δ varies, but the decreasing trend of φ becomes slower when δ exceeds 30°. At a rotation angle of 0°, φ(δ)/φ(δ = 90°) falls within the range of 0.9 to 0.94, which is roughly consistent with experimental values. Figure 15 compares the variation of strength with δ between the proposed model and Wu’s anisotropic model.

4. Discussion

Section 3 simulated the Toyoura sand plane strain test using the proposed model and Wu’s anisotropic model. However, the previous section did not comprehensively discuss the simulation results. This section will further elaborate on the difference in the simulation performance between the two models.
As the principal stress axis rotates, the anisotropic differences in strength and deformation characteristics that arise in the model serve as the criterion for testing the performance difference in simulation among different models. To provide an intuitive comparison of the ability of two models to simulate anisotropic differences, the peak stress difference (and residual stress) was statistically calculated with varying angles for strength characteristic, and the difference in volume strain at the residual state with varying angles was statistically calculated for deformation characteristics. The statistical results were graphically displayed alongside experimental data for ease of comparison, as shown in Figure 16 and Figure 17.
It can be observed that regardless of the peak stress, residual stress, or volumetric strain at the residual state, the anisotropy difference simulated by Wu’s model is always overestimated when the rotation angle changes from 90° to 45°, while the difference in the anisotropy of strength and deformation characteristics simulated by both models is not so obvious when the rotation angle changes from 45° to 0°. The results suggest that the proposed model has a slightly stronger ability to simulate anisotropic differences compared to Wu’s model. Changes in anisotropy with the rotation of the principal stress axis are generally more balanced, without being overestimated in a particular rotation angle range, making it more consistent with the results obtained from indoor experiments.
This paper provides a modeling technique for transforming isotropic models into anisotropic models through simple methods. Furthermore, all parameters carry explicit physical meanings, making it convenient for accurate predictions of subsequent soil mechanics properties. However, it should be noted that this paper only studies the anisotropy differences in strength and deformation characteristics under drained conditions and does not involve undrained experiments. The use of a hypoplastic model for simulating undrained stress paths requires the introduction of concepts such as “intergranular strain tensor” to further improve the simulation performance. Meanwhile, in order to apply the constitutive model in engineering practice, it is necessary to embed the model into finite element software via UMAT subroutine. Then, the model can be utilized for engineering modeling. These are the research directions that we plan to pursue.

5. Conclusions

This paper investigates the geometric relationship between principal stress and fabric and proposes a hypoplastic constitutive model which considers the rotation of the principal stress axis.
(1) To describe the mechanical characteristics of orthogonal anisotropic fabric relative to the rotation of principal stress, a new anisotropic state variable, denoted as A, is defined. As the principal stress axis rotates, the angle between the fabric direction and stress direction also changes. When fabric amplitude parameters a1 and a2 are nonzero, the material becomes anisotropic, and A increases monotonically, within the 0 to 90 degrees range, with the rotation angle. Accordingly, the failure strength changes with the rotation angle, and the effect of a1 on A is greater than that of a2.
(2) A is embedded in the critical state line, and the impact of fabric amplitude parameters and principal stress axis rotation on f(e) is analyzed. The results show that the value of f(e) increases with the increase in a1, a2, and the rotation angle.
(3) An anisotropic hypoplastic constitutive model is proposed, which incorporates the critical state line that takes into account principal stress axis rotation. By using the results of a series of Toyoura sand plane strain tests, the influences of void ratio, confining pressure, and rotation angle on the anisotropic strength and deformation characteristics have been simulated. The proposed model is also compared with the transversely isotropic hypoplastic model by Wu. The proposed model exhibits a balanced performance when simulating the variation of anisotropy in both strength and deformation with respect to rotation angle, without being overestimated within a certain range of rotation angles. The prediction results demonstrated a certain degree of validity and effectiveness of the proposed model.
(4) We have only conducted simulations of drained anisotropic experiments in this paper, and have not yet addressed undrained anisotropic experiments, which will be the main focus of our future research. Additionally, we plan to introduce the constitutive model into finite element software, such as ABAQUS, through the UMAT subroutine to enable numerical modeling and serve the engineering practice field.

Author Contributions

Conceptualization, X.L. and G.F.; methodology, G.F.; software, X.L. and G.F.; validation, Y.H.; formal analysis, G.F. and Y.H.; investigation, G.F. and Y.H.; resources, Y.H.; data curation, Y.H.; writing—original draft preparation, G.F. and Y.H.; writing—review and editing, X.L. and G.F.; visualization, G.F. and Y.H.; supervision, X.L.; project administration, X.L.; funding acquisition, X.L. All authors have read and agreed to the published version of the manuscript.

Funding

This work was financially supported by the Projects for Leading Talents of Science and Technology Innovation of Ningxia (No. KJT2019001), the National Natural Science Foundation of China (No. 12162028), and The innovation team for multi-scale mechanics and its engineering applications of Ningxia Hui Autonomous Region (2021), and these supports are gratefully acknowledged.

Institutional Review Board Statement

Not applicable.

Informed Consent Statement

Not applicable.

Data Availability Statement

The data used to support the findings of this study are available from the corresponding author upon request.

Conflicts of Interest

The authors declare no conflict of interest.

References

  1. Ruan, H.; Wang, Y.K.; Wan, Y.S.; Yu, X.; Zeng, C.N.; Shao, J.G. Three-dimensional numerical modeling of ground deformation during shield tunneling considering principal stress rotation. Int. J. Geomech. 2021, 21, 04021095. [Google Scholar] [CrossRef]
  2. Liu, J.S.; Zhu, K.X.; Shen, Y.; Ren, Y.; Zuo, J.P.; Zhang, X.F. Experimental investigation on the deformation and noncoaxial characteristics of fiber-reinforced aeolian soil under traffic load. Int. J. Geomech. 2022, 22, 04022054. [Google Scholar] [CrossRef]
  3. Wang, Y.K.; Fu, H.S.; Cai, Y.C.; Yu, X.; Zhao, J.C. Seismic subsidence of soft subgrade with considering principal stress rotation. Int. J. Civ. Eng. 2022, 20, 827–837. [Google Scholar] [CrossRef]
  4. Arthur, J.R.F.; Phillips, A.B. Inherent anisotropy in sand. Géotechnique 1972, 22, 128–130. [Google Scholar] [CrossRef]
  5. Oda, M. Initial fabrics and their relations to mechanical properties of granular materials. Soils Found. 1972, 12, 17–36. [Google Scholar] [CrossRef] [Green Version]
  6. Yamada, Y.; Ishihara, K. Anisotropic deformation characteristics of sand under three dimensional stress conditions. Soils Found. 1979, 19, 79–94. [Google Scholar] [CrossRef] [Green Version]
  7. Oda, M. Fabric tensor and its geometrical meaning. Soils Found. 1999, 19, 27–35. [Google Scholar]
  8. Li, X.F.; Huang, M.S.; Qian, J.G. Failure properties of sand considering rotation of principal stress axis with method of macro-meso incorporation. Chin. J. Rock. Mech. Eng. 2010, 29, 1885–1892. [Google Scholar]
  9. Li, X.F.; Huang, M.S.; Kong, L. Failure criterion of anisotropic sand with method of macro-meso incorporation. Rock. Soil. Mech. 2013, 34, 1923–1930. [Google Scholar]
  10. Li, X.F.; Yuan, Q.; Wang, X. A critical state anisotropic model with state-dependent of sand. J. Civ. Environ. Eng. 2015, 37, 70–78. [Google Scholar]
  11. Li, X.F.; Kong, L.; Yuan, Q.; Wang, Y.C. Deformation analysis of anisotropic sand using the method of macro-meso incorporation. J. Tongji Univ. Nat. Sci. Ed. 2016, 44, 173–179. [Google Scholar]
  12. Li, X.F.; He, Y.Q.; Liu, J.F.; He, W.G. Quantitative analysis of amplitude parameters for orthotropic fabric sand. Rock. Soil. Mech. 2017, 38, 3619–3626. [Google Scholar]
  13. Li, X.F.; Li, R.J.; Zhang, J.H.; Wang, Q. Three-dimensional strength characteristic of rockfill. China J. Highw. Transp. 2020, 33, 54–62. [Google Scholar]
  14. Li, X.F.; He, Y.Q.; Meng, F.C. Image analysis of sand void fabric based on stereology principle. J. Tongji Univ. Nat. Sci. Ed. 2017, 45, 323–329. [Google Scholar]
  15. Li, X.F.; Wang, Q.; Liu, J.F.; Wu, W.; Meng, F.C. Quantitative description of microscopic fabric based on sand particle shapes. China J. Highw. Transp. 2016, 29, 29–36+53. [Google Scholar]
  16. Li, X.F.; Du, C.Y.; Wang, X.; Zhang, J.X. Quantitative Determination of High-Order Crack Fabric in Rock Plane. Rock. Mech. Rock. Eng. 2023, in press. [Google Scholar] [CrossRef]
  17. Tobita, Y.; Yanagisawa, E. Contact tensor in constitutive model for granular materials. Stud. Appl. Math. 1988, 20, 263–270. [Google Scholar]
  18. Gao, Z.W.; Zhao, J.D.; Yao, Y.P. A generalized anisotropic failure criterion for geomaterials. Int. J. Soilds Struct. 2010, 47, 3166–3185. [Google Scholar] [CrossRef] [Green Version]
  19. Lade, P.V. Failure criterion for cross-anisotropic soils. J. Geotech. Geoviron. 2008, 134, 117–124. [Google Scholar] [CrossRef]
  20. Guo, P.J. Modified direct shear test for anisotropic strength of sand. J. Geotech. Geoviron. 2008, 134, 1311–1318. [Google Scholar] [CrossRef]
  21. Miura, K.; Miura, S.; Toki, S. Deformation behavior of anisotropic sand under principal stress axes rotation. Soils Found. 1986, 26, 36–52. [Google Scholar] [CrossRef] [Green Version]
  22. Tatsuoka, F.; Nakamura, S.; Huane, C.; Tani, K. Strength anisotropy and shear band direction in plane strain tests of sand. Soils Found. 1990, 30, 35–54. [Google Scholar] [CrossRef] [Green Version]
  23. Yoshimine, M.; Ishihara, K. Flow potential of sand during liquefaction. Soils Found. 1998, 38, 189–198. [Google Scholar] [CrossRef] [PubMed] [Green Version]
  24. Konai, S.; Sengupta, A.; Deb, K. Effect of excavation depths on ground surface settlement for embedded cantilever retaining structure due to seismic loading. Procedia Eng. 2017, 199, 2342–2347. [Google Scholar] [CrossRef]
  25. Qi, C.Q.; Li, R.Q.; Gan, F.F.; Zhang, W.T.; Han, H. Measurement and simulation on consolidation behaviour of soft foundation improved with prefabricated vertical drains. Int. J. Geosynth. Groun. 2020, 6, 23. [Google Scholar] [CrossRef]
  26. Zhang, R.; Zhao, J.; Wang, G.X. Stability analysis of anchored soil slope based on finite element limit equilibrium method. Math. Probl. Eng. 2016, 2016, 7857490. [Google Scholar] [CrossRef]
  27. Oda, M.; Koishikawa, I.; Higuchi, T. Experimental study on anisotropic shear strength of sand by plane strain test. Soils Found. 1978, 18, 25–38. [Google Scholar] [CrossRef] [Green Version]
  28. Finno, R.; Mooney, M.; Harris, W.; Viggiani, G. Shear bands in plane strain compression of loose sand. Géotechnique 1997, 47, 149–165. [Google Scholar] [CrossRef]
  29. Alshibli, K.; Batiste, S.; Sture, S. Strain localization in sand: Plane strain versus triaxial compression. J. Geotech. Geoviron. 2003, 129, 483–494. [Google Scholar] [CrossRef]
  30. Chu, J.; Leong, W.K. Pre-failure strain softening and pre-failure instability of sand: A comparative study. Géotechnique 2001, 51, 311–321. [Google Scholar] [CrossRef]
  31. Tatsuoka, F.; Sakamoto, M.; Kawamura, T.; Fukushima, S. Strength and deformation characteristics of sand in plane strain compression at extremely low pressures. Soils Found. 1986, 26, 65–84. [Google Scholar] [CrossRef] [Green Version]
  32. Kolymbas, D. An outline of hypoplasticity. Arch. Appl. Mech. 1991, 61, 143–151. [Google Scholar] [CrossRef]
  33. Wu, W.; Bauer, E. A simple hypoplastic constitutive model for sand. Int. J. Numer. Anal. Met. 1994, 18, 833–862. [Google Scholar] [CrossRef]
  34. Wu, W.; Kolymbas, D. Numerical testing of the stability criterion for hypoplastic constitutive equations. Mech. Mater. 1990, 9, 245–253. [Google Scholar] [CrossRef]
  35. Wolffersdorff, P.-A.V. A hypoplastic relation for granular materials with a predefined limit state surface. Mech. Cohes-Frict. Mat. 1996, 1, 251–271. [Google Scholar] [CrossRef]
  36. Wu, W.; Lin, J.; Wang, X. A basic hypoplastic constitutive model for sand. Acta Geotech. 2017, 12, 1373–1382. [Google Scholar] [CrossRef] [Green Version]
  37. Fuentes, W.; Triantafyllidis, T.; Lizcano, A. Hypoplastic model for sands with loading surface. Acta Geotech. 2012, 7, 177–192. [Google Scholar] [CrossRef]
  38. David, M. Clay hypoplasticity with explicitly defined asymptotic states. Acta Geotech. 2013, 8, 481–496. [Google Scholar]
  39. Peng, C.; Wu, W.; Yu, H.S.; Wang, C. A sph approach for large deformation analysis with hypoplastic constitutive model. Acta Geotech. 2015, 10, 703–717. [Google Scholar] [CrossRef]
  40. Xu, G.F.; Wu, W.; Qi, J.L. Modeling the viscous behavior of frozen soil with hypoplasticity. Int. J. Numer. Anal. Met. 2016, 40, 2061–2075. [Google Scholar] [CrossRef]
  41. Huang, M.S.; Li, X.F.; Qian, J.G. Strain localization of anisotropic sand. Chin. J. Geotech. Eng. 2012, 34, 1772–1780. [Google Scholar]
  42. Norouzi, N.; Lashkari, A. An anisotropic critical state plasticity model with stress ratio-dependent fabric tensor. Ijst-T Civ. Eng. 2021, 45, 2577–2594. [Google Scholar] [CrossRef]
  43. Hu, N.; Yu, H.S.; Yang, D.S.; Zhuang, P.Z. Constitutive modeling of granular materials using a contact normal-based fabric tensor. Acta Geotech. 2020, 15, 1125–1151. [Google Scholar] [CrossRef] [Green Version]
  44. Wu, W.; Bauer, E.; Kolymbas, D. Hypoplastic constitutive model with critical state for granular materials. Mech. Mater. 1996, 23, 45–69. [Google Scholar] [CrossRef]
  45. Arthur, J.R.F.; Dunstan, T.; Al-Ani, Q.A.J.L.; Assadi, A. Plastic deformation and failure in granular media. Géotechnique 1977, 27, 53–74. [Google Scholar] [CrossRef]
  46. Matsuoka, H.; Sakakibara, K. A constitutive model for sands and clays evaluating principal stress rotation. Soils Found. 1987, 27, 73–88. [Google Scholar] [CrossRef] [Green Version]
  47. Wu, W. Rational approach to anisotropy of sand. Int. J. Numer. Anal. Met. 1998, 22, 921–940. [Google Scholar] [CrossRef]
Figure 1. The influence of rotation angle on the anisotropic state variables.
Applsci 13 06993 g001
Figure 2. The influence of the fabric magnitude parameter on the anisotropic state variables: (a) a1 = 0.1; (b) a1 = 0.5; (c) a2 = 0.1; (d) a2 = 0.5.
Applsci 13 06993 g002
Figure 3. The influence of rotation angle on the anisotropic state variables on f(e).
Applsci 13 06993 g003
Figure 4. The influence of fabric magnitude parameter on the critical state line f(e): (a) a1 = 0.1; (b) a1 = 0.5; (c) a2 = 0.1; (d) a2 = 0.5.
Applsci 13 06993 g004
Figure 5. Schematic diagram of the angle between the direction of principal stress and the bedding plane [31]: (a) major principal stress; (b) stress path when deposition angle is 0° and 90°.
Applsci 13 06993 g005
Figure 6. The stress–strain relationship measured by the test [31] under different confining pressures at δ = 90°.
Applsci 13 06993 g006
Figure 7. The stress–strain relationship simulated by proposed model under different confining pressures at δ = 90°: (a) σ1/σ3-εa; (b) εv-εa.
Applsci 13 06993 g007
Figure 8. The stress–strain relationship measured by the test [31] when confining pressure = 0.05 kgf/cm2; (a) dense sand; (b) loose sand.
Applsci 13 06993 g008
Figure 9. The stress–strain relationship measured by the test [31] when confining pressure = 4.0 kgf/cm2: (a) dense sand; (b) loose sand.
Applsci 13 06993 g009
Figure 10. The σ1/σ3-εa and εv-εa relationship simulated by the proposed model corresponding to (a,b) dense sand and (c,d) loose sand, when σc = 0.05 kgf/cm2.
Applsci 13 06993 g010
Figure 11. The σ1/σ3-εa and εv-εa relationship simulated by the proposed model corresponding to (a,b) dense sand and (c,d) loose sand, when σc = 4.0 kgf/cm2.
Applsci 13 06993 g011aApplsci 13 06993 g011b
Figure 12. The σ1/σ3-εa and εv-εa relationship simulated by Wu’s model corresponding to (a,b) dense sand and (c,d) loose sand, when σc = 4.0 kgf/cm2.
Applsci 13 06993 g012
Figure 13. The relationship between peak friction angle and principal stress rotation angle: (a) e = 0.35; (b) e = 0.8; (c,d) comparison with Wu’s model.
Applsci 13 06993 g013aApplsci 13 06993 g013b
Figure 14. The relationship between φ(δ)/φ(δ = 90°) and principal stress rotation angle: (a) test results [31]; (b) simulation results.
Applsci 13 06993 g014
Figure 15. Comparison with Wu’s model.
Applsci 13 06993 g015
Figure 16. The anisotropic differences in strength characteristics: (a) peak stress; (b) residual stress.
Applsci 13 06993 g016
Figure 17. The anisotropic differences in deformation characteristics.
Applsci 13 06993 g017
Table 1. Test scheme for plane strain.
Sand SampleConfining Pressure (kgf/cm2)Void Ratio eDeposition Angle (°)
Toyoura sand0.05 90
0.1e ≈ 0.745
0.5 34
1.0e ≈ 0.823
4.0 0
Table 2. Hypoplastic constitutive model parameters of plane strain test.
E(Mpa)/σcνiφ(°)ψ(°)
4000.2450
C1C2C3C4
−111.11−347.22−438.11−220.63
Disclaimer/Publisher’s Note: The statements, opinions and data contained in all publications are solely those of the individual author(s) and contributor(s) and not of MDPI and/or the editor(s). MDPI and/or the editor(s) disclaim responsibility for any injury to people or property resulting from any ideas, methods, instructions or products referred to in the content.

