Article

Prediction of Undrained Bearing Capacity of Skirted Foundation in Spatially Variable Soils Based on Convolutional Neural Network

1
Shanghai Investigation, Design & Research Institute Co., Ltd., Shanghai 200434, China
2
Key Laboratory of Ministry of Education for Geomechanics and Embankment Engineering, College of Civil and Transportation Engineering, Hohai University, Nanjing 210098, China
*
Author to whom correspondence should be addressed.
Appl. Sci. 2023, 13(11), 6624; https://doi.org/10.3390/app13116624
Submission received: 20 April 2023 / Revised: 18 May 2023 / Accepted: 26 May 2023 / Published: 30 May 2023
(This article belongs to the Special Issue The Application of Machine Learning in Geotechnical Engineering)

Abstract

:
Skirted foundations are widely used in offshore and subsea engineering. Previous studies have shown that soil undrained shear strength variability has a notable impact on probabilistic analyses of skirted foundation bearing capacity. This study proposes an efficient machine-learning method to predict the uniaxial bearing capacity factors of skirted foundations under pure horizontal and moment loads, without relying on traditional time-consuming random finite element methods. A two-dimensional convolutional neural network is adopted to capture the potential correlation between soil random fields and bearing capacity factors. The proposed CNN-based model exhibits satisfactory prediction performance with regard to coefficients of variation and scale of fluctuations in two directions. Specifically, coefficient of determination (R2) values exceed 0.97, while root mean square error (RMSE) values remain below 0.13 for the surrogate model. In addition, more than 96% of the predictions are associated with a relative error of 5% or less, providing evidence of the proposed 2D-CNN model’s satisfactory prediction performance.

1. Introduction

Skirted foundations are widely used in offshore and subsea engineering applications such as the oil and gas industry, wind turbines, and floating structures. Owing to the complex seabed environment, these foundations experience a combination of horizontal (H), vertical (V), and moment (M) loading. Accurate estimation of the foundation’s bearing capacity is crucial and has drawn increased attention from geotechnical engineers [1,2,3,4]. Previous research has assumed the seabed soil to be homogeneous, ignoring the reality of soil characteristics’ spatial variability due to complex deposition history [5]. Thus, soil property uncertainty needs to be considered when analyzing foundation bearing capacity.
Soil spatial variability is simulated by the random field theory [6,7,8,9]. The random finite element method (RFEM) and random finite difference method (RFDM) have been widely used in the probabilistic analysis of geotechnical engineering, considering soil spatial variability. These methods have been applied in slope stability [10,11,12,13], foundation bearing capacity [14,15,16,17,18], tunnel stability and deformation [19,20,21], seismic response of structures [22,23,24], etc. The non-stationary characteristic exists in seabed soil parameters, as shown by Hossain and Randolph [25]. Consequently, the non-stationary random field of soil undrained shear strength has been simulated to investigate the effect of soil spatial variability on the bearing capacity of offshore foundations. For example, Charlton and Rouainia [26] assessed the ultimate capacity of skirted foundation in spatially variable undrained clay under uniaxial and combined loads. Selmi et al. [27] investigated the influence of soil spatial variability and embedment ratio on the capacity of skirted foundations under combined horizontal and moment loading. Ye et al. [16] presented the probabilistic failure envelope of skirted foundations with surrounding soil undrained shear strength linearly increasing with depth. However, these studies are based on Monte Carlo simulation (MCS), which is time-consuming to obtain stochastic results. Usually, more than one hour was required for one MCS, while 500 simulations were necessary for a stochastic analysis [26]. To resolve this problem, there is a need to develop an effective method for probabilistic analysis of foundation bearing capacity.
In recent years, machine learning has attracted significant attention for its unparalleled ability to model non-linear and exceedingly complex functions. Its efficacy in tackling geotechnical issues has been extensively studied and discussed [28,29,30,31,32]. For example, Moayedi and Hayati [33] employed machine-learning techniques to predict the settlement of the ground near sloping terrain due to strip loading. Tran et al. [34] proposed two hybrid machine-learning models that leveraged five input factors to predict the undrained shear strength of Finnish sensitive clays. Wang et al. [35] developed a convolutional neural-network-based global response surface approach to support reliability-based design of a strip footing in soils that exhibit spatial variability. Furthermore, Van et al. [36] used multivariate adaptive regression splines to predict the bearing capacity of conical foundations in clays that are heterogenous and anisotropic. However, the accurate prediction of the bearing capacity of skirted foundations in spatially variable soils has not been studied using machine-learning methods, to date.
This paper proposes an efficient machine-learning-based method to predict the bearing capacity of skirted foundation subjected to pure horizontal and moment loads. The proposed method employs a two-dimensional convolutional neural network (2D-CNN) to establish an efficient surrogate model, which replaces the time-consuming MCS. The input of the surrogate model is the non-stationary random field of soil undrained shear strength, while the output is the bearing capacity factor of the skirted foundation calculated by RFEM. The prediction performance of the proposed model is evaluated by comparing the prediction results with those generated from RFEM.

2. Random Finite Element Method

The bearing capacity of shirted foundation under uniaxial loading is analyzed by utilizing the random finite element method (RFEM), considering the spatial variability of seabed soil. The datasets for the machine-learning model in Section 3 are based on the results of the numerical simulation.

2.1. Simulation of Non-Stationary Soil Random Field

The random field theory extensively delineates the spatial variability of seabed soils [37,38]. Undrained shear strength ( S u ) constitutes an essential property of seabed soil, significantly influencing the bearing capacity of offshore foundations in undrained conditions [39,40]. This study examines the spatially variable soil undrained shear strength to investigate the bearing capacity of skirted foundations. Several effective methods for simulating soil property random fields include the spectral representation method (SRM) [16], local average subdivision (LAS) method [41], and Karhunen–Loeve (KL) expansion technique [42,43]. The SRM, characterized by its high efficiency and accuracy in previous research [44], is adopted to simulate the random field of S u .
Numerous studies illustrate that the mean value of S u increases linearly with depth for the seabed soil [45,46,47], which can be expressed by Equation (1):
μ S u = μ S u , 0 + k z
where z is the depth of the seabed soil; μ S u is the mean value of S u at the depth z ; μ S u , 0 is the mean undrained shear strength at the mudline; and k is the increasing gradient of strength below the mudline. According to Ye et al. [16], μ S u , 0 is set to 10 kPa and k remains fixed at 1 kPa/m, which indicates that the mean undrained shear strength of the soil in the numerical model increases from 10 to 60 kPa as depth ranges from 0 to 50 m.
Determining the scale of fluctuations (SOFs) in horizontal and vertical directions is essential for evaluating the correlation degree between any two points in the random field. When the SOF approaches zero, data from any two points in the soil domain become independent. Phoon and Kulhawy [48] report mean values of horizontal and vertical SOFs (i.e., δ h and δ v ) for submarine soil as 50.7 m and 3.8 m, respectively. The coefficient of variation (COV), which governs the dispersion degree of S u in the random field around its mean value, constitutes another important parameter. Generally, Phoon and Kulhawy [48] suggests that the COV of submarine soil ranges between 0 and 0.5. In addition, a lognormal distribution is employed to simulate the variability of S u to preclude negative values in the random field. The two-dimensional exponential autocorrelation function [49] describes the spatial correlation of S u , as expressed in Equation (2).
ρ ( τ h , τ v ) = exp 2 τ h δ h 2 τ v δ v
where ρ is the correlation coefficient; τ h and τ v are the distances between any two points in horizontal and vertical directions, respectively.
This paper aims to investigate the predictive performance of the proposed machine-learning model regarding the bearing capacity of the skirted foundations in spatially variable soil. The variation of COV, δ h , and δ v are considered separately to provide a comprehensive depiction of the surrogate model’s prediction performance. Table 1 lists the specific parameters involved in simulating the random field, and the detailed procedures for simulating the non-stationary random field of S u are summarized by Ye et al. [16]. A typical series of random field realization is presented in Figure 1.

2.2. Numerical Model

The finite element method (FEM) was employed to evaluate the bearing capacity of the skirted foundations in homogeneous soil. In accordance with the previous research by Ye et al. [16], a skirted foundation with a diameter (D) of 10 m and length (L) of 10 m was modeled in the commercial finite element software ABAQUS (version 6.14) as a perfectly rigid body. The skirt thickness (t) was set to 0.03 m. Horizontal, vertical, and moment loading (V, H, and M) were applied to the reference point (RP) to determine the corresponding bearing capacity, with RP located at the centre of the skirted foundation lid. Figure 2 presents the details of the skirted foundation and the positive loading and displacement.
In reality, skirted foundation has a circular or square section, but it was considered that plan geometry is secondary to soil strength profile in terms of the effect on bearing capacity by Gourvenec and Barnett [2]. Therefore, a two-dimensional (2D) plane strain condition was assumed in this study to allow comparison with existing analytical solution [2], as well as improving calculation efficiency with satisfactory accuracy [16]. The soil domain was modeled as a rectangular region with dimensions 7D in length and 5D in width (70 × 50 m) to minimize the effect of boundaries. Lateral boundaries were constrained in the horizontal direction, while the bottom boundary was fixed in both horizontal and vertical directions. No constraint was applied in the top boundary. The soil domain was meshed into a square grid with dimensions of 1 × 1 m; however, in the 3D × 2D area surrounding the skirted foundation, the mesh size was adjusted to 0.5 × 0.5 m to obtain more precise bearing capacity results. A total of 5300 four-node bilinear reduced integration quadrilateral (CPE4R) elements were used to simulate the seabed soil domain in the model, as shown in Figure 3.
The soil was defined as an elastoplastic material that obeys the Tresca yield criterion, in which the maximum shear stress was determined by the undrained shear strength [27]. The soil undrained Young’s modulus ( E u ) was assumed to be linearly correlated to S u with the relationship expressed in Equation (3):
E u = K u × S u
where K u is the coefficient. In fact, the ultimate bearing capacity of foundation was confirmed to be barely influenced when K u was equal to 500 [50]. In addition, the Poisson’s ratio was fixed at 0.49 to simulate the undrained condition. As only the ultimate bearing capacities were of interest, the skirted foundation was simulated as a rigid body without any deformation. The skirted foundation and surrounding soil were coupled by the “tie” constraint to avoid the generation of extra interface element.
The bearing capacity factors were introduced in this paper to evaluate the uniaxial bearing capacity normalized by the foundation diameter and the mean undrained shear strength at mudline, as expressed in Equation (4):
N c H = H 0 / D μ S u , 0 N c V = V 0 / D μ S u , 0 N c M = M 0 / D 2 μ S u , 0
where N c H , N c V , and N c M denote the bearing capacity factors under pure horizontal, vertical, and moment loading, respectively; H 0 , V 0 , and M 0 denote the ultimate uniaxial bearing capacity. In the deterministic case, without consideration of soil spatial variability, the bearing capacity factors marked by the subscript det are calculated to make comparison with previous research. The N c H , det and N c M , det calculated by the finite element method in this study are 4.20 and 2.54, which are consistent with the results of upper bound analysis by Bransby and Yun [1] (i.e., N c H = 4.00 and N c M = 2.50). The relative errors are no more than 5%, indicating acceptable accuracy of the proposed numerical model.

2.3. Random Finite Element Method

The random finite element method (RFEM) was employed to perform the stochastic analysis of the skirted foundation’s bearing capacity, considering spatially variable soil undrained shear strength. The primary concept of RFEM involves incorporating the random field data generated in Section 2.1 into the finite element model simulated in Section 2.2. The general steps are summarized as follows.
(1)
A deterministic finite element model, coupling the skirted foundation and soil, is established in ABAQUS software, with the soil elements shown in Figure 1 numbered from 1 to 5300;
(2)
The non-stationary random field of S u is generated using the SRM proposed in Section 2.1. Each value in the random field data is mapped to an element in the finite element model based on its unique position number. Subsequently, each realization of the soil random field is assigned to the deterministic model, replacing the soil undrained shear strength to generate a new calculation document for the subsequent finite element analysis. This process was executed using Python coding;
(3)
The number of MCS (n) is determined, and the finite element calculation in Section 2.2 is repeated after generating the random field data. The stochastic analysis comprises n finite element calculations.
Selecting an appropriate MCS number is crucial for obtaining stable and accurate results. The evolution of the mean value and standard deviation of N c H against the required MCS numbers in case Ani-3 are shown in Figure 4. The converging trend suggests that n= 600 is sufficient to provide stable results for the stochastic analysis.

3. Architecture of the Proposed Two-Dimensional Convolutional Neural Network (2D-CNN) Model

The architecture of the proposed 2D-CNN model for predicting the bearing capacity of skirted foundation consists of the input layer, the convolutional layer, the pooling layer, the fully connected layer and the output layer. The input and output of the proposed model are the random field data and bearing capacity factor, respectively. The detailed architecture of the proposed 2D-CNN model is given in Figure 5. The training process runs on the PyTorch platform, which is an open-source deep-learning framework based on Python. The experiments are performed on a standard PC with 8 Intel Core i7-11700 CPUs and two NVIDIA RTX 3060 GPU cards.

3.1. Input and Output Layer

The proposed 2D-CNN model aims to predict the bearing capacity of the skirted foundation in spatially variable soil. As shown in Figure 5, the input is a random field data matrix with size of 70 × 50 mapping to the soil domain in the numerical model. The bearing capacity factor calculated by FEM is the output of the proposed model. A random field matrix and corresponding bearing capacity factor constitute a sample in the dataset, which contains the training, validation, and prediction datasets that are separated from the whole dataset in the ratio of 70%, 10% and 20%, respectively. Taken the case Ani-1 for example, there are 420, 60, and 120 samples in the training, validation, and prediction datasets for the training process of the proposed 2D-CNN model.

3.2. Convolutional Layer

The convolutional layer is used to extract the key information from the input data. There are several hyperparameters for a convolutional layer that remain constant in the training process, such as the kernel size, stride, padding, and filters. These parameters were determined by trial and error in this study. The kernel size represents the range of each convolution operation, while the stride controls the crossing length in the horizontal and vertical directions between the two adjacent convolution operations. The zero-padding strategy is adopted to make sure the output has the same size as the input. The filter controls the output channels during the convolutional operation. Generally, a nonlinear activation function is utilized after the convolutional operation, which is beneficial to introduce nonlinearities into the surrogate model. In this study, the rectified linear unit (ReLU) function is employed, as expressed in Equation (5). There are four convolutional layers in the proposed 2D-CNN model and the detailed hyperparameters of these layers are shown in Figure 5.
f ( x ) = 0   ,   x 0 x   ,   x > 0

3.3. Pooling Layer

The pooling layer plays significant role in reducing the size of input features. There are two typical patterns of pooling layer. Specifically, the max pooling aims to hold the maximum value of each pooling zone, while the average pooling uses the mean value to present the pooling zone. The average pooling is adopted in this study for a better prediction performance. The pooling size and stride are equal to 2 × 2 to realize a half decreasing in both the horizontal and vertical size of the input data.

3.4. Fully Connected Layer

The fully connected (FC) layer is the final part of a regular CNN model. It works by establishing full connection between the input feature and the output layer. Mathematically, the input feature is transformed to the output layer through a weight matrix and a bias matrix, as illustrated in Equation (6):
y d = f ( W d x d + b d )
where x d and y d denote the input and output vector of the FC layer, respectively; W d and b d denote the weight and bias matrix, respectively; f ( · ) denotes the ReLU activation function expressed in Equation (5). Furthermore, the last convolutional layer is flattened to a one-dimensional array before the FC layer.
In the training process, the early stopping method with limited epochs of 2000 is adopted to avoid overfitting of the proposed 2D-CNN model. The adaptive momentum (Adam) algorithm is selected as the optimizer and the learning ratio is set to 8 × 10⁻⁵ to reach a reasonable prediction performance. The above-mentioned hyperparameters of the proposed 2D-CNN model are determined by trial and error. Several networks with different parameters of convolutional and pooling layers are examined and the effect on R2 and RMSE values in Case Ani-5 are summarized in Table 2, where NCL and KCL denote the number and kernel size of convolutional layer, respectively. It is observed from Table 2 that the architecture of three convolutional layers with kernel size at 2 × 2 and average pooling, as shown in Figure 5, has the maximum R2 and minimum RMSE value in predicting the uniaxial horizontal and moment bearing capacity factors.

4. Results and Discussion

On account of the influence of the number of training samples on the prediction performance of the proposed model, the dataset in case Ani-3 is selected to obtain 16 CNN models with difference size of training samples. The prediction datasets are identical for the 16 models, with 120 samples. Figure 6 displays the variation of R2 and RMSE values for N c H when the number of training samples increases from zero to 420. It is evident that the R2 value increases and the RMSE value decreases quickly with the increasing number of training samples. These changing trends gradually flatten out as the number of training samples exceeds 210. The R2 and RMSE values slightly fluctuate when the training samples arrive at 350, demonstrating that 420 training samples are sufficient to provide stable prediction performance of the surrogate model.

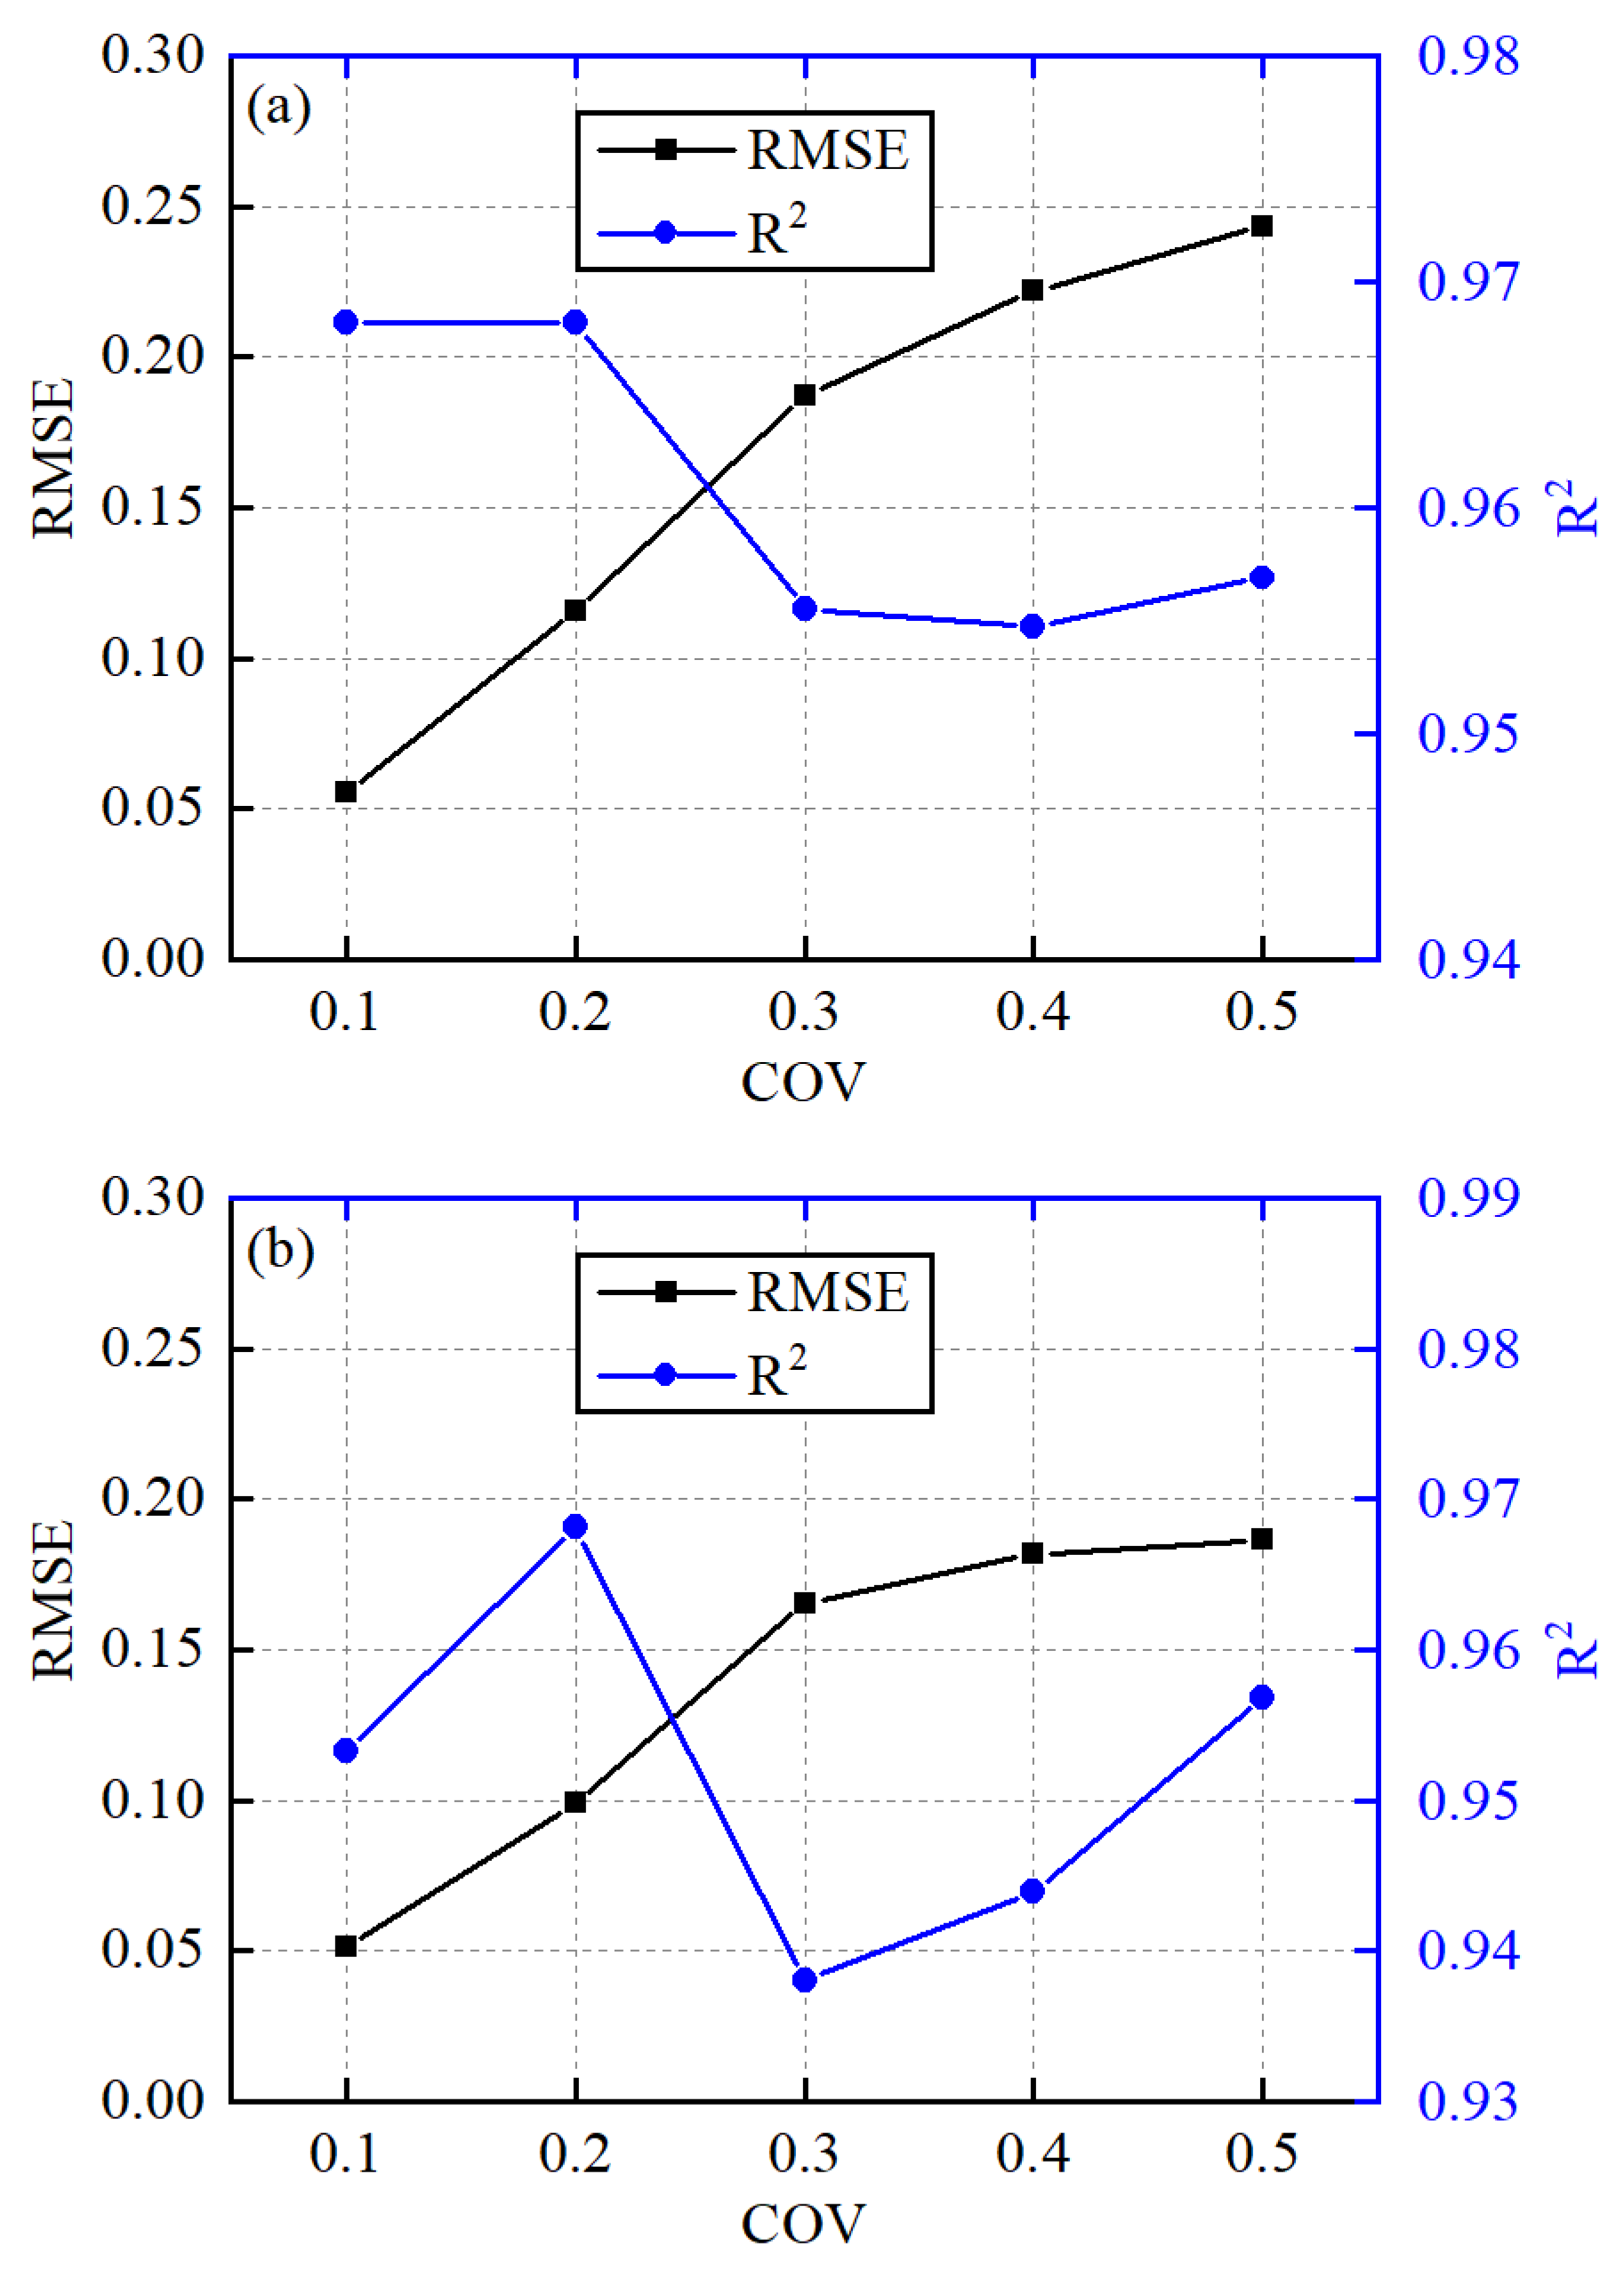
4.1. Influence of Coefficient of Variation (COV) in the Random Field

Figure 7 shows the development of the mean and standard deviation of the uniaxial horizontal and moment bearing capacity factors with the variation of COV in RFEM. It is found that the standard deviations of N c H and N c M increase with COV, for the fluctuation of the undrained shear strength is larger under conditions with higher COV, as illustrated in Figure 1a,b.
In order to investigate the influence of COV of the soil undrained shear strength random field on the prediction performance of the proposed 2D-CNN model, the datasets consist of the random field data and corresponding bearing capacity factors from case Ani-1 to Ani-are trained separately with 480 samples and tested by the remaining 120 samples. The five-fold cross-validation method [51] is adopted to obtain more persuasive results, in which the total dataset is randomly divided into five subsets and each subset is taken as the prediction dataset while the remaining four subsets are taken as the training dataset to train five CNN models. In other words, the presented prediction performance is the average result of the five models. Figure 8 shows the root mean square error (RMSE) and coefficient of determination (R2) of the prediction dataset in the five cases. Specifically, the RMSE value reflects the degree to which the predicted result deviates from the actual value, where a smaller RMSE value represents better prediction accuracy. The R2 value, varying between zero and one, reflects the global performance of the surrogate model. A larger R2 value indicates better prediction performance of the proposed model. It is visible in Figure 8 that the value of RMSE gradually increases when the COV extends from 0.1 to 0.5. Meanwhile, the value of R2 slightly fluctuates with the increase in COV, which indicates that the performance of the proposed surrogate model is affected by the degree of variation of the random field when one considers the soil spatial variability in predicting the uniaxial bearing capacity of skirted foundation. The 2D-CNN model essentially captures the potential characteristics between the input and output vectors. The output value in the dataset contains a wider distribution range in the case of higher COV, resulting in a decrease in the average density of training data when the total number of samples remains unchanged. This is reflected in the surrogate model, which shows relatively poor prediction performance under higher COV.
However, there are five surrogate models for the prediction of bearing capacity factors when COV varies from 0.1 to 0.5. These models are predetermined with the same structure (as shown in Figure 5), which contains the difference in the model parameters trained by different datasets. It is complicated to generate several datasets and train different surrogate models in dealing with the prediction of bearing capacity factors, considering the variation of COV in the random field. It is necessary to train a unified surrogate model in the stochastic analysis under different COV of random field without notably reducing the accuracy of prediction. Therefore, the samples from case Ani-1 to Ani-5 are composed to generate a mixed dataset to train a 2D-CNN model in predicting the bearing capacity factors of the skirted foundation. Specifically, there are 2100, 300 and 600 samples in the training, validation, and prediction datasets for the training process of the unified 2D-CNN model.
Figure 9 presents the uniaxial bearing capacity factors predicted by the unified 2D-CNN model and calculated by the RFEM. It can be seen from Figure 9a,b that both the R2 values in the prediction datasets of the uniaxial horizontal and moment bearing capacity factor are larger than 0.98, while the RMSE values are smaller than 0.12, indicating that N c H and N c M predicted by the surrogate 2D-CNN model are highly consistent with the results calculated by the RFEM. The unified model performs better than the model trained by the dataset with single value of COV, especially when COV is larger than 0.1, as shown in Figure 8. This is mainly caused by the average effect that the samples with small COV in the dataset are beneficial to the prediction of the unified model. The cumulative density function (CDF) of the predicted and calculated bearing capacity factors under uniaxial horizontal and moment loading are shown in Figure 9c,d, respectively. The satisfactory agreement between the CNN-derived and RFEM-derived CDFs of N c H and N c M demonstrates that the global distribution of the uniaxial bearing capacity factor of the skirted foundation under the soil random field with different COV is well captured by the proposed unified 2D-CNN model. In addition, the mean, minimum and maximum values of the results obtained by the two methods are compared for the quantitative analysis of the prediction performance. As to the uniaxial horizontal bearing capacity factor, the relative errors of the mean, minimum, and maximum values between the predicted and calculated results are 0.15%, 3.16%, and 0.49%, respectively. Meanwhile, the three relative errors of the uniaxial moment bearing capacity factors are 0.23%, 0.42%, and 0.13%, respectively. The relative errors of the three evaluating indicators are all restricted within 4.00%, indicating the distribution of the uniaxial bearing capacity factors calculated by the time-consuming RFEM can be replaced by the proposed 2D-CNN model.
The probability density functions (PDFs) of the relative errors between the CNN-predicted and RFEM-calculated bearing capacity factors are given in Figure 10. The relative errors of the 1200 predicted uniaxial horizonal and moment bearing capacity factors are less than 8%. In addition, the confidence intervals (CIs) of the relative errors are 97.7% and 96.3%, with the margin of error at 5%, for the predicted bearing capacity factors under pure horizontal and moment loading, respectively. The unified 2D-CNN model is accurate enough to predict the uniaxial horizontal and moment bearing capacity factors for the probabilistic analysis of the skirted foundation located in spatially variable soil with different COV.

4.2. Influence of Horizontal Scale of Fluctuation ( δ h ) in the Random Field

The development of the mean and standard deviation of N c H and N c M with the variation of δ h is shown in Figure 11. It is indicated that the mean value and standard deviation of N c H and N c M fluctuated slightly with the increase of δ h from 30 to 60 m (e.g., case Ani-6, 7, 3, and 8 given in Table 1). The samples of the four cases are composed to a mixed dataset in training a 2D-CNN model for the prediction of uniaxial bearing capacity factors of the skirted foundation considering the variation of δ h . There are 1680, 240 and 480 samples for the training, validation, and prediction datasets, respectively.
Figure 12 displays the comparison of N c H and N c M predicted by the trained 2D-CNN model and calculated by RFEM. As shown in Figure 12a,b, the predicted and calculated uniaxial horizontal and moment bearing capacity factors are located around the solid line, which is predefined as the predicted value equal to the actual value, with the minimum R2 value at 0.9802 and maximum RMSE value at 0.1204, which indicates a satisfactory prediction performance of the surrogate model. It is observed from Figure 12c that the distribution of the predicted uniaxial horizontal bearing capacity factors is highly consistent with the RFEM-calculated results, in which the relative errors of the mean, minimum, and maximum values are 0.15%, 0.22%, and 0.69%, respectively. Similarly, the relative errors of the three evaluating values are 0.23%, 0.42%, and 0.13% for the uniaxial moment bearing capacity factors predicted by the 2D-CNN model, as presented in Figure 12d, which indicates that the typical distribution of N c H and N c M are well predicted by the surrogate model on account of the variation of δ h .
In order to visualize the accuracy of the CNN-predicted uniaxial bearing capacity factors, the probability distribution of the relative errors between the predicted and calculated results is illustrated in Figure 13. It is obviously that the relative errors are all restricted in 8%, with a CI of 99.2% and 97.3% for the margin of 5% error in the prediction of uniaxial horizontal and moment bearing capacity factors, respectively. It indicates that the architecture of the 2D-CNN model proposed in Figure 5 has the potential to predict the uniaxial bearing capacity factors of the skirted foundation within an acceptable error range when δ h of the soil random field extends from 30 to 60 m.

4.3. Influence of Vertical Scale of Fluctuation ( δ v ) in the Random Field

On account of the increasing of δ v from 2 to 8 m (e.g., case Ani-9, 10, 3, and 11 shown in Table 1), a mixed dataset consisting of the total samples in the four cases is generated to train a 2D-CNN model, which has the same architecture as shown in Figure 5, to predict the uniaxial bearing capacity factors of the skirted foundation considering the variation of δ v in the soil random field. A total of 1680 and 240 samples are selected for the training and validation datasets to accomplish the training process of the model, while the remaining 480 samples are used to estimate the prediction performance of the surrogate model.
Figure 14 compares the uniaxial bearing capacity factors predicted by the 2D-CNN model and calculated by RFEM. It can be seen from Figure 14a,b that the CNN-predicted N c H and N c M are close to the calculated results, in which the R2 value is more than 0.97 and the RMSE value is less than 0.11. According to the cumulative distribution of N c H and N c M shown in Figure 14c,d, it is evident that the proposed 2D-CNN model is feasible in analyzing the uniaxial bearing capacity factors of the skirted foundation in spatially variable soil with different δ v , for the maximum relative error of the three evaluating indicators is 1.67%.
Furthermore, the probability distribution of the relative errors between the predicted and calculated uniaxial bearing capacity factors is given in Figure 15. With the variation of δ v from 2 to 8 m, the proposed 2D-CNN model is capable of providing satisfactory prediction performance for the uniaxial bearing capacity factors by restricting the maximum relative error within 9%. More specifically, the Cis of the relative error located within 5% are 99.6% and 97.9% for the prediction of N c H and N c M , respectively. The effect of δ v in the soil random field on the prediction performance of the uniaxial bearing capacity factors is similar to the influence of δ h , as shown in Figure 13.
The time required for 600 samples in the statistical analysis of tradition RFDM is about 327 min on a standard PC as described in Section 3, while the trained 2D-CNN model takes just 3 s, resulting a 6540-times improvement in calculation efficiency. Only the ultimate bearing capacity of the skirted foundation had been investigated in this study, while more than 600 simulations are essential for further reliability analysis, such as the failure mechanics and failure envelopes of foundation. At this point the trained 2D-CNN model is highly efficient to acquire numerous outputs in several seconds once the random filed data are generated, instead of time-consuming finite element calculations.

5. Conclusions

In summary, this study combines the random field theory and convolutional neural network to develop an effective machine-learning-based model for predicting the uniaxial bearing capacity factors of the skirted foundation in spatial variable soil under pure horizontal and moment loading. The spectral representation method is adopted to simulate the non-stationary random field of soil undrained shear strength with various coefficients of variation and scale of fluctuations, which is acted as the input of the proposed 2D-CNN model. Meanwhile, the uniaxial horizontal and moment bearing capacity factors are defined as the output of the surrogate model. The predicted values are compared with the results calculated by the random finite element method to present the prediction performance of the surrogate model. Several conclusions are summarized as follows:
(1)
The proposed 2D-CNN model can replace the time-consuming RFEM in predicting the uniaxial bearing capacity factors of the skirted foundation in spatially variable soil with reasonable accuracy;
(2)
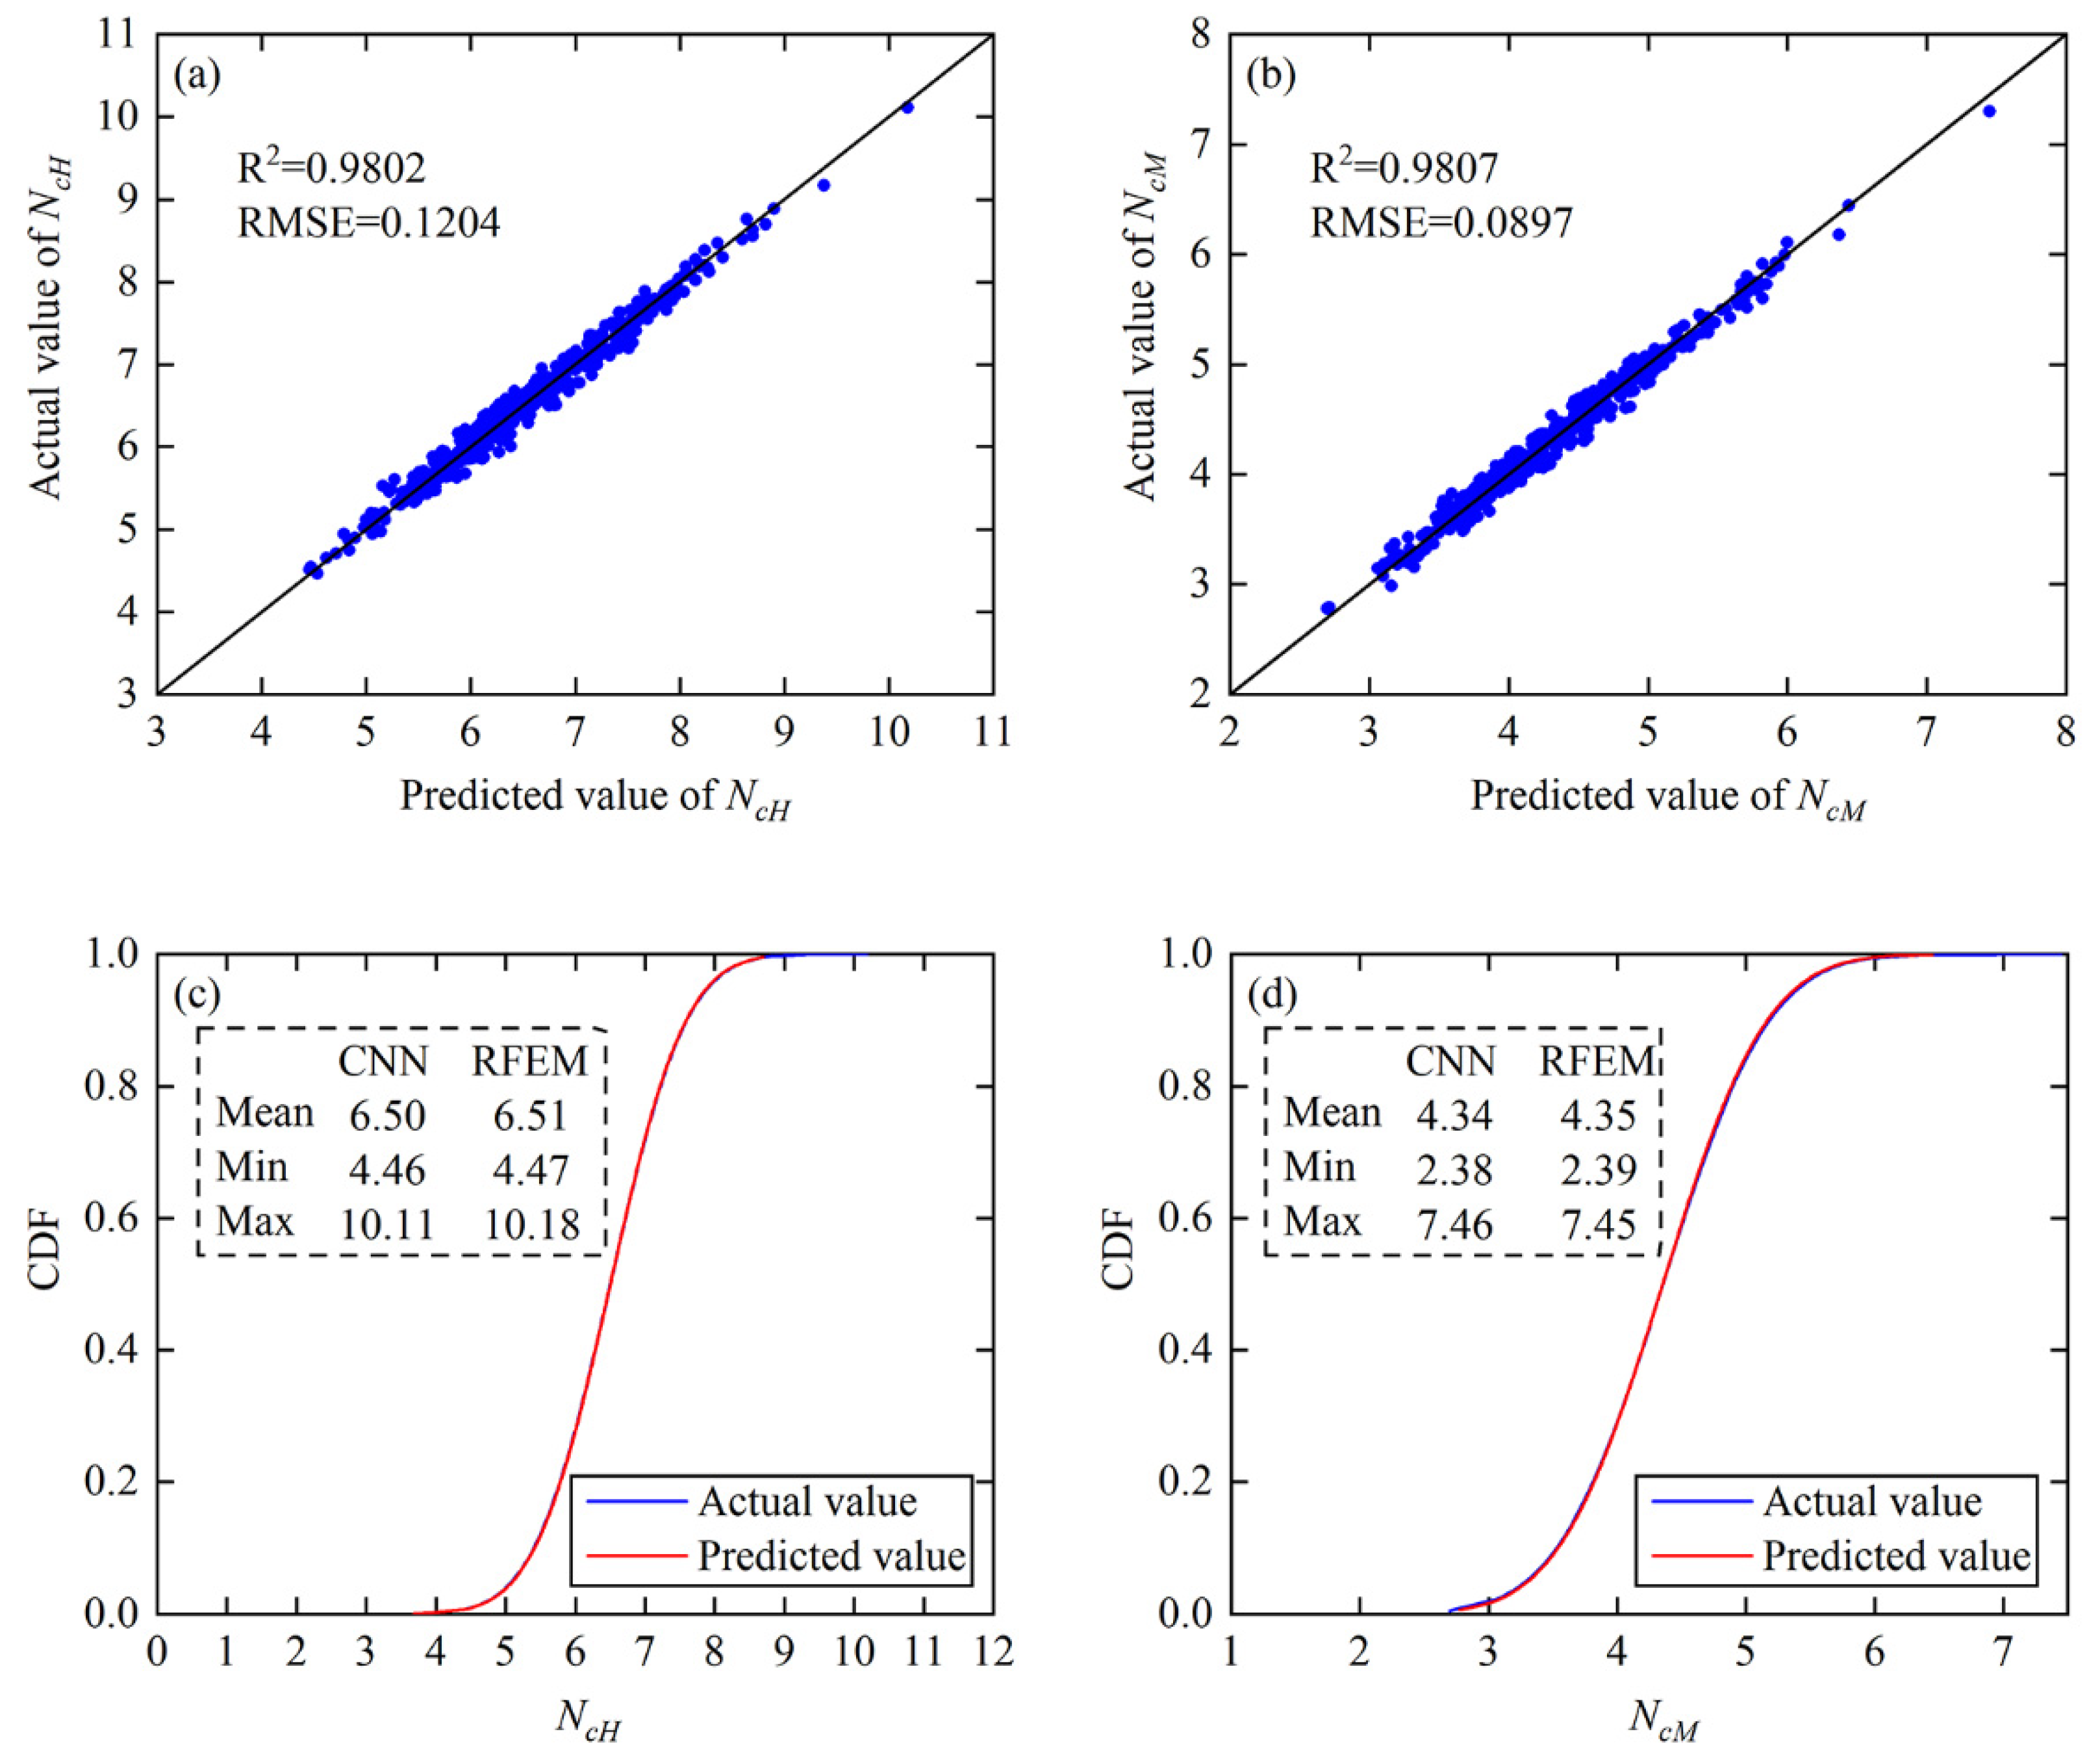
There are three 2D-CNN models with the same architecture that are trained to deal with the prediction of skirted foundation bearing capacity considering the variation of COV, δ h and δ v in the soil random field, respectively. The minimum R2 value and maximum RMSE value for the three surrogate models are 0.9781 and 0.1204, indicating satisfactory prediction performance of the proposed model;
(3)
The confidence interval of the relative error is more than 96.3% with a margin of 5% for the predicted bearing capacity factor with the variation of COV, while the minimum confidence intervals are 97.3% and 97.9% for the relative errors that are located within 5% on account of the variation of δ h and δ v , respectively.
The proposed 2D-CNN model is an effective surrogate model for the prediction of uniaxial bearing capacity factors of skirted foundation. However, it is noted that the bearing capacity prediction of the skirted foundation subjected to the combination of horizontal, vertical and moment loads have not been illustrated. Further study is recommended to develop a reasonable machine-learning model to predict the skirted foundation bearing capacity and failure envelope under different loadings.

Author Contributions

Conceptualization, Y.W. and H.Z.; methodology, H.C.; software, Z.L. and H.Z.; validation, Y.W. and H.Z.; formal analysis, H.Z. and H.C.; investigation, Z.L., H.C. and Y.W.; resources, H.C.; data curation, Z.L. and H.C.; writing-original draft preparation, H.Z.; writing-review and editing, H.C., Y.W. and Z.L.; visualization, H.Z.; supervision, H.Z.; project administration, Y.W. and H.C.; funding acquisition, H.C. All authors have read and agreed to the published version of the manuscript.

Funding

This research was funded by the science foundation of China Three Gorges Corporation grant number 202203004.

Institutional Review Board Statement

Not applicable.

Informed Consent Statement

Not applicable.

Data Availability Statement

The data presented in this study are available on request from the corresponding author.

Acknowledgments

The authors acknowledge the financial support of the science foundation of China Three Gorges Corporation (Grant No. 202203004).

Conflicts of Interest

The authors declare no conflict of interest.

References

  1. Bransby, M.F.; Yun, G.J. The undrained capacity of skirted strip foundations under combined loading. Geotechnique 2009, 59, 115–125. [Google Scholar] [CrossRef]
  2. Gourvenec, S.; Barnett, S. Undrained failure envelope for skirted foundations under general loading. Geotechnique 2011, 61, 263–270. [Google Scholar] [CrossRef]
  3. Hung, L.C.; Kim, S.R. Evaluation of combined horizontal-moment bearing capacities of tripod bucket foundations in undrained clay. Ocean. Eng. 2014, 85, 100–109. [Google Scholar] [CrossRef]
  4. Vulpe, C.; Gourvenec, S.M.; Cornelius, A.F. Effect of embedment on consolidated undrained capacity of skirted circular foundations in soft clay under planar loading. Can. Geotech. J. 2017, 54, 158–172. [Google Scholar] [CrossRef]
  5. Cao, Z.J.; Wang, Y.; Li, D.Q. Quantification of prior knowledge in geotechnical site characterization. Eng. Geol. 2016, 203, 107–116. [Google Scholar] [CrossRef]
  6. Cho, S.E. Probabilistic assessment of slope stability that considers the spatial variability of soil properties. J. Geotech. Geoenviron. 2010, 136, 975–984. [Google Scholar] [CrossRef]
  7. Huang, J.S.; Griffiths, D.V.; Fenton, G.A. Probabilistic analysis of coupled soil consolidation. J. Geotech. Geoenviron. 2010, 136, 417–430. [Google Scholar] [CrossRef]
  8. Bari, M.W.; Shahin, M.A. Probabilistic design of ground improvement by vertical drains for soil of spatially variable coefficient of consolidation. Geotext. Geomembr. 2014, 42, 1–14. [Google Scholar] [CrossRef]
  9. Sina, J.; Luo, N.; Bathurst, R.J. Probabilistic analysis of simple slopes with cohesive soil strength using RLEM and RFEM. Georisk 2017, 11, 231–246. [Google Scholar]
  10. Griffiths, D.V.; Fenton, G.A. Probabilistic Slope Stability Analysis by Finite Elements. J. Geotech. Geoenviron. 2004, 130, 507–518. [Google Scholar] [CrossRef]
  11. Griffiths, D.V.; Huang, J.S.; Fenton, G.A. Influence of spatial variability on slope reliability using 2-D random fields. J. Geotech. Geoenviron. 2009, 135, 1367–1378. [Google Scholar] [CrossRef]
  12. Li, D.Q.; Qi, X.H.; Phoon, K.K.; Zhang, L.M.; Zhou, C.B. Effect of spatially variable shear strength parameters with linearly increasing mean trend on reliability of infinite slopes. Struct. Saf. 2014, 49, 45–55. [Google Scholar] [CrossRef]
  13. Liu, L.L.; Deng, Z.P.; Zhang, S.H.; Cheng, Y.M. Simplified framework for system reliability analysis of slopes in spatially variable soils. Eng. Geol. 2018, 239, 330–343. [Google Scholar] [CrossRef]
  14. Popescu, R.; Deodatis, G.; Nobahar, A. Effects of random heterogeneity of soil properties on bearing capacity. Probab. Eng. Mech. 2005, 20, 324–341. [Google Scholar] [CrossRef]
  15. Cho, S.E.; Park, H.C. Effect of spatial variability of cross-correlated soil properties on bearing capacity of strip footing. Int. J. Numer. Anal. Met. 2010, 34, 1–26. [Google Scholar] [CrossRef]
  16. Ye, Z.T.; Gao, Y.F.; Shu, S.; Wu, Y.X. Probabilistic undrained bearing capacity of skirted foundations under HM combined loading in spatially variable soils. Ocean. Eng. 2021, 219, 108297. [Google Scholar] [CrossRef]
  17. Shen, Z.C.; Pan, Q.J.; Chian, S.C.; Gourvenec, S.; Tian, Y.H. Probabilistic failure envelopes of strip foundations on soils with non-stationary characteristics of undrained shear strength. Geotechnique 2022, 2020, 1–20. [Google Scholar] [CrossRef]
  18. Chen, H.Z.; Shen, Z.C.; Wang, L.; Tian, Y.H.; Chu, X.X. Undrained capacity of skirted circular foundations under fully three-dimensional loading. Comput. Geotech. 2023, 156, 105261. [Google Scholar] [CrossRef]
  19. Mollon, G.; Phoon, K.K.; Dias, D.; Soubra, A.H. Validation of a new 2D failure mechanism for the stability analysis of a pressurized tunnel face in a spatially varying sand. J. Eng. Mech. 2011, 137, 8–21. [Google Scholar] [CrossRef]
  20. Wang, X.R.; Li, Z.; Wang, H.; Rong, Q.G.; Liang, R.Y. Probabilistic analysis of shield-driven tunnel in multiple strata considering stratigraphic uncertainty. Struct. Saf. 2016, 62, 88–100. [Google Scholar] [CrossRef]
  21. Huang, H.W.; Xiao, L.; Zhang, D.M.; Zhang, J. Influence of spatial variability of soil Young’s modulus on tunnel convergence in soft soils. Eng. Geol. 2017, 228, 357–370. [Google Scholar] [CrossRef]
  22. Wang, S.; Hao, H. Effects of random variations of soil properties on site amplification of seismic ground motions. Soil. Dyn. Earthq. Eng. 2002, 22, 551–564. [Google Scholar] [CrossRef]
  23. Yue, Q.X.; Ang, A.H.S. 3D reliability evaluation of tunnels under strong-motion earthquakes considering spatial randomness. Struct. Infrastruct. Eng. 2017, 13, 882–893. [Google Scholar] [CrossRef]
  24. Wang, Y.B.; He, J.J.; Shu, S.; Zhang, H.L.; Wu, Y.X. Seismic responses of rectangular tunnels in liquefiable soil considering spatial variability of soil properties. Soil Dyn. Earthq. Eng. 2022, 162, 107489. [Google Scholar] [CrossRef]
  25. Hossain, M.S.; Randolph, M.F. Effect of strain rate and strain softening on the penetration resistance of spudcan foundations on clay. Int. Geomech. 2009, 9, 122–132. [Google Scholar] [CrossRef]
  26. Charlton, T.S.; Rouainia, M. A probabilistic approach to the ultimate capacity of skirted foundations in spatially variable clay. Struct. Saf. 2017, 65, 126–136. [Google Scholar] [CrossRef]
  27. Selmi, M.; Kormi, T.; Hentati, A.; Ali, N.B.H. Capacity assessment of offshore skirted foundations under HM combined loading using RFEM. Comput. Geotech. 2019, 114, 103148. [Google Scholar] [CrossRef]
  28. Zhang, J.; Sato, T.; Iai, S. Novel support vector regression for structural system identification. Struct. Control. Health 2007, 14, 609–626. [Google Scholar] [CrossRef]
  29. Dong, Y.F.; Li, Y.M.; Lai, M.; Xiao, M.K. Nonlinear structural response prediction based on support vector machines. J. Sound Vib. 2008, 311, 886–897. [Google Scholar]
  30. Lagaros, N.D.; Papadrakakis, M. Neural network based prediction schemes of the non-linear seismic response of 3D buildings. Adv. Eng. Softw. 2012, 44, 92–115. [Google Scholar] [CrossRef]
  31. Amjad, M.; Ahmad, I.; Ahmad, M.; Wroblewski, P.; Kaminski, P.; Amjad, U. Prediction of pile bearing capacity using XGBoost algorithm: Modeling and performance evaluation. Appl. Sci. 2022, 12, 2126. [Google Scholar] [CrossRef]
  32. Jolfaei, S.; Lakirouhani, A. Sensitivity analysis of effective parameters in borehole failure, using neural network. Adv. Civ. Eng. 2022, 2022, 4958004. [Google Scholar] [CrossRef]
  33. Moayedia, H.; Hayati, S. Modelling and optimization of ultimate bearing capacity of stripfooting near a slope by soft computing methods. Appl. Soft Comput. 2018, 66, 208–219. [Google Scholar] [CrossRef]
  34. Tran, Q.A.; Ho, L.S.; Le, H.V.; Prakash, I.; Pham, B.T. Estimation of the undrained shear strength of sensitive clays using optimized inference intelligence system. Neural Comput. Appl. 2022, 34, 7835–7849. [Google Scholar] [CrossRef]
  35. Wang, Z.Z.; Goh, S.H.; Zhang, W.G. Reliability-based design in spatially variable soils using deep learning: An illustration using shallow foundation. Georisk 2022, 2022, 1–15. [Google Scholar] [CrossRef]
  36. Van, C.N.; Keawsawasvong, S.; Nguyen, D.K.; Lai, V.Q. Machine learning regression approach for analysis of bearing capacity of conical foundations in heterogenous and anisotropic clays. Neural Comput. Appl. 2023, 35, 3955–3976. [Google Scholar]
  37. Cassidy, M.J.; Uzielli, M.; Tian, Y.H. Probabilistic combined loading failure envelopes of a strip footing on spatially variable soil. Comput. Geotech. 2013, 49, 191–205. [Google Scholar] [CrossRef]
  38. Hentati, A.; Selmi, M.; Kormi, T.; Ali, N.B.H. Probabilistic HM failure envelopes of strip foundations on spatially variable soil. Comput. Geotech. 2018, 102, 66–78. [Google Scholar] [CrossRef]
  39. Li, J.H.; Zhou, Y.; Zhang, L.L.; Tian, Y.; Cassidy, M.J.; Zhang, L.M. Random finite element method for spudcan foundations in spatially variable soils. Eng. Geol. 2016, 205, 146–155. [Google Scholar] [CrossRef]
  40. Charlton, T.S.; Rouainia, M. Probabilistic capacity analysis of suction caissons in spatially variable clay. Comput. Geotech. 2016, 80, 226–236. [Google Scholar] [CrossRef]
  41. Fenton, G.A.; Vanmarcke, E.H. Simulation of random fields via local average subdivision. J. Eng. Mech. 1990, 116, 1733–1749. [Google Scholar] [CrossRef]
  42. Huang, S.P.; Quek, S.T.; Phoon, K.K. Convergence study of the truncated Karhunen-Loeve expansion for simulation of stochastic processes. Int. J. Numer. Meth. Eng. 2001, 52, 1029–1043. [Google Scholar] [CrossRef]
  43. Tao, Y.Q.; Sun, H.L.; Cai, Y.Q. Bayesian inference of spatially varying parameters in soil constitutive models by using deformation observation data. Int. J. Numer. Anal. Met. 2021, 45, 1647–1663. [Google Scholar] [CrossRef]
  44. Wu, Y.X.; Li, R.; Gao, Y.F.; Zhang, N.; Zhang, F. Simple and efficient method to simulate homogenous multidimensional non-Gaussian vector fields by the spectral representation method. J. Eng. Mech. 2017, 143, 06017016. [Google Scholar] [CrossRef]
  45. Lunne, T.; Andersen, K.H.; Low, H.E.; Randolph, M.F.; Sjursen, M. Guidelines for offshore in situ testing and interpretation in deepwater soft clays. Can. Geotech. J. 2011, 48, 543–556. [Google Scholar] [CrossRef]
  46. Choo, H.; Lee, W.; Hong, S.J.; Lee, C. Application of the dilatometer test for estimating undrained shear strength of Busan New Port clay. Ocean. Eng. 2016, 115, 39–47. [Google Scholar] [CrossRef]
  47. Shi, X.S.; Zhao, J.D. Practical estimation of compression behavior of clayey/silty sands using equivalent void-ratio concept. J. Geotech. Geoenviron. 2020, 146, 04020046. [Google Scholar] [CrossRef]
  48. Phoon, K.K.; Kulhawy, F.H. Characterization of geotechnical variability. Can. Geotech. J. 1999, 36, 612–624. [Google Scholar] [CrossRef]
  49. Zhang, Y.J.; Zhang, H.L.; Wu, Y.X. Dynamic response of rectangular tunnels embedded at various depths in spatially variable soils. Appl. Sci. 2022, 12, 10719. [Google Scholar] [CrossRef]
  50. Zhang, Y.H.; Bienen, B.; Cassidy, M.J.; Gourvenec, S. The undrained bearing capacity of a spudcan foundation under combined loading in soft clay. Mar. Struct. 2011, 24, 459–477. [Google Scholar] [CrossRef]
  51. Zhang, W.G.; Wu, C.Z.; Zhong, H.Y.; Li, Y.Q.; Wang, L. Prediction of undrained shear strength using extreme gradient boosting and random forest based on Bayesian optimization. Geo. Sci. Front. 2021, 12, 469–477. [Google Scholar] [CrossRef]
Figure 1. A typical series of the soil random field: (a) Case Ani-1; (b) Case Ani-3; (c) Case Ani-6; (d) Case Ani-11.
Applsci 13 06624 g001
Figure 2. Details of skirted foundation and positive loading and displacement.
Applsci 13 06624 g002
Figure 3. Finite element model of skirted foundation.
Applsci 13 06624 g003
Figure 4. The converging trend of N c H statistics: (a) mean; (b) standard deviation.
Applsci 13 06624 g004
Figure 5. Architecture of the proposed 2D-CNN model.
Applsci 13 06624 g005
Figure 6. Influence of number of training samples on R2 and RMSE values.
Applsci 13 06624 g006
Figure 7. Variation of the bearing capacity factors ( N c H and N c M ) statistics with COV: (a) Mean; (b) Standard deviation.
Applsci 13 06624 g007
Figure 8. Effect of COV on RMSE and R2 value for (a) N c H and (b) N c M .
Applsci 13 06624 g008
Figure 9. Comparison of the predicted and actual uniaxial bearing capacity factors under mixed COV: (a) Scatter of N c H ; (b) Scatter of N c M ; (c) CDFs of N c H ; (d) CDFs of N c M .
Applsci 13 06624 g009
Figure 10. Distribution of the relative errors of the predicted bearing capacity factors under mixed COV: (a) PDF of N c H ; (b) PDF of N c M .
Applsci 13 06624 g010
Figure 11. Variation of the bearing capacity factors ( N c H and N c M ) statistics with δ h : (a) Mean; (b) Standard deviation.
Applsci 13 06624 g011
Figure 12. Comparison of the predicted and actual uniaxial bearing capacity factors under mixed δ h : (a) Scatter of N c H ; (b) Scatter of N c M ; (c) CDFs of N c H ; (d) CDFs of N c M .
Applsci 13 06624 g012
Figure 13. Distribution of the relative errors of the predicted bearing capacity factors under mixed δ h : (a) PDF of N c H ; (b) PDF of N c M .
Applsci 13 06624 g013
Figure 14. Comparison of the predicted and actual uniaxial bearing capacity factors under mixed δ v : (a) Scatter of N c H ; (b) Scatter of N c M ; (c) CDFs of N c H ; (d) CDFs of N c M .
Applsci 13 06624 g014
Figure 15. Distribution of the relative errors of the predicted bearing capacity factors under mixed δ v : (a) PDF of N c H ; (b) PDF of N c M .
Applsci 13 06624 g015
Table 1. Summary of the parameters of soil random field.
CaseCOV δ h   ( m ) δ v   ( m )
Ani-10.1504
Ani-20.2504
Ani-30.3504
Ani-40.4504
Ani-50.5504
Ani-60.3304
Ani-70.3404
Ani-80.3604
Ani-90.3502
Ani-100.3506
Ani-110.3508
Table 2. Effect of different neural network architecture on R2 and RMSE values.
NCLKCLPooling TypeR2RMSE
NcHNcMNcHNcM
22 × 2Maximum0.90480.89960.27680.2210
22 × 2Average0.94200.94170.25010.1938
23 × 3Maximum0.89860.89380.29110.2271
23 × 3Average0.91890.91320.26170.2051
24 × 4Maximum0.89680.88960.30360.2459
24 × 4Average0.91160.90770.26900.2166
32 × 2Maximum0.92020.91660.26960.2136
32 × 2Average0.95700.95690.24330.1865
33 × 3Maximum0.91130.90880.28360.2203
33 × 3Average0.93450.92990.25460.1987
34 × 4Maximum0.90780.90220.29640.2384
34 × 4Average0.92610.92120.26210.2088
42 × 2Maximum0.90930.90660.27320.2173
42 × 2Average0.94590.94510.24760.1908
43 × 3Maximum0.90010.89160.28770.2241
43 × 3Average0.92150.91980.25810.2029
44 × 4Maximum0.89880.89160.30020.2429
44 × 4Average0.91400.91120.26590.2132
Disclaimer/Publisher’s Note: The statements, opinions and data contained in all publications are solely those of the individual author(s) and contributor(s) and not of MDPI and/or the editor(s). MDPI and/or the editor(s) disclaim responsibility for any injury to people or property resulting from any ideas, methods, instructions or products referred to in the content.

