Article

Characterization of Soluble Salts on the Frescoes by Saturnino Gatti in the Church of San Panfilo in Villagrande di Tornimparte (L’Aquila)

1
Department of Chemistry, University of Milan, 20133 Milan, Italy
2
Department of Sciences of Antiquity, Sapienza University, 00185 Rome, Italy
*
Authors to whom correspondence should be addressed.
Appl. Sci. 2023, 13(11), 6623; https://doi.org/10.3390/app13116623
Submission received: 30 April 2023 / Revised: 24 May 2023 / Accepted: 28 May 2023 / Published: 30 May 2023

Abstract

:
Salt crystallization is one of the most dangerous forms of degradation affecting frescoes. This phenomenon can lead to cracking, flaking and detachment of the pictorial layer, ultimately ruining the work of art. However, the characterization of soluble salts via chemical analysis can be employed to determine the conditions of the artifact and establish the proper restoration and/or conservation strategies to be adopted. In this archaeometric study, a first-ever characterization of the soluble salts and related degradation phenomena on the frescoes by Saturnino Gatti in the church of San Panfilo in Villagrande di Tornimparte (L’Aquila) was carried out. Sampling was performed in areas with evident detachments, exfoliations and saline crystallization (efflorescences). Eleven samples of powder and fragments were taken from different panels of the fresco: nine were taken from Panels A, C, D and E and two from the top part of the vault. Chemical characterizations were performed using two analytical techniques: ion chromatography (IC) and attenuated total reflectance Fourier-transform infrared spectroscopy (ATR-FTIR). Ion chromatography was used for the quantification of the main ions and to evaluate the presence of soluble salts, whereas infrared spectroscopy was used to characterize the mineralogical phases. The results show efflorescence consisting of newly formed gypsum and carbonate in samples taken closer to the ground. Furthermore, a good correlation between sodium and chloride ions was observed, indicating the presence of an efflorescence composed of newly formed sodium chloride. Capillary rise and infiltration were highlighted as the main sources of soluble salts. This information will be crucial in guiding future restoration or conservation operations.

1. Introduction

This paper contributes to the Special Issue “Results of the II National Research project of AIAr: archaeometric study of the frescoes by Saturnino Gatti and workshop at the church of San Panfilo in Tornimparte (AQ, Italy)” in which the scientific results of II National Research Project conducted by members of the Italian Association of Archaeometry (AIAr) are discussed and collected. For in-depth details on the aims of the project, see the introduction of the Special Issue [1].
One of the most serious forms of damage affecting porous stone materials used in monuments and other construction materials is directly linked to the physical action exerted by the crystallization of soluble salts [2,3,4,5,6]. This process can cause several degradation phenomena, including flaking, cracks, detachment or staining of the pigment layer, efflorescence, sub-efflorescence and formation of crusts, all of which can lead to irreversible damage of the original material [7,8]. As documented in numerous studies [7,9,10], walls and frescoes suffer greatly from decay induced by salt crystallization, and conservation strategies often need to be put in place in order to salvage the artworks. However, these efforts may in turn exacerbate the problem by introducing additional salts or solutions, as explained in the following paragraph, which may cause the artifacts to decay more rapidly instead of preventing this process.
The salts responsible for this damage can originate from the building material itself or derive from other sources [11]. For instance, they can be channeled from the groundwater and penetrate the wall via capillary rise, with an efficiency that depends on the distribution of the pore size and the wetting behavior of the material [12]. Alternately, they can derive from polluted atmospheres rich in particulate matter, marine aerosols and other polluting agents which are deposited and eventually penetrate the walls [13]. Additionally, acidic and alkaline products used in cleaning and restoration treatments usually contain salts and, if not applied correctly, can give rise to the problems associated with salt crystallization mentioned previously. Finally, they can derive from the metabolic activity of microbes [14]. When the saline solutions that permeate the material, following the evaporation of water, reach suitable thermodynamic conditions, nucleation and growth of crystals can take place. As the water evaporates, the concentration increases and the salt begins to precipitate. The degree of damage is directly proportional to the concentration of the salt and the size of the crystal, and inversely proportional to the size of the pores [12].
Degradation from salt formation derives from the pressure exerted by the crystallization process on the pores of the material. This can occur via different mechanisms: hydrostatic pressure, hydration pressure and linear pressure. Hydrostatic pressure develops when the solution occupies a volume which is smaller than the one of the precipitating crystals [15]. In some cases, this may only constitute a minor effect, since the increase in pressure is associated with an increase in solubility, limiting the impact of salt crystallization. Hydration pressure occurs following the increase in volume generated by the hydration of the salt [16]. This effect is strictly related to the nature and physical–chemical characteristics of the salt; therefore, the impact may be different from case to case. Finally, linear pressure develops following the crystallization of a salt in the pores of the material, and the exerted pressure will be inversely proportional to the pore size [17]. Many calcarenites with pore sizes smaller than 0.1 micron suffer greatly from this type of degradation [15,16]. Often, these three mechanisms have a combined effect, leading to an increase in pore size and eventually to cracks, efflorescence and sub-efflorescence [16]. Due to the combined effect of all these mechanisms, the pore increases in size and eventually can lead to cracks, efflorescence and/or sub-efflorescence.
According to Zehnder et. al. (1991), the nature of the salts that can be formed varies along the vertical profile of the wall, depending on their solubility. Typically, the relatively less soluble salts, such as calcium carbonate and gypsum, can precipitate more easily and, therefore, are found in the areas closer to the ground. Instead, sulphate and nitrate salts will precipitate in the intermediate sections. Finally, the most soluble and deliquescent salts are found in the upper parts of the wall; these include nitrates and chlorides of sodium and magnesium, which can concentrate and accumulate for centuries. The intermediate sections are usually the most degraded parts because of the favorable conditions for the formation of efflorescence and sub-efflorescence [12]. Indeed, in the areas closer to the ground, the rate of capillary rise of the water is faster than the rate of evaporation from the walls, therefore inhibiting supersaturation of the solution and crystal formation. Instead, as the rate of capillary rise decreases along the wall, the solution becomes supersaturated, and efflorescence starts to form on the outside. Finally, when the rate of rise decreases below the rate of evaporation, the salts are formed inside the walls (sub-efflorescence).
The present study is concerned with the characterization of soluble salts on the frescoes by Saturnino Gatti in the Church of San Panfilo in Villagrande di Tornimparte, which is located in the city of L’Aquila, in the Abruzzo region of Italy. Eleven samples were retrieved at different heights along the walls of the church hosting the frescoes and characterized using ion chromatography (IC) and attenuated total reflectance Fourier-transform infrared spectroscopy (ATR-FTIR). The former was used to determine the ionic composition, in terms of both anions and cations, whereas the latter was employed to identify the most abundant mineralogical phases. The aim of this research is to characterize the salts in the masonry that caused the degradation observed on the surfaces of the church, both in terms of nature and concentration. A complete characterization of the fresco was performed by sampling areas at different heights, covering the entire structure. Thanks to the chemical analysis, it was possible to trace the sources of the soluble salts. The results of this study will also be useful when conducting the restoration processes of the walls.

2. Materials and Methods
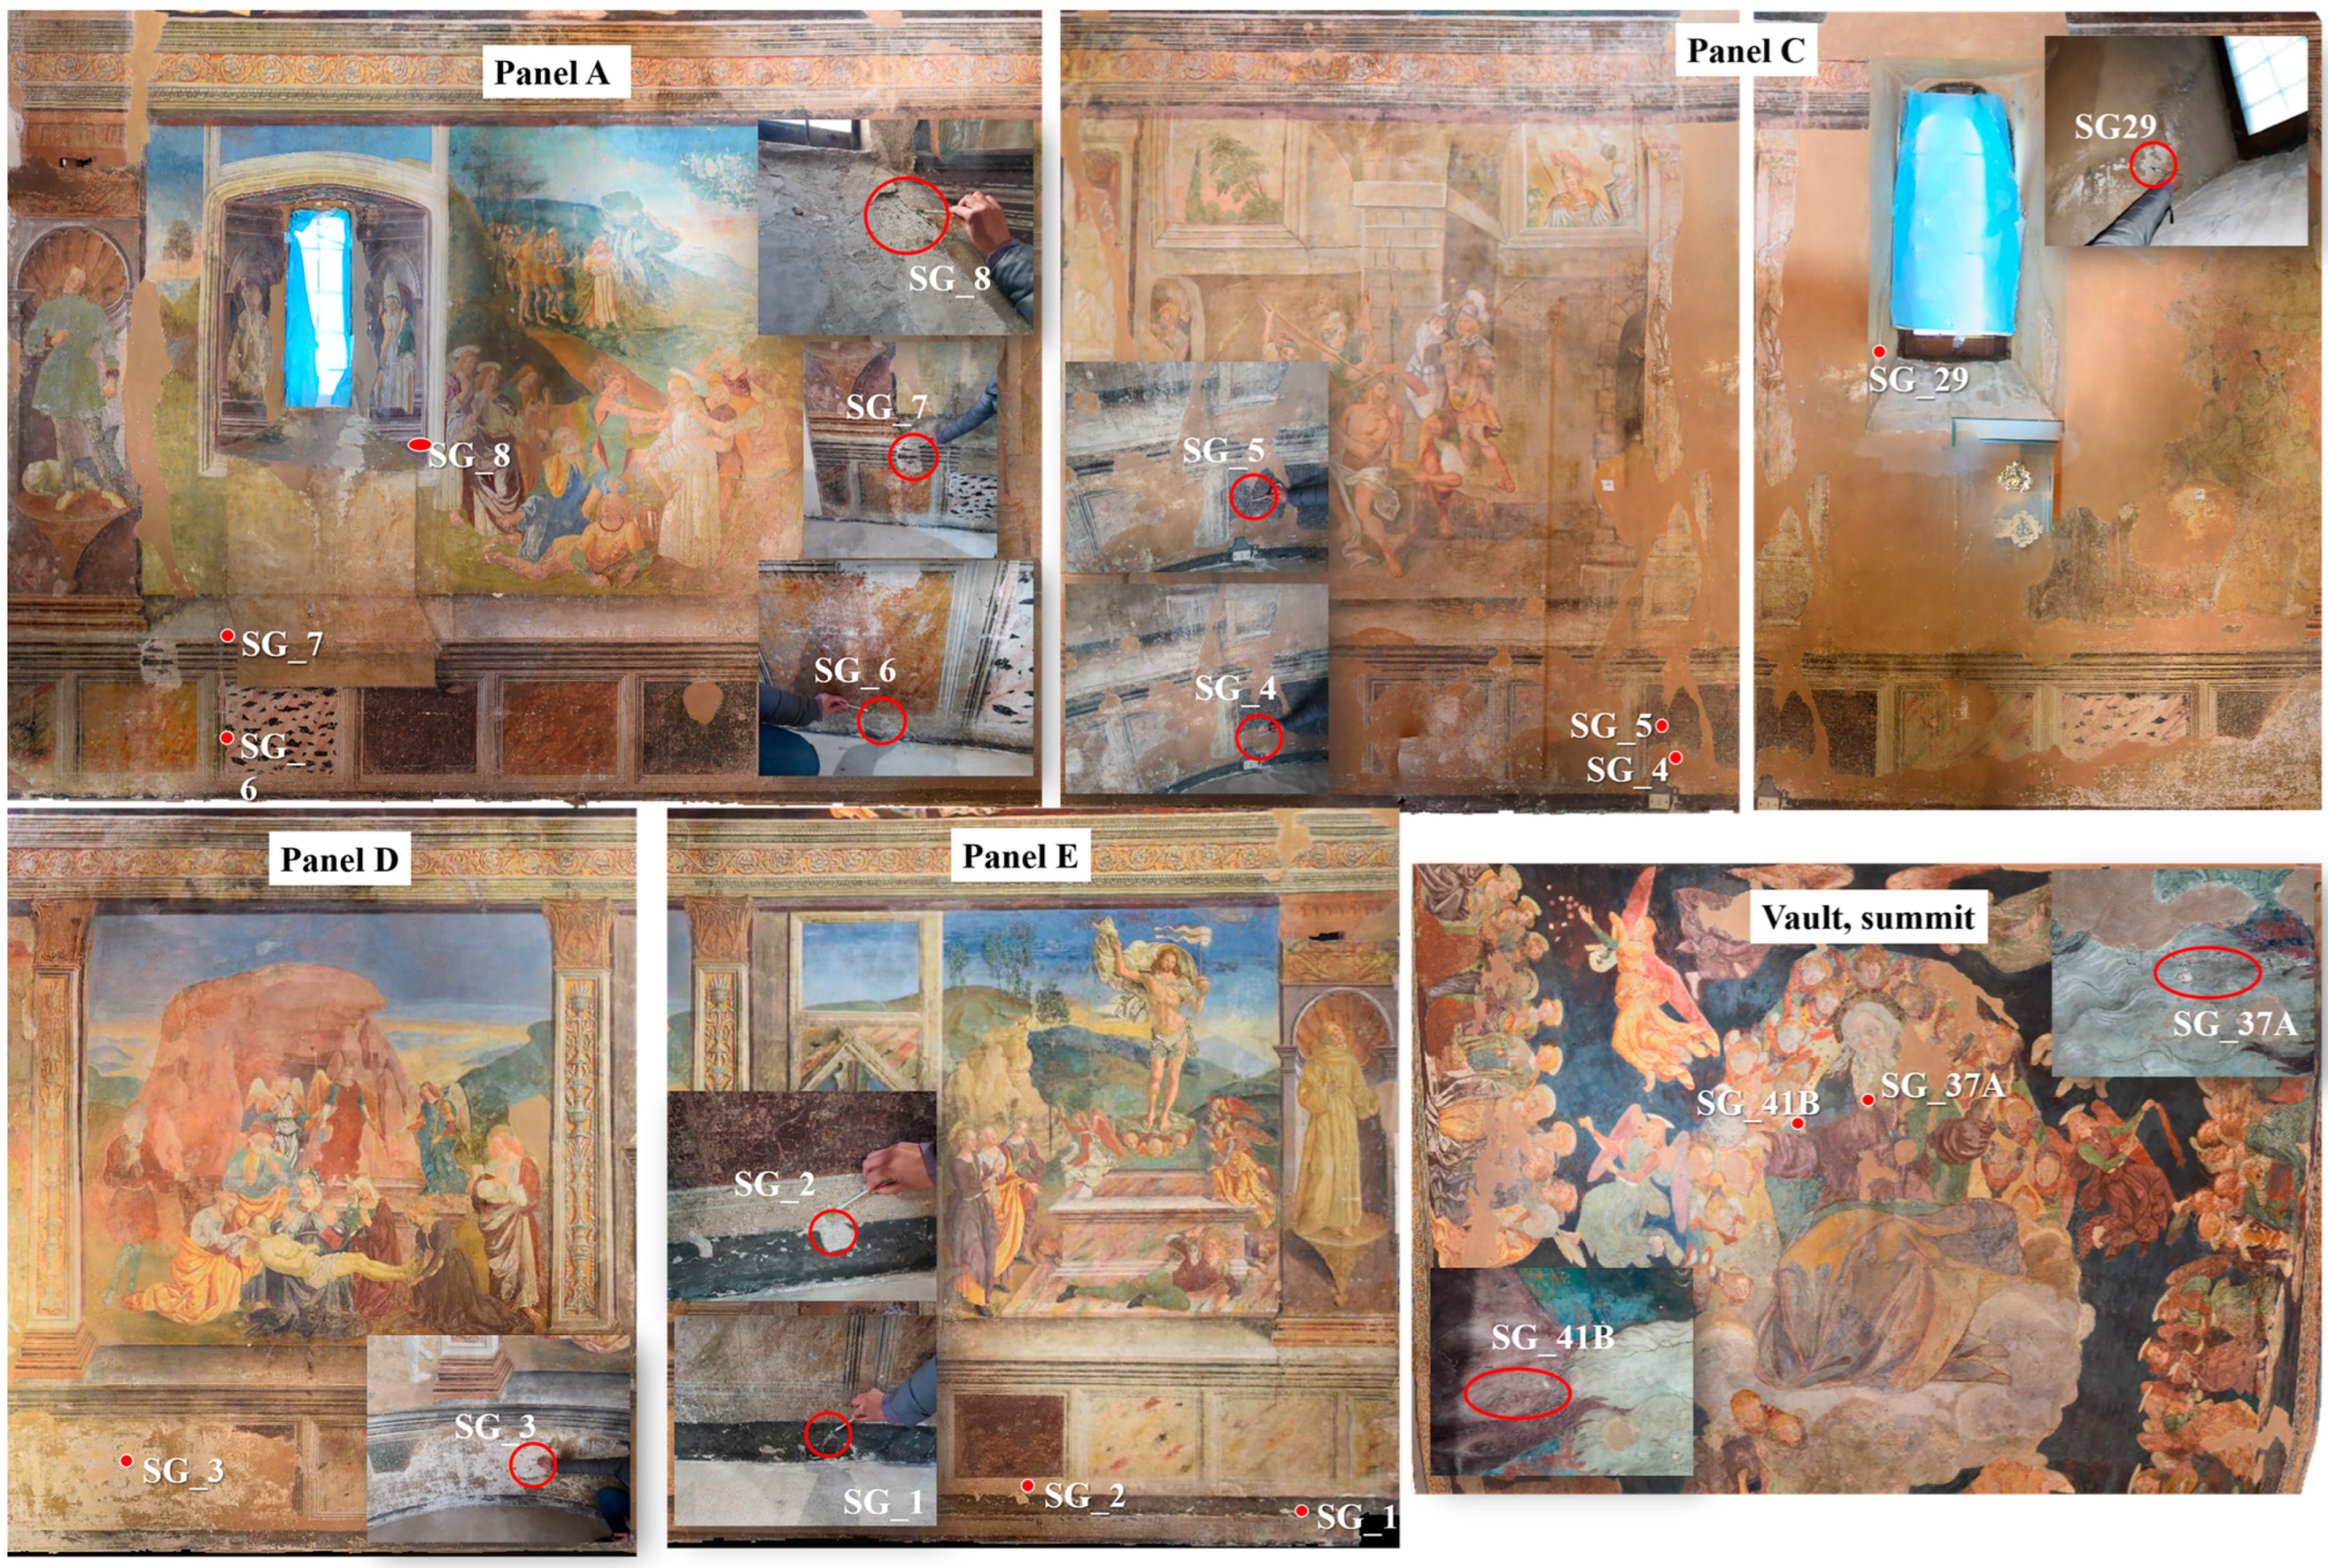
2.1. Sampling

Eleven samples of powder and fragments were taken from different panels of the fresco in order to characterize the degradation produced by the presence of salts. The samples (Figure 1 and Table 1) were taken from areas where salt efflorescence and detachment of the plaster surface were visible. Sampling was carried out at different heights: seven fragments were taken close to the ground level (SG_1 to 7), two samples were taken near window splays (SG_8 and SG_29), and two samples were taken from the top of the vault (SG_37A and SG_41B).

2.2. Ion Chromatography Analysis

Quantification of the main ionic components and evaluation of the presence of soluble salts were performed with ion chromatography (IC). Anions (NO3, SO42−, Cl) and cations (Na+, K+, Ca2+, Mg2+, NH4+) were determined using an HPLC Dionex ICS-1000 Ion Chromatography System (Thermo Scientific, Dionex Corporation, Sunnyvale, CA, USA) equipped with a conductivity detector. Anion analysis was carried out with an Ion Pac AS14A IC Column, using 8 mM Na2CO3/1 mM NaHCO3 as the eluent, isocratic elution, a constant flux of 1.5 mL min−1 and an ULTRA anionic self-healing suppression (ASRS-ULTRA), whereas cations were analyzed with an Ion Pac CS12A IC Column, using 20 mM methanesulfonic acid (MSA) as the eluent, isocratic elution, a constant flux of 1.5 mL min−1 and an ULTRA cationic self-healing suppression (CSRS-ULTRA).
In order to prepare the solutions to be analyzed, a small portion of the sample was ground in an agate mortar. Of this powder, around 2 mg was transferred in a plastic test-tube and treated with 10 mL of milli-q water (Merck Millipore Milli-Q, Burlington, MA, USA). The suspensions were immersed in an ultrasonic bath for 1 h, centrifuged at 3000 rpm for 3 min and filtered using 0.45 µm non-sterile hydrophilic membranes (PTFE Millex-14 LCR, 25 mm, Millex® Syringe Filters, Merck Millipore, Burlington, MA, USA) before injection in the instrument.

2.3. ATR-FTIR Analysis

Fourier-transform infrared spectroscopy was carried out in attenuated total reflectance mode (ATR-FTIR) in order to identify the main components and phases of the samples. The instrumentation used to perform the analyses was a Nicolet 380 FTIR spectrometer (Thermo Electron Corporation, Waltham, MA, USA). The detection window used was between 400 cm−1 and 4000 cm−1, and 64 scans with a resolution of 4 cm−1 were performed, along with smoothing operations (15 points).

3. Results

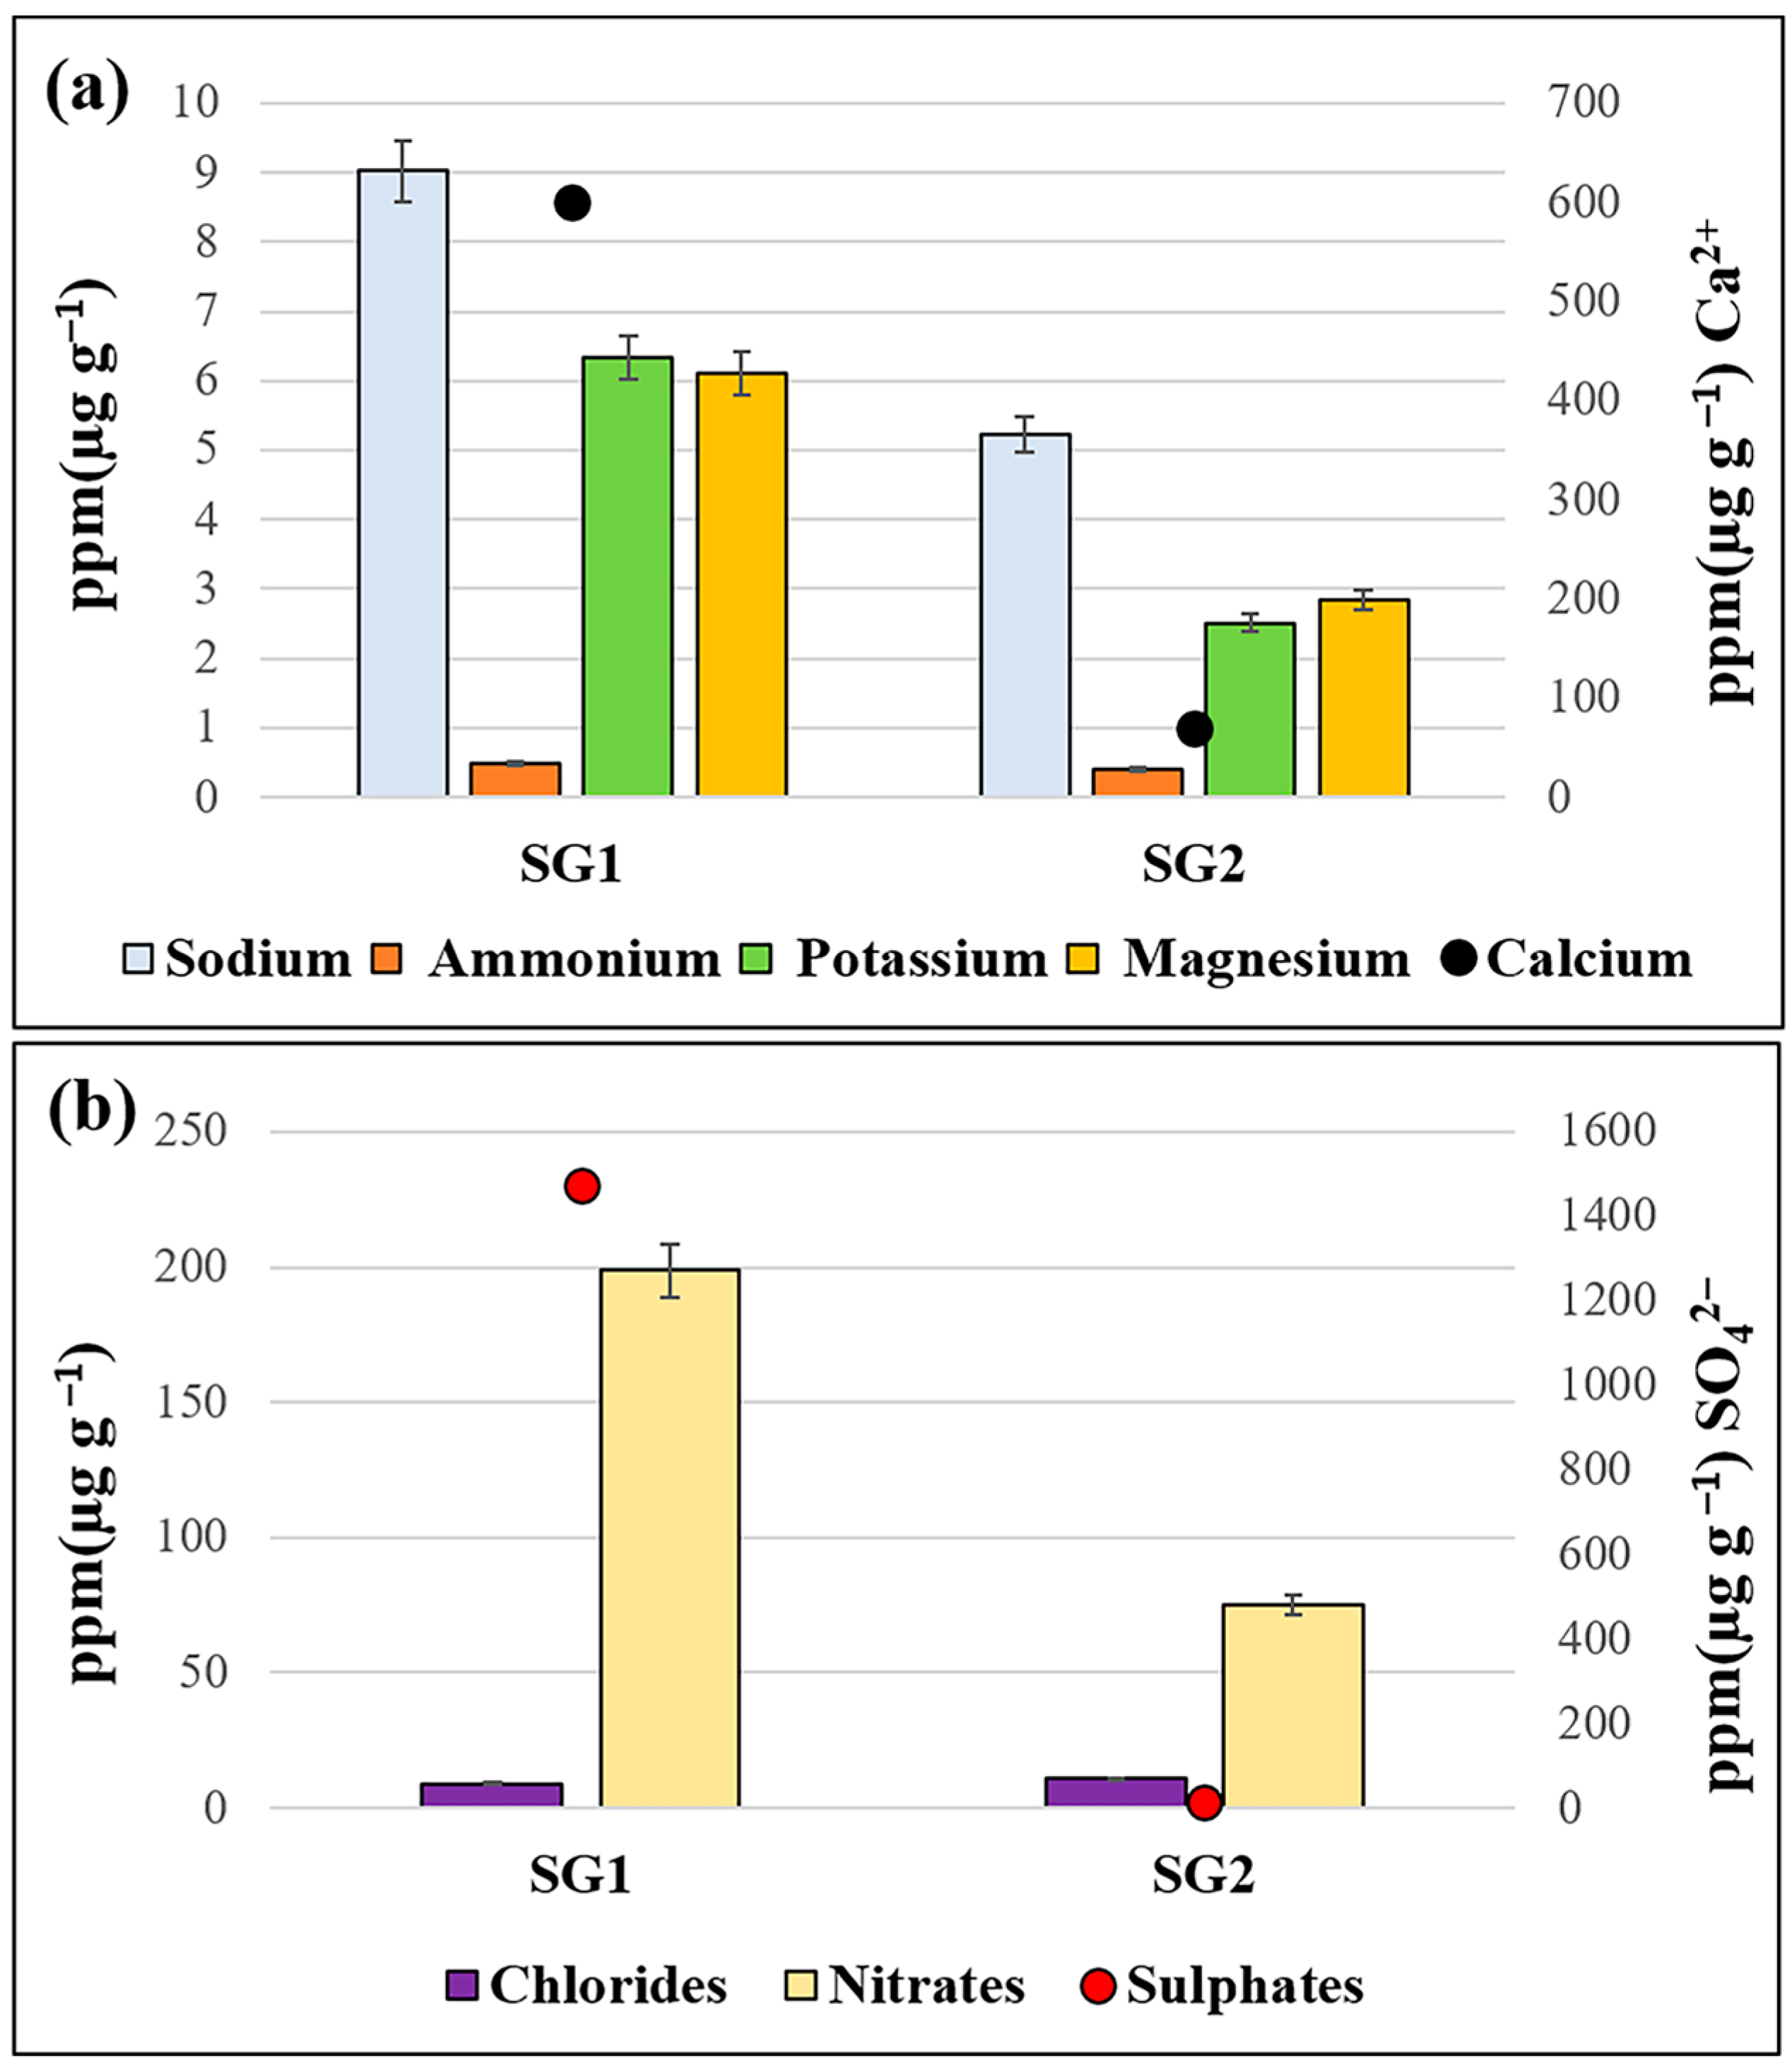
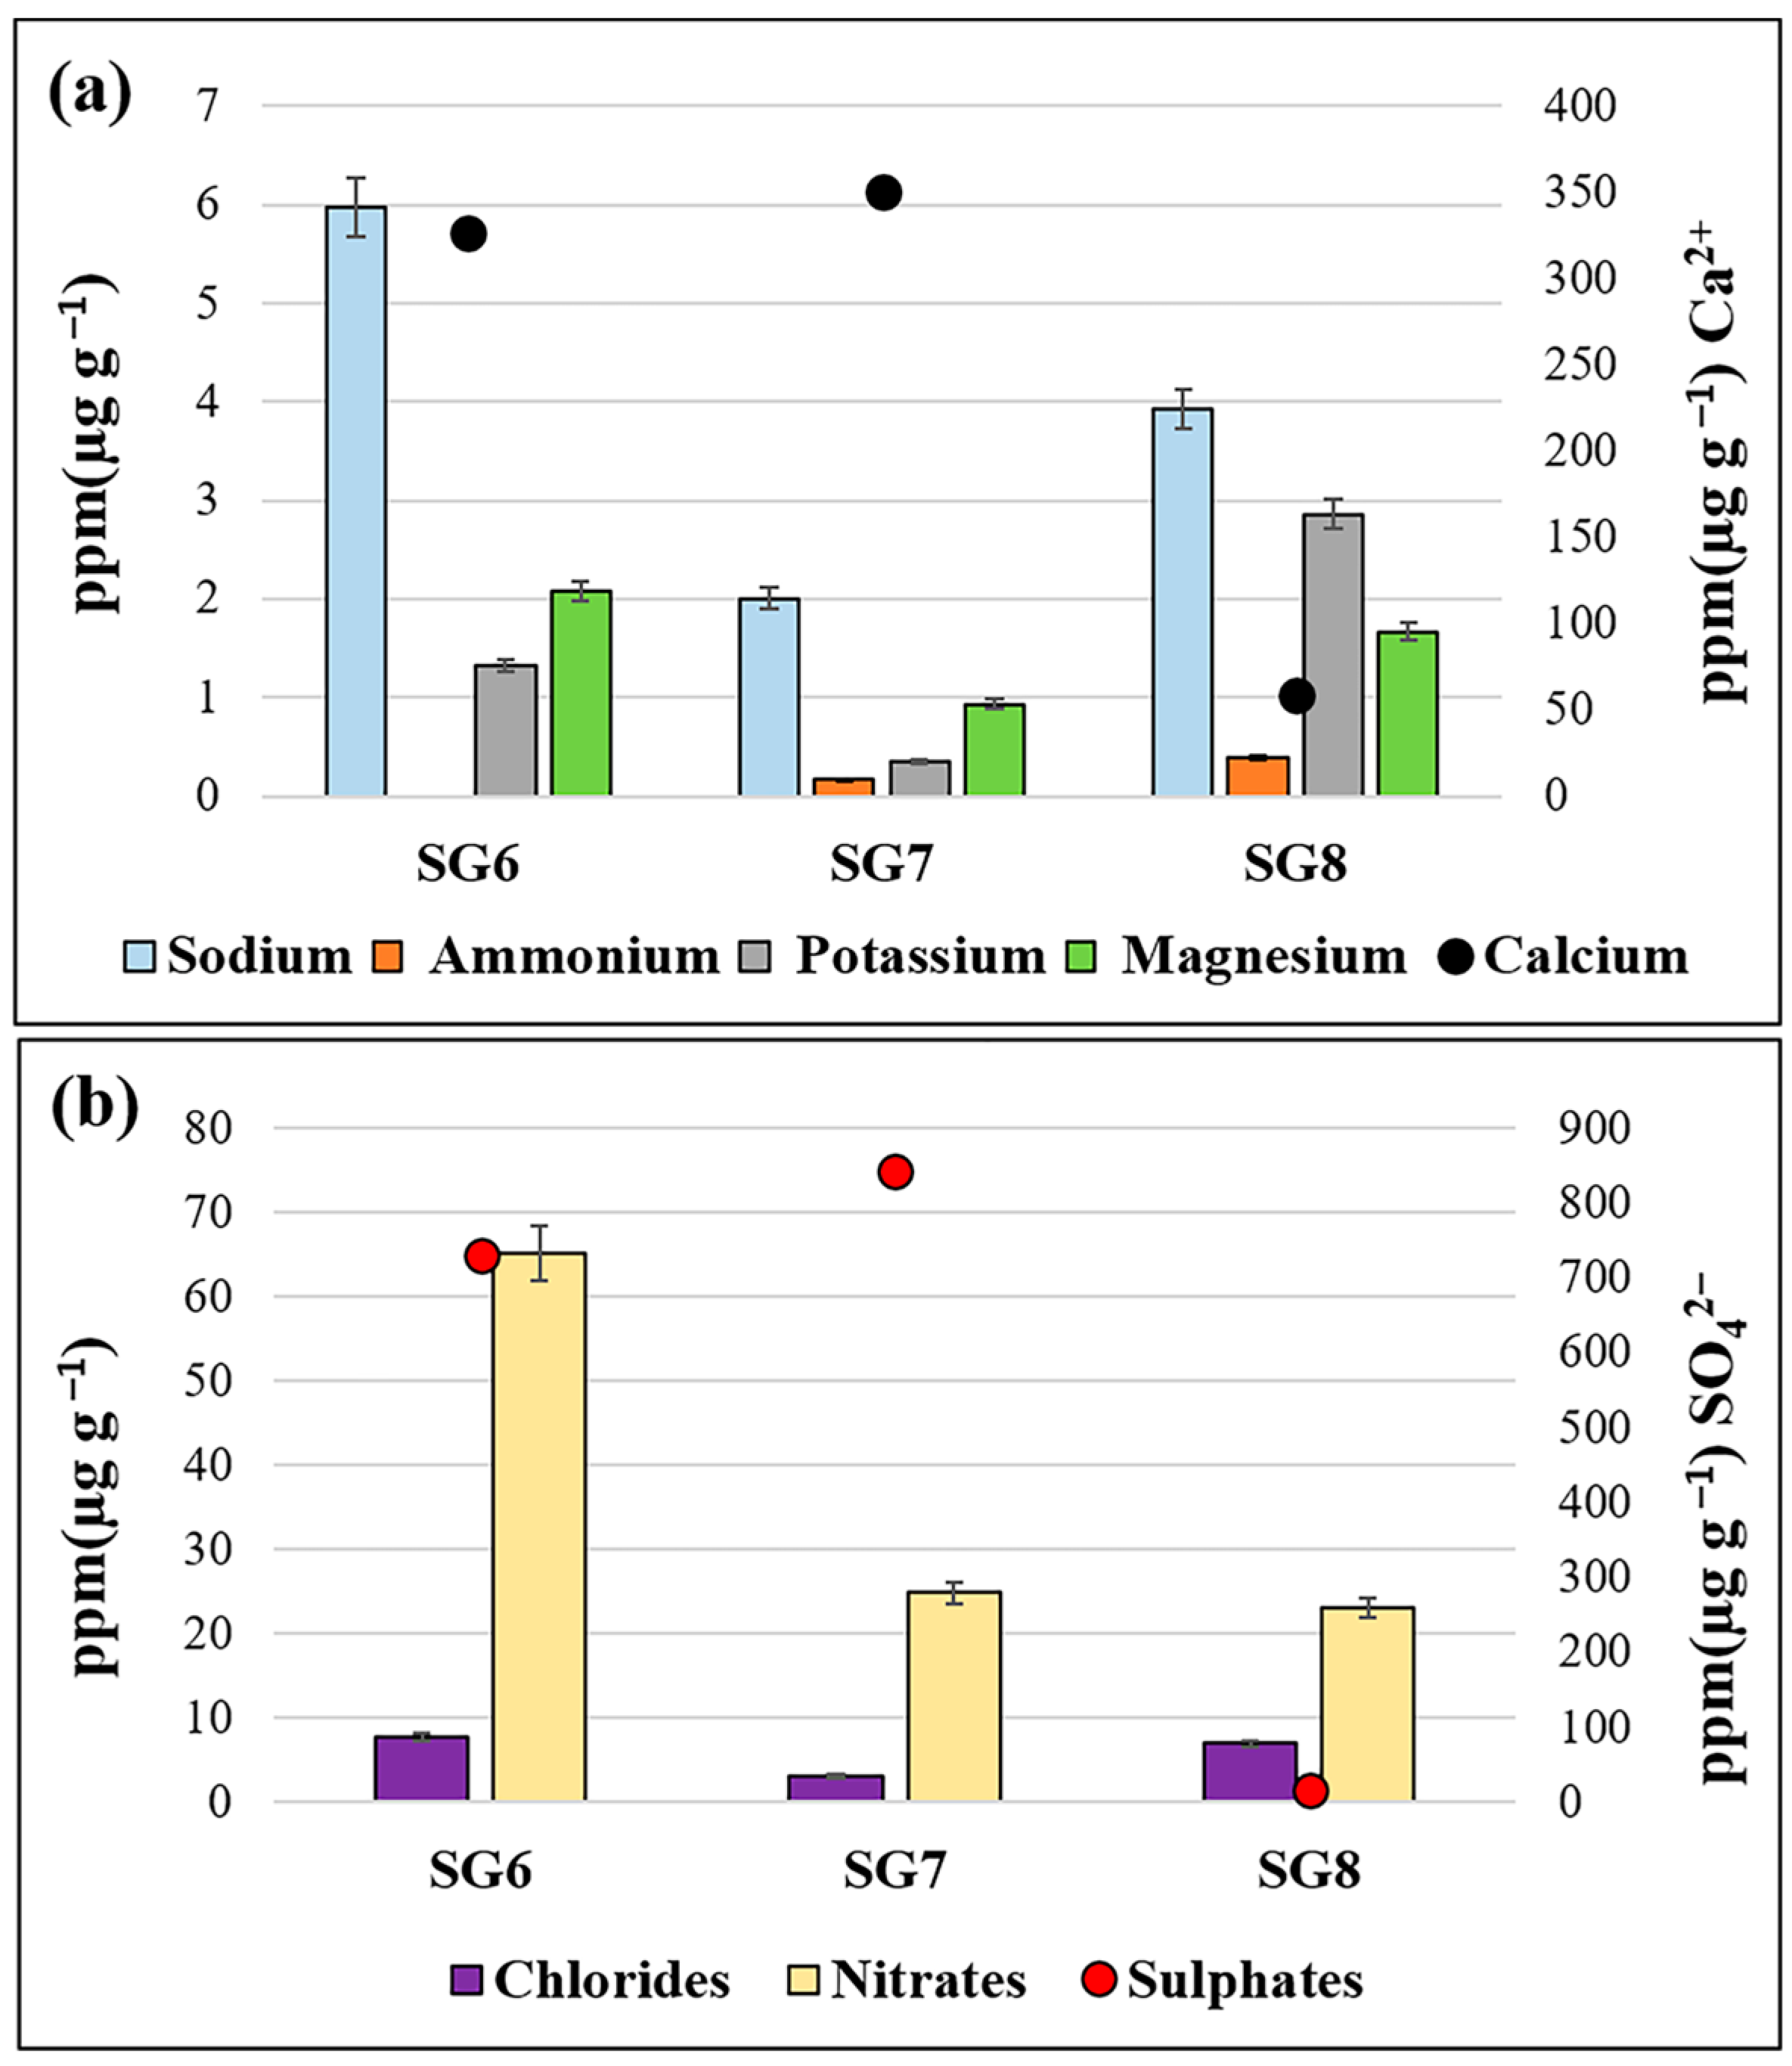
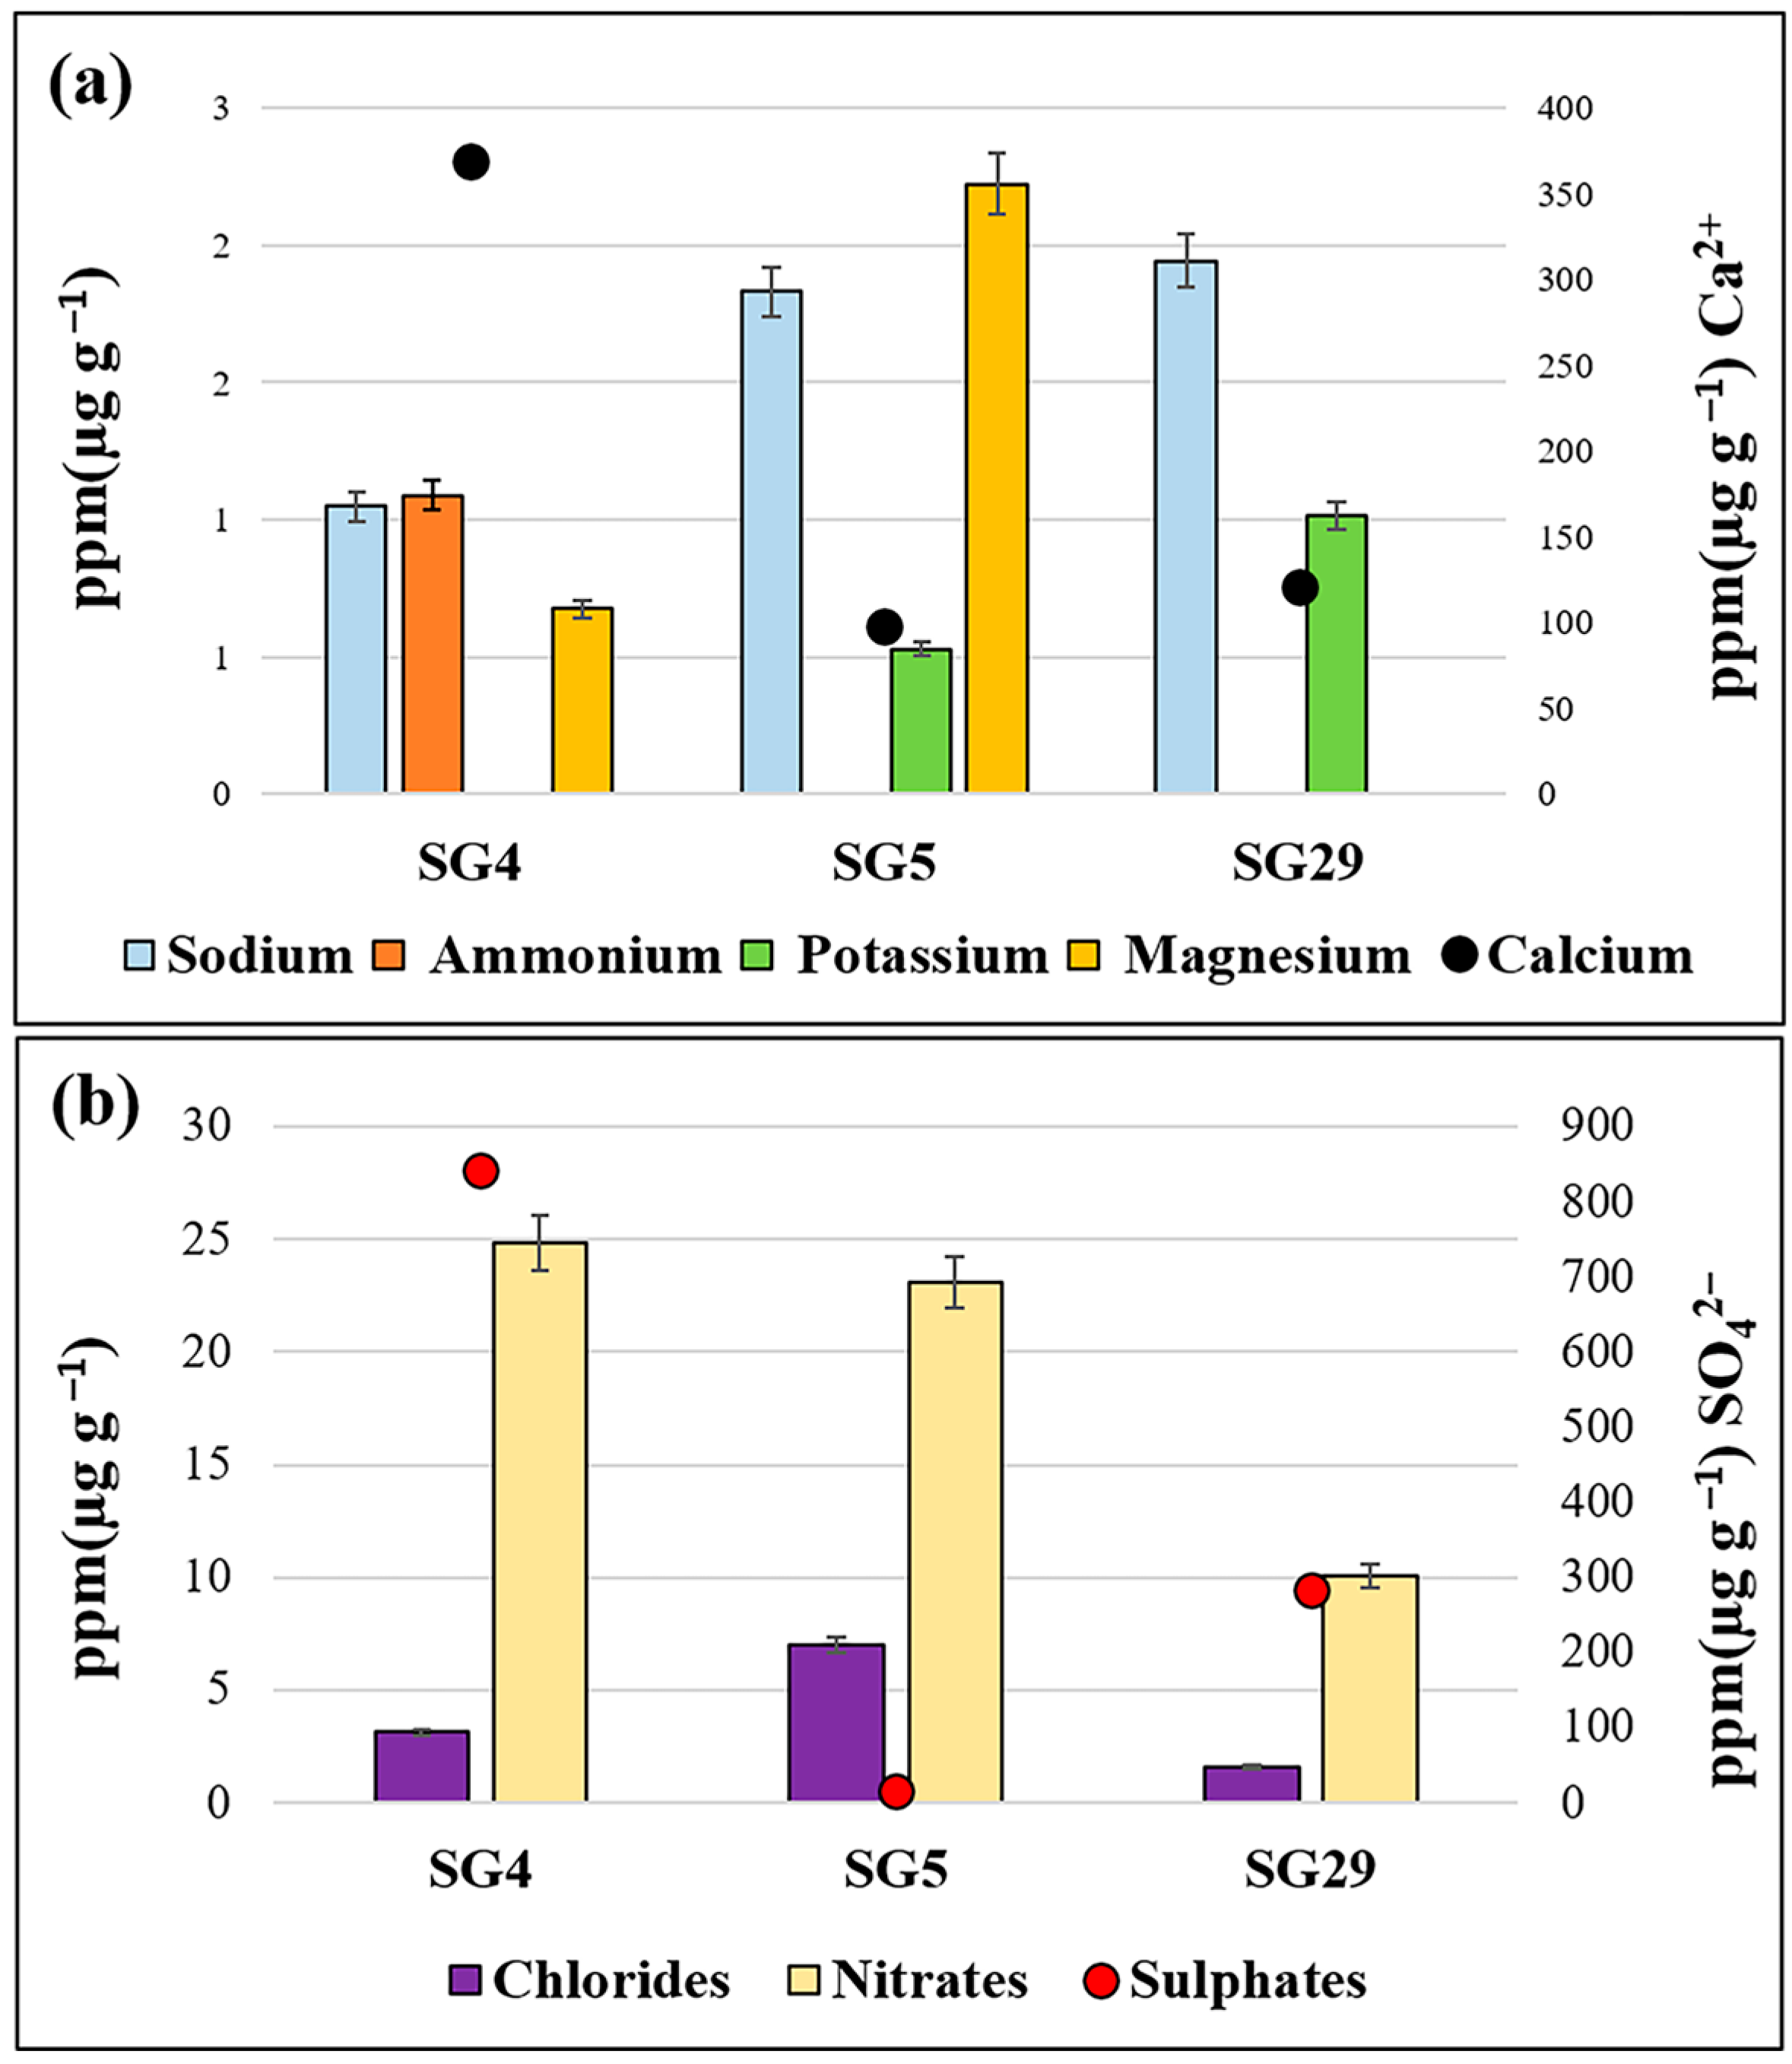
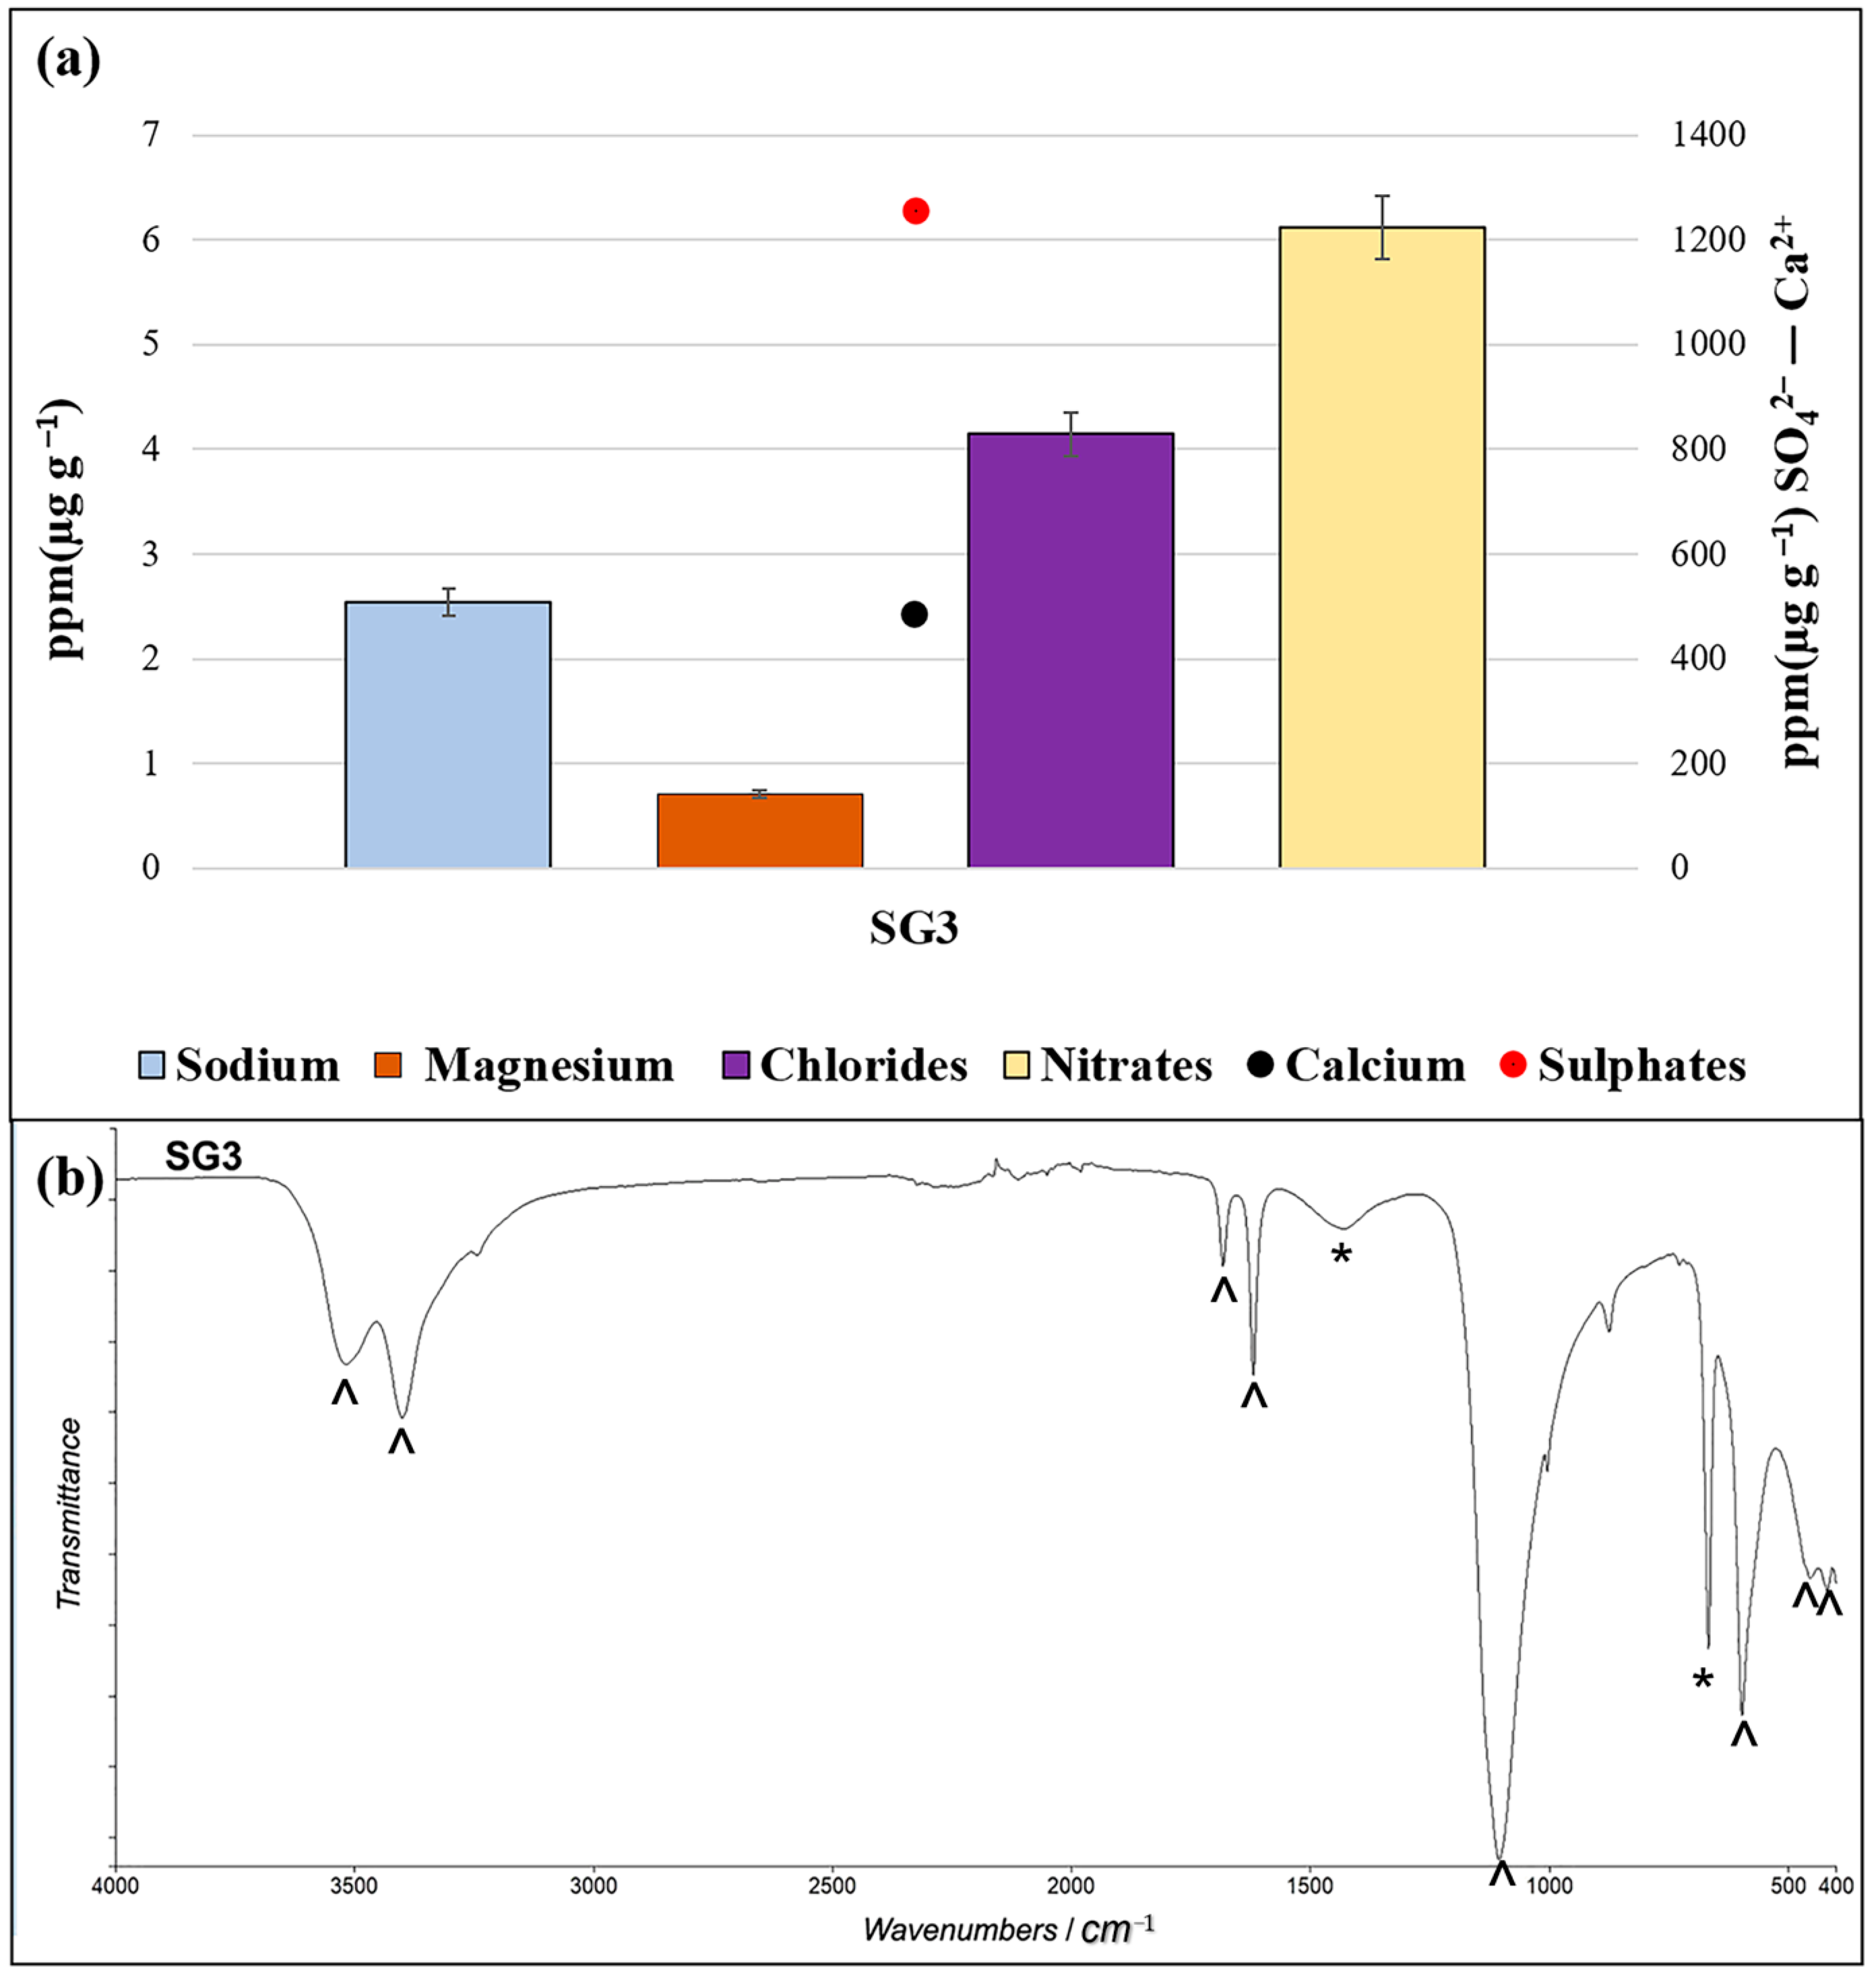
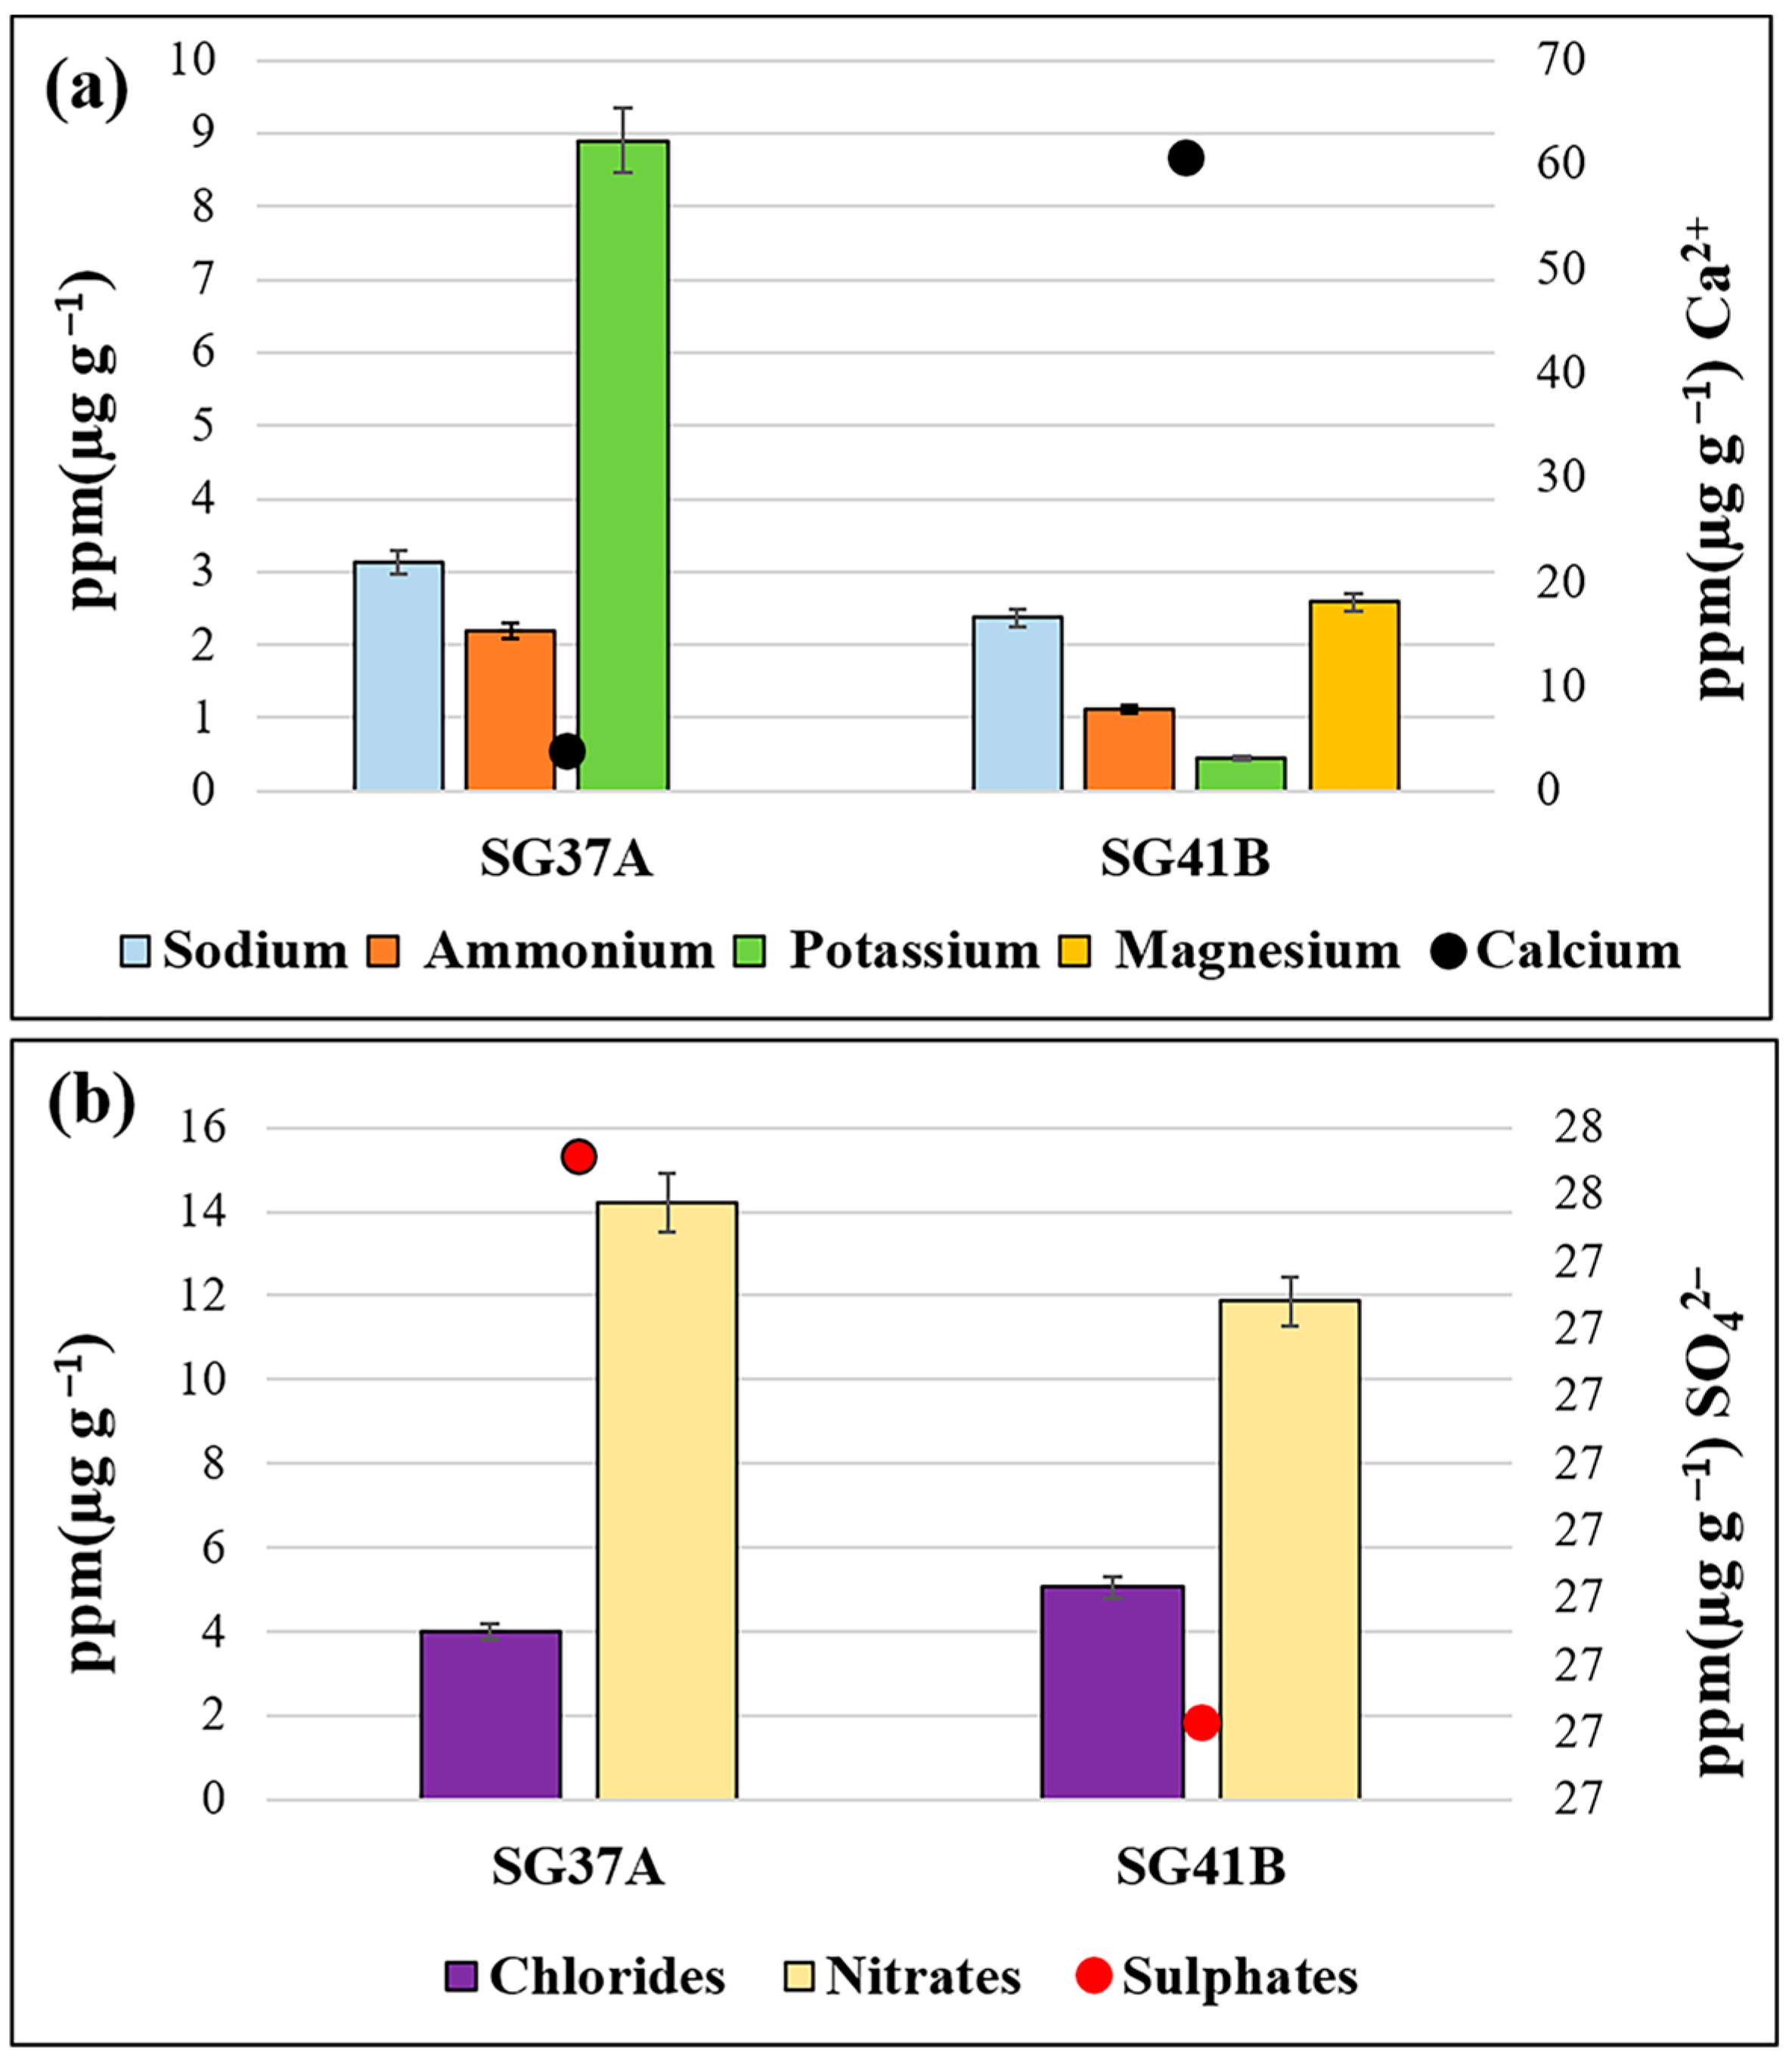
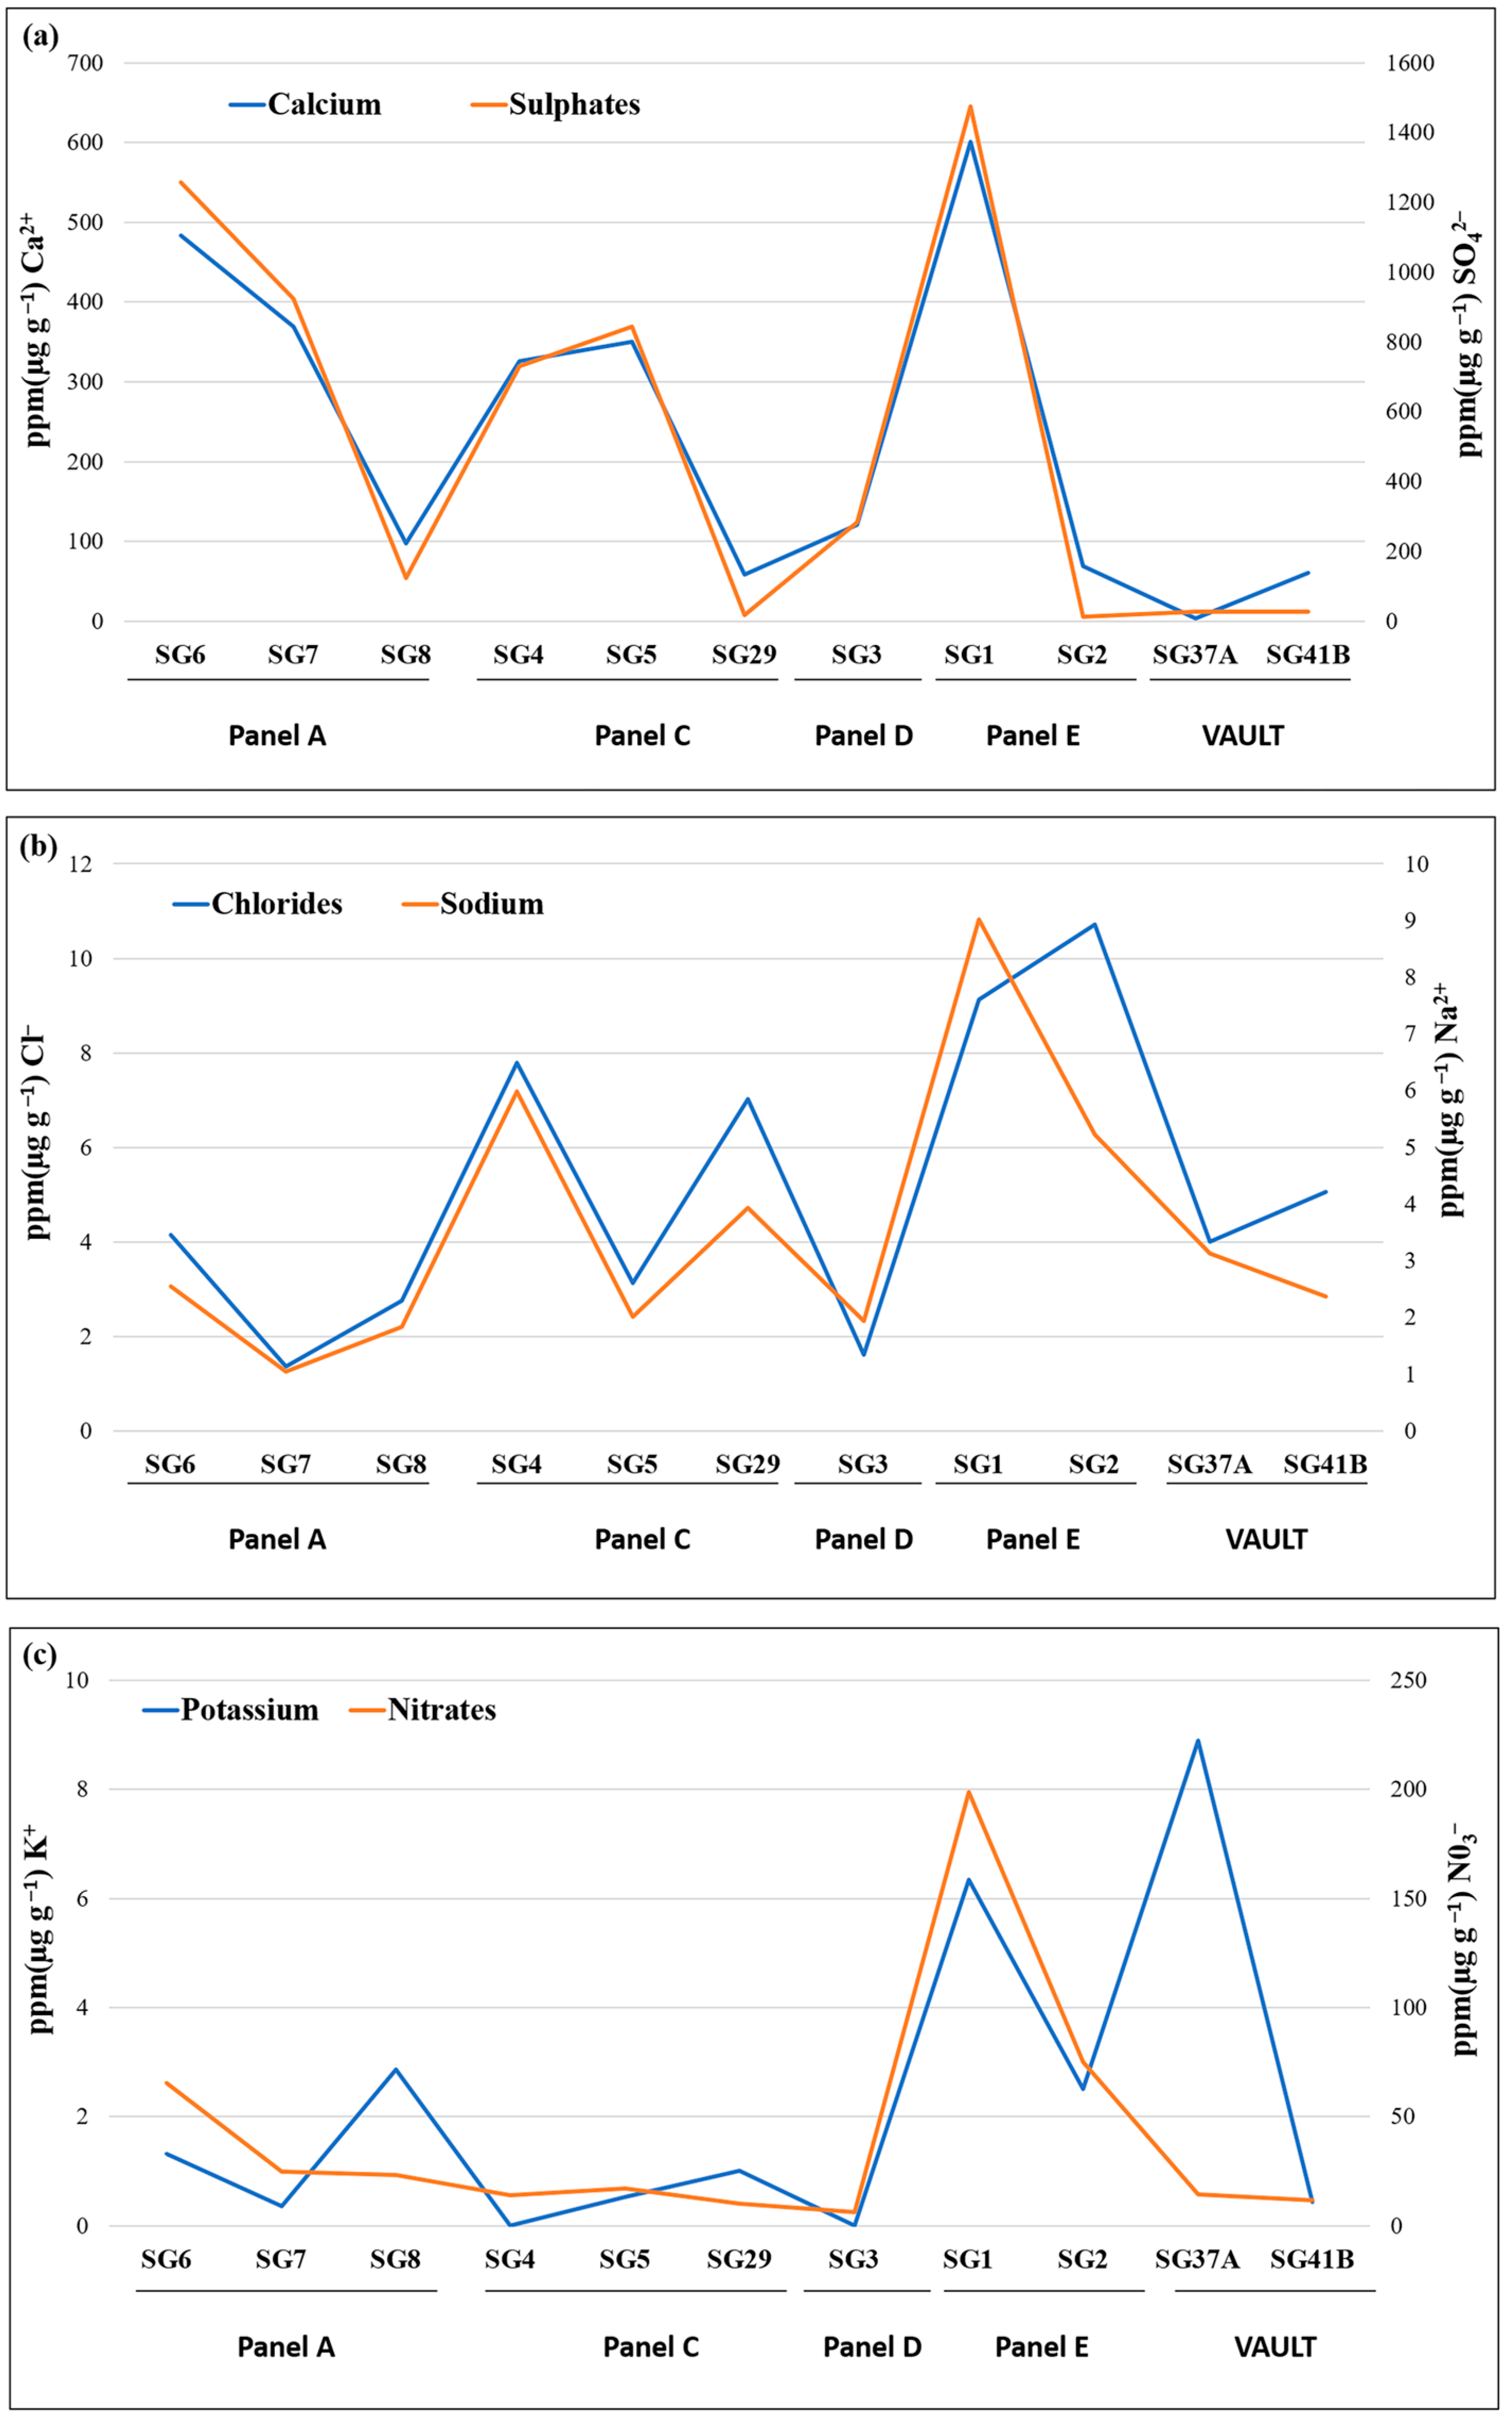
3.1. Ion Chromatography Analysis

The results of the determination of the main ionic species are shown in Table 2.
The concentrations of anions (Table 2) varied between the different samples; even between those taken from the same panel, but at different heights. For almost all the samples, sulphates were the species present in highest concentration, with higher values (>700 ppm) found in samples collected near the ground: SG_6 and 7 (Panel A), SG_4 (Panel C), SG_3 (Panel D), SG_1 (Panel E). Overall, it is possible to appreciate a relationship between sulphate concentration and sampling height. Indeed, the samples taken close to the window splays or in the vault showed, on average, lower concentrations of sulphates compared to samples taken at lower heights. A clear trend in terms of sampling height could not be observed for chlorides and nitrates. In this case, the differences between the samples are related to sampling site (panel), with Panels A and E showing the highest average concentrations of both species.
Moving on to cations, almost all the samples showed high concentrations of calcium ions (above 50 ppm, except for SG_37A). A correlation can be observed between the concentrations of calcium and sulphate ions. Indeed, as was the case for sulphates, it is possible to observe, on average, a relationship with sampling height, with calcium content being lower for samples taken at greater heights. All other cations were found in concentrations below 10 ppm, therefore secondary with respect to calcium. In this case, no significant correlations between concentration values and sampling height or sampling site (panel) could be appreciated.

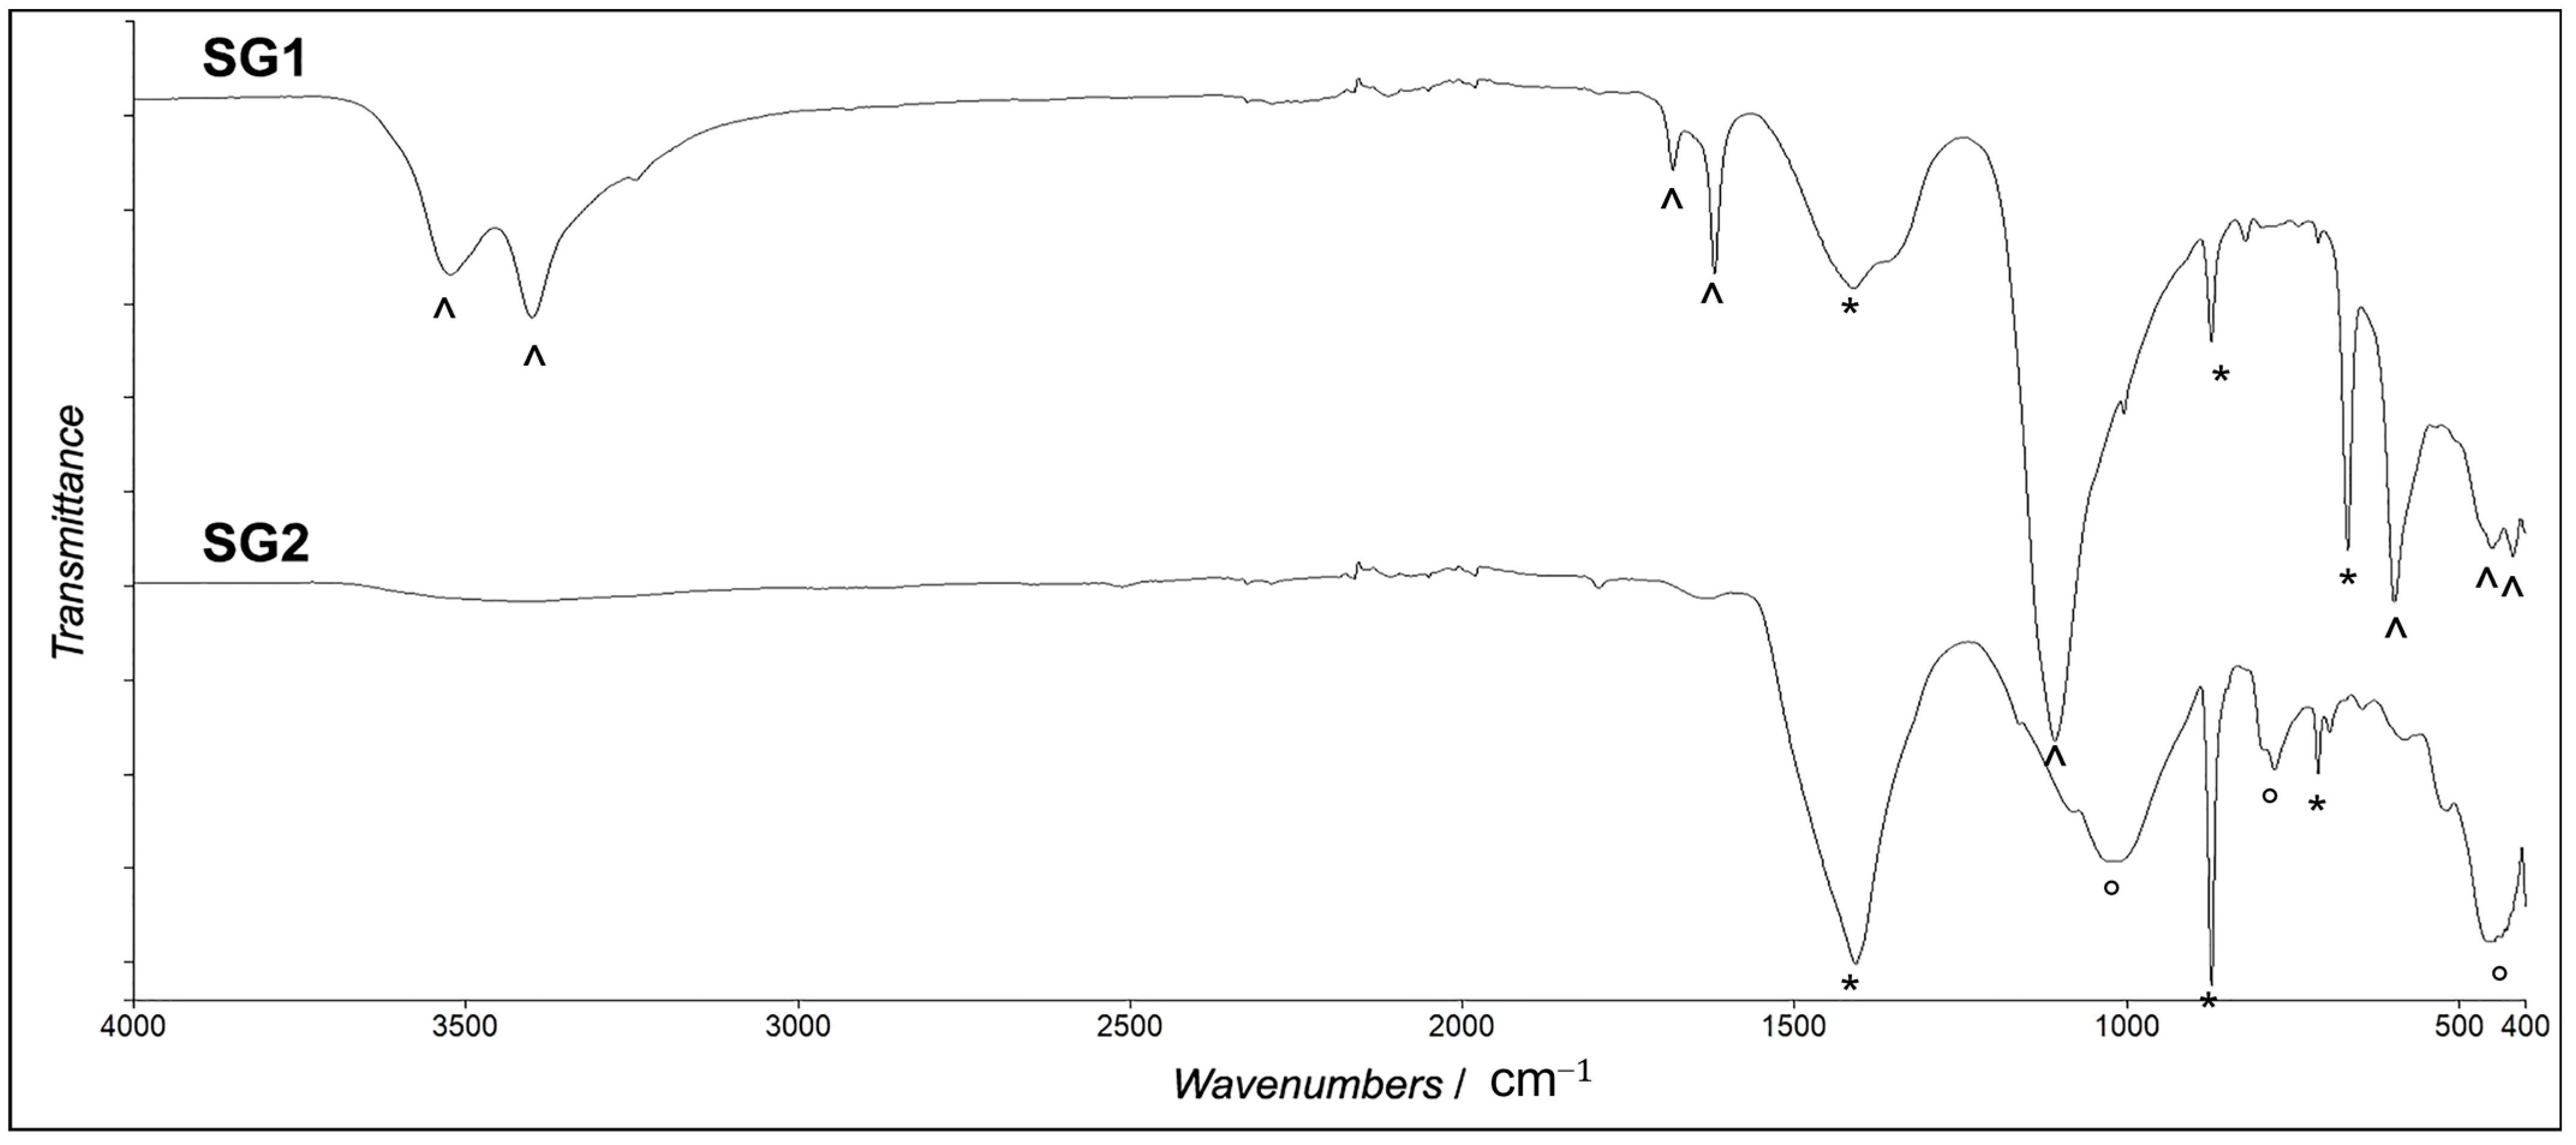
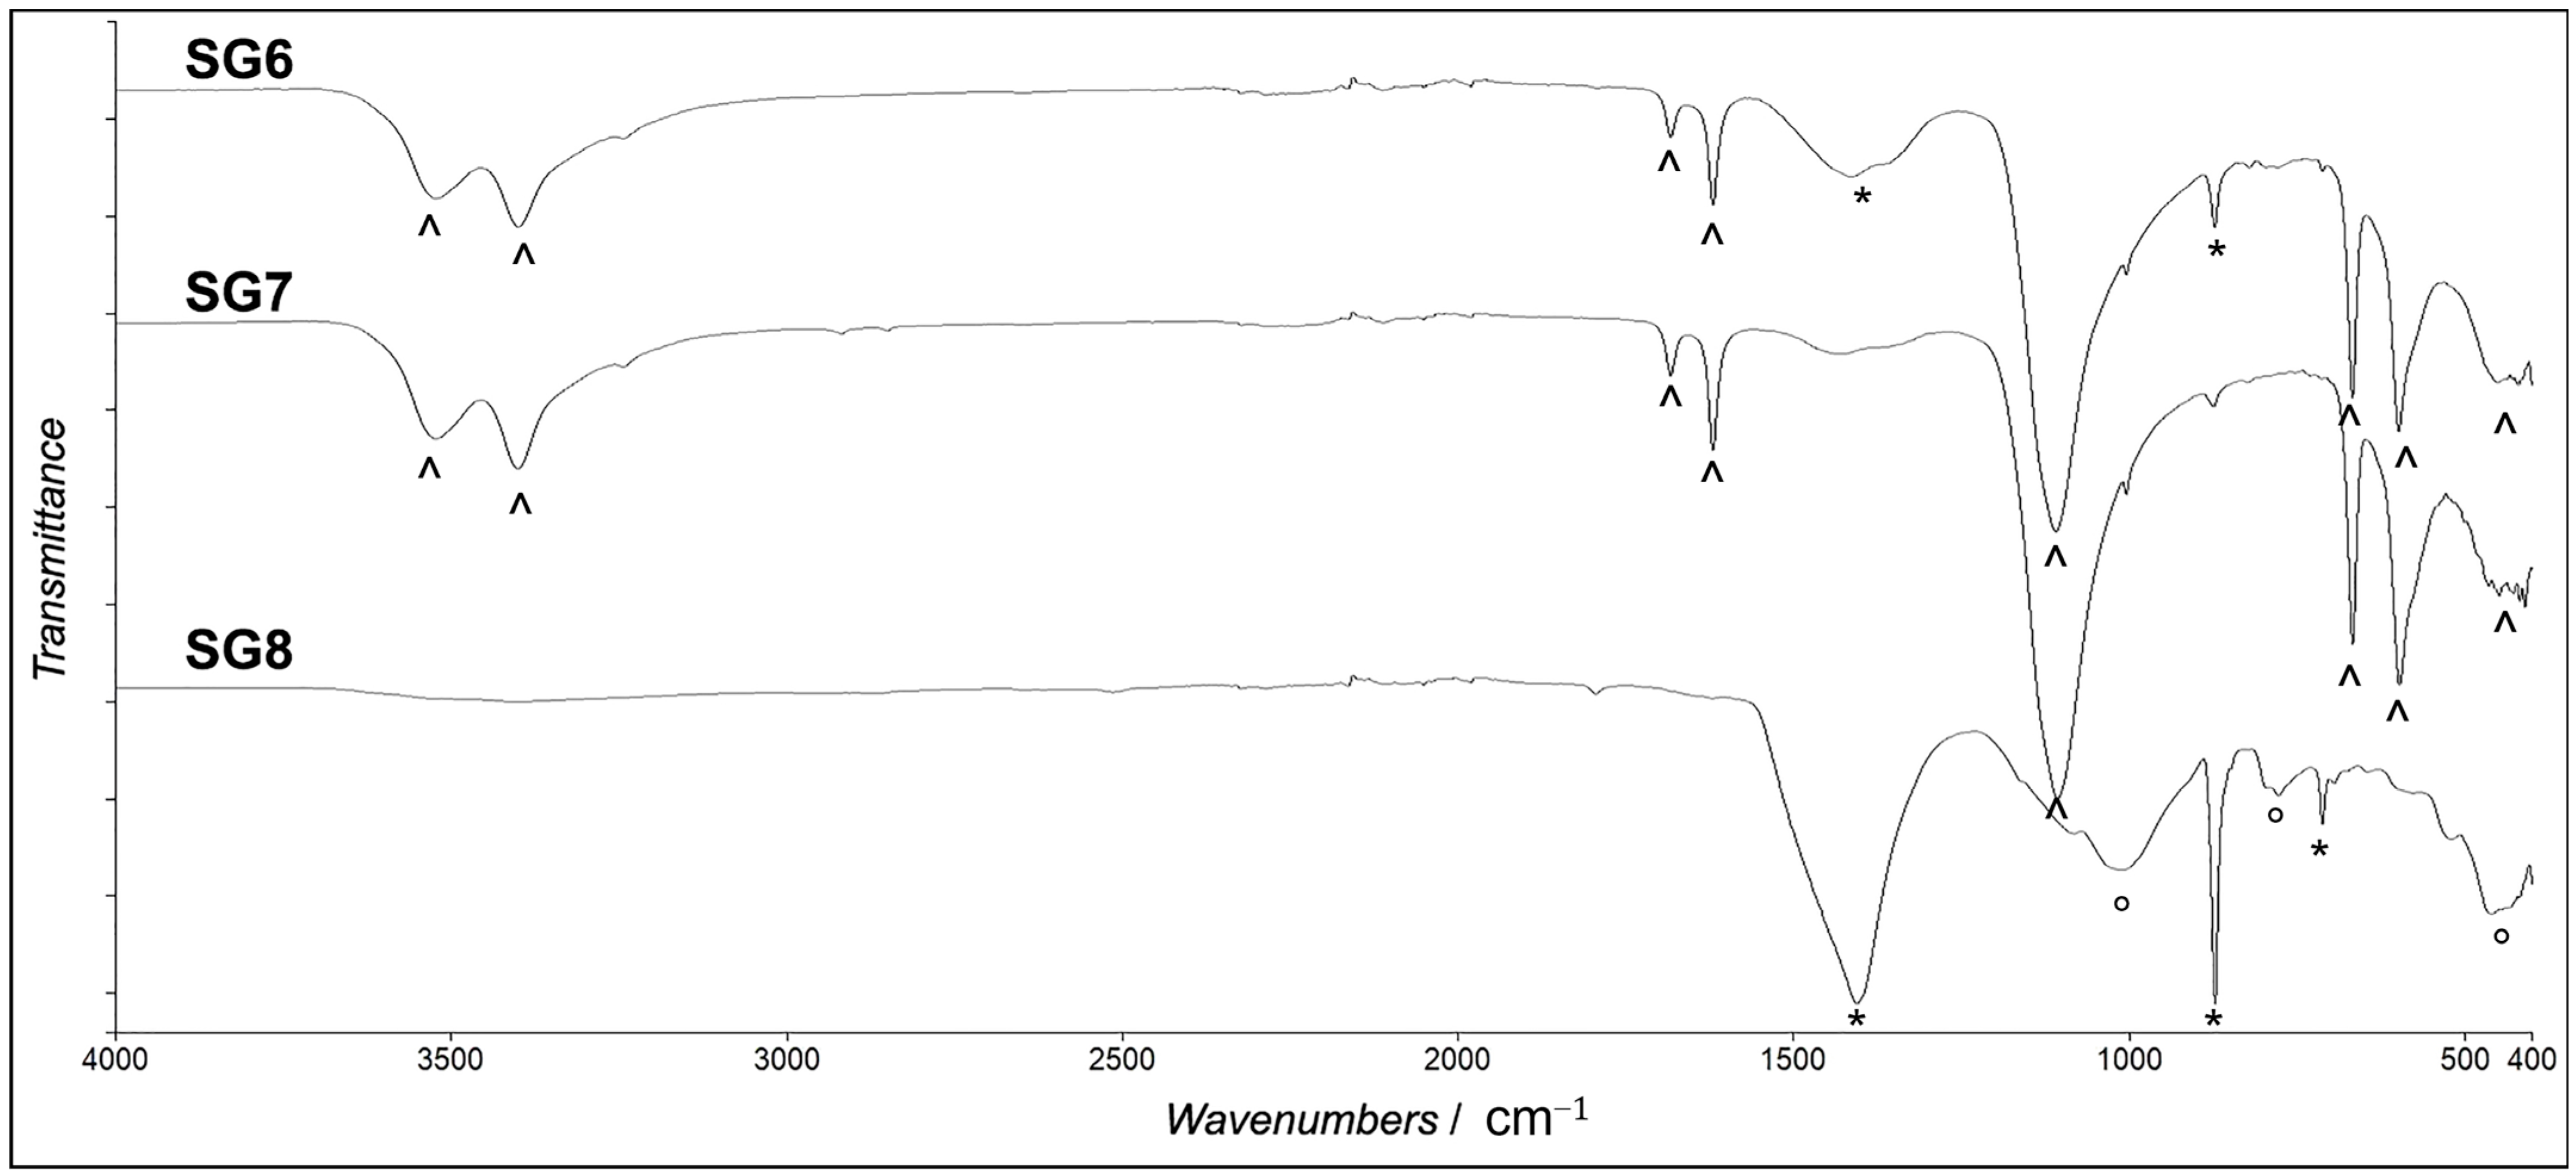
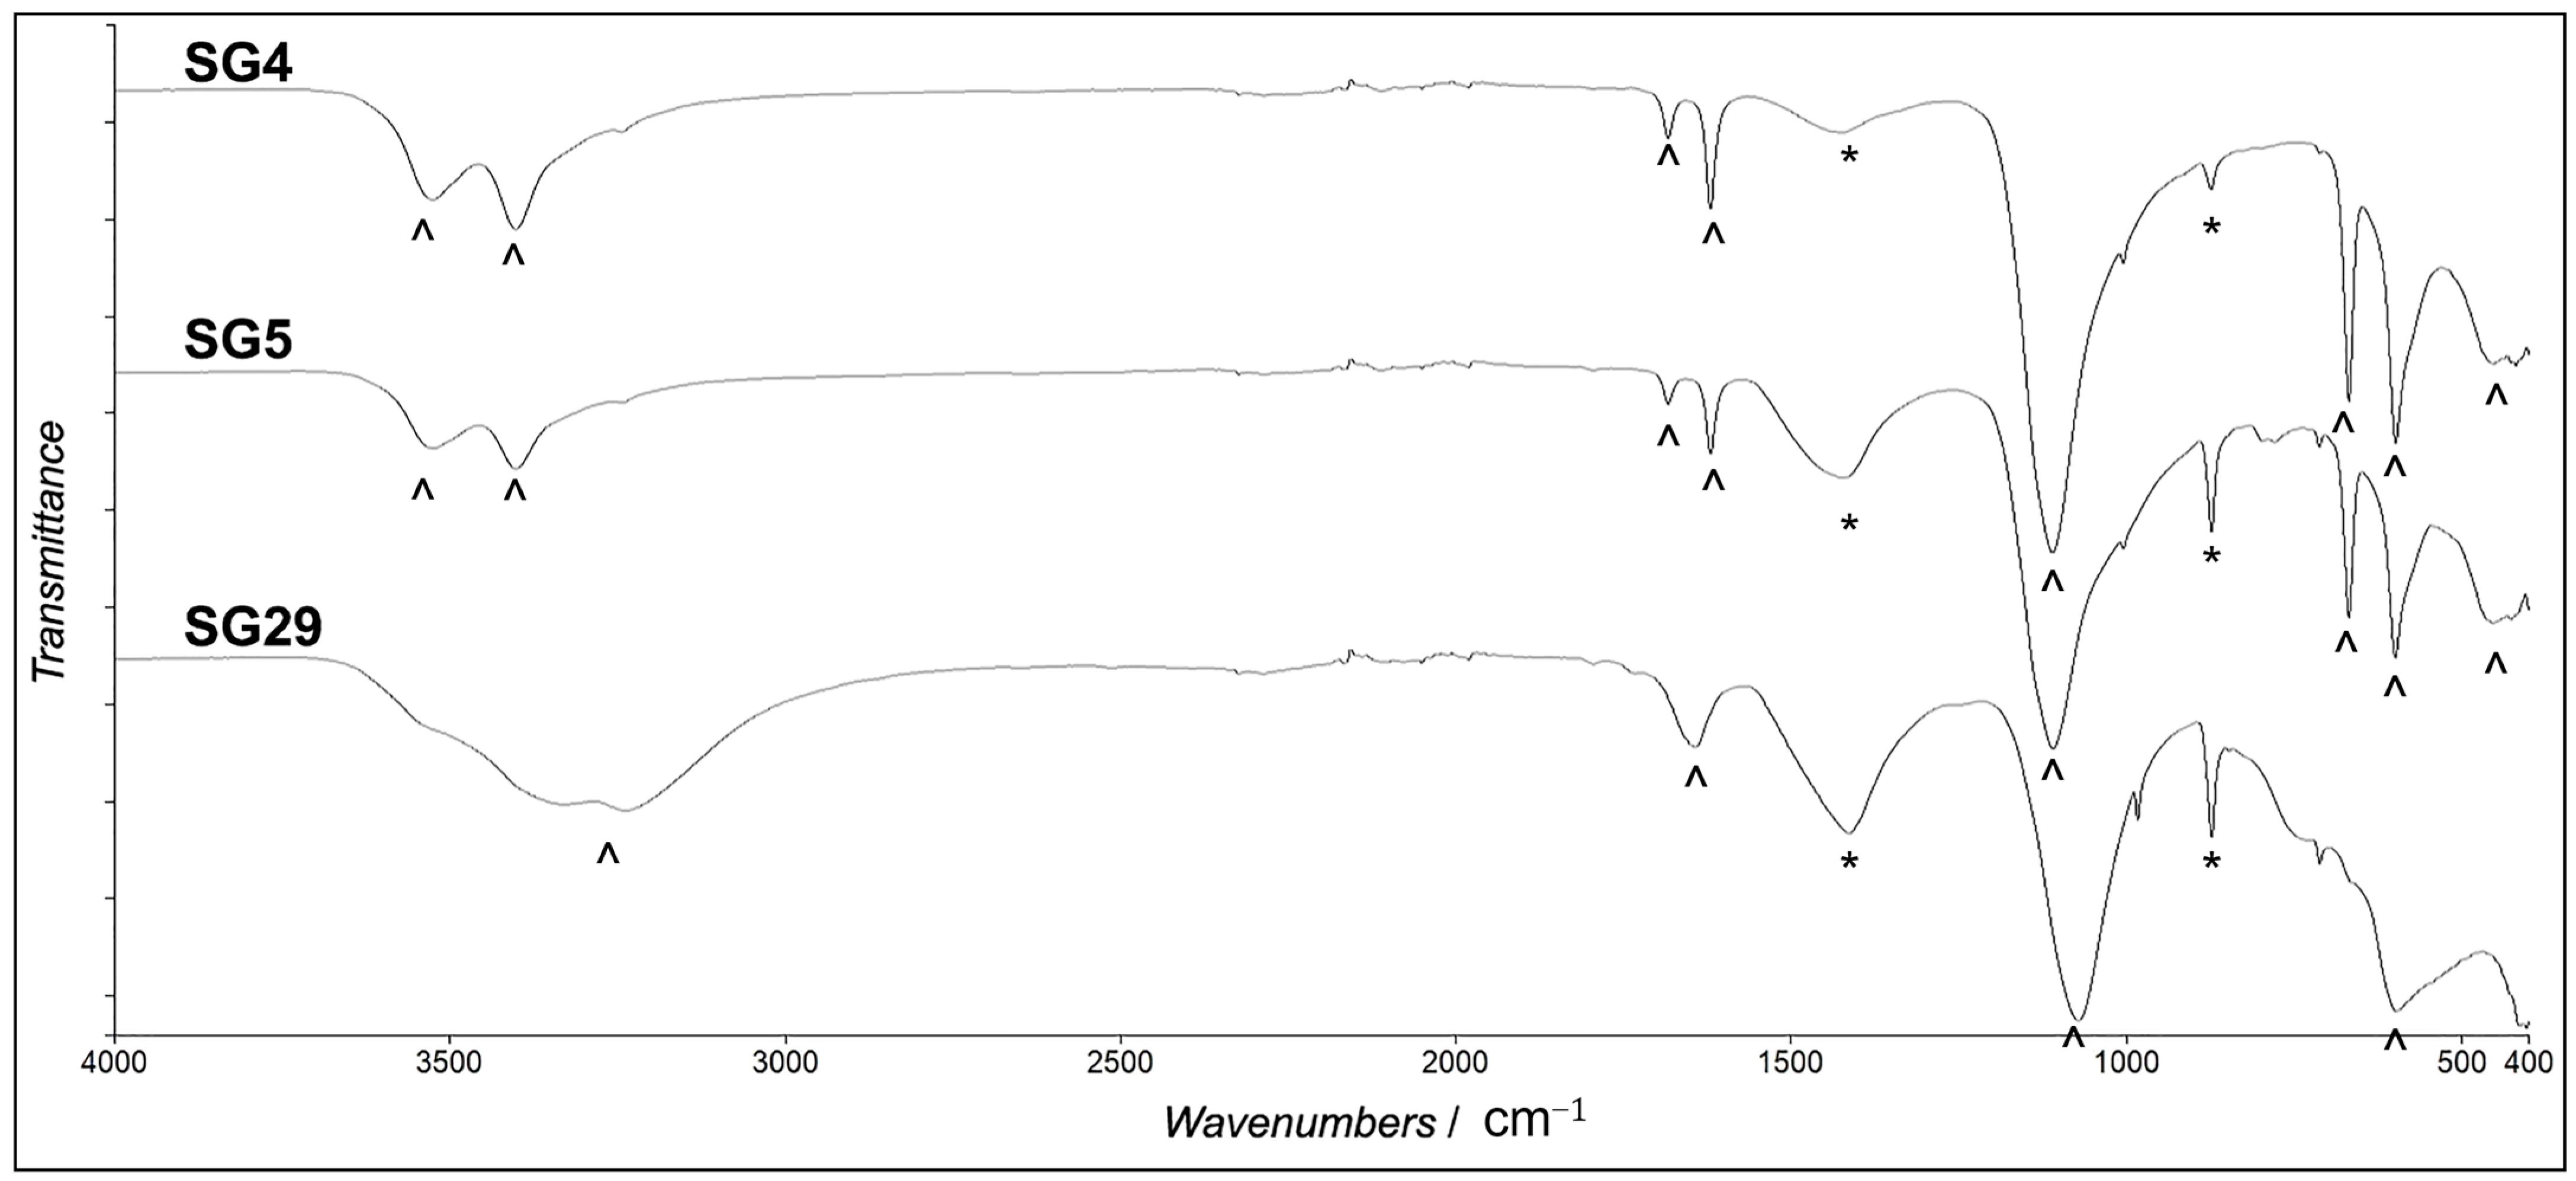
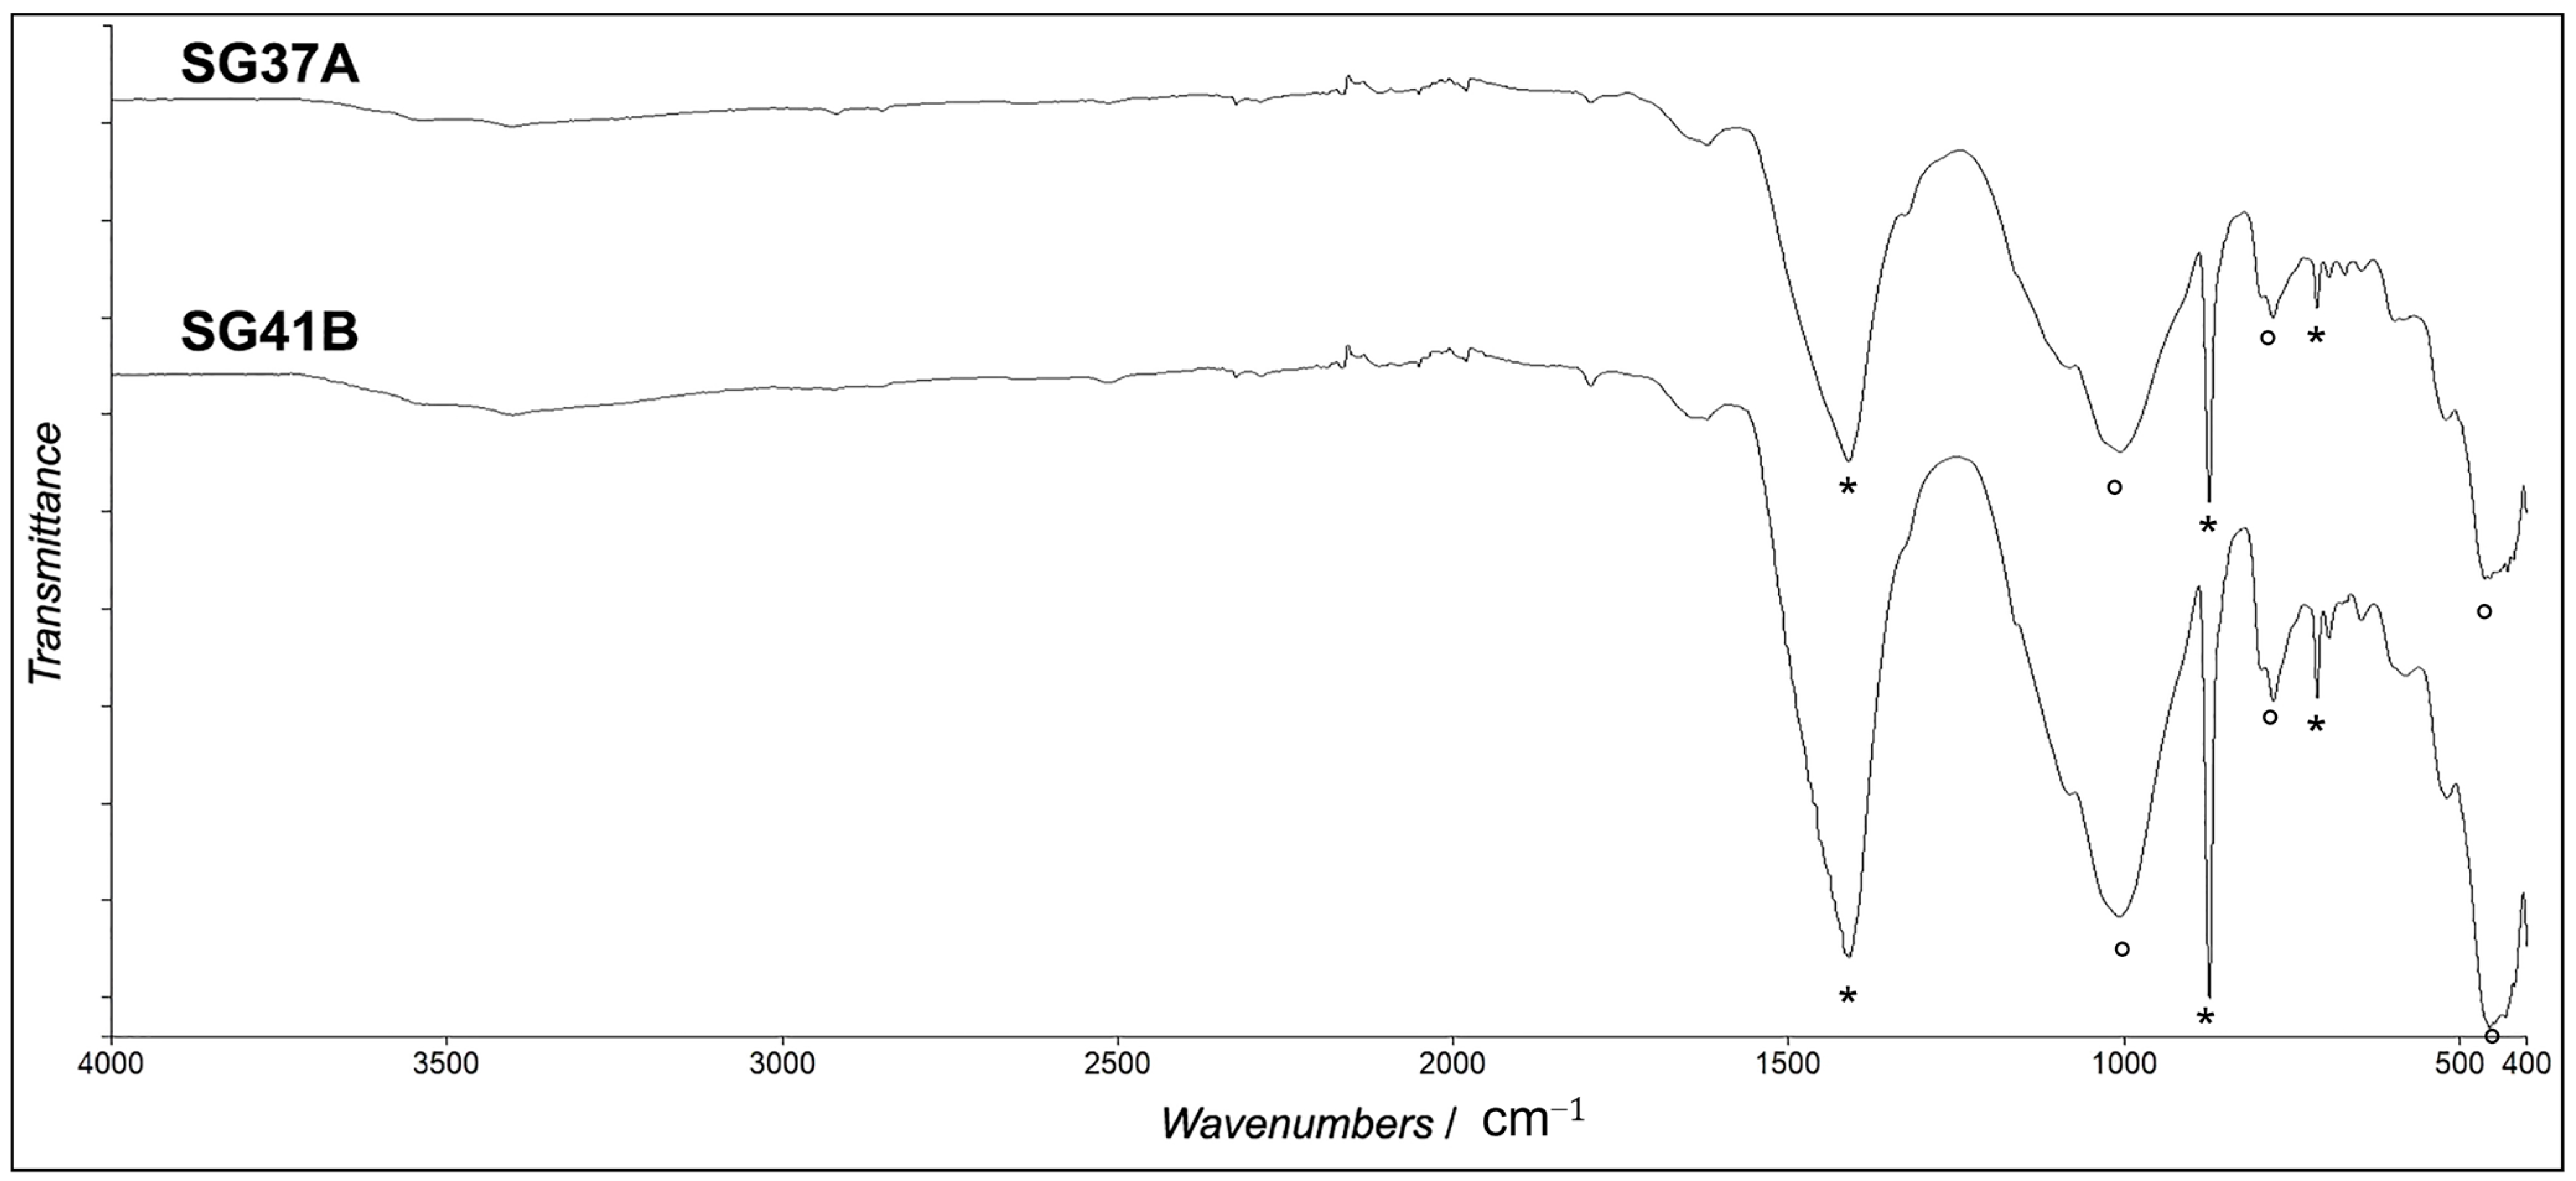
3.2. ATR-FTIR Analysis

The samples were also analyzed using attenuated total reflectance Fourier-transform infrared spectroscopy (ATR-FTIR). Table 3 summarizes the characteristic bands observed in the different samples. For most of the samples (SG_1, SG_3, SG_4, SG_5; SG_6, SG_7 and SG_29), typical gypsum bands were observed, in agreement with the IC results. Indeed, these samples showed high concentrations of sulphates (above 100 ppm), whereas samples SG_2, SG_8, SG_37A and SG_41B were associated with sulphate concentrations below 30 ppm. Based on the combined results of both IC and ATR-FTIR techniques, it is possible to assume that most of the ionic sulphate concentration derives from gypsum formation. Moreover, the characteristic calcite bands were recognized in all samples, which explains the nature of the high calcium concentrations observed in IC analysis. Finally, samples SG_2, SG_7, SG_8, SG_29, SG_37A and SG_41B also showed silicate bands, probably attributable to the substrate.

4. Discussion

The investigations carried out on the samples made it possible to characterize the different phases of salt crystallization in the walls of the Church of San Panfilo in Villagrande di Tornimparte. These were often related to the sampling height. General graphs of samples from the same area taken at different heights are shown below. It is interesting to observe how some samples, e.g., SG_1 and SG_2 (Figure 2) taken from Panel E, despite coming from the same area, near the ground, show different salt crystallization conditions.
In fact, sample SG_1 shows a good concentration trend between calcium and sulphate ions and lower concentrations of the other ions (Figure 2). This observation allowed us to hypothesize that the area under investigation is affected by the sulphation process, which leads to the formation of newly formed crystalline gypsum in the form of efflorescence. This hypothesis is confirmed when observing the ATR-FTIR spectrum acquired for this sample (Figure 3, Table 3). The characteristic peaks of the gypsum centered at 3522, 3400, 1683, 1620, 1108, 667, 597 and 418 cm−1 can all be observed [18,19]. In addition, O–H stretching and bending vibrations of calcium carbonate were found, with peaks at 1412, 872 and 712 cm−1 [19,20]. These peaks can also be attributable to newly formed carbonate salts and not to the substrate, since the samples were taken at salt efflorescence.
In contrast, sample SG_2 shows low concentrations of these ions; in particular, sulphate ions (Figure 2). In fact, the typical bands of gypsum were not observed (Figure 3, Table 3). Sample SG_2, on the other hand, shows the classic carbonate peaks (Figure 3, Table 3), which can be attributable to efflorescence produced by carbonate salts. Indeed, it is known in the literature [14] that the area closer to the ground is where the relatively less soluble salts, such as calcium carbonate and gypsum, tend to form and precipitate as newly formed crystals, generating salt efflorescence which causes the observed detachment of the painted surface. The tensions generated by the increase in size of the salt crystals in the pores of the material can cause the detachment of the most superficial parts of the plaster and/or colored finishes, or, in the most severe cases, can even damage part of the load-bearing masonry. As was demonstrated by Kilian et.al. (2023), gypsum accumulation can cause hardening of the surface, which tends to decrease the superficial porosity of the material. The formation of such crusts reduces water evaporation from the surface and consequently increases sub-efflorescence formation [21].
Moving on to Panel A, the samples taken from this sampling site at different heights show different concentrations of calcium and sulphate ions (Figure 4).
In fact, samples SG_6 and SG_7, taken a few cm above ground level, show higher values of these ions than sample SG_8, which was taken at a greater height close to a window splay (Figure 4). This result indicates that the wall of Panel A close to the ground level are affected by efflorescence produced by sulphation, which produces newly formed gypsum crystals that lead to the detachment of the painted surface [22]. For these samples, the presence of gypsum is confirmed by infrared analysis (Figure 5, Table 3). Typical calcite bands were observed (Figure 5, Table 3) [19,20], and can be attributed to carbonate salts, which contribute to the degradation of the wall.
A similar result was obtained by analyzing samples taken from Panel C. Samples SG_4 and SG_5 were taken at lower heights, near the ground level, whereas sample SG_29 was retrieved at a greater height, near the window splay (Figure 6 and Figure 7, Table 3). In this case, sample SG_4 shows significantly higher concentrations of both calcium and sulphate ions, with respect to samples SG_5 and SG_29. These results indicate an even stronger relationship between sampling height and ionic concentration (calcium and sulphate), once again reaffirming the previous conclusions that gypsum neoformation salts deriving from capillary rise tend to be located closer to the ground, in the vicinity of the walking surface. The pressure exerted by these salts causes the rupture of the porous material, leading to the degradation of the walls and, therefore, serious damage to the work of art, in this case the fresco. Indeed, the sampling site from which sample SG_4 was retrieved appears highly degraded, and most of the pictorial layer is no longer visible (Figure 1). In contrast, the area from which sample SG_5 was taken shows signs of superficial degradation, but the pictorial layer is still intact. Compared to the other samples taken close to the window splays (SG_8) or from the vault (SG_37A, SG_41B), sample SG_29 shows relatively high concentrations of calcium and sulphate. This may be attributable to external infiltrations that are specific to this sampling site.
The sample taken from Panel D (SG_3) also showed high concentrations of sulphate and calcium ions (Figure 8a), attributable to the same degradation phenomena, which was also confirmed by observing the spectrum obtained by infrared spectroscopy (Figure 8b, Table 3). In fact, the sampled area is characterized by the complete loss of the plaster and of the pictorial layer caused by the crystallization cycles of these salts (Figure 1).
Finally, samples taken at the top of the vault do not show high values of sulphate and calcium ions (moderate concentrations were only obtained in sample SG_37A) (Figure 9).
Based on the results obtained, it is difficult to assume the precipitation of a specific salt. In fact, from the infrared spectra of samples taken from the detached surface (Figure 10, Table 3), carbonate bands were observed [19,20] that can be attributed either to newly formed carbonate crystals or to the paint substrate.
The graph shown in Figure 11a indicates that the calcium and sulphur trends are perfectly aligned for many of the analyzed samples in which efflorescence produced by poorly soluble gypsum salts was assumed. Gypsum has a low solubility and hygroscopicity compared to most salts, and its deliquescence occurs at a very high relative humidity (over 99.9%, according to [12]). Hence, it is stable in a variety of environments, even extremely humid ones. It should be noted that studies in literature [12] show that the decay rate of wall paintings due to salt contamination originating from gypsum crystallization causes significant deterioration, but also that it is 10 to 100 times slower than that caused by more soluble salts. In fact, the areas where newly formed gypsum was found did show efflorescence, but detachment of the paint surface was not always very evident (except for the area where SG_4 and SG_3 was sampled). This is supported by other studies which indicate that the deterioration caused by gypsum in stone and similar building materials is not produced by hydration pressures [12], but is the result of its crystallization within the porous matrix of the material, as with any other non-hydrating salt. Because of these characteristics, once gypsum is deposited in the pores of a building material or on a pictorial surface, such as a fresco, it will tend to accumulate over time. Its extremely low mobility also explains why desalination of materials contaminated with calcium sulphate is very difficult [12,23,24].
Furthermore, a comparison was made between the concentrations of sodium and chloride ions (Figure 11b), and a good correlation was observed for samples taken from Panel A (SG_6, SG_7, SG_8), Panel C (except for sample SG_29) and the samples taken from the top of the vault (SG_37A). This suggests that sodium chloride salts, such as halite, are present in these areas in addition to newly formed gypsum. Finally, the samples that showed correlations between potassium and nitrate ions (Figure 11c) were those taken from Panel A (SG_6 and SG_7, with the exception of sample SG_8), the samples taken from Panel C (SG_5 and SG_29, with the exception of sample SG_4) and the samples taken from Panel E (SG_1 and SG_2, which show the highest concentrations of these species). For these samples, the presence of salts such as niter is assumed. Moreover, chloride and nitrate salts (particularly with sodium and magnesium) are more soluble and deliquescent than others and do not usually precipitate on the surface of the wall [25]. However, when the outdoor climate becomes exceptionally dry, efflorescence of this nature can be observed on surfaces. This means that these salts accumulate locally over prolonged periods of time, which can be as long as several decades, and tend to keep the masonry moist at all times, except in very dry conditions [12]. The types of decay that form on masonry usually result in swelling and detachment of the plaster, as was observed on the panels of the walls studied. The distribution of salts within a wall also depends on the actual mixture of salts present and their origin. As discussed by Steiger [26], based on the in-depth analysis of the north façade of a convent in northern Bavaria and other monuments [12], the presence of nitrate, potassium, and magnesium, as well as chloride and sodium, depends on the mixture of salts present and their origins, and is the result of rising damp.
Regarding the mechanism of the saline degradation [14], the results obtained in this study allow us to hypothesize that the degradation produced by the salts on the walls of this monument can be attributed mainly to capillary rise. Fractionation during ascending transport is revealed by the shift in the potassium/magnesium (K/Mg) ratio, which decreases with increasing height [12]. In fact, this ratio, calculated based on the data obtained from the different samples, showed a decrease in this parameter with increasing height. In the samples taken from Panel E (SG_1 and SG_2, K/Mg ratio = 1.03; 0.89, respectively), Panel C (SG_4 and SG_5, K/Mg ratio = 0.98; 0.24, respectively) and Panel A (SG_6 and SG_7, K/Mg ratio = 0.63; 0.38, respectively), the K/Mg ratio indicates an ascending transport of salts due to capillary rise from the ground. Finally, for the samples taken from the splays of the windows (SG_8, Panel A; SG_29, Panel C) or from the top of the vaults (SG_37A, SG_41B), it can be assumed that the detachment observed on the surfaces cannot be attributed to capillary rise from the ground, but is probably attributable to infiltration.

5. Conclusions

Thanks to the use of two analytical techniques (IC and ATR-FTIR), it was possible to characterize the degradation due to salt crystallization of the masonry of the fresco by Saturnino Gatti in the church of San Panfilo in Villagrande di Tornimparte (L’Aquila). The results highlighted the different types of efflorescence that probably caused the detachment of the painted surface and of the plaster.
Specifically, areas were identified where efflorescence was mainly caused by newly formed crystals of gypsum and calcium carbonate. These two types of salts were found in almost all the samples analyzed. Higher concentrations of gypsum were present, especially for those samples taken at a lower height, such as Panels A, C, D and E. Efflorescence composed of newly formed sodium chloride, halite, was present in samples SG_4, 5, 6, 7, 8 and 37A, with varying concentrations (higher concentrations for samples SG_6 and 8). This evidence was observed in the samples taken at slightly greater heights, with higher values detected in Panels A and C and in the sample taken from the upper vault (SG_37A). Efflorescence composed of potassium nitrate was present in samples SG_1 (higher concentrations) and SG_2, 6 and 7 (lower concentrations) (Panels E and A).
Finally, the results suggested that the degradation produced by efflorescence was due mainly to the capillary rise from the ground, with the exception of the samples taken close to the window splays and from the vault, in which infiltration could be responsible. The research carried out will allowed us to provide indications in order to perform targeted interventions regarding possible restoration work aimed at desalinizing the church walls.

Author Contributions

Conceptualization, V.C. and P.F.; methodology, A.B., C.A.L. and M.B.; validation, V.C., A.B. and P.F.; formal analysis, C.A.L. and M.B.; investigation, V.C. and A.B.; resources, V.C. and A.B.; data curation, V.C.; writing—original draft preparation, V.C., P.F. and A.B.; writing—review and editing, V.C. and A.B.; supervision, V.C. and P.F.; project administration, P.F. All authors have read and agreed to the published version of the manuscript.

Funding

This work was performed in the framework of the Project Tornimparte—“Archeometric investigation of the pictorial cycle of Saturnino Gatti in Tornimparte (AQ, Italy)” sponsored in 2021 by the Italian Association of Archeometry AIAR (www.associazioneaiar.com, last accessed: 27 May 2023).

Institutional Review Board Statement

Not applicable.

Informed Consent Statement

Not applicable.

Data Availability Statement

Data sharing is not applicable. No new data were created or analyzed in this study. Data sharing is not applicable to this article.

Conflicts of Interest

The authors declare no conflict of interest.

References

  1. Galli, A.; Alberghina, M.F.; Re, A.; Magrini, D.; Grifa, C.; Ponterio, R.C.; La Russa, M.F. Special Issue: Results of the II National Research project of AIAr: Archaeometric study of the frescoes by Saturnino Gatti and workshop at the church of San Panfilo in Tornimparte (AQ, Italy). Appl. Sci. 2023. to be submitted. [Google Scholar]
  2. D’Agostino, D.; Congedo, P.M.; Cataldo, R. Computational Fluid Dynamics (CFD) Modeling of Microclimate for Salts Crystallization Control and Artworks Conservation. J. Cult. Herit. 2014, 15, 448–457. [Google Scholar] [CrossRef]
  3. Flatt, R.J.; Caruso, F.; Sanchez, A.M.A.; Scherer, G.W. Chemo-Mechanics of Salt Damage in Stone. Nat. Commun. 2014, 5, 4823. [Google Scholar] [CrossRef]
  4. Kotulanova, E.; Schweigstillova, J.; Švarcová, S.; Hradil, D.; Bezdička, P.; Grygar, T. Wall painting damage by salts: Causes and mechanisms. Acta Res. Rep. 2009, 18, 27–31. [Google Scholar]
  5. D’Altri, A.M.; de Miranda, S.; Beck, K.; De Kock, T.; Derluyn, H. Towards a More Effective and Reliable Salt Crystallisation Test for Porous Building Materials: Predictive Modelling of Sodium Chloride Salt Distribution. Constr. Build. Mater. 2021, 304, 124436. [Google Scholar] [CrossRef]
  6. Benavente, D.; Cueto, N.; Martinez-Martinez, J.; Garcia del Cura, M.A.; Canaveras, J.C. The influence of petrophyrical properties on the salt weathering of porous building rocks. Environ. Geol. 2007, 52, 215–224. [Google Scholar] [CrossRef]
  7. Giustetto, R.; Moschella, E.M.; Cristellotti, M.; Costa, E. Deterioration of building materials and artworks in the ‘Santa Maria della Stella’ chuch, Saluzzo (Italy): Causes of decay and possible remedies. Stud. Conserv. 2017, 62, 474–493. [Google Scholar] [CrossRef]
  8. Yu, W.; Yang, L.; Zhao, J.; Luo, H. Study on the Visualization of Transport and Crystallization of Salt Solution in Simulated Wall Painting. Crystals 2022, 12, 351. [Google Scholar] [CrossRef]
  9. Prieto-Taboada, N.; Fdez-Ortiz De Vallejuelo, S.; Veneranda, M.; Marcaida, I.; Morillas, H.; Maguregui, M.; Castro, K.; De Carolis, E.; Osanna, M.; Madariaga, J.M. Study of the Soluble Salts Formation in a Recently Restored House of Pompeii by In-Situ Raman Spectroscopy. Sci. Rep. 2018, 8, 1613. [Google Scholar] [CrossRef]
  10. Bosch-Roig, P.; Lustrato, G.; Zanardini, E.; Ranalli, G. Biocleaning of Cultural Heritage Stone Surfaces and Frescoes: Which Delivery System Can Be the Most Appropriate? Ann. Microbiol. 2015, 65, 1227–1241. [Google Scholar] [CrossRef]
  11. Kilian, R.; Borgatta, L.; Wendler, E. Investigation of the Deterioration Mechanisms Induced by Moisture and Soluble Salts in the Necropolis of Porta Nocera, Pompeii (Italy). Herit. Sci. 2023, 11, 72. [Google Scholar] [CrossRef]
  12. Scherer, G.W. Stress from Crystallization of Salt. Cem. Concr. Res. 2004, 34, 1613–1624. [Google Scholar] [CrossRef]
  13. Maguregui, M.; Knuutinen, U.; Martínez-Arkarazo, I.; Giakoumaki, A.; Castro, K.; Madariaga, J.M. Field Raman Analysis to Diagnose the Conservation State of Excavated Walls and Wall Paintings in the Archaeological Site of Pompeii (Italy). J. Raman Spectrosc. 2012, 43, 1747–1753. [Google Scholar] [CrossRef]
  14. Arnold, A.; Zehnder, K. Monitoring Wall Paintings Affected by Soluble Salts. In The Conservation of Wall Paintings; Proceedings of a Symposium Organized by the Courtauld Institute of Art and the Getty Conservation Institute, London, July 13–16 1987; Getty Conservation Institute: Los Angeles, CA, USA, 1991; pp. 103–135. ISBN 0-89236-162-X. [Google Scholar]
  15. Correns, C.W. Growth and diffusion of crystals under linear pressure. Faraday Discuss. 1949, 5, 267. [Google Scholar] [CrossRef]
  16. Winkler, E.M.; Wilhelm, E.J. Salt burst by hydration pressures in architectural stone in urban atmosphere. GSA Bull. 1970, 81, 567–572. [Google Scholar] [CrossRef]
  17. Everett, D.H. The thermodynamics of frost damage to porous solids. Trans. Faraday Soc. 1961, 57, 1541. [Google Scholar] [CrossRef]
  18. Vahur, S.; Teearu, A.; Peets, P.; Joosu, L.; Leito, I. ATR-FT-IR Spectral Collection of Conservation Materials in the Extended Region of 4000–80 °C m–1. Anal. Bioanal. Chem. 2016, 408, 3373–3379. [Google Scholar] [CrossRef]
  19. Rovella, N.; Aly, N.; Comite, V.; Ruffolo, S.A.; Ricca, M.; Fermo, P.; de Buergo, M.A.; Russa, M.F. La A Methodological Approach to Define the State of Conservation of the Stone Materials Used in the Cairo Historical Heritage (Egypt). Archaeol. Anthr. Sci. 2020, 12, 178. [Google Scholar] [CrossRef]
  20. Chukanov, N.V.; Chervonnyi, A.D. Infrared Spectroscopy of Minerals and Related Compounds; Springer: Berlin/Heidelberg, Germany, 2016. [Google Scholar]
  21. Modestou, S.; Theodoridou, M.; Ioannou, I. Micro-Destructive Mapping of the Salt Crystallization Front in Limestone. Eng. Geol. 2015, 193, 337–347. [Google Scholar] [CrossRef]
  22. Charola, A.E.; Wendler, E. An Overview of the Water-Porous Building Materials Interactions. Restor. Build. Monum. 2016, 21, 55–65. [Google Scholar] [CrossRef]
  23. Charola, A.E.; Pühringer, J.; Steiger, M. Gypsum: A Review of Its Role in the Deterioration of Building Materials. Environ. Geol. 2007, 52, 339–352. [Google Scholar] [CrossRef]
  24. Chwast, J.; Todorović, J.; Janssen, H.; Elsen, J. Gypsum Efflorescence on Clay Brick Masonry: Field Survey and Literature Study. Constr. Build. Mater. 2015, 85, 57–64. [Google Scholar] [CrossRef]
  25. Ju, X.; Feng, W.; Zhang, Y.; Zhao, H. Stress from Crystllization in Ideal Pores. Yanshilixue Yu Gongcheng Xuebao/Chin. J. Rock. Mech. Eng. 2016, 35, 2787–2794. [Google Scholar] [CrossRef]
  26. Steiger, M. Distribution of salt mixtures in a sandstone monument: Sources, transport and crystallization properties. In European Commission Research Workshop: Origin, Mechanisms and Effects of Salts on Degradation of Monuments in Marine and Continental Environments. Protection and Conservation of the European Cultural Heritage. Research Report n° 4; European Commission Research Workshop: Bari, Italy, 1996; pp. 241–246. [Google Scholar]
Figure 1. Sampling points of Panels A,CE and the upper part of the vault on the walls of the Church of San Panfilo in Villagrande di Tornimparte (L’Aquila). The images were obtained with the photogrammetric survey.
Applsci 13 06623 g001
Figure 2. Ion concentration of samples SG_1 and SG_2 taken from Panel E. (a) Ppm (μg g−1) concentrations of sodium, ammonium, potassium, magnesium and calcium cations; (b) ppm concentrations (μg g−1) of chloride, nitrate and sulphate ions.
Applsci 13 06623 g002
Figure 3. ATR-FTIR spectra of samples SG_1 and SG_2 taken from Panel E. Marker bands of carbonates (*), silicates (°) and sulphates (^) are highlighted.
Applsci 13 06623 g003
Figure 4. Ion concentration of samples SG_6, SG_7 and SG_8 taken from Panel A. (a) Ppm (μg g−1) concentrations of sodium, ammonium, potassium, magnesium and calcium cations; (b) ppm concentrations (μg g−1) of chloride, nitrate and sulphate anions.
Applsci 13 06623 g004
Figure 5. ATR-FTIR spectra of samples SG_6, SG_7 and SG_8 taken from Panel A. Marker bands of carbonates (*), silicates (°) and sulphates (^) are highlighted.
Applsci 13 06623 g005
Figure 6. Ion concentrations of samples SG_4, SG_5 and SG_29 taken from Panel C. (a) Ppm (μg g−1) concentrations of sodium, ammonium, potassium, magnesium and calcium cations; (b) ppm concentrations (μg g−1) of chloride, nitrate and sulphate anions.
Applsci 13 06623 g006
Figure 7. ATR-FTIR spectra of samples SG_4, SG_5 and SG_229 taken from Panel C. Marker bands of carbonates (*) and sulphates (^) are highlighted.
Applsci 13 06623 g007
Figure 8. Sample SG3 taken from Panel D. (a) Ion concentrations of sodium, magnesium, chlorides, nitrates, calcium, sulphate in ppm (μg g−1); (b) ATR-FTIR spectrum: marker bands of carbonates (*) and sulphates (^) are highlighted.
Applsci 13 06623 g008
Figure 9. Ion concentration of samples SG_37A and SG_41B taken from the top of the vaults. (a) Ppm (μg g−1) concentrations of sodium, ammonium, potassium, magnesium and calcium cations; (b) ppm concentrations (μg g−1) of chloride, nitrate and sulphate anions.
Applsci 13 06623 g009
Figure 10. ATR-FTIR spectra of samples SG_37A and SG_41B taken from the top of the vaults. Marker bands of carbonates (*) and silicates (°) are highlighted.
Applsci 13 06623 g010
Figure 11. Trend of the concentrations (μg g−1) of certain ions observed in the samples analyzed. (a) Calcium and sulphate; (b) chloride and sodium; (c) potassium and nitrates.
Applsci 13 06623 g011
Table 1. Sampling details: sampling area, sample ID, description, and type of sample.
Sampling AreaSample IDDescriptionType of Sample
ASG_6Original area (pictorial layer and plaster) affected by detachments and fractures, with efflorescence.Powders and fragments
SG_7Integration area affected by partial detachment of the pictorial film. Exfoliations can be observed due to the presence of saline efflorescence.Powders
SG_8Original area (dark yellow pictorial layer and plaster), detached, affected by saline efflorescence, not cohesive, and fragile.Powders and fragments
CSG_4Integration area with yellow-brown pictorial finishing, affected by detachments and exfoliations—presence of salt efflorescence.Powders and fragments
SG_5Original area (pictorial layer and plaster) affected by detachments and fractures.Fragments of various dimensions
SG_29Saline efflorescence selectively retrieved from the surface.Powders and plaster residues
DSG_3Integration area without pictorial finishing and affected by detachment and exfoliation—presence of salt efflorescence.Powders
ESG_1Black paint layer and plaster layer; area affected by substrate detachment and efflorescence.Fragments of various dimensions
SG_2Plaster layer; area affected by complete detachment of the pictorial film and efflorescence.Powders (sampled up to 1 cm from the surface)
Vault, summitSG_37AGrey pictorial layer on degraded plaster, retrieved from degraded area with detachments of the superficial layers.Powders and fragments
Vault, summitSG_41BPurple pictorial layer on degraded plaster, retrieved from degraded area with detachments of the superficial layers.Powders and fragments
Table 2. Concentrations of cations (sodium, ammonium, potassium, magnesium and calcium) and anions (chloride, nitrate and sulphate) in ppm (μg g−1) in the analyzed samples.
CationsAnions
Sampling AreaSamples IDSodiumAmmoniumPotassiumMagnesiumCalciumChlorideNitrateSulphate
ASG_65.98n.d.1.322.08326.237.7865.21730.11
SG_72.010.170.350.93350.203.1324.84843.13
SG_83.930.402.861.6758.327.0223.0916.68
CSG_41.051.09n.d.0.67369.361.3614.15922.52
SG_51.83n.d.0.532.2297.772.7616.91123.47
SG_291.94n.d.1.01n.d.121.071.6210.05284.24
DSG_32.54n.d.n.d.0.71483.054.156.121256.41
ESG_19.020.486.346.11601.099.12198.781475.08
SG_25.220.402.512.8368.8010.7174.8912.14
Vault summitSG_37A3.132.208.90n.d.3.864.0114.2027.56
SG_41B2.371.110.442.5860.845.0611.8626.72
n.d. = not detected. Standard error = 5%.
Table 3. ATR-FTIR bands in the analyzed samples (cm−1).
Sampling AreaSamples IDSilicatesCarbonatesSulphates (Gypsum)
ASG_6 1412, 8723523, 3400, 1683, 1620, 1109, 667, 598, 420
SG_7 3522, 3400, 1683, 1620, 1107, 667, 597, 418
SG_81012, 777, 4591405, 872, 712
CSG_4 1426, 8733525, 3401, 1683, 1620, 1110, 668, 598, 419
SG_5 1421, 8733535, 3401, 1683, 1620, 1109, 668, 599, 454
SG_29 1413, 8723235, 1643, 1110, 598
DSG_3 1429, 8743517, 3400, 1683, 1619, 1105, 667, 597, 418
ESG_1 1410, 872, 7123522, 3400, 1683, 1620, 1108, 667, 597, 418
SG_21011, 777, 4581407, 872, 711
Vault summitSG_37A1005, 778, 4591411, 873, 712
SG_41B1007, 777, 4601410, 872, 712
Disclaimer/Publisher’s Note: The statements, opinions and data contained in all publications are solely those of the individual author(s) and contributor(s) and not of MDPI and/or the editor(s). MDPI and/or the editor(s) disclaim responsibility for any injury to people or property resulting from any ideas, methods, instructions or products referred to in the content.

