Article

An Investigation into the Mechanism of Alkaline Extraction-Isoelectric Point Precipitation (AE-IEP) of High-Thiol Plant Proteins

1
Sonochemistry Group, School of Chemistry, The University of Melbourne, Melbourne, VIC 3010, Australia
2
Algal Processing Group, Department of Chemical Engineering, The University of Melbourne, Melbourne, VIC 3010, Australia
*
Authors to whom correspondence should be addressed.
Appl. Sci. 2023, 13(11), 6469; https://doi.org/10.3390/app13116469
Submission received: 23 April 2023 / Revised: 21 May 2023 / Accepted: 22 May 2023 / Published: 25 May 2023

Abstract

:
Hempseed protein isolate (HPI) has drawn significant attention as a promising source of plant-based protein due to its high nutritional value. The poor functionality (e.g., solubility and emulsifying properties) of HPI has impeded its food application for years. This study provides important new information on hempseed protein extraction, which may provide further insights into the extraction of other high-thiol-based plant proteins to make valuable plant-based products with improved functional properties. In this study, HPI was produced from hempseed meals using the AE-IEP method. The underlying mechanisms and extraction kinetics were investigated under different experimental conditions (pH 9.0–12.0, temperature 24–70 °C, and time 0–120 min). The results suggested that disulphide bond formation is an inevitable side reaction during hempseed protein extraction and that the protein yield and the free -SH content can be influenced by different extraction conditions. A high solution pH and temperature, and long extraction time result in increased protein yield but incur the formation of more intermolecular disulphide bonds, which might be the reason for the poor functionality of the HPI. For instance, it was particularly observable that the protein solubility of HPI products reduced when the extraction pH was increased. The emulsifying properties and surface tension data demonstrated that the functionality of the extracted hempseed protein was significantly reduced at longer extraction times. A response surface methodology (RSM) optimization model was used to determine the conditions that could maximise HPI functionality. However, a three-fold reduction in protein yield must be sacrificed to obtain the protein with this high functionality.

1. Introduction

A growing demand for plant proteins possessing high nutritional and functional properties has urged scientists and the food industry to explore non-conventional protein sources. Hempseed, a by-product in the hempseed oil industry, has gained increasing attention in the past decades as a type of superfood, and it has a rich nutritional profile, excellent digestibility, and well-proportioned amino acid profile [1]. Previous studies have mainly focused on hempseed protein isolate (HPI) extraction yield and its physicochemical properties [2,3,4,5].
Whilst possessing a promising nutritional profile, the usefulness and value of hempseed protein isolate in advanced food applications are highly dependent on its functional properties, such as water solubility, emulsifying capacity, and gelling property in food systems. Recent investigations have suggested that hempseed proteins possess inferior structural and functional properties. At a neutral pH, HPI generally exhibits extremely poor solubility. Especially around its isoelectric point (pH 5.0), the solubility of HPI was found to be merely ~8% [6,7]. Malomo and Aluko [8] investigated the solubility of two protein fractions in hempseed protein by dialysing. The solubility of albumin (80% at pH 7) was found to be dramatically better than edestin (30% at pH 7), which indicated edestin might be responsible for the poor solubility of hempseed. On the other hand, the emulsifying capacity and stability were relatively low [9,10] and might cause a series of problems during processing, storage, and utilization. Although the reason for the HPI’s poor functionality has not been thoroughly investigated, some researchers have proposed a few reasonable assumptions. Globular edestin accounts for the majority (60–80%) of total hempseed protein content [11]. Edestin was identified to have a hexameric structure via crystallographic techniques [12], comprising six identical subunits. Each subunit contains an acidic and a basic subunit linked by a disulphide bond. Docimo et al. [13] identified two edestin types (CsEde1 and CsEde2) by isolating cDNA coding; CsEde2 exhibited abundant cysteine (1.07%), which exceeds the content in glycinin [14], indicating a higher probability of undergoing sulphide bond formation in hempseed protein. Tang et al. [15] reported that HPI contained a three-fold-higher free sulfhydryl (-SH) content than soy protein isolate (SPI), which suggested HPI is more prone to aggregation than conventional protein sources. Wang et al. [16] conducted an SDS-PAGE analysis, and smearing was observed at the top of the gel in both HPI and its protein constituents (HPI-7S, HPI-11S) but disappeared under a reducing environment. This phenomenon demonstrated disulphide bond (SS) formation in HPI products. Nevertheless, there is still a lack of sufficient evidence to irrefutably link the intermolecular disulphide bond formation and the poor functional properties in the HPI system.
Investigations into protein structural modifications have been carried out to address the limited functional properties of HPI. The hempseed protein structure can be modified by heating between 80 to 100 °C [17]. However, the improved functionality was found to be very limited, with the solubility at a neutral pH only slightly increased from 20.6% to 25.8% when heated at 80 °C for 60 min [18]. Yin et al. [19]. even observed that the solubility of heat-treated (90 °C, 10 min) HPI was lower than untreated HPI when pH was above neutral. Succinylation has been used in other plant proteins to improve their functionality via the introduction of a negatively charged succinate group [20,21]. Although the solubility of HPI was found to increase from 30% to 85% with the addition of succinic anhydride [22], the toxicity of succinic anhydride is problematic. Succinic anhydride can react with other substances in food, forming potentially harmful compounds, such as N-substituted succinimides [23]. Therefore, other methods are preferable during food processing. Besides heating, pH shifting has also been widely studied to improve the functionality of multiple plant proteins, such as rapeseed protein [24], soy protein [25], alfalfa protein [26], and pea protein [27]. Wang et al. [16] combined high temperature with pH shifting (7.0 to 12.0) and successfully increased HPI solubility up to 97% at a neutral pH due to the weakening of hydrogen bonds, and electrostatic repulsion. However, treatment at high temperatures and extreme pH values negatively influences the colour, ultimate flavour, and nutrition value of food products [28]. This suggested that appropriate extraction conditions are crucial. According to the previous investigations, functionality modifications of HPI were primarily conducted after the protein isolation process, while the feasibility of the extraction protocol has not been adequately assessed.
At present, similar to other plant protein systems, hempseed protein extraction is commonly based on the AE-IEP method. To maximise yield, hempseed proteins are solubilised in an aqueous phase at alkaline conditions (pH 8.5 to 10.0) [29,30,31,32], temperatures between 24 to 40 °C [10,33], and extraction times from 1 to 4 h [34,35,36]. Our hypothesis is that the combination of high pH and long extraction times might provide a suitable environment for disulphide bond formation that detrimentally affects the functionality of hempseed protein during the extraction, thus leading to the poor functionality of the ultimate HPI product.
Thiol functional groups have been shown in previous investigations to undergo deprotonation at high pH, resulting in the formation of thiolate anions (S) [37]. The thiolate group can participate in intermolecular bond formation reactions with other electrophilic reactive species [38], particularly intermolecular disulphide bond formation [39]. Therefore, it is reasonable to suspect disulphide bonding may occur between proteins during alkaline extraction. Thus, the conventional extraction protocol may not be suitable for high-thiol-content feedstocks such as hempseed. So far, the underlying mechanisms of protein extraction from hempseed has not been widely studied and there is a lack of systematic investigation into hempseed protein extraction kinetics as a function of alkaline pH.
Consequently, the current study is aimed at systematically investigating the impact of the HPI alkaline extraction protocol on the structural and functional properties of hempseed proteins. For this purpose, the biochemistry and functionality of hempseed protein extracted under different alkaline extraction conditions and their corresponding HPI powder were analysed. In particular, the possibility of intermolecular disulphide bond formation during extraction was explored, and the functionality of HPI produced under different conditions compare to conventionally extracted HPIs. This study provides new insights into high-thiol-content-based plant protein extraction in the context of obtaining desirable functional properties for food processing applications.

2. Materials and Methods

2.1. Materials

A commercial hempseed powder was used as the hempseed protein source (approx. 52% protein purity) in this study. Criterion™ Precast Midi PAGE Gels were obtained from Bio-Rad (Bio-Rad Technologies, Gladesville, NSW, Australia) and stored at 4 °C until use. Protein assay dye reagent concentrate (Catalog#500-0006) was obtained from Bio-Rad. Hexane, sodium hydroxide (NaOH), hydrochloric acid (HCl), β-mercaptoethanol (β-ME), tris(hydroxymethyl) methylamine (Tris buffer), glycine, ethylenediaminetetraacetic acid (EDTA), and 5,5-dithio-bis-(2-nitrobenzoic acid) (DTNB, Ellman’s reagent) were all purchased from Sigma-Aldrich and stored at room temperature (24 °C); all chemicals were reagent grade. Canola oil was purchased from Woolworths, Australia. Deionised water (Millipore Australia Pty Ltd., Sydney, NSW, Australia) was used in all experiments with a typical resistivity of 18.2 MΩ-cm at 24 °C.

2.2. Hempseed Protein Alkaline Extraction

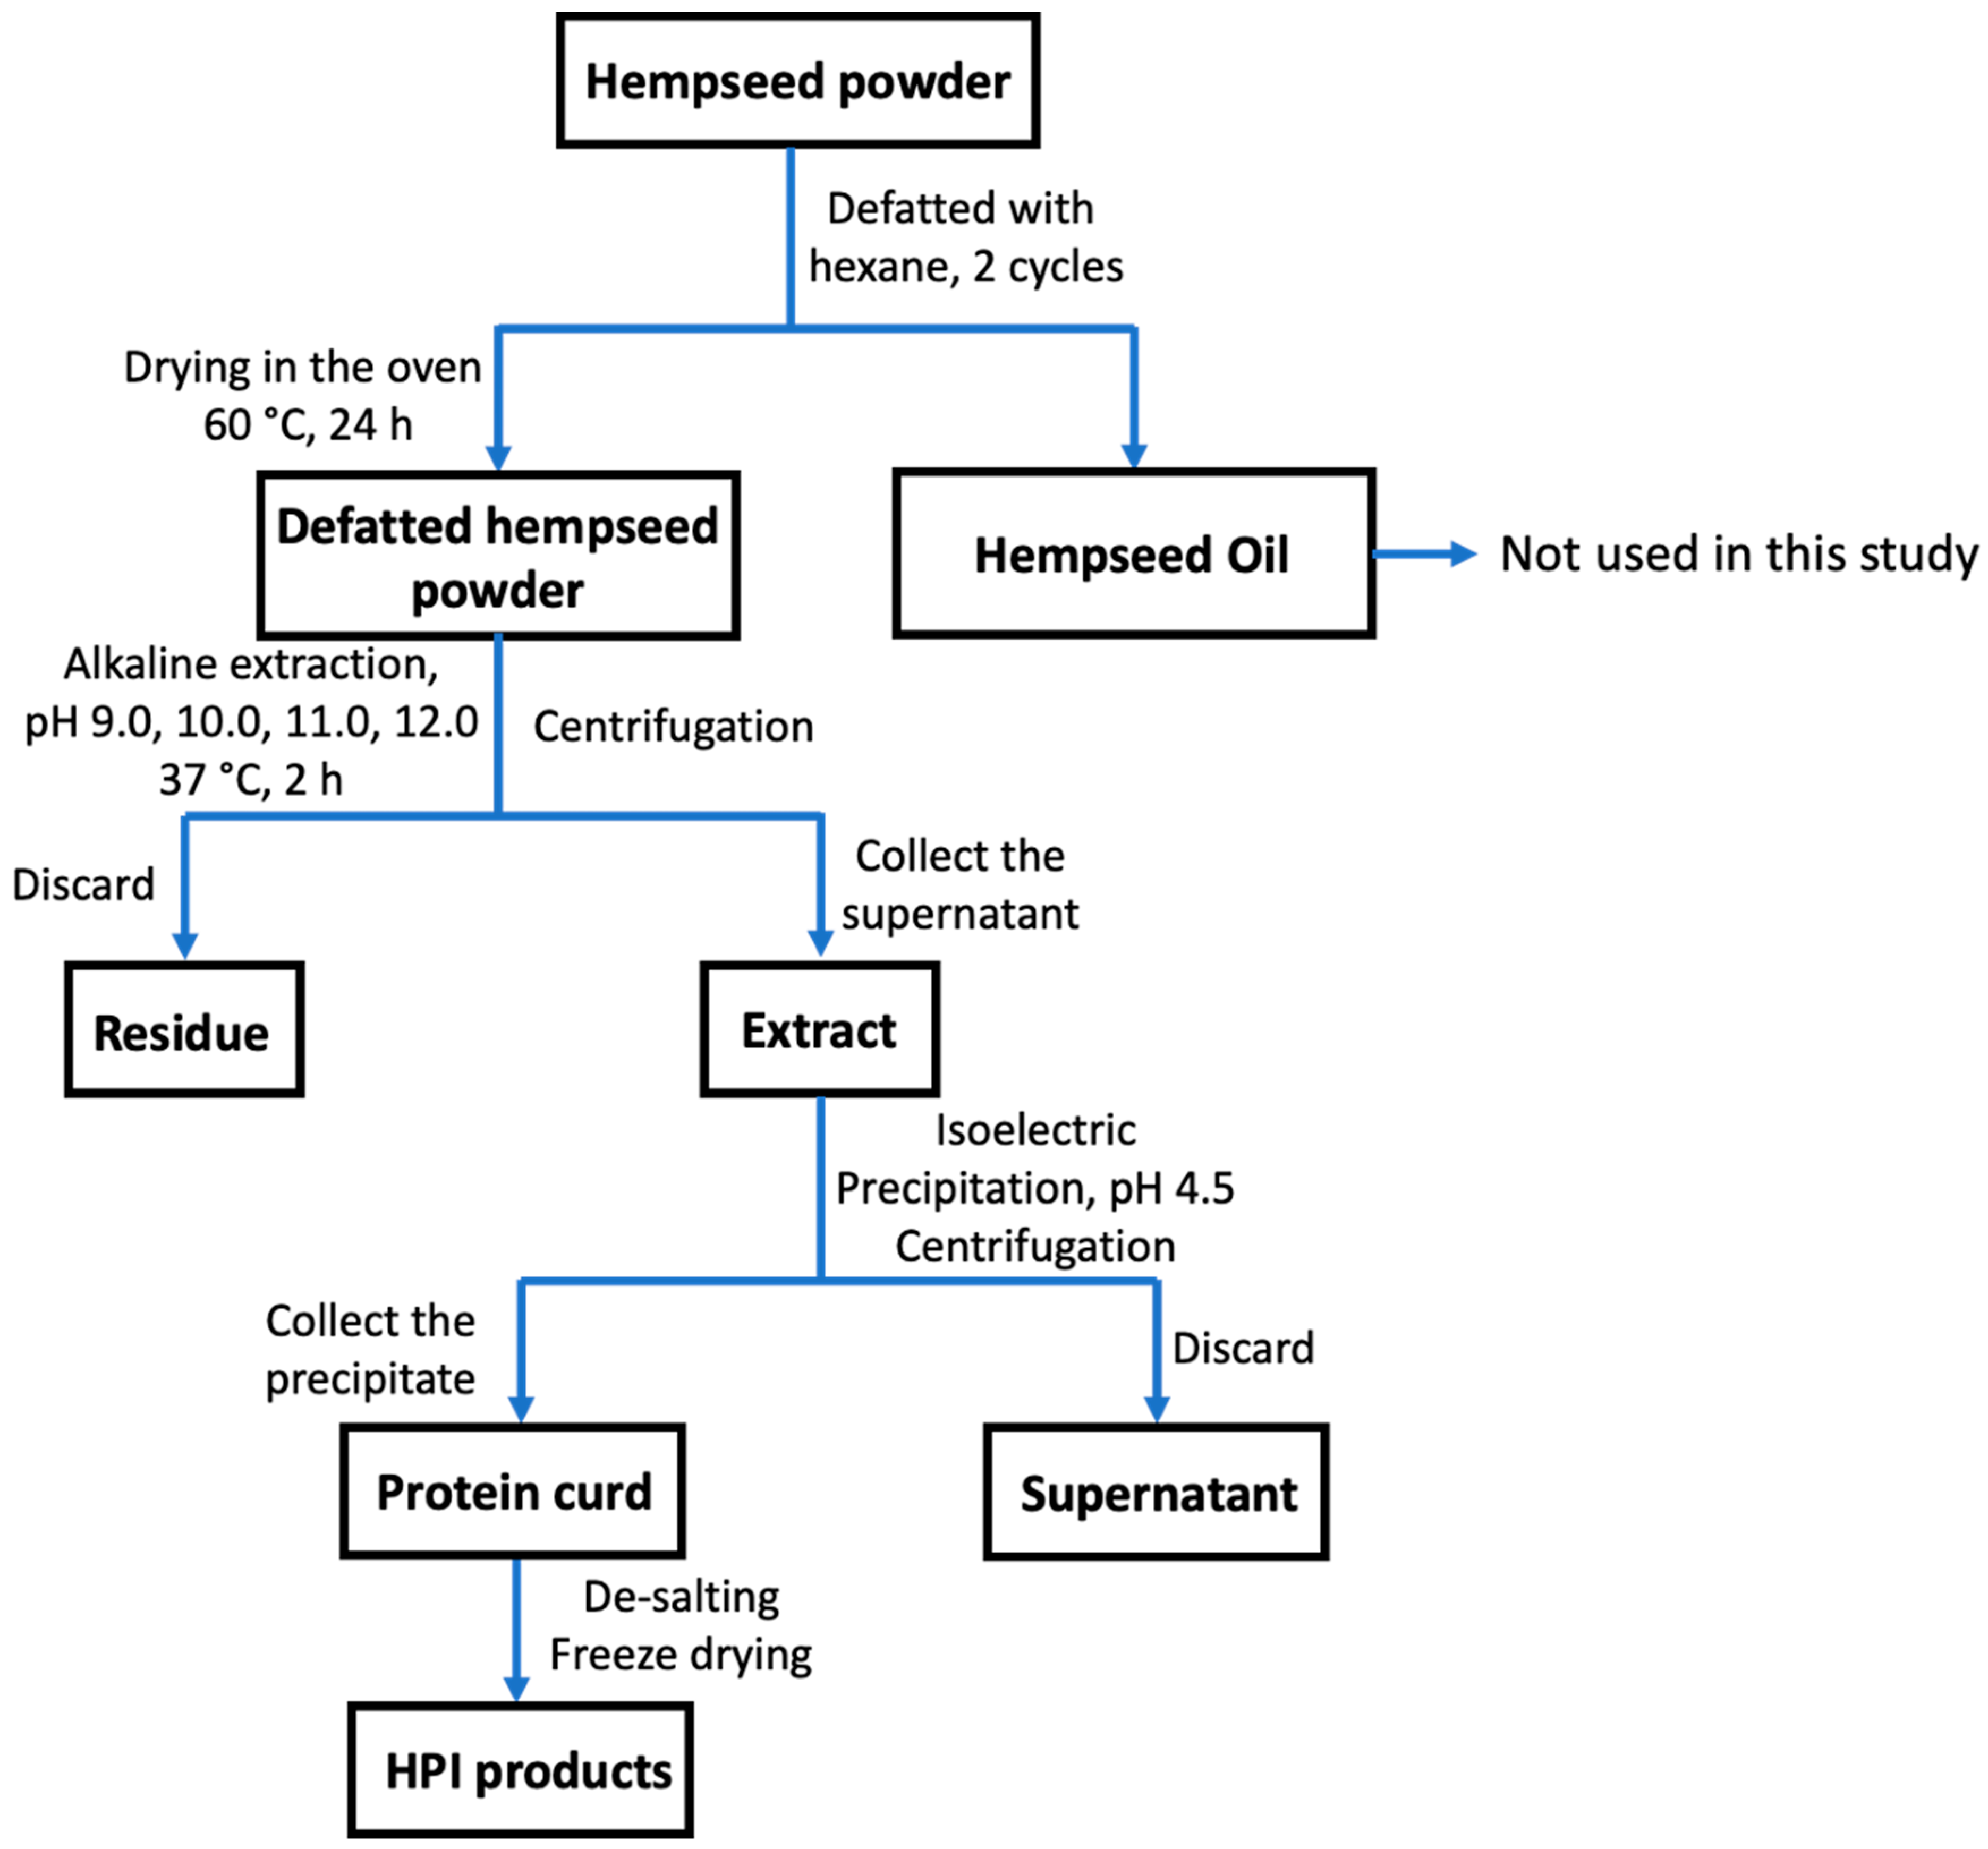
2.2.1. The Preparation of HPI Products

Hempseed protein extraction was based on Tang’s method [15] with minor modifications. The commercial hempseed powder was first dispersed in hexane at room temperature for 16 h to remove lipids to avoid any impact on protein characterization. Afterwards, the solvent was removed by centrifugation (Thermofisher, Megafuge 8, Waltham, MA, USA) at 4383× g for 20 min at 24 °C. The pellet was subjected to another defatting cycle (8 h) until the supernatant was colourless. Then, the pellet was kept in an oven at 60 °C for 24 h to ensure complete removal of hexane.
The appropriate amount of 1 M NaOH was added to 100 mL of deionised water to adjust the aqueous pH to 9.0, 10.0, 11.0, and 12.0, to make different HPI products for further analysis. To avoid confusion, we want to note that the HPI products are only discussed in Table 2, Section 3.3.1 and Section 3.5 of the paper. The solution temperature was then brought to 37 °C with magnetic stirring. Afterwards, the defatted hempseed powder was introduced to the pH-adjusted solution with a volume/weight ratio = 15:1, in order to provide a constant extraction starting point (t = 0 min). The solution pH would dramatically drop, and we re-adjusted the pH to the initial value before conducting further analysis. After 2 h extraction, the suspension was centrifuged at 4383× g for 20 min (Thermofisher, Megafuge 8, Waltham, MA, USA). The precipitate was discarded, the supernatant was carefully collected and vacuum-filtered using a Buhner funnel, and the filtrate was subjected to acidic precipitation with 1 M HCl until the pH was 4.5. The solution should be smelly and cloudy after acidic precipitation. Subsequently, the solution was centrifuged at 4383× g for 20 min, the supernatant was discarded, and the precipitate was collected. The distilled water was added to precipitate, and subjected to centrifugation (4383× g, 10 min). The resulting supernatant was discarded, and the precipitate was retained for repeated washing using the same procedure at least 5 times, until the precipitate exhibited a gel-like texture. The desalted precipitate was re-dispersed in deionised water (w/w = 1:30), and the pH was adjusted to 7.0 using 1 M NaOH and freeze-dried for 72 h to obtain the HPI powder. The preparation of HPI is shown in the Figure 1.

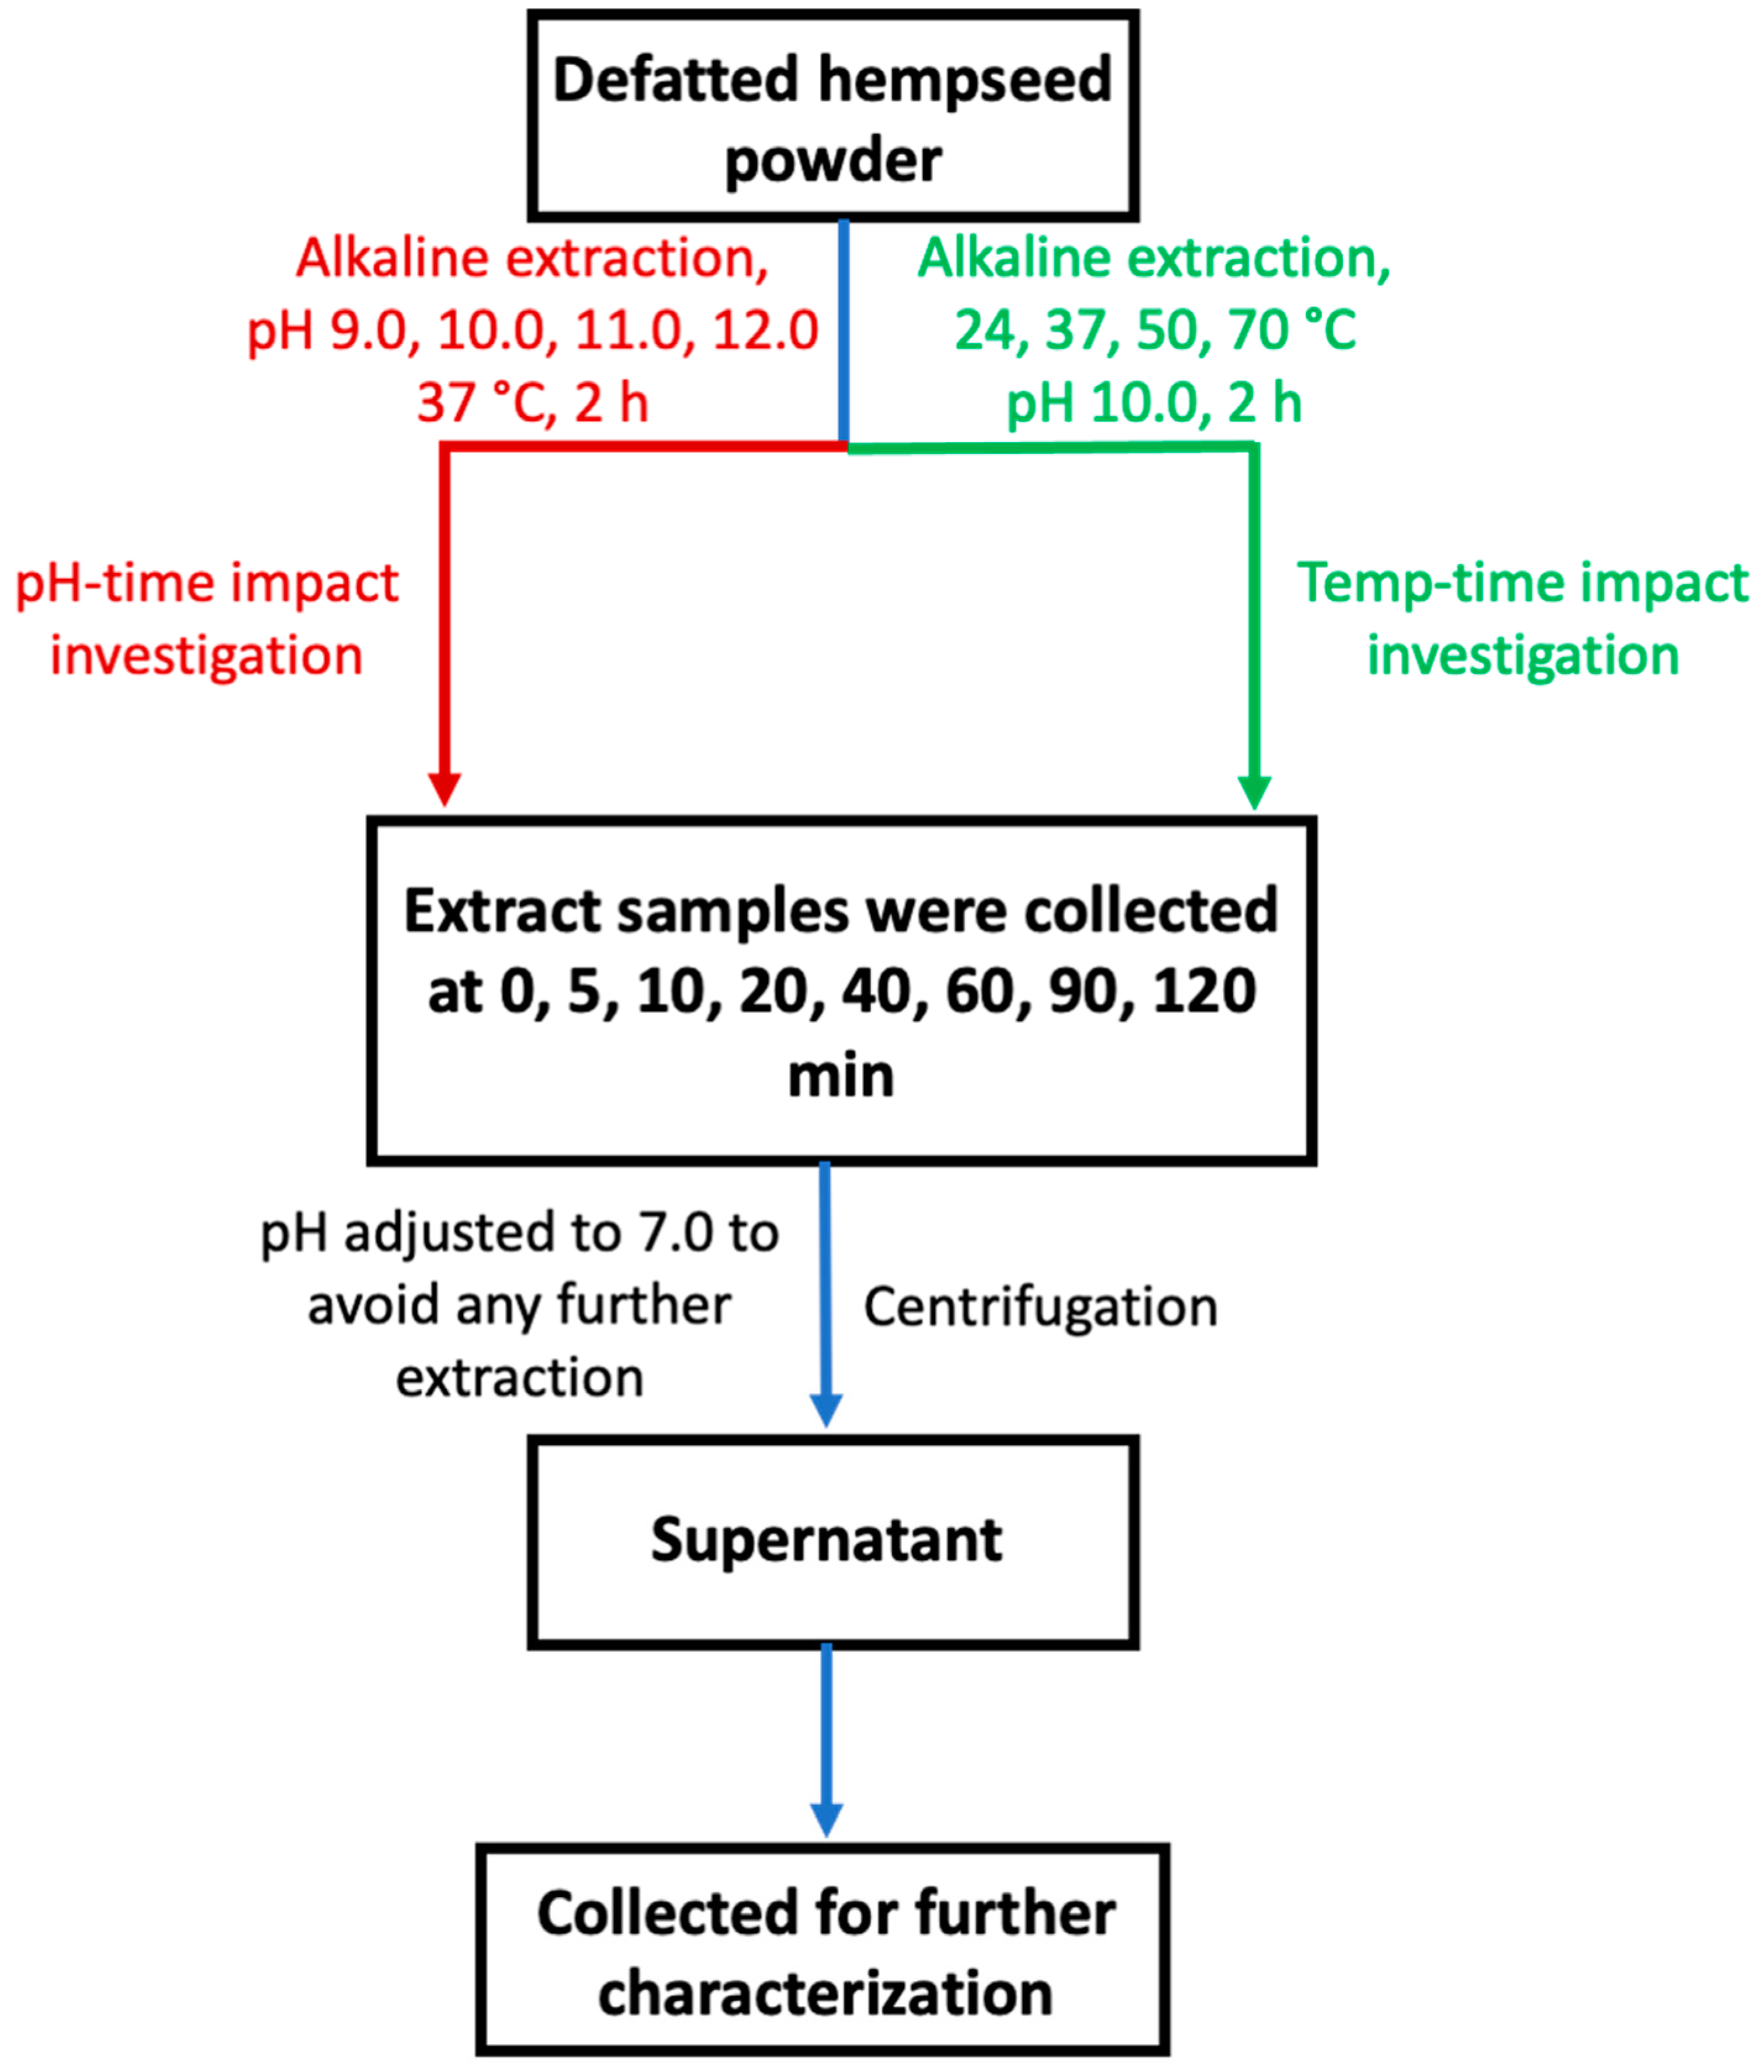
2.2.2. Mechanistic Investigation

To understand the impact of extraction parameters on the extraction kinetics, the protein concentration and free -SH content changes were performed as a function of extraction time. For this, the extraction protocol was similar to the previously introduced method with minor modifications. An appropriate amount of 1 M NaOH was added into deionised water to adjust the pH to 9.0, 10.0, 11.0, and 12.0 and then the solution was brought to 37 °C with magnetic stirring for the pH–time impact investigation. Similarly, for the temperature–time investigation, 1 M NaOH was added to deionised water to adjust the pH to 10.0, and then the solution heated to 24, 37, 50, and 70 °C with magnetic stirring. The defatted hempseed powder was introduced to the pH-adjusted solution at a volume/weight ratio = 15:1. Subsequently, the solution pH was re-adjusted to the initial value before conducting further analysis. During the extraction, extract samples were collected and placed in centrifuge tubes at 5, 10, 15, 20, 40, 60, 90, and 120 min. A suitable amount of 1 M HCl was added to each tube to adjust the pH to 7.0 to avoid further extraction during the centrifugation. Afterwards, the contents were centrifuged at 4383× g for 20 min (Thermofisher, Megafuge 8, Waltham, MA, USA), and supernatants were carefully collected for further characterization. A detailed flow chart illustrating the mechanistic investigation is shown in Figure 2.

2.3. Sodium Dodecyl Sulphate-Polyacrylamide Gel Electrophoresis (SDS-PAGE)

SDS-PAGE was carried out according to Wu et al.’s [40] method with minor modifications to characterise the hempseed proteins and to determine the extent of the intermolecular disulphide bond. First, protein concentrations in all samples were standardised to 2 mg/mL by diluting extracted stock supernatants in accordance with their concentrations.
For non-reducing SDS-PAGE, 50 μL of 2 mg/mL protein supernatant combined with Laemmli buffer (Bio-Rad, Gladesville, NSW, Australia) at a ratio of 1:1 (v/v) was added. For reducing SDS-PAGE purpose, 1 mL of reducing Laemmli buffer was prepared by adding 50 μL of 2-mercaptoethanol (β-ME) into 950 μL of Laemmli buffer. Then, 50 μL of 2 mg/mL protein supernatant was mixed with Laemmli buffer (Bio-Rad, Gladesville, NSW, Australia) at a ratio of 1:1 (v/v). Afterwards, the protein was denatured by heating the samples at 90 °C for 5 min and then allowed to cool to room temperature.
Subsequently, 20 μL of samples were loaded into gel lanes (pre-cast 4–20% Criterion TGX 18-well gel cassette, Bio-Rad, Gladesville, NSW, Australia). The gels were run for 45 min under 200 V (Bio-Rad Criterion cell), after which the gel was washed three times with deionised water for 5 min and stained with Coomassie Biosafe stain for 60 min under gentle shaking. The gels were then de-stained with deionised water for 60 min, and imaged, before applying an image analysis process (Gel-Doc, Bio-Rad, Gladesville, NSW, Australia).

2.4. Protein Extraction Determination

The protein concentration in the extraction supernatants was determined using a BCA protein assay kit (Bio-Rad Technologies, Gladesville, Australia) [41]. Briefly, 100 μL of bovine serum albumin (BSA) standard or sample solution was mixed with 5 mL of diluted dye. The mixture was vortexed and incubated at room temperature for 5 min. The absorbance of the sample was immediately measured at 595 nm (Cary 50 bio UV-Vis, Agilent, Melbourne, VIC, Australia). Measurements were carried out in triplicate. A standard curve was first established using the BSA standard, and the unknown protein concentration subsequently calculated from the regression equation. The purity of HPI was determined by solubilising HPI powder in pH 13.0 NaOH solution (Approx. 2 mg/mL). The weight of the total protein in the HPI product was calculated by the purity multiplied by the total mass of HPI.
The extraction yield (%) was calculated as the mass of HPI product divided by the initial defatted hempseed powder (Equation (1)). The protein recovery yield (%) was calculated as the weight of total protein in the HPI product divided by the weight of protein in the initial defatted hempseed powder (the initial protein content was obtained from the ingredients) (Equation (2)):
Protein   extraction   yield   % = m ( HPI ) m ( hempseed   powder ) × 100
Protein   recovery   yield   % = m ( protein   in   HPI ) m ( protein   in   hempseed   powder ) × 100

2.5. Determination of Free Sulfhydryl (-SH) Group Content

Disulphide bonds in hempseed protein may undergo a disulphide displacement reaction with thiol during alkaline extraction. Determining the -SH content can provide information on the dynamic changes in disulphide content during the extraction. The free sulfhydryl group content in different supernatants collected during alkaline extraction was determined using DTNB reagent according to a previously reported method [42] with slight modifications. Briefly, the extracted hempseed protein solution supernatant was diluted with Tris-Gly standard buffer solution (86 mM Tris, 90 mM glycine, and 4 mM EDTA, pH 8.0) to 2 mg/mL. For free sulfhydryl content measurement, 40 μL of DTNB (4 mg/mL) solution was added into a 4 mL aliquot of each hempseed protein solution. The mixture was vortexed and incubated at room temperature for 15 min and subjected to spectrometric analysis. The absorbance of the samples was recorded at 412 nm (Cary 50 bio UV-Vis, Agilent, Australia). The solution mixture of Tris-Gly standard buffer containing protein supernatant with a total volume of 4 mL was used as a protein blank. The -SH content per gram of soluble protein was calculated using Equation (3) [43]:
SH   ( μ mol / g ) = 10 6 × A × D 1.36 × 10 4 × c
where A is the measured absorbance at 412 nm, D represents the dilution factor, 1.36 × 10⁴ M−1cm−1 is the molar extinction coefficient, and c is the initial protein concentration (2 mg/mL).

2.6. Investigation of Hempseed Protein Functionality

2.6.1. Effect of Extraction Protocol on Protein Emulsifying Capacity

The emulsifying capacity represents the ability of a protein to emulsify oil to form a stable emulsion [44], and can be represented by the emulsifying ability index (EAI). Emulsions are thermodynamically unstable, and the creaming index (CI) can reflect the emulsion stability. Both the EAI and CI were determined for protein extracted under different conditions as follows. O/W emulsions were prepared using protein supernatants collected at 5, 10, 20, 40, and 60 min during the extraction (pH = 10.0 at 37 °C). Emulsions were formulated at a standardised protein concentration (0.25 wt%) with 5 wt% canola oils as the dispersed phase. The aqueous and oil phases were mixed in a plastic container with a total volume of 18.76 mL and mixed using an Ultra-Turrax (IKA-WERKE, T25 Basic) under 13,500 rpm for 5 min. Emulsifying ability was examined based on Pearce and Kinsella’s method with minor modifications [45]. A fixed volume of 20 μL of the emulsion was diluted with 5 mL of SDS solution (0.1 wt%). Subsequently, the absorbance of the emulsion was measured at 500 nm and the EAI calculated using Equation (4):
EAI   m 2 / g = 2 × 2.303 × DF × A 500 c × l × ( 1 ) × 10 4
where A500 is the emulsion absorbance at 500 nm, DF stands for the dilution factor, l is the optical path (l = 0.01 m), c denotes the initial protein concentration (in this study, c = 2.5 × 10⁻³ g/mL), and represents the emulsion’s oil proportion ( = 0.05 ).
To estimate emulsion stability, the creaming index (CI) was determined by transferring aliquots of 10 mL of each emulsion into glass test tubes and kept in a vertical position at room temperature for further characterization. The initial height (Ht) of 10 mL emulsions was measured immediately, and the height of the serum layer on the bottom (Hs) in each tube was recorded, respectively, after 7 days of storage. CI was calculated as per Equation (5):
CI % = H s H t × 100

2.6.2. Particle Size and Microstructure Determination

A light-scattering instrument (Mastersizer 3000 (Malvern, UK)) was used to measure the volume-weight mean size D4,3 ( D 4 , 3 = n i r i 4 n i r i 3 , where ni and ri are the droplet number and droplet radius, respectively) using laser diffraction analysis, and an optical microscope was used to verify the findings.
The droplet size was measured from freshly made emulsions (denoted as D4,3 (fresh)) and after being stored at room temperature for seven days (denoted as D4,3 (7 days)). The droplet size distribution was measured five times for triplicated samples.
The microstructure of fresh and 7-day emulsions was recorded using an optical microscope (Olympus Model IX7, Melbourne, VIC, Australia) to evaluate the phase status and the emulsion stability. Then, 10 µL of the emulsion was loaded on the microscope slide, and the images were captured using an inverted 60× objective lens (Olympus, UPlanFL, Hiroshima, Japan). The images were taken for each emulsion sample from three individual experiments.

2.6.3. Surface Tension

To investigate the interfacial behaviour of hempseed protein during extraction, an optical contact angle measuring tensiometer (OCA 20, ES model, Dataphysics, Filderstadt, Germany) was utilised to determine the interfacial tension between the aqueous phase (protein solution) and the oil phase (canola oil). A drop of the aqueous phase (0.2 mg/mL) was injected into a rectangular cuvette (only filled with 2/3 total volume of canola oil) using a gas-tight glass syringe with a stainless steel Luer lock needle (22 gauge needle, 0.72 mm O.D.) [46]. The cuvette was fixed on the working station to lower the influence of environmental vibration. Afterwards, images of the droplets were recorded by a CCD camera, and the surface tension was calculated by the software based on the Young–Laplace equation. The surface tension results were collected manually for the first 30 s and then acquired automatically at a rate of 10 points/min.

2.7. Percentage Protein Solubility

The percentage protein solubility of HPI samples was determined according to the method described by Malomo et al. [8] with some modifications. Briefly, 50 mg of HPI powder was dissolved in 100 mM phosphate buffer at a dry mass content of 10 mg/mL at a pH of 3, 4, 5, 6, 7, 8, 9, 10, and 11. The total protein content was determined using an HPI solution (10 mg/mL) prepared with 0.1 M NaOH solution (pH = 13.0). The samples were subjected to orbital shaking at room temperature overnight, followed by centrifugation at 4383× g for 10 min. The same BCA assay (Section 2.4) was applied to determine the protein concentration from the supernatant samples. Protein solubility was calculated using Equation (6)
PS   ( % ) = C n C t × 100
where Cn represents the solubilised HPI at pH value n (n = 3.0–11.0), and Ct is the total protein content at pH 13 (assuming that all proteins were solubilised at pH 13).

2.8. Zeta Potential

The ζ-potential of HPI solutions (1.0 wt% in 100 mM phosphate buffer) at pH 3.0–11.0 range was determined using the same supernatant acquired above by a microelectrophoresis device (Zeta PALS, Brookhaven BI-9000AT, Holtsville, NY, USA). Each sample was measured three times, and data were collected and analysed by Zeta pw32 software.

2.9. Extraction Protocol Optimization Based on Response Surface Methodology (RSM)

An RSM design (Design-Expert software, version 13.0, Statease Inc., Minneapolis, MN, USA) with three variables and two responses was employed for HPI extraction optimisation [47]. A Box–Behnken design with three variables and three levels was selected, as shown in Table 1. The effect of extraction pH (9.0–11.0), temperature (24–50 °C), and time (5–60 min) on extracted protein concentration and free -SH content was analysed to develop the current extraction protocol. In the optimization study, the highest temperature was set at 50 °C due to the negligible difference between 50 °C and 70 °C (Section 3.1.1). In this study, hempseed protein products from an ideal extraction protocol should possess good functional properties and high protein yield. A regression analysis was carried out on the two responses—protein concentration and the free -SH content. The boundary values set in the optimization design will be explained in Section 3.5.

2.10. Statistical Analysis

All experiments were repeated three times, and measurements were performed on triplicate samples in replicates indicated in the text. Data were expressed as mean ± standard derivations and analysed by analysis of variance (ANOVA). The significance of the differences between variables was found by ANOVA analysis and was defined at the p < 0.05 level.

3. Results and Discussions

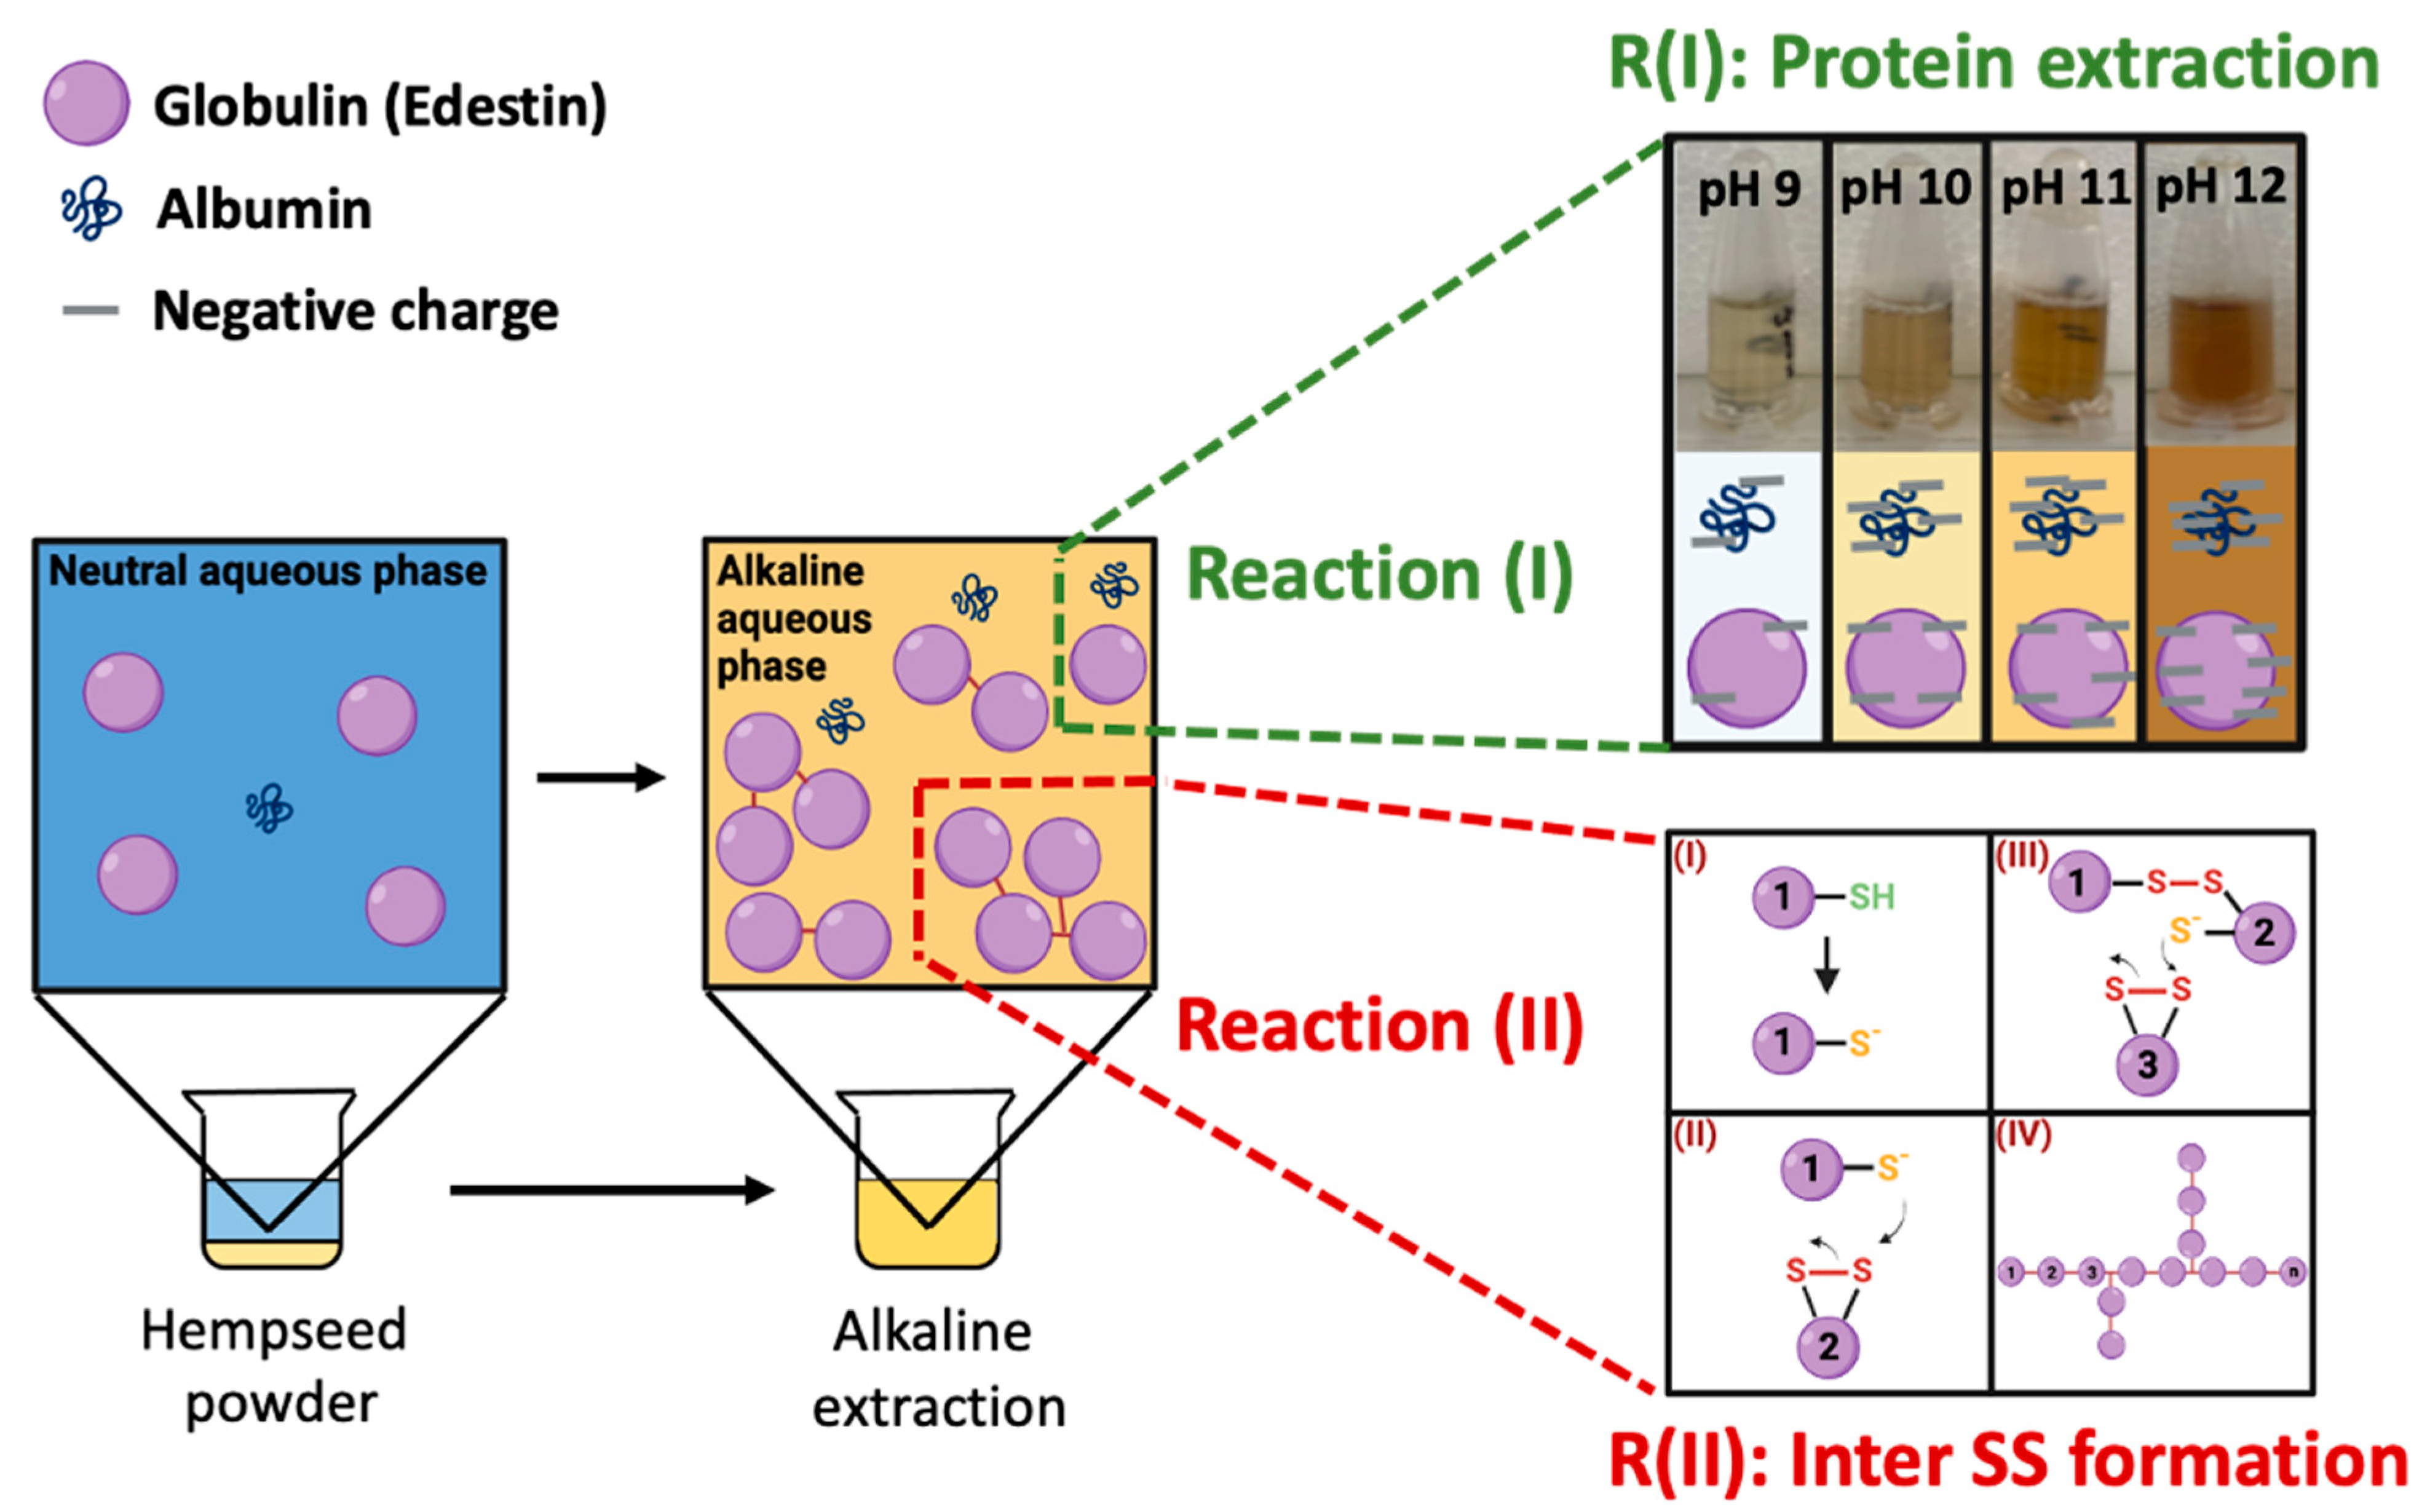
3.1. Mechanistic Investigation of Hempseed Protein AE-IEP Extraction

AE-IEP is the most implemented extraction protocol for most plant materials. The AE-IEP method has also been reported to be adapted for hempseed protein extraction in various research articles [6,15,48]. Nevertheless, it is still not clear whether the extraction conditions negatively impact the quality of the hempseed proteins by triggering undesirable disulphide bonding reactions. The protein yield is also important and depends on the extraction rate, which was first investigated under various extraction conditions.

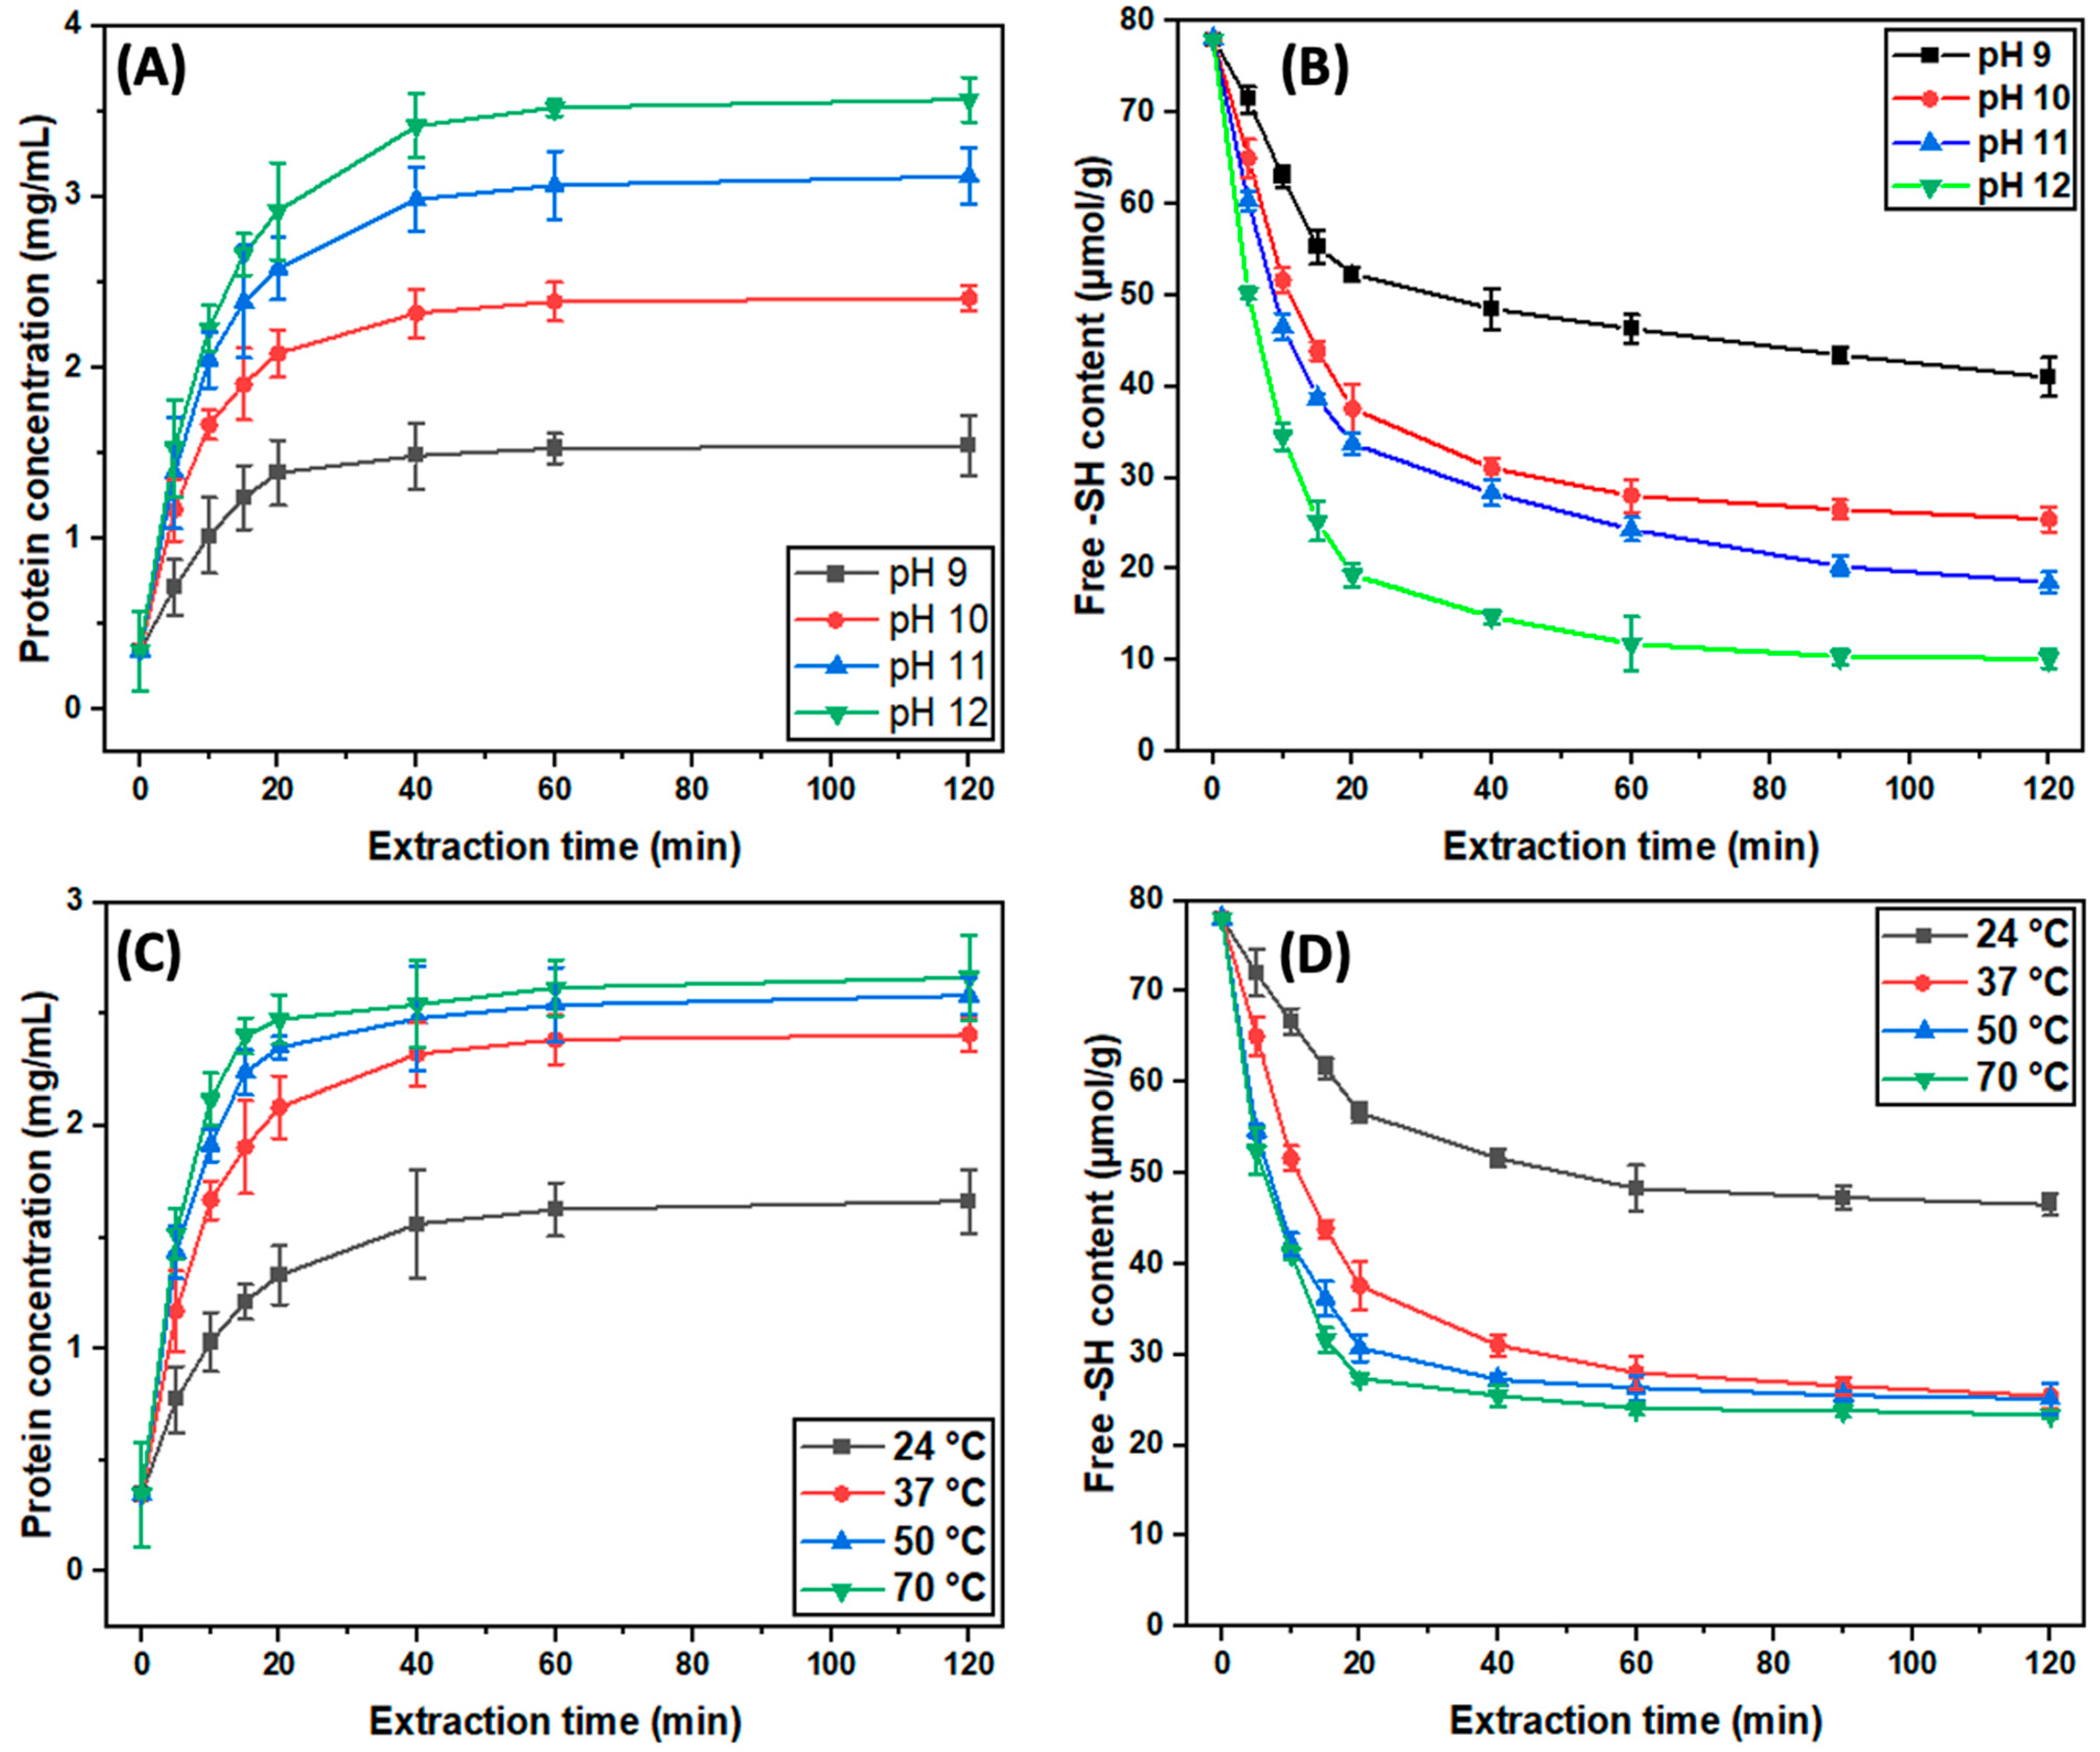
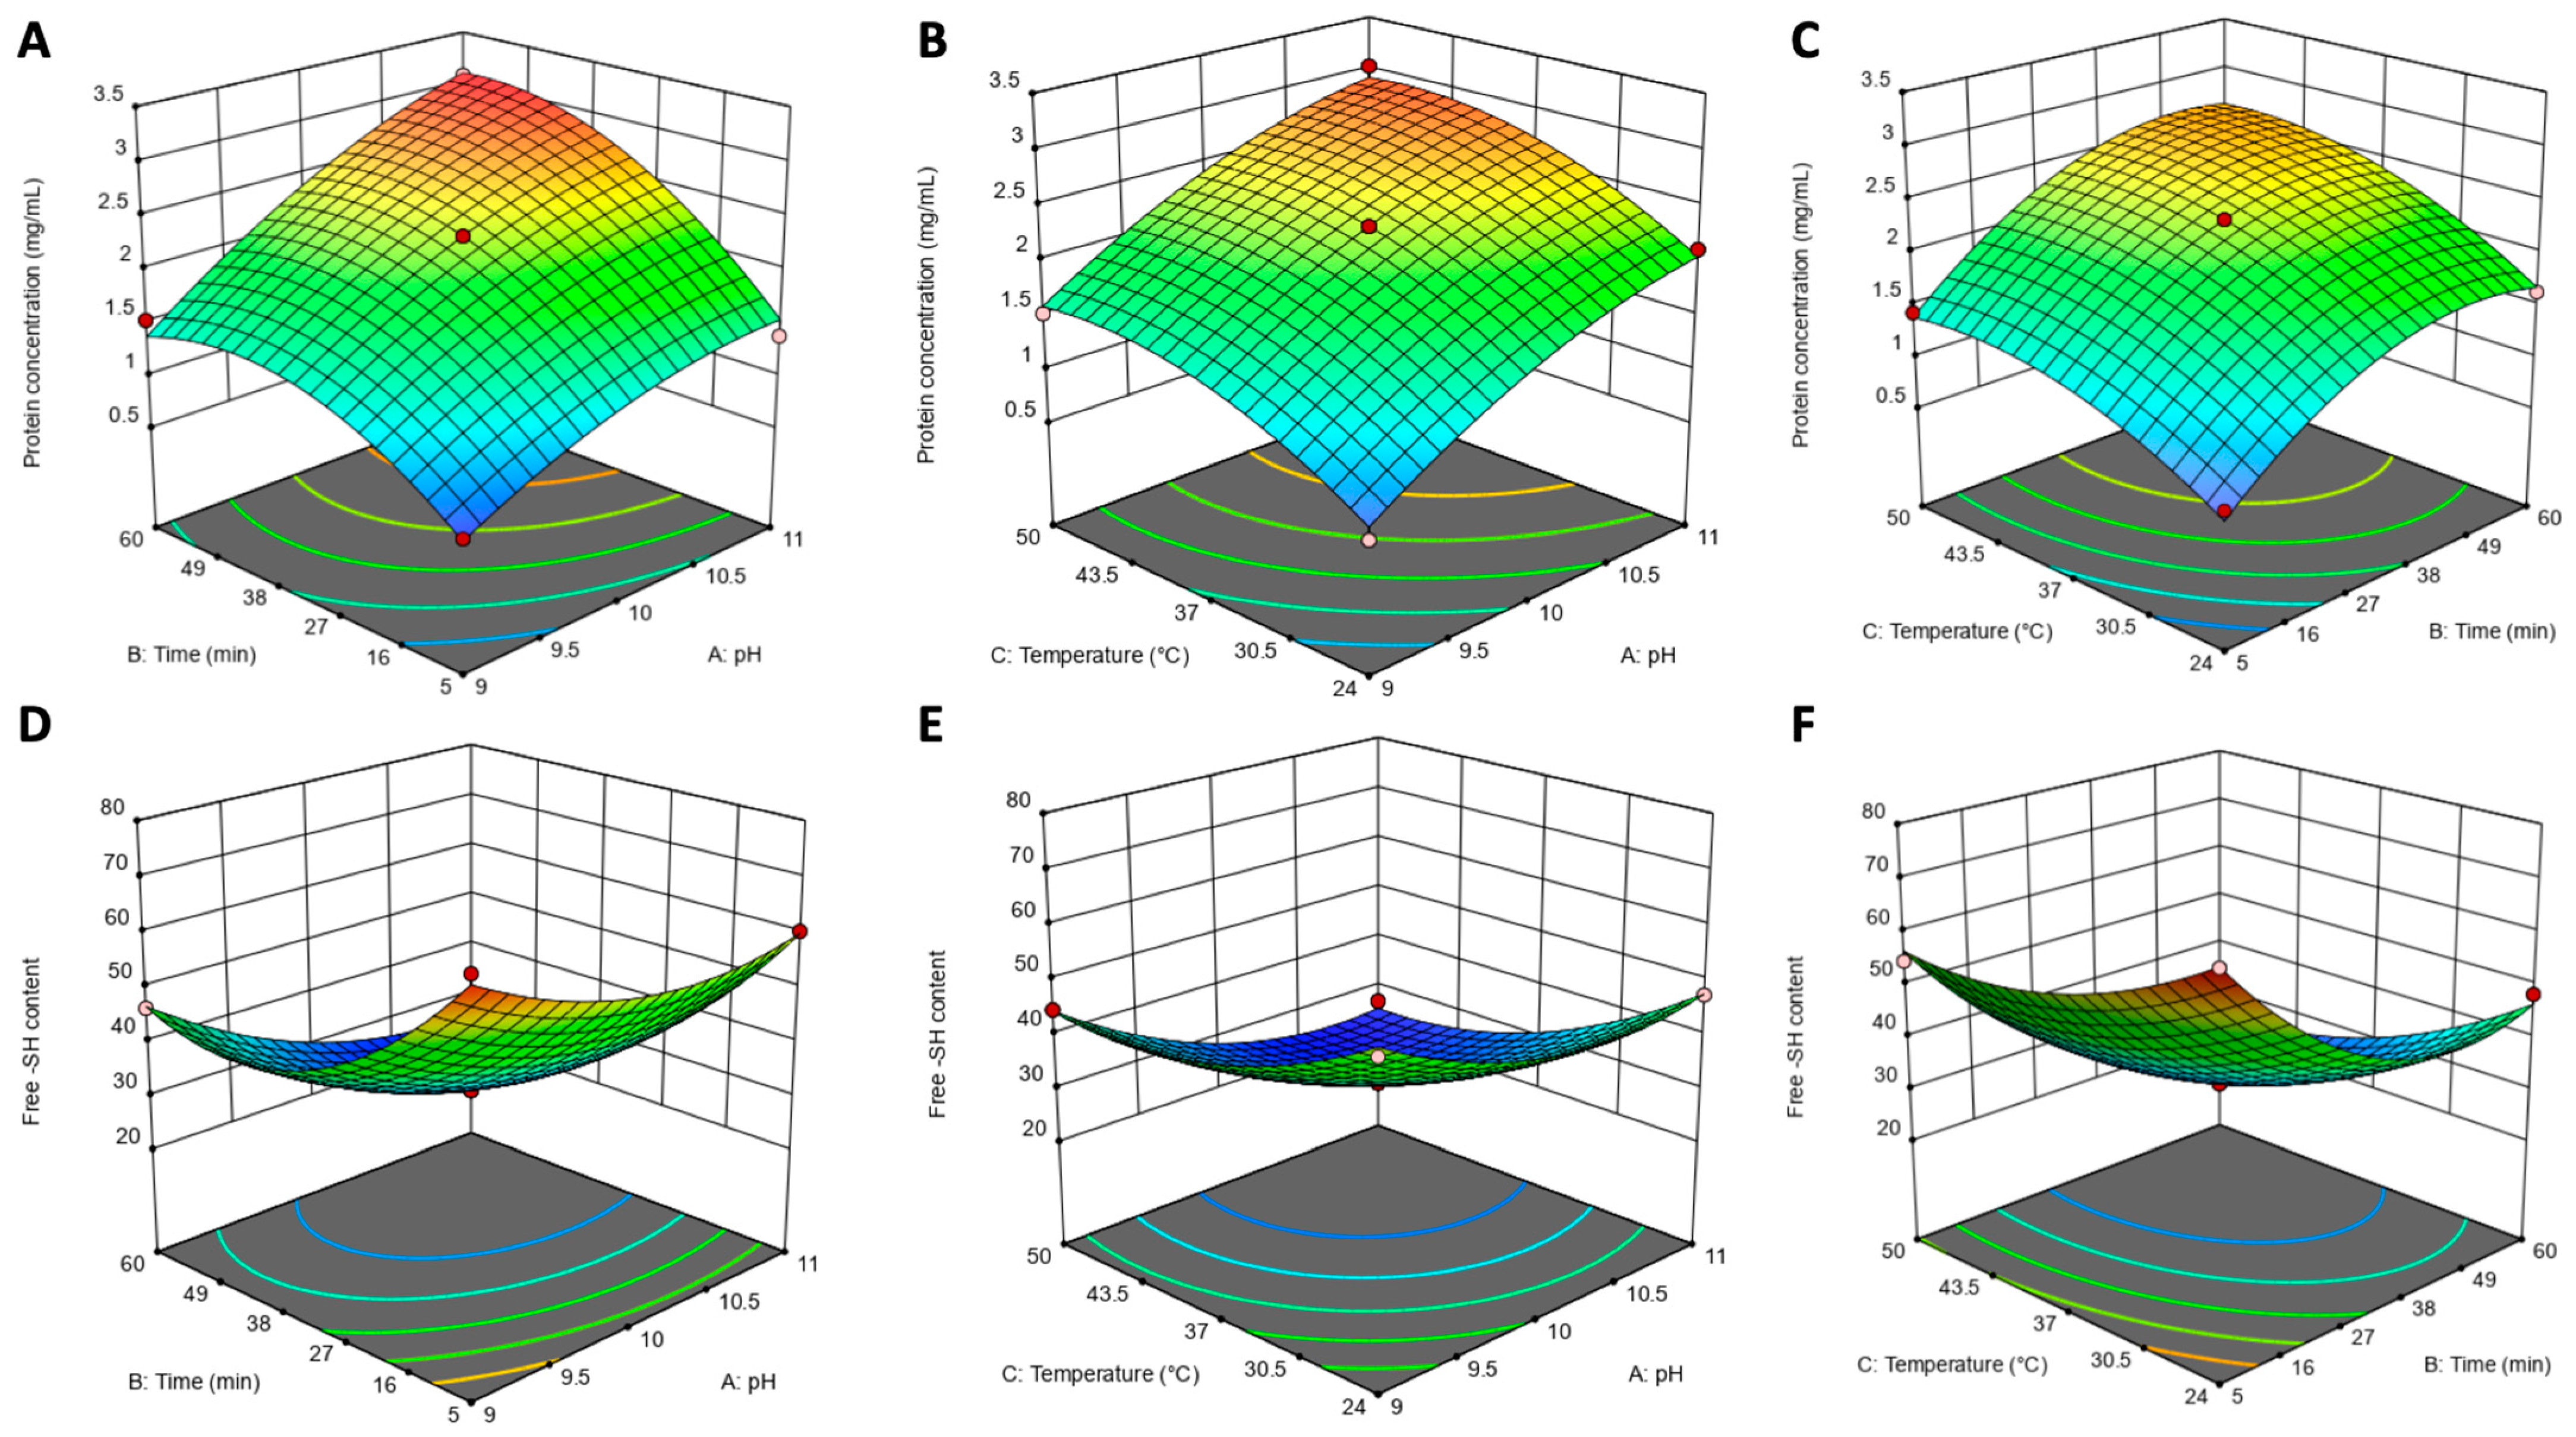
3.1.1. The Effect of pH and Temperature on Protein Extraction Kinetics

It has been reported in other plant protein systems that high extraction pH and temperature can increase protein yield [49], and it can be hypothesised that the hempseed protein system will behave similarly. The effect of pH on the protein extraction rate was first carried out at a fixed temperature (37 °C). As shown in Figure 3A, the rate of extraction was significantly enhanced as the extraction pH increased. For instance, after a 2 h extraction, the protein concentration obtained at pH 12 (3.6 ± 0.1 mg/mL) was more than twice that at pH 9 (1.5 ± 0.2 mg/mL). This can be explained by the fact that, at higher extraction pH, more carboxyl groups will be deprotonated, leading to an increase in hydrophilicity, hence the increased protein extractability. Another contributing factor could be that the hempseed cell wall might be disrupted under highly alkaline conditions due to alterations of the hemicellulose structure and partial lignin removal [50,51].
The observed differences in extraction kinetics are also reflected in the final HPI yield. As shown in Table 2, increasing extraction pH can enhance the HPI yields. This finding accords with many previous investigations on the extraction of various plant proteins [52,53,54,55]. In this study, the extraction yield increased from 17.2 ± 0.3% to 22.4 ± 0.4% as the pH increased from 9.0 to 12.0. By using a similar AE-IEP protocol to extract protein from non-dehulled hempseed raw material, Teh et al. [10] reported an HPI extraction yield of 16.67 ± 0.05%, Hadnađev et al. [6] acquired 24.24 ± 0.22%, while Shen et al. [2] obtained 21.52 ± 0.36%, respectively. The slight difference in the value could be attributed to minor modifications in the HPI extraction protocol and variations in the raw materials. The protein recovery yield based on the initial protein content in the material also varied amongst different studies, having been reported as 37.9. [4], 46.9% [2], 50.6% [6], 58.1% [56], and 73% [15]. The variance in protein recovery yield might also be due to variations in the raw materials and treatments, such as the defatting and dehulling process [2,6].
To investigate the impact of temperature on protein extraction, experiments were carried out at a fixed extraction pH (pH = 10.0). As depicted in Figure 3C, the rate of extraction was much higher at 37 °C than at 24 °C. Interestingly however, there was very little effect of temperature between 37 and 70 °C. Importantly, these effects were similar for both the rate of protein recovery (Figure 3C) and decrease in -SH groups (Figure 3D). This suggests that mildly elevated temperature can help accelerate the extraction process but cannot be used to decouple yield and quality, and that high temperatures provide little benefit.

3.1.2. The Effect of pH and Temperature on Free Sulfhydryl Content during Extraction

Based on the high proportion of cysteine in hempseed protein [6] and the hypothesis present in a previous study [15], the possibility of intermolecular disulphide bond formation during the extraction process must be understood in order to optimise the extraction process with respect to HPI functionality. To the best of our knowledge, no systematic research work regarding hempseed free -SH content changes has been performed before. The changes to free thiol content are shown in Figure 3B,D as a function of pH and temperature, respectively. It can be observed that the free thiol content progressively decreased during all experiments, indicative of SS bonding, and the formation of edestin oligomers (Figure 3B,D). Moreover, increases in pH and temperature can be seen to accelerate the decrease in free thiol content, in a similar manner to the previously observed increase in protein extraction kinetics (Figure 3A,C). The influence of pH can be attributed to the greater extraction and exposure of the hempseed protein at a higher pH condition, resulting in more thiolate (S) available in the system to react. The greater chemical reactivity of S and higher temperature can also be expected to cause more rapid disulphide bond formation.

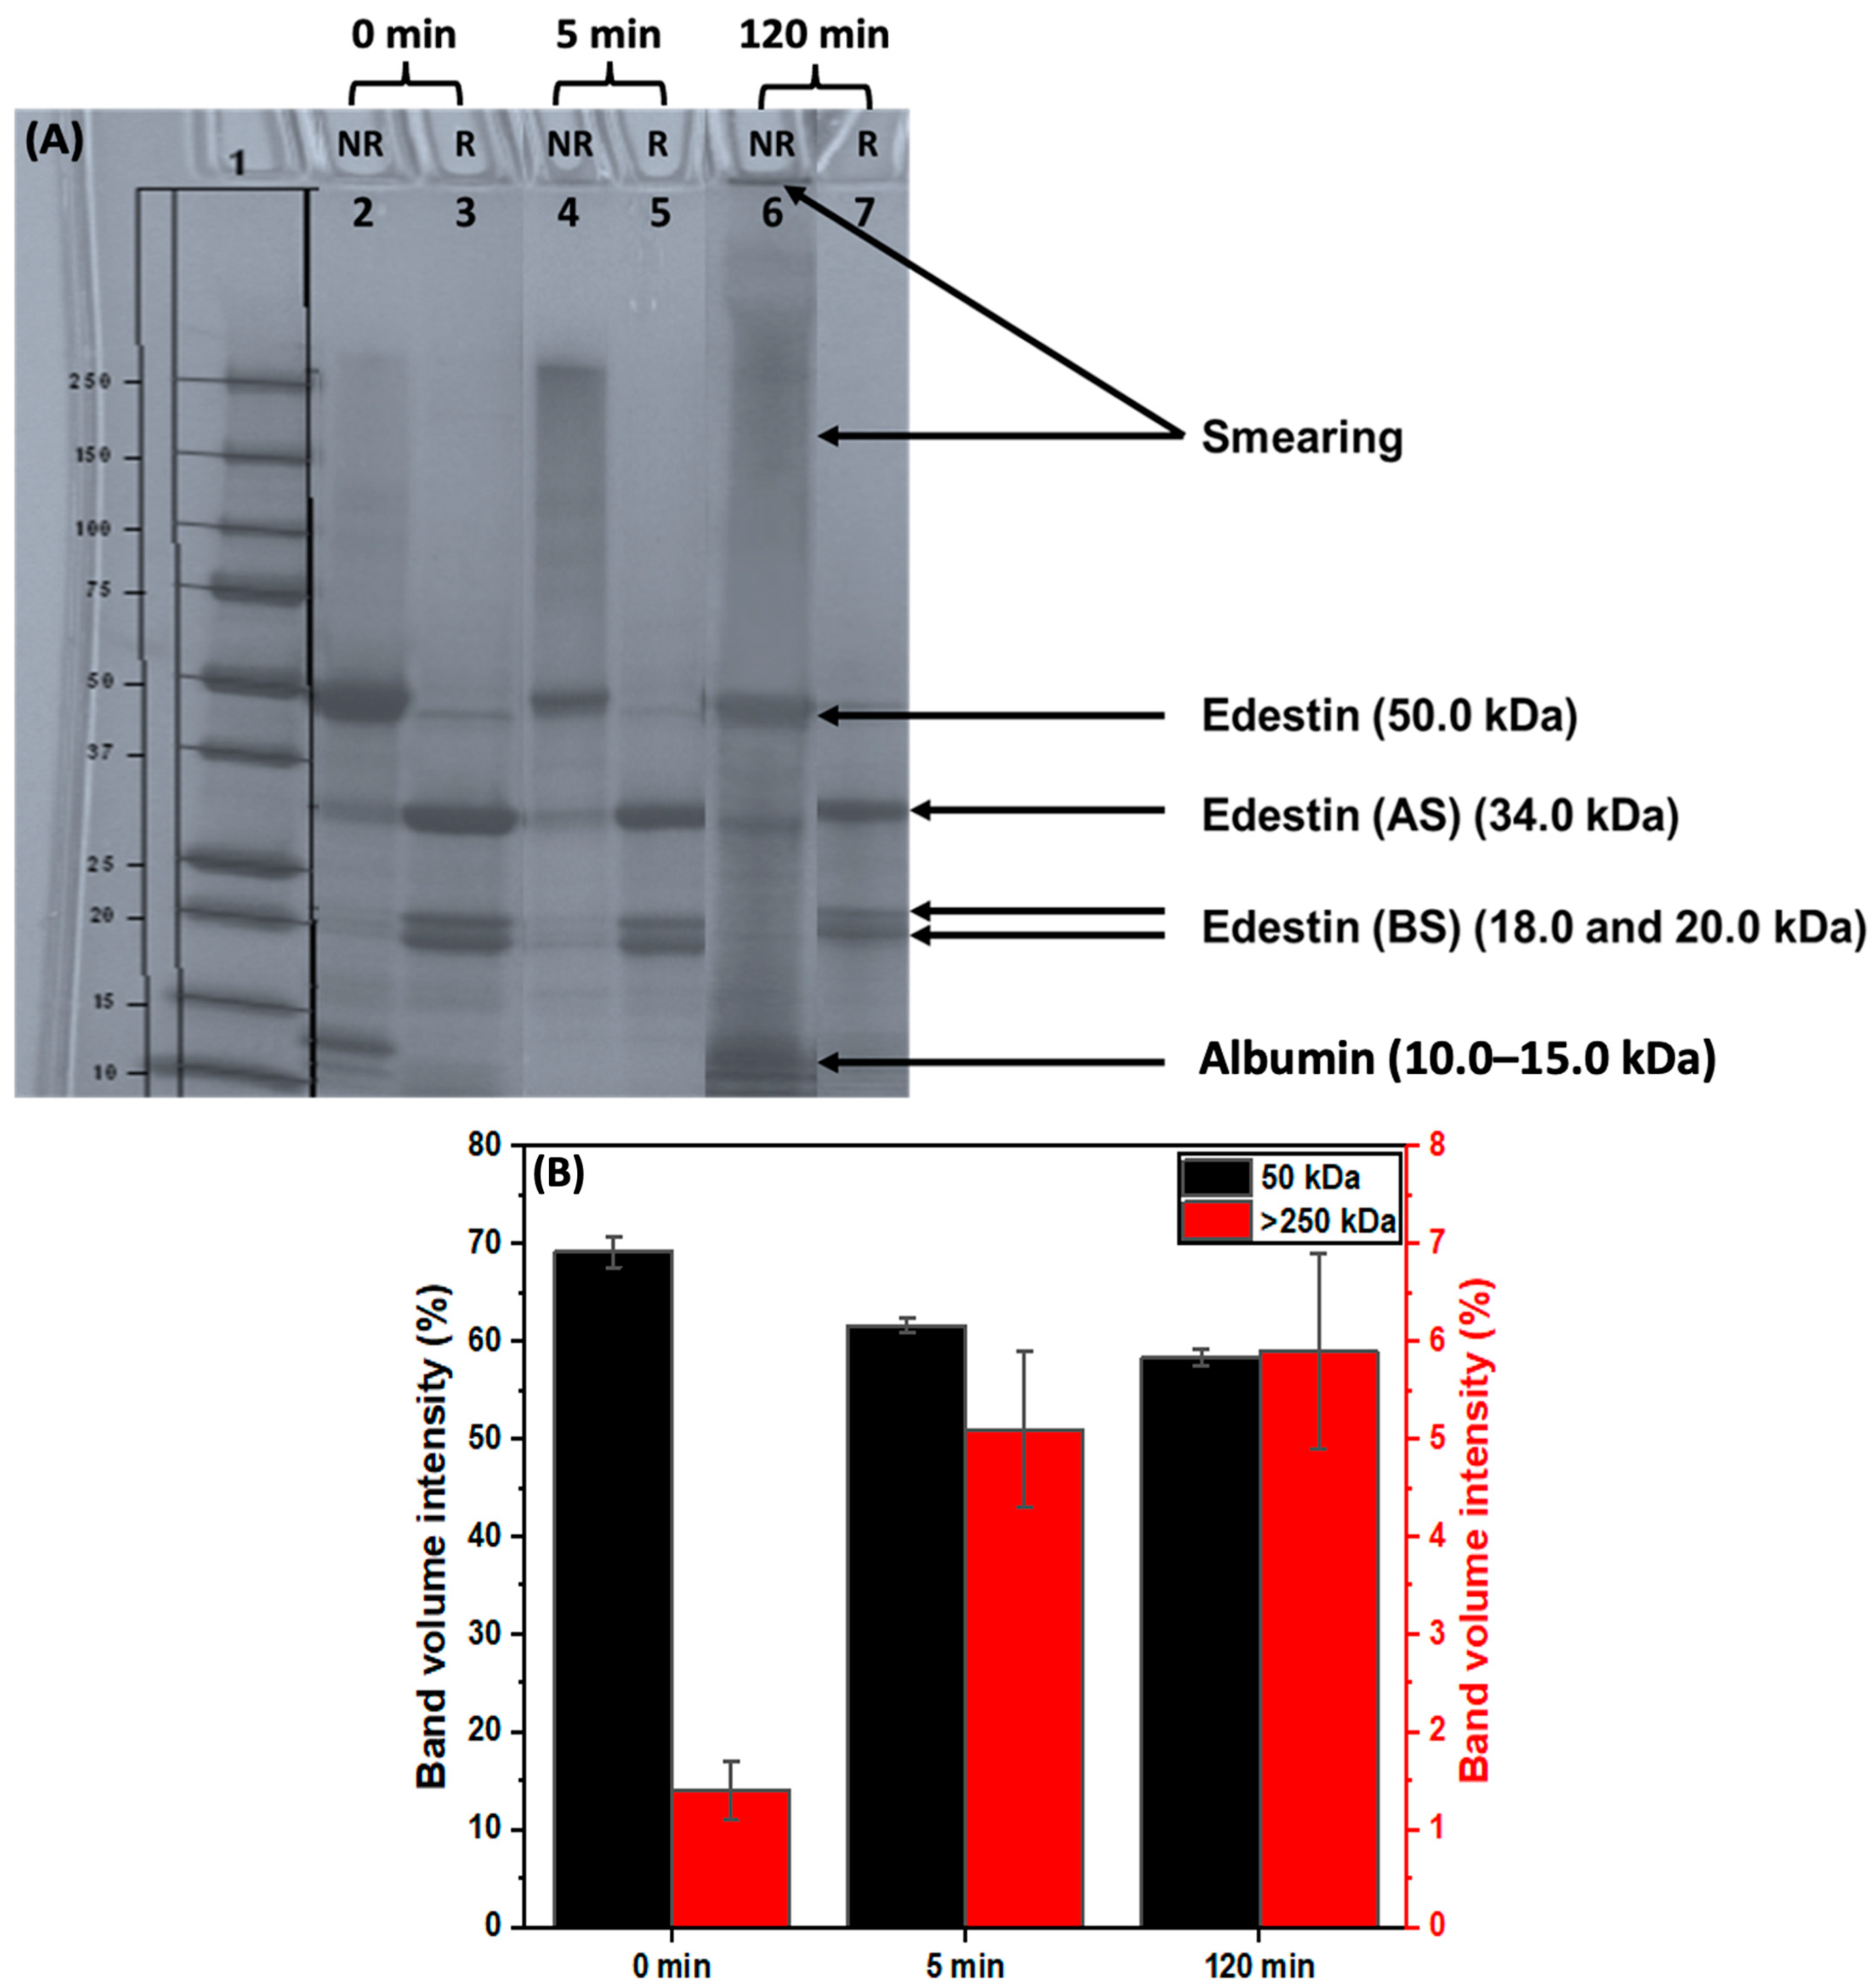
3.2. Evidence for Intermolecular Disulphide Bond Formation

3.2.1. The Impact of Extraction on Hempseed Protein Subunits

As discussed in the introduction, previous research focused on maximising protein yield has encountered an HPI that exhibits poor functionality [4]. As aforementioned, it is highly likely that the intermolecular disulphide bond formation may occur as a side reaction during HPI extraction and that this could explain the poor solubility of the resultant protein. However, direct evidence of intermolecular SS bonds and information about the rate at which they are formed during the extraction process are lacking. Hence, the effect of extraction on hempseed proteins was determined for the hempseed system using native and reducing SDS-PAGE of samples subjected to AE-IEP extraction at pH = 10.0 and 37 °C for different times (0 min, 5 min, and 120 min) (Figure 4A). Non-reducing SDS-PAGE provides information on the native protein–protein interactions, while reducing PAGE cleaves the SS bonds to provide complementary information. Therefore, monitoring SDS-PAGE profiles of the protein solutions at both conditions during the alkaline extraction can reveal the protein conjugation due to intermolecular disulphide bond formation.
Prior to alkaline extraction (t = 0 min), the SDS-PAGE profiles revealed the typical banding of edestin monomer located at 50.0 kDa (Lane 2), from which acid and base subunits at 34.0 and 18.0–20.0 kDa were dissociated under the reducing conditions (Lane 3). The results are in good agreement with other studies [15,35]. Across the entire extraction process, reducing SDS-PAGE (Lane 3, 5, and 7) showed a similar band profile. In contrast, native SDS-PAGE profiles (Lane 2, 4, and 6) showed a progressive decline of the band intensity of the edestin monomer as the protein extraction progressed further. Instead, high MW components are visible at higher MW areas (high-intensity smearing, 50.0–250.0 kDa in this study) and at the top of the gel (>250.0 kDa). This, in combination with the absence of smearing at the high MW area under reducing conditions, provides clear evidence that edestin oligomers are indeed caused by intermolecular SS bonding during extraction. In addition, there is smearing between 10 kDa and 50 kDa, indicating that the low MW albumin might also form disulphide bonds. These findings are also evident in the quantified band intensities (Figure 4B). In summary, high MW protein aggregates were confirmed to be formed during extraction due to disulphide bonding, which can explain the decline in the functionality of HPI.

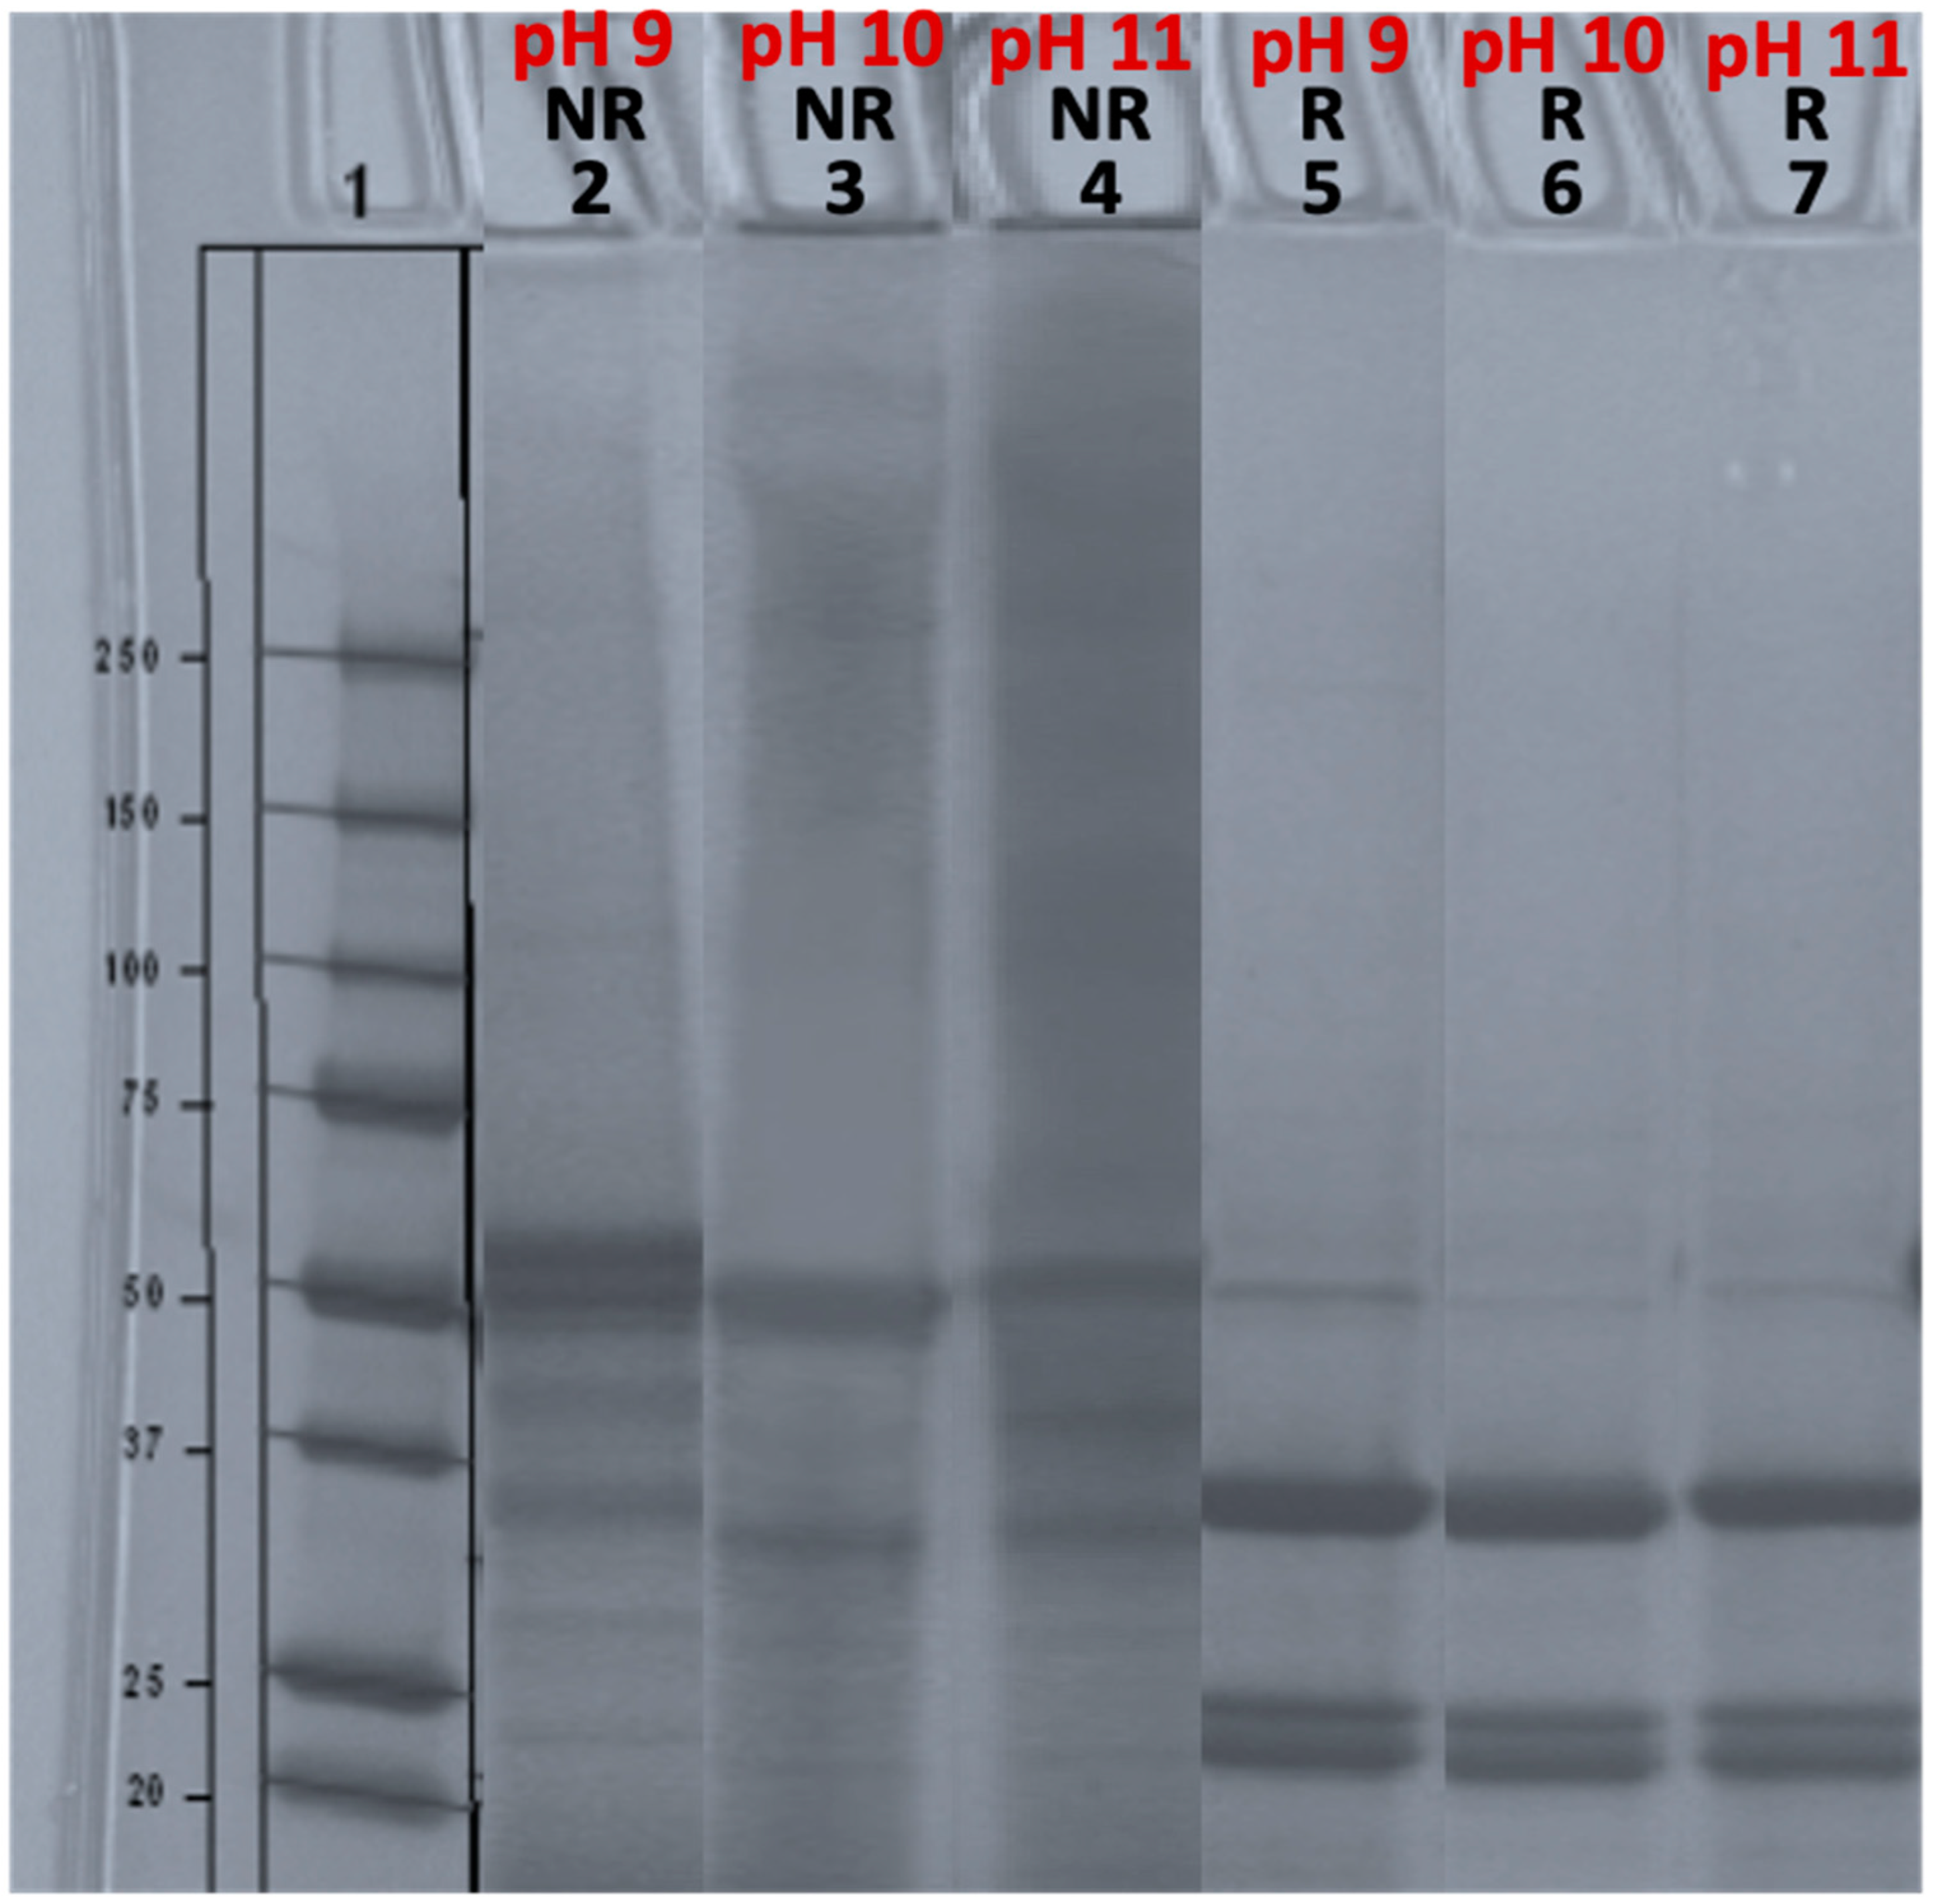
3.2.2. The Impact of Extraction pH on Hempseed Protein Subunits

SDS-PAGE analysis was also used to investigate HPI samples extracted at different pH. In this study, samples extracted at pH 12 were inappropriate for SDS-PAGE analysis as they might contaminate other protein profiles on the gel. The undesirable profiles could be attributed to the hydrolysis of proteins. The peptides can be broken down into smaller peptides and amino acids under high pH, resulting in the smearing and decreased resolution of the protein bands [57]. As observed in the Figure 5, while all non-reducing profiles (lanes 2–4) showed the typical hempseed protein monomer bands (most predominant at ~50 kDa), the intensity of the high MW smearing (>50 kDa) was greater at a higher extraction pH. The increased abundance of edestin oligomers is consistent with the reduction in -SH (Figure 3B) and can be attributed to the more chemically reactive form S existing at high pH. In the reducing protein profiles (Lanes 5–7), there was an absence of smearing at the high MW while the edestin subunits were present, again consistent with the hypothesis that the edestin conjugates are linked by intermolecular SS bonds.
Hence, unlike other traditional plant protein sources, such as soy protein [58], pea protein [59], and lentil protein [60], we have shown that hempseed protein extraction involves two processes: protein solubilization and intermolecular disulphide bond formation. During hempseed protein extraction, pH was a major factor for both processes, as OH acts as a reactant and trigger for protein solubilization and SS formation. Notably, disulphide bond formation appears to be an inevitable consequence of alkaline extraction and is the presumed cause of insolubility of the HPI products. Therefore, finding a balance between the protein yield and the intermolecular SS bonding is crucial.

3.3. The Influence of Disulphide Bond Formation on Protein Functionality

The performance of plant proteins in food processing systems is highly dependent on their functional properties, such as protein solubility, interfacial properties, water/oil holding capacity, etc. [61]. These functionalities are fundamentally dependent on protein structural features. Since disulphide bond formation has been confirmed to occur during hemp protein extraction, the influence of SS bond formation on protein functionality should be investigated. In this study, protein solubility and interfacial properties of hempseed protein were examined, respectively, to highlight the benefits of controlling SS bond formation in the HPI system.

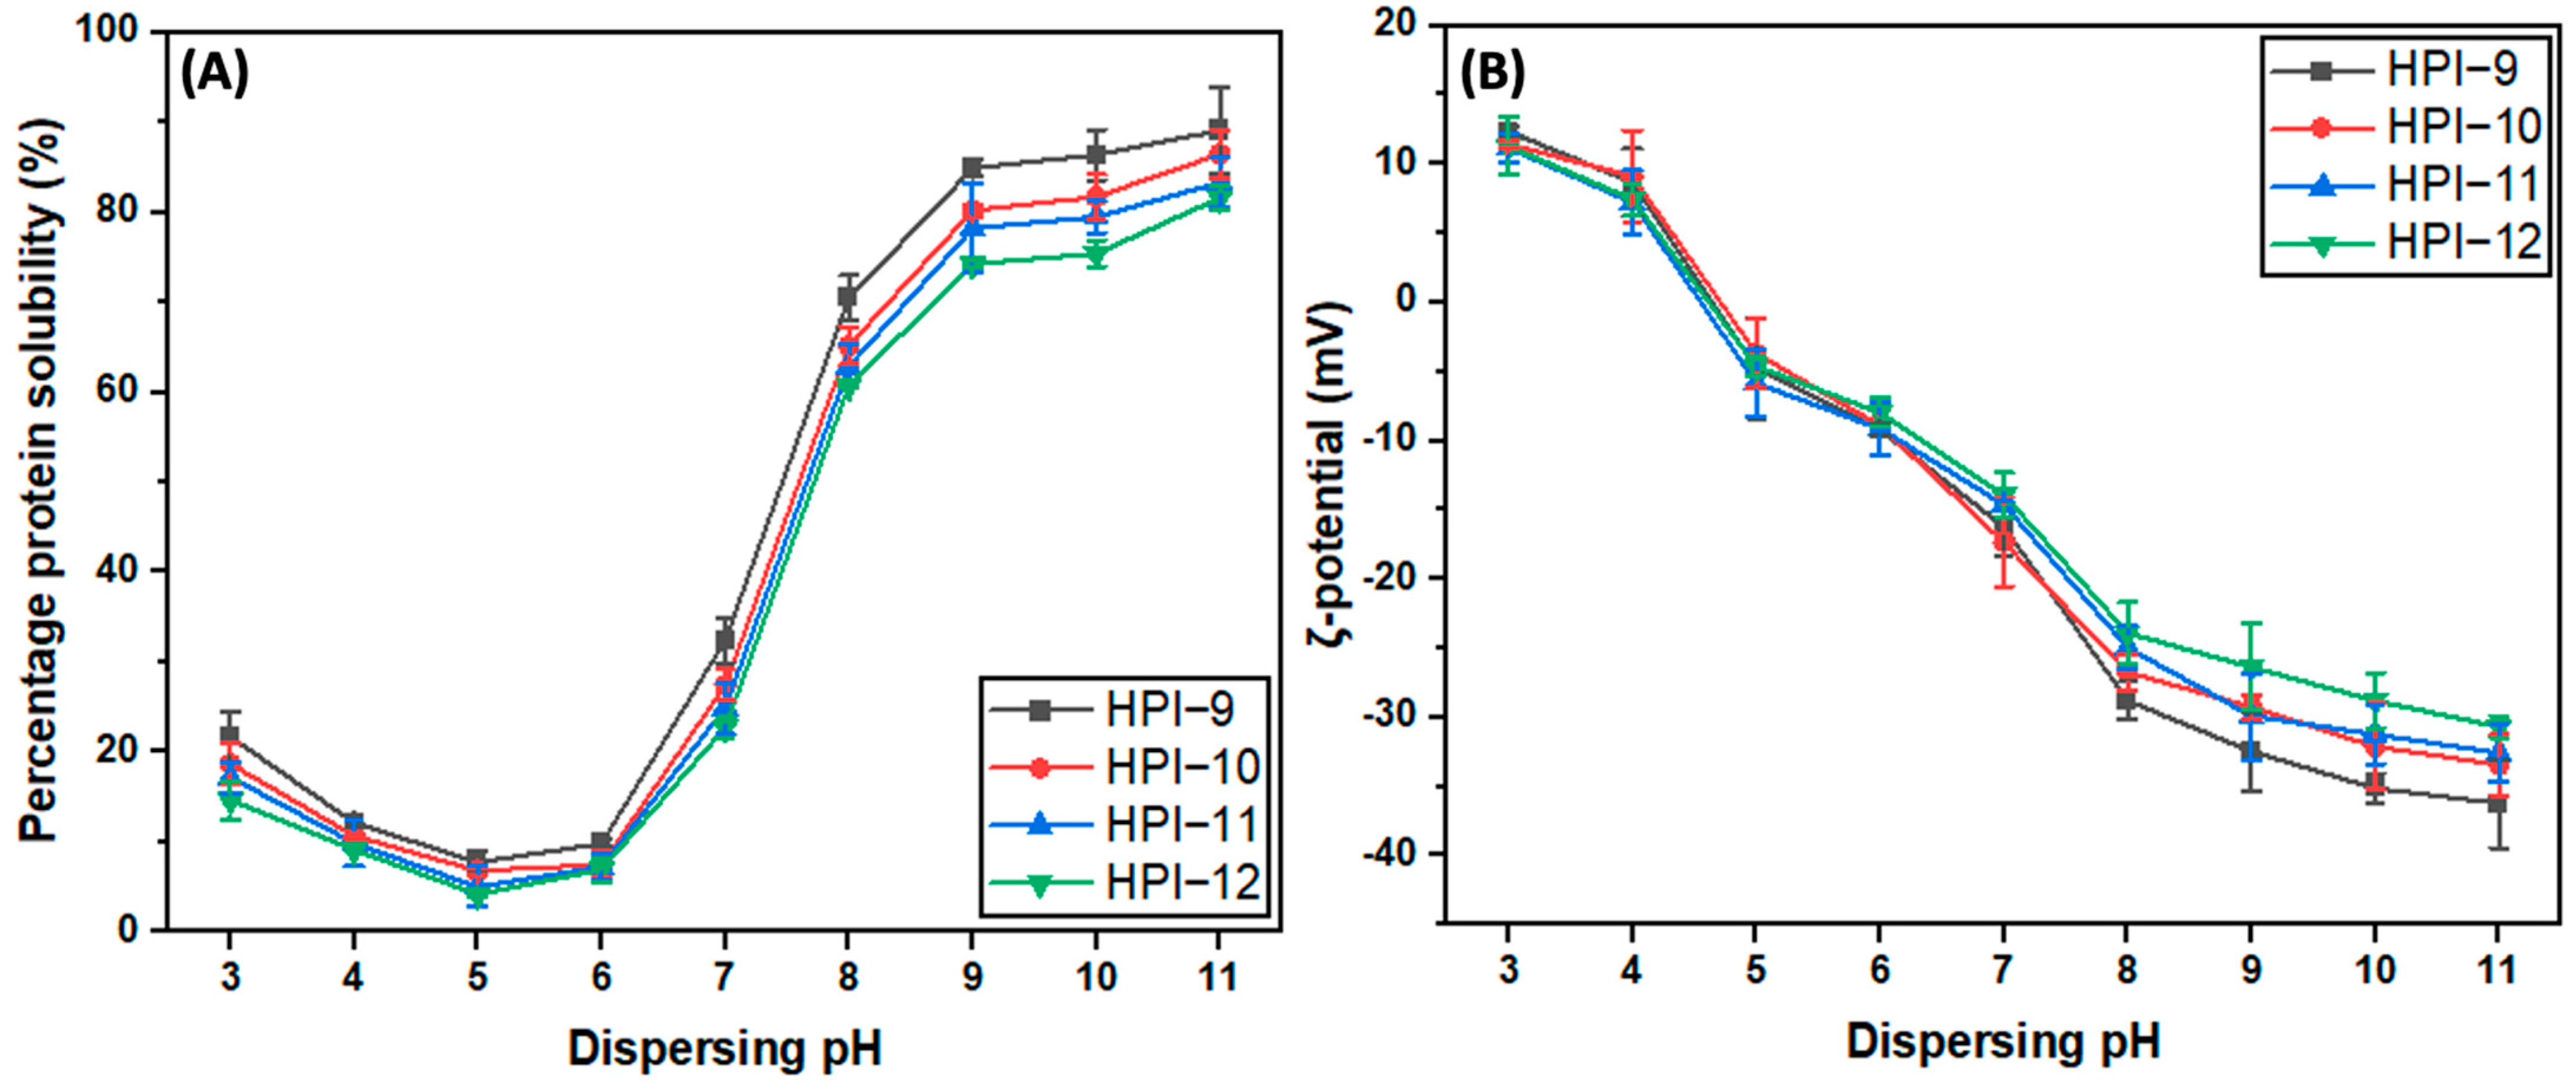
3.3.1. Protein Solubility and ζ-Potential

Protein solubility is an essential index that impacts many functional properties, such as foaming, gelling, and emulsifying capacities [62,63,64]. It is also a prerequisite for protein to be further applied in the food industry. Protein solubility (PS) is highly related to the carried charge of amino acids displayed on the protein surface [24]. Zeta potential is indicative of protein surface charges in the solvent and can help to explain its behavior. Generally, for commercial food applications, the pH of the food matrix should be slightly acidic (pH 4.0–6.0) up to neutral (pH 7.0) [28]. In this study, the hempseed protein pH-solubility profile (dispersing range pH 3–11) and its corresponding zeta potentials were determined, with the focus on the behavior in neutral pH and acidic range. As shown in Figure 6B, the ζ-potential of HPI solution ranged from positive (+11.2 mV) at pH 3.0 to highly negative (−36.2 mV) at pH 11.0, with a similar profile to a previous investigation [2]. The positive charge is owing to the protonation of carboxyl groups by H+. When the solution is more basic, the carboxyl groups are deprotonated, and the amino groups on the side chain are neutralised by OH, leading to a net negative charge. As the pH is decreased, the carboxyl groups become protonated and the pH neutralised. The zero charge, or isoelectric point for hempseed protein, can be observed between pH 4.0–5.0. The isoelectric point difference among these four samples was negligible, and the minor difference could be attributed to slight changes in amino acid content.
As visualised in Figure 6A, HPI samples produced from different extraction pH values (pH 9–12) all displayed a typical U-shape pH-solubility profile, which was consistent with the previous studies [2,15]. In all HPI samples, there was higher protein solubility in the alkaline range (pH > 8.0) than in the neutral and acidic range. The largest difference between the samples extracted at different pH occurred at a neutral and alkaline dispersion pH. For instance, the solubility of the HPI extracted at pH 12 and pH 9 differed by approximately 50% (32.4 ± 2.6% and 22.7 ± 1.1%, respectively) when dispersed at pH 7, but only differed by around 10% (89.1 ± 4.8% compared to 81.6 ± 1.4%) when dispersed at pH 11.0. As mentioned before, enhanced intermolecular SS bond formation incurred more protein aggregation at more alkaline extraction pH. In addition, after a 2 h extraction, a great extent of aggregation might exist in the final products, which further causes the poor solubility of HPI. The larger protein aggregates are presumably linked to the poor protein solubility. Strikingly, the protein solubility of all HPI samples in the food-processing range (pH 4–6) was extremely low. However, this is not surprising as the dispersing pH is around the protein isoelectric point of the protein (pH ~5). This again affirms that the currently used plant protein extraction protocol is not appropriate for the hempseed system. This is likely due to the unique characteristics of hempseed protein, which has a high content of sulfhydryl groups that distinguish it from other typical plant protein systems. The mechanistic understanding developed in this work can subsequently be used to develop improved extraction protocols able to produce more functional HPI.

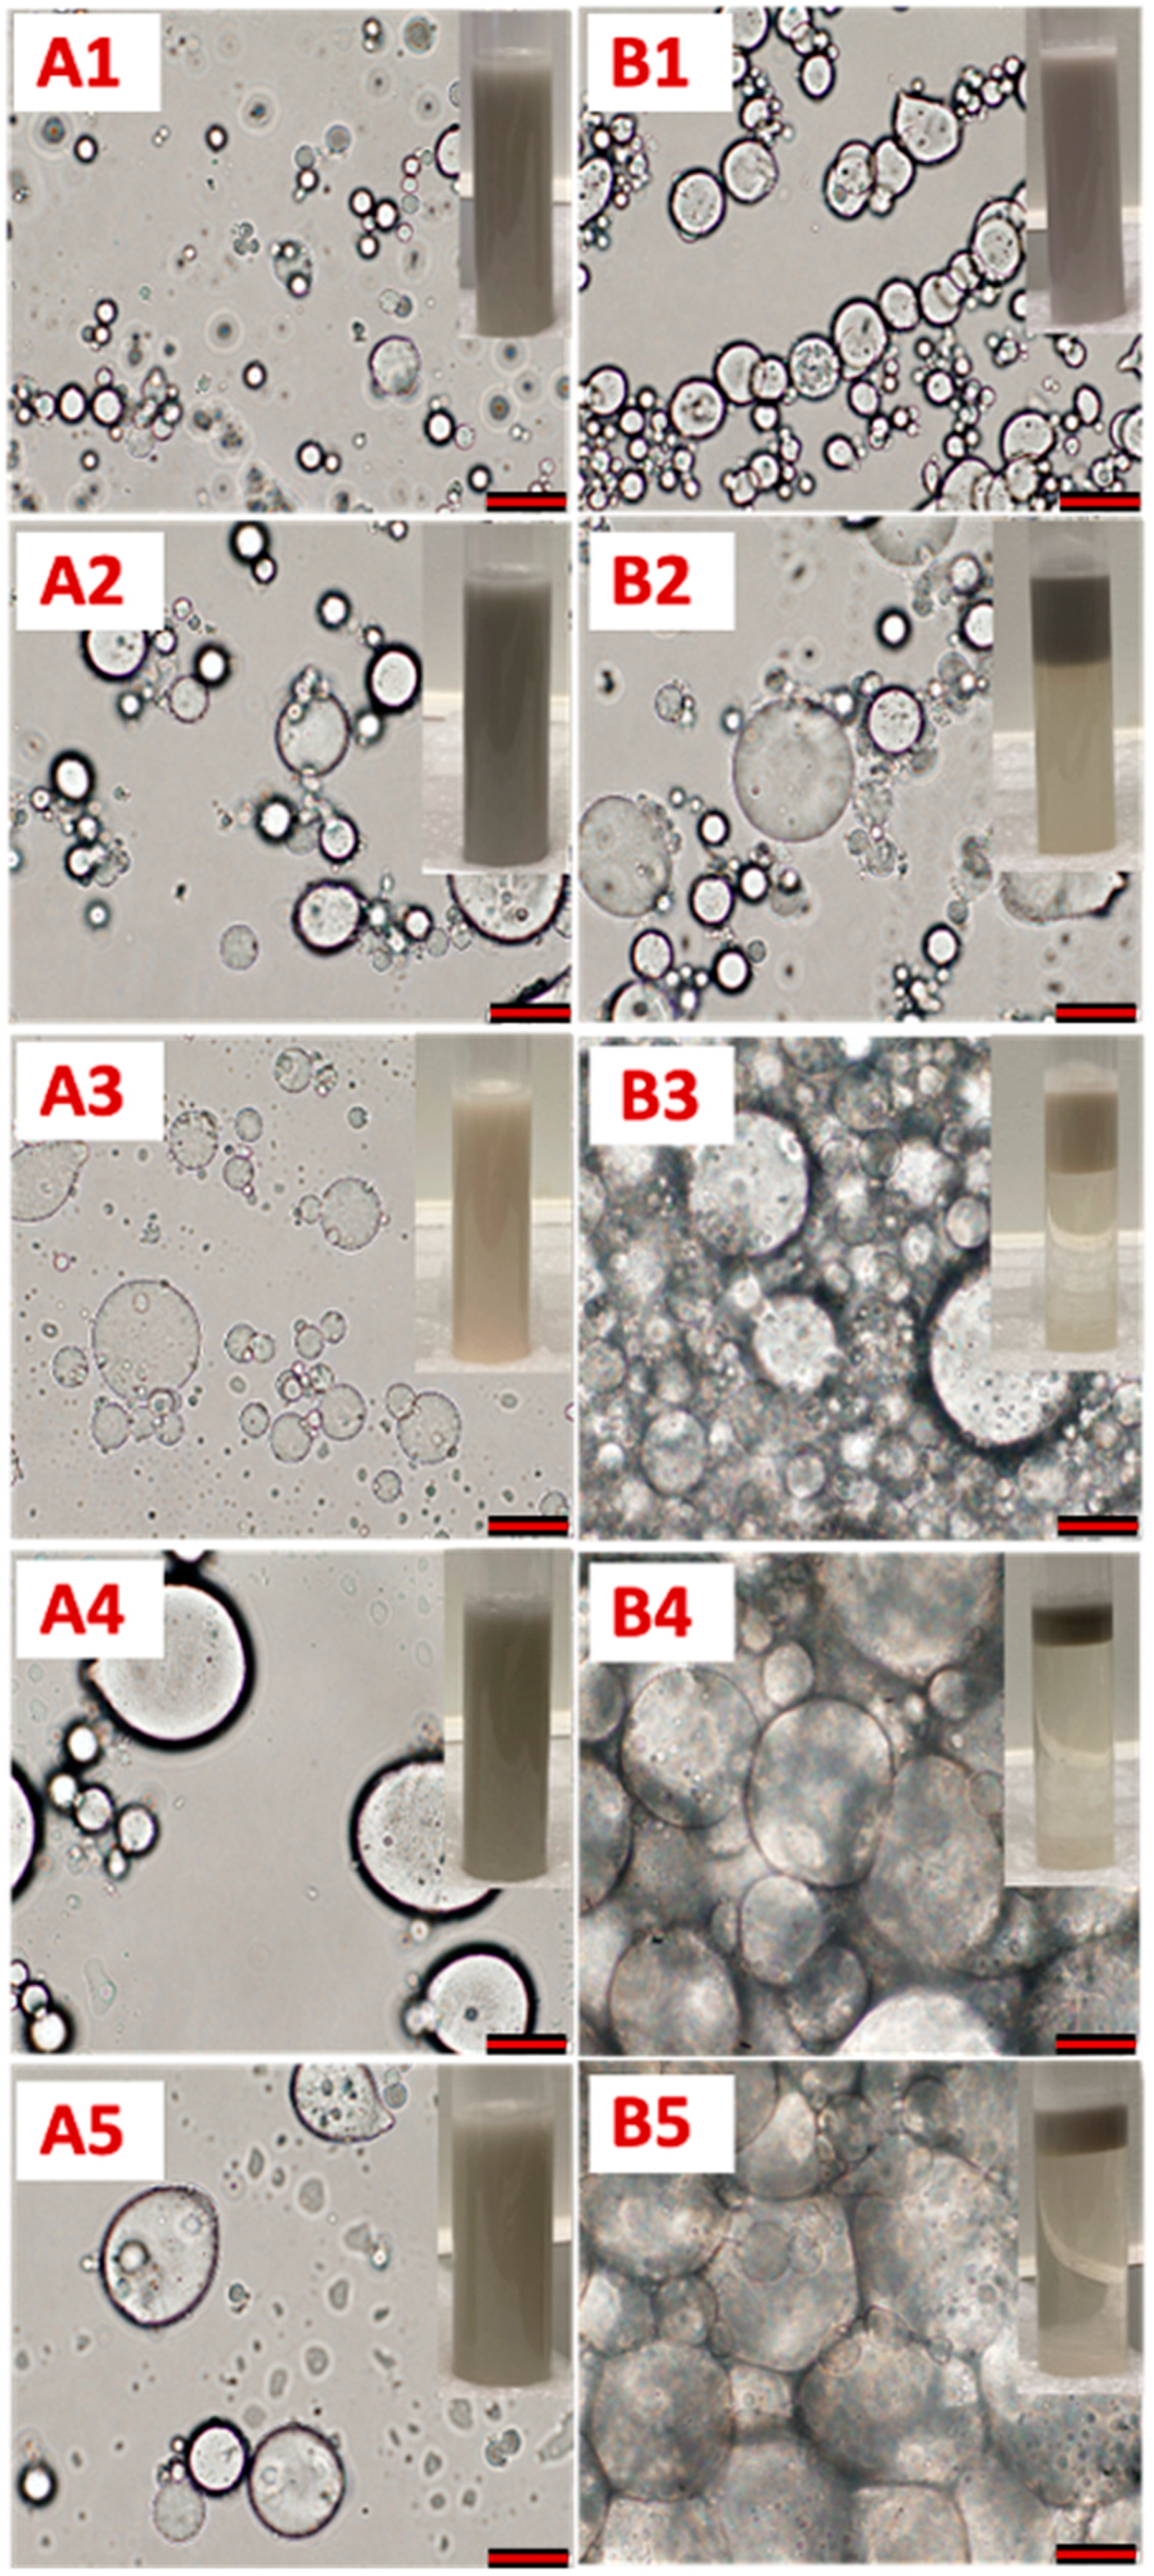
3.3.2. Emulsifying Properties

The emulsifying properties of a protein can significantly impact the texture, sensory quality, and stability of a food matrix [65]. Proteins are amphiphilic and function as an emulsifier by creating a film over oil droplets dispersed in water. The emulsifying capacity and stability are two key parameters that determine the ability of proteins to produce and stabilise emulsions [66]. The emulsifying ability (EAI), stability (creaming index), and emulsion droplet size for emulsions made from HPI extracted for different times at 37 °C and pH = 10.0 are summarised in Table 3. Unsurprisingly given the observed intramolecular disulphide bonding, the emulsifying properties of hempseed protein declined as the extraction proceeded. The best emulsifying properties of HPI were observed at the shortest 5 min extraction time, which had the highest free -SH content among all the samples. The decreased emulsifying properties as the extraction proceeds can be attributed to more aggregation between the protein molecules, as evidenced by the decrease in free -SH content. Our results were slightly higher than the other reported hempseed protein investigation by Wang et al. (5.6 ± 0.2 m2/g) [18]. The difference can be ascribed to different raw materials and extraction conditions. A lower temperature (24 °C) but longer extraction time (120 min) was selected in their study [18]. Moreover, the greater emulsifying ability found in the 5 min sample can also be linked to the emulsion droplet size, where the droplets in the 60 min sample (39.0 ± 9.4 μm) were almost four-fold larger than those in the 5 min sample (11.0 ± 0.9 μm). This suggested that the capacity of the hempseed protein to absorb at the water–oil interface gradually declined as the extraction time increased.
The emulsion stability was assessed by gravitational phase separation, with poorly stabilised emulsion droplets agglomerating into a top layer after some time. The creaming index of the 60 min sample (91.6%) was significantly higher than that of the 5 min sample (14.2%), suggesting a substantial decline in hempseed protein emulsifying stability properties occurred during prolonged extraction. Similarly, the investigation of Guo et al. [67] demonstrated that SS formation contributed to the aggregation of kidney bean protein, which adversely affected the kidney bean protein emulsion stabilising properties.
To better illustrate our emulsifying results, the hempseed-protein-stabilised emulsions were imaged by optical microscopy (Figure 7). It is evident that the droplets in the freshly made emulsion were progressively larger when made from protein obtained from longer extraction times (Figure 7, picA1–A5). Consistent with the particle sizing results, the smallest emulsion droplets were present in the emulsion formed using proteins at an extraction time of 5 min. In addition, very large droplets are visible in the background of images of the 7-day emulsions from longer extraction times (Figure 7, pic B3–B5), indicative of re-coalescence occurring in these emulsions. As can be seen in the macroscopic images (inserts), after 7 days of storage, only the emulsion made from the 5 min-extracted hempseed protein had not separated. Based on these results, it could be proposed that hempseed protein should exhibit at least 65 μmol/g of free -SH content to be suitable for emulsifying applications (Section 3.5).

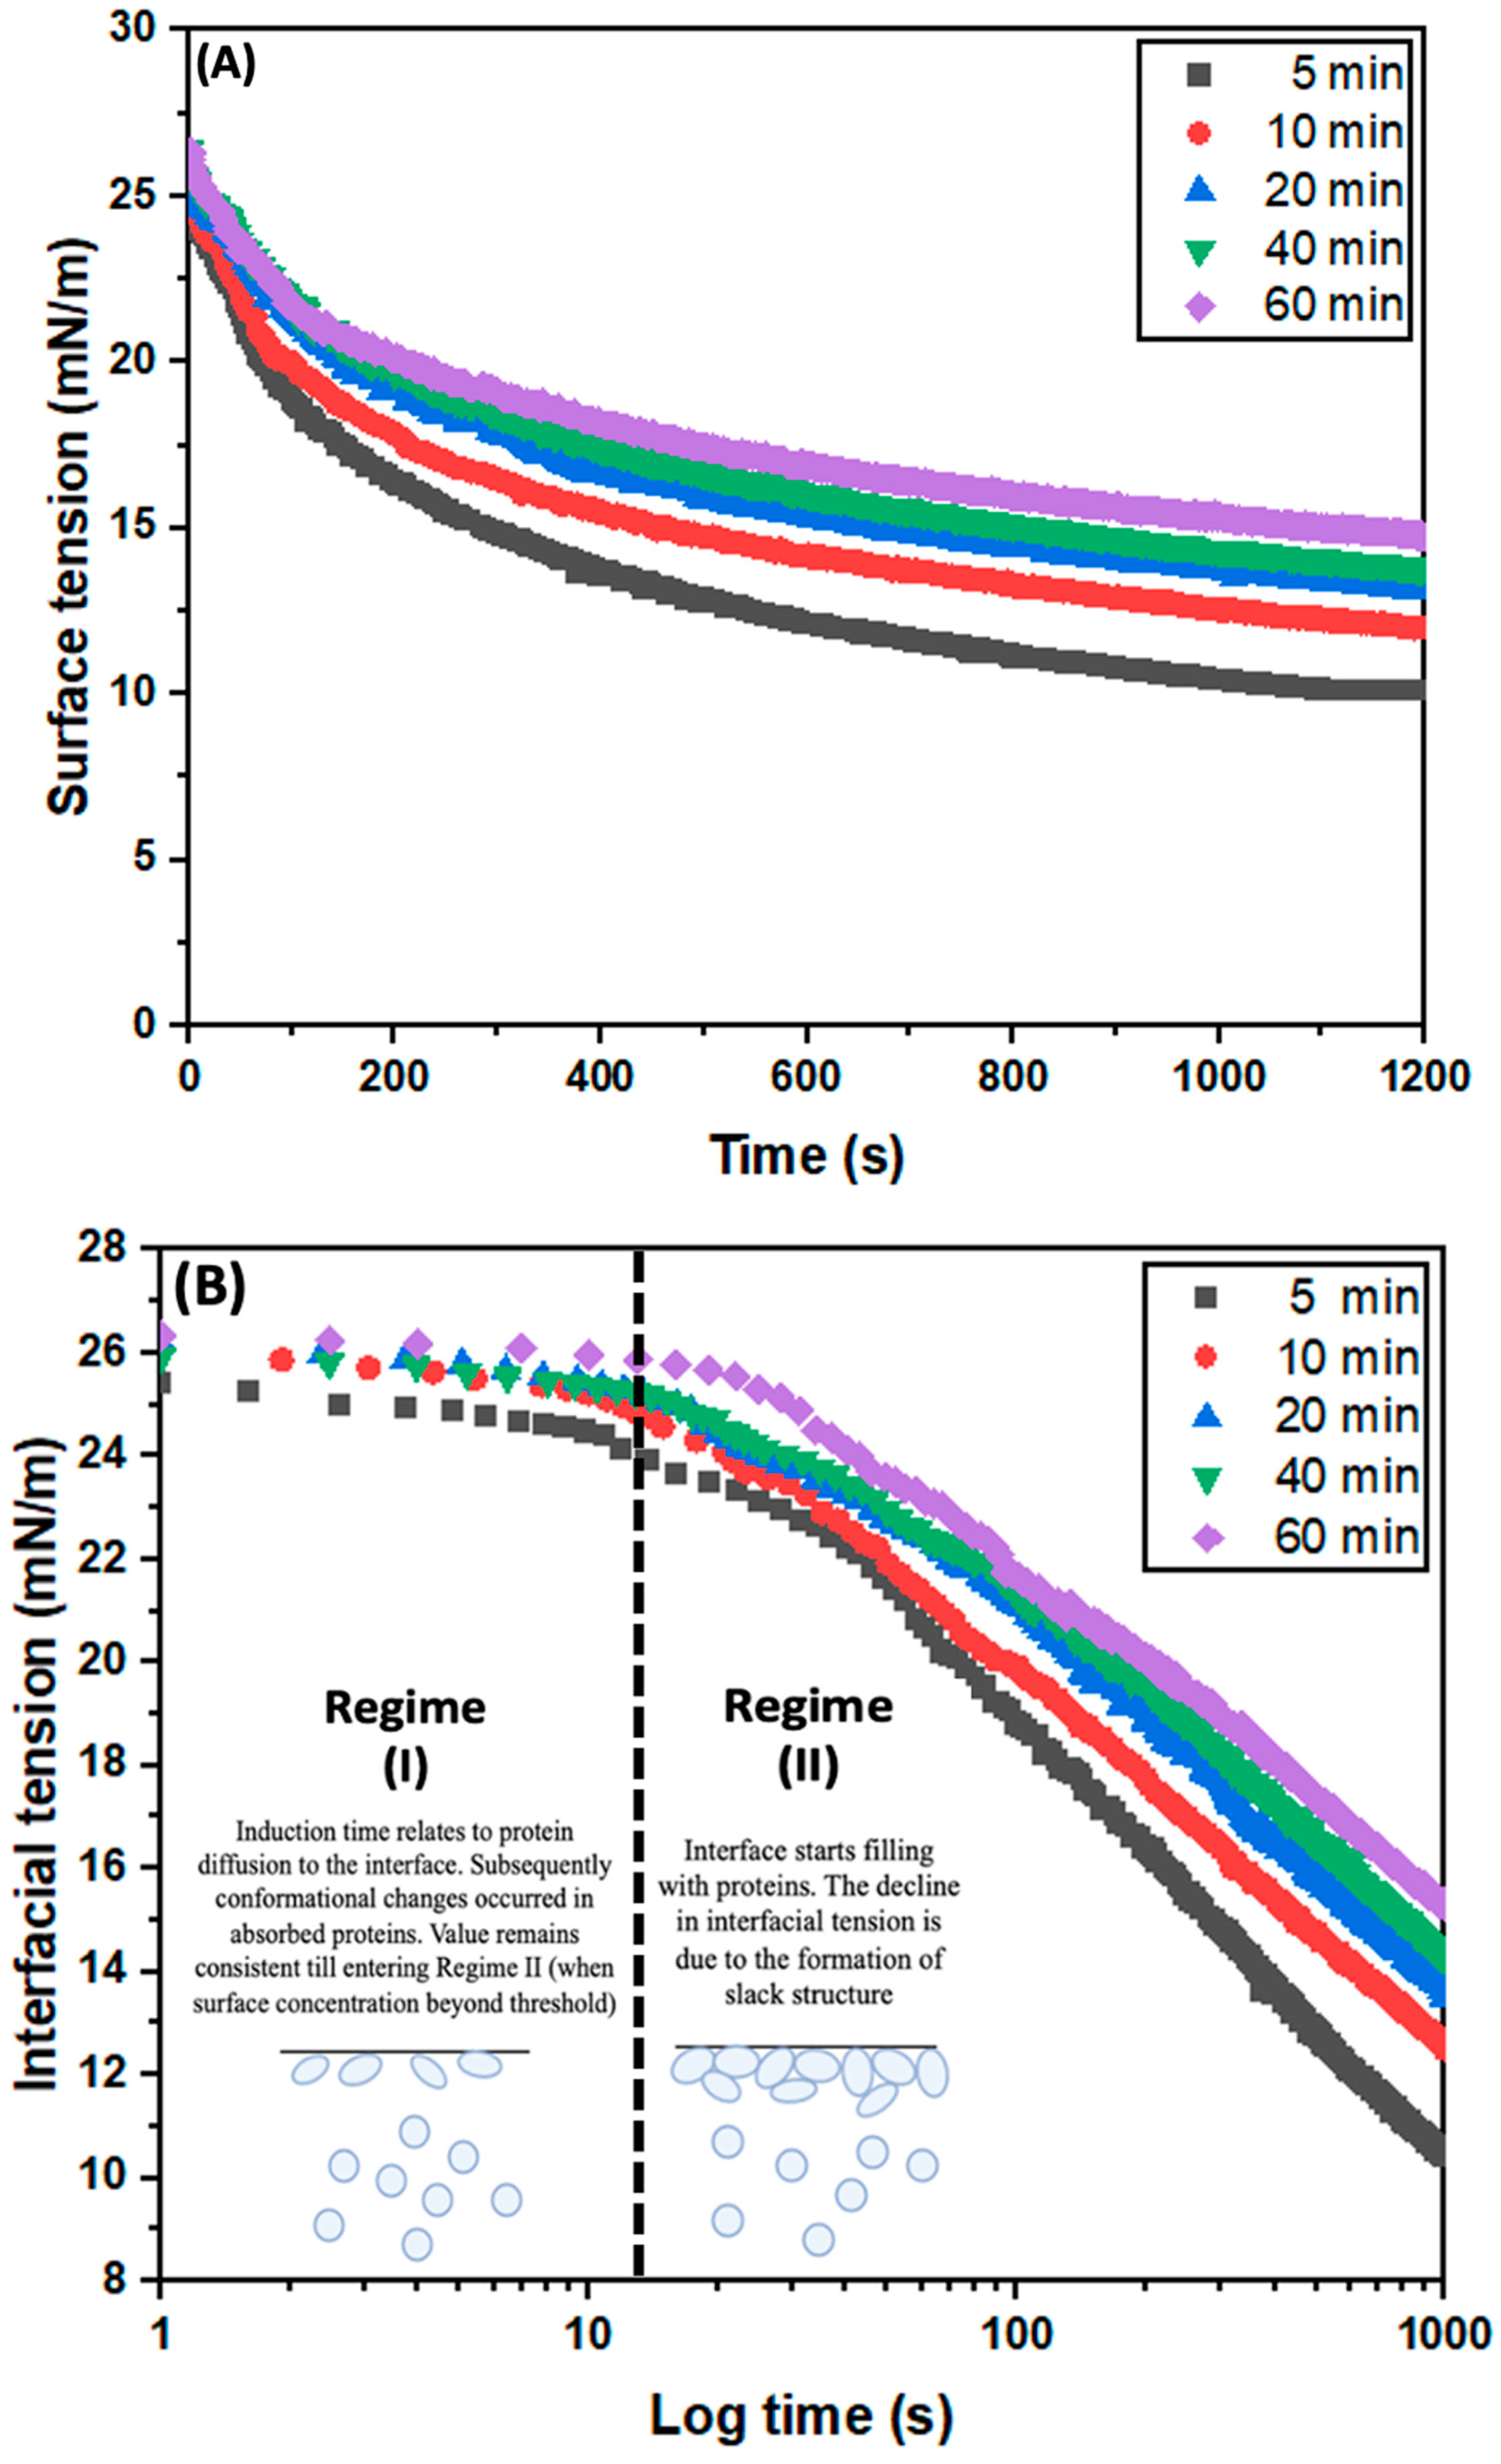
3.3.3. Surface Tension (γ)

The capacity and stability of the protein-stabilised emulsions are primarily associated with the protein surface activity at the water–oil interfaces [68]. Differences in the flexibility of protein molecules can cause them to either unfold or maintain their tertiary structure. For instance, lysozyme contains excessive disulphide bonds and retains its structure when adsorbed at an interface and is therefore not recommended to be used as an emulsifier [69]. In the current study, the adsorption kinetics of protein was investigated to help explain observed changes in emulsifying ability based on protein adsorption capacity at an interface. The interfacial surface tension of different hempseed proteins was measured for 20 min, as shown in Figure 8A. Among the hempseed proteins, the larger reduction in surface tension was observed for the proteins extracted for the shortest time of 5 min, with a value of ~10 mN/m after 20 min of adsorption. According to penetration theory, the cube root of the molecular weight showed an inverse proportionality with the diffusion coefficient [70], for samples extracted for a longer time which exhibited more SS bonds, leading to larger particle size. Therefore, the lower adsorption kinetics in the longer-time-extracted protein samples might be attributed to their larger particle size, reducing their susceptibility to conformational changes.
The dynamic surface tension changes were also probed and shown on a logarithm timescale, with two different regimes (I–II) identified, as marked in the Figure 8B. A similar investigation into protein adsorption at the interface was carried out by Beverung et al. [71]. As demonstrated by them, three different regimes could be observed when probing for more extended time scales. In this study, the main concern is the induction time in Regime I. Typically, in Regime I, the interfacial tension remains essentially constant for a short period until the surface-active proteins diffuse to the interface [46]. Compared to that of the 5 min sample, the induction time of the 60 min sample was increased from 11.9 s to 25.0 s. Regime I is considered as a phase dominated by protein diffusion and structural rearrangement, which can be linked to the protein structural information. Firstly, the greater size of the aggregated proteins resulting from prolonged extraction will diffuse more slowly than individual proteins. Secondly, the aggregated and cross-linked proteins will have less ability to rapidly unfold and expose hydrophobic regions that can adsorb at the water/oil interface [71]. Hence, the increased induction time in Regime I can be explained by the large and a more stable structures of the aggregated proteins caused by the intermolecular SS formed during extraction.
Figure 8. Changes in dynamic surface tension of hempseed protein adsorbed at a canola-oil–water interface as a function of time. The data were plotted on (A) linear and (B) logarithm timescale. Two regimes were identified and divided by a dashed line. The hempseed proteins were obtained from specific extraction times (5, 10, 20, 40, and 60 min) under 37 °C at pH 10. The initial surface tension γ of canola oil in this study was 25 ± 1 mN/m [72].
Applsci 13 06469 g008

3.4. Proposed Mechanism Underlying Hempseed Protein Extraction

A pair of cysteine residues forming an SS bond can be crucial for native protein folding and stability. A previous investigation by Anfinsen et al. [73] comparing SS bond formation in vivo and in vitro suggested that the oxidative thiol-to-disulphide mechanism can be different in in vitro conditions and result in more rapid formation. To gain further insights into the extraction mechanism occurring during hempseed protein extraction, an intracellular antioxidant sodium L-ascorbate was used to determine whether a redox reaction also occurred. As evidenced in Figure S2, no significant difference was observed between the control and the antioxidant-involved extraction. The absence of a significant difference in the rate of SS formation between the presence and absence of an antioxidant in this system suggests that a redox mechanism may not be the primary contributor to the observed phenomenon. Therefore, we consider the underlying mechanism of the thiol/disulphide exchange process in this study to involve an SN2 transition state, as illustrated in Figure 9 [74]. The free sulfhydryl groups were first deprotonated by hydroxide to thiolate anions (S). This highly reactive form attacks an existing disulphide bond in the system and forms the SN2 transition form (Cys-S-S-R). Subsequently, a new disulphide bond is formed by displacing the other sulphur atom in the transition form. The native state of disulphide in plant protein is displayed as intra-molecular [75], which indicates the transition form can only displace the last sulphur atom in intra-molecular disulphide at the initial reaction. However, the proportion of intermolecular SS bonds increases as the extraction proceeds, and S might attack the newly formed inter-SS instead of the intra-SS via disulphide shuffling procedure [76]. The protein aggregation caused by inter-SS formation via the disulphide shuffling process would cease upon introducing hydrogen ion (H+) into the system, as evidenced in Figure S1.

3.5. RSM Optimization of Hempseed Protein Extraction

The poor functionality of HPI has been a significant obstacle to using HPI in food applications. Based on the findings of this study, there is a strong link between the intermolecular SS content and the poor functionality of HPI. In this part of the study, the aim is to use an RSM to determine how to modify the current extraction protocol to improve the functional properties of HPI products.

3.5.1. Model Fitting

The impact of extraction pH (X1), time (X2), and temperature (X3) on two responses were investigated using multiple regression analysis on the experimental data. Box–Behnken design models for response prediction were established, which were expressed by quadratic polynomial equations as follows:
Hempseed   protein   concentration   mg / mL = 0.64   X 1 + 0.56   X 2 + 0.42   X 3 + 0.22   X 1 X 2 + 0.02   X 1 X 3 + 0.06   X 2 X 3 0.20   X 1 2 0.44   X 2 2 0.28   X 3 2 + 2.32   Adjusted   R 2 = 0.9732 ,   predicted   R 2 = 0.9124
Free   thiol   content   μ mol / g = 7.60   X 1 14.25   X 2 9.19   X 3 2.72   X 1 X 2 2.09   X 1 X 3 1.35   X 2 X 3 + 6.71   X 1 2 + 12.89     X 2 2 + 6.21     X 3 2 + 31.04   Adjusted   R 2 = 0.9894 ,   predicted   R 2 = 0.9261
The predicted R2 values of these two models are in reasonable agreement with the adjusted R2, and the predicted R2 suggests that the fitting model can account for more than 90% of the variations.
The p-value can determine whether the model factors are statistically significant (p < 0.05). The significance of each factor is shown in Table 4. It can be observed that the three independent parameters (pH, time, and temperature) dramatically influenced the two responses. To further improve the quality of HPI, it may be necessary to manipulate multiple variables simultaneously.

3.5.2. The Potential Impact of Optimising Extraction Conditions on HPI Functionality

The 3D RSM plots were obtained from the two responses according to regression Equations (7) and (8). Figure 10 plots the response of any two independent factors, with the third factor kept fixed, which can be used to analyse the interaction impacts between independent factors. Regarding the protein yield, only the interaction between pH and time (X1X2) was significant (p = 0.0094), while the interactions between pH–Temp (X1X3) and Temp–time (X2X3) were not significant (p > 0.05) (Table 4). This suggests that the pH exerts a substantial impact during the extraction, which fits our empirical findings.
Optimised extraction parameters were determined to maximise the functionality of HPI on the basis of maximising both the free -SH content (and a minimum criterion of ≥ 65 μmol/g, as reasoned in Section 3.3) and protein yield. The reliability of the optimum conditions was determined by the desirability values of the responses, which range from 0 to 1, analysed by Design Expert 13 software. The value of desirability closer to 1 indicated better extraction conditions. The optimised independent variables were at pH 11.0 for 5 min under 31.8 °C, with a desirability of 0.862. Under such extraction conditions, the projected protein yield was 1.343 mg/mL with 65.0 μmol/g of free -SH content. Subsequently, verification experiments under these optimised conditions were conducted to confirm the validity of the model results. The practical values of protein yield and free -SH content were 1.2 mg/mL and 64.1 μmol/g, respectively. The results have demonstrated a good agreement between the practical and the projected values.
Furthermore, the functionality of the optimised HPI was compared with the hempseed protein extracted by the original protocol (Table 5). Expectedly, compared with HPI extracted under conventional extraction conditions, the emulsifying properties were significantly improved. Notably, even though the protein solubility was enhanced, the improvement did not meet the required threshold. At a pH value most relevant to food processing (pH 4.0), the solubility only slightly improved from 11.1 ± 0.5% to 18.5 ± 3.8% after optimization. In addition, according to our findings, the maximum protein yield was 3.6 ± 0.2 mg/mL without considering the functionality. This indicated that, in order to obtain a high-functional HPI product, a three-fold yield loss has to be sacrificed to compensate for the functionality. Therefore, more research is required to discover other technology that can improve both the functionality and protein yield to maximise the usefulness of HPI products.

4. Conclusions

This study represents a systematic investigation of hempseed protein extraction. It has been observed that the conventional plant protein extraction processes are not suitable for hempseed. This study reveals that the prolonged extraction times and strongly alkaline conditions provide an ambient environment for intermolecular disulphide bond formation, which are responsible for the detrimental effects on protein functionality. The results show that both the protein solubility and emulsifying properties were reduced due to the formation of intermolecular SS bonds as the extraction proceeded. In terms of the emulsifying properties, the droplet size of emulsions was more than three-fold higher in emulsions made from proteins extracted for 60 min instead of 5 min, and the creaming index was also much higher. While the functionality of hempseed protein extracted after 5 min under pH 10.0 and 37 °C could be considered acceptable (based on a content of at least 65 μmol/g of free -SH content), only a low yield (30.6% of maximum) could be obtained. Subsequently, an optimum set of extraction conditions were determined using an RSM optimization design. However, only a minimal improvement in HPI functionality could be obtained at the optimised extraction conditions, while a three-fold protein yield loss was necessary to compensate for the increased functionality. Importantly, these findings suggest that it is impractical to produce high functionality with an ideal protein yield by only varying the extraction parameters. Additional work is required to investigate the use of other emerging methodologies (e.g., ultrasound and salt concentration) to improve the protein yield without affecting the high-functional properties to make HPI attractive to industrial applications, which will be the focus of future studies.

Supplementary Materials

The following supporting information can be downloaded at: https://www.mdpi.com/article/10.3390/app13116469/s1, Figure S1: The hempseed protein concentration and free -SH content change after a series of extraction pH adjustments. Figure S2: The impact of antioxidant agent introduction to the system on the protein concentration and free -SH content [77].

Author Contributions

Conceptualization, S.Y.; methodology, S.Y.; software, S.Y.; validation, S.Y., W.L., G.J.O.M. and M.A.; formal analysis, S.Y.; investigation, S.Y.; resources, G.J.O.M. and M.A.; data curation, S.Y.; writing—original draft preparation, S.Y.; writing—review and editing, W.L., G.J.O.M. and M.A.; visualization, S.Y.; supervision, W.L., G.J.O.M. and M.A.; project administration, M.A.; funding acquisition, M.A. All authors have read and agreed to the published version of the manuscript.

Funding

S.Y. acknowledges the University of Melbourne Research Scholarship. The authors acknowledge funding from Maxarham Pty Ltd.

Institutional Review Board Statement

Not applicable.

Informed Consent Statement

Not applicable.

Data Availability Statement

The data shown in this study are available in this article.

Conflicts of Interest

The authors declare no conflict of interest.

References

  1. Callaway, J.C. Hempseed as a nutritional resource: An overview. Euphytica 2004, 140, 65–72. [Google Scholar] [CrossRef]
  2. Shen, P.; Gao, Z.; Xu, M.; Ohm, J.-B.; Rao, J.; Chen, B. The impact of hempseed dehulling on chemical composition, structure properties and aromatic profile of hemp protein isolate. Food Hydrocoll. 2020, 106, 105889. [Google Scholar] [CrossRef]
  3. Dapčević-Hadnađev, T.; Hadnađev, M.; Dizdar, M.; Lješković, N.J. Functional and Bioactive Properties of Hemp Proteins. In Sustainable Agriculture Reviews; Springer: Berlin/Heidelberg, Germany, 2020; Volume 42, pp. 239–263. [Google Scholar]
  4. Malomo, S.A.; He, R.; Aluko, R.E. Structural and Functional Properties of Hemp Seed Protein Products. J. Food Sci. 2014, 79, C1512–C1521. [Google Scholar] [CrossRef]
  5. Potin, F.; Lubbers, S.; Husson, F.; Saurel, R. Hemp (Cannabis sativa L.) Protein Extraction Conditions Affect Extraction Yield and Protein Quality. J. Food Sci. 2019, 84, 3682–3690. [Google Scholar] [CrossRef] [PubMed]
  6. Hadnađev, M.; Dapčević-Hadnađev, T.; Lazaridou, A.; Moschakis, T.; Michaelidou, A.-M.; Popović, S.; Biliaderis, C.G. Hempseed meal protein isolates prepared by different isolation techniques. Part I. physicochemical properties. Food Hydrocoll. 2018, 79, 526–533. [Google Scholar] [CrossRef]
  7. Wang, Q.; Xiong, Y.L. Processing, nutrition, and functionality of hempseed protein: A review. Compr. Rev. Food Sci. Food Saf. 2019, 18, 936–952. [Google Scholar] [CrossRef]
  8. Malomo, S.A.; Aluko, R.E. A comparative study of the structural and functional properties of isolated hemp seed (Cannabis sativa L.) albumin and globulin fractions. Food Hydrocoll. 2015, 43, 743–752. [Google Scholar] [CrossRef]
  9. Dapčević-Hadnađev, T.; Dizdar, M.; Pojić, M.; Krstonošić, V.; Zychowski, L.M.; Hadnađev, M. Emulsifying properties of hemp proteins: Effect of isolation technique. Food Hydrocoll. 2019, 89, 912–920. [Google Scholar] [CrossRef]
  10. Teh, S.-S.; Bekhit, A.E.-D.; Carne, A.; Birch, J. Effect of the defatting process, acid and alkali extraction on the physicochemical and functional properties of hemp, flax and canola seed cake protein isolates. J. Food Meas. Charact. 2014, 8, 92–104. [Google Scholar] [CrossRef]
  11. Odani, S.; Odani, S. Isolation and primary structure of a methionine-and cystine-rich seed protein of Cannabis sativa. Biosci. Biotechnol. Biochem. 1998, 62, 650–654. [Google Scholar] [CrossRef]
  12. Patel, S.; Cudney, R.; McPherson, A. Crystallographic characterization and molecular symmetry of edestin, a legumin from hemp. J. Mol. Biol. 1994, 235, 361–363. [Google Scholar] [CrossRef] [PubMed]
  13. Docimo, T.; Caruso, I.; Ponzoni, E.; Mattana, M.; Galasso, I. Molecular characterization of edestin gene family in Cannabis sativa L. Plant Physiol. Biochem. 2014, 84, 142–148. [Google Scholar] [CrossRef] [PubMed]
  14. Beilinson, V.; Chen, Z.; Shoemaker, R.; Fischer, R.; Goldberg, R.; Nielsen, N. Genomic organization of glycinin genes in soybean. Theor. Appl. Genet. 2002, 104, 1132–1140. [Google Scholar] [CrossRef] [PubMed]
  15. Tang, C.-H.; Ten, Z.; Wang, X.-S.; Yang, X.-Q. Physicochemical and functional properties of hemp (Cannabis sativa L.) protein isolate. J. Agric. Food Chem. 2006, 54, 8945–8950. [Google Scholar] [CrossRef]
  16. Wang, X.-S.; Tang, C.-H.; Yang, X.-Q.; Gao, W.-R. Characterization, amino acid composition and in vitro digestibility of hemp (Cannabis sativa L.) proteins. Food Chem. 2008, 107, 11–18. [Google Scholar] [CrossRef]
  17. Wang, S.; Wang, J.; Xue, F.; Li, C. Effects of heating or ultrasound treatment on the enzymolysis and the structure characterization of hempseed protein isolates. J. Food Sci. Technol. 2019, 56, 3337–3346. [Google Scholar] [CrossRef]
  18. Wang, Q.; Jin, Y.; Xiong, Y.L. Heating-Aided pH Shifting Modifies Hemp Seed Protein Structure, Cross-Linking, and Emulsifying Properties. J. Agric. Food Chem. 2018, 66, 10827–10834. [Google Scholar] [CrossRef]
  19. Yin, S.-W.; Tang, C.-H.; Cao, J.-S.; Hu, E.-K.; Wen, Q.-B.; Yang, X.-Q. Effects of limited enzymatic hydrolysis with trypsin on the functional properties of hemp (Cannabis sativa L.) protein isolate. Food Chem. 2008, 106, 1004–1013. [Google Scholar] [CrossRef]
  20. Kim, K.S.; Rhee, J.S. Effects of Acetylation on Physicochemical Properties of J1s Soy Protein. J. Food Biochem. 1989, 13, 187–199. [Google Scholar] [CrossRef]
  21. Ma, C.-Y.; Wood, D.F. Functional properties of oat proteins modified by acylation, trypsin hydrolysis or linoleate treatment. J. Am. Oil Chem. Soc. 1987, 64, 1726–1731. [Google Scholar] [CrossRef]
  22. Yin, S.W.; Tang, C.H.; Wen, Q.B.; Yang, X.Q. Functional and structural properties and in vitro digestibility of acylated hemp (Cannabis sativa L.) protein isolates. Int. J. Food Sci. Technol. 2009, 44, 2653–2661. [Google Scholar] [CrossRef]
  23. Shaaban, S.; Negm, A.; Sobh, M.A.; Wessjohann, L.A. Organoselenocyanates and symmetrical diselenides redox modulators: Design, synthesis and biological evaluation. Eur. J. Med. Chem. 2015, 97, 190–201. [Google Scholar] [CrossRef]
  24. Li, Y.; Cheng, Y.; Zhang, Z.; Wang, Y.; Mintah, B.K.; Dabbour, M.; Jiang, H.; He, R.; Ma, H. Modification of rapeseed protein by ultrasound-assisted pH shift treatment: Ultrasonic mode and frequency screening, changes in protein solubility and structural characteristics. Ultrason. Sonochem. 2020, 69, 105240. [Google Scholar] [CrossRef] [PubMed]
  25. Matsudomi, N.; Sasaki, T.; Kato, A.; Kobayashi, K. Conformational changes and functional properties of acid-modified soy protein. Agric. Biol. Chem. 1985, 49, 1251–1256. [Google Scholar]
  26. Nissen, S.H.; Schmidt, J.M.; Gregersen, S.; Hammershøj, M.; Møller, A.H.; Danielsen, M.; Stødkilde, L.; Nebel, C.; Dalsgaard, T.K. Increased solubility and functional properties of precipitated Alfalfa protein concentrate subjected to pH shift processes. Food Hydrocoll. 2021, 119, 106874. [Google Scholar] [CrossRef]
  27. Jiang, J.; Zhu, B.; Liu, Y.; Xiong, Y.L. Interfacial structural role of pH-shifting processed pea protein in the oxidative stability of oil/water emulsions. J. Agric. Food Chem. 2014, 62, 1683–1691. [Google Scholar] [CrossRef]
  28. Gao, Z.; Shen, P.; Lan, Y.; Cui, L.; Ohm, J.-B.; Chen, B.; Rao, J. Effect of alkaline extraction pH on structure properties, solubility, and beany flavor of yellow pea protein isolate. Food Res. Int. 2020, 131, 109045. [Google Scholar] [CrossRef]
  29. Ren, Y.; Liang, K.; Jin, Y.; Zhang, M.; Chen, Y.; Wu, H.; Lai, F. Identification and characterization of two novel α-glucosidase inhibitory oligopeptides from hemp (Cannabis sativa L.) seed protein. J. Funct. Foods 2016, 26, 439–450. [Google Scholar] [CrossRef]
  30. Orio, L.P.; Boschin, G.; Recca, T.; Morelli, C.F.; Ragona, L.; Francescato, P.; Arnoldi, A.; Speranza, G. New ACE-inhibitory peptides from hemp seed (Cannabis sativa L.) proteins. J. Agric. Food Chem. 2017, 65, 10482–10488. [Google Scholar] [CrossRef]
  31. Lu, R.-R.; Qian, P.; Sun, Z.; Zhou, X.-H.; Chen, T.-P.; He, J.-F.; Zhang, H.; Wu, J. Hempseed protein derived antioxidative peptides: Purification, identification and protection from hydrogen peroxide-induced apoptosis in PC12 cells. Food Chem. 2010, 123, 1210–1218. [Google Scholar] [CrossRef]
  32. Raikos, V.; Duthie, G.; Ranawana, V. Denaturation and Oxidative Stability of Hemp Seed (Cannabis sativa L.) Protein Isolate as Affected by Heat Treatment. Plant Foods Hum. Nutr. 2015, 70, 304–309. [Google Scholar] [CrossRef] [PubMed]
  33. Zhou, X.; Zheng, Y.; Zhong, Y.; Wang, D.; Deng, Y. Casein-hempseed protein complex via cross-link catalyzed by transglutaminase for improving structural, rheological, emulsifying and gelation properties. Food Chem. 2022, 383, 132366. [Google Scholar] [CrossRef] [PubMed]
  34. Potin, F.; Goure, E.; Lubbers, S.; Husson, F.; Saurel, R. Functional properties of hemp protein concentrate obtained by alkaline extraction and successive ultrafiltration and spray-drying. Int. J. Food Sci. Technol. 2022, 57, 436–446. [Google Scholar] [CrossRef]
  35. Mamone, G.; Picariello, G.; Ramondo, A.; Nicolai, M.A.; Ferranti, P. Production, digestibility and allergenicity of hemp (Cannabis sativa L.) protein isolates. Food Res. Int. 2019, 115, 562–571. [Google Scholar] [CrossRef]
  36. Drinić, Z.; Vladic, J.; Koren, A.; Zeremski, T.; Stojanov, N.; Tomić, M.; Vidović, S. Application of conventional and high-pressure extraction techniques for the isolation of bioactive compounds from the aerial part of hemp (Cannabis sativa L.) assortment Helena. Ind. Crop. Prod. 2021, 171, 113908. [Google Scholar] [CrossRef]
  37. Wall, S.B.; Oh, J.-Y.; Diers, A.R.; Landar, A. Oxidative Modification of Proteins: An Emerging Mechanism of Cell Signaling. Front. Physiol. 2012, 3, 369. [Google Scholar] [CrossRef]
  38. LoPachin, R.M.; Gavin, T. Reactions of electrophiles with nucleophilic thiolate sites: Relevance to pathophysiological mechanisms and remediation. Free. Radic. Res. 2016, 50, 195–205. [Google Scholar] [CrossRef]
  39. Yao, S.; Li, W.; Wu, Y.; Martin, G.J.O.; Ashokkumar, M. The Impact of High-Intensity Ultrasound-Assisted Extraction on the Structural and Functional Properties of Hempseed Protein Isolate (HPI). Foods 2023, 12, 348. [Google Scholar] [CrossRef]
  40. Wu, Y.; Li, W.; Martin, G.J.; Ashokkumar, M. Mechanism of low-frequency and high-frequency ultrasound-induced inactivation of soy trypsin inhibitors. Food Chem. 2021, 360, 130057. [Google Scholar] [CrossRef]
  41. Bradford, M.M. A rapid and sensitive method for the quantitation of microgram quantities of protein utilizing the principle of protein-dye binding. Anal. Biochem. 1976, 72, 248–254. [Google Scholar] [CrossRef]
  42. Beveridge, T.; Toma, S.; Nakai, S. Determination of SH- and SS-groups in some food proteins using Ellman’s reagent. J. Food Sci. 1974, 39, 49–51. [Google Scholar] [CrossRef]
  43. Ladjal-Ettoumi, Y.; Boudries, H.; Chibane, M.; Romero, A. Pea, Chickpea and Lentil Protein Isolates: Physicochemical Characterization and Emulsifying Properties. Food Biophys. 2016, 11, 43–51. [Google Scholar] [CrossRef]
  44. Amagliani, L.; O’Regan, J.; Kelly, A.L.; O’Mahony, J.A. The composition, extraction, functionality and applications of rice proteins: A review. Trends Food Sci. Technol. 2017, 64, 1–12. [Google Scholar] [CrossRef]
  45. Pearce, K.N.; Kinsella, J.E. Emulsifying properties of proteins: Evaluation of a turbidimetric technique. J. Agric. Food Chem. 1978, 26, 716–723. [Google Scholar] [CrossRef]
  46. Yatipanthalawa, B.; Li, W.; Hill, D.R.; Trifunovic, Z.; Ashokkumar, M.; Scales, P.J.; Martin, G.J. Interplay between interfacial behaviour, cell structure and shear enables biphasic lipid extraction from whole diatom cells (Navicula sp.). J. Colloid Interface Sci. 2021, 589, 65–76. [Google Scholar] [CrossRef] [PubMed]
  47. Guo, P.; Cao, Z.; Chen, S.; Chen, C.; Liu, J.; Meng, J. Application of Design-Expert Response Surface Methodology for the Optimization of Recycled Asphalt Mixture with Waste Engine Oil. J. Mater. Civ. Eng. 2021, 33, 04021075. [Google Scholar] [CrossRef]
  48. Shen, P.; Gao, Z.; Xu, M.; Rao, J.; Chen, B. Physicochemical and structural properties of proteins extracted from dehulled industrial hempseeds: Role of defatting process and precipitation pH. Food Hydrocoll. 2020, 108, 106065. [Google Scholar] [CrossRef]
  49. Sari, Y.W.; Mulder, W.J.; Sanders, J.P.M.; Bruins, M.E. Towards plant protein refinery: Review on protein extraction using alkali and potential enzymatic assistance. Biotechnol. J. 2015, 10, 1138–1157. [Google Scholar] [CrossRef]
  50. Momen, S.; Alavi, F.; Aider, M. Alkali-mediated treatments for extraction and functional modification of proteins: Critical and application review. Trends Food Sci. Technol. 2021, 110, 778–797. [Google Scholar] [CrossRef]
  51. Ashori, A.; Ornelas, M.; Sheshmani, S.; Cordeiro, N. Influence of mild alkaline treatment on the cellulosic surfaces active sites. Carbohydr. Polym. 2012, 88, 1293–1298. [Google Scholar] [CrossRef]
  52. Feyzi, S.; Milani, E.; Golimovahhed, Q.A. Grass Pea (Lathyrus sativus L.) Protein Isolate: The Effect of Extraction Optimization and Drying Methods on the Structure and Functional Properties. Food Hydrocoll. 2018, 74, 187–196. [Google Scholar] [CrossRef]
  53. Östbring, K.; Nilsson, K.; Ahlström, C.; Fridolfsson, A.; Rayner, M. Emulsifying and Anti-Oxidative Properties of Proteins Extracted from Industrially Cold-Pressed Rapeseed Press-Cake. Foods 2020, 9, 678. [Google Scholar] [CrossRef] [PubMed]
  54. Gadalkar, S.M.; Gogate, P.R.; Rathod, V.K. Recovery of Proteins from Rice Mill Industry Waste (Rice Bran) Using Alkaline or NaCl-Assisted Alkaline Extraction Processes. J. Food Process. Eng. 2017, 40, e12430. [Google Scholar] [CrossRef]
  55. Sari, Y.W.; Bruins, M.E.; Sanders, J.P. Enzyme assisted protein extraction from rapeseed, soybean, and microalgae meals. Ind. Crop. Prod. 2013, 43, 78–83. [Google Scholar] [CrossRef]
  56. Plati, F.; Ritzoulis, C.; Pavlidou, E.; Paraskevopoulou, A. Complex coacervate formation between hemp protein isolate and gum Arabic: Formulation and characterization. Int. J. Biol. Macromol. 2021, 182, 144–153. [Google Scholar] [CrossRef] [PubMed]
  57. Sereewatthanawut, I.; Prapintip, S.; Watchiraruji, K.; Goto, M.; Sasaki, M.; Shotipruk, A. Extraction of protein and amino acids from deoiled rice bran by subcritical water hydrolysis. Bioresour. Technol. 2008, 99, 555–561. [Google Scholar] [CrossRef]
  58. L’Hocine, L.; Boye, J.I.; Arcand, Y. Composition and Functional Properties of Soy Protein Isolates Prepared Using Alternative Defatting and Extraction Procedures. J. Food Sci. 2006, 71, C137–C145. [Google Scholar] [CrossRef]
  59. Stone, A.K.; Karalash, A.; Tyler, R.T.; Warkentin, T.D.; Nickerson, M.T. Functional attributes of pea protein isolates prepared using different extraction methods and cultivars. Food Res. Int. 2015, 76, 31–38. [Google Scholar] [CrossRef]
  60. Jarpa-Parra, M. Lentil protein: A review of functional properties and food application. An overview of lentil protein functionality. Int. J. Food Sci. Technol. 2018, 53, 892–903. [Google Scholar] [CrossRef]
  61. Avelar, Z.; Vicente, A.A.; Saraiva, J.A.; Rodrigues, R.M. The role of emergent processing technologies in tailoring plant protein functionality: New insights. Trends Food Sci. Technol. 2021, 113, 219–231. [Google Scholar] [CrossRef]
  62. Schmitt, C.; Bovay, C.; Rouvet, M.; Shojaei-Rami, S.; Kolodziejczyk, E. Whey Protein Soluble Aggregates from Heating with NaCl: Physicochemical, Interfacial, and Foaming Properties. Langmuir 2007, 23, 4155–4166. [Google Scholar] [CrossRef] [PubMed]
  63. Alavi, F.; Chen, L.; Wang, Z.; Emam-Djomeh, Z. Consequences of heating under alkaline pH alone or in the presence of maltodextrin on solubility, emulsifying and foaming properties of faba bean protein. Food Hydrocoll. 2021, 112, 106335. [Google Scholar] [CrossRef]
  64. Tan, S.H.; Mailer, R.J.; Blanchard, C.L.; Agboola, S.O.; Day, L. Gelling properties of protein fractions and protein isolate extracted from Australian canola meal. Food Res. Int. 2014, 62, 819–828. [Google Scholar] [CrossRef]
  65. Aryee, A.; Agyei, D.; Udenigwe, C. Impact of processing on the chemistry and functionality of food proteins. In Proteins in Food Processing; Elsevier: Amsterdam, The Netherlands, 2018; pp. 27–45. [Google Scholar] [CrossRef]
  66. Malik, M.A.; Sharma, H.K.; Saini, C.S. High intensity ultrasound treatment of protein isolate extracted from dephenolized sunflower meal: Effect on physicochemical and functional properties. Ultrason. Sonochem. 2017, 39, 511–519. [Google Scholar] [CrossRef] [PubMed]
  67. Guo, Z.; Huang, Z.; Guo, Y.; Li, B.; Yu, W.; Zhou, L.; Jiang, L.; Teng, F.; Wang, Z. Effects of high-pressure homogenization on structural and emulsifying properties of thermally soluble aggregated kidney bean (Phaseolus vulgaris L.) proteins. Food Hydrocoll. 2021, 119, 106835. [Google Scholar] [CrossRef]
  68. Friberg, S.; Larsson, K.; Sjoblom, J. Food Emulsions; CRC Press: Boca Raton, FL, USA, 2003. [Google Scholar]
  69. Poon, S.; Clarke, A.E.; Schultz, C.J. Effect of Denaturants on the Emulsifying Activity of Proteins. J. Agric. Food Chem. 2001, 49, 281–286. [Google Scholar] [CrossRef]
  70. Ward, A.; Tordai, L. Time-dependence of boundary tensions of solutions I. The role of diffusion in time-effects. J. Chem. Phys. 1946, 14, 453–461. [Google Scholar] [CrossRef]
  71. Beverung, C.; Radke, C.J.; Blanch, H.W. Protein adsorption at the oil/water interface: Characterization of adsorption kinetics by dynamic interfacial tension measurements. Biophys. Chem. 1999, 81, 59–80. [Google Scholar] [CrossRef]
  72. Abu Baka, N.; Abu-Siada, A.; Islam, S.; El-Naggar, M.F. A new technique to measure interfacial tension of transformer oil using UV-Vis spectroscopy. IEEE Trans. Dielectr. Electr. Insul. 2015, 22, 1275–1282. [Google Scholar] [CrossRef]
  73. Anfinsen, C.B. Principles that Govern the Folding of Protein Chains. Science 1973, 181, 223–230. [Google Scholar] [CrossRef]
  74. Fernandes, P.A.; Ramos, M.J. Theoretical Insights into the Mechanism for Thiol/Disulfide Exchange. Chem. A Eur. J. 2004, 10, 257–266. [Google Scholar] [CrossRef]
  75. Taniyama, Y.; Kuroki, R.; Omura, F.; Seko, C.; Kikuchi, M. Evidence for intramolecular disulfide bond shuffling in the folding of mutant human lysozyme. J. Biol. Chem. 1991, 266, 6456–6461. [Google Scholar] [CrossRef]
  76. Coghlan, J.; Benet, A.; Kumaran, P.; Ford, M.; Veale, L.; Skilton, S.J.; Saveliev, S.; Schwendeman, A.A. Streamlining the Characterization of Disulfide Bond Shuffling and Protein Degradation in IgG1 Biopharmaceuticals Under Native and Stressed Conditions. Front. Bioeng. Biotechnol. 2022, 10, 311. [Google Scholar] [CrossRef]
  77. Giustarini, D.; Dalle-Donne, I.; Colombo, R.; Milzani, A.; Rossi, R. Is ascorbate able to reduce disulfide bridges? A cautionary note. Nitric Oxide 2008, 19, 252–258. [Google Scholar] [CrossRef]
Figure 1. Flow chart of the preparation of HPI products.
Applsci 13 06469 g001
Figure 2. Flow chart of the mechanistic study of the HPI extraction system.
Applsci 13 06469 g002
Figure 3. Impacts of extraction conditions on the kinetics of hempseed protein extraction. The effects of pH on (A) protein concentration and (B) free -SH content at a fixed temperature (37 °C) as a function of extraction time. The impact of temperature on (C) protein concentration (D) and free -SH content at fixed pH (10.0). Experiments were carried out as triplicates.
Applsci 13 06469 g003
Figure 4. (A) SDS-PAGE profiles of hempseed protein after different extraction times (0, 5, and 120 min) with (reducing, R) or without (non-reducing, NR) the addition of β-ME. The protein was extracted under pH = 10.0 at 37 °C. Different bands were identified and marked on the profile image, including a large extent of smearing (>50.0 kDa), edestin (50.0 kDa), edestin AS (34.0 kDa), edestin BS (18.0 and 20.0 kDa), and albumin (10.0–15.0 kDa). (B) The relative band intensities of hempseed protein subunits (50 and >250 kDa) at 0, 5, and 120 min extraction times, which were analysed by Gel-doc software. Means denoted by a different letter indicate significant differences (p < 0.05).
Applsci 13 06469 g004
Figure 5. Non-reducing (NR) and reducing (R) SDS-PAGE gels display the effect of extraction pH on hempseed protein subunits. The extractions were carried out at a fixed temperature (37 °C) and time (2 h). Lane 1: Protein standard; Lane 2: pH 9, non-reducing; Lane 3: pH 10, non-reducing; Lane 4: pH 11, non-reducing; Lane 5: pH 9, reducing; Lane 6: pH 10, reducing; and Lane 7: pH 11, reducing.
Applsci 13 06469 g005
Figure 6. (A) pH−solubility profiles and (B) ζ−potential profiles of HPI samples extracted at pH 9.0, 10.0, 11.0, and 12.0. The other extraction parameters were set at a fixed temperature (37 °C) and time (2 h).
Applsci 13 06469 g006
Figure 7. Microstructure of hempseed-protein-stabilised emulsions as imaged by an optical microscope. The freshly-made emulsions stabilised with hempseed protein from specific extraction times of 5, 10, 20, 40, and 60 min are shown in images (A1A5). In addition, their corresponding emulsions kept for 7 days are shown in images at (B1B5). The macroscopic images of protein-solubilised emulsions were taken by the camera and are presented as the insert. The scale bar in optical microscopy images is 20 μm.
Applsci 13 06469 g007
Figure 9. Schematic representation of the proposed mechanism of protein alterations occurring during alkaline extraction of hempseed proteins.
Applsci 13 06469 g009
Figure 10. The 3D RSM plots demonstrating that extraction pH, time, and temperature impact the protein yield (AC) and free -SH content (DF) of hempseed protein. The independent variable temperature (X3) was fixed at 37 °C in plots (A,D). The independent variable time (X2) was set at 32.5 min in plots (B,E). The independent variable pH (X1) was fixed at 10.0 in plots (C,F).
Applsci 13 06469 g010
Table 1. Uncoded and coded levels of the three variables of the hempseed protein extraction protocol.
Independent VariablesSymbol Coded Levels
−101
Extraction pHX191011
Extraction time (min)X2532.560
Extraction Temp (°C)X3243750
Table 2. The impact of extraction pH on HPI extraction yield, recovery yield, and sulfhydryl group content of HPI. In this study, the extraction time was 2 h, and the extraction temperature was 37 °C. Means denoted by a different letter indicate significant differences at a p < 0.05 probability level.
Extraction pHExtraction Yield (%)Protein Recovery Yield (%)Free -SH Group in HPI (μmol/g Soluble Protein)
9.017.2 ± 0.3 c49.2 ± 0.8 c41.0 ± 0.2 a
10.018.7 ± 0.6 c51.7 ± 1.6 bc25.5 ± 0.4 b
11.020.7 ± 0.5 b55.4 ± 1.3 ab18.5 ± 1.1 c
12.022.4 ± 0.4 a59.3 ± 1.0 a10.2 ± 0.2 d
Table 3. The free sulfhydryl group (-SH) content, volume-mean emulsion droplet size D4,3, emulsifying ability index (EAI), and creaming index of hempseed-protein-solubilised emulsion. The extraction was conducted at fixed temperature (37 °C) and pH (10.0). The droplet sizes were measured immediately following emulsion formation (0 days) and after 7 days of storage. Means denoted by a different letter indicate significant differences at p < 0.05 probability level.
Extraction Time (min)Free -SH Content (μmol/g Soluble Protein)0-Day
Droplet Size D4,3 (μm)
7th-Day
Droplet Size D4,3 (μm)
EAI
(m2/g)
Creaming Index (%)
565.0 ± 0.6 a11.0 ± 0.9 c11.6 ± 0.3 d7.1 ± 0.5 a14.2
1051.7 ± 1.3 b12.5 ± 0.8 c13.6 ± 0.3 cd6.4 ± 0.1 b67.3
2037.6 ± 0.7 c20.0 ± 4.0 bc22.6 ± 1.9 bc6.0 ± 0.1 c69.6
4032.1 ± 2.4 d27.8 ± 1.8 ab31.6 ± 1.1 b5.9 ± 0.2 cd90.2
6028.0 ± 0.9 d39.0 ± 9.4 a43.6 ± 7.2 a5.8 ± 0.1 d91.6
Table 4. Estimated regression coefficients for hempseed protein concentration and free -SH content.
FactorCoefficientSE
Coefficient
F-Valuep-Value
Hempseed protein concentration
pH0.64250.0434219.54<0.0001
Time0.56000.0434166.78<0.0001
Temperature0.41500.043491.59<0.0001
pH × Time0.21750.061312.580.0094
pH × Temp0.01750.06130.08140.7836
Time × Temp0.06250.06131.040.3420
pH × pH−0.20380.059811.620.0113
Time × Time−0.44380.059855.120.0001
Temp × Temp−0.28370.059822.540.0021
Free sulfhydryl (-SH) content
pH−7.600.5736175.56<0.0001
Time−14.250.5736617.10<0.0001
Temperature−9.190.5736256.49<0.0001
pH × Time−2.720.811211.240.0122
pH × Temp−2.090.81126.610.0370
Time × Temp−1.350.81122.760.1406
pH × pH6.710.790672.00<0.0001
Time × Time12.890.7906265.64<0.0001
Temp × Temp6.210.790661.620.0001
Table 5. A comparison of functionality between the optimised HPI and the hempseed protein extracted by the original protocol. The original HPI extraction conditions were set as pH 10, 37 °C, and 60 min.
Selected FunctionalityOriginal HPIOptimised HPI
PS at pH 4.0 (%)11.1 ± 0.518.5 ± 3.8
PS at pH 7.0 (%)29.4 ± 2.039.8 ± 4.1
EAI (m2/g)5.8 ± 0.17.4 ± 1.2
CI (%)91.612.9
Disclaimer/Publisher’s Note: The statements, opinions and data contained in all publications are solely those of the individual author(s) and contributor(s) and not of MDPI and/or the editor(s). MDPI and/or the editor(s) disclaim responsibility for any injury to people or property resulting from any ideas, methods, instructions or products referred to in the content.

