1. Introduction
The constant increase in raw materials demand to supply the global industry necessitates the investigation of increasingly complex mineral deposits at greater depths. This type of project represents a challenge, in which the development of investigation tools is a fundamental pillar. In this context, geophysical investigation techniques are presented as a fundamental tool for the investigation and analysis of these new mineral deposits.
In the North of Spain there is an industry based on the extraction of potassium salts. The exploitation of these salts is carried out by dissolution processes through drilling and subsequent evaporation and processing of the extracted brine in ponds. These salts are found within the Barbastro Formation, which is located in an outcropping anticline structure (Barbastro-Balaguer Anticline). The progressive depletion of the currently exploited areas, located in the outcropping part of the formation and nearby areas, makes necessary the investigation and delimitation of the saline materials at greater depths, given its affectation by the regional anticline structure.
The application of geophysical tools in the resolution of geological and structural problems has experienced an important evolution in recent times, due to the improvement in the equipment power, resolution and penetration capacity. In this case, one of the most used geophysical investigation systems due to its high resolution and penetration capacity is the time domain electromagnetic method (TDEM).
TDEM surveys have been widely applied to investigate and solve problems in geology, hydrogeology, environmental studies, mining and geothermics, providing subsurface resistivity models at relatively shallow depths (up to 1000 m) [
1,
2,
3,
4,
5,
6,
7,
8]. There are few publications about the use of the TDEM system (Monex Geoscope LTD.; The Basin, VIC, Australia) to analyze great depths, mainly due to the technical limitations of the equipment; however, depths greater than 2000 m have been reached in hydrogeological studies [
9,
10,
11,
12,
13,
14], and also in oil and gas exploration, in which TEM data allows a resources estimation and well optimization [
10]. The equipment used in this study, TerraTEM with TerraTX-50 transmitter (Monex Geoscope LTD.; The Basin, VIC, Australia) and the acquisition parameters and configuration (coincident-loop 600 m × 600 m square configuration, 96 volts output voltage and 40 ampere transmitter current, and late delay times (over 1 s)) allowed us to reach larger depth ranges than usual in the industry, reaching up to 3000 m depth.
In this study, TDEM was applied to obtain a novel approach to the structure of the saline-evaporitic Barbastro formation in the southern flank of the Barbastro-Balaguer anticline in an area southwest of Graus (Huesca, Spain), where the development of new mining projects related to the exploitation of potassium salts is expected. Different inverted models were confronted with one parametric layered constrained model based on a lithological drilling log (borehole Monzon-1). The parametric constrained model was then used in the rest of the TDEM survey points as a starting model. Data, 1D models, and formation surfaces arising from a new electromagnetic survey are presented. The applied methodology allows for an improved detailed geological and structural view of the saline-evaporitic Barbastro Formation.
The new survey suggests that the general structure of the saline-evaporitic Barbastro Formation, and, therefore, of the materials affected by the regional anticlinal structure, presents a ramp hanging wall and close to flat footwall structure dipping to the SW, in concordance with the previous accepted geological structural model. This structure involves a thickness loss to the SW due to the defined structure, ranging in the survey area from 1103 m to 601 m. Hence, our study contributes to improving the geological structure and position of the saline materials, allowing design and drilling optimization in future mining exploitations.
2. Geological Settings
The study area is located at the northern margin of the Ebro Foreland Basin in the central sector of the South Pyrenean fold and thrust belt, which formed during the continental collision between the Iberian and Eurasian plates, from the Late Cretaceous to Miocene [
15,
16,
17,
18,
19] (
Figure 1). This collision resulted in the growth of an antiformal stack of basement-involved thrust sheets in the axial zone acting as a boundary between the South and North Pyrenean fold and thrust belts [
20]. The South Pyrenean fold and thrust belt consists of a system of south-verging thrust sheets and the related Ebro Foreland basin emplaced in a piggy-back sequence from the Late Cretaceous to the Oligocene Pyrenean compression [
21,
22,
23,
24]. These tectonic units detached predominantly above Upper Triassic evaporites [
25] and above Eocene evaporites deposited in the foreland basin [
26,
27]. The Foreland Ebro Basin is the late non-marine stage of the South Pyrenean foreland basin, which developed since the middle Priabonian at 36 Ma [
28]. The system of folds deforming this foreland basin detached above the Cardona salt and gypsum from the Barbastro Formation [
27,
29] resulting in the formation of the Barbastro-Balaguer Anticline [
30].
The study area is located in the surroundings of the Monzón-1 well. It is located at the southern flank of the Barbastro-Balaguer anticline [
31] which detached in the evaporites of the Barbastro Formation at the front of the Southcentral Pyrenean unit [
32,
33]. According to Lanaja [
31], the infra-detachment stratigraphy consists of: (1) Lower Triassic red sandstones and claystones from the Bundanstein Facies; (2) Middle Triassic limestones, dolostones and anhydrite from the Muschelkalk; (3) Upper Triassic red claystones and evaporites from the Keuper; (4) Lower Jurassic limestones, dolostones and carbonatic breccias; and (5) Lower Eocene limestones. Folded strata from the Barbastro anticline comprise Cenozoic strata related to the later stages of evolution of the South Pyrenean foreland Basin. The main detachment is the Barbastro Formation, which consists of Priabonian gypsum and grey lutites deposited in a lacustrine evaporite sedimentary environment [
34], with interbedded decameter halite and anhydrite packages [
33]. Significant halite deposits are also known in this formation, as evidenced in the Monzón-1 well as in different wells where this material is exploited for the electrochemical industry. Significant halite deposits are also known in this formation, as evidenced in the Monzón-1 and other wells in the area where this material is exploited for the electrochemical industry. The upper part of the Barbastro Formation consists of lacustrine limestones, mudstones, sandstones and minor contents of gypsum acting as a transition to the overlying Peraltilla Formation. The Barbastro Formation outcrops in the core of the Barbastro-Balaguer Anticline [
30,
35], a 150 km NW-SE direction structure parallel to the Sierras Marginales front. The thickness of the gypsiferous zone of the Barbastro Formation is difficult to measure at the surface, due to the great deformation on the anticlinal outcropping area, although it decreases progressively towards the South [
36]. The Peraltilla Formation consists of Middle Rupelian to Chattian conglomerates, sandstones and mudstones covered by similar sedimentary rocks from the Chattian to Aquitanian Sariñena Formation [
36,
37,
38]. Both detrital siliciclastic formations are interbedded with decimeter-thick lacustrine limestones and gypsum [
39,
40].
Monzón-1 Borehole
The Monzón-1 borehole lithological drilling log with chronostratigraphic interpretation is available. Monzón-1 is an oil & gas wildcat borehole drilled by ENPASA in 1963 that reached 3714.60 m depth.
This borehole is a very important element, as it is the basis for the interpretation of the geophysical data. The borehole crosses the Cenozoic continental series of the northern edge of the Ebro Basin, reaching the base of the sedimentary basin constituted by the local Mesozoic substratum. The Barbastro Formation presents a depth of 886 m, located between 1402 m and 2268 m deep. From the lithological point of view, the Barbastro Formation is composed by an alternacy of gypsum and marls levels with interbedded decameter-thick halite and anhydrite packages, with a 90 m thick massive gypsum level close to the hanging wall of the formation. A detailed lithological log analysis lets us conclude that the salt and evaporites content is not constant, decreasing to the hanging wall and footwall of the formation; this content, being the zone of interest due its saline composition, is located between 1433 and 2034 m depth, reducing the real thickness to 601 m.
3. Data and Methodology
3.1. Time Domain Electromagnetics (TDEM)
TDEM uses transient electromagnetic field diffusion under time-domain control [
41,
42]. A time-varying magnetic field is created using a loop of wire. The methodology is based on a ground current injection through a transmitter (T
x) loop that is alternatively turned on and off. As a consequence of the current injection, a magnetic field perpendicular to the plane of the transmitter loop will be produced. When the current injection is turned off, the decay of the primary field induces electromotive forces within the surface, generating eddy currents that penetrate into the ground, creating a secondary magnetic field whose amplitude decreases with time (transient). The voltage against time for the decay secondary magnetic field associated with the eddy currents produced by the primary transmitter is measured during the turn-off period by the receiver loop (R
x). The decay is measured at several times, obtaining of a curve which amplitude and shape reflects the distribution of resistivity with depth, where early times provide information at shallow depths while later times provide the information about deeper depths. Detailed description of the physical background of the TDEM method can be found, for example, in Fitterman and Stewart [
43].
3.2. Survey and Data Acquisition
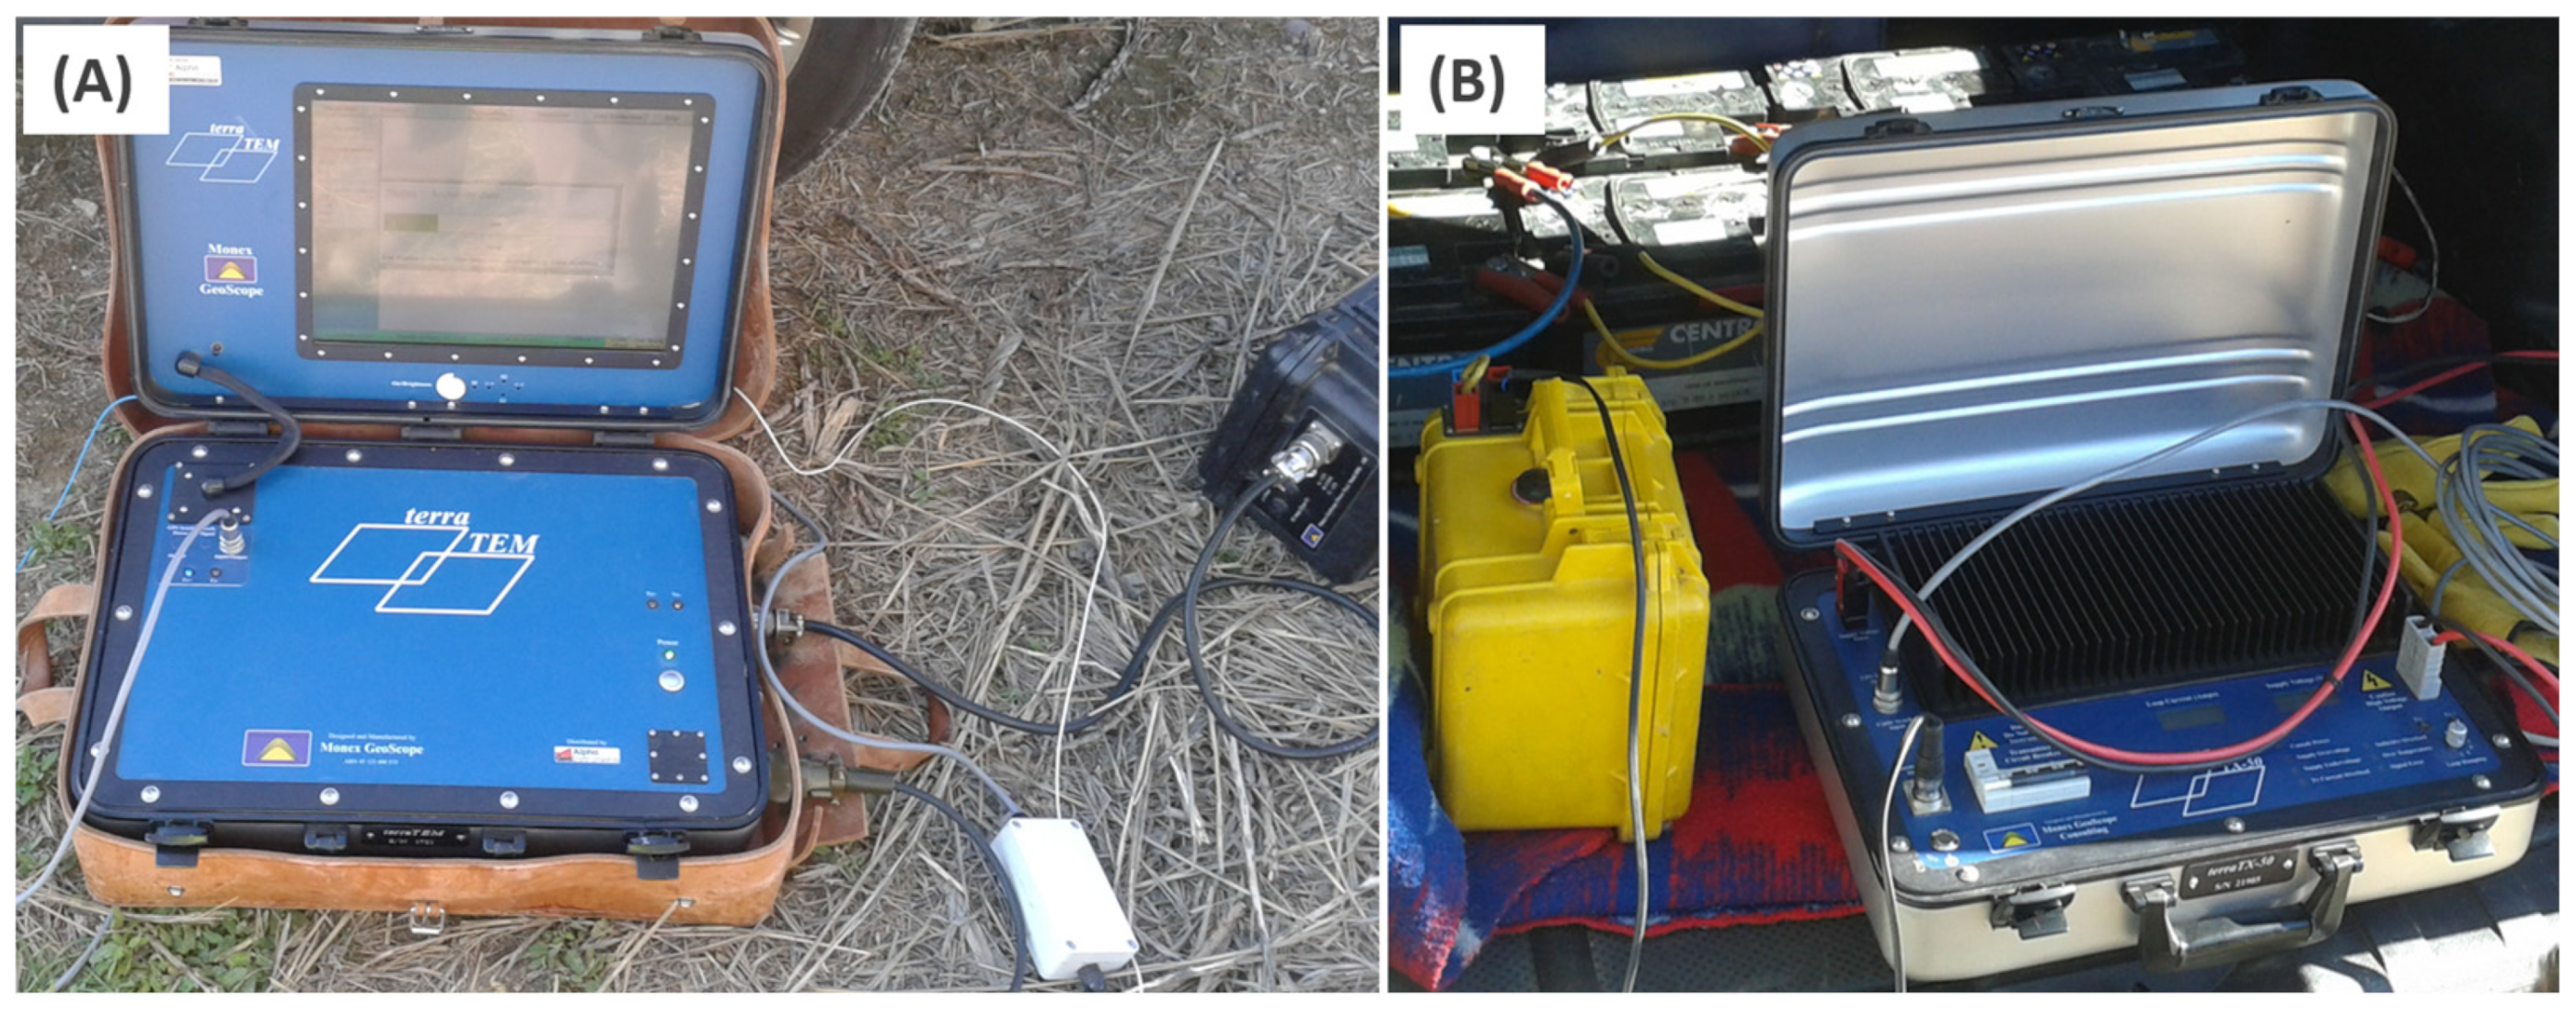
A total of 15 deep TDEM survey points were executed on a close to flat area covered mainly by vegetable crops. TDEM data were acquired using a TerraTEM system (Monex GeoScope Ltd.; The Basin, VIC, Australia) together with a TerraTX-50 transmitter (
Figure 3). The Terra TX-50 transmitter delivers an output voltage of 96 volts and 50 A transmitter current, with a GPS synchronization module. A coincident-loop 600 m × 600 m square configuration was selected to obtain higher penetration and better signal to noise levels at late points, allowing a more reliable apparent conductivity estimation at depth [
44]. Loops were laid out using a compass for correct placement. TDEM locations were determined using a handheld 3 m accuracy GPS while topography heights were extracted from 5 m resolution DEM (Instituto Geográfico Nacional,
https://centrodedescargas.cnig.es/CentroDescargas/index.jsp) (accessed on 11 October 2022).
TDEM survey points were distributed in a self-regular grid covering the selected survey area, where there was sufficient spacing for the loop laying and avoiding the close presence of anthropogenic interferences. TDEM-13 was laid out in the vicinity of the Monzón-1 borehole. The presence of power lines, plot fencing and lack of spacing in some points, especially in the southern part of the study area, generated a deformation of the recording grid, creating a final non regular grid with an important gap between southern survey points (TDEM-7, 12, 13 and 15) and the northern ones (TDEM-5, 6, 8 and 11) (
Figure 2). To improve data quality during acquisition and decrease the interference noise, a strong signal and enhanced signal-to-noise ratio proceeding was established based on up to 4000 stacks per channel [
45] and a high current external transmitter (up to 50 amperes)0020(
Figure 4).
3.3. Processing Strategy
Raw recorded field data was downloaded and transformed into usf format to numerically process using TerraTEM equipment TEMPlot V 2.0.0 software (Monex GeoScope Ltd.; The Basin, VIC, Australia), allowing the display of voltage/time curves, automatic and manual filtering to remove wrong time windows and the exporting of initial preprocessed data.
TDEM was modeled using the commercial IX1D-V3 software (Interpex Limited; Golden, CO, USA), designed for a 1D analysis of electric and electromagnetic data inversion and interpretation. The inversion software obtains 1-D resistivity models, producing geoelectric resistivity versus depth columns for each TDEM.
The inversion software allows the user to insert an initial geoelectrical model with a preferred number of layers, resistivity values and thickness. For this task, data processing started with a parametric TDEM (TDEM-13) executed close to the Monzón-1 borehole. The available lithological information was used to define the number of layers and its thickness, only allowing the inversion software to adjust the resistivity of the layers in the model, to get the best fit of the model curve convergence with the field data. As a result of this process, an initial model based on the lithological data from the borehole and layer resistivity was obtained. The inversion process was repeated iteratively until a minimum RMS % model was obtained, showing the model adjustment degree to the data.
The remaining TDEM survey points were then inverted using the parametric model, allowing the inversion software to adjust the model curves to better fit with the field data, adjusting its thickness and contacts.
4. Inversion Results
Inversion starts with the analysis of the parametric TDEM executed next to the Monzón-1 borehole (TDEM-13 parametric). According to the lithological drilling log of the Monzon-1 borehole, a seven-layer geoelectrical model with next defined thickness and depth contacts is be defined (
Figure 5).
Layer 1 consists of quaternary materials, with a thickness of 54 m. Layer 2 corresponds to continental tertiary materials of the Sariñena Formation, mainly silts, mudstones and sandstones, extending between 54 and 982 m deep. Under this layer, the materials of the Peraltilla Formation appear in layer 3, similar to the previous layer but with a higher relative proportion of sandstones. This layer extends to 1433 m depth, comprising the first meters of the Barbastro Formation, with low salt and gypsum content. Layer 4 consists of the most saline and evaporitic part of the Barbastro Formation, with predominance of anhydrite and massive salty layers. The layer is 601 m thick, extending between 1433 and 2034 m deep. Layer 5 constitutes the transition layer between the bottom non saline part of the Barbastro Formation with the Red Marls Formation, up to the Jurassic, showing a thickness of 413 m. The Jurassic limestones is layer 6, located between 2447 and 2656 m depth. The last layer, layer 7, contains all the Triassic materials up to the end of the drilling, composed of clays, evaporitic materials, sandstones and limestones.
Due to limitations of TDEM survey acquisition parameters (big loop size and measuring windows), a lack of data (ramp) on the first meter’s depth is obtained, affecting the layers near the surface, so the depth of layer one (quaternary) was fixed due to the processing at close to 54 m, even thought the borehole lithological description only reflects a few meters of these materials.
As a result of this process, an initial model based on the lithological data from the borehole and layer resistivity was obtained. The designed model obtains an RMS % fitting error of 0.65, indicating a good fit of the model curve based on the proposed geoelectrical model with the field data.
There are other models equally consistent with the measured data (
Figure 6B). All the equivalent models present similar results in the upper part of the data, layers 1 and 2. Additionally, the contact position between layers 2 and 3 corresponds to the hanging wall of the most saline-evaporitic part of the Barbastro Formation. The resistivity and contact position between layers 3 and 4, and the rest of the layers, shows bigger disparity between models. Taking into account that, although the equivalent models are viable from the geophysical point of view, they imply a worse correlation with the observed lithological data; these equivalent models were therefore discarded.
After the obtaining of the parametric model, it was applied to the rest of the TDEM resistivity–time curves (
Figure 7) to obtain the geoelectric resistivity–depth columns. RMS% residuals error obtained for all the TDEM survey presents acceptable values, between 0.64–1.88%.
5. Discussion
Once the parametric model was obtained and used to obtain the 1D model (resistivity-depth) of all TDEM survey points, three profiles were elaborated to visualize the structure and thickness variation of the saline-evaporitic Barbastro Formation (
Figure 2): Profile A, with NW-SE orientation, and Profiles B and C, with NW-SE orientation. Profile A’s path follows the supposed maximum slope and strike of the Barbastro-Balaguer Anticline in the survey area, deduced from the geological cartography (
Figure 2), while Profiles B and C were placed perpendicular to Profile A. All TDEMs reached a minimum penetration over 3000 m, enough to reach the hanging wall and footwall of the Basbastro Formation and reach the Mesozoic local basement. TDEM is very sensitive to the conductive layers [
45,
46], helping to distinguish the saline-evaporitic formation from the upper and lower geological formations due to its higher resistivity.
Profile A (
Figure 8) follows the deduced maximum slope of the saline-evaporitic Barbastro Formation. The hanging wall is located at greater depths as we move to the SW, ranging from 1000 m to 1433 m depth. The footwall shows a subhorizontal morphology with slight depth variations, being located along the profile around 2050 m depth. As a result of the defined structure, saline-evaporitic materials thickness ranges along the profile from 1077 m to 601 m.
Profiles B and C follows the same direction as the Barbastro-Balaguer anticline, but at different distances from the axis, so a thickness decrease of the saline-evaporitic Barbastro Formation is observed towards Southwest, but with a constant value along the profile. Profile B defines a 900 m thickness of the saline-evaporitic formation with the hanging wall and footwall placed at 1125 and 2030 m depth, respectively (
Figure 9B). Profile C, located further to the SW, shows the thinning of the Barbastro Formation as it is placed away from the core of the anticline, showing a formation thickness close to 670 m, with the hanging wall lying at 1375 m depth, while the footwall is located at 2050 m depth (
Figure 10B).
D Surfaces and Thickness Map
The processing and interpretation of the TDEMs attempted to obtain the position of the hanging wall and footwall of the saline-evaporitic part of the Barbastro Formation. An interpolation processing using Surfer V 15.1 software (Golden Software LLC.; Golden, CO, USA) allows us to obtain both surfaces, defining the main structure of the formation and Barbastro-Balaguer Anticline.
Figure 11 integrates all interpreted TDEM points, showing the spatial elevation of the hanging wall and footwall of the saline-evaporitic Barbastro Formation in the survey area. In case of the hanging wall surface, the outcropping mapped position based on the official geological cartography 1:50,000. Magna [
47] is used in the interpolation process to define its morphology and limit due to its outcropping to the North. According to the obtained surface (
Figure 11A), the hanging wall surface becomes progressively less steep as we move to the SW, with a dip varying between 40° in TDEM-2 zone to almost subhorizontal in the southernmost TDEM survey points area (TDEM-13 and TDEM-15). The hanging wall elevation ranges between −658 and −1135 m above sea level (masl) (996 and 1433 m depth). The footwall shows a subhorizontal morphology, with small elevations and small local depressions, recording in the TDEM elevations between −1640 and −1762 masl (2001 and 2101 m depth) (
Figure 11B). The inferred structure agrees with the initial geological structure.
Once the hanging and footwall surfaces have been obtained, the saline-evaporitic part of the Barbastro Formation thickness can be calculated, which ranges between 601 and 1103 m in the TDEM survey points, decreasing in the SW direction according to regional anticlinal defined structure (
Figure 12) constrained by the hanging wall depth variation.
No influence on the interpolated surfaces is observed due to the irregular distribution of the TDEM points (
Figure 2), presenting a realistic structure in accordance with the accepted geological structural model.
The surfaces generated show the structure of the southern flank of the Barbastro-Balaguer anticline in the survey area, and its affectation of the Barbastro Formation materials, generating a thinning of the formation towards the SW, as can be seen in a 3D representation in
Figure 13 created with the commercial Voxler V 4.1.509 3D modelling software (Golden Software LLC).
6. Conclusions
This study presents the new results of deep time domain electromagnetic soundings (TDEM) study to gain insights into the Barbastro saline-evaporitic formation, affected by the Barbastro-Balaguer Anticline regional structure. The survey was conducted in the southern flank of the anticline in the vicinity of Graus, Spain. Resistivity data were obtained from 15 TDEM survey points with a coincident-loop 600 m × 600 m square configuration, allowing a depth penetration of up to 3.0 km. An initial inversion model was stablished using a thickness and layered parametric constrained model based on the Monzón-1 drilling lithological logging in the rest of the TDEM survey points. The applied methodology allows for an improved detailed geological and structural view of the saline-evaporitic Barbastro Formation affected by the Barbastro-Balaguer Anticline.
The results support the idea that that the Barbastro saline-evaporitic formation presents a complex structure because of the regional anticlinal structure, dipping SW, where the hanging wall shows a variable dip from 40° to close to subhorizontal (distally), ranging from 996 to 1433 m depth, while the footwall shows a close to flat surface between 2001 and 2101 m depth. As a result of the defined structure, the Barbastro saline-evaporitic formation shows a thickness reduction to the SW, ranging from 1103 to 601 m.
Therefore, our study has revealed that the TDEM research method can be an important tool to study saline-evaporitic formations affected by major geological structures, such as the Barbastro-Balaguer Anticline. The new TDEM structural and geoelectrical data would be useful for allocating and designing mining drills at a region of interest for the exploitation of potassium salts in new mining projects.
Author Contributions
Conceptualization, D.P.; methodology, D.P., J.C. and P.C.; software, J.C. and P.C.; validation, D.P., J.C. and P.C.; formal analysis, D.P. and J.C.; investigation, D.P.; resources, D.P., J.C. and P.C.; writing—original draft preparation, D.P.; writing—review and editing, D.P., J.C., P.C. and J.L.H.-P.; visualization, J.C. and J.L.H.-P.; supervision, D.P.; project administration, D.P.; funding acquisition, D.P., J.C. and P.C. All authors have read and agreed to the published version of the manuscript.
Funding
This research received no external funding.
Institutional Review Board Statement
Not applicable.
Informed Consent Statement
Not applicable.
Data Availability Statement
Not available.
Acknowledgments
The authors sincerely appreciate the assistance of reviewers for their comments and support on this paper, especially D. Pedro Carrasco Morillo.
Conflicts of Interest
The authors declare no conflict of interest.
References
- Goldman, M.; Arad, A.; Kafri, U.; Gilad, D.; Melloul, A. Detection of freshwater/sea-water interface by the time domain electromagnetic (TDEM) method in Israel. In Proceedings of the l0th SWIM, Ghent, Belgium, 16–20 May 1988; pp. 329–344. [Google Scholar]
- Ferguson, I.J.; Taylor, W.J.; Schmigel, K. Electromagnetic mapping of saline contamination at an active brine pit. Can. Geotech. J. 1996, 33, 309–323. [Google Scholar] [CrossRef]
- Tartaras, E.; Zhdanov, M.S.; Wada, K.; Saito, A.; Hara, T. Fast imaging of Nojima fault zone TDEM data using S-inversion. In SEG Technical Program Expanded Abstracts; Society of Exploration Geophysicists: Houston, TX, USA, 1997; pp. 346–349. [Google Scholar] [CrossRef]
- Craven, B.; Rovira, T.; Grammer, T.; Styles, M. The role of geophysics in the discovery and delineation of the Cosmos Nickel Sulphide Deposit, Leinster Area, Western Australia. Explor. Geophys. 2000, 31, 201–209. [Google Scholar] [CrossRef]
- Cummings, D. Transient Electromagnetic Survey of a Landslide and Fault, Santa Susanna Mountains, Southern California. Environ. Eng. Geosci. 2000, 6, 247–254. [Google Scholar] [CrossRef]
- Yechieli, Y.; Kafri, U.; Goldman, M.; Voss, C.I. Factor controlling of configuration of the fresh-saline water interface in the Dead Sea coastal aquifer: Synthesis of TDEM surveys and numerical groundwater modeling. Hydrogeol. J. 2001, 9, 367–377. [Google Scholar]
- Cheng, M.; Yang, D.; Luo, Q. Interpreting Surface Large-Loop Time-Domain Electromagnetic Data for Deep Mineral Exploration Using 3D forward Modeling and Inversion. Minerals 2023, 13, 34. [Google Scholar] [CrossRef]
- Nieto, I.M.; Carrasco García, P.; Sáez Blázquez, C.; Farfán Martín, A.; González-Aguilera, D.; Carrasco García, J. Geophysical Prospecting for Geothermal Resources in the South of the Duero Basin (Spain). Energies 2020, 13, 5397. [Google Scholar] [CrossRef]
- Spies, B.R. Depth of investigation in electromagnetic sounding methods. Geophysics 1989, 54, 872–888. [Google Scholar] [CrossRef]
- Buddo, I.; Shelokhov, I.; Misyurkeeva, N.; Sharlov, M.; Agafonov, Y. Electromagnetic Surveys for Petroleum Exploration: Challenges and Prospects. Energies 2022, 15, 9646. [Google Scholar] [CrossRef]
- Levi, E.; Kafri, U.; Goldman, M. The Delineation of Saline Groundwater Bodies within the Arava Rift Valley, Israel, Using Deep Geoelectromagnetic Measurements. In AGU Fall Meeting Abstracts; American Geophysical Union: Washington, DC, USA, 2006. [Google Scholar]
- Levi, E.; Goldman, M.; Hadad, A.; Gvirtzman, H. Spatial delineation of groundwater salinity using deep timedomain electromagnetic geophysical measurements: A feasibility study. Water Resour. Res. 2008, 44, W12404. [Google Scholar] [CrossRef]
- Kafri, U.; Goldman, M.; Levi, E. The relationship between saline groundwater within the Arava Rift Valley in Israel and the present and ancient base levels as detected by deep geoelectromagnetic soundings. Environ. Geol. 2008, 54, 1435–1445. [Google Scholar] [CrossRef]
- Kafri, U.; Goldman, M.; Levi, E.; Wollman, S. Detection of Saline Groundwater Bodies between the Dead Sea and the Mediterranean Sea, Israel, Using the TDEM Method and Hydrochemical Parameters. Environ. Process. 2014, 1, 21–41. [Google Scholar] [CrossRef]
- Choukroune, P. The ECORS Pyrenean deep seismic profile reflection data and the overall structure of an orogenic belt. Tectonics 1989, 8, 23–39. [Google Scholar] [CrossRef]
- Muñoz, J.A. The Pyrenees. In The Geology of Spain; Gibbons, W., Moreno, T., Eds.; Geological Society: London, UK, 2002; pp. 370–385. [Google Scholar]
- Vergés, J.; Millán, H.; Roca, E.; Muñoz, J.A.; Marzo, M.; Cirés, J.; Bezemer, T.D.; Zoetemeijer, R.; Cloetigh, S. Eastern Pyrenees and related foreland basins: Pre-, syn- and post-collisional cristal-scale cross-sections. Mar. Pet. Geol. 1995, 12, 893–915. [Google Scholar] [CrossRef]
- Vergés, J.; Fernàndez, M.; Martínez, A. The Pyrenean orogen: Pre-, syn-, and post-collisional evolution. J. Virtual Explor. 2002, 8, 55–74. [Google Scholar] [CrossRef]
- Teixell, A.; Labaume, P.; Ayarza, P.; Espurt, N.; Blanquat, M.D.S.; Lagabrielle, Y. Crustal structure and evolution of the Pyrenean-Cantabrian belt: A review and new interpretations from recent concepts and data. Tectonophysics 2018, 724–725, 146–170. [Google Scholar] [CrossRef]
- Muñoz, J.A. Evolution of a continental collision belt: ECORS—Pyrenees crustal balanced section. In Thrust Tectonics; McClay, K.R., Ed.; Chapman & Hall: London, UK, 1992; pp. 235–246. [Google Scholar]
- Burbank, D.W.; Vergés, J.; Muñoz, J.A.; Bentham, P. Coeval hinward- and forward-imbricating thrusting in the south-central Pyrenees, Spain: Timing and rates of shortening and deposition. Geol. Soc. Am. Bull. 1992, 104, 3–17. [Google Scholar] [CrossRef]
- Puigdefàbregas, C.; Muñoz, J.A.; Vergés, J. Thrusting and Foreland Basin Evolution in the Southern Pyrenees. In Thrust Tectonics; McClay, K.R., Ed.; Chapman & Hall: London, UK, 1992; pp. 247–254. [Google Scholar]
- Cruset, D.; Vergés, J.; Albert, R.; Gerdes, A.; Benedicto, A.; Cantarero, I.; Travé, A. Quantifying deformation processes in the SE Pyrenees using U-Pb dating of fracture-filling calcites. J. Geol. Soc. 2020, 177, 1186–1196. [Google Scholar] [CrossRef]
- Muñoz-López, D.; Cruset, D.; Vergés, J.; Cantarero, I.; Benedicto, A.; Mangenot, X.; Albert, R.; Gerdes, A.; Beranoaguirre, A.; Travé, A. Spatio-temporal variation of fluid flow behavior along a fold: The Bóixols-Sant Corneli anticline (Southern Pyrenees) from U–Pb dating and structural, petrographic and geochemical constraints. Mar. Pet. Geol. 2022, 143, 105788. [Google Scholar] [CrossRef]
- Séguret, M. Étude Tectonique des Nappes et Séries Décollées de la Partie Centrale du Vesant sud des Pyrénées; Laboratoire de Géologie Structurale: Montpellier, France, 1972; 155p. [Google Scholar]
- Vergés, J.; Martínez, A.; Muñoz, J.A. South Pyrenean fold and thrust belt: The role of foreland evaporitic levels in thrust geometry. In Thrust Tectonics; McClay, K., Ed.; Chapman & Hall: London, UK, 1992; pp. 255–264. [Google Scholar]
- Sans, M.; Muñoz, J.A.; Vergés, J. Triangle zone and thrust wedge geometries related to evaporitic horizons (Southern Pyrenees). Can. Pet. Geol. Bull. 1996, 4, 375–384. [Google Scholar]
- Costa, E.; Garcés, M.; López-Blanco, M.; Beamud, E.; Gómez-Paccard, M.; Larrasoaña, J.C. Closing and continentalization of the South Pyrenean foreland basin (NE Spain): Magnetochronological constraints. Basin Res. 2010, 22, 904–917. [Google Scholar] [CrossRef]
- Sans, M. From thrust tectonics to diapirism. The role of evaporites in the kinematic evolution of the eastern South Pyrenean front. Geol. Acta 2003, 1, 239–259. [Google Scholar]
- Martínez Peña, B.; Pocoví, A. El amortiguamiento frontal de la estructura de la cobertera surpirenaica y su relación con el anticlinal de Barbastro-Balaguer. Acta Geol. Hisp. 1988, 23, 81–94. [Google Scholar]
- Lanaja, J.M. Contribución de la Exploración Petrolífera al Conocimiento de la Geología de España; Instituto Geológico de España: Madrid, Spain, 1987. [Google Scholar]
- Muñoz, J.A.; Mencos, J.; Roca, E.; Carrera, N.; Gratacós, O.; Ferrer, O.; Fernàndez, O. The structure of the South-Central-Pyrenean fold and thrust belt as constrained by subsurface data. Geol. Acta 2018, 16, 439–460. [Google Scholar]
- Santolaria, P.; Ayala, C.; Pueyo, E.L.; Rubio, F.M.; Soto, R.; Calvín, P.; Luzón, A.; Rodríguez-Pintó, A.; Oliván, C.; Casas-Sainz, A.M. Structural and Geophysical Characterization of the Western Termination of the South Pyrenean Triangle Zone. Tectonics 2020, 39, e2019TC005891. [Google Scholar] [CrossRef]
- Sáez, A.; Anadón, P.; Herrero, M.J.; Moscariello, A. Variable style of transition between Paleogene fluvial fan and lacustrine systems, southern Pyrenean foreland, NE Spain. Sedimentology 2007, 54, 367–390. [Google Scholar] [CrossRef]
- Pardo, G.; Villena Morales, J. Aportación a la Geología de la región de Barbastro. Acta Geológica Hispánica 1979, 14, 289–292. [Google Scholar]
- Quintares, J. Estudio Sedimentológico y Estratigráfico del Terciario Continental de Los Monegros. Ph.D. Thesis, Universidad de Granada, Granada, Spain, 1969. [Google Scholar]
- Crusafont, M.; Riba, O.; Villena, J. Nota Preliminar Sobre un Nuevo Yacimiento de Vertebrados Aquitanienses en Sta. Cilia (Río Formiga; Provincia de Huesca) y Sus Consecuencias Geológicas, Notas y Comunicaciones IGME; IGME: Madrid, Spain, 1966; pp. 7–13. [Google Scholar]
- Cuenca, G.; Canudo, J.I.; Laplana, C.; Andrés, J.A. Bio y cronoestratigrafía con mamíferos en la Cuenca Terciaria del Ebro: Ensayo de síntesis. Acta Geol. Hisp. 1992, 27, 127–143. [Google Scholar]
- Senz, J.G.; Zamorano, M. Evolución tectónica y sedimentaria durante el Priaboniense superior-Mioceno inferior, en el frente de cabalgamiento de las Sierras Marginales Occidentales. Acta Geol. Hisp. 1992, 27, 195–209. [Google Scholar]
- Luzón, A. Análisis Tectosedimentario de los Materiales Terciarios Continentales del Sector Central de la Cuenca del Ebro (Provincias de Huesca y Zaragoza). Ph.D. Thesis, Universidad de Zaragoza, Zaragoza, Spain, 2001. [Google Scholar]
- Stewart, M.; Gay, M.C. Evaluation of transient electromagnetic soundings for deep detection of conductive fluids. Ground Water 1986, 24, 351–356. [Google Scholar] [CrossRef]
- McNeil, J.D. Use of electromagnetic method for groundwater studies. In Geotechnical and Environmental Geophysics: Review and Tutorial; SEG Investigations in Geophysics; Ward, S., Ed.; Society of Exploration Geophysicists: Houston, TX, USA, 1990; No. 5; Volume 1, pp. 191–218. [Google Scholar]
- Fitterman, D.V.; Stewart, M.T. Transient electromagnetic soundings for groundwater. Geophysics 1986, 53, 118–128. [Google Scholar] [CrossRef]
- Carrasco-García, J.; Porras, D.; Carrasco-García, P.; Herrero-Pacheco, J.; Martín Nieto, I.; Benito-Herrero, J.; Huerta, P. Time-Domain Electromagnetics as a Geophysical Tool in Hydrogeological Exploitation Projects in Mesozoic Formations. Appl. Sci. 2022, 12, 8655. [Google Scholar] [CrossRef]
- Sørensen, K.; Auken, E.; Thomsen, P. TDEM in groundwater mapping—A continuous approach. In Symposium on the Application of Geophysics to Engineering and Environmental Problems; Environmental & Engineering Geophysical Society: Denver, CO, USA, 2000; pp. 485–491. [Google Scholar] [CrossRef]
- Sørensen, K.; Auken, E.; Christensen, N.B.; Pellerin, L. An integrated approach for hydrogeological investigations: New technology and a case history. Near-Surf. Geophys. 2005, 2, 583–603. [Google Scholar]
- García-Senz, J.; Zamorano-Cáceres, M.; Montes, M.J.; Rico, M. Mapa Geológico de España 1:50.000, Hoja nº 326 (Monzón) y Memoria; IGME: Madrid, Spain, 1991; 39p. [Google Scholar]
| Disclaimer/Publisher’s Note: The statements, opinions and data contained in all publications are solely those of the individual author(s) and contributor(s) and not of MDPI and/or the editor(s). MDPI and/or the editor(s) disclaim responsibility for any injury to people or property resulting from any ideas, methods, instructions or products referred to in the content. |
© 2023 by the authors. Licensee MDPI, Basel, Switzerland. This article is an open access article distributed under the terms and conditions of the Creative Commons Attribution (CC BY) license (https://creativecommons.org/licenses/by/4.0/).


