Article

An Improved Few-Shot Object Detection via Feature Reweighting Method for Insulator Identification

1
Key Laboratory of Modern Power System Simulation and Control & Renewable Energy Technology, Ministry of Education, Northeast Electric Power University, Jilin City 132012, China
2
School of Electrical Engineering, Northeast Electric Power University, Jilin City 132012, China
*
Author to whom correspondence should be addressed.
Appl. Sci. 2023, 13(10), 6301; https://doi.org/10.3390/app13106301
Submission received: 27 April 2023 / Revised: 19 May 2023 / Accepted: 19 May 2023 / Published: 22 May 2023
(This article belongs to the Special Issue Deep Learning for Object Detection)

Abstract

:
To address the issue of low accuracy in insulator object detection within power systems due to a scarcity of image sample data, this paper proposes a method for identifying insulator objects based on improved few-shot object detection through feature reweighting. The approach utilizes a meta-feature transfer model in conjunction with the improved YOLOv5 network to realize insulator recognition under conditions of few-shot. Firstly, the feature extraction module of the model incorporates an improved self-calibrated feature extraction network to extract feature information from multi-scale insulators. Secondly, the reweighting module integrates the SKNet attention mechanism to facilitate precise segmentation of the mask. Finally, the multi-stage non-maximum suppression algorithm is designed in the prediction layer, and the penalty function about confidence is set. The results of multiple prediction boxes are retained to reduce the occurrence of false detection and missing detection. For the poor detection results due to a low diversity of sample space, the transfer learning strategy is applied in the training to transfer the entire trained model to the detection of insulator targets. The experimental results show that the insulator detection mAP reaches 29.6%, 36.0%, and 48.3% at 5-shot, 10-shot, and 30-shot settings, respectively. These findings serve as evidence of improved accuracy levels of the insulator image detection under the condition of few shots. Furthermore, the proposed method enables the recognition of insulators under challenging conditions such as defects, occlusion, and other special circumstances.

1. Introduction

With the continuous expansion and rapid growth of the scale of the power system, the sustainability of reliable operation of the power grid becomes more important. Given the supportive and isolative functions of insulators, their operating status determines the overall safety of the power system’s operation [1]. In the inspection task of electrical equipment such as insulators, real-time identification and detection of image samples are carried out by using object detection network models based on deep learning. These models include the faster region-convolution neural network (Faster R-CNN) [2], the single-shot multibox detector (SSD) [3], you only look once (YOLO) [4], etc. Because of its technical advantages, it can replace the manual to realize automatic and intelligent detection, which has obtained some applications and research. In the literature [5], Faster R-CNN was used as the object detection network; the optimal parameters were obtained by adjusting different network layers and comparing the size of the convolution kernel; and sample expansion was carried out by image rotation. Experimental results showed that this method has high detection performance in the identification of transmission line components and defects. Literature [6] improved the anchor point generation method for the Faster R-CNN network to improve the detection effect, aiming at the situation that the insulators of transmission and transformation are difficult to identify due to different image scales and mutual occlusion. Literature [7] proposed a transmission line component detection method that combined the SSD network with the feature pyramid network, which improved the automatic detection accuracy of insulator faults in unmanned aerial vehicle (UAV) power inspection mode. Literature [8] improved the SSD network according to the specificity of images of electrical equipment components in substations. They introduced an additional feature extraction layer, optimized the quantity and proportion of prediction boxes, and improved the soft-penalty non-maximum suppression algorithm. These modifications led to increased detection accuracy of five types of electrical equipment images, achieved through the utilization of transfer learning during the training process. Literature [9] proposed an improved YOLOv3 [10] detection method for insulator foreign bodies. A dense network is designed to replace the original convolutional network through the reuse of multilayer features and the fusion of insulator images, which can improve detection accuracy while reducing false detection occurrences. Literature [11] proposed an insulator self-detonation identification method based on YOLOv4 [12], which designed a modified detection network with a multi-layer information fusion and attention mechanism. The results showed that the detection precision had improved.
Most object detection technologies with a wide range of applications rely on a large amount of annotated data to achieve model training and use network models with good performance to achieve sample detection. Therefore, large-scale open-source general data sets such as MS COCO [13] and Pascal VOC [14] have been widely used. However, the confidentiality and particularity of the actual operation process of the power system usually result in difficulty in obtaining large-scale insulator image data sets for training. For example, in extremely bad weather conditions, it is difficult to obtain sufficient clear and usable images by using a manual or UAV, and there are certain security risks. Given the above problems, the object detection method based on the few-shot theory has gradually entered the field of vision of researchers. Literature [15] made use of a data enhancement approach to handle the problem of few-shot. The saliency network was used to integrate the feature information of foreground and background in the image to achieve data amplification, and then the intraclass and interclass hybrid schemes were used to make the expanded data set play a role in guiding and training the network. Literature [16] proposed a two-stage fine-tuning approach (TFA), which achieved better performance in both the source domain and target domain. They first used the Faster R-CNN model as the detection framework, utilizing base-class image samples for pre-training the detection network and freezing the class-irrelevant part of the network. Then, they used new class samples of few-shot to fine-tune the model in the second stage. In the literature [17], the few-shot object detection via feature reweighting (FSRW) method was proposed for few-shot detection. This approach employed transfer learning and a reweighting strategy. The feature reweighting vector, generated by the support set and query set, guided the model to learn the discriminant ability and quickly generalized it for the detection of new classes. In addition, there are metric learning methods [18,19] and graph convolutional network-based methods [20,21].
However, as shown in Figure 1, insulators have their own characteristics. For example, the scale of the insulator target shown in (a) is slightly smaller in the image, and the defective part of the insulator shown in (b) and the insulator blocked by other equipment shown in (c) appear. It can be seen that the current few-shot object detection methods on the targeted insulators are difficult to achieve. Therefore, based on the FSRW model, an object detection method for few-shot insulators is proposed in this paper. The main contributions are as follows:
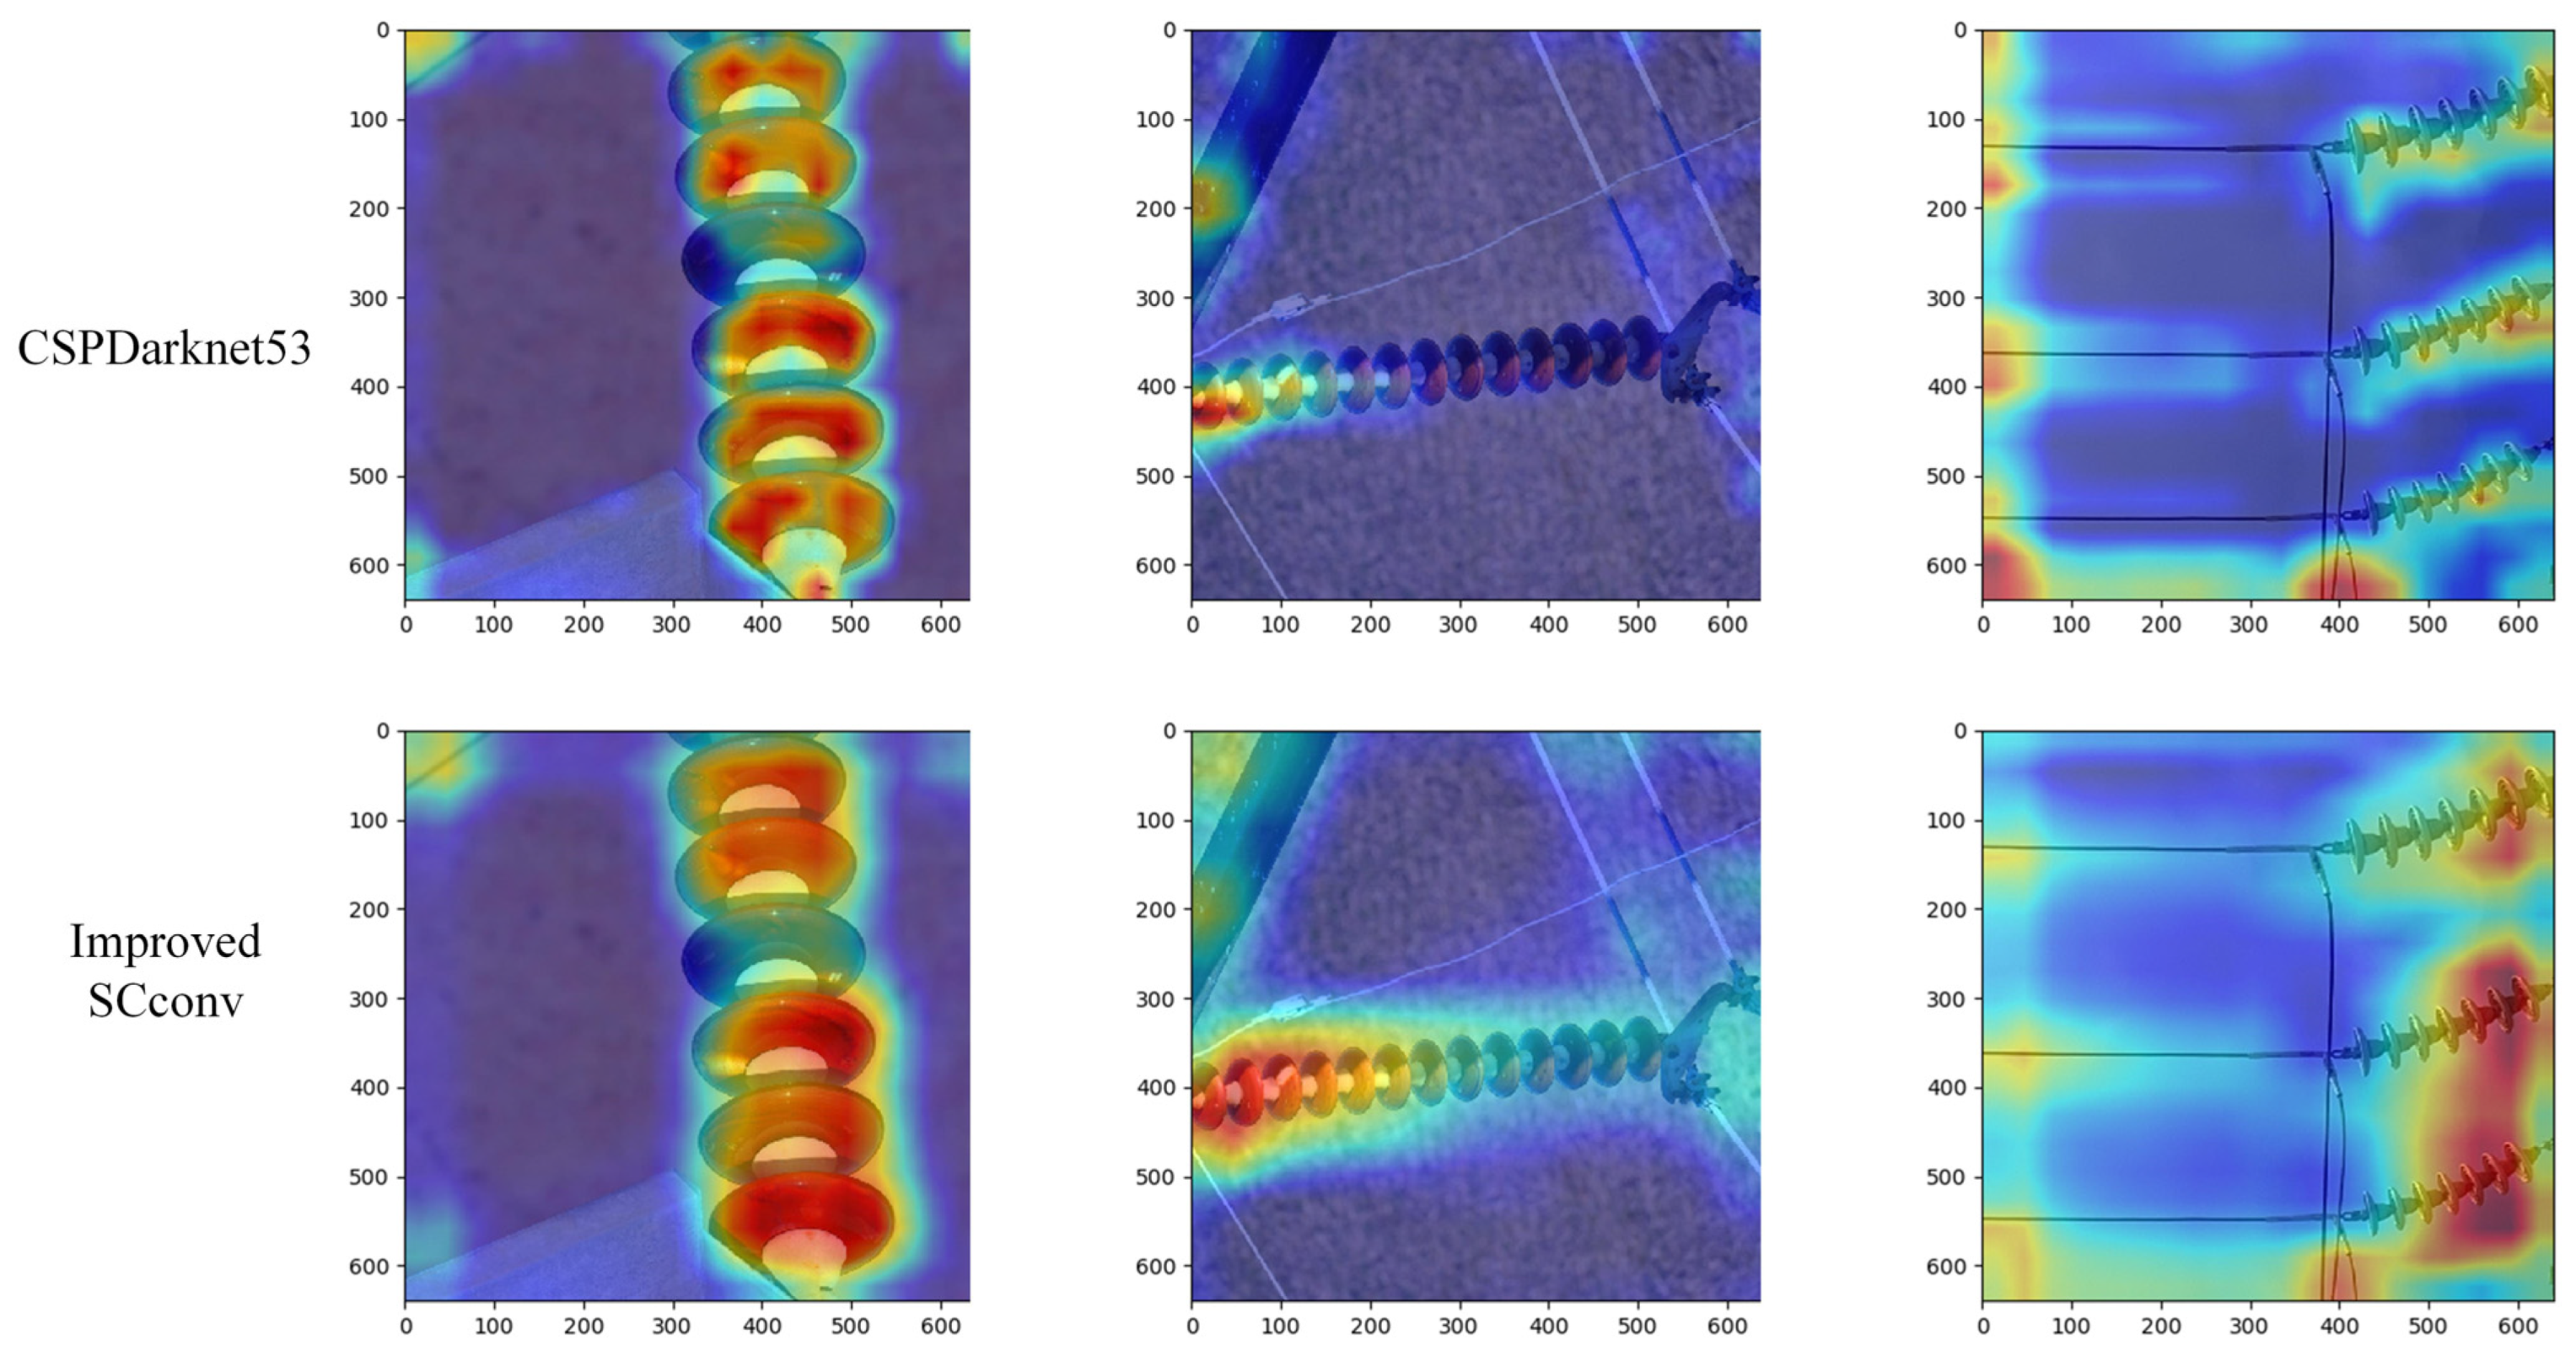
  • The article uses YOLOv5 as the main detection network of the whole model, the feature extraction network of YOLOv5 is replaced by a corrected self-calibrated convolutional (SCconv) network [22] to develop the ability of the model to detect insulators with different scale targets;
  • The article embeds the selective kernel network (SKNet) attention mechanism [23] before the input of the reweighting module, to generate a detailed mask and enhance the capacity of the network to obtain key detail meta-feature information of the support set;
  • The article proposes an improved multi-stage non-maximum suppression (NMS) algorithm to avoid the wrong deletion of candidate boxes with insulator targets and reduce the missing detection of occluding insulators.

2. Improved Feature Reweighting Model

In this paper, the few-shot object detection via feature reweighting model is improved to deal with insulator identification. The improved model structure is shown in Figure 2, mainly including the feature extraction module, reweighting module, and prediction module, respectively, in improving the corresponding feature extractor, reweighting module, and prediction layer. Among them, a feature extractor is used to extract image meta-features. In the part of the feature extraction network of the model where a self-calibrated convolutional feature extraction network is introduced and improved, the model can obtain multi-scale and finer meta-feature information. The convolutional neural network in the reweighting module consists of six convolutional layers, five maximum pooling layers, and a global pooling layer. The input of this module is the splicing of a support set image composed of few-shot insulator images and its mask, among which the mask is a detailed mask generated after processing based on the SKNet attentional mechanism module. After the convolution integration of the meta-feature reweighting module, the reweighted meta-feature vector is generated, and the channel convolution integration is carried out. The prediction layer uses the reweighting meta-feature information to get the classification and positioning score of the target. To reduce false detection, the non-maximum suppression algorithm is improved in the prediction layer. The training strategy of the network uses the data set with abundant sample space to train the whole model initially and then quickly transfer the trained meta-knowledge to the recognition of few-shot insulator images.

3. Methodology

3.1. Improved Self-Calibrated Feature Extraction Network

For the promotion of the positioning ability of the network for the multi-scaled insulators, the self-calibrated convolutional network with the Focus layer is used in the feature extraction module, which enhances the data. Moreover, it adaptively establishes a potential space around each specific location containing contextual information, which expands the receptive field of the convolutional layer. It enables the network to combine more abundant information and improves the network’s ability to obtain characteristic information when the insulator sample is small-sized. The structure of the improved self-calibrated convolutional feature extraction network is shown in Figure 3.
Specifically, the Focus layer is inserted at the head end of the improved self-calibrated feature extraction network. The original 640 × 640 × 3 image is input into the Focus structure and then transformed into a 320 × 320 × 12 feature map by slice operation. After contact, a convolution operation is implemented again. The feature map has finally changed to 320 × 320 × 64. The Focus layer carries out the down-sampling process, which rapidly and efficiently improves the extent of the effective receptive field while retaining the feature information of the object. Then, the feature graph with an input size of 320 × 320 × 64 is divided into two 320 × 320 × 32 parts, which are respectively input into two scale spaces for convolutional feature conversion. After average pooled down-sampling in the self-calibration space, up-sampling is performed, and the Sigmoid activation function is used to calibrate the features extracted from the convolution. Finally, the feature map is derived from the fusion of the contact.
Figure 4 shows the comparison of heat maps between CSPDarknet53 and the improved SCconv feature extraction network. From it, the expanded receptive field, the decreasing influence of irrelevant background information, and the promoted locating accuracy of targeted insulators in the network model can be seen.

3.2. Mask Generation Method Based on SKNet

The input in the reweighted part is the stitching of the original image and the object mask. Since the mask used in the original model is the target location in the rectangular frame, the precise contour of the target cannot be located. To reduce the negative effects of background on the discriminability of the pixel feature vector of the insulator image, a selective kernel network-based attention mechanism is introduced to generate the detailed pixel-level mask adaptively.
As shown in Figure 5, SKNet can be divided into three portions: Segmentation, Fusion, and Selection. In the segmentation part, the original input image passes two convolution kernels with sizes 3 × 3 and 5 × 5, respectively, to generate two feature graphs, U1 and U2. In the fusion part, firstly, the feature map is fused by element-wise summation, then the feature information is embedded by global average pooling, dimensionality is reduced by the full connection layer, and the binary classification task is completed by the Softmax activation function. Finally, two feature diagrams, S1 and S2, are generated, respectively, in the selection part, and the output feature mask is obtained by element-wise multiplication and weighting.
The mask used in the reweighting module of this method is generated by SKNet after training with the above method. The comparison of the generated mask is shown in Figure 6. As shown in this figure, the mask generated by the selective kernel attention mechanism network is increasingly focusing on the fine features of the insulator target region and can extract pixel-level feature information more effectively. This helps optimize the model’s differentiation performance for small differences in insulators on different scales.

3.3. Multi-Stage Non-Maximum Suppression Algorithm

In the prediction module of the network, since a great deal of prediction boxes would be generated at each anchor, the detector deletes all the prediction boxes that IoU is less than the threshold when the original non-maximum suppression algorithm of the YOLOv5 network was used. Based on the above unsettled problems, an improved multi-stage adaptive NMS algorithm is proposed to improve the ability to detect the occluding insulators. The multi-stage penalty function is introduced, and the application of this function makes the detection box whose IoU value is greater than the threshold value not discarded. Additionally, the results of all prediction boxes are retained as far as possible to decrease the missed detection rate of insulators in the case of occlusion. The penalty function is shown in Equation (1):
P i = { S i 1 I o U ( M , b i ) 3 , I o U ( M , b i ) < N 1 S i [ 0.7 lg ( I o U ( M , b i ) + 0.5 ) ] ,   N 1 I o U ( M , b i ) N 1 S i 1 I o U ( M , b i ) 2 , I o U ( M , b i ) > N 2
where S i represents the confidence score of the i-th prediction box; N 1 and N 2 represent the two thresholds of the penalty function, and 0 < N 1 < N 2 < 1 . The pseudocode of the improved multi-stage non-maximum suppression algorithm is shown in Algorithm 1.
Algorithm 1. Multi-stage non-maximum suppression algorithm pseudocode.
Input:
Initial candidate box set B = {b1, …, bN}
  Confidence set K = {K1, …, KN}
Begin
 Define empty set D
while  The candidate box set B is not empty  do
  Order by confidence score from highest to lowest
  The candidate box M with the highest confidence is moved into set D and removed from set B
for  Candidate boxes in set bi  do
if  0 < The IoU of candidate frame M and candidate frame bi < N1  then
Si = [1 − IoU(M,bi)3]1/2
else if  N1 ≦ The IoU of candidate frame M and candidate frame bi ≦ N2  then
Si = 0.7 − lg(IoU(M,bi)) + 0.5
else  Si = [1 − IoU(M,bi)2]1/2
Recalculate the confidence Ki
  end
end
 Output: Set D and the confidence set K
End

4. Experiment and Analysis

4.1. Experiment Preparation and Data Sets Settings

The hardware and environment used in this experiment are shown in Table 1.
The base insulator image samples are from the open-source insulator data sets CPLID [24] and IDID [25]. The new insulator image samples are composed of field shot images and a small part of the CPLID and IDID data sets, which are set into four categories. The number of samples is set at 5, 10, and 30. Therefore, three kinds of experiments are set up in this paper, and the experimental settings are 4-way 5-shot and 4-way 10-shot, and 4-way 30-shot respectively. Labelimg software is used to annotate the category and location information. The category and label information are shown in Table 2.

4.2. Training Strategy

In the process of training, base insulator data sets with sufficient data samples are first used to train the whole model, including the improved SCconv network, the feature reweighting module inserted into the SKNet attention mechanism, and the detector after the improved NMS algorithm is introduced. After the training is completed, the meta-feature in the retention network and the meta-knowlege are transferred successively. The new insulator images with only k-shots are divided into query sets and support sets according to the ratio of 1:4 for training.
In this experiment, the combination of warmup preheating learning rate and cosine annealing learning rate decline can make the learning at the early stage of training first maintained at a low level, the training process maintained stable through linear growth, and then the learning is slow first and then declined rapidly. This learning rate adjustment can ensure that the model tends to converge at an appropriate speed. By obtaining optimal parameters, the model’s performance can be improved. The experimental parameters are shown in Table 3.
In addition, to simulate image noise caused by bad weather and other conditions in real scenes, salt-and-pepper noise and Gaussian noise are introduced into 20% of image samples, as shown in Figure 7.
Due to insufficient occlusion in field images, to strengthen the learning capacity of the model under occlusion conditions, the cutout data enhancement strategy is introduced for 10% of image samples; that is, rectangular boxes are used to block images randomly, as shown in Figure 8.

4.3. Evaluation Index

Precision refers to the proportion of real cases in all predicted positive cases, and recall refers to the proportion of real cases in all positive cases [26]. The calculation method is shown in Equations (2) and (3):
Precision = TP TP + FP
Recall = TP TP + FN
where TP represents a positive sample detected and is in fact a positive sample; FP represents a positive sample when in fact it is a negative sample; and FN means it is tested as a negative sample but is actually a positive sample.
Furthermore, the average accuracy index of mainstream evaluation indicators of object detection is introduced, as shown in Equation (4):
mAP = i = 1 n AP n n
To comprehensively evaluate the effectiveness of the improved method, the harmonic average evaluation indexes F1-score and F2-score of precision ratio and recall ratio are introduced, as shown in Equations (5) and (6):
F 1 = TP TP + 0.5 FP + 0.5 FN
F 2 = TP TP + 0.8 FP + 0.2 FN
Given the unique characteristics of insulator images, the method aims to highlight the detection capability of insulators with varying scales. To achieve this, weights are adjusted based on different AP values, and a multi-scale accuracy metric, APms, is defined, as shown in Equation (7):
AP ms = 0.5 × AP S + 0.15 × AP M + 0.35 × AP L
where the APS boundary frame area is less than 32 × 32, the APM boundary frame area is between 32 × 32 and 96 × 96, and the APL boundary frame area is greater than 96 × 96.

4.4. Experimental Results and Analysis

Figure 9 shows the comparison of insulator test diagram samples of large-scale samples, small-scale samples, defect samples, block samples, samples with salt-and-pepper noise, samples with Gaussian noise, and samples with cutout data enhancement under the 30-shot setting. The first column is the test result for the original FSRW model. The second is the test result of the improved model. As can be seen from Figure 9a, the improved method’s positioning ability on large-scale insulator targets is improved by a large margin compared with the original FSRW model. From Figure 9b, the improved model not only improves the positioning ability of small-scale insulator targets but also reduces the occurrence of missed detection. From Figure 9c, the improved method avoids a range of false detections on the whole string of insulators for multiple strings and can better identify the defective part of the insulator. From Figure 9d, compared with the original method, this method can better detect the location and classification information of blocking insulators. Figure 9e,f show that the detection accuracy of this method is still improved after the influence of salt-and-pepper noise and Gaussian noise is introduced, which proves the noise suppression performance of this method. Figure 9g shows that insulator targets can also be detected by this method after cutout rectangular frame occlusion is introduced. This proves that this method can also realize positioning and recognition by using a small part of the insulator’s characteristic information after occlusion. Figure 9 shows the effectiveness of the improved model.
Figure 10 shows the P-R graph under different shot settings before and after the improvement, in which the abscissa is recalled and the ordinate is precision. As can be seen from the figure, the improved model has a larger area enclosed by the horizontal and vertical coordinates. This indicates that this method has achieved better detection performance in few-shot insulator detection tasks, especially in the settings of 10-shot and 30-shot.
In order to visually showcase the enhancement brought by the improved self-calibrated feature extraction network in detecting few-shot insulator images of various scales, the backbone network in this model is replaced with different architectures. Specifically, Resnet [27], VGG16 [28] from Faster R-CNN, CSP Darknet53 [12] from YOLOv4, and SCconv are utilized as alternative backbone networks in the model. Under the setting of 30-shot, the detection accuracy results of different feature extraction networks at different scales are shown in Table 4. According to the table, the APS of this method is increased by 1.4–13.3% when detecting insulator targets on a small scale, which proves that the performance of this method is improved. The APM of the proposed method also increases by 0.7–11.6% when detecting medium-insulator targets. When detecting large-sized insulators, the APL of this method is slightly lower than that of Resnet, but it exceeds most feature extraction networks, increasing by 0.6–2.6%. The multi-scale accuracy APms of the feature extraction network improved by this method is increased by 1.8–9.9% when detecting insulators with different boundary frame areas, which shows the validity of the improved method.
To show the comparison of the detection effects of this method before and after the insertion of the SKNet attention mechanism module, Figure 11 shows the F1-score and F2-score of different categories of this method under the setting of 30-shot. The scores of F1 and F2 in the detection of normal insulators increase by 0.059–0.104 and 0.046–0.075, respectively. Similarly, in the detection of defective insulator parts, the results increase by 0.120–0.156 and 0.056–0.120, respectively. These improvements indicate a broader range of enhancements achieved by the method. The observed improvements can be attributed to the integration of the attention mechanism module into the network. This integration enables the improved network to effectively identify more subtle differences between defects and normal insulators by combining the more detailed features of the insulator image. As a result, the model’s identification ability is further enhanced.
Table 5 shows the average precision rate of different NMS algorithms under two different learning rate decline strategies. As can be seen from the table, under the same NMS algorithm, a higher mAP can be obtained by the warmup cosine annealing strategy, which increases by 0.2–1.5%. Under the same learning rate reduction strategy, the improved multi-stage NMS algorithm effectively strengthens the detection ability of the model, and mAP is improved by 3.6–5.9%. Using the improved method with the combination of the network of NMS and the learning rate decline strategy algorithm, the maximum mAP achieved under the settings of 5-shot, 10-shot, and 30-shot is 29.6%, 36.0%, and 48.3%, respectively. These results demonstrate an improvement of 5.4%, 6.3%, and 4.3% compared to other methods. It shows that the NMS algorithm and warmup cosine annealing training strategy can efficaciously improve the detection ability of the model.
Finally, Figure 12 shows the comparison between the improved method and mAP of TFA [16] and the original FSRW method [17] for few-shot object detection. As can be seen from the results, the mAP of the improved method increased by 5.1% and 8.3% in 5-shot settings and increased by 4.2% and 6.1% in 10-shot settings. In 30-shot settings, the results are improved by 8.6% and 11.1%. This significant improvement indicates that the proposed method has a targeted improvement in few-shot insulator detection tasks compared with the baseline method in dealing with few-shot object detection, which verifies the validity of the improved method.

5. Conclusions

This paper presents a method for identifying insulators under few-shot conditions, utilizing few-shot object detection via a feature reweighting approach. The proposed method addresses the challenges of low accuracy and high omission rates encountered when detecting insulator images with varying sizes, defects, and occlusions under few-shot conditions. In the feature extraction network part, the self-calibrated convolutional network is introduced and promoted the feature extraction ability for insulators of different sizes. The SKNet attention mechanism is embedded before the input of the reweighting module, which enhances the performance of the model by extracting the key detail meta-feature information of the support set. Finally, a multi-stage non-maximum suppression algorithm for missing values is introduced to set a penalty function for confidence. The results of multiple prediction boxes are retained to reduce the occurrence of false checks and cases. In the experiment, data enhancement and a warmup cosine annealing learning rate reduction strategy are adopted to further develop the detection ability of the model. The experimental results show that the average accuracy achieved by this method reaches up to 48.3%. This accuracy level is significantly higher, with an improvement of 8.6% compared to the original method. This substantial enhancement in accuracy greatly improves the detection and recognition ability of the network for normal and special insulators under few-shot conditions.
Although the accuracy of this paper has been improved to some extent, it is still difficult to reach the same level as the model developed by using large-scale data training. In future work, we can try to use a deeper and more complicated network structure to further increase the accuracy of insulator identification under few-shot conditions.

Author Contributions

Conceptualization, J.W.; methodology, J.W. and Y.Z.; software, Y.Z.; validation, Y.Z.; formal analysis, J.W. and Y.Z.; investigation, J.W.; resources, J.W. and Y.Z.; data curation, Y.Z.; writing—original draft preparation, Y.Z.; writing—review and editing, J.W.; visualization, Y.Z.; supervision, J.W.; project administration, J.W.; funding acquisition, J.W. All authors have read and agreed to the published version of the manuscript.

Funding

This research was financially supported by the Jilin Science and Technology Development Plan Project (Grant No. 20200403075SF), Doctoral Research Start-up Fund of Northeast Electric Power University (Grant No. BSJXM-2018202).

Institutional Review Board Statement

Not applicable.

Informed Consent Statement

Not applicable.

Data Availability Statement

Not applicable.

Acknowledgments

The authors are grateful to the editor and reviewers for their suggestions.

Conflicts of Interest

The authors declare no conflict of interest.

References

  1. Gu, J.; Hu, J.; Jiang, L.; Jiang, L.; Wang, Z.; Zhang, X.; Xu, Y.; Zhu, J.; Fang, L. Research on object detection of overhead transmission lines based on optimized YOLOv5s. Energies 2023, 16, 2706. [Google Scholar] [CrossRef]
  2. Ren, S.; He, K.; Girshick, R.; Sun, J. Faster R-CNN: Towards real-time object detection with region proposal networks. Adv. Neural Inf. Process. Syst. 2015, 28, 91–99. [Google Scholar] [CrossRef] [PubMed]
  3. Liu, W.; Anguelov, D.; Erhan, D.; Szegedy, C.; Reed, S.; Fu, C.-Y.; Berg, A.C. SSD: Single shot multibox detector. In Proceedings of the 2016 European Conference on Computer Vision (ECCV), Amsterdam, The Netherlands, 8–16 October 2016; pp. 21–37. [Google Scholar]
  4. Redmon, J.; Divvala, S.; Girshick, R.; Farhadi, A. You only look once: Unified, real-time object detection. In Proceedings of the 2016 IEEE Conference on Computer Vision and Pattern Recognition (CVPR), Las Vegas, NV, USA, 26 June–1 July 2016; pp. 779–788. [Google Scholar]
  5. Tang, Y.; Han, J.; Wei, W.; Ding, J.; Peng, X. Research on part recognition and defect detection of transmission line in deep learning. Electron. Meas. Technol. 2018, 41, 60–65. [Google Scholar]
  6. Zhao, Z.; Zhen, Z.; Zhang, L.; Qi, Y.; Kong, Y.; Zhang, K. Insulator detection method in inspection image based on improved faster R-CNN. Energies 2019, 12, 1204. [Google Scholar] [CrossRef]
  7. Han, H.; Luo, J.; Liu, L.; Zhao, S.; Xia, C.; Zhao, A. Research on detection method of transmission line components based on UAV image. Electr. Meas. Instrum. 2022, 1–7. [Google Scholar]
  8. Ma, P.; Fan, Y. Sample smart substation power equipment component detection based on deep transfer learning. Power Syst. Technol. 2020, 44, 1148–1159. [Google Scholar]
  9. Zhang, H.; Li, J.; Zhang, B. Foreign object detection on insulators based on YOLO v3. Electr. Power 2020, 53, 49–55. [Google Scholar]
  10. Redmon, J.; Farhadi, A. YOLOv3: An incremental improvement. arXiv 2018, arXiv:1804.02767. [Google Scholar]
  11. Hui, H.; Huang, X.; Song, Y.; Zhang, Z.; Wang, M.; Chen, B.; Yan, G. An insulator self-blast detection method based on YOLOv4 with aerial images. Energy Rep. 2022, 8, 448–454. [Google Scholar]
  12. Bochkovskiy, A.; Wang, C.; Liao, H. YOLOv4: Optimal speed and accuracy of object detection. arXiv 2020, arXiv:2004.10934. [Google Scholar]
  13. Lin, T.; Maire, M.; Belongie, S.; Hays, J.; Perona, P.; Ramanan, D.; Dollár, P.; Zitnick, C.L. Microsoft coco: Common objects in context. In Proceedings of the 2014 European Conference on Computer Vision (ECCV), Zurich, Switzerland, 5–12 September 2014; pp. 740–755. [Google Scholar]
  14. Everingham, M.; Eslami, S.M.A.; Van, L.; Williams, C.K.I.; Winn, J.; Zisserman, A. The pascal visual object classes challenge: A retrospective. Int. J. Comput. Vis. 2015, 111, 98–136. [Google Scholar] [CrossRef]
  15. Zhang, H.; Zhang, J.; Koniusz, P. Few-shot learning via saliency-guided hallucination of samples. In Proceedings of the 2019 IEEE Conference on Computer Vision and Pattern Recognition (CVPR), Long Beach, CA, USA, 16–20 June 2019; pp. 2770–2779. [Google Scholar]
  16. Wang, X.; Huang, T.; Gonzalez, J.; Yu, F. Frustratingly simple few-shot object detection. In Proceedings of the 37th International Conference on Machine Learning (ICML), Online, 13–18 July 2020; pp. 9919–9928. [Google Scholar]
  17. Kang, B.; Liu, Z.; Wang, X.; Yu, F.; Feng, J.; Darrell, T. Few-shot object detection via feature reweighting. In Proceedings of the 2019 IEEE International Conference on Computer Vision (ICCV), Seoul, Republic of Korea, 27 October–2 November 2019; pp. 8420–8429. [Google Scholar]
  18. Li, W.; Wang, L.; Xu, J.; Huo, J.; Gao, Y.; Luo, J. Revisiting local descriptor based image-to-class measure for few-shot learning. In Proceedings of the 2019 IEEE Conference on Computer Vision and Pattern Recognition (CVPR), Long Beach, CA, USA, 16–20 June 2019; pp. 7260–7268. [Google Scholar]
  19. Hsieh, T.I.; Lo, Y.C.; Chen, H.T.; Liu, T.L. One-shot object detection with co-attention and co-excitation. In Proceedings of the 2019 Advances in Neural Information Processing Systems (NIPS), Vancouver, BC, Canada, 10–12 October 2019; pp. 2725–2734. [Google Scholar]
  20. Kim, J.; Kim, T.; Kim, S.; Yoo, C.D. Edge-labeling graph neural network for few-shot learning. In Proceedings of the 2019 IEEE Conference on Computer Vision and Pattern Recognition (CVPR), Long Beach, CA, USA, 16–20 June 2019; pp. 11–20. [Google Scholar]
  21. Han, G.; He, Y.; Huang, S.; Ma, J.; Chang, S.-F. Query adaptive few-shot object detection with heterogeneous graph convolutional networks. In Proceedings of the 2021 IEEE International Conference on Computer Vision (ICCV), Montreal, QC, Canada, 10–17 October 2021; pp. 3263–3272. [Google Scholar]
  22. Liu, J.; Hou, Q.; Cheng, M.; Wang, C.; Feng, J. Improving convolutional networks with self-calibrated convolutions. In Proceedings of the 2020 IEEE Conference on Computer Vision and Pattern Recognition (CVPR), Seattle, WA, USA, 14–19 June 2020; pp. 10093–10102. [Google Scholar]
  23. Li, X.; Wang, W.; Hu, X.; Yang, J. Selective kernel networks. In Proceedings of the 2019 IEEE Conference on Computer Vision and Pattern Recognition (CVPR), Long Beach, CA, USA, 16–20 June 2019; pp. 510–519. [Google Scholar]
  24. Tao, X.; Zhang, D.; Wang, Z.; Liu, X.; Zhang, H.; Xu, D. Detection of power line insulator defects using aerial images analyzed with convolutional neural networks. IEEE Trans. Syst. Man Cybern. Syst. 2020, 50, 1486–1498. [Google Scholar] [CrossRef]
  25. Lewis, D.; Kulkarni, P. Insulator Defect Detection. Available online: https://dx.doi.org/10.21227/vkdw-x769.s (accessed on 29 March 2023).
  26. Arifando, R.; Eto, S.; Wada, C. Improved YOLOv5-Based Lightweight Object Detection Algorithm for People with Visual Impairment to Detect Buses. Appl. Sci. 2023, 13, 5802. [Google Scholar] [CrossRef]
  27. He, K.; Zhang, X.; Ren, S.; Sun, J. Deep residual learning for image recognition. In Proceedings of the 2016 IEEE Conference on Computer Vision and Pattern Recognition (CVPR), Las Vegas, NV, USA, 26 June–1 July 2016; pp. 770–778. [Google Scholar]
  28. Simonyan, K.; Zisserman, A. Very deep convolutional networks for large-Scale image recognition. arXiv 2014, arXiv:1409.1556. [Google Scholar]
Figure 1. Example insulator image. (a) Examples of small-scale insulators; (b) Examples of defective insulators; (c) Examples of blocking insulators.
Applsci 13 06301 g001
Figure 2. Improved feature reweighting model structure.
Applsci 13 06301 g002
Figure 3. Improved self-calibrated feature extraction network.
Applsci 13 06301 g003
Figure 4. Heat map comparison of CSPDarknet53 and Improved SCconv.
Applsci 13 06301 g004
Figure 5. SKNet structure of attention mechanism network.
Applsci 13 06301 g005
Figure 6. Comparison of mask images generated before and after improvement. (a) Original insulator images; (b) The mask images generated by the original method; (c) The mask images generated by SKNet.
Applsci 13 06301 g006
Figure 7. Insulator images before and after introducing different noises. (a) Original image; (b) Image with salt-and-pepper noise; (c) Image with Gaussian noise.
Applsci 13 06301 g007
Figure 8. Cutout data enhancement examples (a) Original image; (b) Cutout data enhancement image.
Applsci 13 06301 g008
Figure 9. Comparison of insulator detection. (a) Comparison of large scale insulator detection; (b) Comparison of small scale insulator detection; (c) Comparison of insulator detection with the defect; (d) Comparison of insulator detection with blocking; (e) Comparison of insulator detection with salt-and-pepper noise; (f) Comparison of insulator detection with Gaussian noise; (g) Comparison of insulator detection with cutout rectangular frame occlusion.
Applsci 13 06301 g009aApplsci 13 06301 g009b
Figure 10. P-R comparison graph. (a) 5-shot P-R comparison graph. (b) 10-shot P-R comparison graph. (c) 30-shot P-R comparison graph.
Applsci 13 06301 g010
Figure 11. Comparison of F1 and F2 scores before and after improvement.
Applsci 13 06301 g011
Figure 12. mAP comparison of different methods.
Applsci 13 06301 g012
Table 1. Experimental hardware and environment.
ConfigurationParameters
Operating systemWindows 10
CPUIntel(R) Core(TM) i7-10700 CPU @ 2.90 GHz
GPUNVIDIA Geforce RTX2080 Ti
Experimental environment versionPython3.6, Pytorch1.6, Cuda10.1
Table 2. Insulator categories and labeling information.
CategoriesLabels
Glass normal insulatorInsulator1
Missing part of glass insulatorDefect1
Composite normal insulatorInsulator2
Missing part of composite insulator Defect2
Table 3. Training parameter setting.
ParametersSettings
Base lr0.001
Batch size16
Decay rate0.9
Epoch100
Table 4. Comparison of insulator detection accuracy of different feature extraction networks.
MethodAPSAPMAPLAPms
Resnet0.4160.4850.5180.462
VGG160.3240.3760.4650.381
Darknet530.3480.4010.4820.403
SCconv0.4570.4650.4620.460
Ours0.4710.4920.4880.480
Table 5. Comparison of network identification ability (mAP) for insulators under different algorithms.
NMS AlgorithmLearning Rate Decline Strategy5-Shot10-Shot30-Shot
Hard-NMSGradient descent0.2420.2980.440
Hard-NMSWarmup cosine annealing0.2470.3010.447
Linear-NMSGradient descent0.2550.2970.457
Linear-NMSWarmup cosine annealing0.2570.3040.462
Gaussian-NMSGradient descent0.2650.3180.451
Gaussian-NMSWarmup cosine annealing0.2720.3210.458
Multistage NMSGradient descent0.2810.3500.468
Multistage NMSWarmup cosine annealing0.2960.3600.483
Disclaimer/Publisher’s Note: The statements, opinions and data contained in all publications are solely those of the individual author(s) and contributor(s) and not of MDPI and/or the editor(s). MDPI and/or the editor(s) disclaim responsibility for any injury to people or property resulting from any ideas, methods, instructions or products referred to in the content.

