Article

The Impact of ECAP Parameters on the Structural and Mechanical Behavior of Pure Mg: A Combination of Experimental and Machine Learning Approaches

by
Waleed H. El-Garaihy
1,2,*,
Amal BaQais
3,*,
Abdulrahman I. Alateyah
1,
Mohammed F. Alsharekh
4,
Majed O. Alawad
5,
Mahmoud Shaban
4,6,
Fahad Nasser Alsunaydih
4 and
Mokhtar Kamel
2
1
Department of Mechanical Engineering, College of Engineering, Qassim University, Unaizah 56452, Saudi Arabia
2
Mechanical Engineering Department, Faculty of Engineering, Suez Canal University, Ismailia 41522, Egypt
3
Department of Chemistry, College of Science, Princess Nourah bint Abdulrahman University, Riyadh 11671, Saudi Arabia
4
Department of Electrical Engineering, College of Engineering, Qassim University, Unaizah 56452, Saudi Arabia
5
Center of Excellence for Nanomaterials for Clean Energy Applications, King Abdulaziz City for Science and Technology (KACST), Riyadh 12354, Saudi Arabia
6
Department of Electrical Engineering, Faculty of Engineering, Aswan University, Aswan 81542, Egypt
*
Authors to whom correspondence should be addressed.
Appl. Sci. 2023, 13(10), 6279; https://doi.org/10.3390/app13106279
Submission received: 2 April 2023 / Revised: 11 May 2023 / Accepted: 19 May 2023 / Published: 20 May 2023
(This article belongs to the Topic Hybrid Computational Methods in Materials Engineering)

Abstract

:
Commercial pure Mg specimens were processed through equal channel angular pressing (ECAP) using two dies with die angles of 90° and 120°. Mg billets were processed up to four passes via different route types. Machine learning (ML) techniques were adopted to estimate the ECAP parameters and verify the experimental findings. Several ML techniques were employed to estimate the effect ECAP parameters of pure Mg on microstructural evolution, Vicker’s microhardness (HV), and tensile properties for ECAP billets and their as-annealed (AA) counterparts. Electron back-scatter diffraction (EBSD) was applied to determine the structural evolution and crystallographic texture both prior to and following the ECAP process for the Mg billets. EBSD analysis showed that route Bc is the most effective route in grain refinement, and four passes of route Bc experienced a significant refinement of 86% compared to the AA condition. Furthermore, the crystallographic texture showed that four passes of route Bc produced the most robust texture that was greater than 26.21 times random. ML findings revealed that the grain size demonstrated a strong correlation of −0.67 with rising number of passes, while ϕ affected the grain size strongly with 0.83. When adopting a 90°-die to accumulate the plastic strain up to 4Bc, the subsequent HV was indeed 111% higher than that of the AA equivalent. From ML findings it was clear that the number of passes was the most significant parameter on the Mg HV values, while ECAP channel angle (ϕ) revealed high correlation factor with HV values as well. Furthermore, four passes of route Bc with ϕ = 90° and 120° led to a significant increase of the tensile strength by 44.7%% and 35.7%, respectively, compared to the AA counterpart. ML findings revealed that the tensile strength was affected by the increasing number of passes with a strong correlation of 0.81, while affecting ductility moderately with 0.47.

1. Introduction

Magnesium (Mg) alloys are considered among the lightest metal alloys in existence and are remarkably strong relative to their weight; in fact, their density is just a fraction of that of aluminum and that of steel [1,2,3]. Moreover, Mg alloys have attractive traits [4,5,6] in different utilizations, including the aviation and automobile sectors [7,8,9], including substantial specific strength, specific stiffness, and significant recyclability. In addition, owing to their weight reductions of around 10%, Mg alloys are seen as a crucial option to minimize carbon dioxide emissions from cars, as this translates to a substantial decrease in energy usage of 5–10% [10].
Nonetheless, Mg alloys’ low ability to deform is a key drawback that limits their use in many fields, including aircraft and shipbuilding, due to their hexagonal close-packed (hcp) crystal structure, which results in a small range of potential deformation directions [11]. That is, Mg deformation is extraordinarily challenging because of the large discrepancies in the essential resolved shear stresses for the various slip systems [5,12,13,14]. Hence, Mg and related alloys struggle to form when produced using conventional techniques such as extrusion and rolling without heating [15]. Adversely, the formability of Mg alloys is ameliorated at elevated temperatures [16,17,18]; the hardening effects of deformation are mitigated by dynamic recrystallization and recovery processes. Diverse Mg alloys with improved corrosion resistance, ductility, and/or both have been developed over the past few years [19,20,21]. Because of this, it is preferable to improve the ability to deform of Mg alloys by employing plastic processing procedures to regulate texture.
Methodologies of severe plastic deformation, such as high-pressure torsion [22,23,24], equal channel angular pressing (ECAP) [12,25,26,27,28,29], twist extrusion (TE) [30], multichannel spiral twist extrusion (MCSTE) [31,32,33], accumulative rolling bonding [34], and rolling in a three-high skew rolling mill [35], show promise for providing the ability to deform Mg alloys without heating them [36,37]. ECAP belongs to the numerous severe plastic deformation methods that can effectively create nanostructures and ultrafine grain (UFG) structures in alloys that are used in a variety of industrial applications [37,38,39,40,41].
Given the relationship of the microstructural and mechanical attributes of affected materials and the level of permanent alteration produced, a variety of investigators have undertaken a period of study investigating various elements of the ECAP process to examine the effect of processing variables on material behavior. Thus, it was critical to the design of an ECAP process to comprehend the phenomenon of strain growth. As shown by Equation (1) [38,39], the equivalent strain ( ε e q ) could be calculated theoretically based on the die shape. The strain of the specimens produced by the ECAP method was determined by the number of passes (N), the inner channel angle (ϕ), and the outside corner angle (Ψ), as explained in [38,39].
The three most common forms of ECAP routes are A, Bc, and C [42,43,44]. Route A entails making multiple passes over the sample without rotating it while performing any of them. On the other hand, the specimen is turned by 90° with the very same orientation along its longitudinal axis after each transit in the case of route Bc [22,42,43]. Upon the completion of every single pass over route C, the specimen is turned by 180° to face the opposite orientation of the extrusion path [44,45]. Large alterations in texture, microstructure, and mechanical properties can be linked to ECAP’s influence on strain [42]. According to the analysis of Ghosh et al. [46], strain has been mostly uniformly distributed along route BC following the third pass through the cross-sectional area, whereas strain is mainly localized along route A in the upper left location and, in the case of route C, at the corners.
It is common knowledge that ECAP makes Mg alloys longer-lasting and stronger by improving their texture and refining their grains. In addition, it was found that the regular shift in orientation and shear surface throughout the overall procedure was caused by the various adopted ECAP routes with several passes, resulting in the greatest impact on refining grains [47]. Non-basal slip methods stimulation and the recently created texture were also observed to decrease the compressive behavior of the ECAP pure Mg as part of its mechanical attributes, obtained from extrusion without heating when ϕ was set at 90° utilizing route BC for two passes. Refining grains, meanwhile, led to an improvement in mechanical behavior following 4P [48]. In another instance, the ECAP method was used with the AA2014 aluminum alloy by Venkatachalam et al. [49]. It was shown in their work that the effective strain was equalized across all planes during processing by route Bc, and the mechanical behavior showed drastic enhancement as opposed to routes A, C, and Ba. The influence of ϕ on the strain uniformity, development of microstructure, texture crystallography, and mechanical behavior of pure Mg was investigated by A.I. Alateyah et al. [50]. The test took place with ϕ = 90° and 120°, and the specimens went via 4P of the Bc route. The analysis of microstructure and mechanical behavior measurements also indicated that the ϕ = 90° specimen had a finer grain and greater ultimate strength than the ϕ = 120° specimen.
In order to discover and create novel materials with exceptional features, researchers have placed a lot of time and effort into developing various techniques for designing materials, such as experimental design procedures, approaches to optimizing parameters, and tangible physical modeling [51,52,53]. In order to discover the right connections across intricate features of materials and conceptual designs, conventional methods often necessitate a thorough, tangible, physical examination. There are a variety of laws of physics and chemistry that govern material features that must be explored in this context. Machine learning (ML) models are another option; these models just need a dataset to capture the understanding of the links among material attributes and design parameters, and they have lately shown great success in the field of material design.
During the past few years, there has been a lot of chatter about using ML in a wide variety of commercial settings, thanks in large part to the exponential growth in computational power, the accessibility of large databases, and the ease with which complex systems can be placed into practice. As a result, ML approaches are increasingly placed into practice to deal with large databases featuring rapid input flows and to carry out a variety of difficult tasks, including regression, categorization, data grouping, and dimensionality reduction. ML has advanced to the point that it can now handle intricate systems and expose complicated material systems, even with frequent transitions, by mining data for insights and making predictions about how the system will operate. Feeding fresh datasets to trained and well-tested ML models allows them to operate as a data analysis tool to independently extract outputs [54,55].
Data on ECAP’s effectiveness in terms of numbers is scarce in the literature. Because of its weak ability to deform, there are not many experiments that have looked at the way the ECAP method affects pure Mg; instead, researchers have mainly concentrated on Mg alloys with a ϕ of less than 90°. For this reason, the current research looked into how changing ECAP processing settings affected the grain size, Vicker’s microhardness, and tensile properties. Moreover, pure Mg was experimentally investigated for a range of ECAP factors, such as the number of passes (N), inner die angle (ϕ), and processing route. The full impact of ECAP on the evolution of microstructural and mechanical properties was assessed. In this study, ML techniques were used to create a model that can estimate pure Mg ECAP values. Models were trained and validated using ML techniques, including linear regression (LR), Gaussian process regression (GPR), and support vector machine for regression (SVR). A few assessment measures, such as mean squared error (MSE), root mean squared error (RMSE), and coefficient of determination (R2 score), were employed to check and evaluate the trained models.

2. Materials and Methods

2.1. Materials and Experimental Methods

The Mg employed currently measures 10 mm in radius and 500 mm long, and it is commercially pure (containing just 0.06% Al, 0.008% Ca, 0.005% Cr, 0.002% Cu, 0.015 Fe, 0.012% Mn, 0.005% Ni, and 0.06% Zn, and the balance is Mg). A precision cutting machine was employed, aiming at cutting the Mg billets into 60 mm long pieces for the ECAP samples. The specimens were annealed at 250 °C for 1 h prior to going through the ECAP. Single pass (1P), 2 passes (2P), and 4 passes (4P) of ECAP were employed to process the billets, along with a variety of routes (A, Bc, and C). A temperature of 225 degrees Celsius and a ram velocity of 0.05 mm per second were employed to carry out the ECAP process. After each pass, the die’s interior surfaces were lubricated with a graphite-based substance to lessen frictional force across the specimens obtained from ECAP and the utilized die. The exterior angle (Ψ) of the split ECAP die employed was 20 degrees. Both of the adopted ECAP dies featured different inner channel angles (ϕ) of 90° and 120°.
Scanning electron microscopy (SEM) was adopted to investigate the microstructural development of commercially available pure Mg billets. Furthermore, EBSD was applied to determine its structural progression and crystallographic texture both prior to and following the ECAP process. Both the AA and the ECAP billets were employed for the analysis of the microstructure, with cross-sections trimmed longitudinally (LS) in a given plane parallel to the orientation of the press (flow plane) and perpendicular to the die entrance channel), where the axes of the reference system coincide with the extrusion ECAP direction “Y” (ED), the normal direction “Z” (ND), and the transversal direction “X” (TD), as displayed in [27]. A conductive epoxy was employed for the cold mounting of the sample. Wheels revolving at a rate of 150 revolutions per minute were used to perform the grinding and polishing. The sample was cleaned with water in every grinding stage and then ground with 600, 800, 1000, and 1200-grit silicon carbide sandpaper. Diamond suspensions with a particle size of 3 and 1 µm and a yellow DP-lubricant were employed in the initial polishing phase, while a colloidal silica suspension with a particle size of 0.05 µm was employed for the last polishing phase, which lasted until an external surface without scratches was reached, which was detected with the use of an optical microscope. As a lubricant, water that had gone through the distillation process was employed. Following every phase of polishing, ultrasonic waves were employed to properly clean the sample using ethanol for 10 min; consequently, a drying process using a blow-dryer was performed. The sample was polished, then an etching in a hydrochloric acid and nitric acid mixture was performed (12 mL HCl + 8 mL HNO3 + 100 mL ethanol) for a couple of seconds before being rinsed in ethanol. The etching spots or oxide coatings were removed from the sample’s surface through ion milling for 30 min at 2 keV ion beam energy, 0.425 s−1 sample rotating velocity, and an 85° sample inclination angle, where the sample surface was inclined at 5° comparative to the ion beam axis. At 15 kV, 1.5 nA average current, and a 70° inclination angle, an SU-70 SEM was employed to obtain EBSD observations on the upper surface of the ED plane. With a resolution of 100 nm, crystallographic data were acquired with the help of the HKL Channel5 Flamenco program. After gathering crystallographic data, a post-processing HKL Channel 5 program was employed to create an inverse pole figure (IPF) map.
Testing for microhardness employing Vicker’s method was carried out on the specimens prior to and following ECAP processing, beginning at the edges of the billets and working inward. The HV’s testing was conducted on the LS which was a square 20 × 20 mm2, and on the transverse section (TS), which was a circular area with diameter 20 mm, both the LS and TS were cut from the center of the Mg billets. The recorded HV value was the average of the measured HV’s values. In order to determine the hardness, a 0.5 kg load was imposed for 15 s. Moreover, the ECAP specimens’ tensile properties were also examined before and after ECAP processing using a 100 kN universal testing machine, employing a predetermined strain rate set at 0.001 s−1 at room temperature. To find the specimens to be employed for tensile testing, samples were taken from the middle area of the ECAP specimens. Tensile sample sizes were standardized using the E8M/ASTM protocol. In order to ensure the precision of the outcomes, 3 samples were evaluated for each processing condition.

2.2. Design of Experiments

The effect of three ECAP factors on the microstructural and mechanical properties of pure Mg is explored in this work. Table 1 shows that these three variables are the number of passes (N), the angle of the ECAP die (ϕ), and the processing route. An ML-based strategy was employed to create the various sets of ECAP parameters to examine the range of possible ECAP responses; 16 separate trials were conducted. Grain size (GR), the sample’s HV, and the tensile properties of ultimate tensile strength (σu) and ductility (Du) were the independent parameters in this context. Table A1 (Appendix A) displays the results of grain size, HV values, and tensile testing.

2.3. Machine Learning Approach

ML techniques are classified as supervised learning, unsupervised learning, semisupervised learning, and reinforcement learning. The far more prevalent type of ML technique is supervised learning, which employs training data to find patterns and predict future outcomes based on previous results. The unsupervised learning framework includes many critical phases, such as data preprocessing, data standardization, feature extraction, algorithm selection, model training, validation, and assessing [56]. The training dataset is employed to create an initial model capable of matching the input data with adjusted variables for model learning. The bulk of model learning procedures are implemented by searching inside the training data for empirical correlations that may result in best-fit relationships that correctly anticipate the model’s projected output. The validation dataset is employed to fine-tune the model variable structure in order to obtain greater accuracy in calibration. The probability distribution of the validation set should be the same as that of the training dataset. Furthermore, while the testing dataset is distinct from the training dataset, it shares similar probability distribution. The next step is to train the model by maximizing its performance, which is frequently determined using a cost function. Modifying model hyperparameters that influence the training process, model structure, and characteristics is frequently required. The hyperparameters should typically be adjusted, utilizing validation datasets distinct from both test and training sets.
Overfitting is a problem that can occur during model training when the model exactly matches all of the points in the dataset while neglecting the regularization criterion. In this case, the trained model almost invariably does not perform effectively during the testing phase. To address this issue, especially with a limited dataset (as in this study instance), the cross-validation (CV) technique is used. The k-fold CV method randomly arranges the sets of training into smaller ones, which are called folds. To calculate and assess prediction accuracy, the model is taught with the folds as training data for every k-fold, and the model is validated with the rest of the data as a test set. This procedure occurs k times inside an iterative loop, and the model evaluation metrics are generated by taking the mean of the metrics obtained during the loop. Although this method is computationally costly, it preserves data, particularly when the algorithm is taught on a limited collection of data.
Several ML techniques, including multivariable linear regression, Gaussian process regression (GPR), support vector machine (SVM), and support vector regression (SVR), were employed to estimate the ECAP variables of pure Mg. The chosen techniques are shortly described in the part that follows.

2.3.1. Multivariable Linear Regression

Linear regression techniques are frequently utilized to describe the connection between a single or many predictor parameters, referred to as input variables, and a response variable, which is the outcome of the model. The linear regression technique employs supervised ML to determine the optimal linear connection among a set of predictors and an associated response. It aids in the interpretation of experimental, economic, and physiological data, in addition to the understanding and prediction of the actions of complicated systems. Multiple input (X) through linear regression yields a response vector (Y), defined as
Y = β 0 + n = 1 N β n X n + ϵ n
where βn denotes the estimated linear parameters, β0 represents the constant value, and ϵn refers to the error terms.

2.3.2. Regression Gaussian Process

There have been recent significant strides in ML using the GPR, which is a nonparametric Bayesian regression technique [57,58]. This technique provides numerous benefits, including the potential to function effectively with minimal data as well as provide contemporaneous estimates of the output and related uncertainty.
The main advantage of employing GPR is the simultaneous estimation of the output value and the associated uncertainty. By using GPR, the formulated hybrid model can generate a probability density function (PDF) over the range FTs that embodies both the predicted TtF and the corresponding uncertainty associated with various sources.
GPR works by taking into account a training set of data (xi,yi); i = 1, 2, …, n, where xi ϵ ℝd and yi ϵ ℝ are drawn from an undefined distribution. Predicting the output parameter y* from a fresh input vector x* as well as the training data is the purpose of a GPR model. The preceding is the basic form of a linear regression model:
y = x T β + ε
where the β vector is the estimated coefficient of model fitting and ε is the error associated with the model. It should be noted that ε is normally distributed with a mean value of zero mean and a variance value denoted as σ2. In general, a Gaussian process (GP) is determined through its associated mean function m(x) and covariance function (or kernel function), k(x,x′), where x and x′ are two instances in the input features matrix x. Therefore, the predicted values of y* can be formulated as a GP:
y ~ G P ( m x , k x , x )
It should be noted that the covariance function must be chosen or made correctly because it is a key factor in how well GPR works. In reality, a lot of alike covariance functions in the GPR are available; however, reaching a particular choice is a case-by-case decision. One of the famous kernels that are commonly utilized with GPR is the radial basis function, which is written as [57]:
K x i , x j = e x p ( x i x j 2 2 σ 2 )
where x i x j represents the Euclidean distance among the two subject vectors and σ represents the dispersion of the kernel function’s distribution.

2.3.3. Support Vector Machine

SVM is frequently employed in ML modeling of regression or categorization issues [59]. SVR employs similar categorization techniques as the SVM, along with some minor modifications [59,60,61,62,63]. Throughout the regression instance, a range of tolerance (ε) is given to the SVM as a prediction of what the issue might have previously required. In addition, an additional intricate factor should be considered because the technique is more complex. The SVM technique determines the optimal hyperplane for splitting data into many groups with the greatest margin. f(x) is employed to, as closely as possible, mimic the training dataset (xi,yi), where i = 1, 2, …, N, and xn is a multivariate collection. In its simplest form, the function f(x) is represented as [59]:
f x = w x + b
Minimizing the following formula [59] yields optimality for the values of w and b:
m i n 1 2 W 2 + C i = 1 N ( ξ i + ξ i )
Subject to:
y i w x i b ε + ξ i w x i + b y i ε + ξ i ξ i , ξ i 0
where ξ is an ε-insensitive tube expressing error tolerance and C is a balance among the empirically-predicted error and generic term. Using the optimal constraints along with Lagrangian multipliers, the regression function may be stated as below [59]:
y = i = 1 N α i + α i K x i , x + b
where K(xi,x) is referred to as the kernel function. The linear, polynomial, sigmoidal, Gaussian, and radial basis functions are some of the most well-known kernel functions that are commonly used with SVR.

3. Results and Discussion

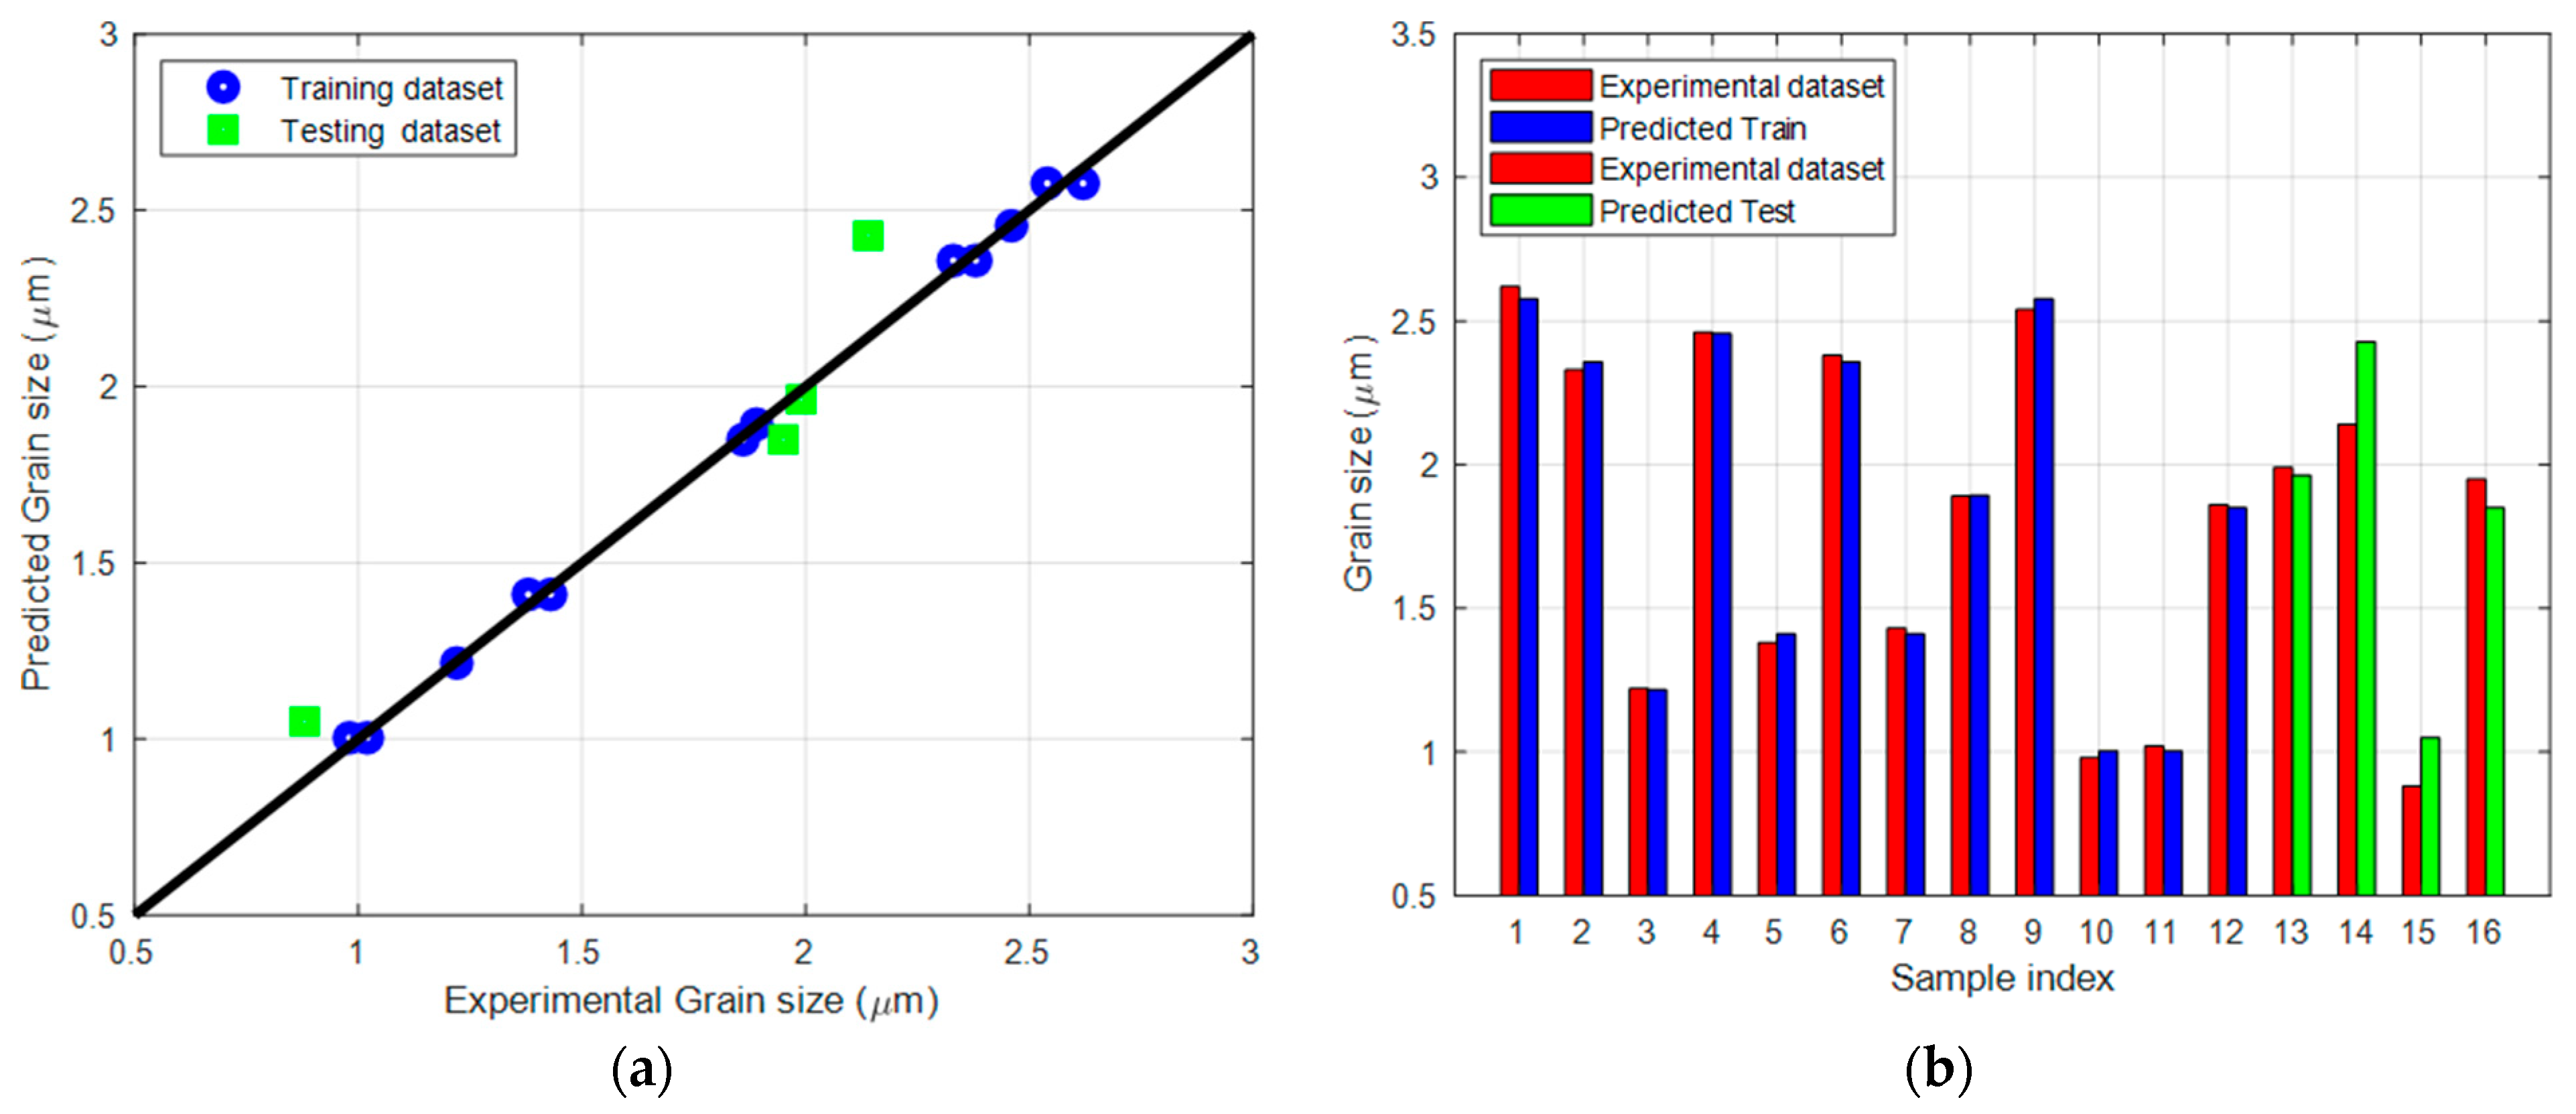
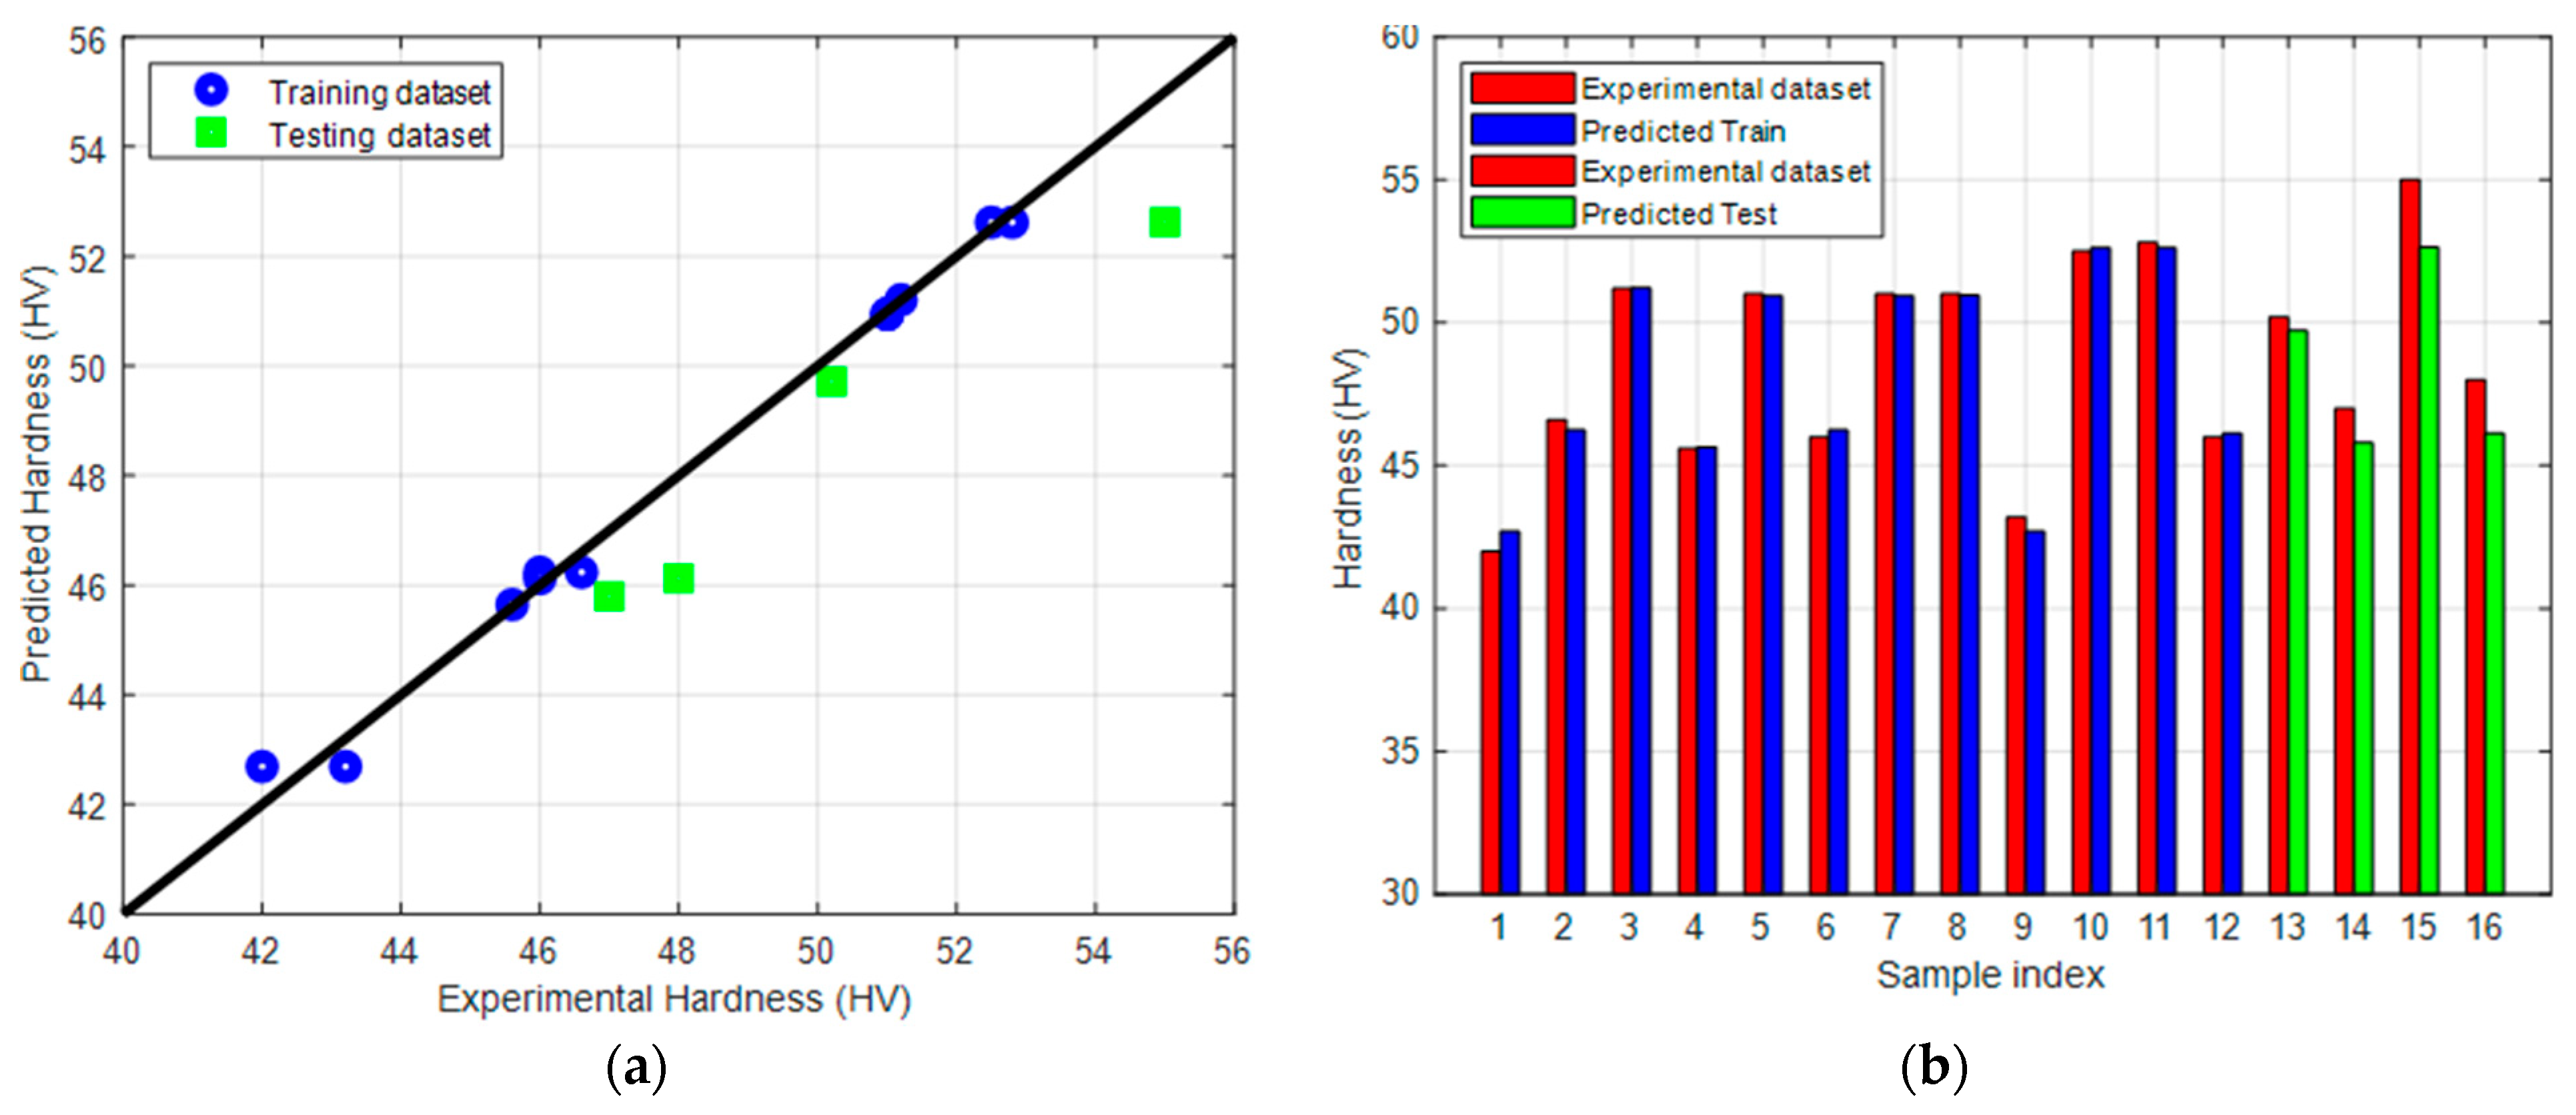
3.1. Analysis of Machine Learning Approach

The correlation coefficients among the pairs of parameters are depicted in the correlation chart depicted in Figure 1. The slope of a least-squares reference line for every pair of parameters serves as the correlation coefficient in each off-diagonal scatter subplot. A histogram representing the distribution of every parameter is shown along every diagonal subplot. Pearson’s coefficient, used to determine the degree of linear correlation among two sets of data, served as the basis for this graph. When a value is assigned to the correlation coefficient, it must be from −1 to 1. Linear correlations between a pair of parameters are said to be positively sloped when the values are positive, and vice versa. Coefficients approaching 1 indicate robust correlations, whereas those near 0 point to poor ones.
In addition, the correlation chart showed that the mechanical properties of hardness (H) and ultimate tensile strength (σu) were affected by the rising number of passes (N), where strong correlations of 0.81 and 0.44 were obtained, respectively, whereas the ductility (Du) demonstrated a moderate correlation of −0.37. Moreover, the grain size (Gr) demonstrated a strong correlation of −0.67 with N. Regarding the die angle (ϕ), it affected H strongly and σu moderately with −0.63 and −0.35, respectively, while affecting Du moderately and Gr strongly with 0.47 and 0.83, respectively. Moreover, the route type (Rt) weakly affected all four responses: H, σu, Du, and Gr. Calculation of the correlation coefficients is a popular approach in ML for data analysis and mining. It is capable of extracting the important features from a given collection of input and output characteristics, which subsequently play a considerable role during model training and fitting. In this study, the most important system feature was the number of passes, followed by the die angle, and finally the route type, which was the least important parameter.

3.2. Impact of ECAP Processing Factors

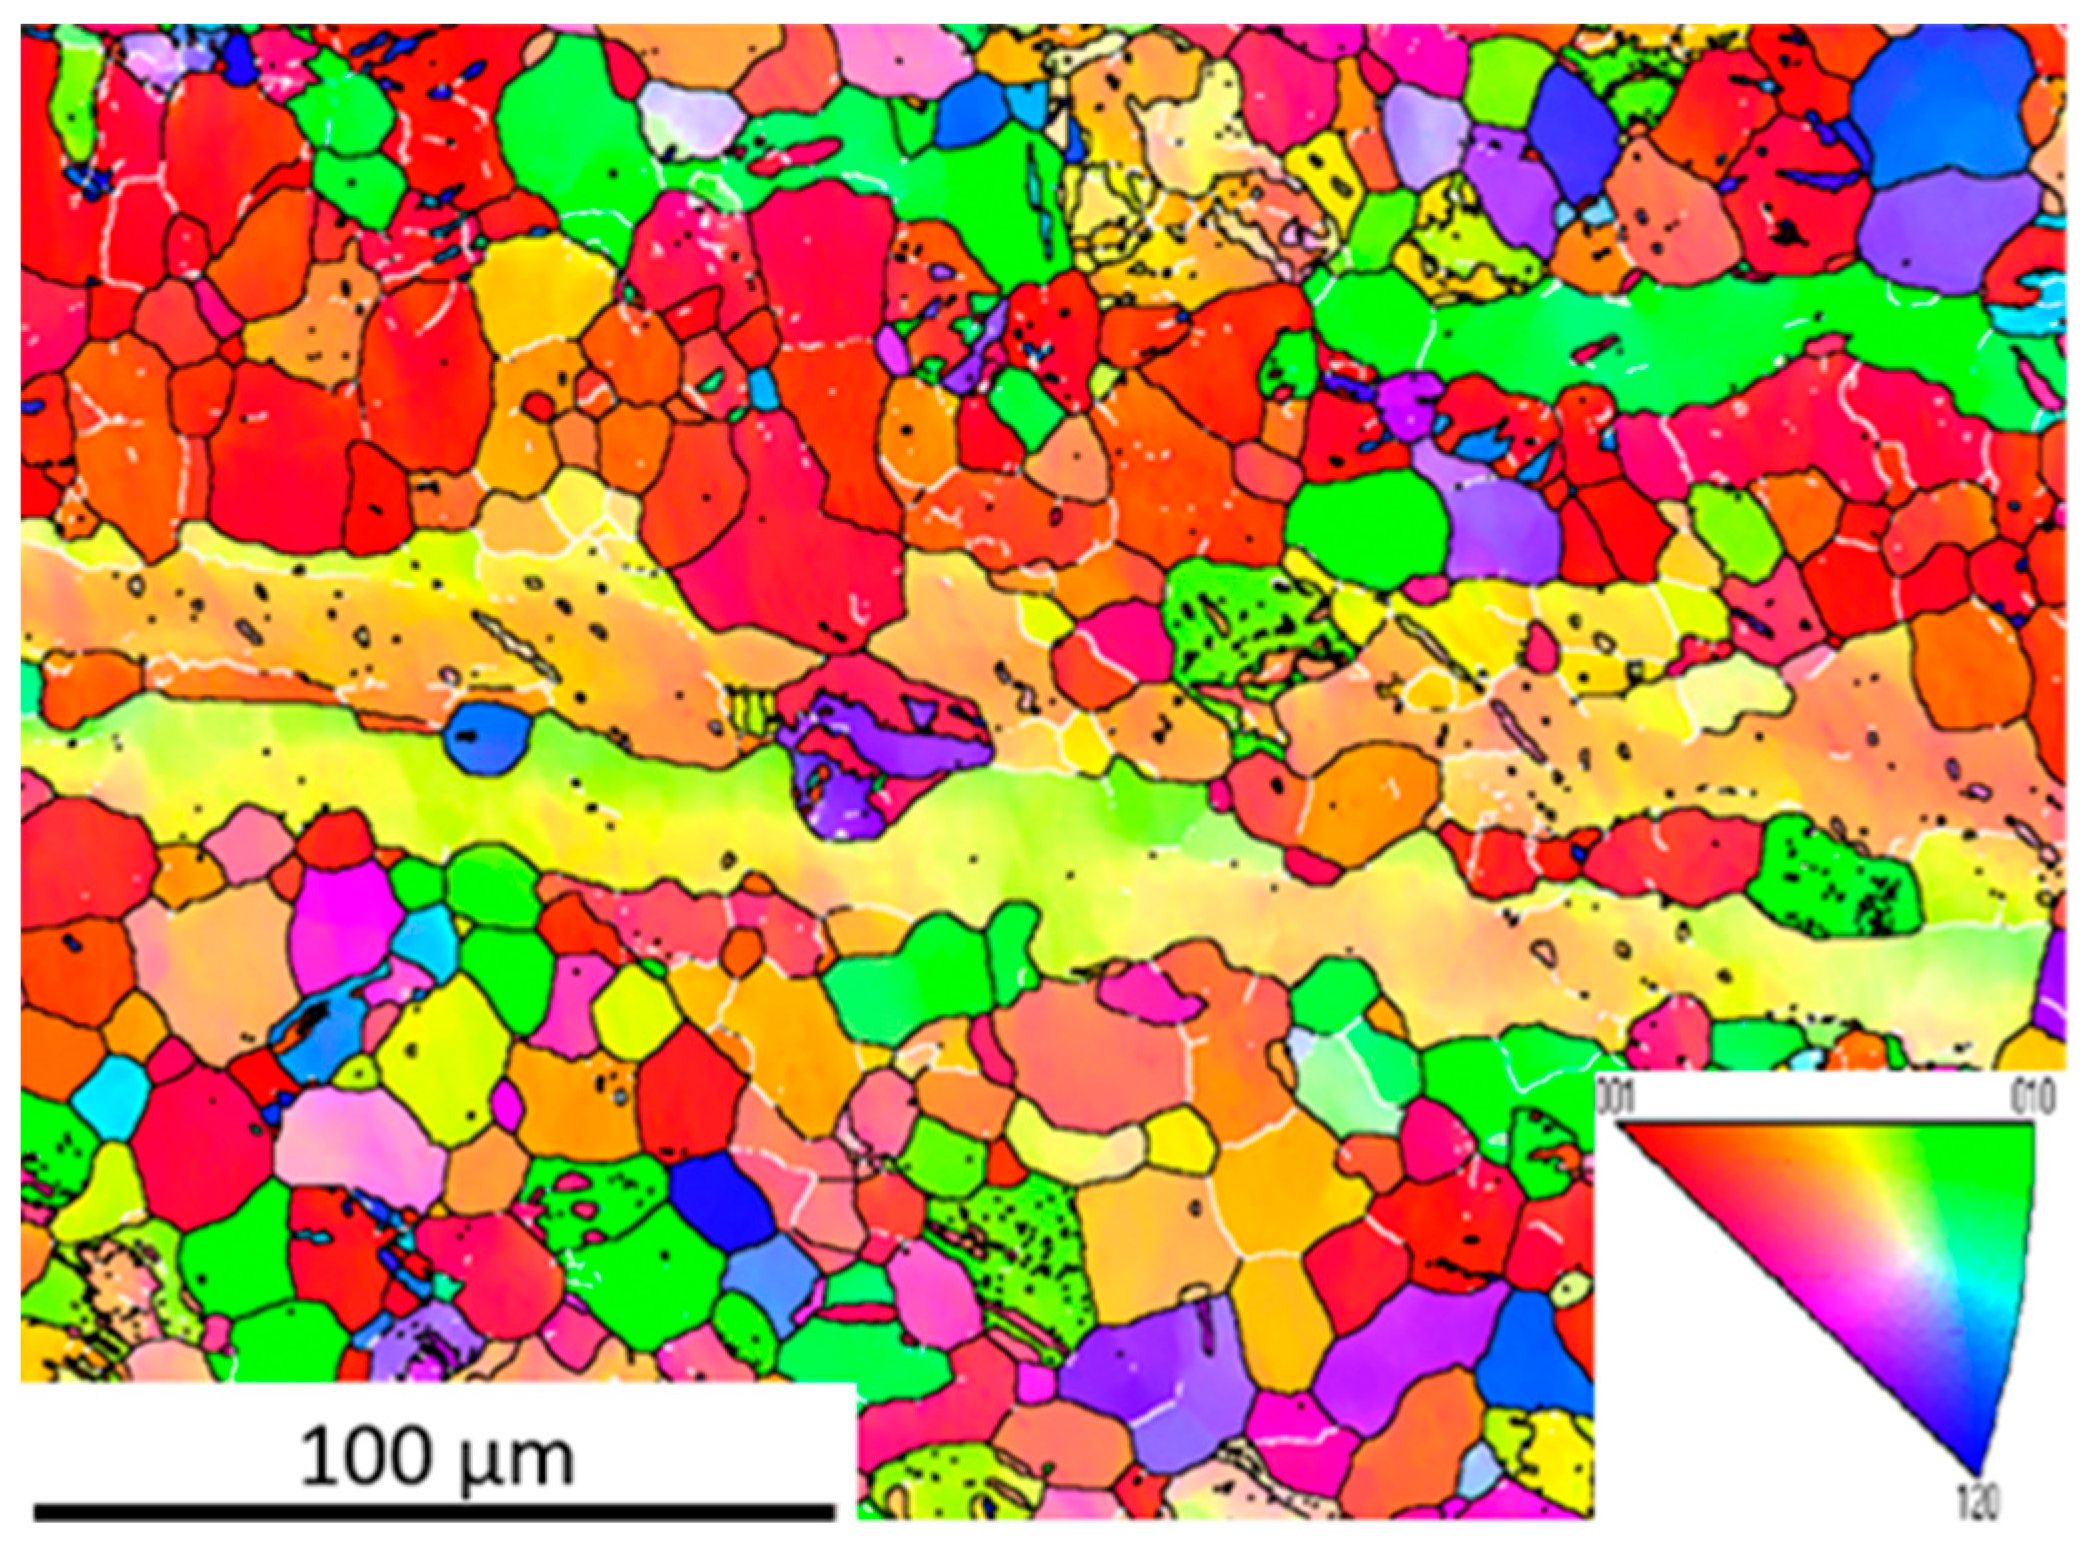
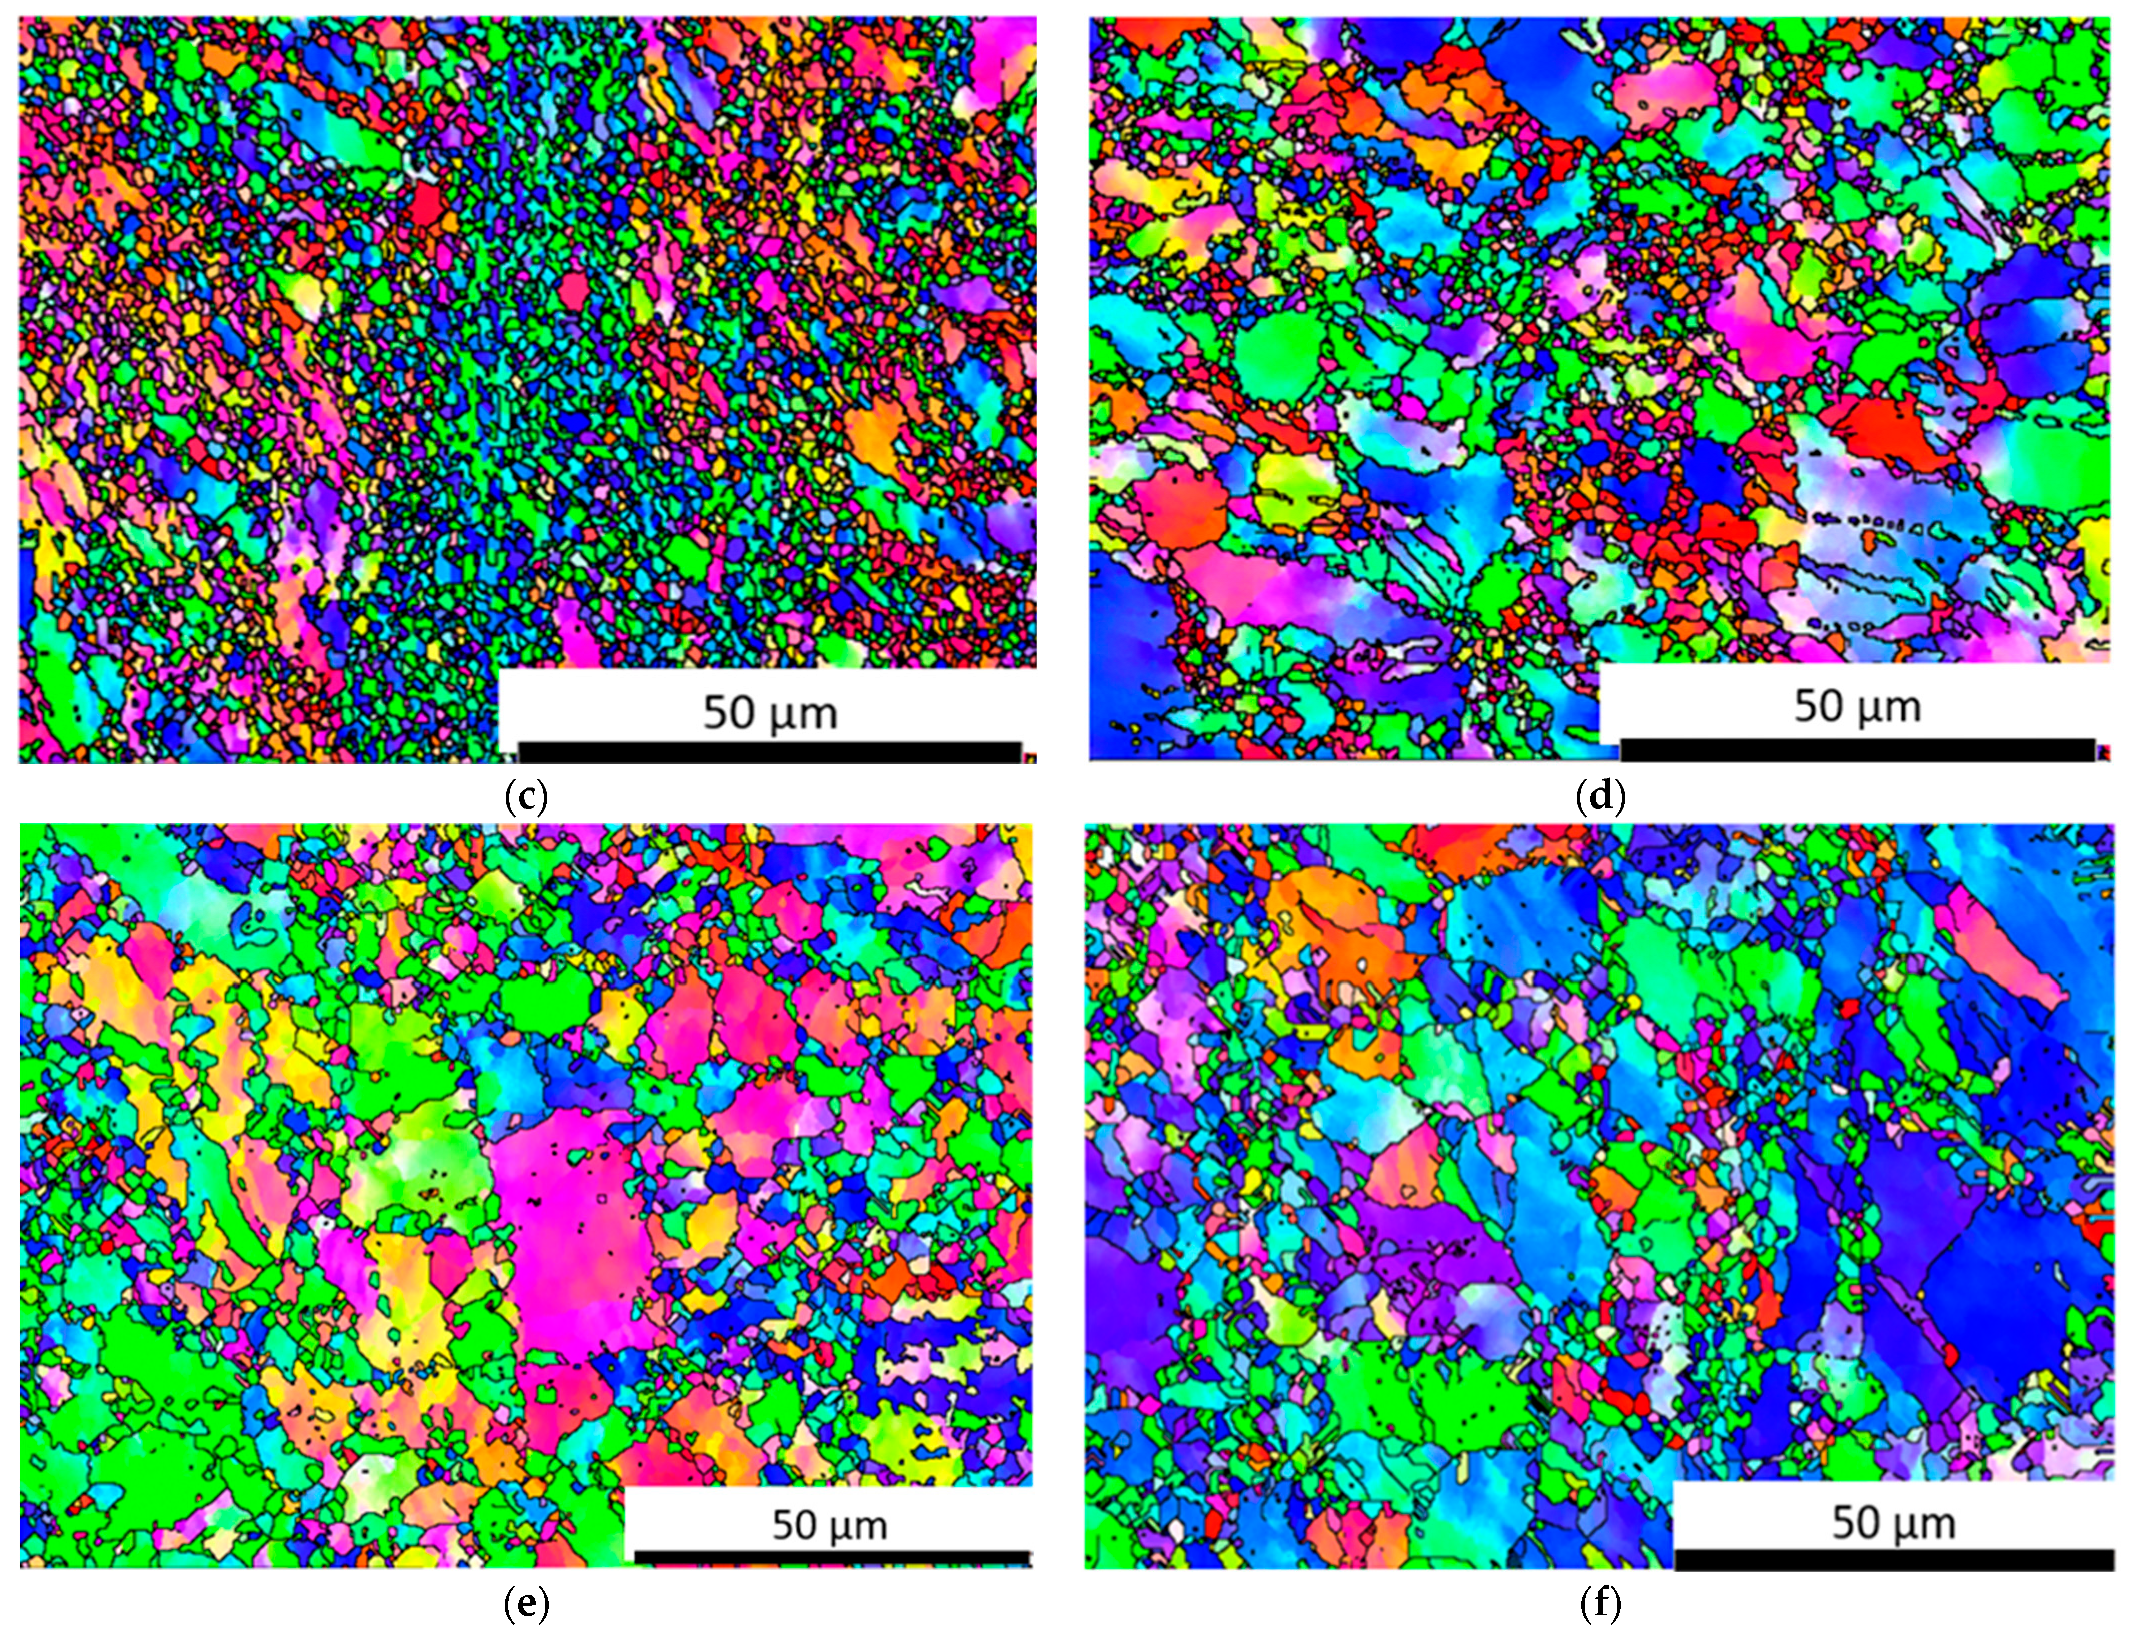
3.2.1. Microstructure Evolution

EBSD was used to look into the microstructure of grains and the textural associated crystallography of both of the ECAP specimens and AA counterparts of Mg in pure form. The inverse pole figure (IPF) orientation map relevant to the extrusion direction (ED) for the AA billets is displayed in Figure 2. A microstructural dominance of roughly equiaxed coarse grains was observed, with a few outliers that were abnormally big and a few regions of exceedingly fine grains. Even further, substructures were visible, notably within the extremely immense grains. The grains varied greatly, from 1.14 µm to 34 µm, with 6.34 µm being the mean. Information on grain size for ECAP specimens and their AA counterparts is depicted in Table 2.
Figure 3 displays the IPF orientation maps in relation to the ED or the ECAPed billets using both the 90°-die and 120°-die. These maps were created for Mg billets processed through 1P and four passes of route Bc (4Bc). The microstructure of pure Mg that was ECAP-processed for 1P was seen to show bimodality, with recently created fine and significantly deformed big grains, as shown in Figure 3a. A significant density of high-angle grain boundaries (HAGBs), also described as split into ultrafine grains, was discovered in regions of the Mg billets where a strain post-1P had led to the formation of dynamic recrystallization at local areas [50]. Since the AA microstructure is not homogeneous, the applied strain of 1P will have varying effects on the various microstructural properties. Hence, in some regions, this strain will be sufficient to initiate dynamic recrystallization and yield fine grains, whereas in other regions, it will not be sufficient. The bimodal microstructure produced following 1P, with grain sizes varying from 0.64 µm to 25.45 µm and averaging 1.96 µm, was consistent with such a condition. The EBSD orientation maps showed that 1P caused a decrease in the mean of grain size, from 6.3 µm for the BM to 1.96 µm (Table 2). Moreover, the HAGBs between 15 and 80 degrees appeared to be more randomly distributed. As the misorientation angle approached 90 degrees, a weakening of the twin boundaries became apparent as well. The literature also revealed consistent results in regards to microstructural evolution. Following 1P ECAP processing at room temperature, Lei and Zhang [45] noticed various grain sizes, with certain grains larger than the rest, with a size exceeding 50 µm and a mean of 4.15 µm. They claimed that the pure Mg microstructural obtained form was highly heterogeneous as a result of this observation. Different samples of pure Mg were ECAP-processed with 120° over a comparable number of passes to examine the impact of angle changing on the resulting microstructure and texture. By comparing the microstructures produced utilizing the 90° die angle (Figure 3a) and following 1P (Figure 3b), it could be seen that the latter had fewer fine grain regions, whereas the former had more AA with coarse grain regions. The reason for this could be explained by the fact that the 120° die angle caused far less strain on its first pass than the 90° die angle did. Grain sizes following 1P varied between 1.1 µm and 24.8 µm, averaging 2.62 µm.
After undergoing ECAP processing, the grain size resulting from 4Bc (through the 90°-die) was more refined, varying from 0.21 µm to 7.14 µm with a mean of 0.88 µm, as depicted in Figure 3c. Without the five separate slip systems necessary for homogenous plasticity, local shearing close to the grain boundaries led to the gradual lattice twists that refined the grains [49]. Equivalent results were obtained by Lei and Zhang [48] following the processing of pure Mg into four passes, which led to a mean particle size of 1.75 µm. Another research looked into 4 and 12 passes of ECAP processing on AZ91 Mg alloy, where they found that only four passes were sufficient to produce the desired homogeneous microstructure, which was distinguished by consistent and fine equiaxed grains having a mean grain size of 7 μm, which was explained thoroughly by Xu et al. [64]. For the 120o-die, increases in the regions with structural fine grains could be seen with augmenting the passes; at 4Bc, the microstructure consisted mainly of fine recrystallized equiaxed grains. Furthermore, the grain size following 4Bc resulted in a range extending from 0.81 µm to 6.5 µm, showing a mean value of 1.89 µm, as depicted in Figure 3d. The grain size of pure Mg processed using ECAP for multiple passes is often significantly reduced. According to studies [65], ECAP processing of Mg leads to continuous dynamic recovery and recrystallization (CDRR). It was discovered by Gautam and Biswas [66] that the ECAP could process pure Mg with as many as eight passes at varying temperatures. Refined grains with the necklace structure were reported to have formed as a consequence of the CDRR in all settings studied. Nevertheless, Wang et al. [67] looked at the effects of ECAP processing on Mg–Al–Ca–Mn alloys with a variety of Mg2Ca morphologies for as many as 12 passes, both as-cast and as-homogenized. Following four passes, they had a grain structure that was a combination of coarse and fine grains; following eight passes, it was more uniform; but then following 12 passes, it was completely uniform.
To investigate the effect of route type on the microstructural evolution of pure Mg, other samples of pure Mg were ECAP-processed with 120° and 90° die angles over two passes of different routes A, Bc, and C, as shown in Figure 4. After the AA sample was processed with a 90°-die for two passes, fine grains started occupying the microstructural area; however, there were still some big grains, though they had been badly distorted. Moreover, the remaining coarse grains maintained their symmetry and uniformity. Figure 4a demonstrates that as plastic strain increased with augmenting the passes, fine grain regions increased in the case of two passes, while the coarse ones decreased during processing through route A. Results showed that 2A led to a reduction in grain size of 73.3% relative to the AA equivalent, with the limit of grain sizes between 0.56 µm to 22.62 µm and a mean grain size of 1.69 µm. It can be seen in Figure 4b that, post-ECAP processing with 2Bc, the region of refined grains grew while the region of coarse grains shrank. Following two passes, the grain size varied from 4.41 µm to 9.29 µm, with a mean of 1.49 µm; this was mostly attributable to the rise throughout the induced strain. Grain sizes varied from 0.677 µm to 11.052 µm, with a mean grain size of 1.574 µm following 2C processing, suggesting that 2C decreased mean grain size by 75.1% relative to the AA equivalent, which is depicted in Figure 4c. Based on these results, it was evident that route Bc was superior to routes C and A for producing UFG-equiaxed grains, while route A produced grains that were far more extended. Figure 4 and Table 2 revealed that the mean size of the grain was smallest for the grains produced by route Bc, preceded by route C, and then route A using the 90°-die. For Mg billets processed through the 120°-die, as depicted clearly in Figure 4d, processing via 2A led to bimodality in the structure, with the UFG existing alongside prolonged coarse grains. In comparison to its AA equivalent, the grain size resulted from 2A was refined by 72.3%, varying from 0.68 µm up to 24.79 µm with a mean grain size of 1.75 µm. Furthermore, following 2Bc, nevertheless, the mean grain size was 1.89 µm, varying from 0.5 µm up to 22.73 µm, as depicted in Figure 4e. Strain buildup during the two passes showed a rise in the UFG regions, while diminishing the coarse grain regions, which is consistent with the results from the 90°-die. For instance, 2C processing led to a 69.4% refinement of the mean grain size of pure Mg relative to its AA equivalent, as displayed in Table 2.
The (0001) pole figures in AA condition and the ECAP-processed pure Mg with a 90°-die and 120°-die are depicted in Figure 5. Figure 5a reveals that the AA texture was a prominent {0001} <uvtw> fiber texture, with the intense {0001} poles oriented in alignment inclined in relation to the ED. Crystallographically, ECAP processing resulted mostly in the simple shear texture, with the shear plane in alignment at 45 degrees with respect to the ED. When plastically deforming hcp metals, the optimal simple shear texture relied heavily on the presence of active slip systems; unlike fcc and bcc crystal structures, hcp crystals only had a restricted amount of slip systems, including basal {0001}<11–20>, prismatic {10-10}<11–20>, or pyramidal {10–11}<11–20> slip [65,68,69].
Figure 5b shows that following a single pass of ECAP through the 90°-die, the texture had been twisted nearly 45 degrees about the ED. This is important because it reflected the impact of the initial ECAP pass, which activated the basal slip. As a result of applying 1P, the texture intensity of AA dropped from a maximum of 24.26 to around 9.59 times random, as depicted in Figure 5b. In the initial pass through shear deformation, there were fewer active slip systems, which clearly weakened the texture [64]. A quite robust texture was developed following 1P using the 120°-die at roughly 23.22 times random, whereas the texture constituents were substantially twisted about the ED. As a result, the 0001-pole viewgraph revealed its presence at an angle in relation to the ED, as evidenced by the presence of robust 0001 poles. The 120° die angle strongly suggested that the texture was a B fiber with its constituents substantially twisted from their optimum placements [64].
Increasing the number of passes to two passes resulted in much weaker crystallographic texture for all the processing routes, as shown in Figure 5. The 2A processing displayed double poles; the first was aligned parallel to the ED and the second was twist about 10° relative to the ED with texture intensity of 9.59 times random (Figure 5d), while 2A processing using the 120°-die showed a texture intensity of 7.19 times random (Figure 5e). As observed in Figure 5f, the texture achieved by 2Bc through the ECAP die with 90° was very similar to the regular B fiber texture [64], with its constituents nearly in their optimal position. Because of the shift in the shear plane’s position during the second pass, the shear plane normal (SPN) became aligned with the TD. With regard to the intensity of the texture, it is nearly identical to that following 1P counterpart but with approximately 10.35 times random. Similarly, the texture began to weaken and break apart after 2Bc via the 120°-die, as evidenced by the 0001-pole viewgraph (Figure 5g), whereas a larger number of slip systems became active after the second pass with ECAP, which explained this phenomenon. The 2Bc displayed a texture intensity of 11.66 times random, as depicted in Figure 5g. Furthermore, 2C through the 90°-die experienced the weakest texture with a maximum texture intensity of 5.80 times random, as shown in Figure 5h. On the other hand, 2C processing through the 120°-die displayed much higher texture intensity (14.68 times random) compared to its 2A and 2Bc counterparts, as shown in Figure 5i.
Bringing the total count of ECAP passes up to 4Bc using the 90°-die produced a highly robust texture that was greater than 26.21 times random, and the intense {0001} poles were in alignment in the midpoint of the distance from the transverse direction (TD) to the ED, as shown in Figure 5j. This robust fiber texture that had been seen following 4Bc might be related to the grain refinement that took place following 1P and 2Bc, which enabled activating additional slip systems after 4Bc [70]. However, the ECAP processing for 4Bc through the 120°-die had oriented the intense 0001 poles so that they were perpendicular to the ED and aligned with the TD (Figure 5k).
The texture crystallography of pure Mg that underwent ECAP was studied by Gautam and Biswas [71]. They used a maximum of 8P at various temperatures and employed route A, which utilized a 90° angle for its die. According to their findings, after one pass, the strong basal poles revolved 130 degrees about the TD axis to achieve the optimal location for the B fiber, accordingly raising the temperature and the passes until eight failed to substantially alter the texture beyond a minor fluctuation in its intensity. They concluded that this was because the slip deformation mechanism predominated.
Checking the pole figures (0001) confirmed that except for 4Bc through the 90°-die and 1P through the 120°-die, all treated texture components were weaker and less intense than in the AA condition (Figure 5). One possible interpretation of this weakening is that the slip mechanism had been activated. In fact, shearing pressures perpendicular to the basal planes [64] accounted for the twisting of the basal plane that occurred throughout ECAP processing. Furthermore, investigations of pure Mg [50,72], AZ31B Mg alloy [73], ZK30 alloy [42,69], and AZ31 alloy [74] all agreed precisely with the crystallographic texture observations of pure Mg.
Linear regression (LR), Gaussian process regression (GPR), and support vector regression (SVR) were adopted as ML approaches to describe the ECAP associated variables of Mg alloy. The model evaluation results are depicted in Figure 6a,b along with Table 3. The predicted grain size values in both the training and testing datasets closely matched the outcomes obtained from experiments, as depicted in Figure 6a,b. As depicted in Table 3, the effectiveness of the model was examined utilizing the RMSE and R2 score after training and testing. The three ML approaches, including LR, GPR, and SVR, performed well in predicting the grain size with considerable accuracy, as reflected in R2 scores ranging from 0.98 to 0.99 for the training dataset and from 0.85 to 0.88 for the testing dataset. Here, the GPR approach was selected to model the gain size properties as it provided the most optimal performance for both the training and testing phases.

3.2.2. Vicker’s Microhardness

Table A1 (Appendix A) depicts the relationship between various passes and the hardness fluctuation of Mg billets processed with dies having ϕ = 90° and 120°, where the AA-Mg measured a mean hardness of 26 HV on the Vickers scale; additionally, augmenting the number of passes substantially ameliorated the hardness of AA-Mg throughout. As contrasted to the AA equivalents, the HV improved by a whopping 84% during 1P processing with the 90°-die. Alternatively, when comparing the 1P case of the 90°-die to that of the 120°-die, a rise in HV of 14% was found for the Mg-billets processed through the 90°-die. Accordingly, the increase of the HV values of the Mg-billets that were processed through the 90°-die compared to the counterparts that were processed through the 120°-die can be attributed to the increase in the imposed strain when using the 90°-die compared to the 120°-die. The higher plastic strain resulted in more grains refinement, as indicated in Figure 3, which led to higher improvement in the HV values. Furthermore, as opposed to its 1P counterpart, the HV was enhanced by 6.25% after being processed via 2Bc utilizing a 90°-die. The 120°-die in the 2Bc case displayed an identical pattern. HV values for 2A and 2C processed via the 90°-die were both found to be significantly higher than their AA counterparts, by 76.9% and 84.6%, respectively. In addition, when comparing 2A and 2C samples processed through the 120°-die to those of the 90°-die, it was found that the HV outcomes were augmented by 9.5% and 9%, respectively.
When adopting a 90°-die to accumulate the plastic strain up to 4Bc, the subsequent HV was indeed 111% higher than that of the AA equivalent. Furthermore, the HV values for the 4Bc case of the 90°-die were 7.8% higher than those of the 120°-die, which might be explained by the refined grains produced; Table A1 (Appendix A) shows that the mean grain size produced by the 90°-die was 0.88 μm and that produced by the 120°-die was 1.89 μm at the 4Bc. The strain hardening that occurred during ECAP processing also contributed to the rise in HV values that was observed as the passes increased. The HV results were then compared to the changes in microstructure shown in Figure 3 and Figure 4. It was the underlying grain refinement that led to the dramatic increase in HV values, with route Bc having the smallest grains. Since the plastic strain placed on the samples is smaller at larger angles, the reduction in hardness when raising ϕ made sense. Similar findings were reported in previous studies. Alateyah et al. [25] reported that ECAP processing for AZ31 resulted in improving the HV values by 132% compared to the AA counterpart. Processing of ZK 30 alloy through four passes of route Bc through a die with internal channel angle of 90° and 120° experienced a significant improvement in the HV values by 80.8% and 86.5%, respectively [42,69]. From the Vicker’s microhardness findings, it can be concluded that ECAP processing of Mg and its alloys exhibited a notable improvement in the HV values, which can be attributed to the significant grain refinement.
LR, SVR, and GPR were employed to simulate and examine the microhardness parameters of the Mg alloy. As per Figure 7 and Table 4, the predicted values for both the training and testing sets of microhardness closely matched the outcomes obtained from experiments. The reported findings were acquired by employing the optimization techniques of the SVM and GPR modeling to meet the needs of reaching modeling with proven reliability that must achieve respectable ratings on both sets of data for training and testing. The best-fit models for the training dataset exhibited R2 values between 0.88 and 0.99, whereas the scores for the testing dataset were between 0.71 and 0.84. This demonstrated that the LR approach successfully captured the data trend, achieving considerable accuracy for both the training and testing datasets.

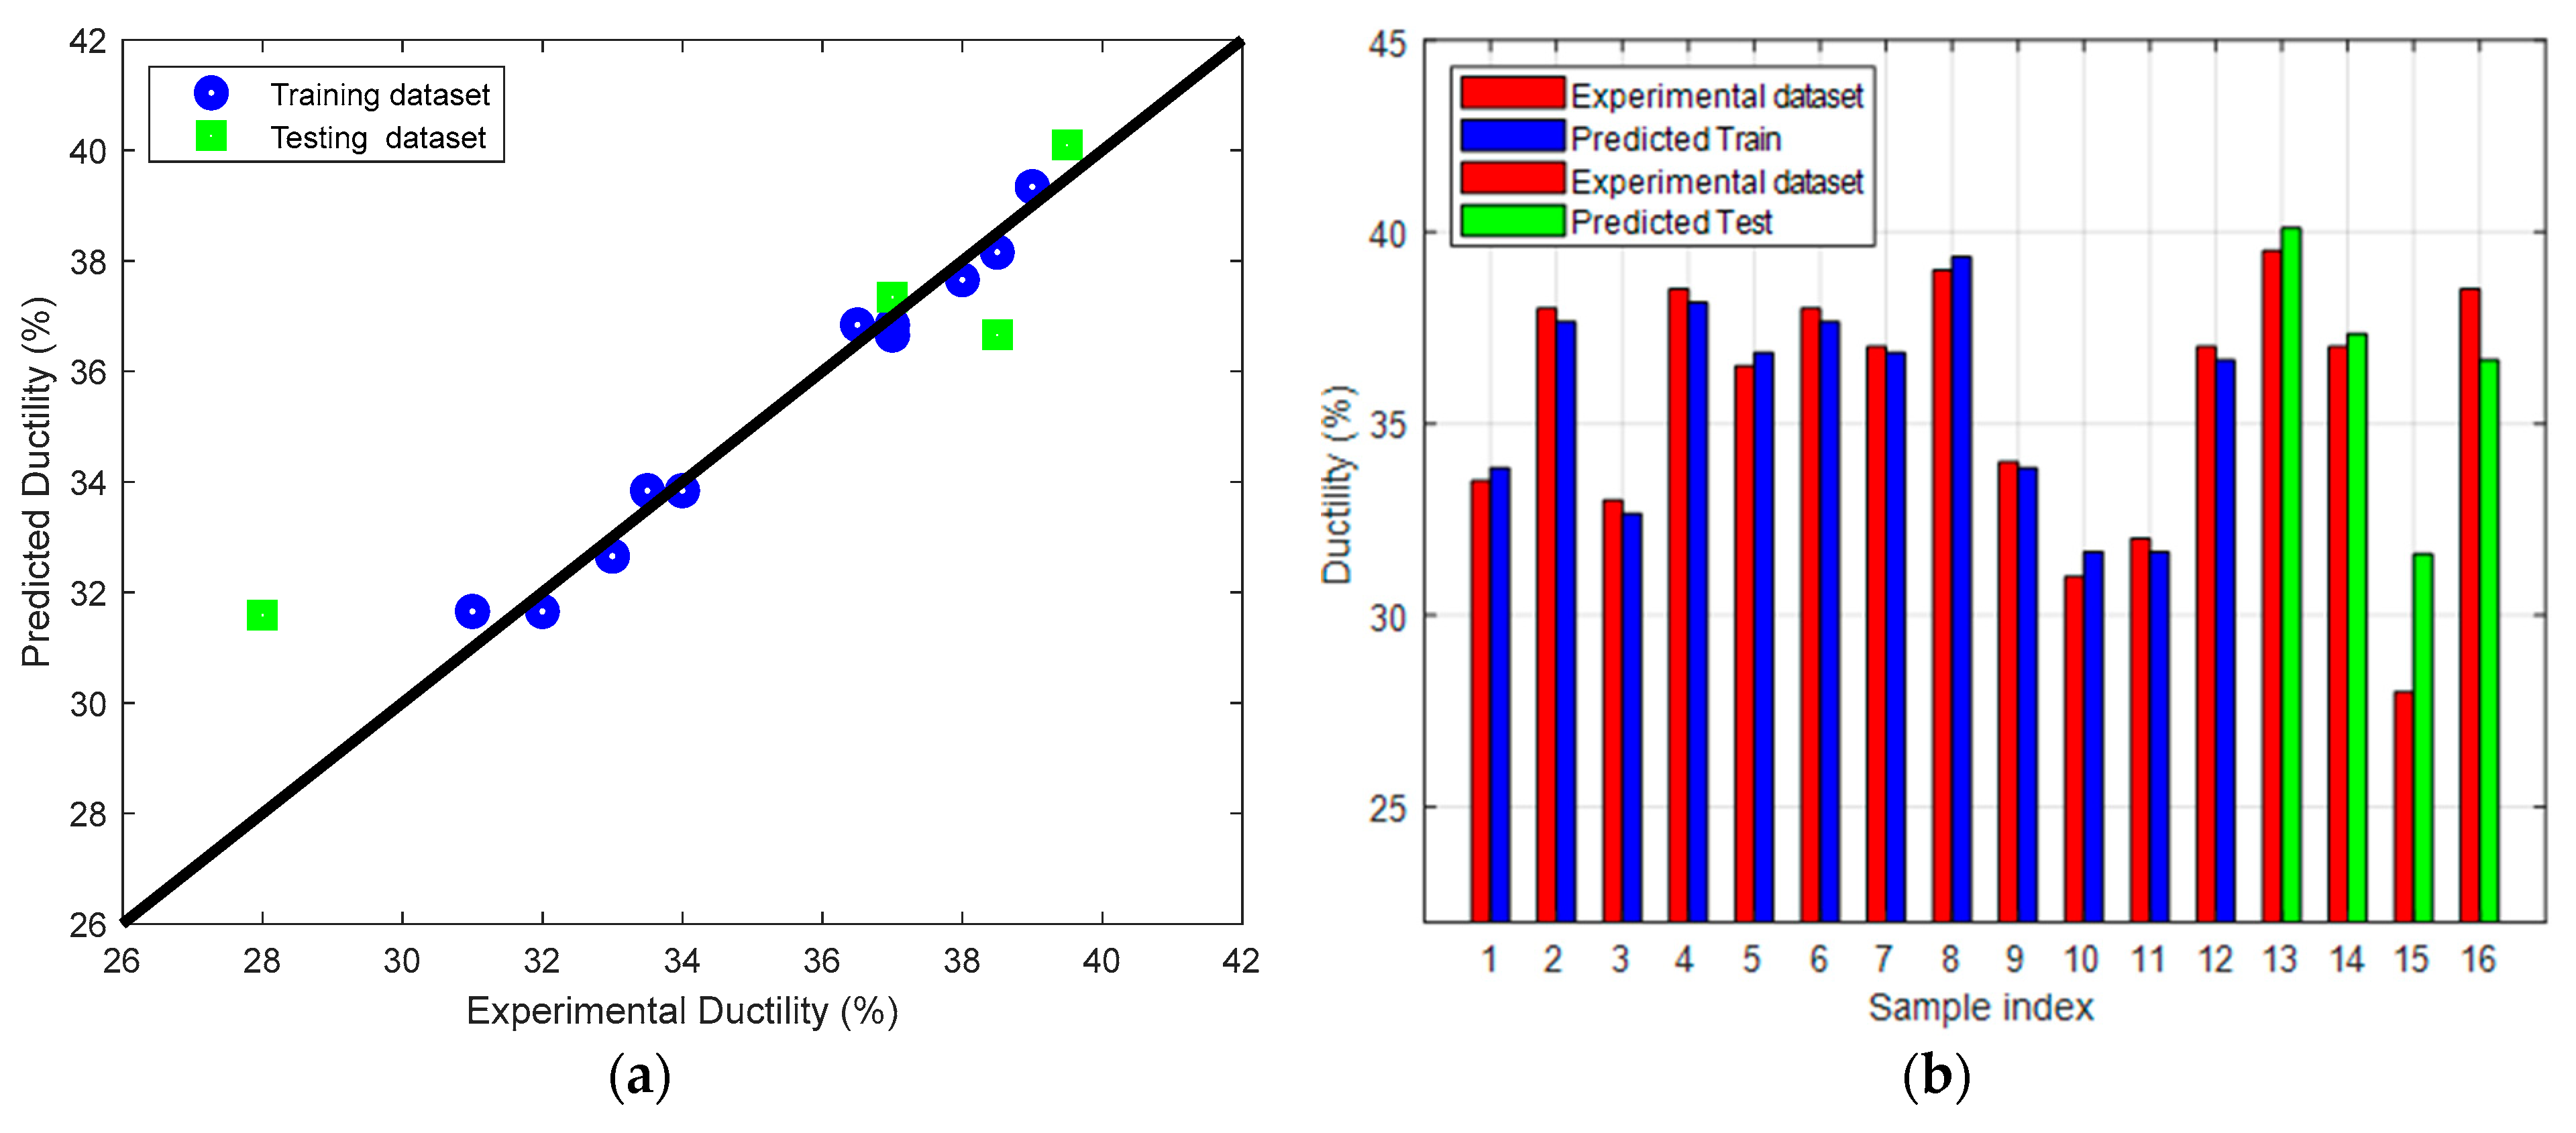
3.2.3. Tensile Properties

Tensile tests were conducted on Mg specimens in the form of billets prior to and following ECAP processing. The tensile findings, such as σu and Mg percent elongation at fracture or ductility (Du), are tabulated in Table A1 (Appendix A). Grain size was substantially minimized as ECAP passes were increased, as shown in Figure 3, Figure 4 and Figure 5. As a result, given that the grain decrease in size is unrelated to the increase in σu, there are further variables impacting it. One of them is the crystallographic texture, which has an essential function in reinforcing Mg billets because of the substantial texture anisotropy (as illustrated in Figure 5) of Mg slip systems with hcp crystal structure. Moreover, Mg billet characteristics may be altered through the initiation of non-basal slip methods [48], where analogous results were published previously in [75]. The AA billets experienced σu and Du of 235 MPa and 0.23. From Table A1 it is revealed that 1P through the 90°-die experienced a substantial increase in σu and Du, from 32% and 67%, respectively. Upping the strain to 2Bc (using the 90°-die) only marginally increased the σu by 7% while decreasing the Du by 3% in comparison to the 1P. When contrasted with its AA equivalent, ECAP-processed via a 90°-die for two passes through route A, Bc, and C showed increases in σu of 14.1%, 38.4%, and 43.75%, respectively, and increases in Mg ductility of 80.9%, 73.5%, and 47.6%, respectively. When the ECAP was raised to 4Bc, it was found that the σu increased by 10% and the Du decreased by 20% relative to the 2Bc equivalent.
Alternatively, 1P at ϕ = 120° displayed a notable boost in σu of 17% and Du of 47%. Taking ECAP passes all the way to 2Bc showed that the σu was augmented by 5%, while the Du was augmented by 12%, both compared favorably to their 1P equivalents. While the Du was lowered by 5.26%, 1.35%, and 18.4% in the 90°-die of the 2A, 2Bc, and 2C samples, respectively, the 120°-die showed a 6.1%, 13.14%, and 23.8% enhancement in σu. As a consequence of the lowered strain implemented, the samples from the 120°-die steadily seemed to have significantly greater ductility than their 90°-die counterparts among all routes. Additional enhancements of 10% in σu and 5% in Du were discovered when employing 4Bc. In both the 90° and 120°-dies, the increase in σu is ascribable to the formation ultrafine grains that result from the processing step. The outcomes of tensile testing agreed with the refinement of the grain size as a function of number of ECAP passes (Figure 3, Figure 4 and Figure 5). The buildup of strain is responsible for the rise in σu, which is in turn attributable to the noticeable rise in texture intensity as the number of ECAP passes increased. Additionally, the production of UFG materials was also clearly impacted by an increase in HAGBs in the ECAP process [28,50]. Hughes’ theoretical model [76] provided an explanation, noting that strain caused dislocations to move. Dislocations were irreversibly consumed by LABs as strain increased; as a result, low-angle grain boundaries (LAGBs) were slowly changed into steady HAGBs, and the grains were refined as a consequence of the creation of HAGBs. Consequently, the increased strength might have been traced back to the finer grain size. However, the high dislocation density produced by ECAP processing reduced the dislocation mobility [77], which in turn raised the hardness outcomes and the tensile strength results of the processed ECAP Mg billets. Substantial refining of grains (as depicted in Figure 3 and Figure 4) also resulted in a mechanism of strengthening for the grain boundary, which enhanced the Mg billets’ mechanical properties, as corroborated by [78]. Consequently, σu was found to be greater for ECAP Mg billets with ϕ = 90° than for those with ϕ = 120° as a result of the smaller grains obtained from the former.
The reduced grain size caused an augmentation in grain boundary area per unit volume, which in turn strengthened the material and caused a minimization of ductility, as clearly shown at ϕ = 90° with the number of passes augmentation, where earlier studies [75] revealed identical trends. However, the 120°-die showed more ductility than the 90°-die, which can be explained by the decreased strain observed while utilizing the 120°-die, particularly in comparison to the 90°-die. Thereby, the 120°-die revealed bimodal and dynamic recrystallization grains (DRX) in the bulk materials, which helped increase ductility [79]. According to studies [80,81], fine grains with a size of less than 5 µm kept their elevated strength, whereas coarser grains with a size of roughly 20 µm offered strain hardening to sustain the transformation to enormous strains. Thus, the ductility of Mg specimens obtained from ECAP was enhanced by the specific textures that prefer grain sizes in the region of 10–20 µm and basal slip, as found in [75]. Moreover, the bimodal grain structure may account for the reduced difficulty of moments of dislocation seen in ECAP billets relative to those in the AA condition [79]. Similar findings of improving the tensile properties due to a significant grain refinement were reported in [82].
Figure 8 and Figure 9 show the results of ML modeling σu and Du of the Mg alloy. The results revealed a significant relationship between the predicted and experimentally-driven datasets. The RMSE and R2 scores depicted in Table 5 revealed that the majority of the selected methods performed satisfactorily with data training and testing. It is worth noting that SVR and GPR performed the best for obtaining a model representing the process variables, which were assessed using both the RMSE and R2 score. The LR was not able to model the data trends, whereas both the SVR and GPR successfully did, which was due to their inherent advantages when dealing with nonlinear models. For these models, the R2 score range was between 0.79 and 0.99 for the training dataset and 0.72 and 0.92 for the testing dataset.

4. Conclusions

Commercial pure Mg specimens were processed through ECAP via single pass, two passes, and four passes, along with a variety of routes (A, Bc, and C). The exterior angle (Ψ) of the split ECAP die was 20°, and both of the adopted ECAP dies had inner channel angles (ϕ) of 90° and 120°. ML techniques were adopted to estimate the ECAP variables and verify the experimental findings of microstructural evolution, tensile properties, and Vicker’s microhardness of ECAP specimens and their AA counterparts. The following conclusions were drawn:
  • Route Bc is the most effective route in grain refinement.
  • The ECAP die with channel angle of 90° resulted in higher plastic strain; hence, it is more efficient than the 120°-die in grain refinement.
  • Processing through 4Bc resulted in significant grain refinement of 86% compared to the AA condition.
  • The 4Bc using the 90°-die produced the most robust texture, which was greater than 26 times random.
  • The grain size demonstrated a strong correlation of −0.67 with rising number of passes, while ϕ affected the grain size strongly (with 0.83), whereas the route type had the lowest effect on the grain size.
  • When adopting a 90°-die to accumulate the plastic strain up to 4Bc, the subsequent HV was indeed 111% higher than that of the AA equivalent.
  • From ML findings, it was clear that the number of passes was the most significant parameter affecting the Mg HV values, whereas ECAP channel angle (ϕ) revealed high correlation factor with HV values as well.
  • The 4Bc with ϕ = 90° and 120° led to a significant increase of σu by 44.7%% and 35.7%, respectively, compared to the AA counterpart, which can be explained by the significant refinement in the grain size.
  • σu was affected by the rising number of passes with a strong correlation of 0.81, as revealed in the correlation chart, while affecting ductility moderately with 0.47.
  • The route type weakly affected all four responses of hardness, σu, Du, and grain size.

Author Contributions

Conceptualization, W.H.E.-G., A.I.A. and M.S.; methodology, W.H.E.-G., M.O.A. and A.B.; software, M.S., M.F.A. and F.N.A.; validation, A.I.A., M.S. and M.K.; formal analysis, M.F.A. and F.N.A.; investigation, W.H.E.-G., M.O.A. and A.B.; resources, A.I.A., M.F.A. and M.O.A.; data curation, M.S. and M.K.; writing—original draft preparation, M.K. and M.S.; writing—review and editing, W.H.E.-G. and A.I.A.; visualization, A.B.; supervision, M.O.A.; project administration, W.H.E.-G., A.I.A. and M.F.A.; funding acquisition, A.B. All authors have read and agreed to the published version of the manuscript.

Funding

The Princess Nourah bint Abdulrahman University Researchers Supporting Project number PNURSP2023R230, Princess Nourah bint Abdulrahman University, Riyadh, Saudi Arabia.

Institutional Review Board Statement

Not applicable.

Informed Consent Statement

Not applicable.

Data Availability Statement

All the raw data supporting the conclusion of this paper were provided by the authors.

Acknowledgments

The authors acknowledge the Princess Nourah bint Abdulrahman University Researchers Supporting Project number (PNURSP2023R230), Princess Nourah bint Abdulrahman University, Riyadh, Saudi Arabia, for funding the publication of this project.

Conflicts of Interest

The authors declare no conflict of interest.

Appendix A

Table A1. Experimental design of independent input ECAP process parameters along with their response outcomes.
RunECAP ParametersResponse
ABCGrain Size
GR (μm)
Hardness
(HV)
Tensile Strength
NφRoute Typeσu
(MPa)
Du
(%)
11120A2.624227833.5
22120A2.3346.628238
3490C1.2251.232733
42120C2.4645.628038.5
5290Bc1.385132036.5
62120A2.384629038
7290Bc1.435131837
84120Bc1.895131939
94120C1.9950.231539.5
102120Bc2.144738837
111120A2.5443.227534
12490Bc0.885534028
13190A1.954830838.5
14490A0.9852.533031
15490A1.0252.832832
16190A1.864631137

References

  1. Witte, F. The history of biodegradable magnesium implants: A review. Acta Biomater. 2010, 6, 1680–1692. [Google Scholar] [CrossRef]
  2. Amani, S.; Faraji, G. Recrystallization and mechanical properties of WE43 magnesium alloy processed via cyclic expansion extrusion. Int. J. Miner. Metall. Mater. 2018, 25, 672–681. [Google Scholar] [CrossRef]
  3. Mostaed, E.; Vedani, M.; Hashempour, M.; Bestetti, M. Influence of ECAP process on mechanical and corrosion properties of pure Mg and ZK60 magnesium alloy for biodegradable stent applications. Biomatter 2014, 4, e28283. [Google Scholar] [CrossRef]
  4. Mordike, B.L.; Ebert, T. Magnesium: Properties—Applications—Potential. Mater. Sci. Eng. A 2001, 302, 37–45. [Google Scholar] [CrossRef]
  5. Kainer, K.U.; Mordike, B.L. Magnesium Alloys and Their Applications; Wiley: New York, NJ, USA, 2000. [Google Scholar]
  6. Shapiro, A.E. Magnesium and Magnesium Alloys; ASM International: Almere, The Netherlands, 1999; p. 2. [Google Scholar]
  7. Gupta, M.; Ling, S.N. Magnesium, Magnesium Alloys, and Magnesium Composites; John Wiley & Sons, Ltd.: Hoboken, NJ, USA, 2011; pp. 39–85. [Google Scholar] [CrossRef]
  8. Kuwahara, H.; Al-Abdullat, Y.; Ohta, M.; Tsutsumi, S.; Ikeuchi, K.; Mazaki, N.; Aizawa, T. Surface Reaction of Magnesium in Hank’s Solutions. Mater. Sci. Forum 2000, 350–351, 349–358. [Google Scholar] [CrossRef]
  9. Kojima, Y. Platform Science and Technology for Advanced Magnesium Alloys. Mater. Sci. Forum 2000, 350–351, 3–18. [Google Scholar] [CrossRef]
  10. Kim, J.J.; Han, D.S. Recent Development and Applications of Magnesium Alloys in the Hyundai and Kia Motors Corporation. Mater. Trans. 2008, 49, 894–897. [Google Scholar] [CrossRef]
  11. Agnew, S.R.; Duygulu, Ö. Plastic anisotropy and the role of non-basal slip in magnesium alloy AZ31B. Int. J. Plast. 2005, 21, 1161–1193. [Google Scholar] [CrossRef]
  12. Abdel-Aziem, W.; Hamada, A.; Makino, T.; Hassan, M.A. Microstructure Evolution of AA1070 Aluminum Alloy Processed by Micro/Meso-Scale Equal Channel Angular Pressing. Met. Mater. Int. 2021, 27, 1756–1768. [Google Scholar] [CrossRef]
  13. Agnew, S.R. Deformation mechanisms of magnesium alloys. In Advances in Wrought Magnesium Alloys; Bettles, C., Barnett, M., Eds.; Woodhead Publishing: Sawston, UK, 2012; pp. 63–104. [Google Scholar] [CrossRef]
  14. Chulist, R.; Czaja, P.; Tokarski, T.; Kuksgauzen, I.; Chumlyakov, Y. Orthogonal shear process in Ni-Mn-Sn single crystal. Int. J. Plast. 2019, 114, 63–71. [Google Scholar] [CrossRef]
  15. Sułkowski, B.; Chulist, R. Twin-induced stability and mechanical properties of pure magnesium. Mater. Sci. Eng. A 2019, 749, 89–95. [Google Scholar] [CrossRef]
  16. Hadadzadeh, A.; Wells, M.A. Analysis of the hot deformation of ZK60 magnesium alloy. J. Magnes. Alloys 2017, 5, 369–387. [Google Scholar] [CrossRef]
  17. Rao, K.P.; Prasad, Y.V.R.K.; Dzwończyk, J.; Hort, N.; Kainer, K.U. Hot Deformation Mechanisms in AZ31 Magnesium Alloy Extruded at Different Temperatures: Impact of Texture. Metals 2012, 2, 292–312. [Google Scholar] [CrossRef]
  18. Al-Samman, T.; Molodov, K.D.; Molodov, D.A.; Gottstein, G.; Suwas, S. Softening and dynamic recrystallization in magnesium single crystals during c-axis compression. Acta Mater. 2012, 60, 537–545. [Google Scholar] [CrossRef]
  19. Wang, H.; Yu, Z.; Zhang, L.; Liu, C.; Zha, M.; Wang, C.; Jiang, Q. Achieving high strength and high ductility in magnesium alloy using hard-plate rolling (HPR) process. Sci. Rep. 2015, 5, 17100. [Google Scholar] [CrossRef]
  20. Xu, W.; Birbilis, N.; Sha, G.; Wang, Y.; Daniels, J.E.; Xiao, Y.; Ferry, M. A high-specific-strength and corrosion-resistant magnesium alloy. Nat. Mater. 2015, 14, 1229–1235. [Google Scholar] [CrossRef]
  21. Alateyah, A.I.; Aljohani, T.A.; Alawad, M.O.; Elkatatny, S.; El-Garaihy, W.H. Improving the Corrosion Behavior of Biodegradable AM60 Alloy through Plasma Electrolytic Oxidation. Metals 2021, 11, 953. [Google Scholar] [CrossRef]
  22. El-Garaihy, W.; El Rassoul, E.-S.A.; Al Ateyah, A.; Alaskari, A.M.; Oraby, S. Data Manipulation Approach and Parameters Interrelationships of the High-Pressure Torsion for AA6061-15%SiCp Composite. SAE Int. J. Mater. Manuf. 2018, 11, 167–182. [Google Scholar] [CrossRef]
  23. El-Garaihy, W.; Rassoul, E.S.M.; Salem, H.G. Consolidation of High Performance AA6061 and AA6061-SiCp Composite Processed by High Pressure Torsion. Mater. Sci. Forum 2014, 783–786, 2623–2628. [Google Scholar] [CrossRef]
  24. Salem, H.G.; El-Garaihy, W.H.; Rassoul, E.-S.M.A. Influence of High-Pressure Torsion on the Consolidation Behavior and Mechanical Properties of AA6061-SiCp Composite Powders, in Supplemental Proceedings; John Wiley & Sons, Ltd.: Hoboken, NJ, USA, 2012; pp. 553–560. [Google Scholar] [CrossRef]
  25. Alateyah, A.I.; Aljohani, T.A.; Alawad, M.O.; El-Hafez, H.A.; Almutairi, A.N.; Alharbi, E.S.; Alhamada, R.; El-Garaihy, B.W.; El-Garaihy, W.H. Improved Corrosion Behavior of AZ31 Alloy through ECAP Processing. Metals 2021, 11, 363. [Google Scholar] [CrossRef]
  26. Alateyah, A.I.; Ahmed, M.M.Z.; Zedan, Y.; El-Hafez, H.A.; Alawad, M.O.; El-Garaihy, W.H. Experimental and Numerical Investigation of the ECAP Processed Copper: Microstructural Evolution, Crystallographic Texture and Hardness Homogeneity. Metals 2021, 11, 607. [Google Scholar] [CrossRef]
  27. El-Shenawy, M.; Ahmed, M.M.Z.; Nassef, A.; El-Hadek, M.; Alzahrani, B.; Zedan, Y.; El-Garaihy, W.H. Effect of ECAP on the Plastic Strain Homogeneity, Microstructural Evolution, Crystallographic Texture and Mechanical Properties of AA2xxx Aluminum Alloy. Metals 2021, 11, 938. [Google Scholar] [CrossRef]
  28. Alateyah, A.I.; El-Garaihy, W.H.; Alawad, M.O.; Sanabary, S.E.; Elkatatny, S.; Dahish, H.A.; Kouta, H. The Effect of ECAP Processing Conditions on Microstructural Evolution and Mechanical Properties of Pure Magnesium—Experimental, Mathematical Empirical and Response Surface Approach. Materials 2022, 15, 5312. [Google Scholar] [CrossRef] [PubMed]
  29. Alawad, M.O.; Alateyah, A.I.; El-Garaihy, W.H.; BaQais, A.; Elkatatny, S.; Kouta, H.; Kamel, M.; El-Sanabary, S. Optimizing the ECAP Parameters of Biodegradable Mg-Zn-Zr Alloy Based on Experimental, Mathematical Empirical, and Response Surface Methodology. Materials 2022, 15, 7719. [Google Scholar] [CrossRef]
  30. She, J.; Peng, P.; Tang, A.T.; Zhang, J.Y.; Mao, J.J.; Liu, T.T.; Zhou, S.B.; Wang, Y.; Pan, F.S. Novel on-line twist extrusion process for bulk magnesium alloys. Mater. Des. 2019, 182, 108011. [Google Scholar] [CrossRef]
  31. El-Garaihy, W.H.; Fouad, D.M.; Salem, H.G. Multi-channel Spiral Twist Extrusion (MCSTE): A Novel Severe Plastic Deformation Technique for Grain Refinement. Met. Mater. Trans. A 2018, 49, 2854–2864. [Google Scholar] [CrossRef]
  32. Fouad, D.; Moataz, A.; El-Garaihy, W.; Salem, H. Numerical and experimental analysis of multi-channel spiral twist extrusion processing of AA5083. Mater. Sci. Eng. A 2019, 764, 138216. [Google Scholar] [CrossRef]
  33. Fouad, D.M.; El-Garaihy, W.H.; Ahmed, M.M.Z.; Seleman, M.E.-S.; Salem, H.G. Influence of multi-channel spiral twist extrusion (MCSTE) processing on structural evolution, crystallographic texture and mechanical properties of AA1100. Mater. Sci. Eng. A 2018, 737, 166–175. [Google Scholar] [CrossRef]
  34. Ghazanlou, S.I.; Eghbali, B.; Petrov, R. Microstructural evolution and strengthening mechanisms in Al7075/graphene nano-plates/ carbon nano-tubes composite processed through accumulative roll bonding. Mater. Sci. Eng. A 2021, 807, 140877. [Google Scholar] [CrossRef]
  35. Pater, Z.; Tomczak, J.; Bulzak, T. Problems of forming stepped axles and shafts in a 3-roller skew rolling mill. J. Mater. Res. Technol. 2020, 9, 10434–10446. [Google Scholar] [CrossRef]
  36. Wang, L.-P.; Chen, T.; Jiang, W.-Y.; Feng, Y.-C.; Cao, G.-J.; Zhu, Y. Microstructure and mechanical properties of AM60B magnesium alloy prepared by cyclic extrusion compression. Trans. Non. Ferr. Met. Soc. China 2013, 23, 3200–3205. [Google Scholar] [CrossRef]
  37. Chen, X.; Li, L.; Chen, W.; Zhang, W.; Zhang, L.; Qiao, Y.; Wang, E. Fine-grained structure and recrystallization at ambient temperature for pure magnesium subjected to large cold plastic deformation. Mater. Sci. Eng. A 2017, 708, 351–359. [Google Scholar] [CrossRef]
  38. Alawadhi, M.Y.; Sabbaghianrad, S.; Huang, Y.; Langdon, T.G. Evaluating the paradox of strength and ductility in ultrafine-grained oxygen-free copper processed by ECAP at room temperature. Mater. Sci. Eng. A 2020, 802, 140546. [Google Scholar] [CrossRef]
  39. Iwahashi, Y.; Wang, J.T.; Horita, Z.; Nemoto, M.; Langdon, T.G. Principle of equal-channel angular pressing for the processing of ultrafine-grained materials. Scr. Mater. 1996, 35, 143–146. [Google Scholar] [CrossRef]
  40. Shaban, M.; Alateyah, A.I.; Alsharekh, M.F.; Alawad, M.O.; BaQais, A.; Kamel, M.; Alsunaydih, F.N.; El-Garaihy, W.H.; Salem, H.G. Influence of ECAP Parameters on the Structural, Electrochemical and Mechanical Behavior of ZK30: A Combination of Experimental and Machine Learning Approaches. J. Manuf. Mater. Process. 2023, 7, 52. [Google Scholar] [CrossRef]
  41. Alateyah, A.I.; El-Shenawy, M.; Nassef, A.; El-Hadek, M.; Ahmed, M.M.Z.; Kouta, K.; El Sanabary, S.; El-Garaihy, W.H. Op-timizing the ECAP processing parameters of pure Cu through experimental, finite element, and response surface approaches. Rev. Adv. Mater. Sci. 2023, 62, 20220297. [Google Scholar] [CrossRef]
  42. Alateyah, A.I.; Alawad, M.O.; Aljohani, T.A.; El-Garaihy, W.H. Effect of ECAP Route Type on the Microstructural Evolution, Crystallographic Texture, Electrochemical Behavior and Mechanical Properties of ZK30 Biodegradable Magnesium Alloy. Materials 2022, 15, 6088. [Google Scholar] [CrossRef]
  43. Valiev, R.Z.; Langdon, T.G. Principles of equal-channel angular pressing as a processing tool for grain refinement. Prog. Mater. Sci. 2006, 51, 881–981. [Google Scholar] [CrossRef]
  44. Shaban, M.; Alsharekh, M.F.; Alsunaydih, F.N.; Alateyah, A.I.; Alawad, M.O.; BaQais, A.; Kamel, M.; Nassef, A.; El-Hadek, M.A.; El-Garaihy, W.H. Investigation of the Effect of ECAP Parameters on Hardness, Tensile Properties, Impact Toughness, and Electrical Conductivity of Pure Cu through Machine Learning Predictive Models. Materials 2022, 15, 9032. [Google Scholar] [CrossRef]
  45. Sankuru, A.B.; Sunkara, H.; Sethuraman, S.; Gudimetla, K.; Ravisankar, B.; Babu, S.P.K. Effect of processing route on microstructure, mechanical and dry sliding wear behavior of commercially pure magnesium processed by ECAP with back pressure. Trans. Indian Inst. Met. 2021, 74, 2659–2669. [Google Scholar] [CrossRef]
  46. Ghosh, A.; Ghosh, M. 3D FEM simulation of Al-Zn-Mg-Cu alloy during multi-pass ECAP with varying processing routes, Mater. Today Commun. 2021, 26, 102112. [Google Scholar] [CrossRef]
  47. Shaeri, M.H.; Salehi, M.T.; Seyyedein, S.; Abutalebi, M.; Park, J. Characterization of microstructure and deformation texture during equal channel Angular pressing of Al–Zn–Mg–Cu alloy. J. Alloy. Compd. 2013, 576, 350–357. [Google Scholar] [CrossRef]
  48. Lei, W.; Zhang, H. Analysis of microstructural evolution and compressive properties for pure Mg after room-temperature ECAP. Mater. Lett. 2020, 271, 127781. [Google Scholar] [CrossRef]
  49. Venkatachalam, P.; Kumar, S.R.; Ravisankar, B.; Paul, V.T.; Vijayalakshmi, M. Effect of processing routes on microstructure and mechanical properties of 2014 Al alloy processed by equal channel angular pressing. Trans. Non. Ferr. Met. Soc. China 2010, 20, 1822–1828. [Google Scholar] [CrossRef]
  50. Alateyah, A.; Ahmed, M.M.; Alawad, M.O.; Elkatatny, S.; Zedan, Y.; Nassef, A.; El-Garaihy, W. Effect of ECAP die angle on the strain homogeneity, microstructural evolution, crystallographic texture and mechanical properties of pure magnesium: Numerical simulation and experimental approach. J. Mater. Res. Technol. 2022, 17, 1491–1511. [Google Scholar] [CrossRef]
  51. Schmidt, J.; Marques, M.R.; Botti, S.; Marques, M.A. Recent advances and applications of machine learning in solid-state materials science. Npj Comput. Mater. 2019, 5, 83. [Google Scholar] [CrossRef]
  52. Wen, C.; Zhang, Y.; Wang, C.; Xue, D.; Bai, Y.; Antonov, S.; Dai, L.; Lookman, T.; Su, Y. Machine learning assisted design of high entropy alloys with desired property. Acta Mater. 2019, 170, 109–117. [Google Scholar] [CrossRef]
  53. Butler, K.T.; Davies, D.W.; Cartwright, H.; Isayev, O.; Walsh, A. Machine learning for molecular and materials science. Nature 2018, 559, 547–555. [Google Scholar] [CrossRef]
  54. Schleder, G.R.; Padilha, A.C.M.; Acosta, C.M.; Costa, M.; Fazzio, A. From DFT to machine learning: Recent approaches to materials science—A review. J. Phys. Mater. 2019, 2, 032001. [Google Scholar] [CrossRef]
  55. Wang, A.Y.-T.; Murdock, R.J.; Kauwe, S.K.; Oliynyk, A.O.; Gurlo, A.; Brgoch, J.; Persson, K.A.; Sparks, T.D. Machine Learning for Materials Scientists: An Introductory Guide toward Best Practices. Chem. Mater. 2020, 32, 4954–4965. [Google Scholar] [CrossRef]
  56. Sarker, I.H. Machine Learning: Algorithms, Real-World Applications and Research Directions. SN Comput. Sci. 2021, 2, 160. [Google Scholar] [CrossRef]
  57. Williams, C.K.; Rasmussen, C.E. Gaussian Processes for Machine Learning; MIT Press: Cambridge, MA, USA, 2006. [Google Scholar]
  58. Deringer, V.L.; Bartók, A.P.; Bernstein, N.; Wilkins, D.M.; Ceriotti, M.; Csányi, G. Gaussian process regression for materials and molecules. Chem. Rev. 2021, 121, 10073–10141. [Google Scholar] [CrossRef]
  59. Vapnik, V. The Nature of Statistical Learning Theory; Springer Science & Business Media: New York, NY, USA, 1999. [Google Scholar]
  60. Cherkassky, V.; Ma, Y. Practical selection of SVM parameters and noise estimation for SVM regression. Neural Netw. 2014, 17, 113–126. [Google Scholar] [CrossRef]
  61. Ahmad, A.S.; Hassan, M.Y.; Abdullah, M.P.; Rahman, H.A.; Hussin, F.; Abdullah, H.; Saidur, R. A review on applications of ANN and SVM for building electrical energy consumption forecasting. Renew. Sustain. Energy Rev. 2014, 33, 102–109. [Google Scholar] [CrossRef]
  62. Blanco, V.; Japón, A.; Puerto, J. A mathematical programming approach to SVM-based classification with label noise. Comput. Ind. Eng. 2022, 172, 108611. [Google Scholar] [CrossRef]
  63. Ahmed, N.I.; Nasrin, F. Reducing Error Rate for Eye-Tracking System by Applying SVM. In Machine Intelligence and Data Science Applications; Springer: New York, NY, USA, 2022; pp. 35–47. [Google Scholar]
  64. Xu, B.; Sun, J.; Yang, Z.; Xiao, L.; Zhou, H.; Han, J.; Liu, H.; Wu, Y.; Yuan, Y.; Zhuo, X.; et al. Microstructure and anisotropic mechanical behavior of the high-strength and ductility AZ91 Mg alloy processed by hot extrusion and multi-pass RD-ECAP. Mater. Sci. Eng. A 2020, 780, 139191. [Google Scholar] [CrossRef]
  65. Fonda, R.; Knipling, K. Texture development in near-α Ti friction stir welds. Acta Mater. 2010, 58, 6452–6463. [Google Scholar] [CrossRef]
  66. Gautam, P.C.; Biswas, S. On the possibility to reduce ECAP deformation temperature in magnesium: Deformation behaviour, dynamic recrystallization and mechanical properties. Mater. Sci. Eng. A 2021, 812, 141103. [Google Scholar] [CrossRef]
  67. Wang, C.; Ma, A.; Sun, J.; Liu, H.; Huang, H.; Yang, Z.; Jiang, J. Effect of ECAP process on as-cast and as-homogenized Mg-Al-Ca-Mn alloys with different Mg2Ca morphologies. J. Alloy. Compd. 2019, 793, 259–270. [Google Scholar] [CrossRef]
  68. Fonda, R.W.; Knipling, K.E. Texture development in friction stir welds. Sci. Technol. Weld. Join. 2011, 16, 288–294. [Google Scholar] [CrossRef]
  69. Alateyah, A.I.; Alawad, M.O.; Aljohani, T.A.; El-Garaihy, W.H. Influence of Ultrafine-Grained Microstructure and Texture Evolution of ECAPed ZK30 Magnesium Alloy on the Corrosion Behavior in Different Corrosive Agents. Materials 2022, 15, 5515. [Google Scholar] [CrossRef]
  70. Rollett, A.; Humphreys, F.; Rohrer, G.S.; Hatherly, M. Recrystallization and Related Annealing Phenomena, 2nd ed.; Elsevier: Amsterdam, The Netherlands, 2004. [Google Scholar] [CrossRef]
  71. Gautam, P.C.; Biswas, S. Effect of ECAP temperature on the microstructure, texture evolution and mechanical properties of pure magnesium. Mater. Today Proc. 2021, 44, 2914–2918. [Google Scholar] [CrossRef]
  72. Biswas, S.; Singh, D.S.; Beausir, B.; Toth, L.S.; Suwas, S. Thermal Response on the Microstructure and Texture of ECAP and Cold-Rolled Pure Magnesium. Metall. Mater. Trans. A 2015, 46, 2598–2613. [Google Scholar] [CrossRef]
  73. Gzyl, M.; Rosochowski, A.; Boczkal, S.; Olejnik, L. The role of microstructure and texture in controlling mechanical properties of AZ31B magnesium alloy processed by I-ECAP. Mater. Sci. Eng. A 2015, 638, 20–29. [Google Scholar] [CrossRef]
  74. Suh, J.; Victoria-Hernández, J.; Letzig, D.; Golle, R.; Volk, W. Effect of processing route on texture and cold formability of AZ31 Mg alloy sheets processed by ECAPMater. Sci. Eng. A 2016, 669, 159–170. [Google Scholar] [CrossRef]
  75. Fan, G.; Zheng, M.; Hu, X.; Xu, C.; Wu, K.; Golovin, I. Improved mechanical property and internal friction of pure Mg processed by ECAP. Mater. Sci. Eng. A 2012, 556, 588–594. [Google Scholar] [CrossRef]
  76. Hughes, D.A.; Hansen, N. High angle boundaries formed by grain subdivision mechanisms. Acta Mater. 1997, 45, 3871–3886. [Google Scholar] [CrossRef]
  77. Tolaminejad, B.; Dehghani, K. Microstructural characterization and mechanical properties of nanostructured AA1070 aluminum after equal channel angular extrusion. Mater. Des. 2012, 34, 285–292. [Google Scholar] [CrossRef]
  78. Cheng, W.; Tian, L.; Ma, S.; Bai, Y.; Wang, H. Influence of Equal Channel Angular Pressing Passes on the Microstructures and Tensile Properties of Mg-8Sn-6Zn-2Al Alloy. Materials 2017, 10, 708. [Google Scholar] [CrossRef]
  79. Naik, G.M.; Narendranath, S.; Kumar, S.S.S. Effect of ECAP Die Angles on Microstructure Mechanical Properties and Corrosion Behavior of AZ80 Mg Alloy. J. Mater. Eng. Perform. 2019, 28, 2610–2619. [Google Scholar] [CrossRef]
  80. del Valle, J.; Carreño, F.; Ruano, O. Influence of texture and grain size on work hardening and ductility in magnesium-based alloys processed by ECAP and rolling. Acta Mater. 2006, 54, 4247–4259. [Google Scholar] [CrossRef]
  81. Wang, Y.; Chen, M.; Zhou, F.; Ma, E. High tensile ductility in a nanostructured metal. Nature 2002, 419, 912–915. [Google Scholar] [CrossRef] [PubMed]
  82. Zhou, W.; Lin, J.; Dean, T.A. Microstructure and mechanical properties of curved AZ31 magnesium alloy profiles produced by differential velocity sideways extrusion. J. Magnes. Alloy. 2023, 11, 493–508. [Google Scholar] [CrossRef]
Figure 1. Correlation chart of ECAP responses (H, σu, Du, and Gr) against their counterpart input parameters (N, ϕ, and Rt).
Applsci 13 06279 g001
Figure 2. IPF orientation map for pure Mg in its AA condition, IPF coloring triangle, red: (001); blue: (120); green: (010).
Applsci 13 06279 g002
Figure 3. IPF orientation map comparable to ED for pure Mg processed 1P (a,b) and 4Bc (c,d) using the 90°-die (a,c) and 120°-die (b,d).
Applsci 13 06279 g003
Figure 4. IPF orientation map comparable to ED for pure Mg processed 2A (a,d), 2Bc (b,e), and 2C (c,f) using the 90°-die (ac) and 120°-die (df).
Applsci 13 06279 g004aApplsci 13 06279 g004b
Figure 5. The (0001) pole viewgraphs obtained from the EBSD data for the (a) AA condition and the ECAP-processed using the 90°-die (b,d,f,h,j) and 120°-die (c,e,g,i,k) for 1P (b,c), 2A (d,e), 2Bc (f,g), 2C (h,i), and 4Bc (j,k).
Applsci 13 06279 g005aApplsci 13 06279 g005b
Figure 6. (a) Predicted grain size against experimentally measured grain size values examined for the training and the testing datasets. (b) Predicted grain size values versus sample indices for predicted train, predicted test, and experimental dataset.
Applsci 13 06279 g006
Figure 7. (a) Predicted against experimental hardness values examined for the training and the testing datasets. (b) Predicted hardness values versus sample indices for predicted train, predicted test, and experimental hardness.
Applsci 13 06279 g007
Figure 8. (a) Predicted versus experimental σu values examined for the training and the testing datasets. (b) Predicted σu values versus sample indices for predicted train, predicted test, and experimental dataset.
Applsci 13 06279 g008
Figure 9. (a) Predicted versus experimental ductility values examined for the training and the testing datasets. (b) Predicted ductility values versus sample indices for predicted train, predicted test, and experimental dataset.
Applsci 13 06279 g009
Table 1. Experimental design of independent input ECAP process parameters.
RunECAP Parameters
A (N)B (Φ)C (Route Type)
22120A
3490C
42120C
5290Bc
62120A
7290Bc
84120Bc
94120C
102120Bc
111120A
12490Bc
13190A
14490A
15490A
16190A
Table 2. Comparison of AA and ECAPed billets obtained grain sizes produced by utilizing two distinct die angles (ϕ) and various passes.
Grain Size (µm)AAΦ = 90°Φ = 120°
1P2A2Bc2C4Bc1P2A2Bc2C4Bc
Minimum1.10.640.560.50.680.211.10.680.50.50.81
Maximum3425.4522.629.2911.057.1424.8224.7922.7316.9116.91
Mean grain size6.341.961.691.491.570.882.621.751.891.941.89
Standard deviation5.81.50.970.950.670.732.451.441.851.641.11
Table 3. Model evaluation metrics of pure Mg ECAP parameters.
ParameterOptimized ML ModelTraining SetTesting Set
RMSER2RMSER2
Grain size (µm)LR0.0780.9830.1940.851
GPR0.0240.9980.1750.878
SVR0.0780.9830.1940.851
Table 4. Model evaluation metrics of pure Mg ECAP parameters.
ParameterOptimized ML ModelTraining SetTesting Set
RMSER2RMSER2
Vicker’s microhardness (HV)LR1.2260.8831.2230.843
GPR0.2880.9941.6460.715
SVR0.4980.9811.6260.722
Table 5. Model evaluation metrics of pure Mg ECAP parameters.
ParameterOptimized ML ModelTraining SetTesting Set
RMSER2RMSER2
σu (MPa)SVR12.910.7974.2530.929
Ductility (Du%)GPR0.2560.9912.3820.728
SVR0.3580.9822.0470.799
Disclaimer/Publisher’s Note: The statements, opinions and data contained in all publications are solely those of the individual author(s) and contributor(s) and not of MDPI and/or the editor(s). MDPI and/or the editor(s) disclaim responsibility for any injury to people or property resulting from any ideas, methods, instructions or products referred to in the content.

