
Glass Ceramic with Improved Structure and Properties Made with Wastes from FeNi Production
Institute of Physical Chemistry “Acad. Rostislaw Kaishew”, Bulgarian Academy of Sciences, 1113 Sofia, Bulgaria
Appl. Sci. 2023, 13(10), 6206; https://doi.org/10.3390/app13106206
Submission received: 31 March 2023
/
Revised: 12 May 2023
/
Accepted: 16 May 2023
/
Published: 18 May 2023
(This article belongs to the Special Issue Recent Development in Utilization of Waste Ash for Construction Materials)
Abstract
:Hazardous residues from ferronickel production are vitrified. The optimum thermal regime for the conversion of the resulting glass into glass-ceramics is estimated by rapid alternative methods: the nucleation step is valued by DTA, and the crystallization step by density measurements. The results show that a short and inexpensive thermal treatment can be used. The evolution of phase formation is highlighted by XRD, SEM–EDS, FESEM and TEM. Due to the presence of 1.5 wt % chromium oxides and high amounts of iron and magnesium oxides, the crystallization process is peculiar. It starts during the melt’s cooling with the precipitation of preliminary Fe-Mg-Cr spinel crystals, which then act as centers for growth of pyroxenes. Simultaneously, due to liquid–liquid immiscibility, the main amorphous phase forms a nonhomogeneous binodal structure, which becomes finer after the nucleation treatment. Subsequently, thus formed iron-rich drops are transformed into tiny secondary magnetite spinel, acting as nuclei for the main crystallization process. As a result, new pyroxenes with sizes of about 200 nm are formed and the total crystallinity reaches about 60%. Regardless of the large amounts of problematic wastes in the batch, the resulting glass shows good chemical durability, while the glass-ceramic is characterized by optimal mechanical characteristics.
1. Introduction
Under the regulatory rules in many countries, the uncontrolled landfilling of hazardous industrial residues can be completely forbidden. Nevertheless, various metallurgical industries continue to produce and discharge huge amounts of slags, ashes or slurries, some of which contain a variety of heavy metals; a portion of these wastes can be considered as hazardous. However, the price for their storage continues to increase, while the available landfill places appropriated for the construction of new disposal facilities (as dumps or tailing ponds) strongly decreases. At the same time, notwithstanding the progress in metallurgy, frequently either the additional recovery of metals from these residues is not economically effective or new types of wastes are formed.
In general, the metallurgical wastes contain high amounts of SiO2, Al2O3, CaO or MgO in different ratios [1,2,3,4], so the possibility arises that they might be considered as potential raw materials for different building glass-ceramics or ceramics (i.e., industries with high production volume). Moreover, during vitrification or immobilization into ceramic body, the heavy metals from the waste are bonded chemically in stable structures, which significantly decreases their solubility. Usually, the subsequent crystallization heat-treatment additionally improves the chemical durability of the final products.
Many industrial residues containing high amounts of iron oxides have been used for synthesis of various glass-ceramics. Successful research has been conducted using blast furnace slag, electric furnace dust and slag, residues by hydrometallurgical production of zinc (as goethite and jarosite), copper flotation waste, residues from hydrometallurgical nickel production, foundry slag from lead manufacture, etc. [5,6,7,8,9].
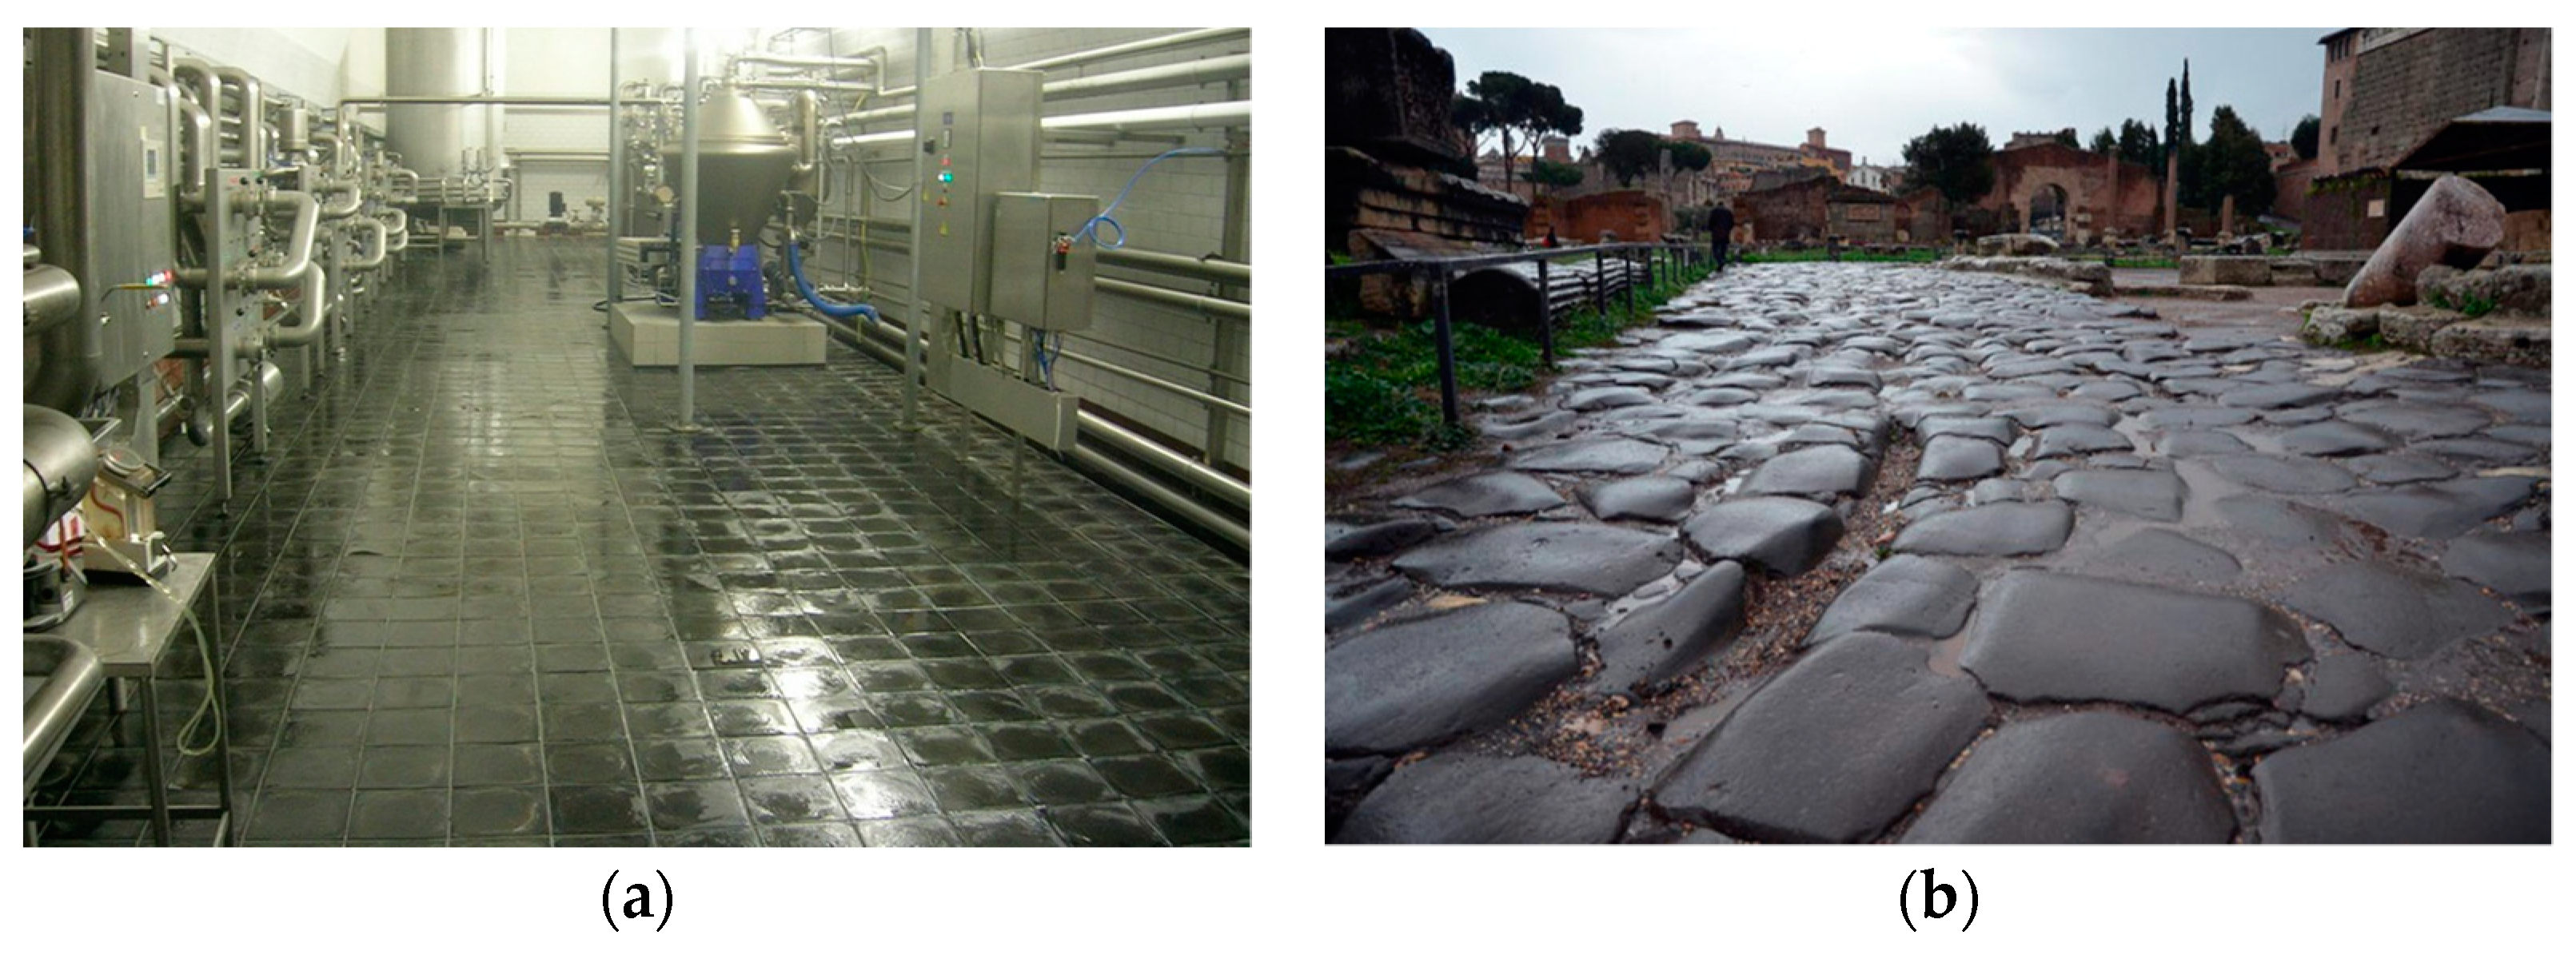
It can also be noted that silicate melts, rich with iron oxides, are also widely used in “petrurgy” (i.e., industrial re-melting of basalts). This manufacturing process, which began its expansion in the first decades of the twentieth century in the former Soviet Union and Germany, must be considered to be a forerunner of glass-ceramic production, because partially controlled crystallization takes place during the forming, cooling and annealing of the basalt melts used. Typical petrurgical products are tiles, tubes and bends, as well as basalt fiber or sintered materials. Due to the high chemical resistance and the very good mechanical properties of the obtained materials this industry is still viable. As an example, in Figure 1a is presented the application of paving tiles from a modern re-fused rock company [10].
It is also very interesting to remember that basaltic natural blocks were applied as pavements in the Roman Empire more than two millennia ago (as is shown in Figure 1b). Many medieval squares and streets in Naples, Rome and other sites in Italy are covered with large natural basaltic tiles or cobblestone. Even today, different companies continue successfully to produce similar natural materials.
The silicate melts, rich with iron oxides, are characterized by intriguing peculiarities, which reduce the costs of the glass melting and the crystallization treatment. Firstly, their viscosity curves simultaneously show high glass transition temperatures and low melting temperature range. Practically, the glass transition is similar to the ones of common container and windows glasses, while the melting temperatures are lower by 150–200 °C. The relatively high temperature of glass-transition indicates the good chemical durability of the glasses, whereas the low melting temperature leads to a decreased melting cost.
The crystallization process of these glasses is also specific. Since the iron oxides have low solubility in silicate melts, a tendency for liquid–liquid separation at higher temperatures is typically observed. As a result, an enrichment of iron oxide occurs in the liquid phase during the cooling, which provokes the subsequent quick crystallization of tiny magnetite spinel crystals. Then, this spinel phase provides centers for the main crystallization process. In many cases, the quantity of thereby-formed spinel crystals does not change expressively with the nucleation heat-treatment, so the iron-rich glass-ceramics can be manufactured by one-step crystallization heat-treatment.
However, if Cr2O3, TiO2, CaF2 or/and large amounts of MgO are present in the iron oxide rich glasses, the phase formation processes become more complex [11,12,13,14,15,16,17,18] and the nucleation processing can be more effective. This is a precondition for the formation of finer crystal structure and enhanced mechanical properties.
Here, a glass which is a product of vitrification of FeNi metallurgical wastes is presented. It contains elevated amounts of MgO and iron oxides and ~1.5 wt % Cr2O3, which leads to an intriguing phase formation and a complex glass-ceramic structure coupled with very good mechanical, thermal and chemical characteristics.
The present manuscript is a partially modified and shortened version of a chapter of a book, which includes the invited lectures, presented during the first VitroGeoWastes conference in Elche, Spain [19]. The author expresses thanks to the book’s editors for their permission to distribute this summary, which is an overview of already published results [20,21,22] together with some new data and comments.
2. Characterization of Main Industrial Wastes
The metallurgical waste used is from the FENI INDUSTRY ferronickel smelting plant in the Republic of North Macedonia. The initial stage of the production is related to a pre-reduction of the ores in a rotary kiln, which produces a waste in the form of filter dust, D. During the second stage of reduction smelting, raw ferroalloy and electric arc furnace slag, collectively known as EFS (which is the main waste stream), are produced. At the final manufacturing stage, during the refining of the ferronickel alloy, another type of slag, one which contains huge amounts of iron oxides, is formed, namely, CS.
The chemical compositions of these wastes were analyzed by XRF spectrometer (XRF ARL 9900), and the corresponding results are reported in Table 1. The EFS stream is rich of silica, iron oxides and MgO, which means that it might be a possible material for an additional vitrification. D waste is fairly similar, while CS is mostly composed of the iron oxides CaO and MgO.
The major crystal phases in EFS and D are various silicates, such as olivine, plagioclase and quartz, while iron oxides are present in CS. All of these crystal phases are results of the high temperature of the production treatments, which, however, is an advantage for the eventual vitrification procedure, since the glass batch can be dense and non-foaming.
The chemical durability of the wastes used was valued by TCLP (toxicity characteristic leaching procedure) for 24 h at pH = 5.0 ± 0.2 (controlled by 0.5 M acetic acid). The resulting values, which are reported in Table 2, surpass the permissible limits for non-hazardous wastes for several metals [23]. It is evident that Zn, Ni, and As are problematic in the dust and Ni and Cr in the electric-furnace slag and the converter slag. In addition, very high concentrations of iron in the solutions from EFS and CS are also measured.
3. Materials and Methods
The results of chemical analyses elucidate that the main residue EFS and the dust D contain relatively high amounts of glass formers, while the leaching results demonstrated that the most problematic waste was CS. In order to use the wastes simultaneously, they were mixed in ratio D/CS/EFS = 1/1/10 (comparable to the production rate) and homogenized. The chemical composition of the resulting mix (labelled WM) is also reported in Table 1. Due to high amounts of iron oxides and MgO and elevate Cr2O3 percentage, the direct (as it is) vitrifications of WM will be problematic, because spontaneous and uncontrolled crystallization during the melt-cooling is possible. In order to decrease the crystallization tendency, 30% container glass cullet CG (crushed to particles below 5 mm) was mixed with 70% WM. The chemical compositions of the CG and of the resulting composition, WG, are also shown in Table 1. The usage of cheap waste-glass is a common technique in the synthesis of similar glass-ceramics [1,2,3,4]; it favors the glass melting, decreases the crystallization trends and improves the chemical durability.
A batch of approximately 400 g was melted in a corundum crucible (99% Al2O3) using an electric furnace. A portion of the mix was placed in the crucible at room temperature. The remaining batch was added during an additional step at ~1200 °C, and then the temperature was raised up to 1400 °C. After 1–1.5 h melting, although there were high amounts of wastes in the batch, the melt formed a clean surface free of bubbles, which is an indication of quick refining and homogenization processes. After another 0.5 h holding, the melt was poured out in copper casting molds to manufacture 15–20 cm glass bars. The obtained glass was characterized by glossy black surfaces, similar to that of natural basalt slabs.
The main part of the glass was annealed for 30 min at 600 ± 5 °C and then the glass bars obtained were cut into samples appropriate for the planned studies. A quantum of 4–5 g of non-annealed glass was crushed into small bulk samples suitable for DTA analysis.
The heat treatment for nucleation was studied by DTA technique in an air atmosphere (PerkinElmer Diamond apparatus). The optimal temperature for nucleation was evaluated by means of small bulk samples weighing 10–15 mg, held for 1 h at various temperatures and then heated at 20 °C/min to 1000 °C. The efficiency of the nucleation was related to the temperature shift (ΔT) between the peak temperatures (TP) of the crystallization exo-effects of the nucleated samples and a non-nucleated sample. Then, the optimal nucleation time was estimated by calculating the variation of ΔT vs. the duration of the holding time at the optimal nucleation temperature.
The proper temperatures and times of the crystallization temperature were estimated by use of the increase of density due to crystallization [5]. Both nucleated and non-nucleated samples weighing 3–4 g were subjected to heat treatments at diverse temperatures for different times. The density of each sample was measured twice: before and after the crystallization step.
For these measurements, an Ar displacement pycnometer (AccyPyc 1330) was used. The percentage of crystal phase, % CP, was calculated by the relationship:
where ρg is the parent glass density and ρgc is the glass-ceramic density. Here, the calibration coefficient K depends upon the density difference between the crystal and the corresponding amorphous structures:
where ρcr is the crystal phase density and ρ(g*) is the density of a glass with a composition identical to that of the crystal phase.
% CP = 100 × (1⁄ρg − 1⁄ρgc)/K
K = 1⁄ρ(g*) − 1⁄ρcr
This method is suitable when phases with a high density-difference between the amorphous and crystal structures are formed. In the case of pyroxene and spinel (which are the crystal phases formed in the studied glass-ceramics) the differences between ρcr and ρ(g*) are so high that the ratio ρ(g*)/ρcr for pyroxene crystallization is 0.84 ± 0.1 and for precipitation of the spinel phase is 0.82 ± 0.2. Considering that the experimental error in density measurements was evaluated as ±0.005 g/cm3, the experimental error is at approximately ±2% in the crystal phase.
The phase formation in samples crystallized in different regimes was investigated by SEM–EDS (JEOL JSM 6390 coupled with an Oxford INCA energy dispersive x-ray spectrometer). The specimens were grinded, polished, and etched for 3 s in 2% HF solution, and then coated with Au. Additionally, the structure of the final glass-ceramic and the element mapping were studied by FESEM (Zeiss Merlin with high efficiency HE-SE2 detector).
The formed-crystal phases were identified by XRD (PANalytical Empyrean).
Certain powder samples (<54 μm) were observed by HRTEM (JEOL JEM 2100 at 200 kV accelerating voltage) after dispersion in distilled water, sonication in ultrasonic bath and fixation on a 3-D Cu grid.
The mechanical properties of the final product were determined by a universal strength testing set (SHIMADZU AGS-X at 10 kN load, connected with TRAPEZIUM X supporting software) [21]. For evaluation of the bending strength, 5 × 5 × 50 mm samples were used, while for the compressive strength—5 × 5 × 5 mm specimens. The Vickers micro-hardness was also evaluated (AVERY 6460 with optical microscope). The coefficient of linear thermal expansion in the interval 20–400 °C was measured at 5 °C/min by optical dilatometer (Misura HOD 1400). The leaching of the parent glass and that of the final glass-ceramic also were evaluated by TCLP test at conditions identical to those for the used wastes.
4. Results and Discussion
4.1. Evaluation of the Optimal Crystallization Heat Treatment
Evaluation of the suitable crystallization regime is essential for the successful conversion of the initial glass into a fine crystalline glass-ceramic. Typically, the times and temperatures for nucleation and crystallization stages are estimated by sophisticated microscopic studies and quantitative XRD analysis [1,24], which, unfortunately, are expensive and time-consuming. However, other techniques can also be applied.
The most popular alternative for estimating nucleation temperature and time is use of non-isothermal DTA experiments [12,24]. In this case, the temperature shifts, ΔT, of the exothermic crystallization peak temperature, Tp, to inferior temperatures is used as an indicator for the effectiveness of the nucleation process. This is a consequence of the fact that the formation of a significant number of new nuclei can result in a smaller size of crystals being formed, which accelerates the rate of crystallization. The higher the number of formed crystals, the smaller their size and the larger the temperature shift.
The DTA method is also widely used to estimate the crystallization tendency (i.e., bulk or surface). In this case, the ability for bulk nucleation and growth is evaluated by a simple comparison of the DTA runs of bulk and fine powder samples. At a satisfactory tendency for bulk crystallization, the Tp of the bulk sample can be similar to that of the powder sample. To the contrary, when the tendency for bulk nucleation is scarce, the crystallization exo-peak is larger, with lower intensity, and it appears at a higher temperature.
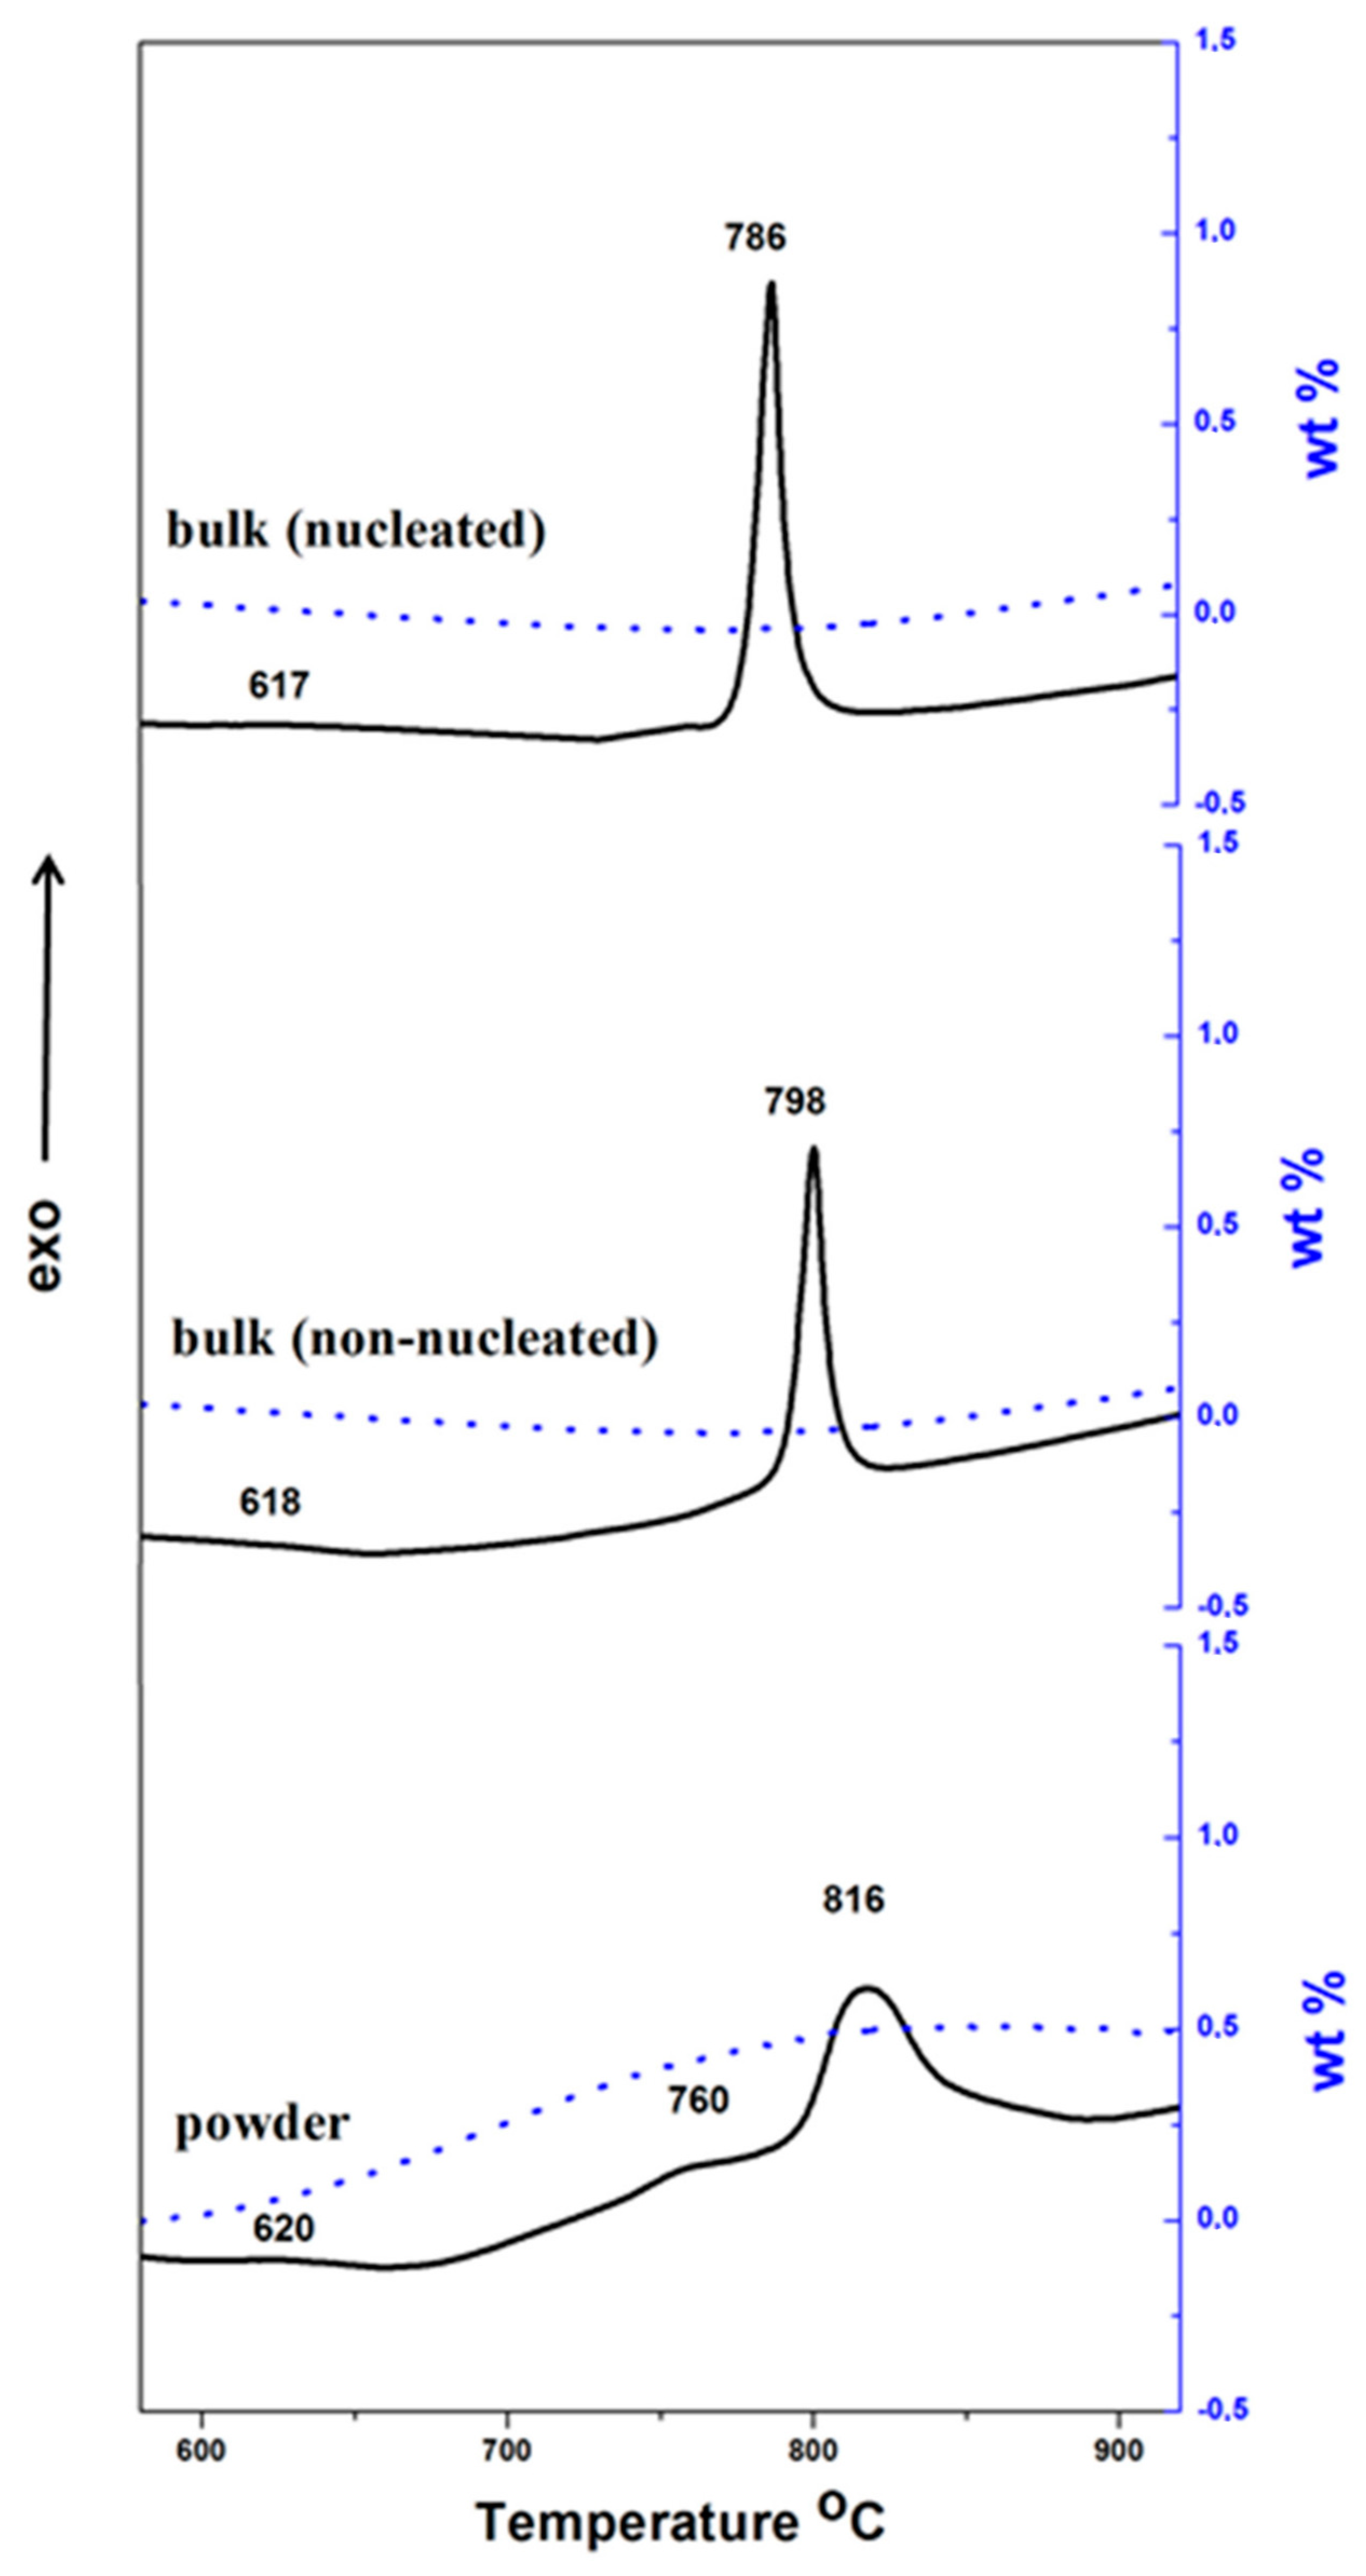
The DTA–TG data of the powder sample (below 75 µm) and that for non-nucleated and nucleated bulk samples of the discussed glass are shown in Figure 2. The DTA results elucidate a glass transition temperature of 615–620 °C (estimated as the first onset of the heat flow signal in the glass transition range) for all samples, and Tp at ~816, ~798 and 786 °C for powder sample, non-nucleated and nucleated bulk samples, respectively. Additionally, the traces of the powder sample show an exotherm with low intensity in the interval 720–780 °C, which is connected with a weight increase of about 0.5 wt %. This effect can be associated with the surface oxidation of Fe2+ into Fe3+ which takes place before the crystallization in the glass powder. Similar DTA peaks and TG signals are not present in the bulk samples due to their low specific surfaces. Since a complete oxidation of the iron oxides is expected in the glass transition temperature interval, the value of TG gain might be used to evaluate the ratio Fe2+/Fe3+ in the parent glass [9,14]. For our composition, the weight rise due to FeO oxidation is ~0.55 wt %, which corresponds to an initial FeO amount of ~5% and a FeO/F2O3 ratio of ~0.34. This ratio is typical for similar glass compositions and melting procedures and is not very different from the magnetite (FeO·Fe2O3) ratio of 0.5, one which can provoke the most exhaustive formation of iron spinel.
The higher crystallization temperature of the powder samples is unusual behavior, consequent to the surface oxidation Fe2+ into Fe3+, leading to an increase of viscosity and to a significant decrease of the magnetite (FeO·Fe2O3) spinel [5] formation in the glass powders. The viscosity variation is result of the different structural roles of Fe2+ (which is a typical “modifier”) and Fe3+ (acting as “intermediates”) in glass and melt structures.
The intense DTA peak of the non-nucleated bulk sample at 798 °C, only about 200 °C higher than the glass transition temperature, indicates a notable bulk crystallization, even without nucleation heat-treatment. As has been already noted, this behavior can be considered typical for glasses rich of iron oxides. Nevertheless, the nucleation treatment additionally decreases the crystallization temperature, which can lead to a finer crystalline structure.
The optimum nucleation temperature was defined with DTA experiments at 20 °C/min by means of bulk particles, heat-treated previously for 1 h at diverse temperatures in the expected “nucleation” range (Tg − 20 °C)–(Tg + 50 °C). The Tp of observed exotherms and the corresponding ΔT shifts are reported in Table 3. It is evident that the optimum temperature for nucleation is at about 630–650 °C, where ΔT is 11–12 °C. In the glass transition range, practically no temperature shift was noted, while at 615 and at 670 °C ΔT was only 3–4 °C. Similarly, the optimum nucleation time at 650 °C was also obtained. These results also are presented in Table 3 and show that the maximum temperature shift was reached after only 45–60 min.
The temperature and time of crystallization were estimated by pycnometric measurements. In these experiments, both nucleated specimens (heat-treated for 1 h at 650 ± 5 °C) and non-nucleated specimens, weighing about 2–3 g were heat-treated at 710 ± 5 °C, 730 ± 5 °C, 750 ± 5 °C and 770 ± 5 °C for times between 1 and 120 min. The heat treatments were carried out in an electric furnace at 10 °C/min heating and 20 °C/min cooling. The densities of each sample were measured before and after the crystallization. The density of the initial glass samples varied in the range of 2.86–2.87 g/cm3, whereas the maximum density reached was 3.17–3.18 g/cm3.
The changes in density (Δρ) of nucleated and non-nucleated samples treated at 730 °C for different times are reported in Table 4a. In both series, during the first 20 min the phase formation is faster, and then the rate of crystallization begins to decrease. The results also clarify that the crystallization process is significantly accelerated in the nucleated samples, and that the increase in crystallinity becomes negligible after 1 h holding.
The density variations and the corresponding amounts of crystal phase formed after 5 min holding at diverse temperature are summarized in Figure 4b. The results support the proposition that the preliminary nucleation treatment accelerates the crystallization and that the temperature significantly influences the crystallization rate: at 770 °C, the maximum crystallinity of 52–54% is reached after only 5–10 min, while at 750 °C, the maximum crystallinity of 55–57% is obtained after 30–40 min; at 710 °C the formed-crystal phase remains below 10–13%, even after 2 h of holding. The observed increase of the significant amount of formed-crystal phase with the decrease of temperature (i.e., 59–61% at 730 °C vs. 52–54% at 770 °C) can be explained by the diminishing of precipitation with rises in temperature.
These results demonstrate that the optimum temperature for the crystallization step is 730–740 °C, while the crystallization hold is about 45–60 min. If the temperature is lower with 20–30 °C, the crystallization time will increase significantly, whereas at higher temperature (760–770 °C) a distinguished decrease of the crystallinity occurs. In addition, if the crystallization rate is too high, some problems with the formation of regular structure can be expected due to the intensive release of latent crystallization heat.
4.2. Phase Formation and Structure
The efficiency of the optimal thermal regime was studied using XRD, SEM, TEM and FESEM. Various samples, obtained with and without the nucleation step at 650 °C for 1 h, and with 1, 5 and 60 min crystallization holds at 730 °C, were made and analyzed. These specimens were labeled GC0-1, GC0-5, GC0-60, GC60-1, GC60-5 and GC60-60; the first number indicates the nucleation time, and the second, the crystallization time.
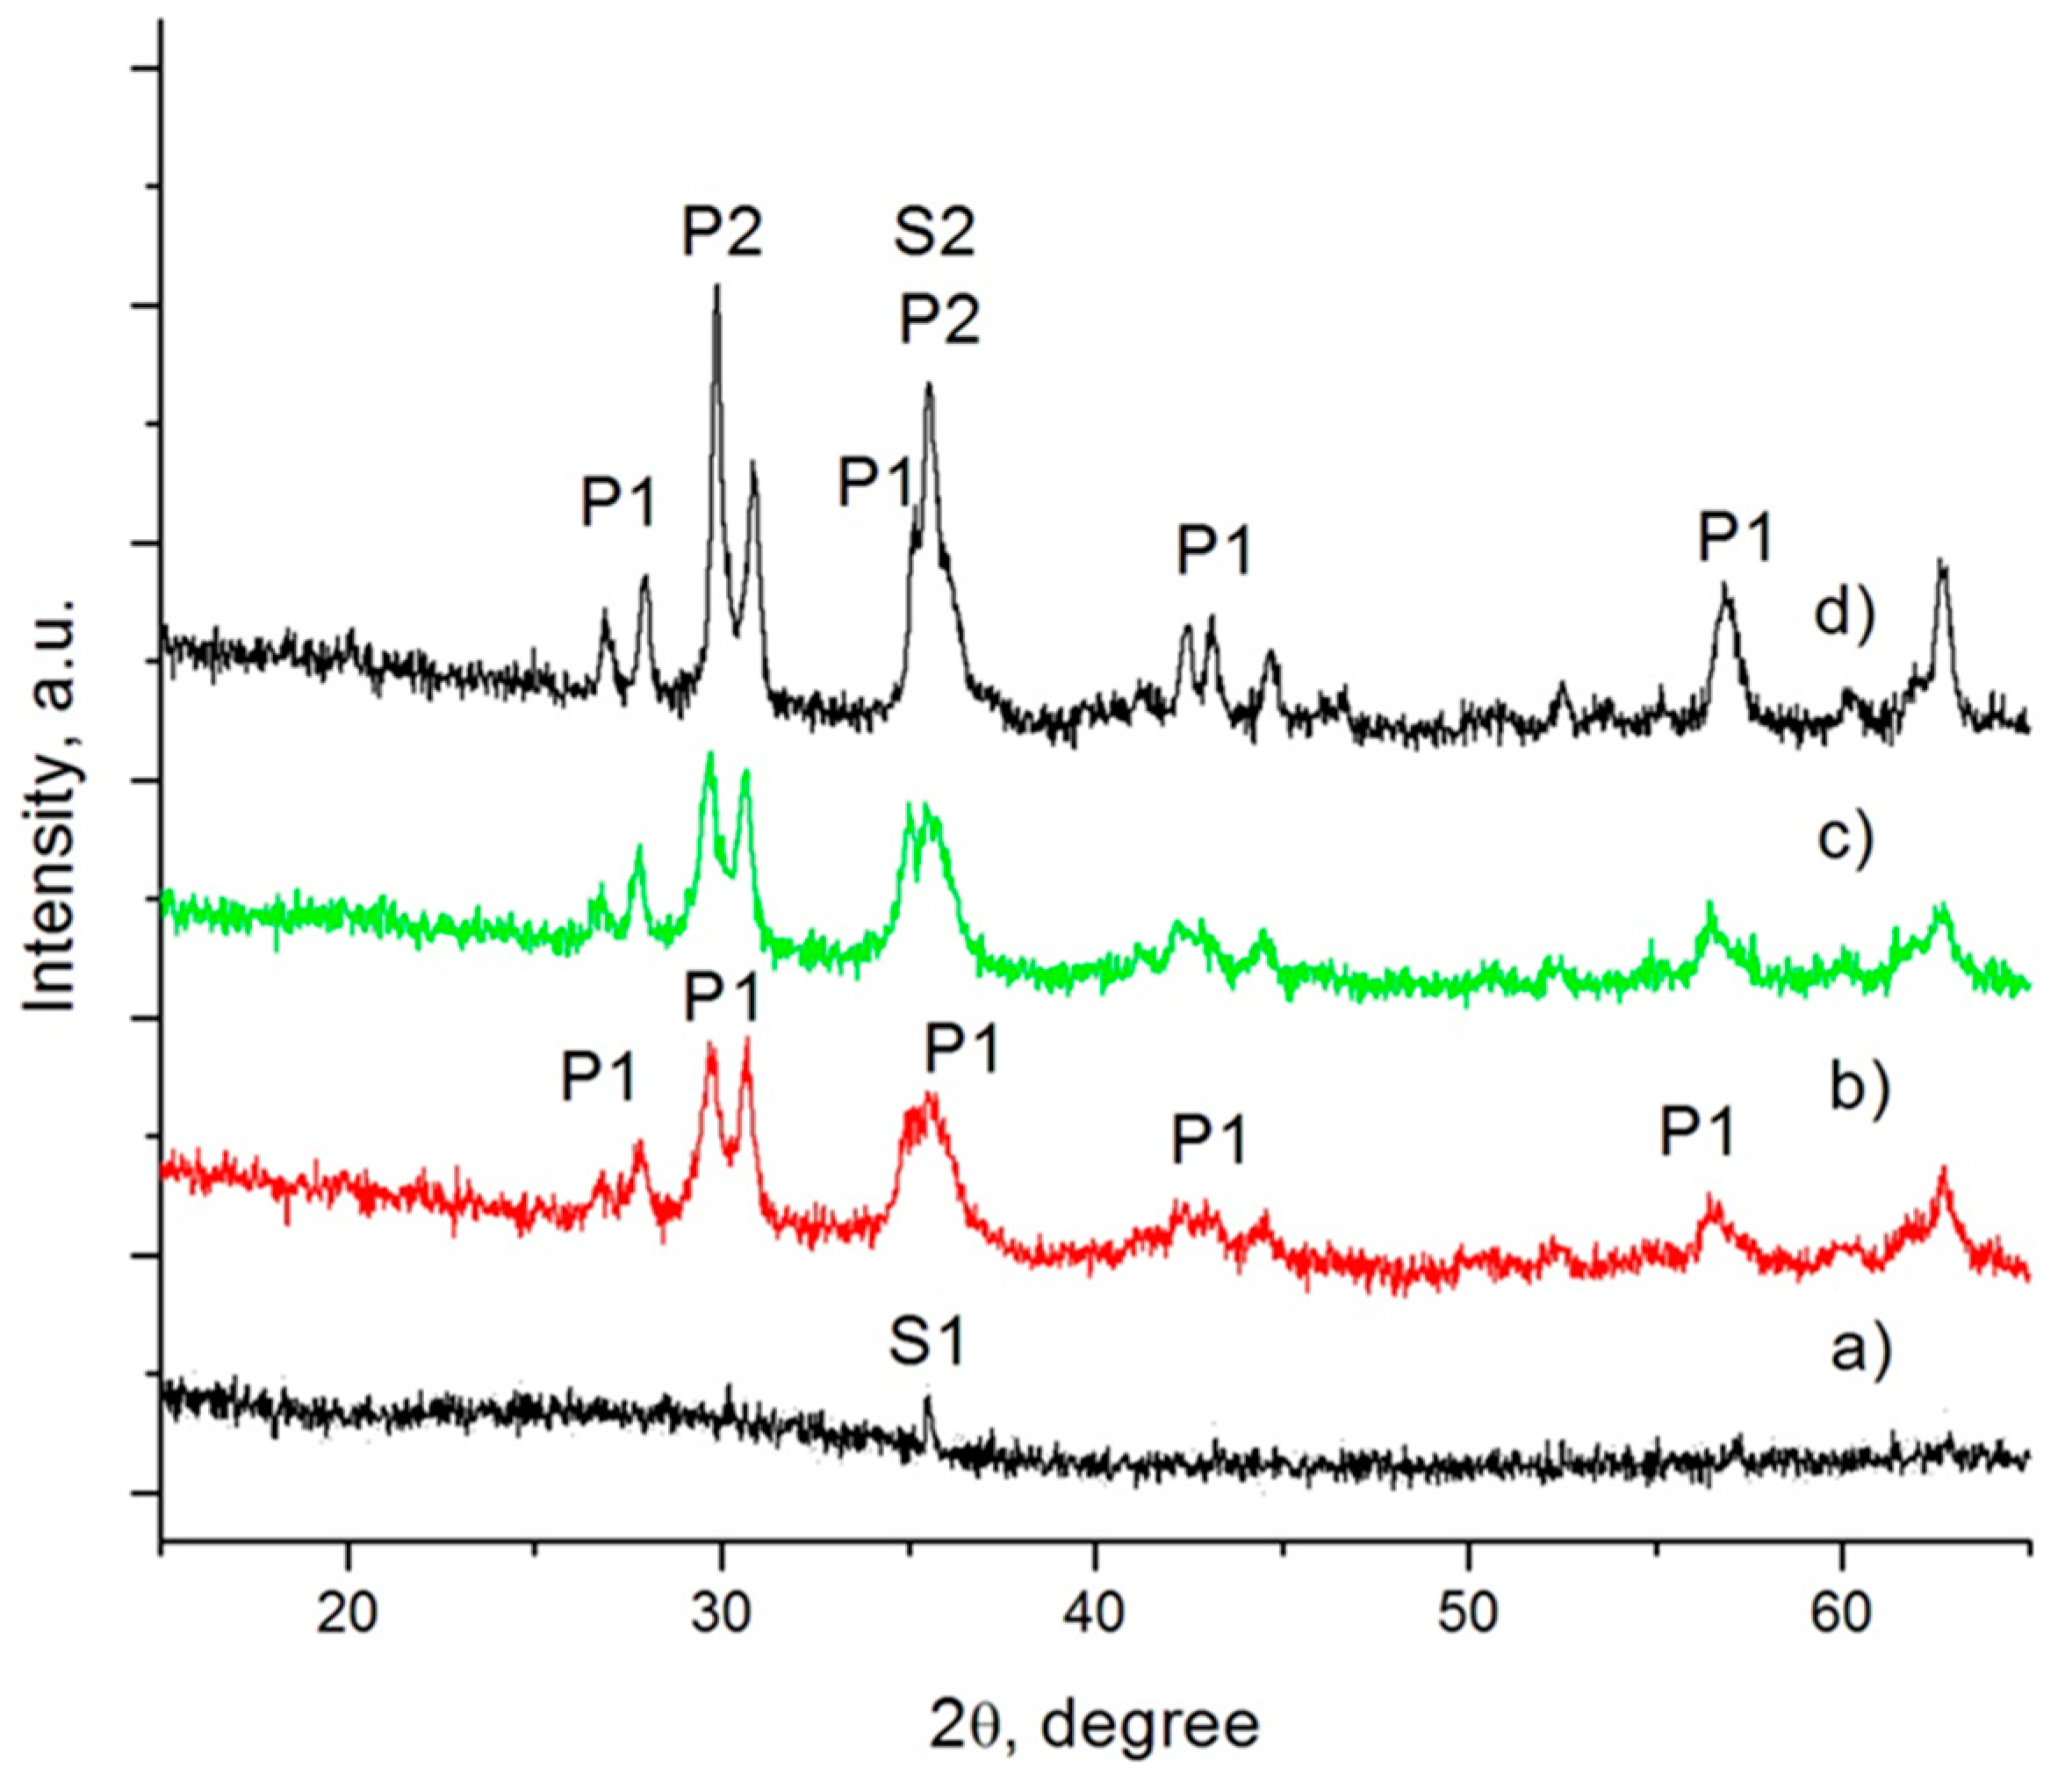
The XRD pattern of the parent glass (a) and specimens GC60-1 (b), GC60-5 (c) and GC60-60 (d) are shown in Figure 3.
Some spinel was observed in the parent glass. As a result of the low Cr2O3 solubility in silicate melts, when its concentration is higher than 0.7–1.0 wt %, a part of this oxide spontaneously precipitates into “preliminary” spinel crystals during the melt cooling; the residual part eventually might participate in the formation of a “secondary” spinel phase at low temperatures. The “preliminary” spinel (labelled S1) that was formed in our glass was defined as a solid solution between MgO·Cr2O3 (ICSD171106) and FeO·Fe2O3 (ICSD158742).
In sample GC60-1, the formation of some pyroxene phase (labelled P1) was also identified. After 5 min crystallization at 730 °C, some increasing in its amount were observed. In the final glass-ceramics (see Figure 3d), together with P1, a new pyroxene phase, one which practically becomes the main crystal phase in the material (labelled P2), is formed. According to the structural analysis P1 is characterized with a unit cell with V~428 × 106 pm3, whereas in P2, V~422 × 106 pm3. This difference is about 1.5%, and it clearly highlights a variation in the chemical compositions of both pyroxene phases. It can be assumed that some larger ions participate in the formation of the P1 phase. Additionally, some increase of the spinel phase is observed, which must be related to the formation of “secondary” magnetite spinel (labelled S2).
The results for the non-nucleated samples (GC0-1, GC0-5 and GC0-60) show no significant differences from the nucleated samples.
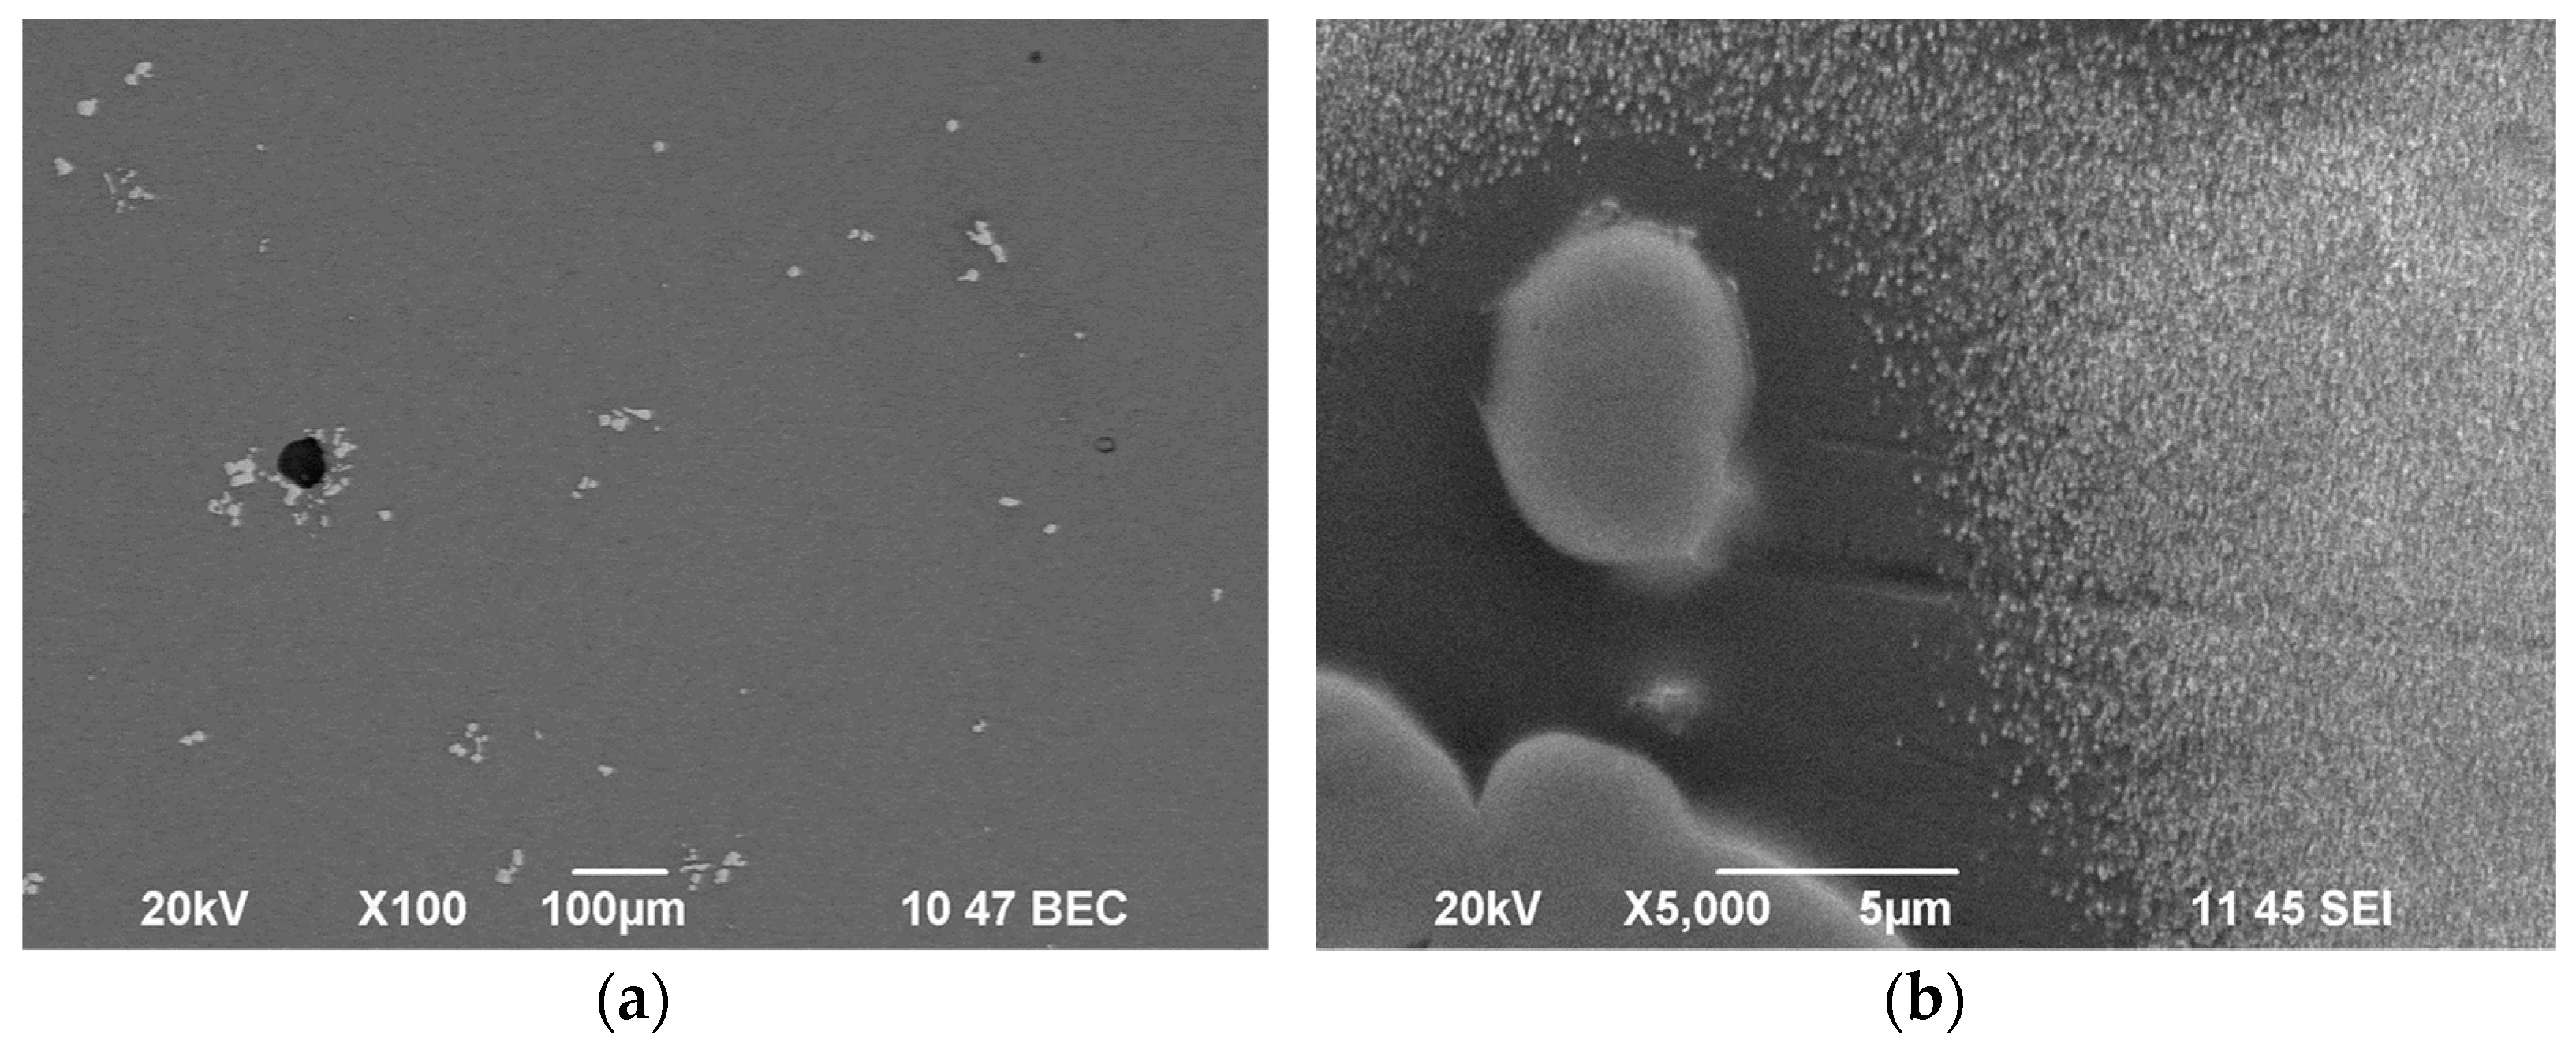
After 1 min at 730 °C, the phase formation is still in its initial stage and the SEM image, which is presented in Figure 4a, practically shows only “preliminary” spinel crystals. Their size is between 3 and 10 μm, and the EDS analysis reports a quite constant chemical composition (mol %): 36 ± 2 iron oxides, 23 ± 2 Cr2O3 and 41 ± 3 MgO. These results confirm the XRD data for the formation of a solid solution between MgO·Cr2O3 and FeO·Fe2O3.
Since the molar percentage of MgO in the parent glass is higher than that of Cr2O3, it follows that the iron taking part in the formation of the “preliminary” spinel is predominantly in Fe3+ valence. This indicates that some increase of the Fe2+/Fe3+ ratio in the main glassy matrix can be expected, which must favor the subsequent formation of a “secondary” magnetite spinel phase. In addition, considering that the overall volume of the Cr-Mg-Fe spinel phase is at about 4–6%, it might also be concluded that the chromium oxide is mainly concentrated in the “preliminary” spinel crystals.
Figure 4b shows a photo at higher magnification, with a group of “preliminary” spinel crystals in GC60-1. It is evident that around these crystals is formed a “homogeneous” crystallization field with a thickness between 5 and 10 µm.
However, the main volume of the sample (i.e., at about 80–85%), where the Fe2O3 concentration is high, is characterized with a “non-homogeneous” structure due to the formation of tiny spherical particles enriched with iron. It is clear that these drops become finer and finer when moving away from the crystallization field.
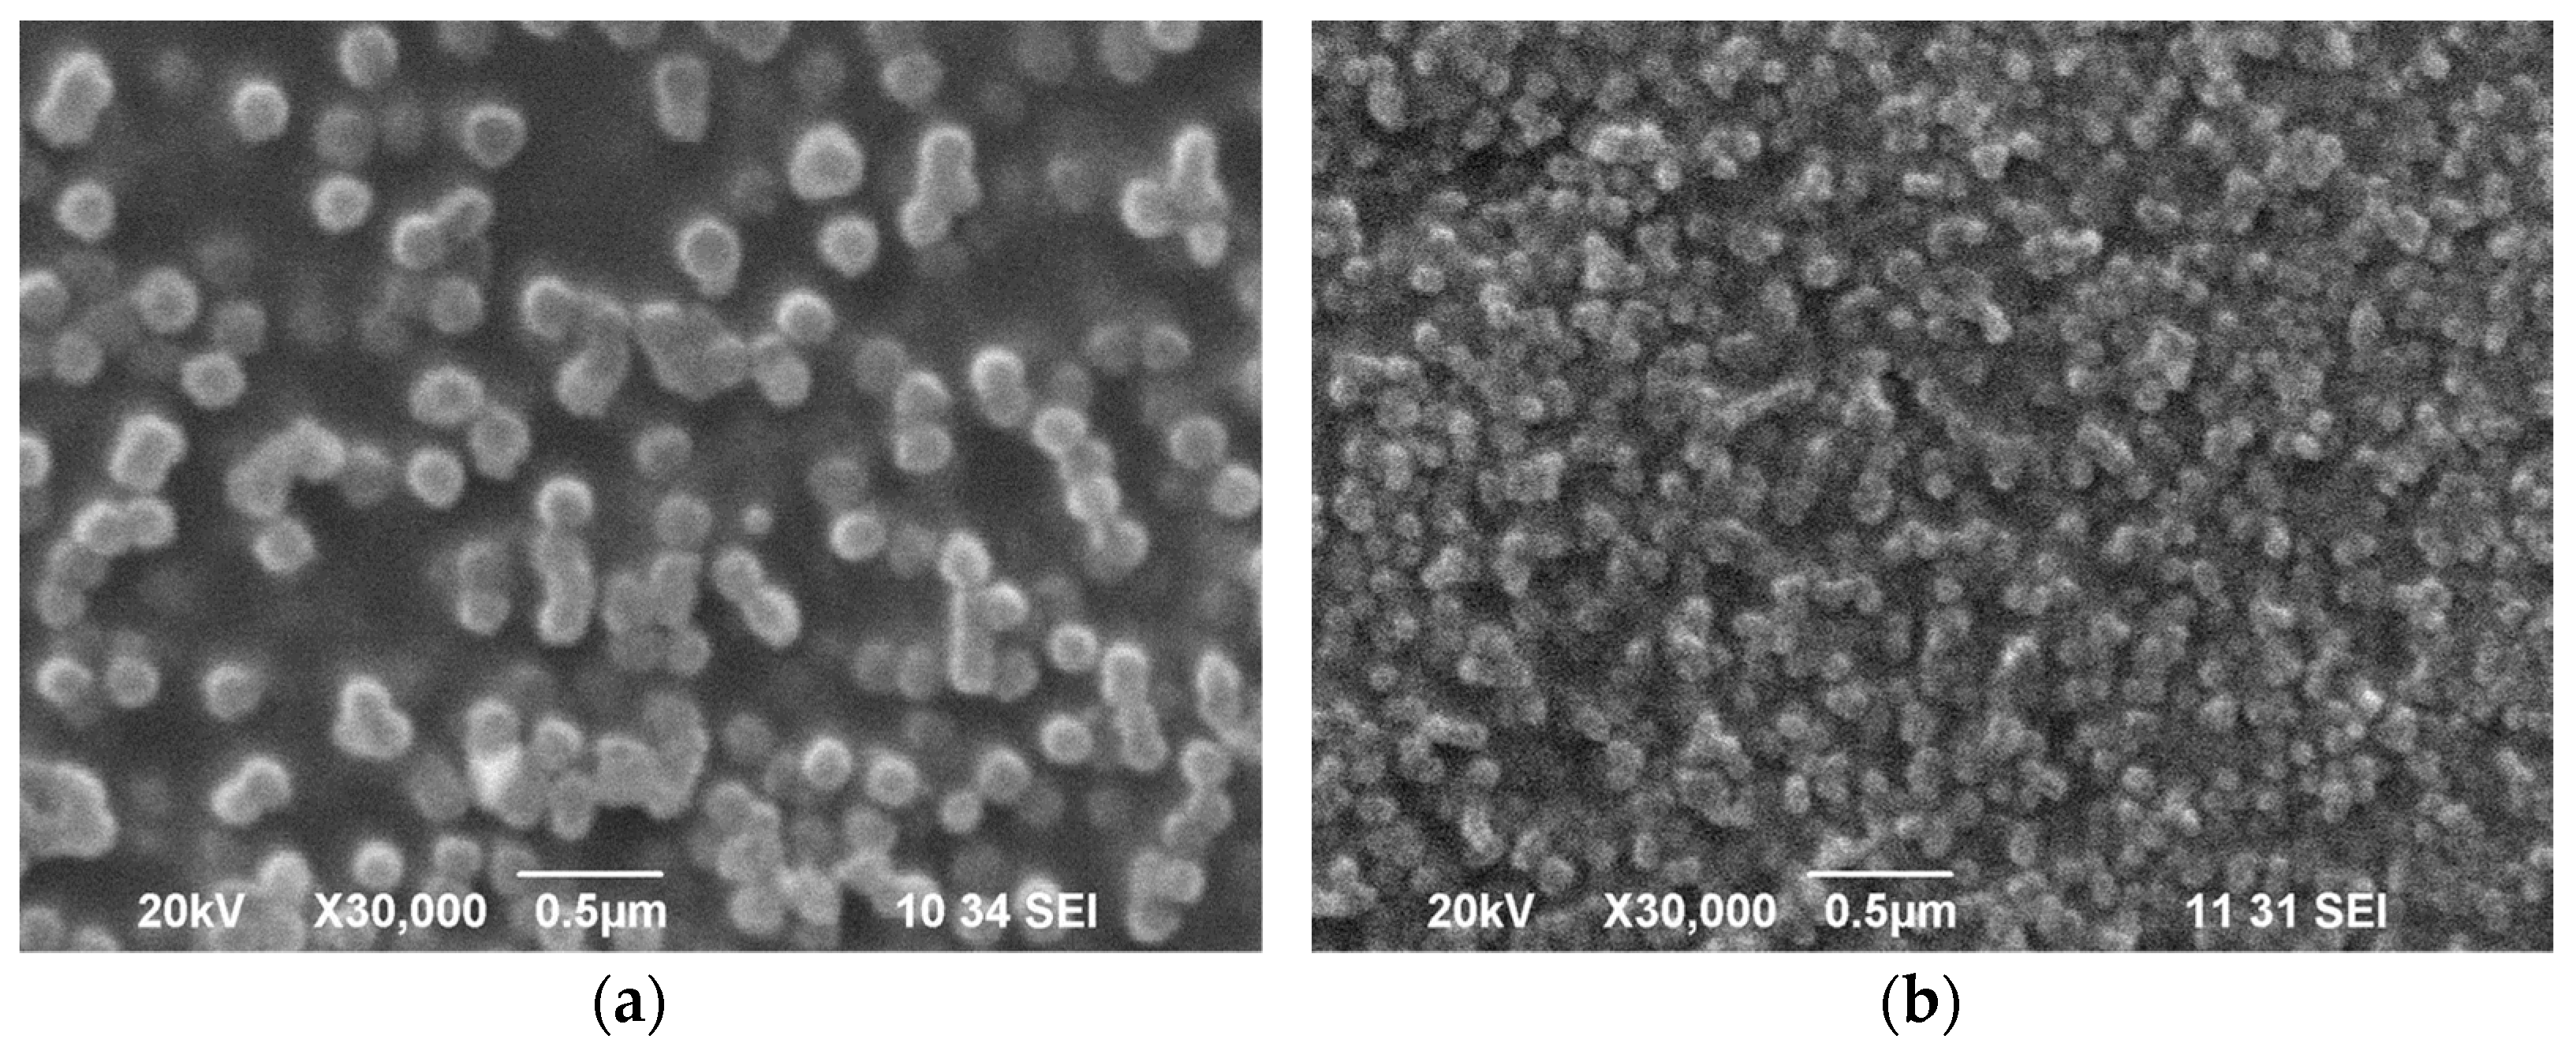
Figure 5a,b elucidates areas free of “preliminary” spinel in samples GC0-1 and GC60-1, respectively. These SEM results demonstrate that without treatment at 650 °C, the size of iron-rich drops is in the range of 150–250 nm, while after the “nucleation step” it decreases to 50–70 nm and the number of drops significantly rises (from 15 ± 5 per µm2 in GC0-1 to 50 ± 10 for GC60-1). This result clarifies that during the nucleation step binodal liquid–liquid separation occurs.
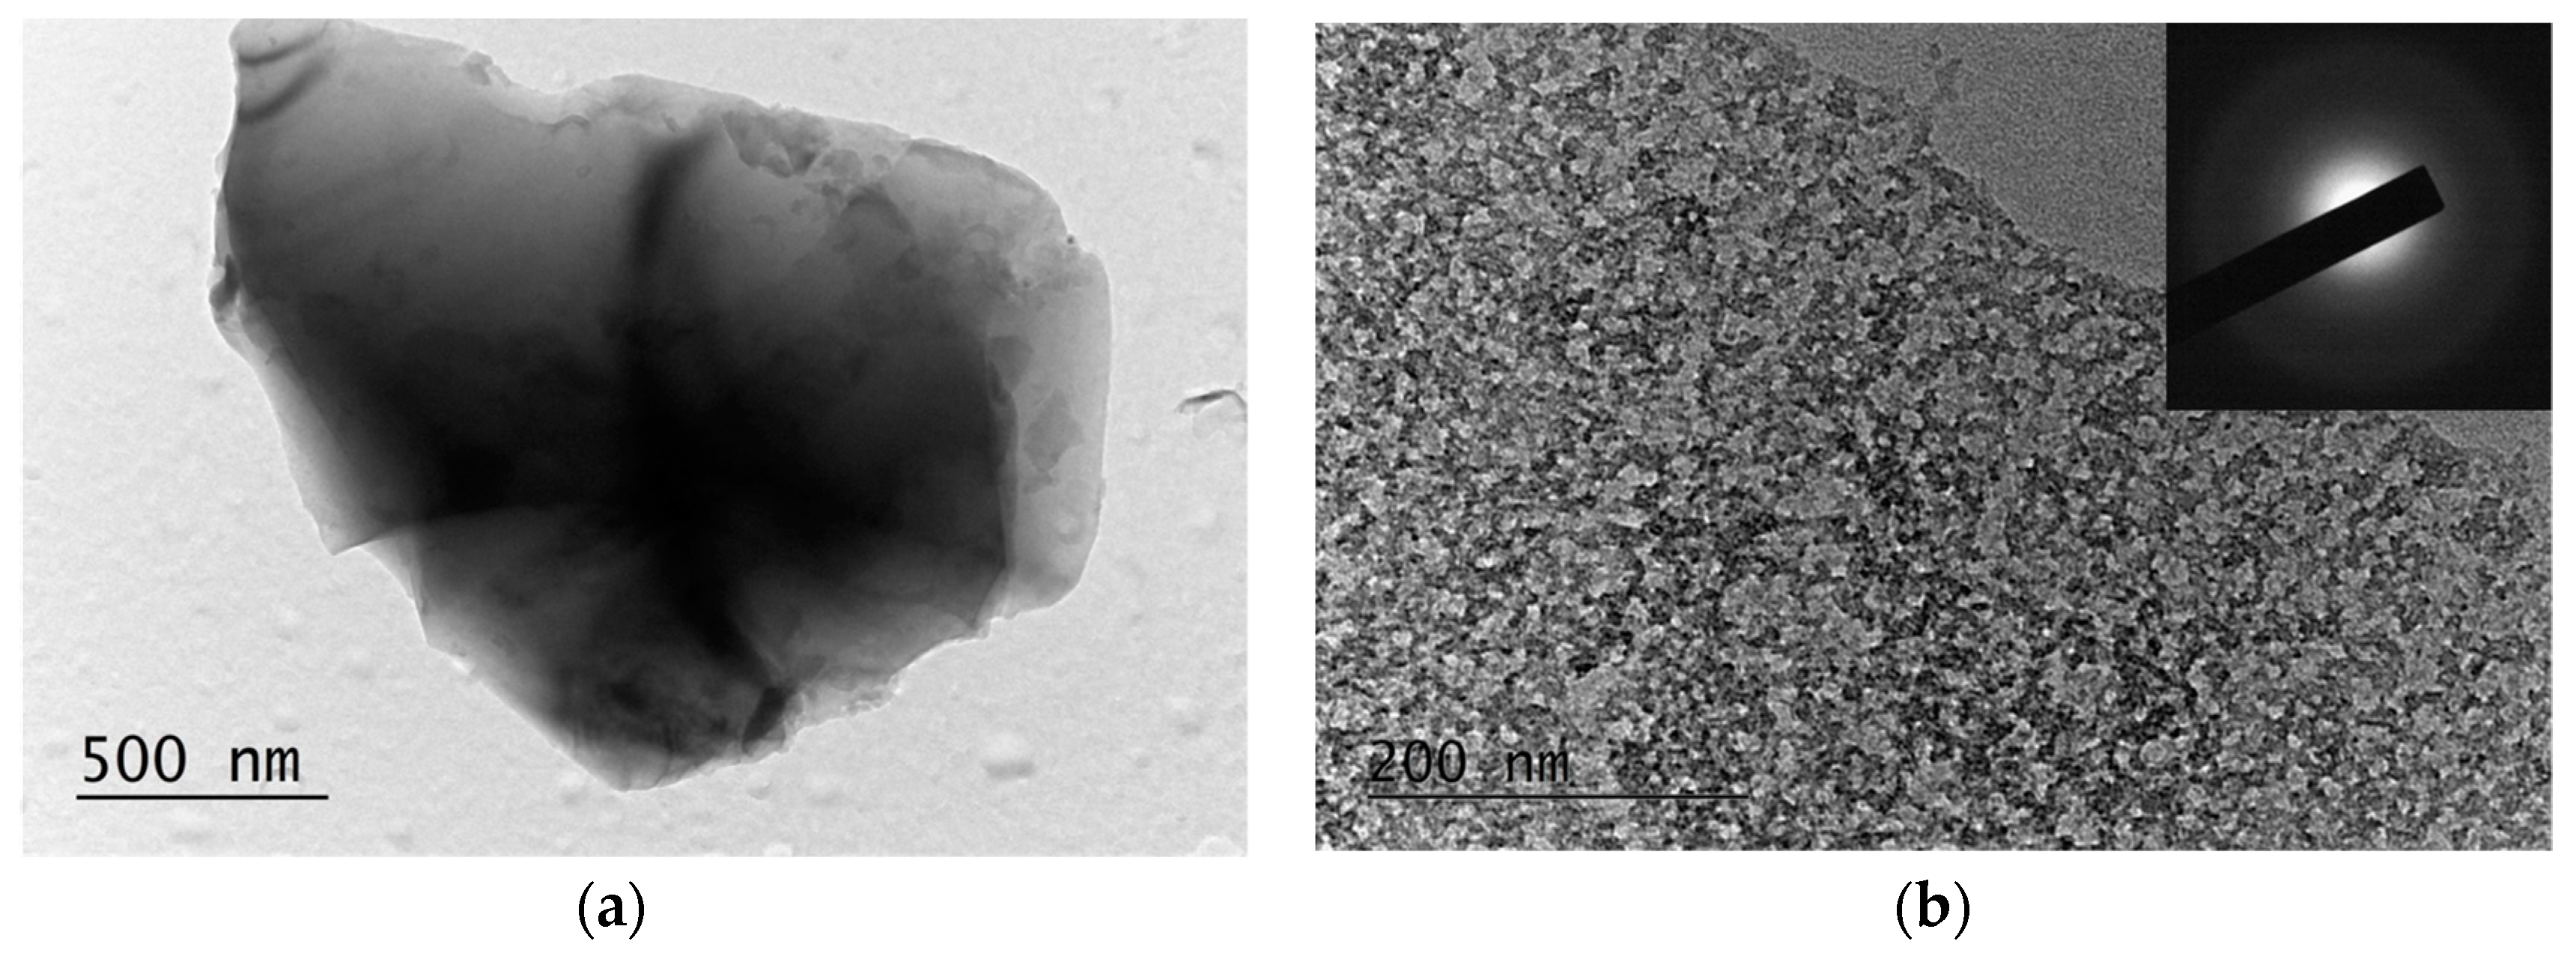
The liquid–liquid immiscibility was also confirmed by TEM observations. In Figure 6a, a flake from the parent glass rapidly quenched in water, elucidating a homogeneous amorphous structure, is shown. On the contrary, in Figure 6b, an image from sample GC60-1, where the structure is non-homogeneous and comparable to one obtained by SEM, is presented. In addition, the corresponding electron diffraction (SAED) pattern (shown in the inset) confirms the amorphous structure of GC60-1 and thus the assumption for initial liquid–liquid separation.
In samples GC0-5 and GC60-5, variations in the composition and the size of the “preliminary” spinel were not detected, which supports the hypothesis that this phase is generally formed during the melt’s cooling. In agreement with XRD results, the beginning of pyroxene growth on these spinel crystals was observed. It can be also supposed that at subsequent heat treatments, the iron-rich drops were transformed into tiny magnetite crystals, which than acted as nucleation agents for the pyroxene formation.
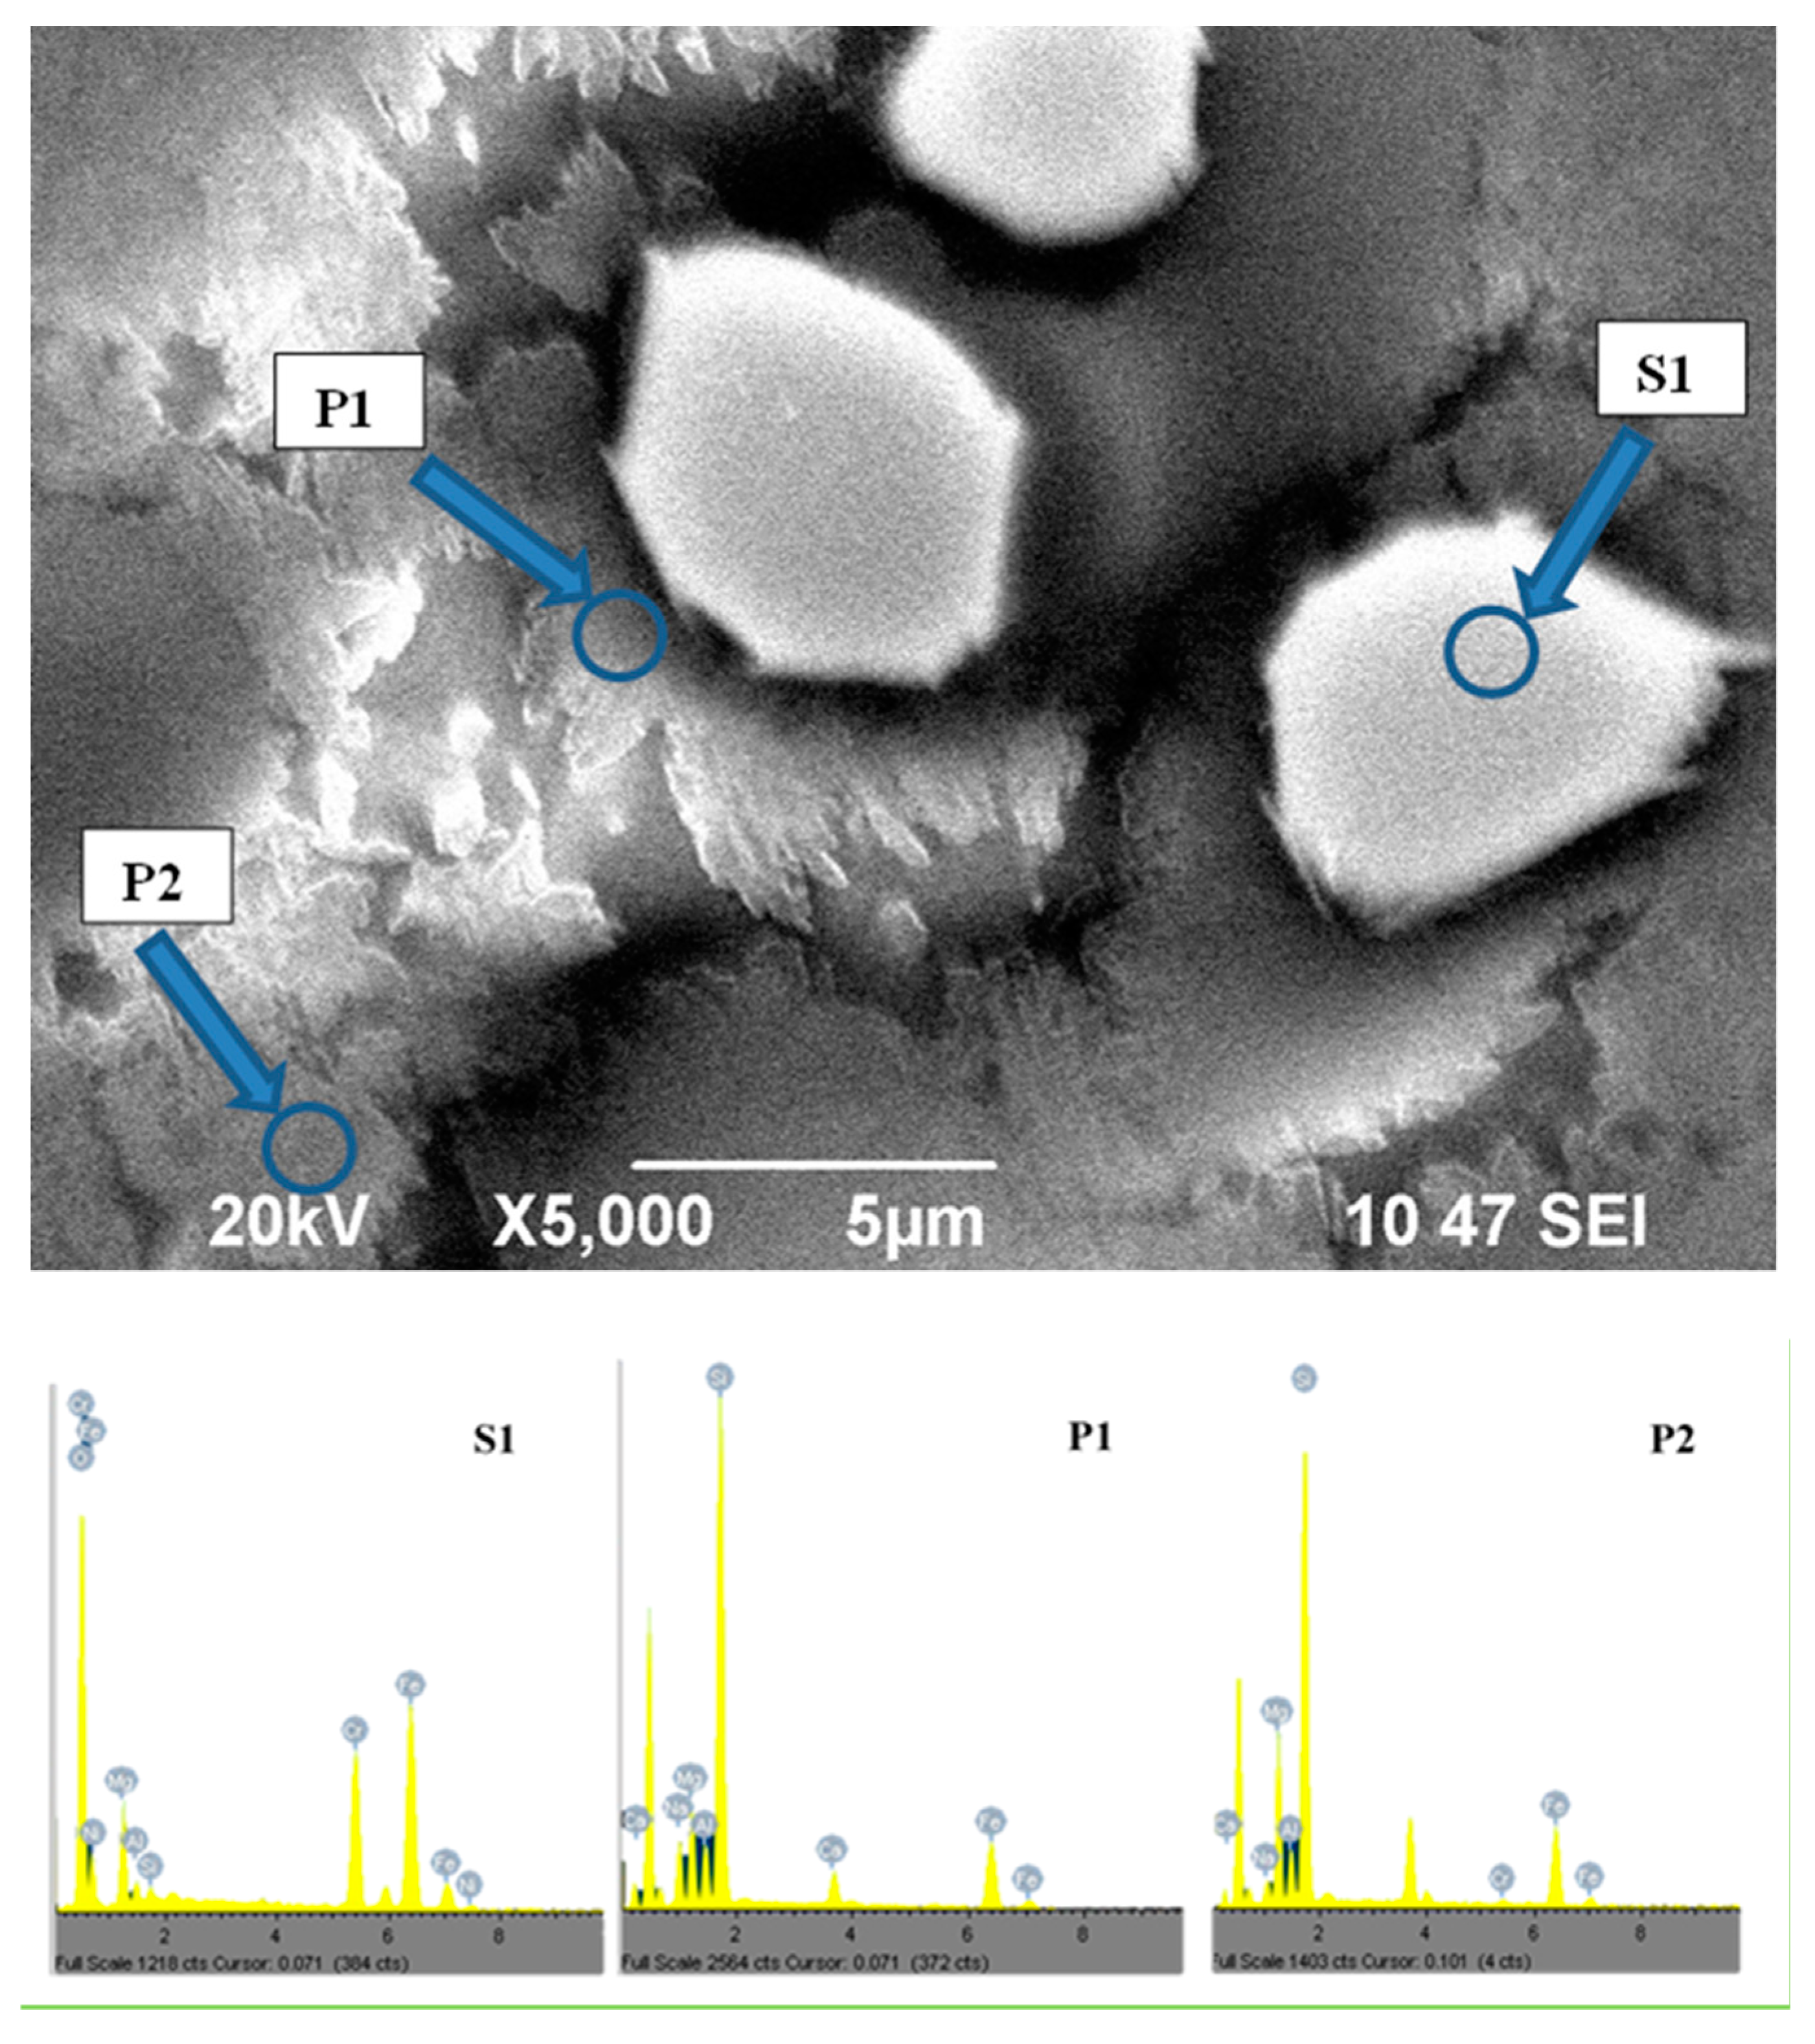
In sample GC0-60, presented in Figure 7, together with the pyroxene crystals growing on the “preliminary” spinel, consistent crystallization (in the form of pyroxene spherulites with of 3–6 μm size) was also observed in the main matrix. In this figure, EDS spectra of the “preliminary” spinel and both pyroxene phases are also reported. The results demonstrate that the first pyroxene phase, growing in the diffusion field on the “preliminary” spinel, is characterized by higher concentrations of Ca2+ and Na+, while the main pyroxene phase was characterized by higher concentrations of Mg2+. These results confirm the XRD data for both pyroxene phases and explain the differences in the volumes of their unit cells. In sample GC60-60, due to the effective “nucleation”, the size of both pyroxene crystals (P1 and P2) is significantly lower [21]; in order to better highlight the structure of the final glass-ceramic, it was additionally studied by FESEM and EDS mapping of the elements Fe, Cr, Mg, Ca, Na and Si.
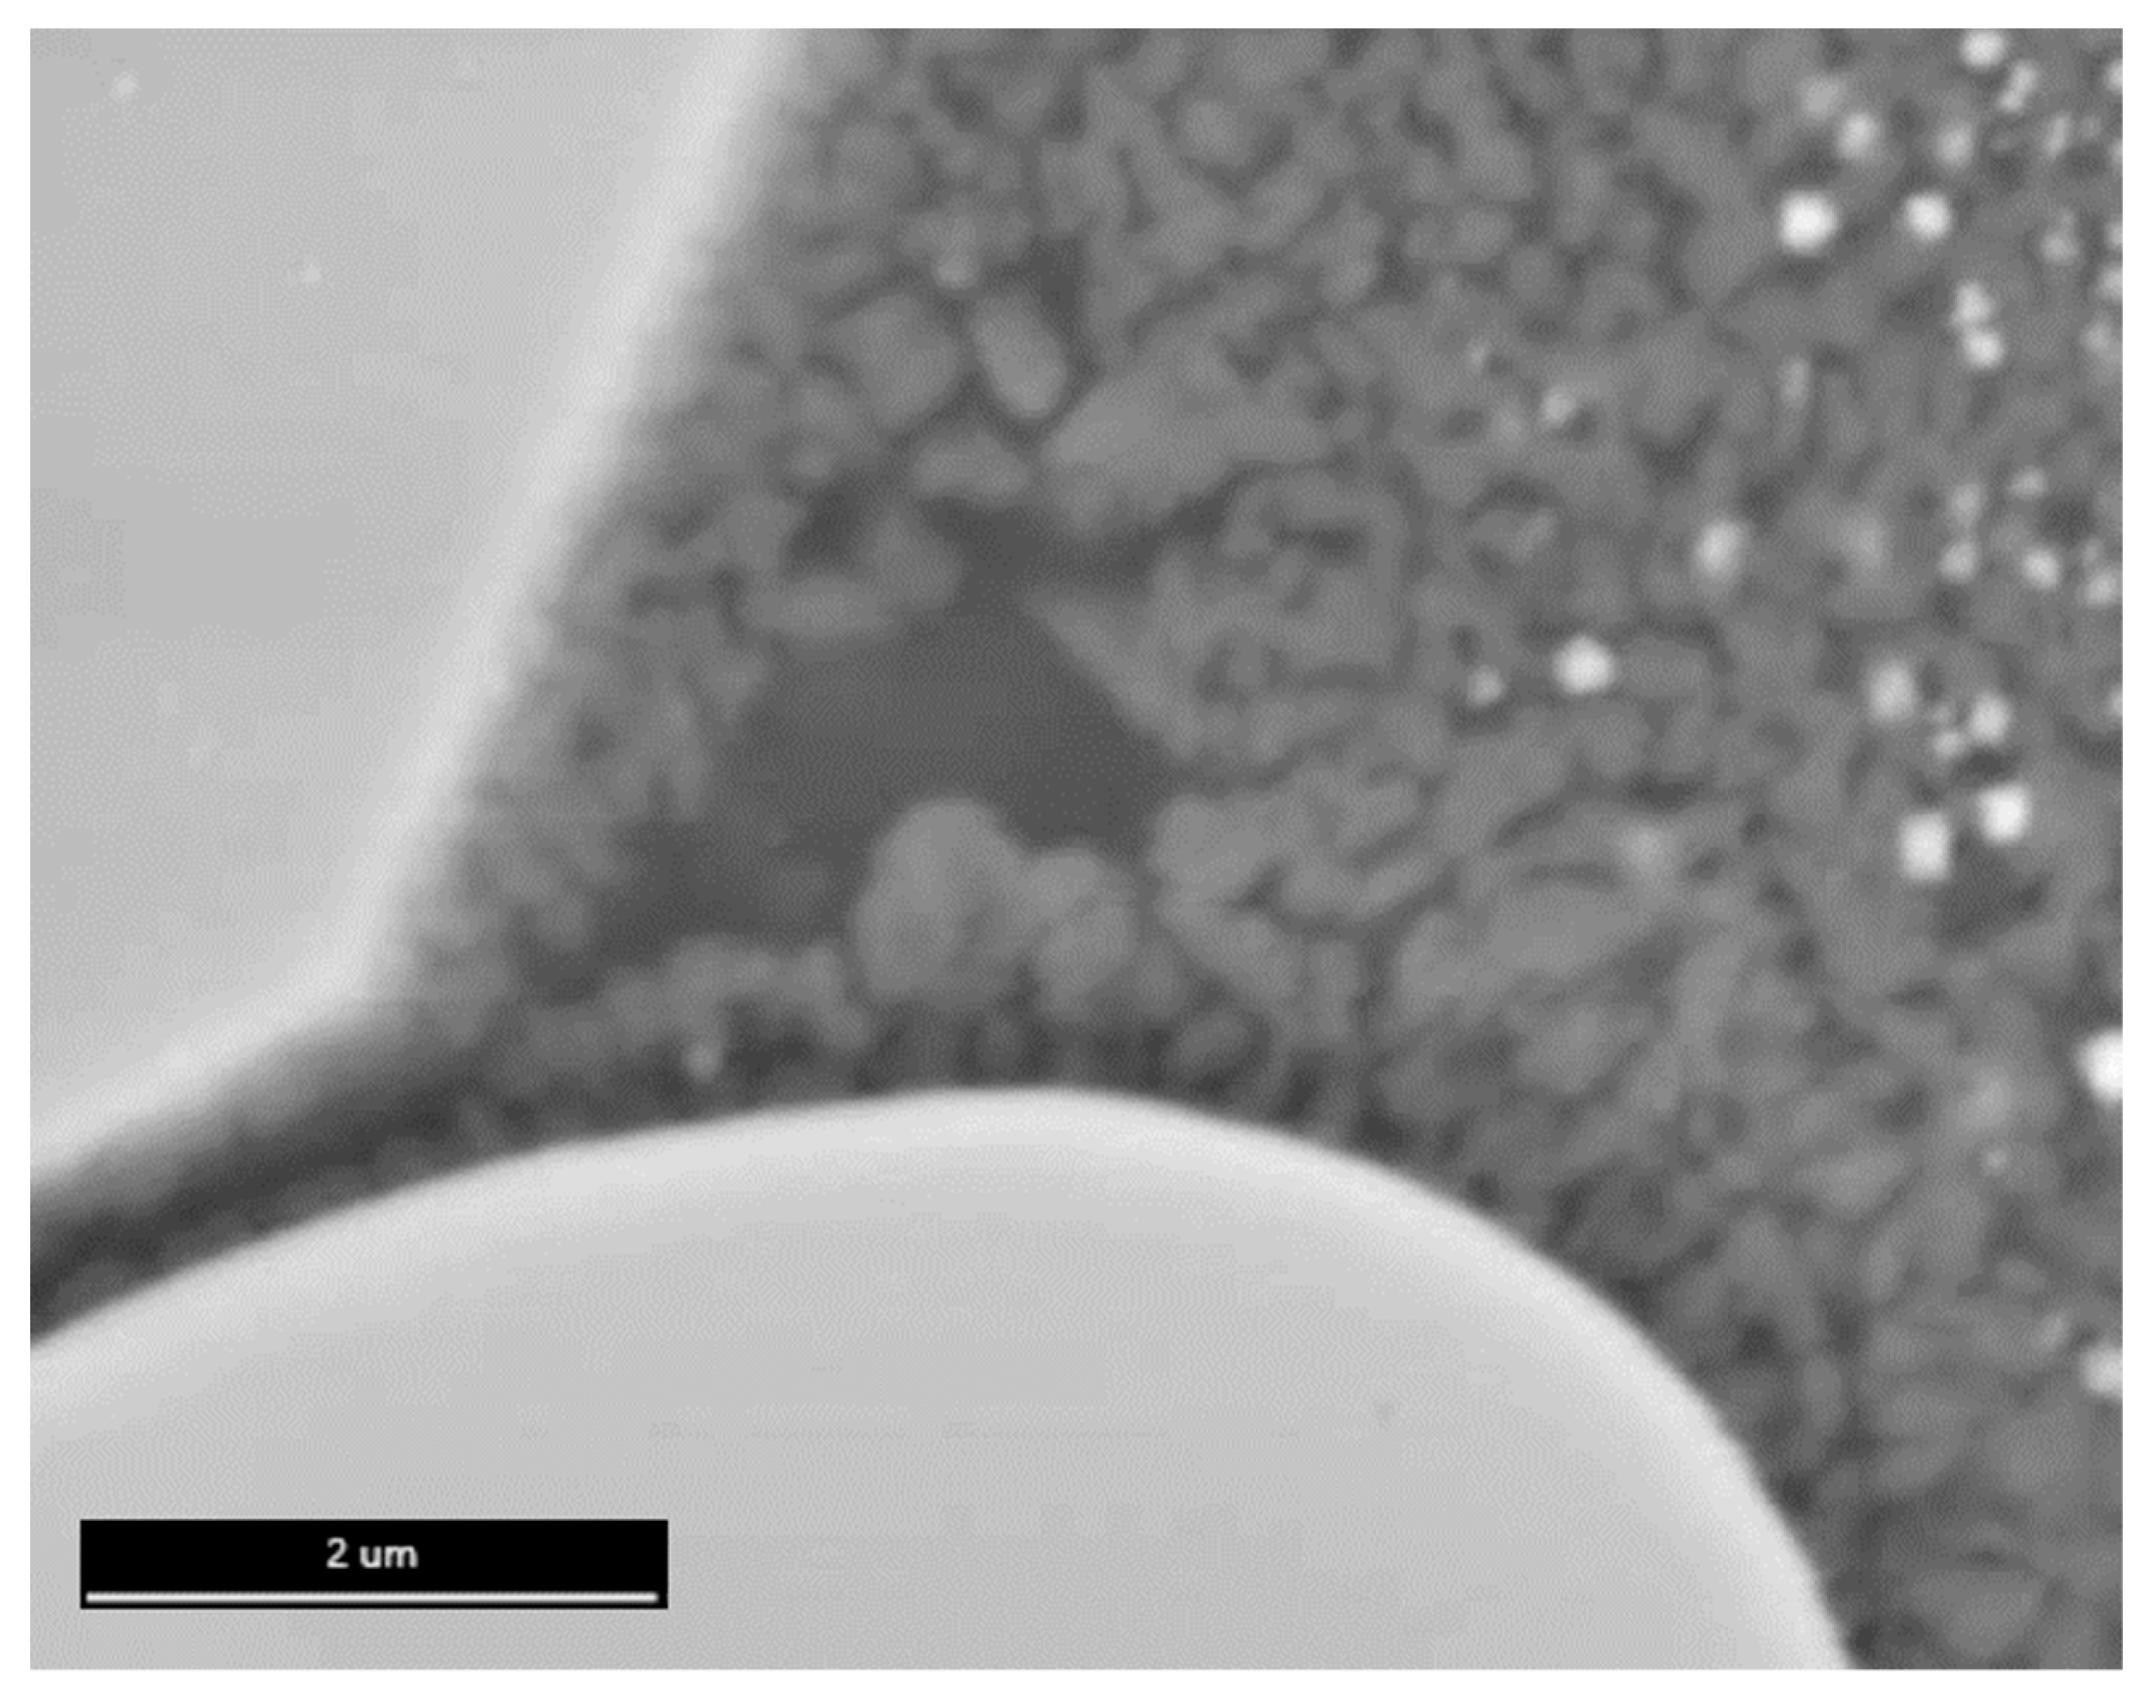
Figure 8 presents an image of a zone containing two “preliminary” spinel crystals and many 0.3–0.6 μm pyroxene P1 crystals growing on them in a preferential direction. The formation of tiny “secondary” spinel and a fine pyroxene P2 phase is also well distinguished in the circumference zone. It is also well seen that the sizes of the “secondary” spinel decrease with increased distance from the diffusion zone.
The EDS mapping highlights that the concentrations of Si, Na and Ca are higher in the diffusion field, while the ones of Fe and Mg are higher into the main matrix, which is in agreement with EDS data for both P1 and P2 pyroxenes from Figure 7. It was also confirmed that the amount of Cr outside of the “preliminary” spinel is negligible, so the “secondary” spinel phase (S2) has a composition close to that of magnetite.
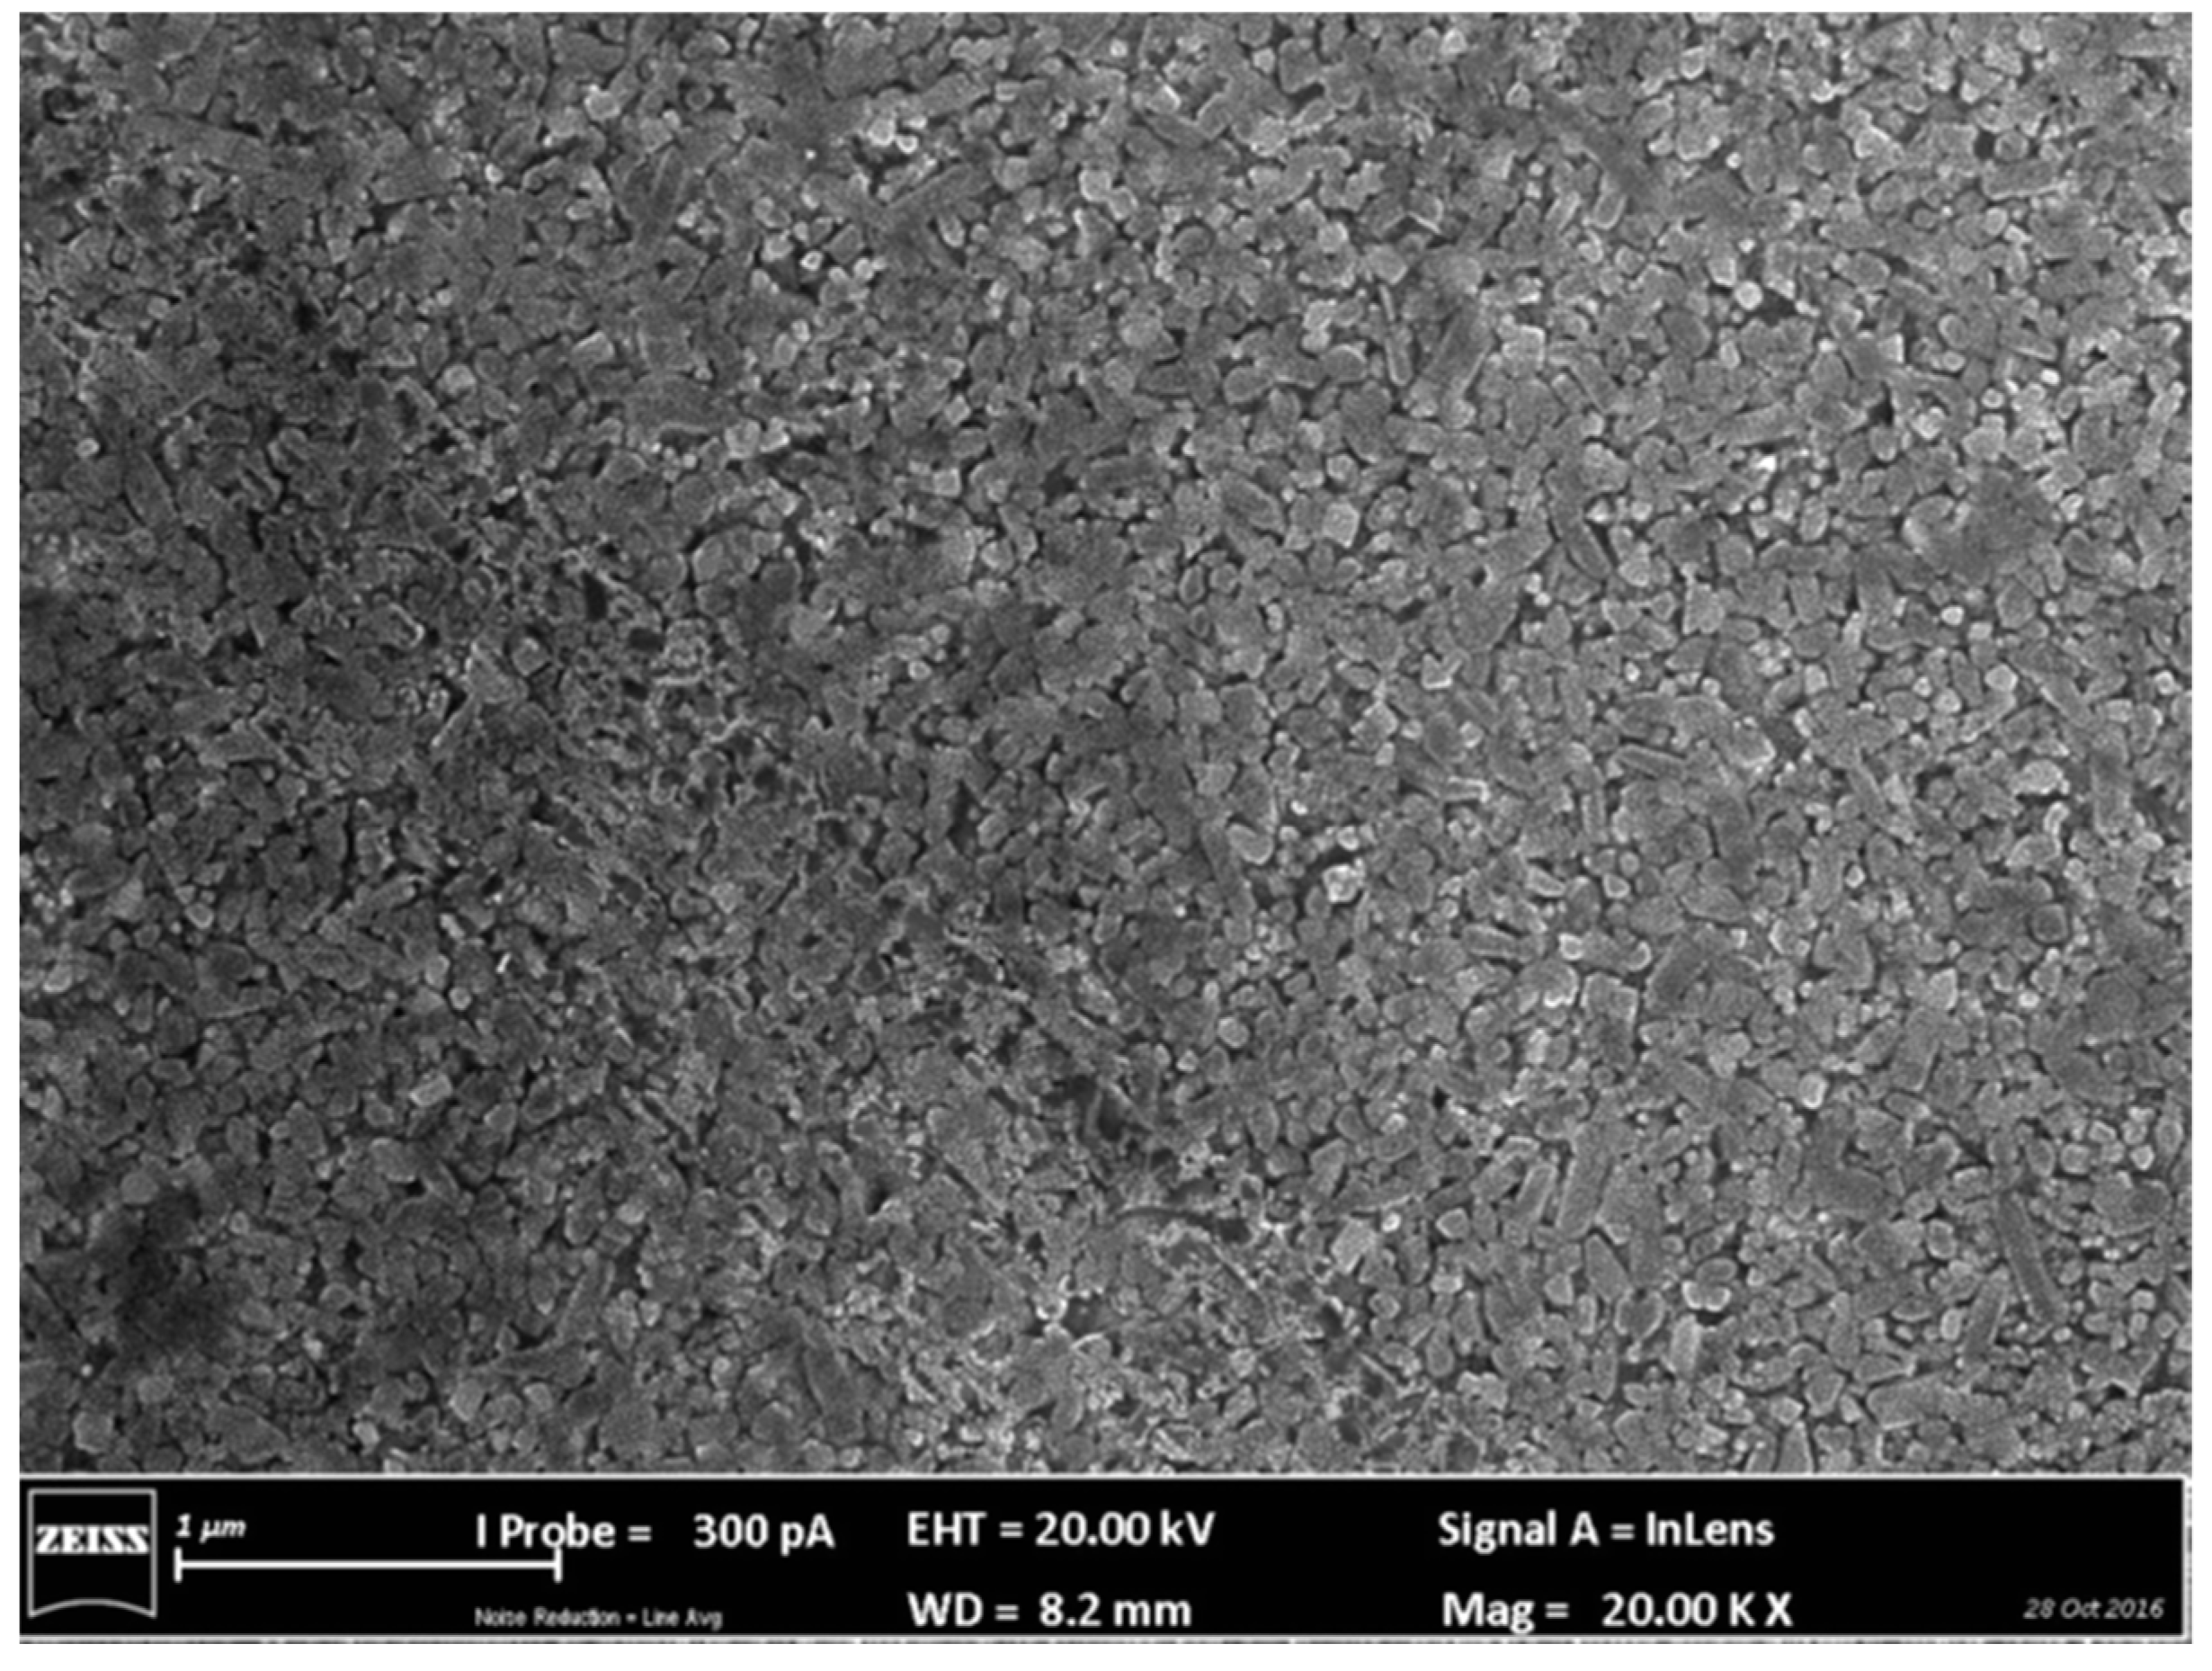
The main structure of sample GC60-60 (i.e., the part free from “preliminary” spinel), where P2 is the predominate crystal phase, is shown in Figure 9. It highlights the high degree of crystallinity of the final glass-ceramic and shows that the size of formed pyroxenes having the typical prismatic attributes is about 200 nm. The additional analysis demonstrates that the number of these pyroxene crystals is 80 ± 15 per µm2. This value is just slightly higher than that of one of the iron-rich drops formed in sample GC60-1, which confirms that the “secondary” spinel phase acts as nucleation agent for the main crystallization process.
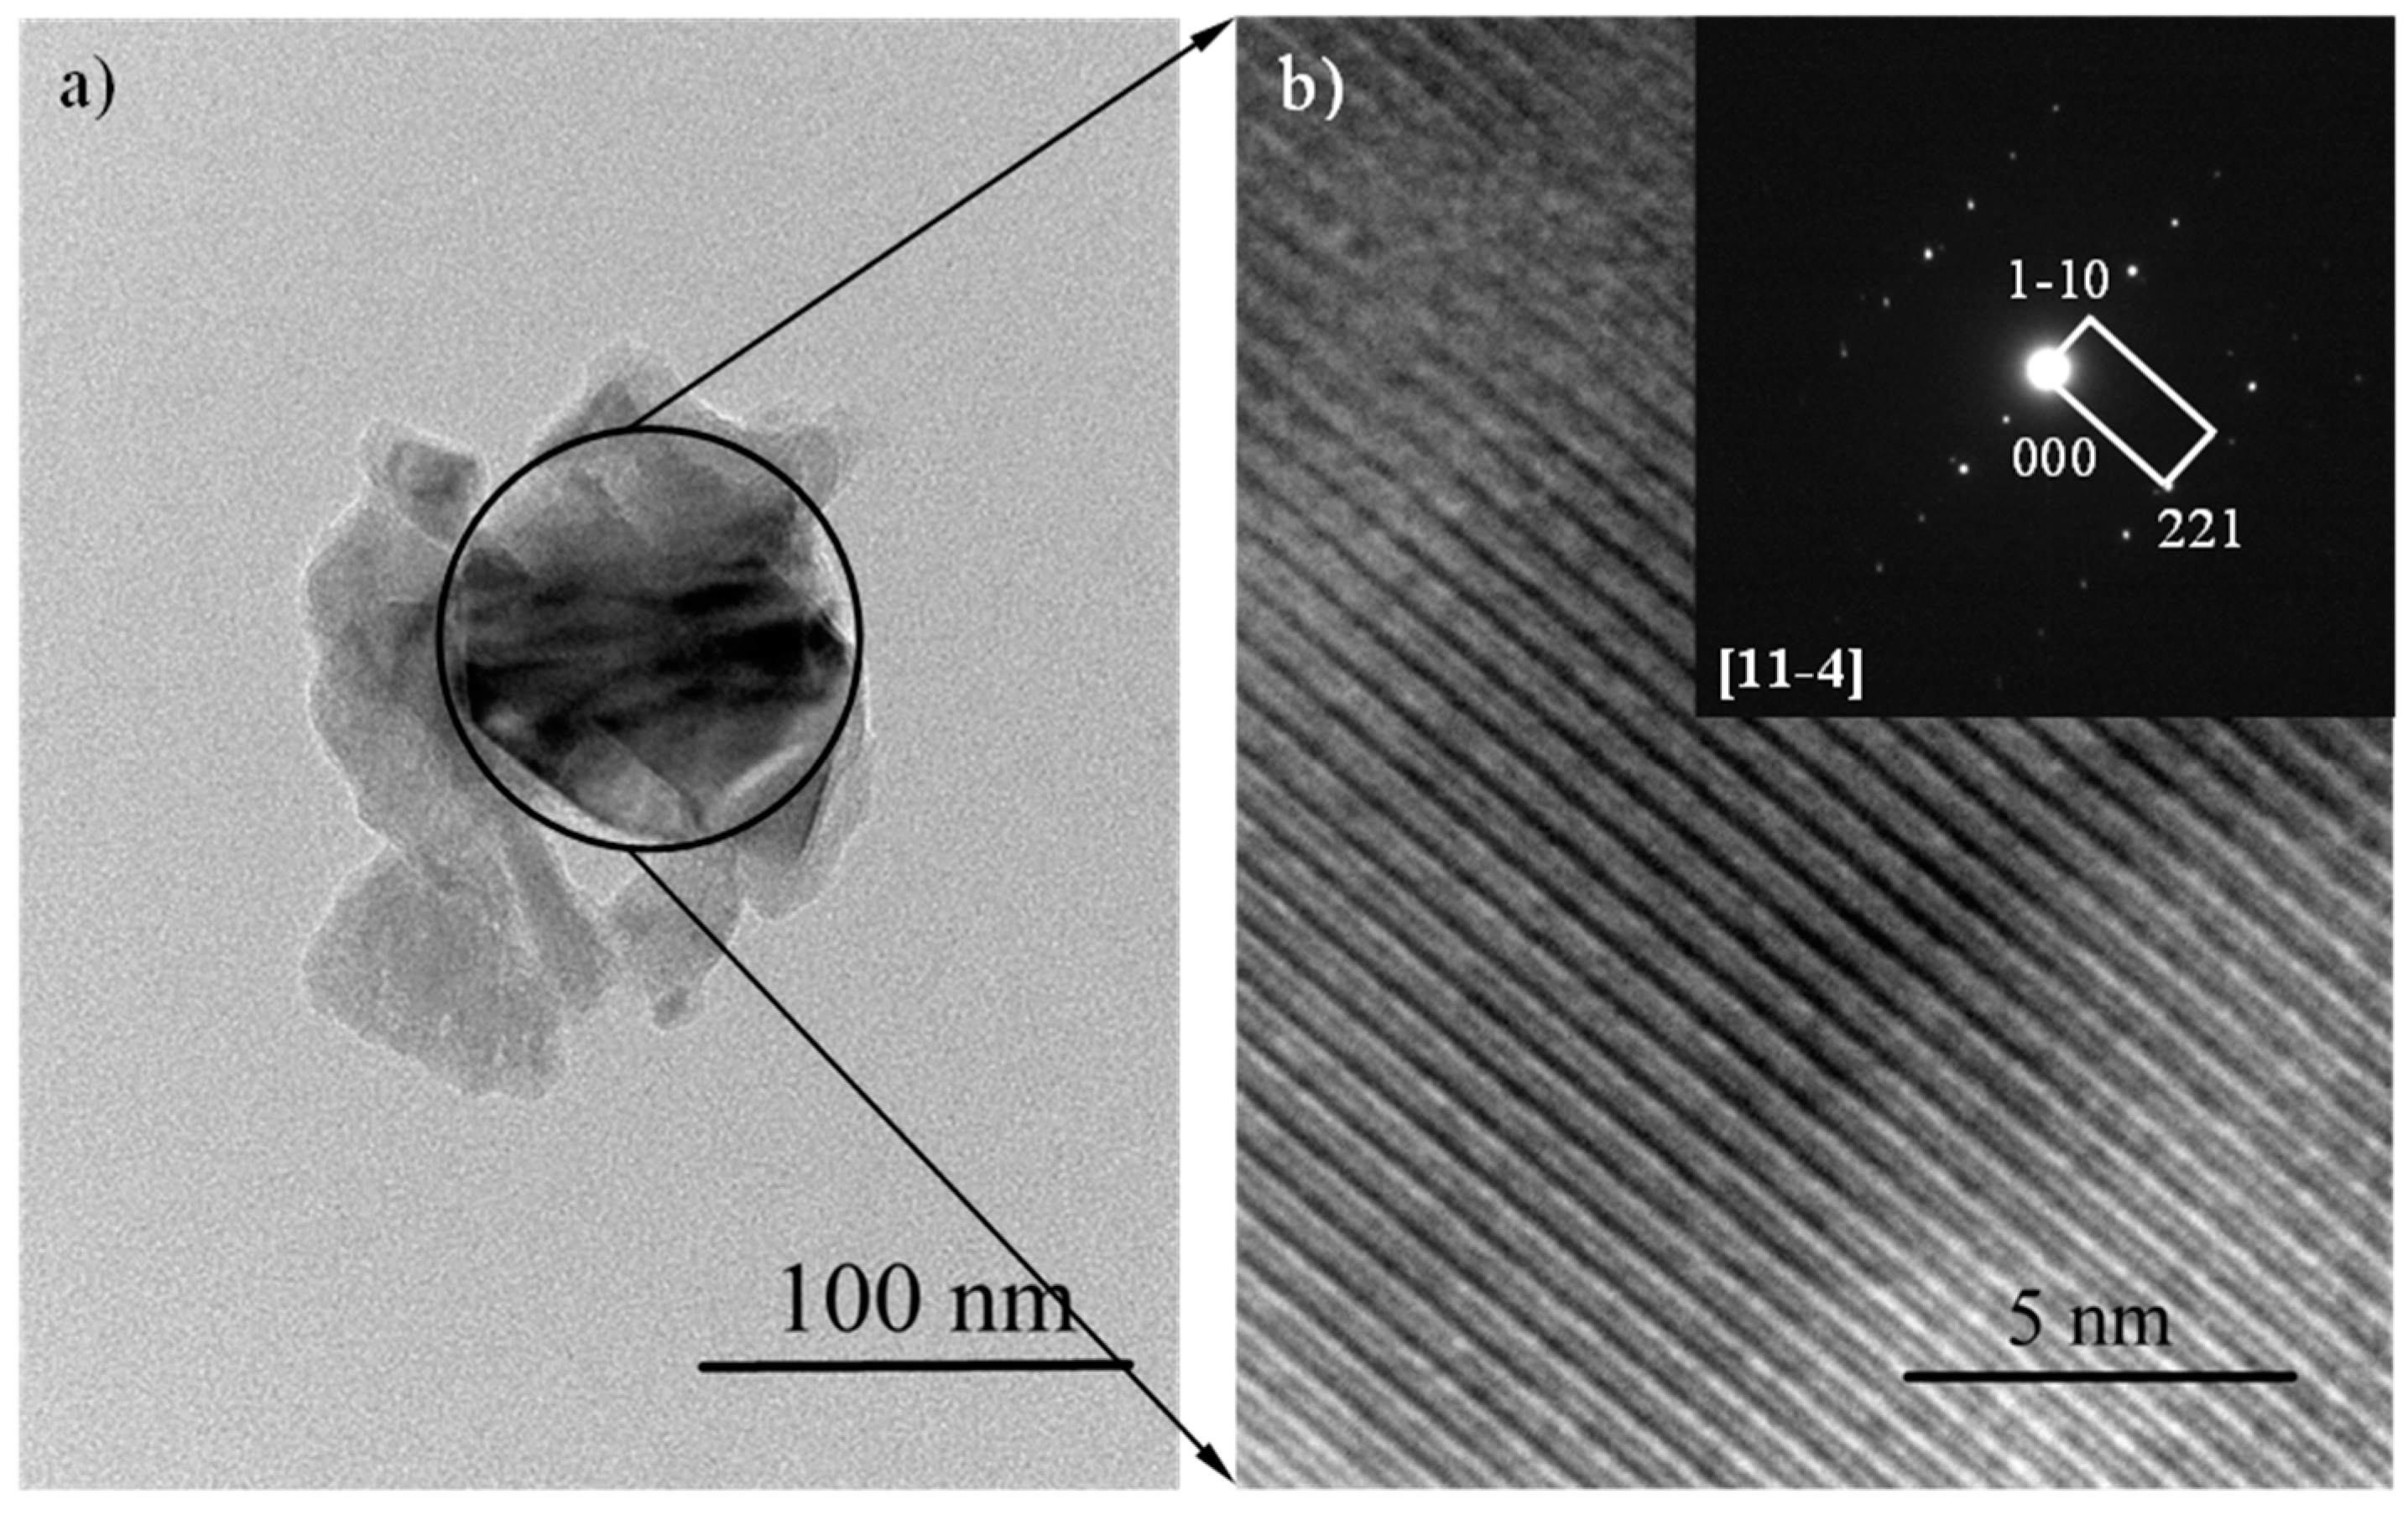
Finally, TEM observation of the final glass-ceramic elucidates that the main P2 phase is composed of mono-crystals. Figure 10 shows a single pyroxene crystal from sample GC60-60, which is embedded in an amorphous glass matrix with lower contrast. The SAED patterns and the HRTEM fringes reveal the single crystalline structure of the particle and its orientation along zone axis /11-4/. The phase identification highlights a monoclinic clinopyroxene with cell parameters a = 9.724, b = 8.875, c = 5.281 and β = 107.24 (PDF 85-1740), which is in an agreement with the XRD data.
4.3. Characteristics of the Final Glass-Ceramic
The main characteristics of the new material were evaluated by different techniques [21]. Here these results are summarized in Table 5, together with the corresponding data for Slagsitalls [24,25], which up to now have been the most-produced glass-ceramics in the world. Slagsitalls were developed in the former Soviet Union by Prof. Kitajgorodski only few years after the discovery of glass-ceramics by Prof. Stookey in “Corning”, New York, in the USA. Their production was mainly based on the use of blast furnace slag from the region of Donbas, Ukraine. In 1966 in the plants of Avtosteklo (Konstantinovka), a manufacturing line with daily capacity of 3000 m2 was started, and by 1980 the entire volume of produced Slagsitall tiles surpassed 15,000,000 m2.
The melting temperatures of the Slagsitalls batches, as well as those of various similar glass-ceramics, were at about 1500–1550 °C, while the nucleation and crystallization temperatures were at about 600–650 and 900–950 °C, respectively; the duration of the crystallization cycle was at about 3–4 h.
Notwithstanding the significantly lower melting and crystallization temperatures, as well as the shorter holding times for melting, nucleation and crystallization, the newly obtained iron-oxide-rich glass-ceramic is characterized by enhanced hardness and bending strength, both of which can be explained by the nano-structure of the material. At the same time, the values for compressive strength and Young’s modulus, which are high enough for a modern building material, are lower than the ones reported for the Slagsitalls. This is a consequence of the non-homogeneous structure of new iron-rich materials due to the precipitation of “preliminary” spinel. Finally, due to the formation of crystal phases as iron rich pyroxenes and spinel, the density of our glass-ceramic is slightly higher, while the coefficient of thermal expansion is moderate, even a little lower than the one reported for the Slagsitalls.
Finally, the TCLP tests of the parent glass and the final glass-ceramics, reported in Table 2, demonstrate that the new material is completely inert. In fact, the measured concentrations of heavy metals are two to four orders of magnitude lower than those of the corresponding values for the initial residues.
5. Conclusions
The studied glass-ceramic is obtained by using only waste raw materials, mainly those from ferronickel production. The parent glass is easily melted at a relatively low temperature, while a short and low-cost thermal cycle can be used to obtain material with nano-crystalline structure and with improved properties.
The crystallization process is peculiar, resulting in a complex and intriguing structure of the final glass-ceramic. The phase formation practically begins during the cooling of the melt, with the precipitation of preliminary Fe-Mg-Cr spinel crystals, which subsequently act as centers for the growth of a pyroxene phase. In this manner, a part of the glass-ceramic’s internal structure is formed.
However, the main part of the structure of the final glass-ceramic (which is approximatively 80–85 vol %) is formed after binodal liquid–liquid immiscibility of the main glassy phase, leading to the formation of very tiny secondary magnetite spinel and then to final crystallization of a new pyroxene phase composed of mono crystals with sizes of 150–200 nm.
The new glass-ceramic is characterized as being highly chemically resistant, and as having very good exploitation properties.
Funding
This research received no external funding.
Informed Consent Statement
Informed consent was obtained from all subjects involved in the study.
Data Availability Statement
Data is unavailable.
Acknowledgments
The author expresses thanks to Perica Paunović, Alexandra Kamusheva, Ejup Ljatifi, Emilia Karamanova, Bogdan Ranguelov, Georgi Avdeev, Anita Grozdanov, Goran Nacevski and Daniela Karashanova, who are his co-workers in this complex research, as well as for the support given by project BG05M2OP001-1.002-0019 “Clean Technologies for Sustainable Environment—Water, Waste, Energy for Circular Economy”.
Conflicts of Interest
The authors declare no conflict of interest.
References
- Donald, I.W. Waste Immobilization in Glass and Ceramic Based Hosts: Radioactive, Toxic, and Hazardous Wastes; John Wiley & Sons: Hoboken, NJ, USA, 2010. [Google Scholar]
- Rawlings, R.D.; Wu, J.; Boccaccini, A.R. Glass-ceramics: Their production from wastes—A Review. J. Mater. Sci. 2006, 41, 733–761. [Google Scholar] [CrossRef]
- Colombo, P.; Brusatin, G.; Bernardo, E.; Scarinci, G. Inertization and reuse of waste materials by vitrification and fabrication of glass-based products. Curr. Opin. Solid State Mater. Sci. 2003, 7, 225–239. [Google Scholar] [CrossRef]
- Chinnam, R.; Francis, A.; Will, J.; Bernardo, E.; Boccaccini, A. Functional glasses and glass-ceramics derived from iron rich waste and combination of industrial residues. J. Non-Cryst. Solids 2013, 365, 63–74. [Google Scholar] [CrossRef]
- Karamanov, A.; Pelino, M. Crystallization phenomena in iron-rich glasses. J. Non-Cryst. Solids 2001, 281, 139–151. [Google Scholar] [CrossRef]
- Romero, M.; Rincon, J.M. Preparation and properties of high iron oxide content glasses obtained from industrial wastes. J. Europ. Ceram. Soc. 1998, 18, 153–160. [Google Scholar] [CrossRef]
- Kavouras, P.; Kehagias, T.; Tsilika, I.; Kaimakamis, G.; Chrissafis, K.; Kokkou, S.; Papadopoulos, D.; Karakostas, T. Glass-ceramic materials from electric arc furnace dust. J. Hazard. Mater. 2007, 139, 424–429. [Google Scholar] [CrossRef] [PubMed]
- Ferreira, E.B.; Zanotto, E.D.; Scudeller, L.A.M. Glass and glass-ceramic from basic oxygen furnace (BOF) slag. Glass Sci. Technol. 2002, 75, 75–86. [Google Scholar]
- Karamanov, A.; Schabbach, L.M.; Karamanova, E.; Andreola, F.; Barbieri, L.; Ranguelov, B.; Avdeev, G.; Lancellotti, I. Sinter-crystallization in air and inert atmospheres of a glass from pre-treated municial solid waste bottom ashes. J. Non-Cryst. Solids 2014, 389, 50–59. [Google Scholar] [CrossRef]
- EULIT—Tiles of Cast Basalt. Available online: https://www.eutit.com/ (accessed on 10 May 2023).
- Khater, G. Influence of Cr2O3, LiF, CaF2 and TiO2 nucleants on the crystallization behavior and microstructure of glass-ceramics based on blast-furnace slag. Ceram. Int. 2011, 37, 2193–2199. [Google Scholar] [CrossRef]
- Karamanov, A.; Pisciella, P.; Pelino, M. The effect of Cr2O3 as a nucleating agent in iron-rich glass-ceramics. J. Eur. Ceram. Soc. 1999, 19, 2641–2645. [Google Scholar] [CrossRef]
- Marghousian, V.K.; Arjomandnia, S. Effect of Cr2O3 on Nucleation of SiO2-Al2O3-CaO-MgO-(R2O,Fe2O3,TiO2). Glass-Ceram. Phys. Chem. Glasses 1998, 39, 246–251. [Google Scholar]
- Sørensen, P.; Pind, M.; Yue, Y.; Rawlings, R.; Boccaccini, A.; Nielsen, E. Effect of the redox state and concentration of iron on the crystallization behavior of iron-rich aluminosilicate glasses. J. Non-Cryst. Solids 2005, 351, 1246–1253. [Google Scholar] [CrossRef]
- Barbieri, L.; Leonelli, C.; Manfredini, T.; Pellacani, G.C.; Siligardi, C.; Tondello, E.; Bertoncello, R. Solubility, Reactivity and Nucleation Effect of Cr2O3 in the CaO-MgO-Al2O3-SiO2 glassy system. J. Mater. Sci. 1994, 29, 6273–6280. [Google Scholar] [CrossRef]
- Ballesteros-Elizondo, S.; Parga-Torres, J.R.; Rincón-López, J.M.; Palacios-González, E. Transmission Electron Microscopy (TEM) Through Focused ION Beam (FIB) from Vitrified Chromium Wastes. J. Appl. Res. Technol. 2011, 9, 242–248. [Google Scholar] [CrossRef]
- Ballesteros, S.; Rincón, J.; Rincón-Mora, B.; Jordán, M. Vitrification of urban soil contamination by hexavalent chromium. J. Geochem. Explor. 2017, 174, 132–139. [Google Scholar] [CrossRef]
- Elizondo, S.B.; Rincón, J.M. Microstructure and Microanalysis of Porous Glass Obtained by Sintering of Vitreous Powders from Cr-Ni Sludge. Microsc. Microanal. 2011, 17, 1904. [Google Scholar] [CrossRef]
- Karamanov, A.; Paunović, P.; Kamusheva, A.; Ljatifi, E.; Karamanova, E.; Ranguelov, B.; Avdeev, G.; Grozdanov, A.; Karashanova, D. Synthesis, Structure and Properties of Glass-Ceramic by Fe-Ni Wastes. In Vitrogeowastes; Jordan, M.M., Pinet, O., Ma, J., Eds.; Rinconp.UMH: Elche, Spain, 2019. [Google Scholar]
- Ljatifi, E.; Kamusheva, A.; Grozdanov, A.; Paunović, P.; Karamanov, A. Optimal thermal cycle for production of glass-ceramic based on wastes from ferronickel manufacture. Ceram. Int. 2015, 41, 11379–11386. [Google Scholar] [CrossRef]
- Karamanov, A.; Paunović, P.; Ranguelov, B.; Ljatifi, E.; Kamusheva, A.; Načevski, G.; Karamanova, E.; Bogoevski, S. Vitrification of hazardous Fe-Ni wastes into glass-ceramic with fine crystalline structure and elevated exploitation characteristics. J. Environ. Chem. Eng. 2017, 5, 432–441. [Google Scholar] [CrossRef]
- Karamanov, A.; Kamusheva, A.; Karashanova, D.; Ranguelov, B.; Avdeev, G. Structure of glass-ceramic from Fe-Ni wastes. Mater. Lett. 2018, 223, 86–89. [Google Scholar] [CrossRef]
- EN 12457-2; Characterization of Waste. Leaching Compliance Test for Leaching of Granular Waste Materials and Sludge. European Committee for Standardization (CEN): Brussels, Belgium, 2002.
- Strnad, Z. Glass-Ceramic Materials; Elsevier: Amsterdam, The Netherlands, 1986. [Google Scholar]
- Pavlushkin, N.M. Chemical Technology of Glass and Glass-Ceramics; Strojizdat: Moscow, Russia, 1983. (In Russian) [Google Scholar]
Figure 1.
Modern petrurgical basalt tiles (a) and ancient Roman road with that natural basaltic slabs (b).
Figure 1.
Modern petrurgical basalt tiles (a) and ancient Roman road with that natural basaltic slabs (b).

Figure 2.
DTA (solid lines) and TG (dashed lines) curves of powder sample and non-nucleated and nucleated bulk samples at 20 °C/min.
Figure 2.
DTA (solid lines) and TG (dashed lines) curves of powder sample and non-nucleated and nucleated bulk samples at 20 °C/min.

Figure 3.
XRD patterns of parent glass (a) and nucleated samples, crystallized for 1 min (b), 5 min (c) and 60 min (d) at 730 °C.
Figure 3.
XRD patterns of parent glass (a) and nucleated samples, crystallized for 1 min (b), 5 min (c) and 60 min (d) at 730 °C.

Figure 4.
SEM images of sample GC0-1 at low magnification (a) and sample GC60-1 at high magnification (b).
Figure 4.
SEM images of sample GC0-1 at low magnification (a) and sample GC60-1 at high magnification (b).

Figure 5.
SEM images at high magnification of zones free of “preliminary” spinel for samples GC0-1 (a) and GC60-1 (b).
Figure 5.
SEM images at high magnification of zones free of “preliminary” spinel for samples GC0-1 (a) and GC60-1 (b).

Figure 6.
BF TEM of flake of parent glass (a) and area of sample GC60-1 with the corresponding SAED as inset (b).
Figure 6.
BF TEM of flake of parent glass (a) and area of sample GC60-1 with the corresponding SAED as inset (b).

Figure 7.
SEM image of sample GC0-60 with EDS spectra of formed-crystal phases S1, P1 and P2.

Figure 8.
FESEM images of sample GC60-60, showing a zone around preliminary S1 spinel crystals.

Figure 9.
FESEM images of sample GC60-60, showing the main structure of glass-ceramic, free of “preliminary spinel”.
Figure 9.
FESEM images of sample GC60-60, showing the main structure of glass-ceramic, free of “preliminary spinel”.

Figure 10.
BF TEM of single P2 crystal (a) and HRTEM from the area in the circle with the corresponding SAED as inset (b).
Figure 10.
BF TEM of single P2 crystal (a) and HRTEM from the area in the circle with the corresponding SAED as inset (b).


Table 1.
Chemical composition (wt %) of the main slag from an electro-furnace (EFS), dust (D), converter slag (CS), obtained waste mixture (WM), glass cullet (GC) and studied glass (WG).
Table 1.
Chemical composition (wt %) of the main slag from an electro-furnace (EFS), dust (D), converter slag (CS), obtained waste mixture (WM), glass cullet (GC) and studied glass (WG).
| Wastes | ||||||
|---|---|---|---|---|---|---|
| EFS | D | CS | WM | GC | WG | |
| wt % | 56 | 7 | 7 | 70 | 30 | 100 |
| SiO2 | 53.0 | 41.1 | 1.4 | 47.8 | 71.7 | 55.2 |
| Al2O3 | 2.0 | 2.8 | 0.3 | 1.9 | 0.6 | 1.5 |
| MgO | 16.9 | 16.0 | 4.2 | 15.9 | 3.3 | 12.1 |
| CaO | 2.4 | 2.5 | 15.4 | 3.5 | 9.8 | 5.4 |
| Cr2O3 | 2.5 | 1.1 | 0.2 | 2.2 | - | 1.5 |
| CoO | 0.1 | 0.1 | 0.1 | 0.1 | - | 0.1 |
| NiO | 0.1 | 3.2 | 0.5 | 0.3 | - | 0.2 |
| Fe2O3 | 14.0 | 33.2 | 59.4 | 19.5 | - | 14.6 |
| FeO | 9.0 | - | 18.5 | 8.8 | - | 5.0 |
| Na2O | - | - | - | - | 13.3 | 4.0 |
| K2O | - | - | - | - | 1.3 | 0.4 |
Table 2.
Concentration of the heavy metals in the solution after TCLP test (mg L−1).
| D | EFS | CS | WG | GC | Applied Limits [23] | |
|---|---|---|---|---|---|---|
| Fe | 1 | 202 | 1155 | 0.416 | 0.26 | |
| Ni | 6.1 | 2.7 | 19.2 | 0.311 | 0.1 | 1 |
| Co | 0.4 | 0.14 | 1.1 | <0.005 | <0.005 | 2 |
| Cd | <0.005 | <0.005 | <0.005 | <0.005 | <0.005 | 0.02 |
| Cu | 0.15 | 0.093 | 0.07 | 0.011 | 0.042 | 5 |
| Mn | 4.7 | 14.6 | 1.5 | <0.005 | <0.005 | |
| Pb | 0.026 | 0.031 | 0.086 | 0.017 | <0.005 | 1 |
| Zn | 3.6 | 0.29 | 0.42 | <0.005 | 0.006 | 5 |
| Cr | 0.22 | 1.1 | 2.9 | <0.005 | <0.005 | 1.0 |
| As | 1.2 | 0.011 | 0.18 | 0.009 | 0.003 | 0.2 |
Table 3.
Crystallization peak temperatures (Tp) and ΔT as functions of the holding temperature (T0) and the holding time (τ).
Table 3.
Crystallization peak temperatures (Tp) and ΔT as functions of the holding temperature (T0) and the holding time (τ).
| T0 (°C) | Tp (°C) | ΔT | τ (min) | Tp (°C) | ΔT |
|---|---|---|---|---|---|
| τ—60 min | T0—650 °C | ||||
| 585 | 798.0 | −0.4 | 0 | 797.6 | |
| 600 | 797.8 | −0.2 | 20 | 793.2 | 4.4 |
| 615 | 793.2 | 4.4 | 30 | 789.4 | 8.2 |
| 630 | 787.1 | 10.5 | 45 | 785.8 | 11.8 |
| 650 | 786.2 | 11.4 | 60 | 786.2 | 11.4 |
| 670 | 793.1 | 3.5 | 90 | 787.1 | 10.1 |
Table 4.
(a) Density difference (Δρ) and % crystal phase formed as a function of the holding time (τ) at 730 °C. (b) Density difference (Δρ) and % crystal phase formed as a function of the temperature (T0) at holding time of 5 min.
Table 4.
(a) Density difference (Δρ) and % crystal phase formed as a function of the holding time (τ) at 730 °C. (b) Density difference (Δρ) and % crystal phase formed as a function of the temperature (T0) at holding time of 5 min.
| (a) | ||||
| Non-Nucleated Sample | Nucleated Sample | |||
| τ | Δρ | % Crystal Phase | Δρ | % Crystal Phase |
| 1 | 0.02 | 4 | 0.02 | 4 |
| 5 | 0.07 | 14 | 0.13 | 25 |
| 20 | 0.19 | 37 | 0.26 | 53 |
| 60 | 0.22 | 42 | 0.29 | 59 |
| 120 | 0.25 | 47 | 0.30 | 62 |
| (b) | ||||
| Non-Nucleated Sample | Nucleated Sample | |||
| T0 | Δρ | % Crystal Phase | Δρ | % Crystal Phase |
| 710 | 0.02 | 4 | 0.01 | 2 |
| 730 | 0.07 | 14 | 0.13 | 25 |
| 750 | 0.22 | 42 | 0.24 | 46 |
| 770 | 0.23 | 43 | 0.26 | 53 |
Table 5.
Properties of final glass-ceramic (GC) and Slagsitalls (SS).
| Properties | GC | SS |
|---|---|---|
| Density (g/cm3) | 3.16 ± 0.01 | 2.6–2.8 |
| Coefficient of thermal expansion (10−7/C) | 70.8± 0.1 | 60–95 |
| Bending strength (MPa) | 120 ± 8 | 90–130 |
| Compressive strength (MPa) | 250 ± 17 | 250–500 |
| Young’s modulus (GPa) | 40 ± 2 | 60–90 |
| Hardness (GPa) | 9.0 ± 0.2 | 6–8 |
Disclaimer/Publisher’s Note: The statements, opinions and data contained in all publications are solely those of the individual author(s) and contributor(s) and not of MDPI and/or the editor(s). MDPI and/or the editor(s) disclaim responsibility for any injury to people or property resulting from any ideas, methods, instructions or products referred to in the content. |
© 2023 by the author. Licensee MDPI, Basel, Switzerland. This article is an open access article distributed under the terms and conditions of the Creative Commons Attribution (CC BY) license (https://creativecommons.org/licenses/by/4.0/).
Share and Cite
MDPI and ACS Style
Karamanov, A. Glass Ceramic with Improved Structure and Properties Made with Wastes from FeNi Production. Appl. Sci. 2023, 13, 6206. https://doi.org/10.3390/app13106206
AMA Style
Karamanov A. Glass Ceramic with Improved Structure and Properties Made with Wastes from FeNi Production. Applied Sciences. 2023; 13(10):6206. https://doi.org/10.3390/app13106206
Chicago/Turabian StyleKaramanov, Alexander. 2023. "Glass Ceramic with Improved Structure and Properties Made with Wastes from FeNi Production" Applied Sciences 13, no. 10: 6206. https://doi.org/10.3390/app13106206
Note that from the first issue of 2016, this journal uses article numbers instead of page numbers. See further details here.