
Measurement of Air Layer Thickness under Multi-Angle Incidence Conditions Based on Ultrasonic Resonance Reflection Theory for Flange Fasteners

Abstract
:1. Introduction
2. Establishment of the Mathematical Model
3. Establishment of the Finite Element Model and Simulation Results
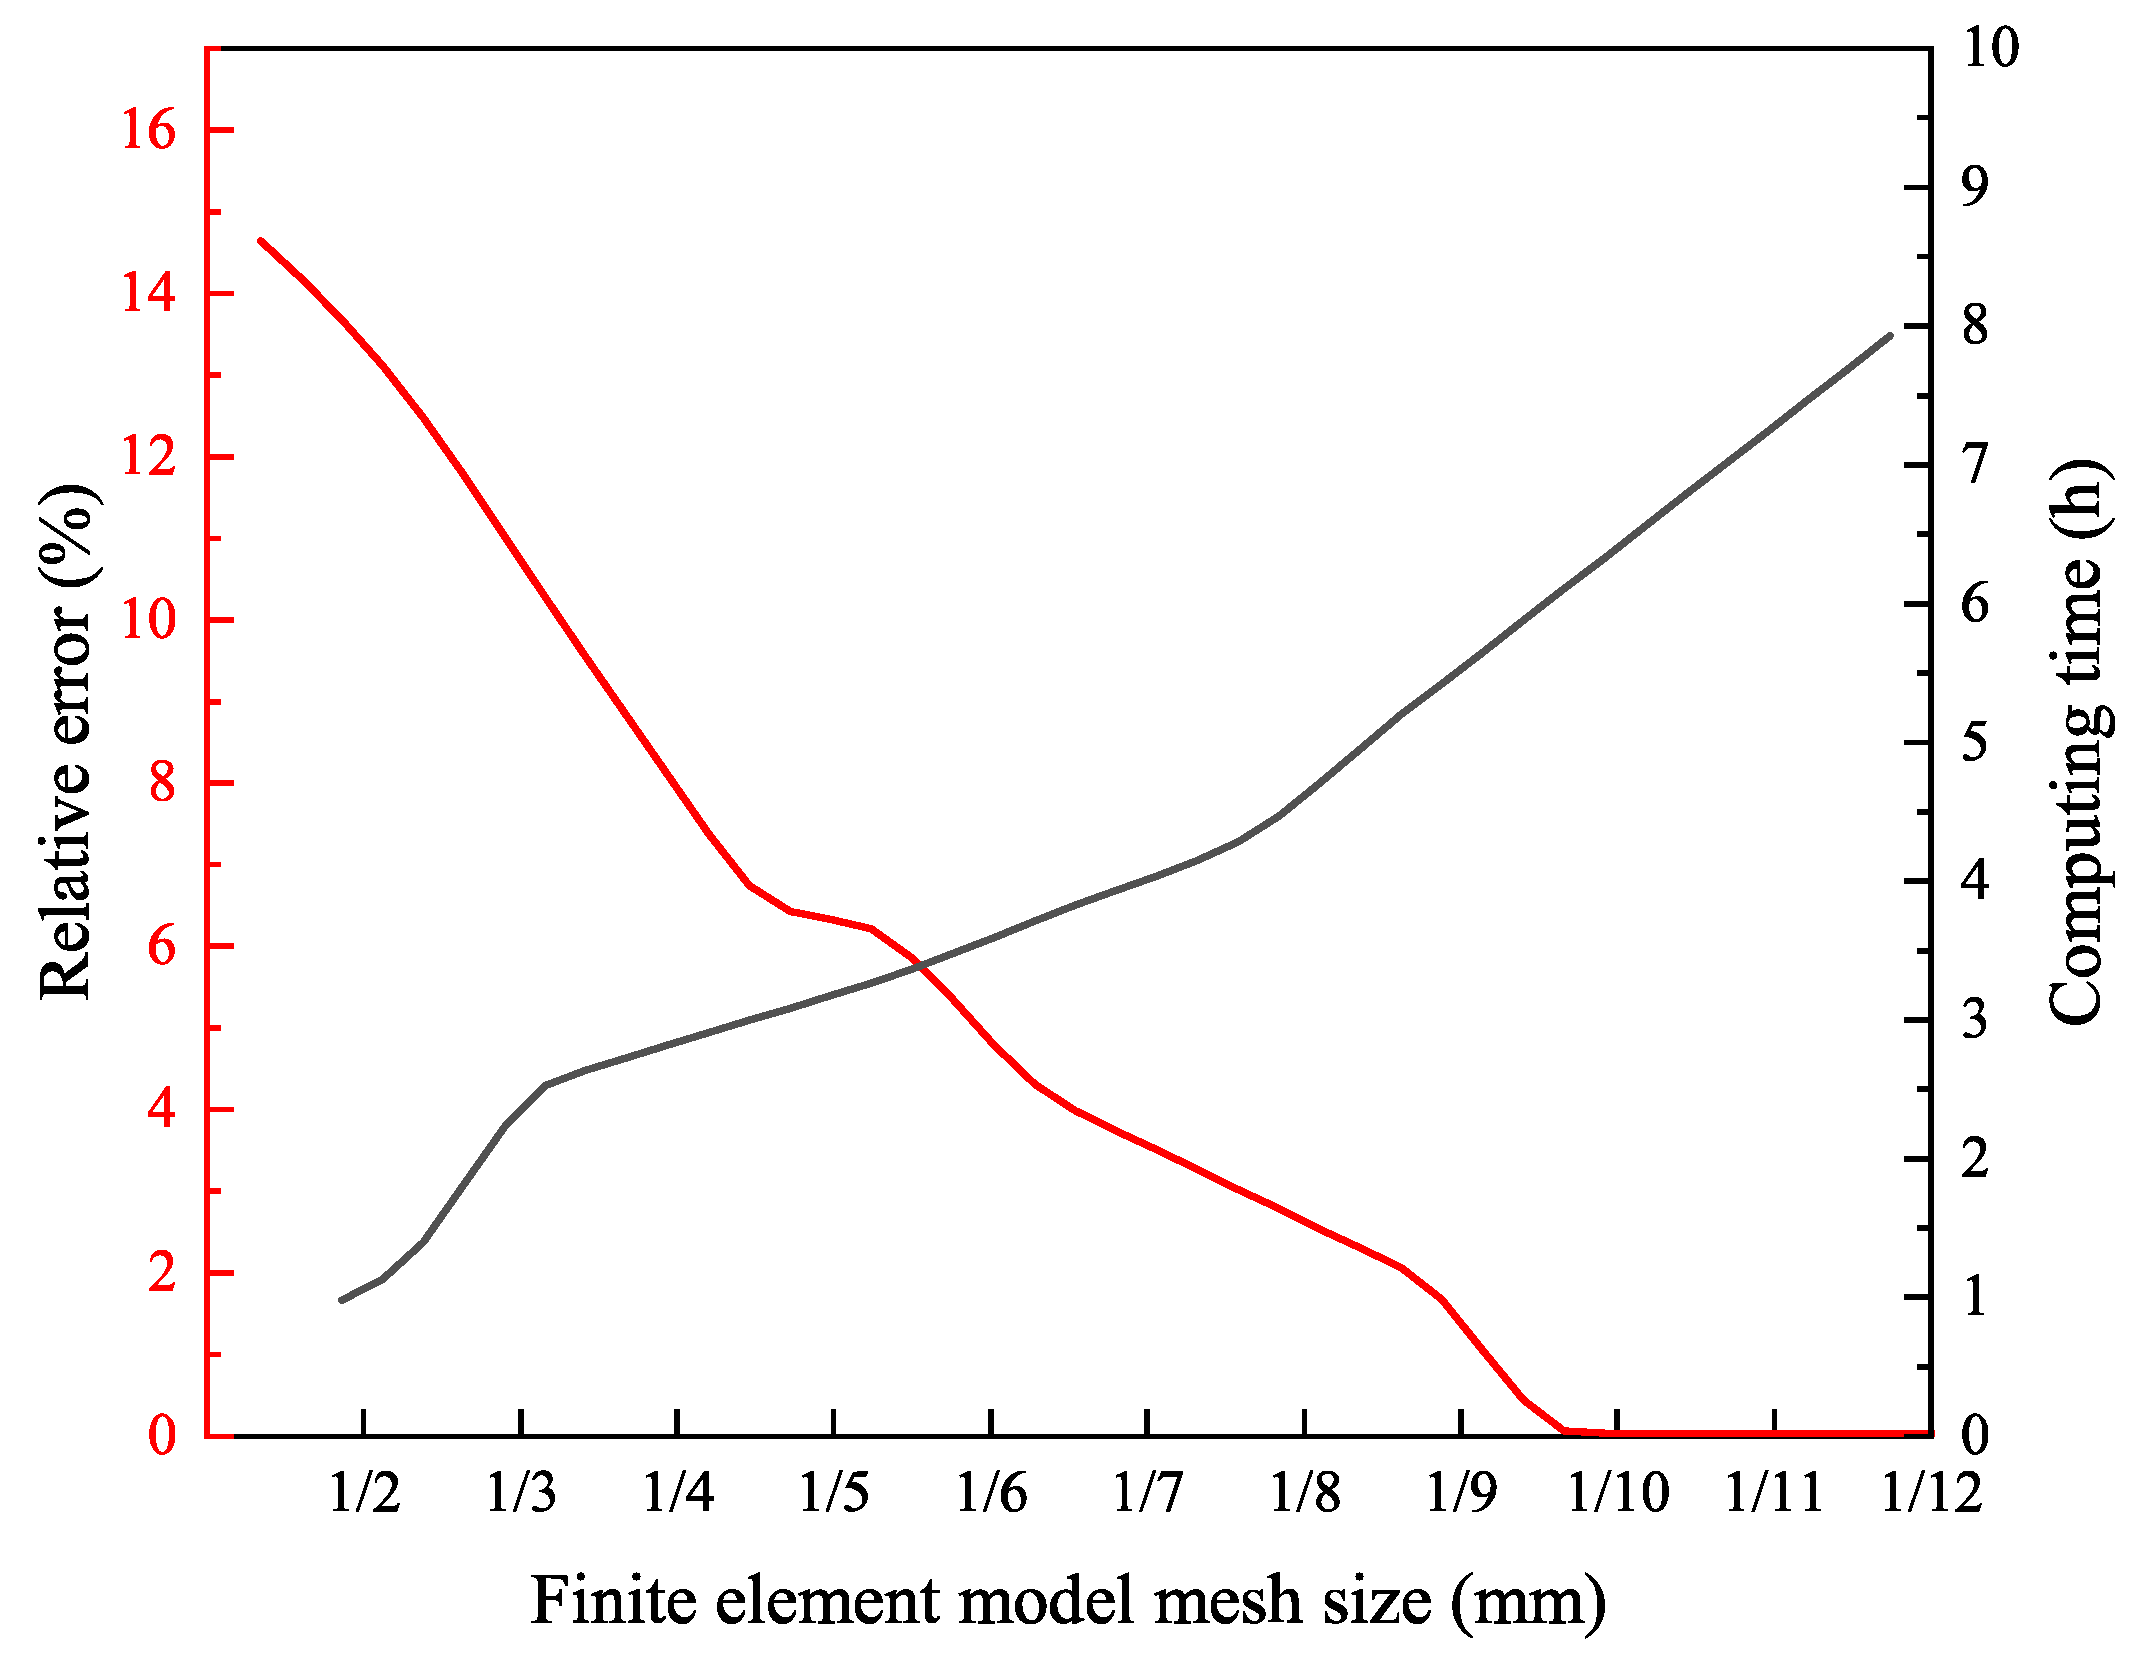
3.1. Establishment of the Finite Element Model
3.2. Finite Element Simulation Results
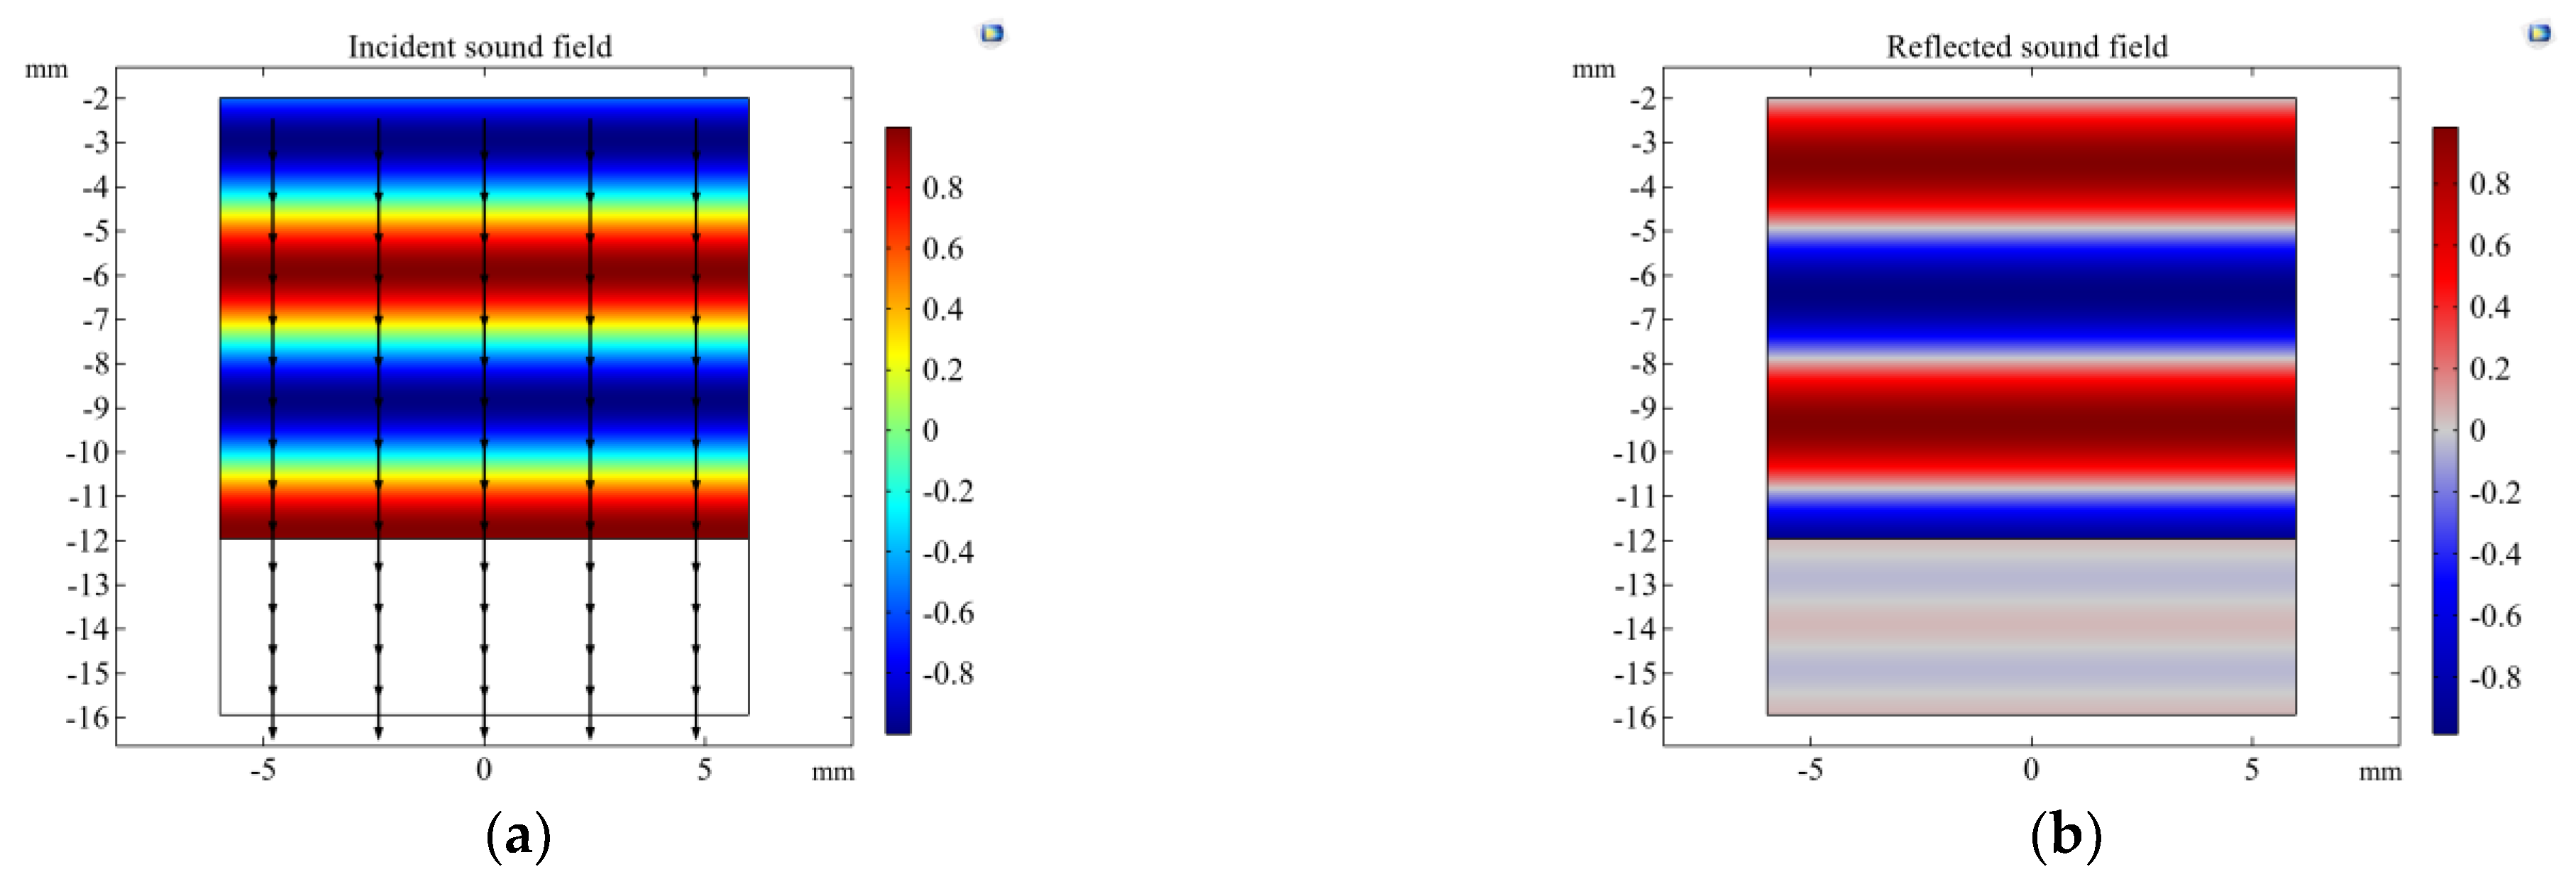
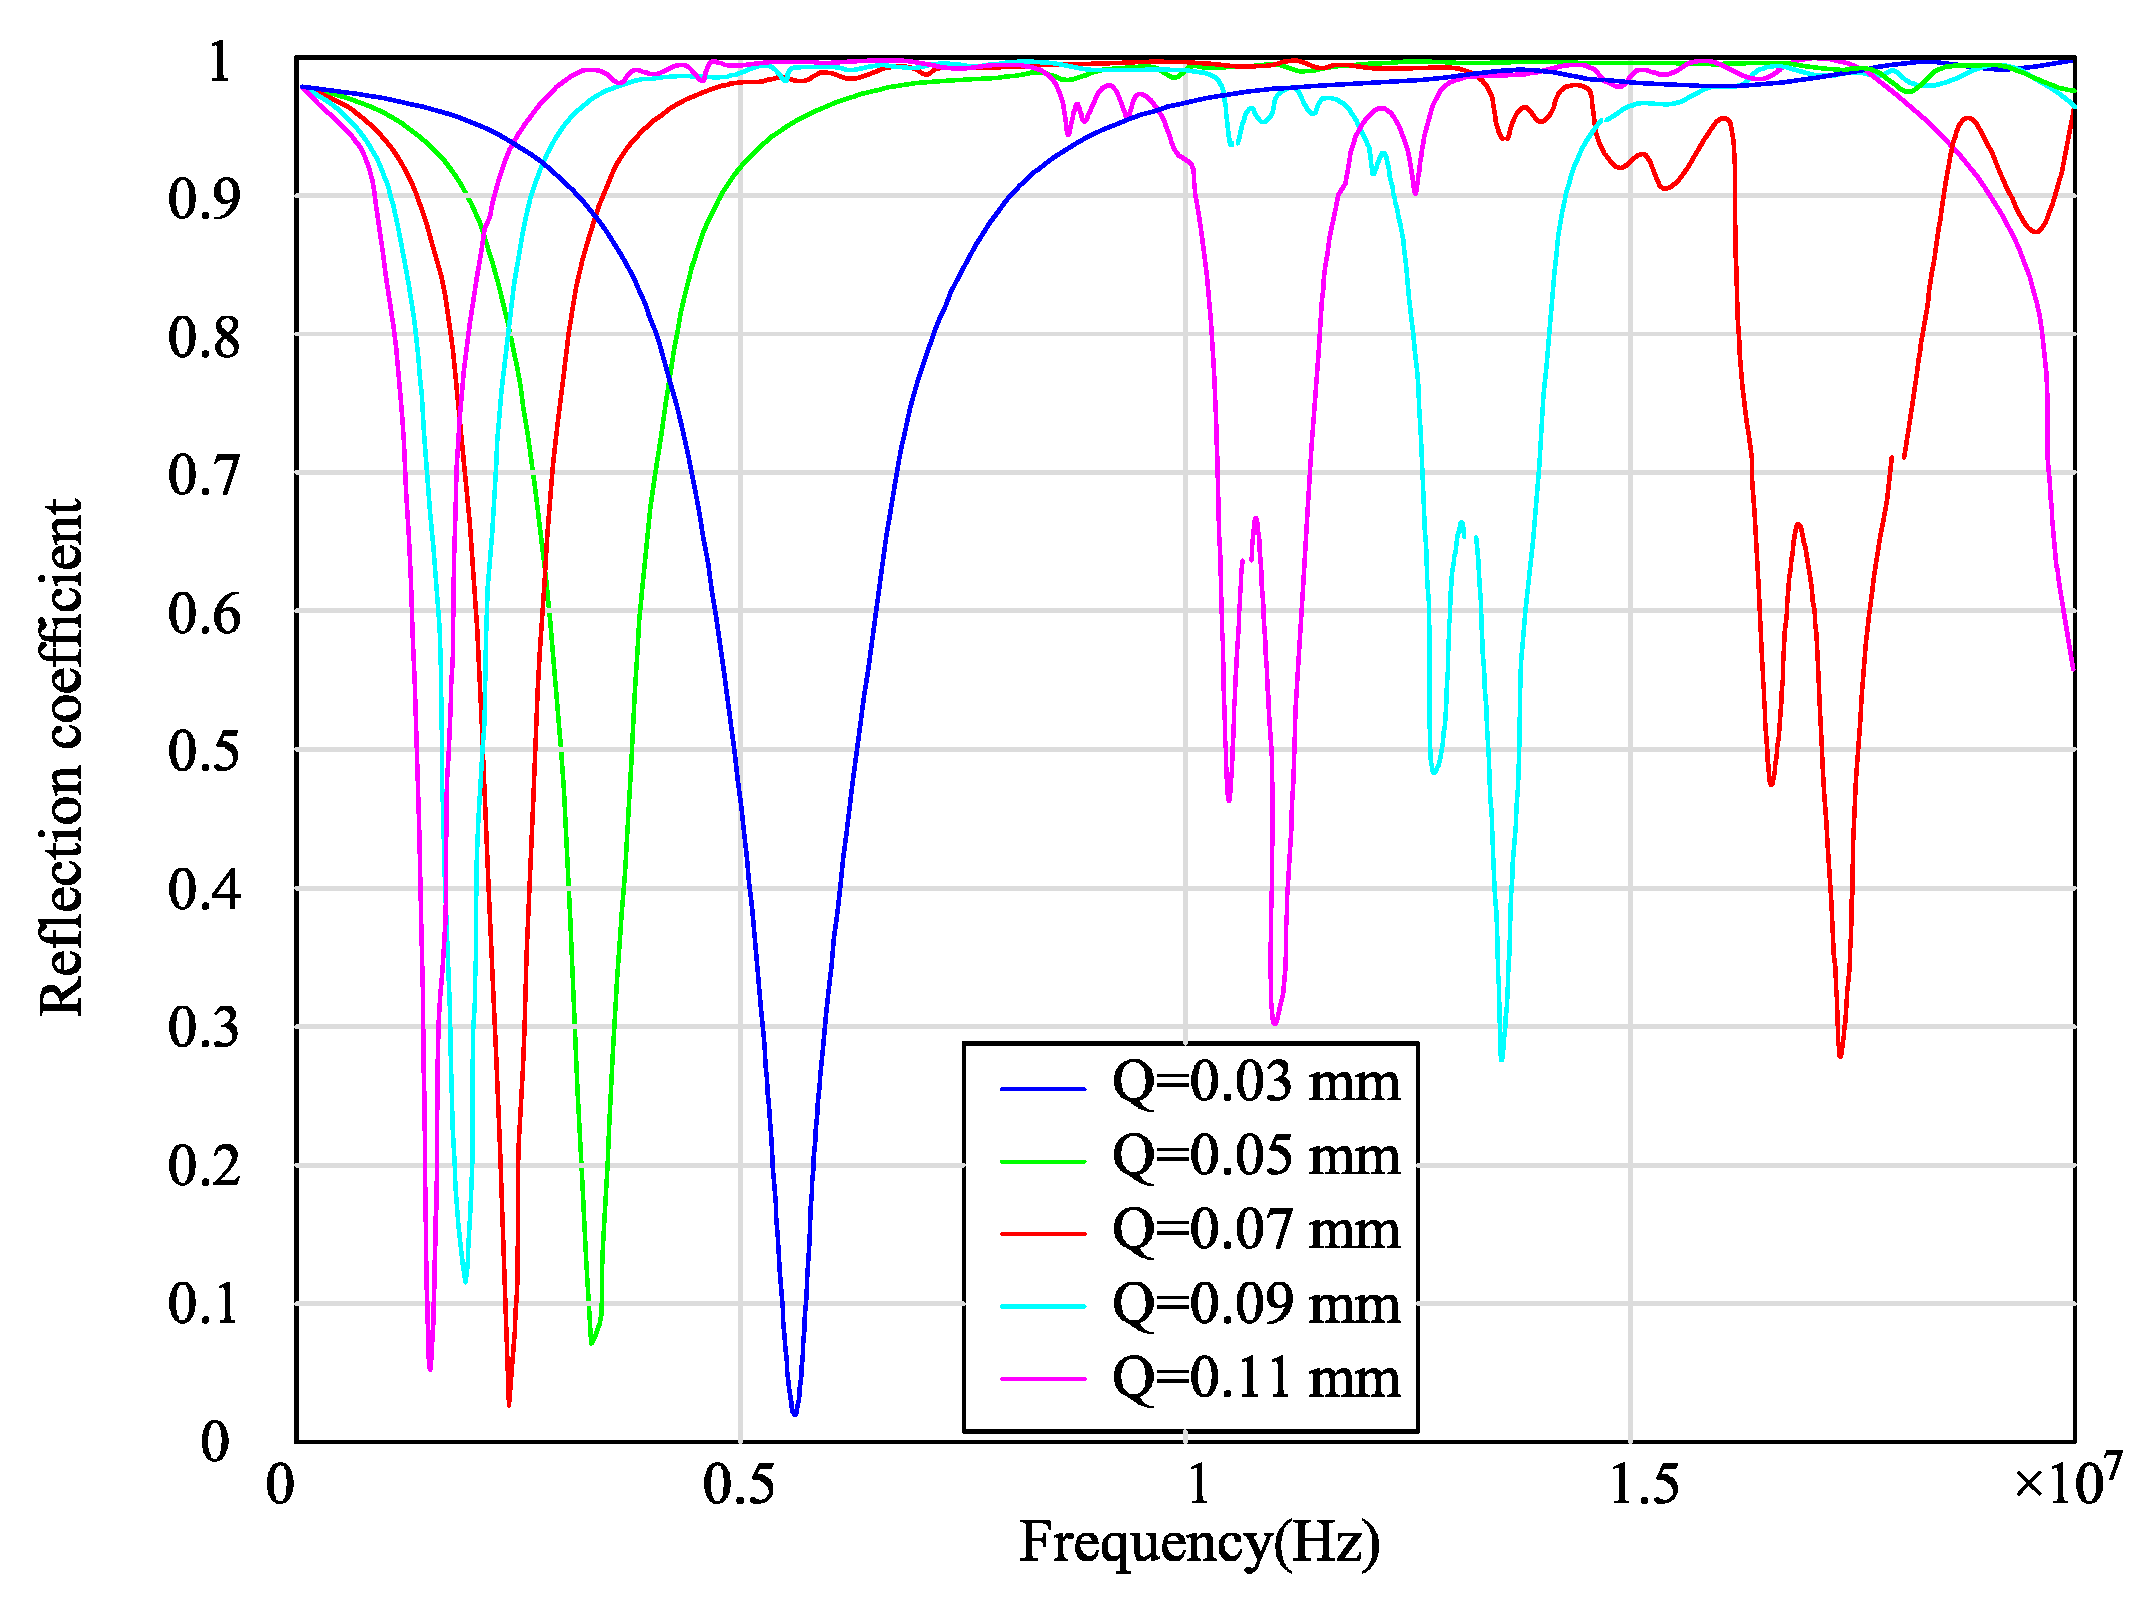
3.2.1. Vertical Incident Simulation Results
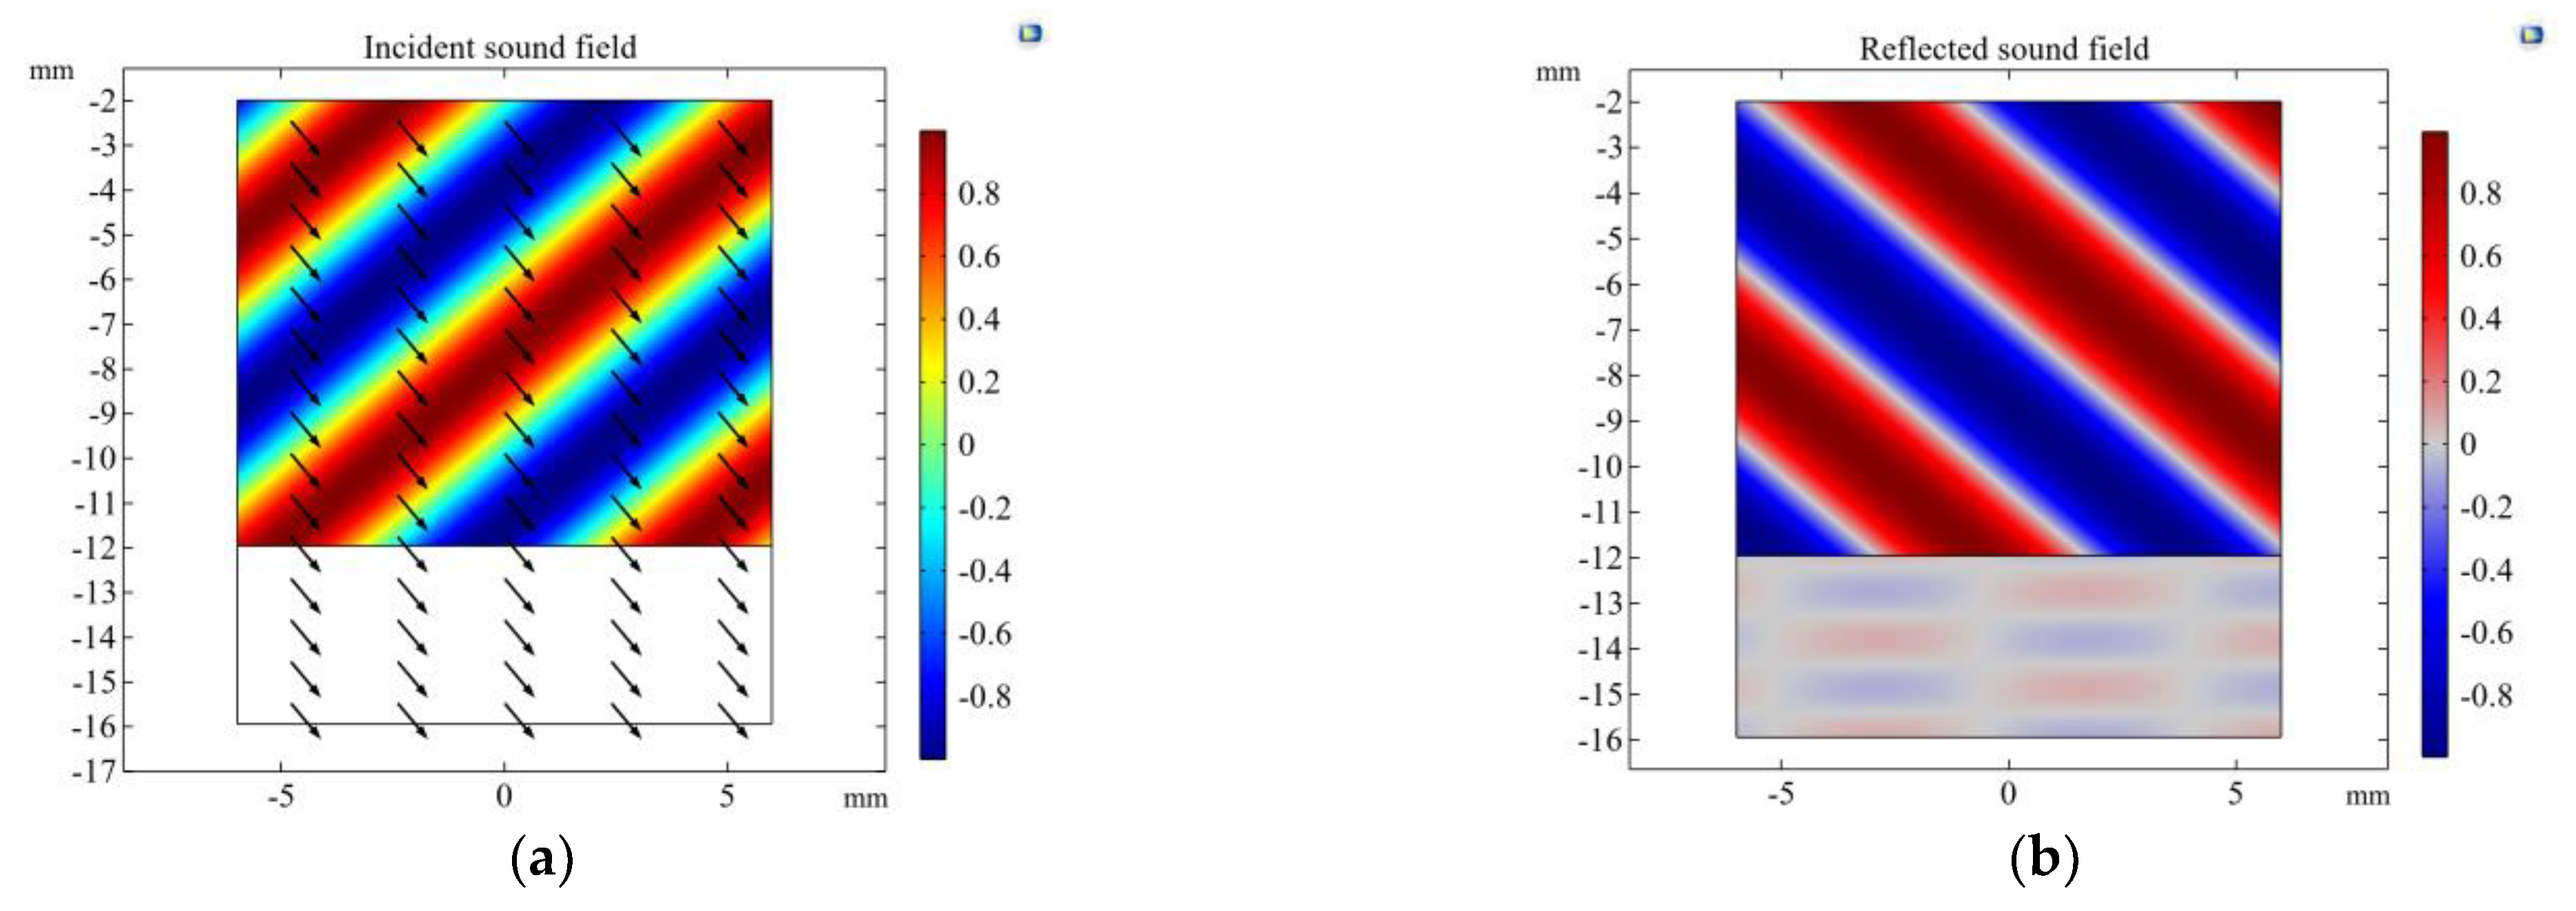
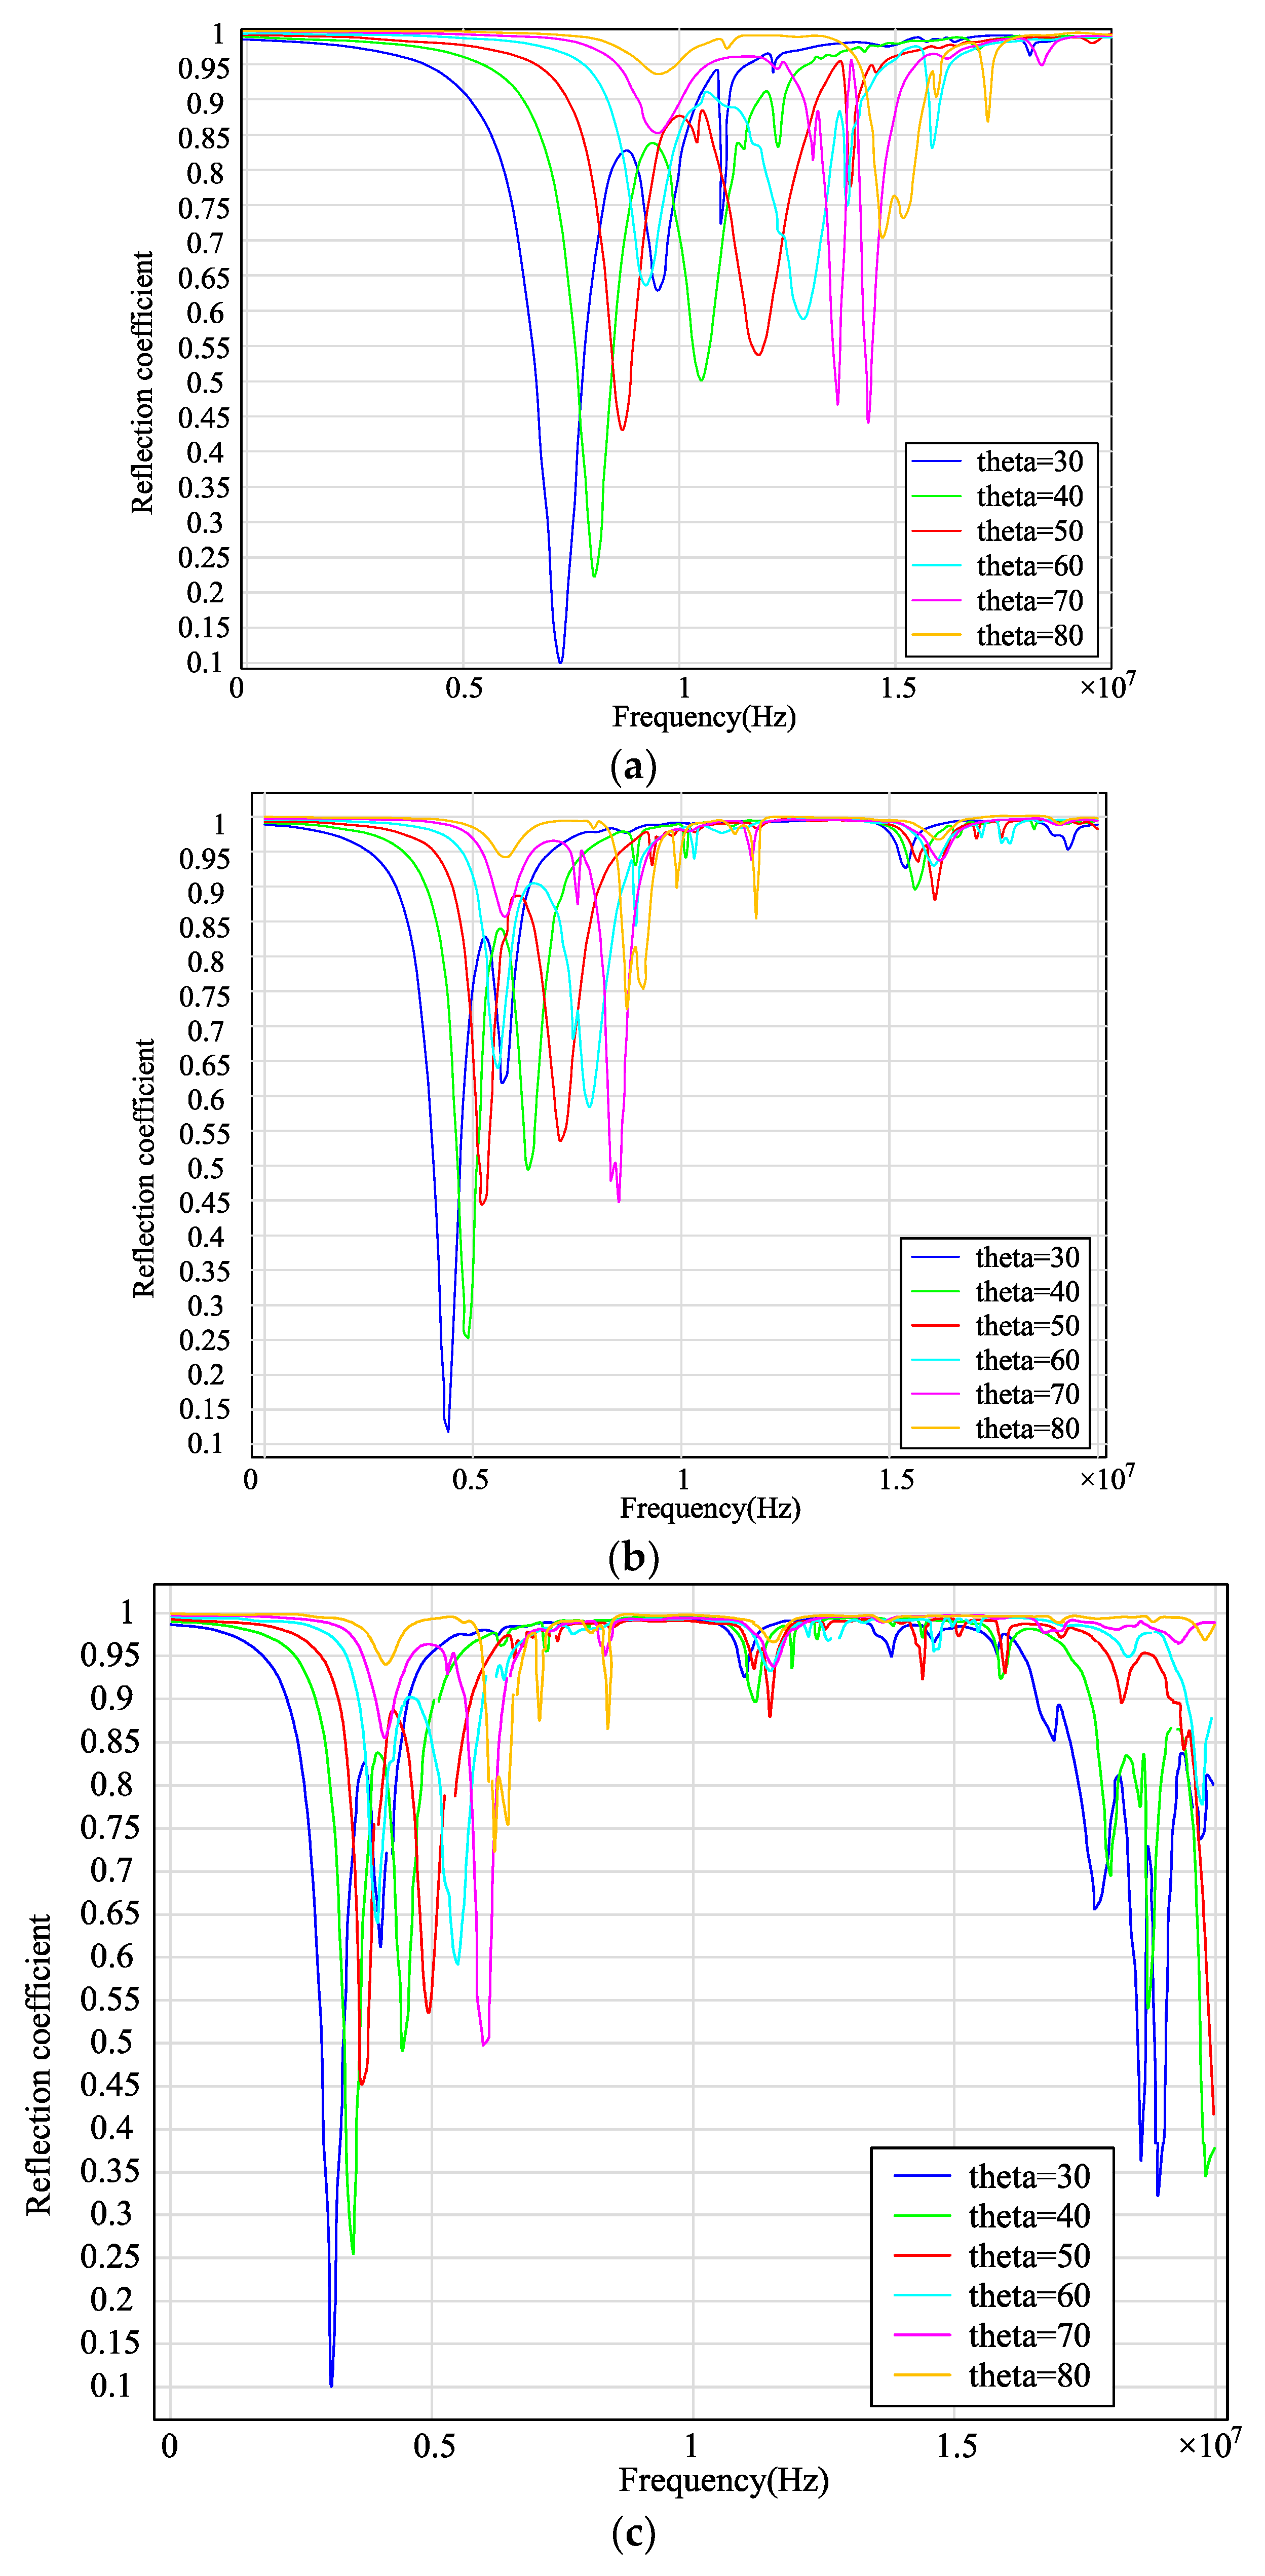
3.2.2. Simulation Results of Multi-Angle Incident
4. Comparative Analysis of the Mathematical Model and Finite Element Model Results
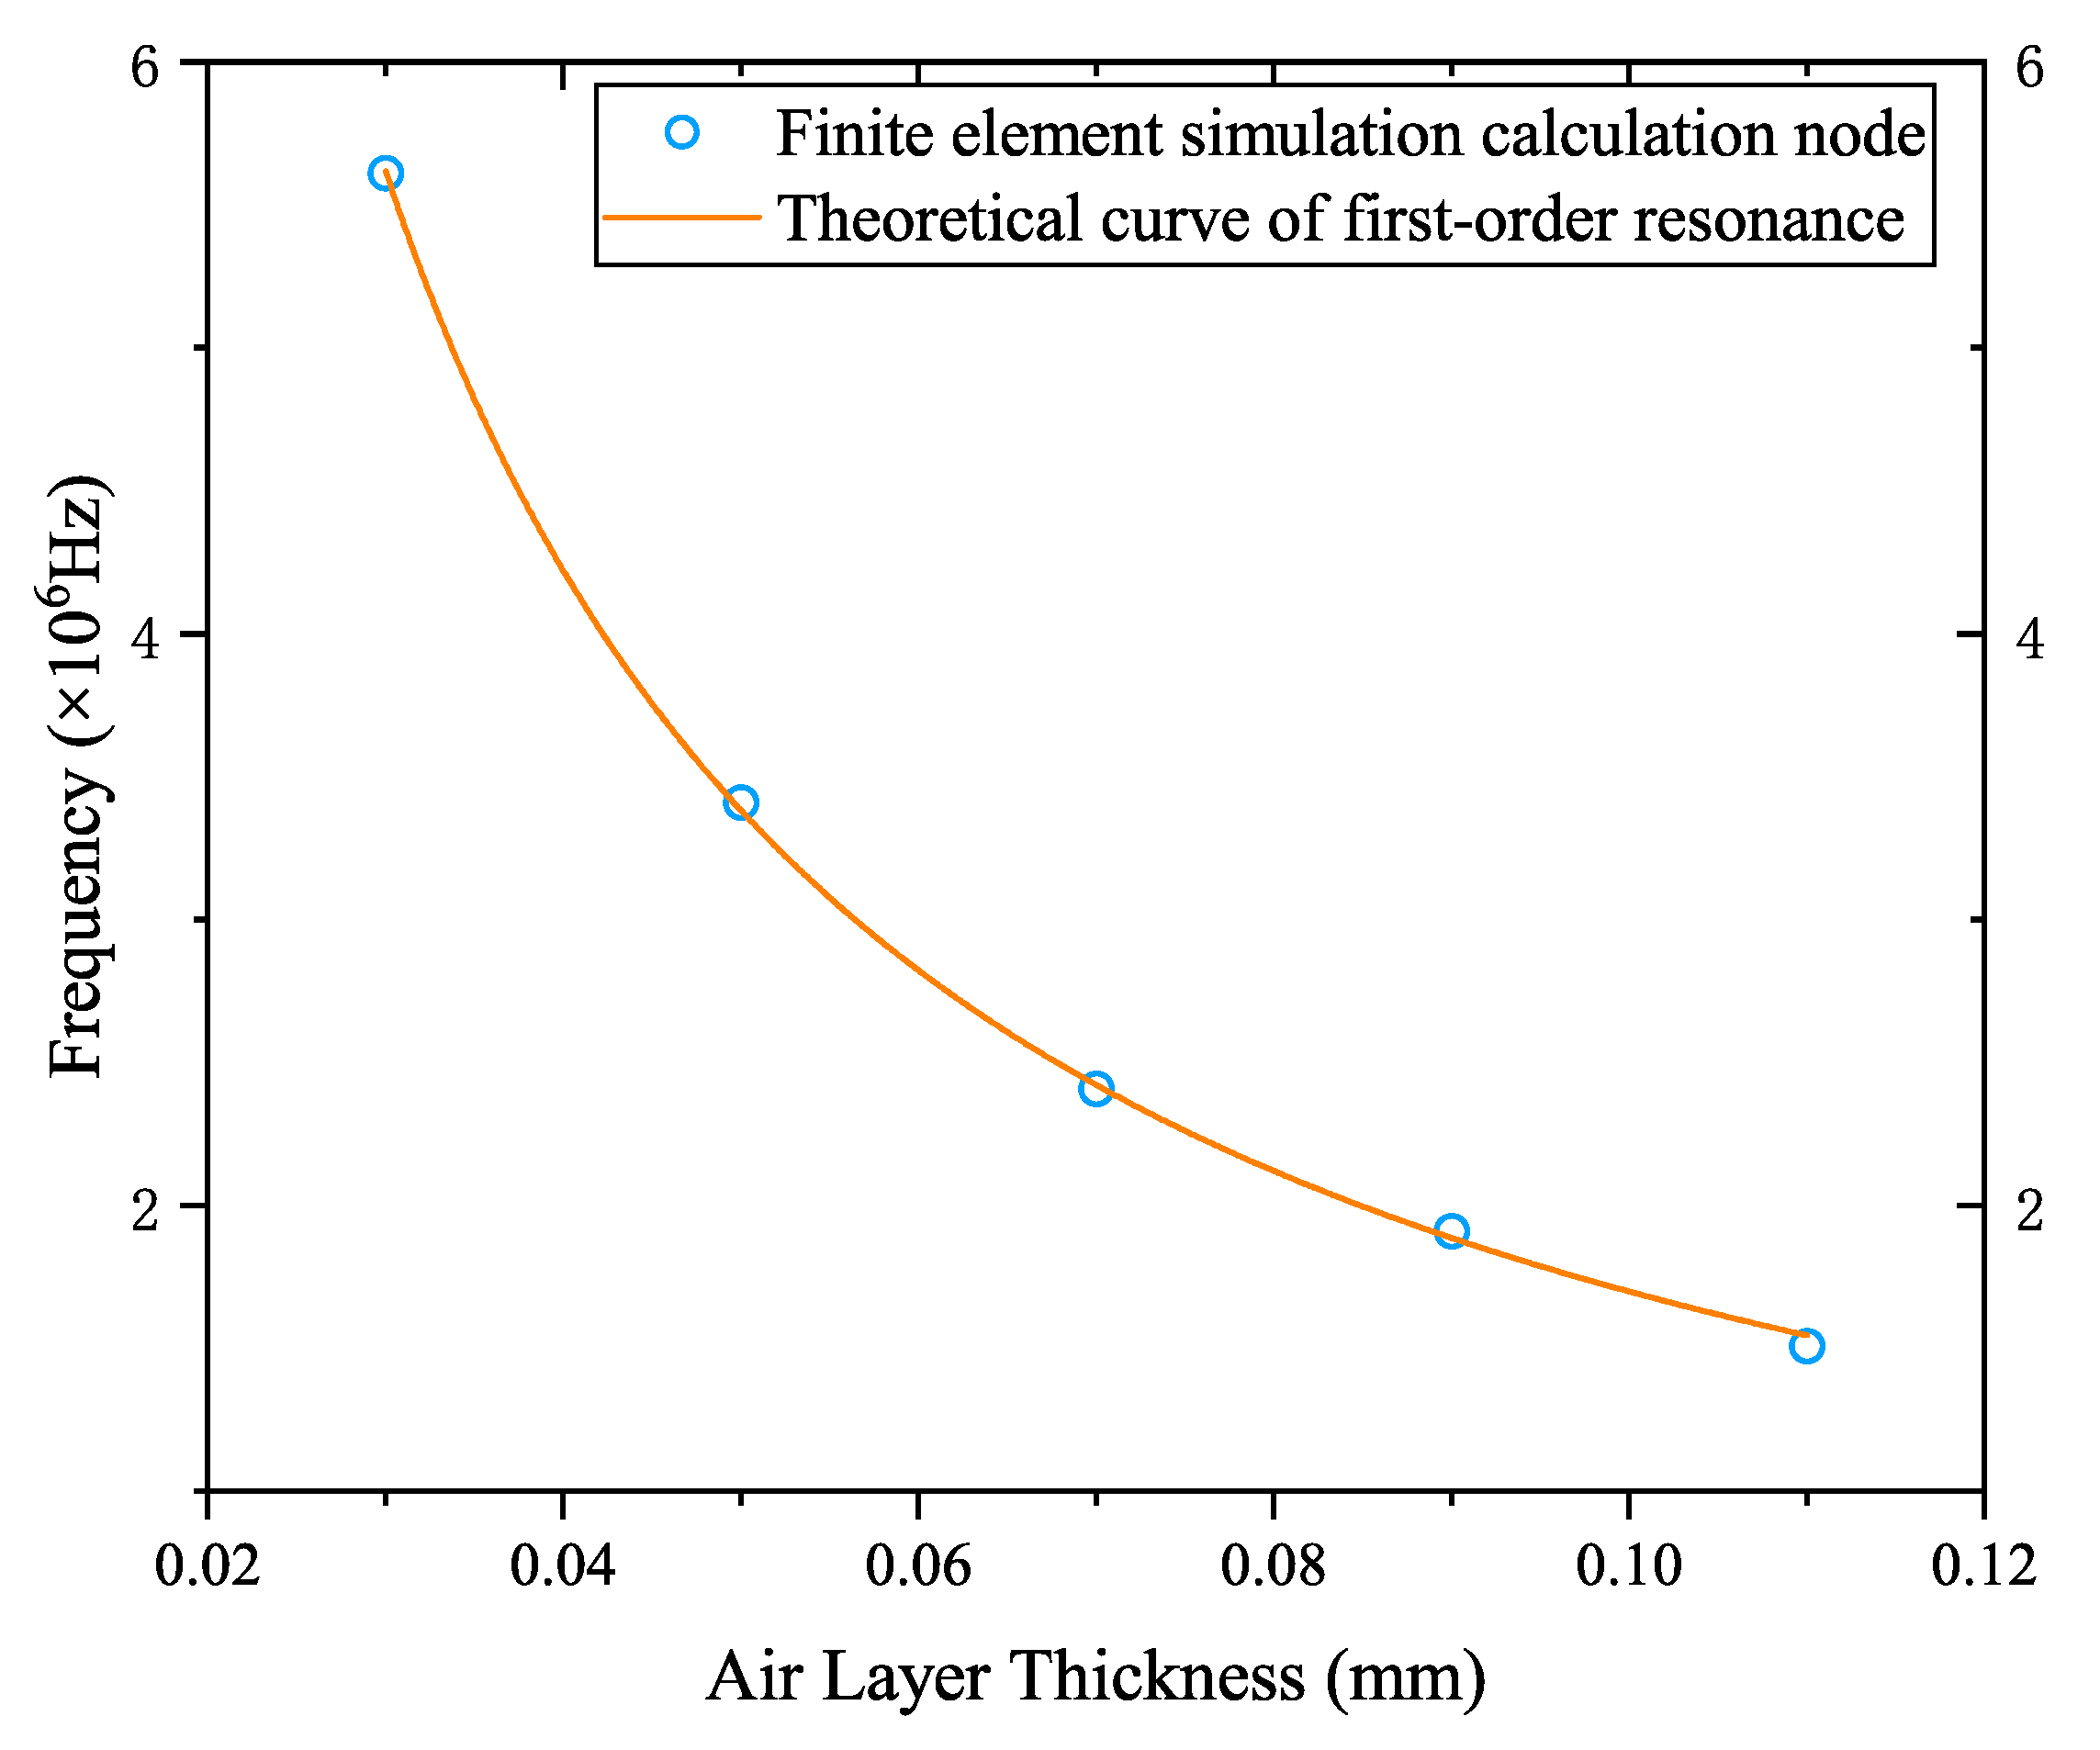
4.1. Comparison of Results from the Vertical Incident of Sound Waves
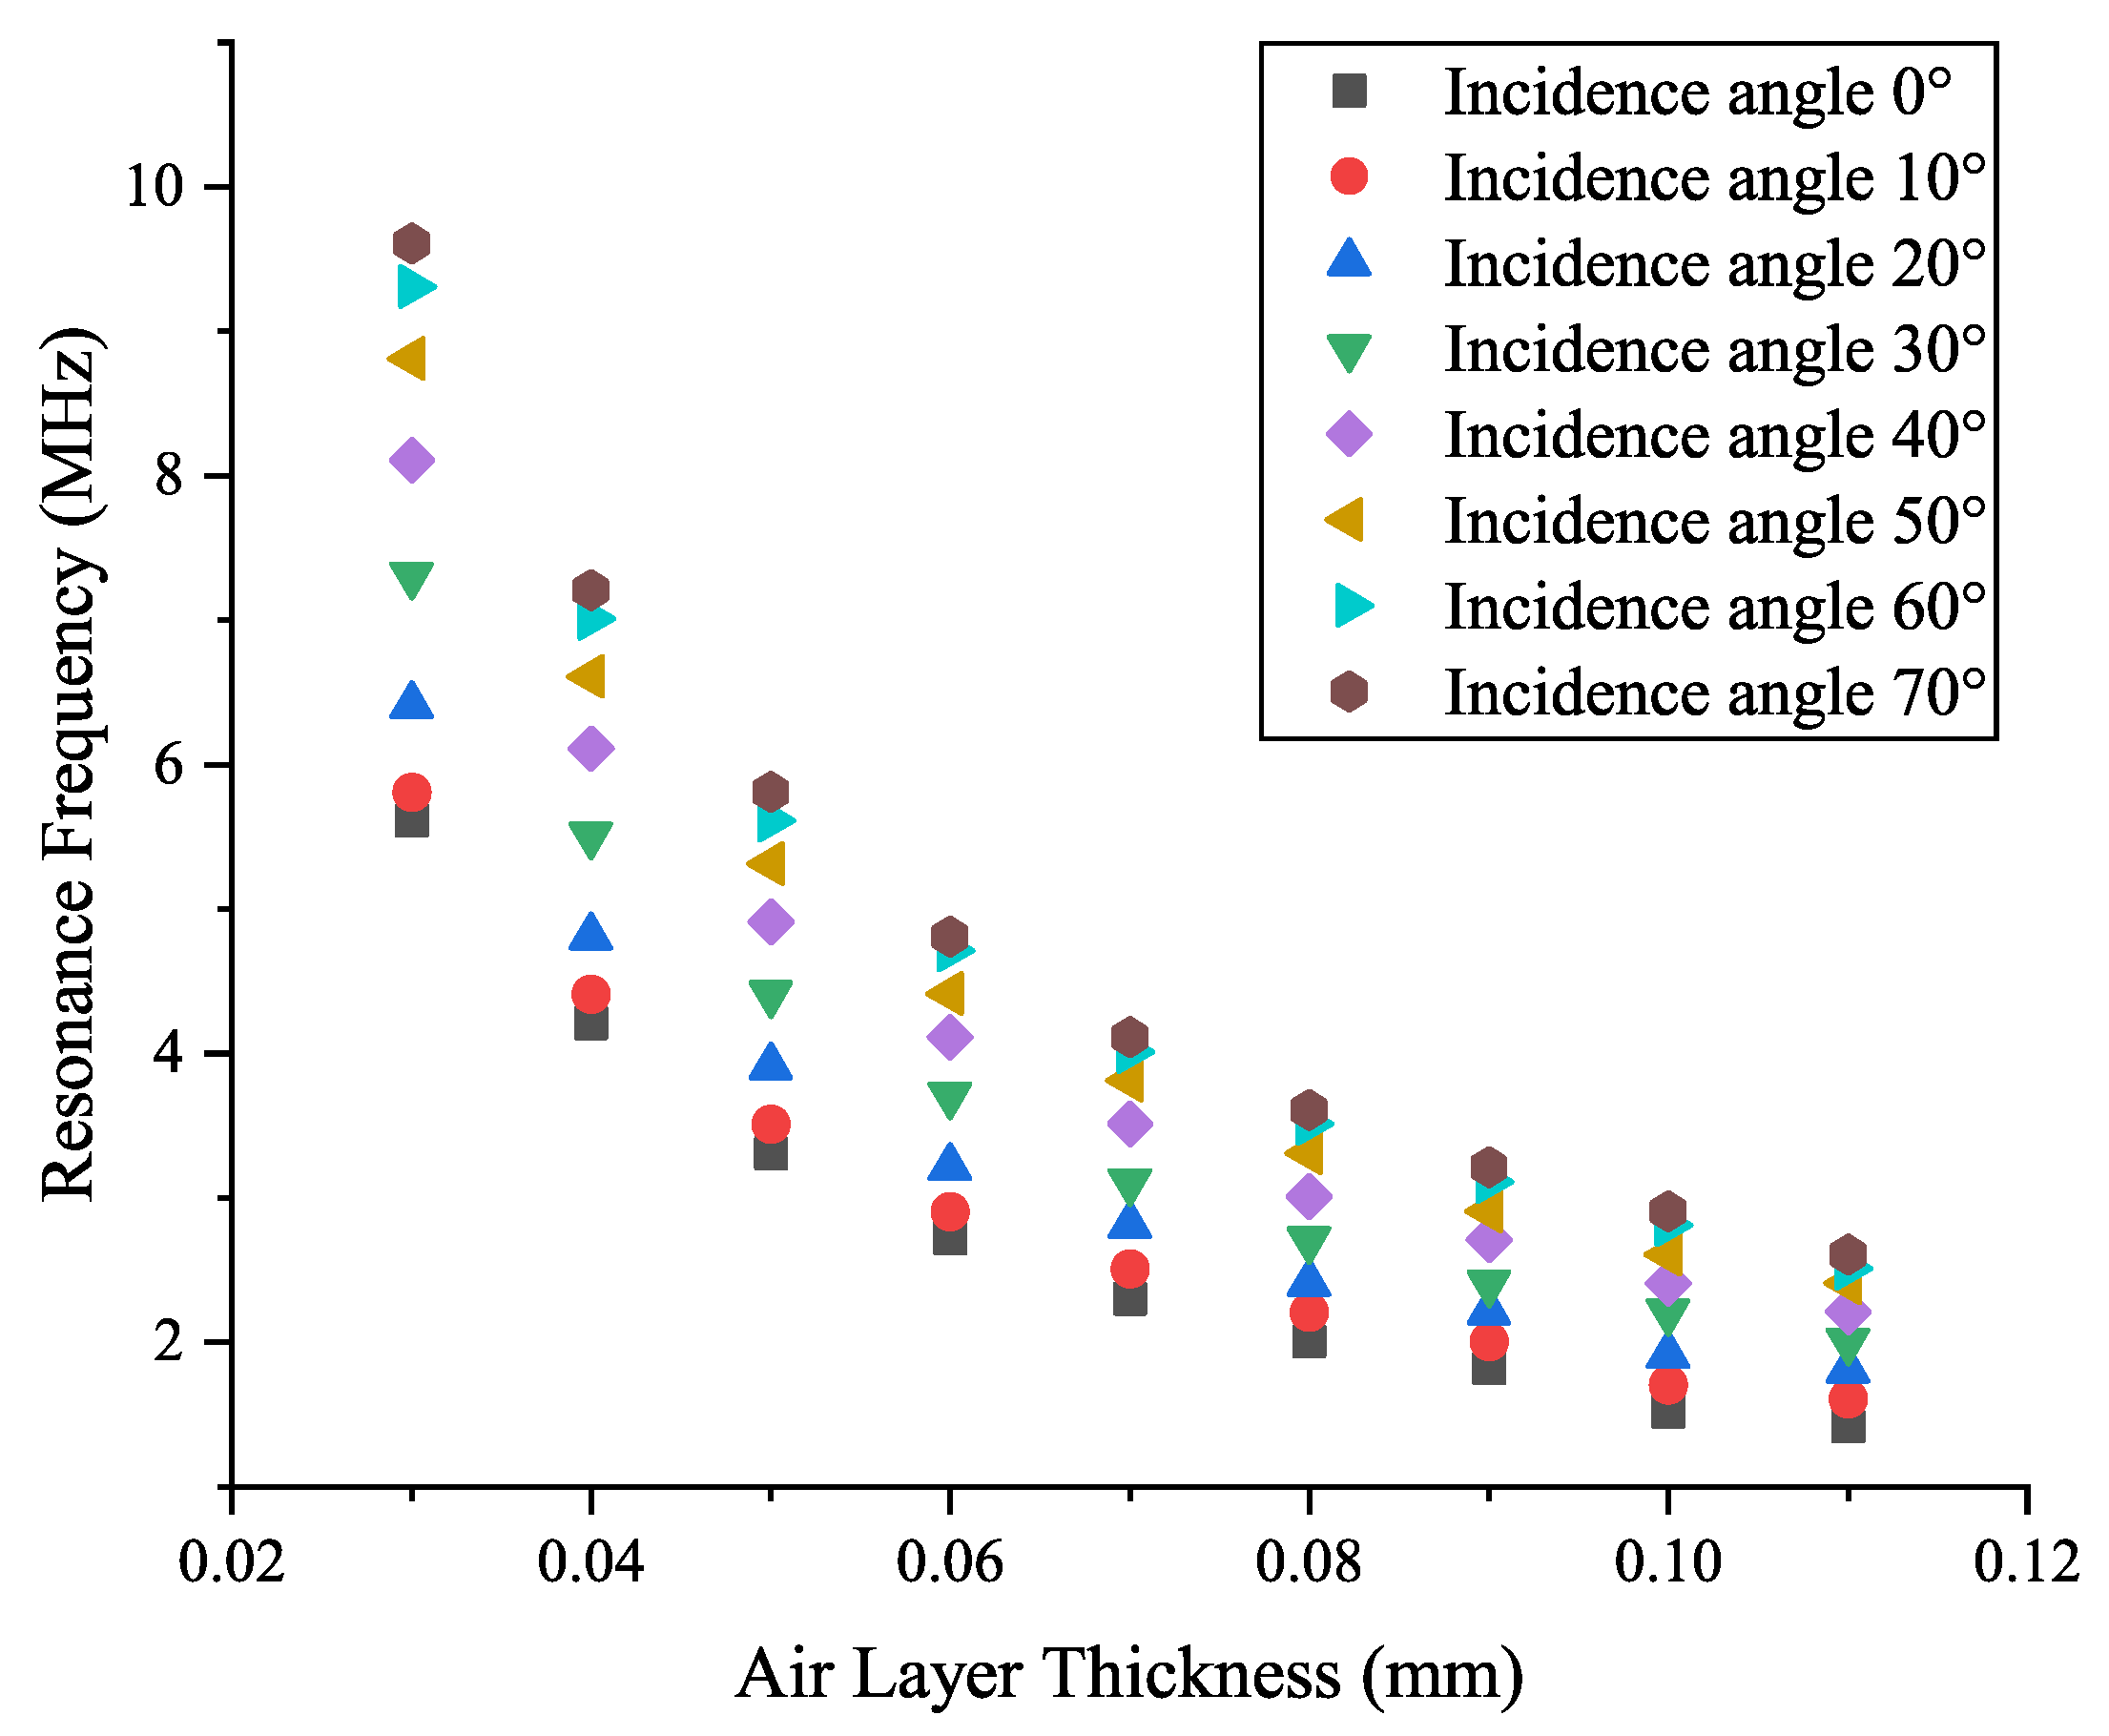
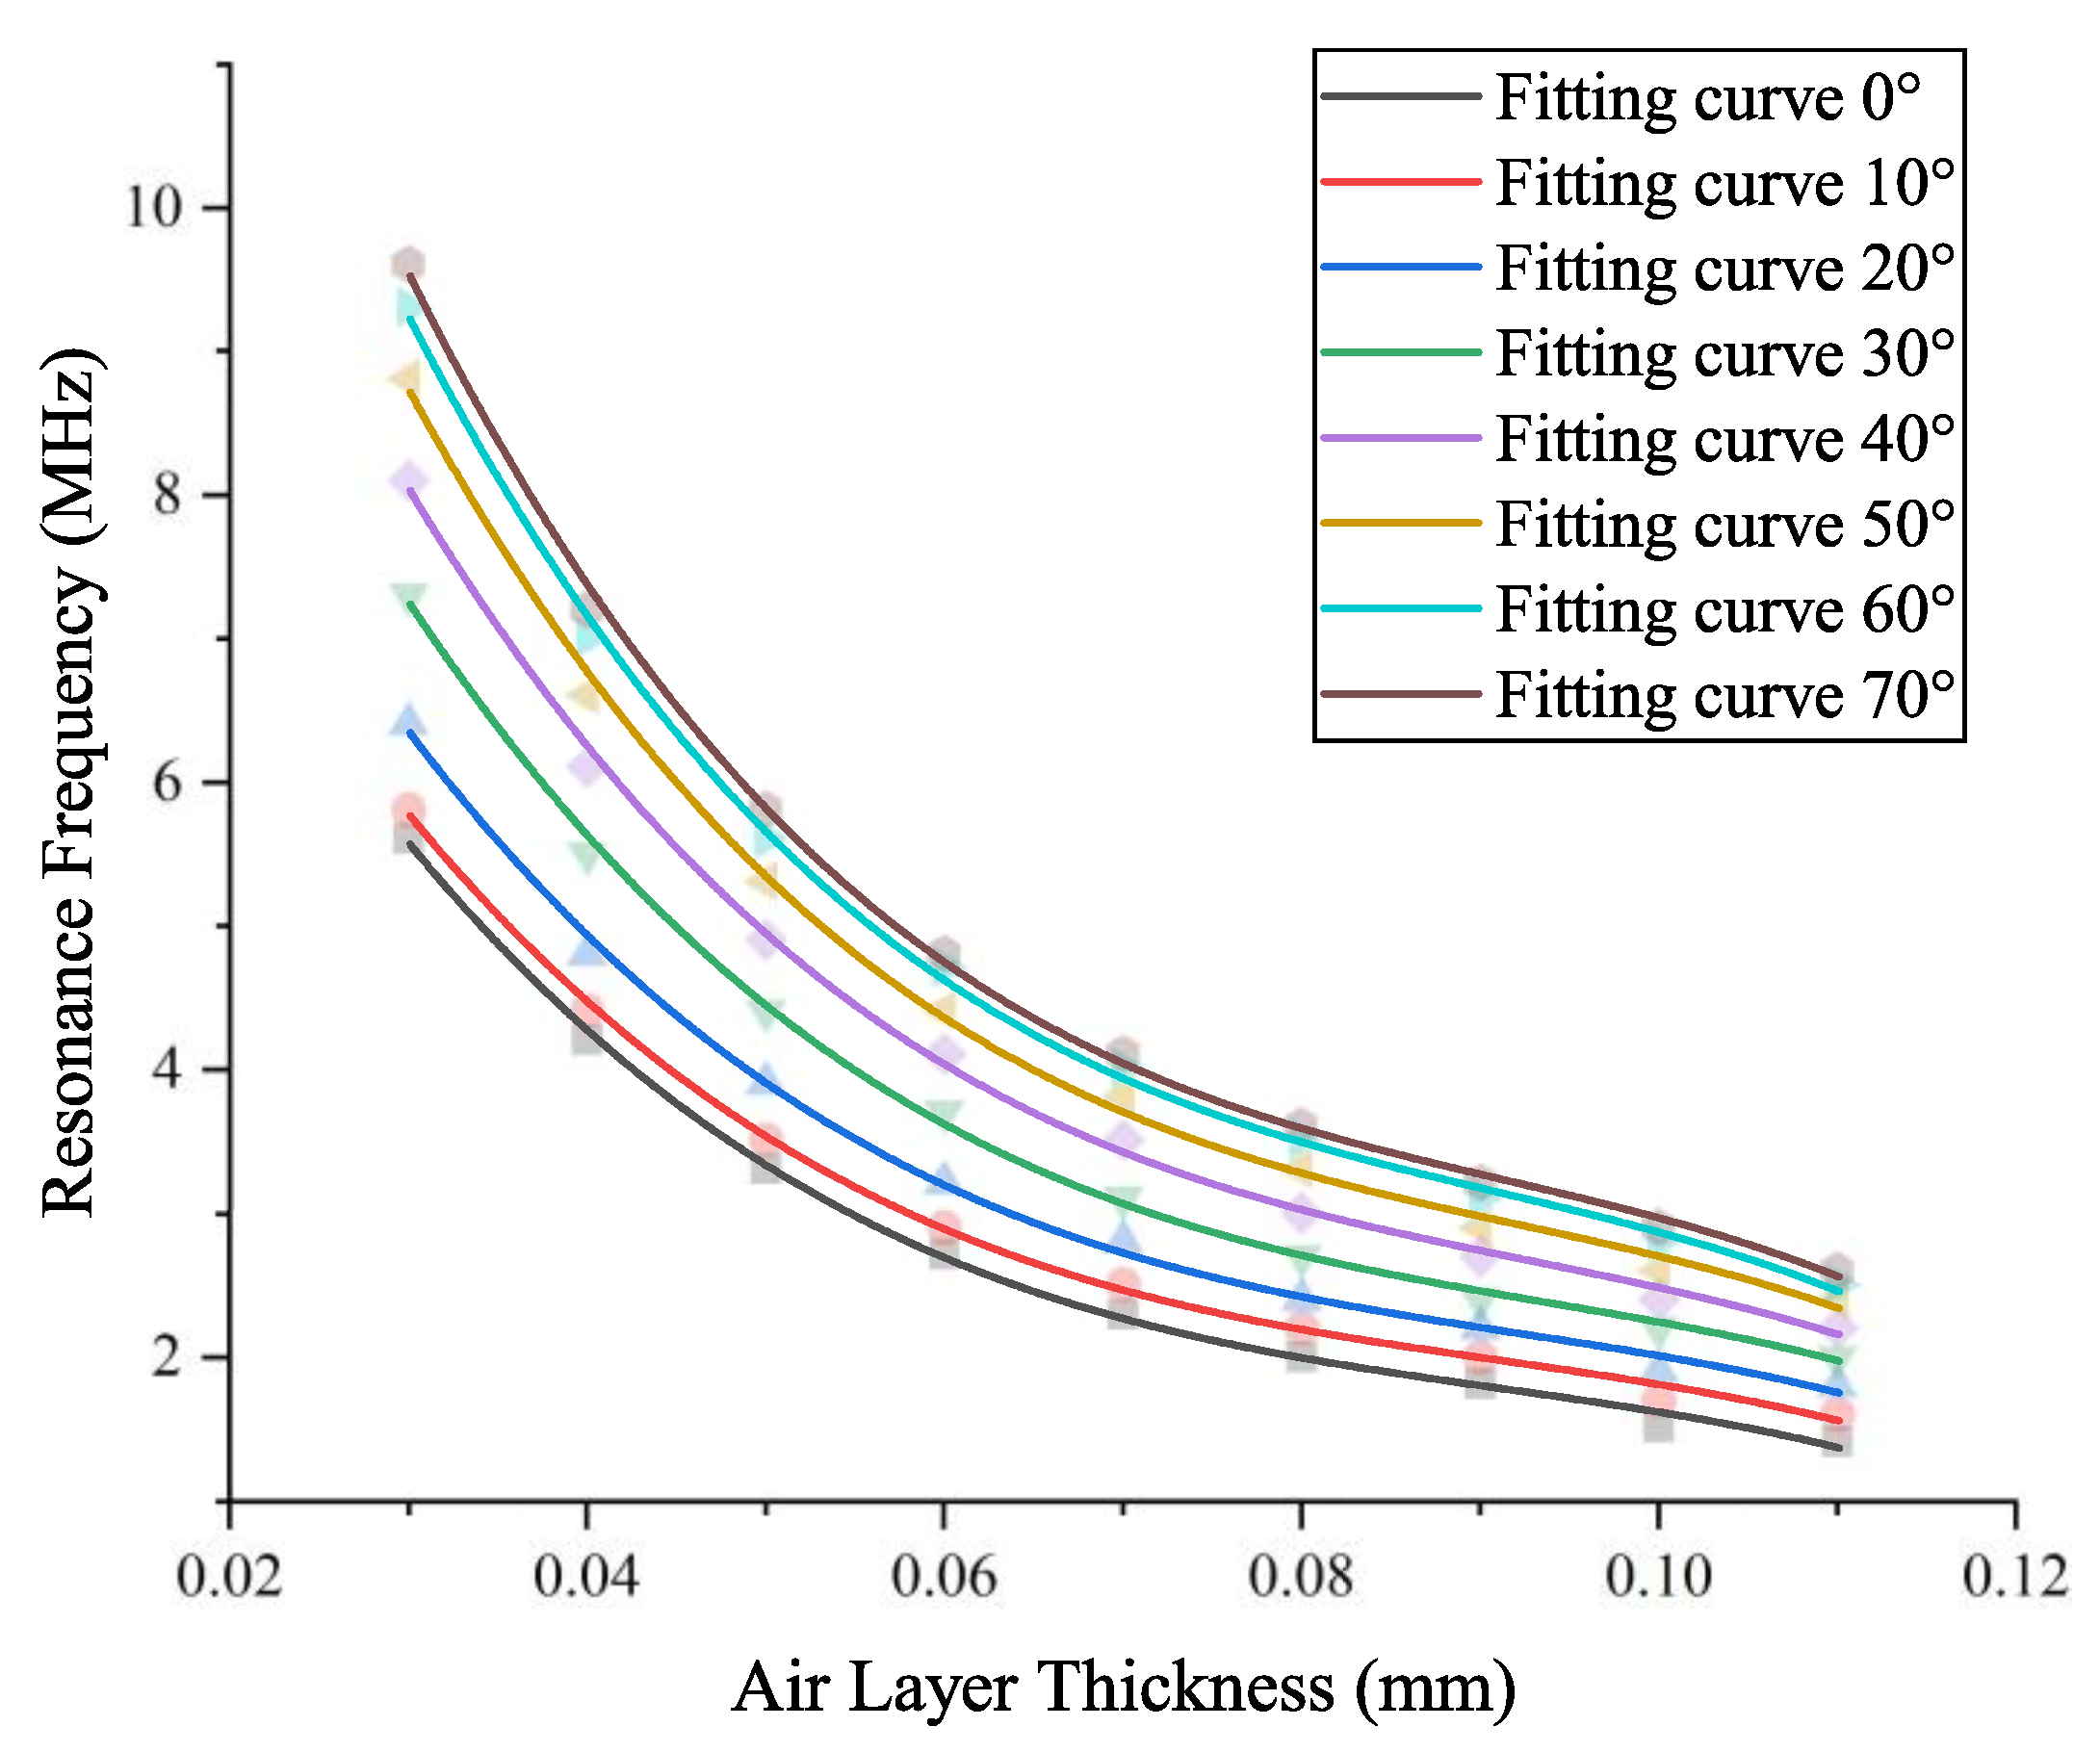
4.2. Comparison of Results from the Multi-Angle Incident of Sound Waves
5. Conclusions
- (1)
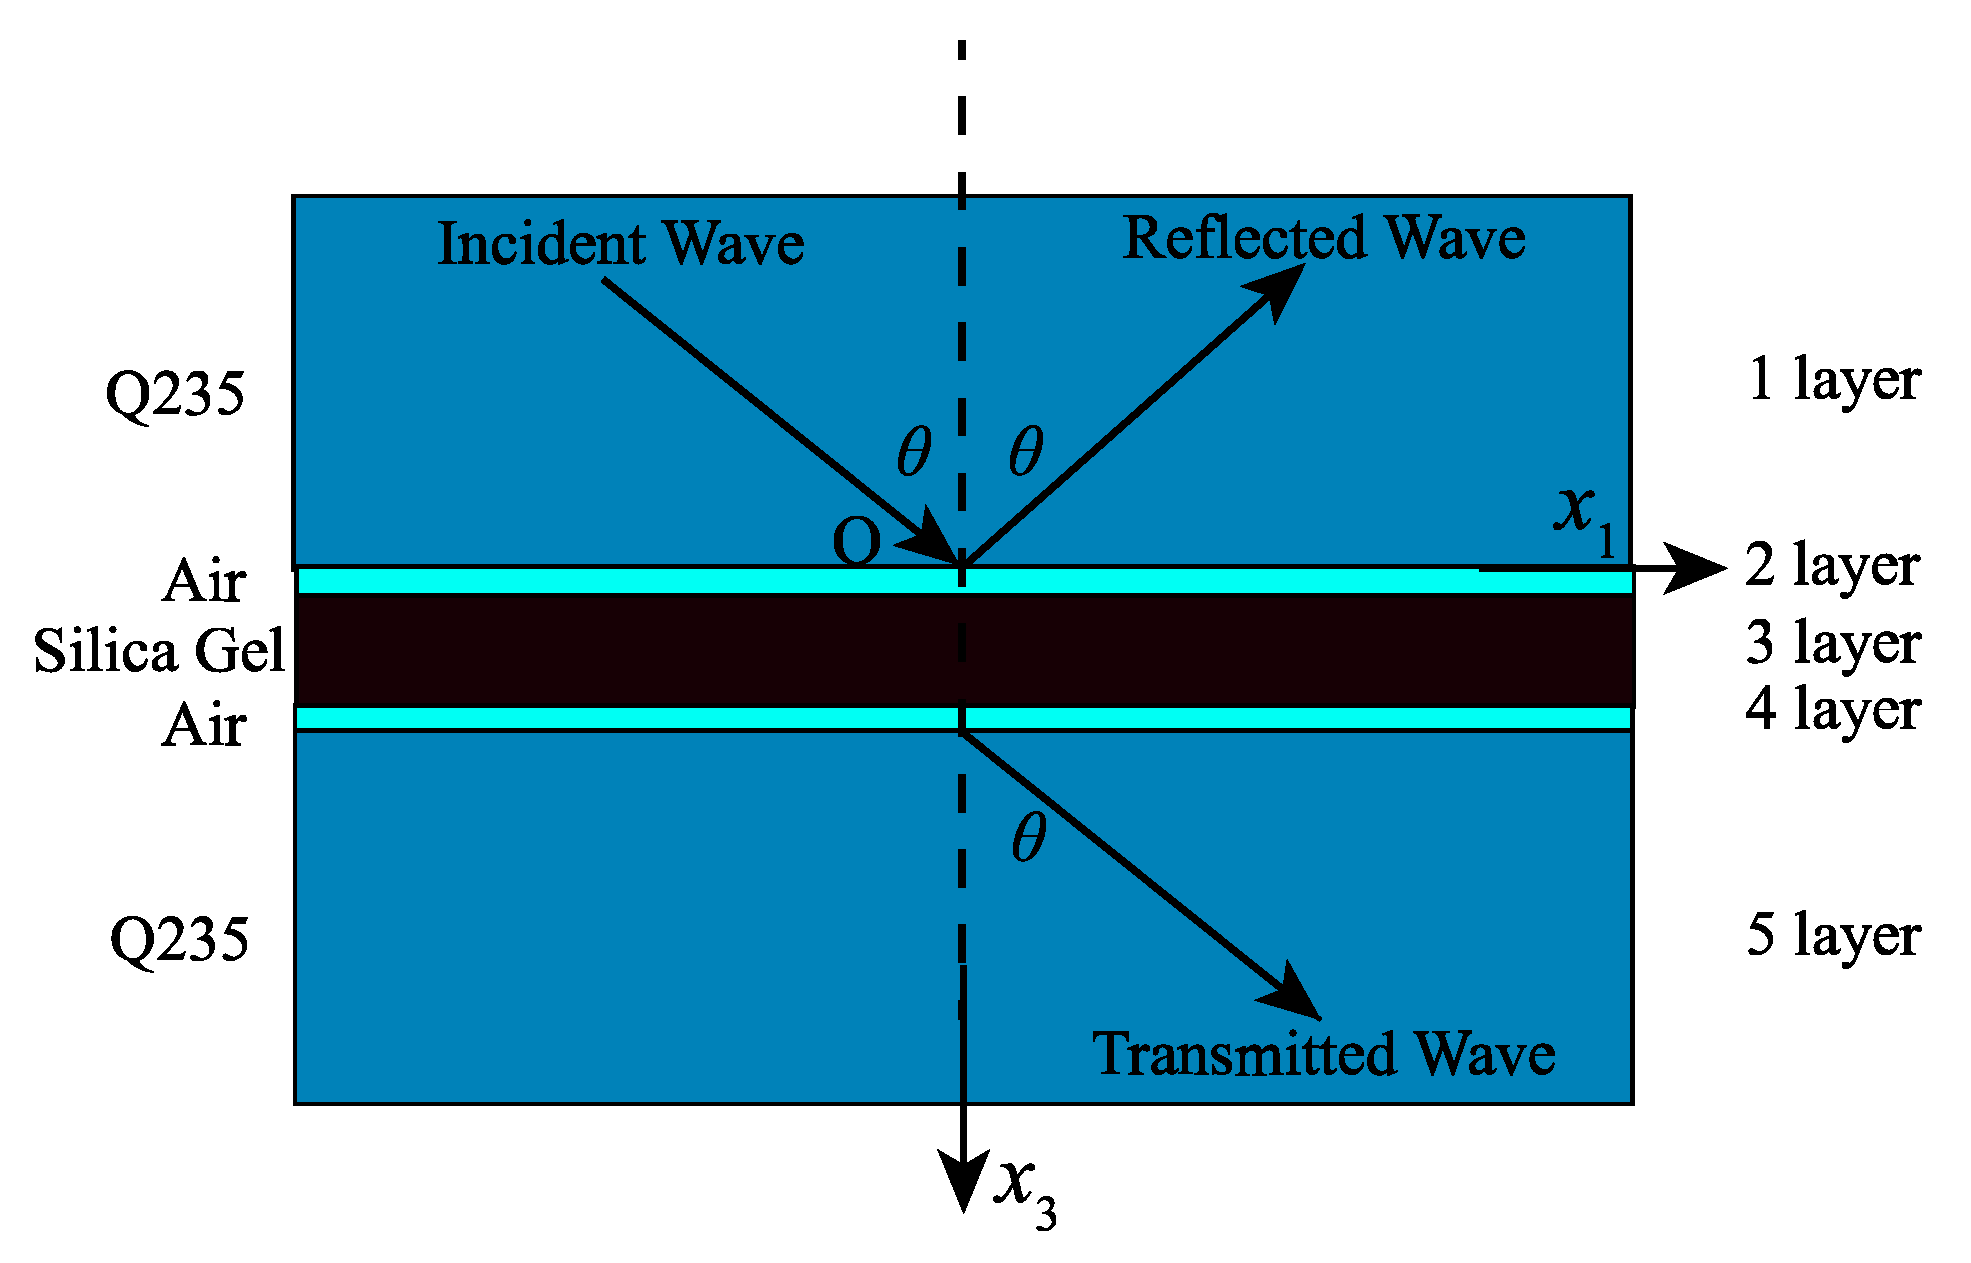
- Under the condition of the vertical incidence of sound waves, by using the displacement and stress equations of longitudinal waves in solids and the reflection conditions of elastic waves on non-homogeneous interfaces, the expressions of air layer thickness in the flange model containing an air layer were obtained. Based on the boundary conditions of elastic waves, the ultrasound resonance frequency under different air layer thickness conditions was calculated.
- (2)
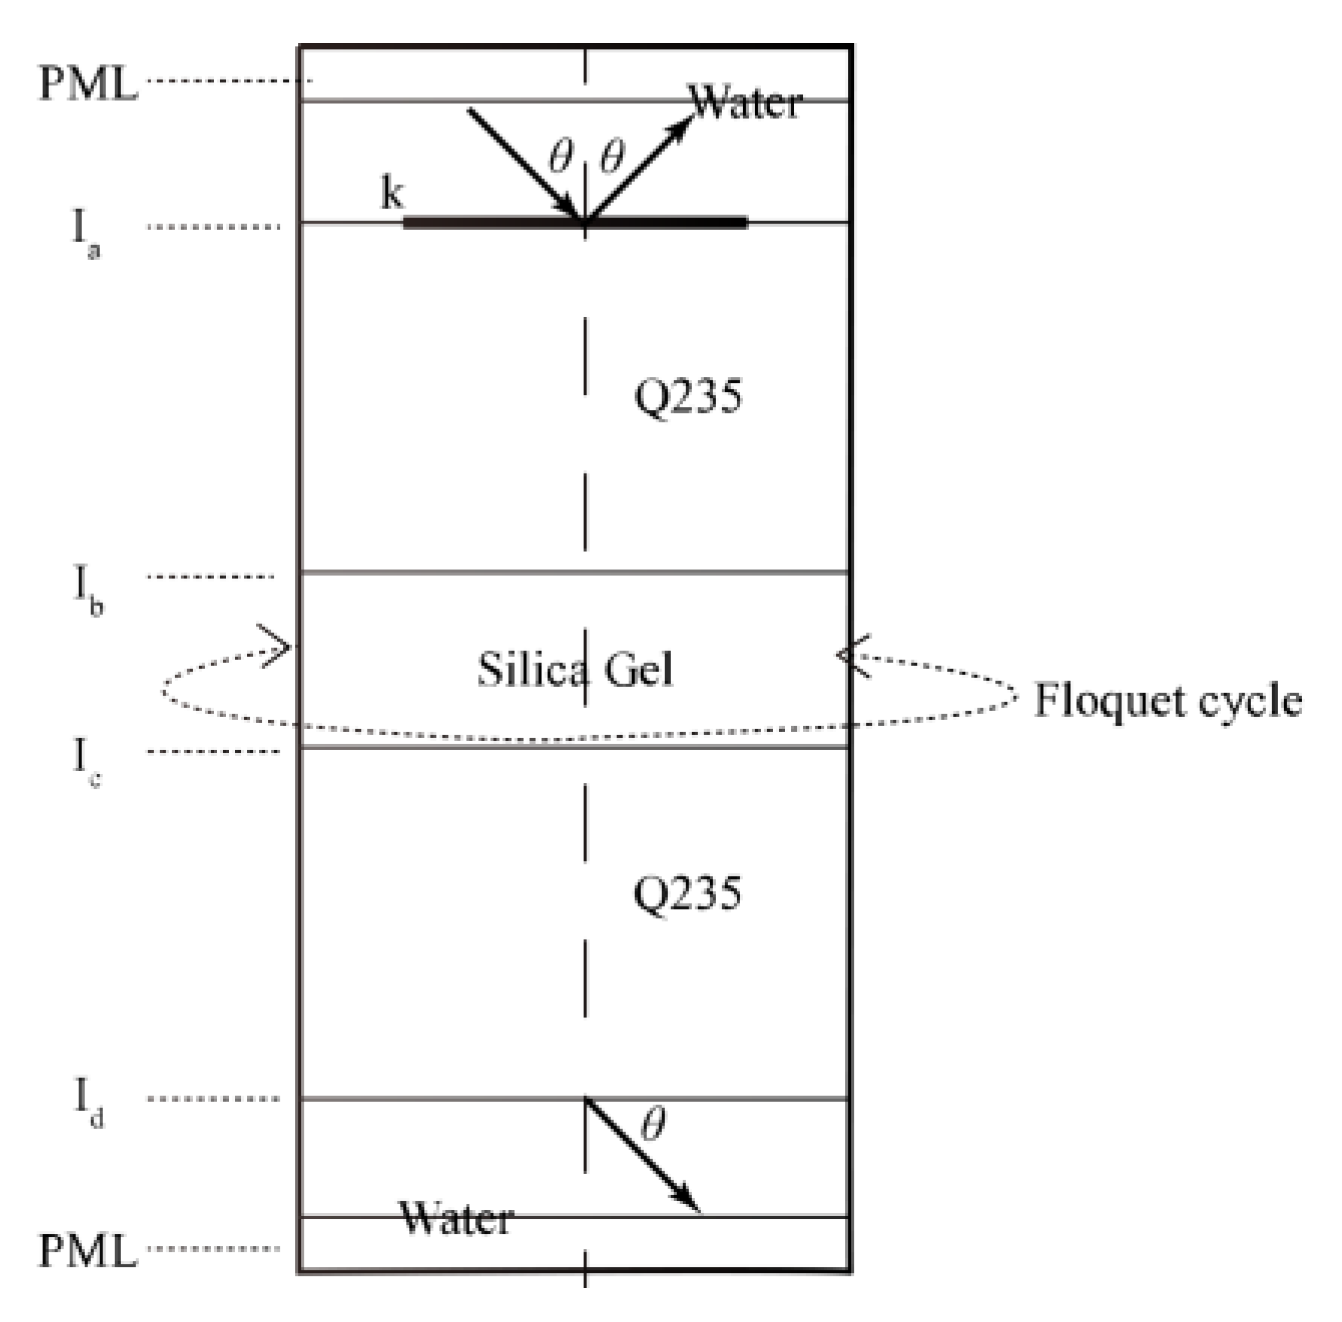
- Based on considering the resonance frequency theory of ultrasonic waves generated by the air layer, this paper derived the expression of the air layer thickness in the flange model with the help of displacement and stress equations of longitudinal waves in solids and the reflection condition of elastic waves at the interface of dissimilar media under the condition of vertical ultrasonic wave incidence. Based on the boundary conditions of elastic waves, the resonant frequencies of ultrasonic waves were calculated for different air layer thicknesses. Additionally, a finite element simulation model of the flange contact surface with an air layer was established. By simulating the pressure sound field distribution of reflection and transmission at different incident angles and frequencies, the angle and frequency spectra of ultrasonic reflection coefficients for different air layer thicknesses were extracted. Comparing the finite element results with the mathematical model results showed high consistency. The reliability of using the ultrasonic reflection coefficient method to evaluate the interface contact quality by measuring the air layer thickness was confirmed.
- (3)
- Based on the vertical incidence model, a multi-angle incidence air layer thickness measurement model was derived and constructed. The relationship between air layer thickness and incidence angle under multiple incidence angles was obtained. The influence of the ultrasonic incidence angle and air layer thickness on the resonance frequency of the air layer was analyzed in detail. The results showed that when the incidence angle was constant, the resonance frequency of the air layer gradually decreased as the air layer thickness increased in a power function form. When the air layer thickness was constant, the resonance frequency of the air layer gradually increased with increasing incidence angle. The thickness of the air layer between the flanges can be analyzed by the resonance frequency of the air layer at different incidence angles to infer the fitting degree of the flange contact surface and prevent leakage.
Author Contributions
Funding
Institutional Review Board Statement
Informed Consent Statement
Data Availability Statement
Acknowledgments
Conflicts of Interest
References
- Zhang, J.; Lian, Z.; Zhou, Z.; Song, Z.; Liu, M.; Yang, K. Leakage detection in a buried gas pipeline based on distributed optical fiber time-domain acoustic wave signal. Eng. Fail Anal. 2022, 141, 106594. [Google Scholar] [CrossRef]
- Li, G. Establishment of Leakage Rate Model and Failure Analysis of Bolt Flange System. Master’s Thesis, Kunming University of Science and Technology, Kunming, China, 2014. [Google Scholar]
- Seyed, M.Y.N.; Masoud, G. Looseness Detection and Assessment of Flange Type Joints Using Vibroacoustic Modulation Method. Russ. J. Nondestruct. 2020, 56, 490–505. [Google Scholar]
- Ishii, Y.; Biwa, S. Evaluation of interlayer interfacial stiffness and layer wave velocity of multilayered structures by ultrasonic spectroscopy. J. Acoust. Soc. Am. 2014, 136, 183–191. [Google Scholar] [CrossRef] [PubMed]
- A study of the interaction between ultrasound and a partially contacting solid—Solid interface. Proc. R. Soc. Lond. Ser. A Math. Phys. Eng. Sci. 1997, 452, 2613–2628.
- Wu, W. Research on the Air-Coupled Ultrasonic Testing of the Bonded Performance of Layered Medium. Master’s Thesis, Jingdezhen Ceramic Institute, Jingdezhen, China, 2018. [Google Scholar]
- Zilidou, M.; Smith, R.A.; Wilcox, P.D. Suppression of front and back surface reflections in ultrasonic analytic-signal responses from composites. Ultrasonics 2022, 126, 106815. [Google Scholar] [CrossRef] [PubMed]
- Wang, X.; Wang, J.; Huang, Z.; Li, X. Measurement Interface Stiffness of Bonded Structures Using Air-Coupled Ultrasonic Transmission Technology. IEEE Access 2021, 9, 43494–43503. [Google Scholar] [CrossRef]
- Li, X.; Ma, X.; Zhang, B. Theory and Numerical Calculation of Acoustic Reflection Coefficient for Oil Film Thickness Measurement. Lubri. Eng. 2018, 43, 13–18+27. [Google Scholar]
- Geng, X.; Zhang, C.; Zhang, J.; Luo, G.; Shen, Q. Simultaneous measurement of layer thicknesses in thin layered materials using the phase of ultrasonic reflection coefficient spectrum. Appl. Acoust. 2022, 195, 108835. [Google Scholar] [CrossRef]
- Dou, P.; Zou, L.; Wu, T.; Yu, M.; Reddyhoff, T.; Peng, Z. Simultaneous measurement of thickness and sound velocity of porous coatings based on the ultrasonic complex reflection coefficient. NdtE Int. 2022, 131, 102683. [Google Scholar] [CrossRef]
- Shirgina, N.V.; Kokshaiski, A.I.; Korobov, A.I. Nonlinear Reflection of Elastic Waves from the Boundary of Solids. In Proceedings of the IEEE International Ultrasonics Symposium, Chicago, IL, USA, 3–6 September 2014. [Google Scholar]
- Ding, J. Research on Measuring Method of Liquid Layer Thickness Based on Ultrasonic. Master’s Thesis, Chongqing University, Chongqing, China, 2020. [Google Scholar]
- Achenbach, J.D. Wave Propagation in Elastic Solids; Elsevier Science Publishers: Amsterdam, The Netherlands, 1973. [Google Scholar]
- Tang, W.; Ma, X. The Research on Measuring Oil Film Thickness by Reflection Coefficients. Lubri. Eng. 2010, 35, 44–47. [Google Scholar]
- Yu, M.; Reddyhoff, T.; Dini, D.; Holmes, A.; O’Sullivan, C. Using Ultrasonic Reflection Resonance to Probe Stress Wave Velocity in Assemblies of Spherical Particles. IEEE Sens. J. 2021, 21, 22489–22498. [Google Scholar] [CrossRef]
- Cai, Y.; Fan, M.; Sun, P.; Xu, L.; Ma, J. Axial Super-Resolution Ultrasound Imaging With Quasi-Monopolar Pulses From a Dual-Frequency Transducer. IEEE Trans. Instrum. Meas. 2023, 72, 9500710. [Google Scholar] [CrossRef]
- Gao, J.; Wang, X.; Lyu, Y.; Song, G.; Zhang, B.; He, C. Acoustic reflection and transmission at the interface between two-phase porous lithium-ion battery and liquid media. Acta Acust. 2023, 48, 138–147. [Google Scholar]
- Stoll, R.D.; Kan, T.K. Reflection of acoustic waves at a water—Sediment interface. J. Acoust. Soc. Am. 1981, 70, 149–156. [Google Scholar] [CrossRef]
- COMSOL Inc. Acoustic Reflections off a Water-Sediment Interface; COMSOL Inc.: Stockholm, Sweden; Available online: https://cn.comsol.com/model/download/1044311/models.aco.reflections_water_sediment.pdf (accessed on 1 November 2022).
- Shukla, K.; Ahmad, A.; Ahluwalia, B.S.; Melandsø, F.; Habib, A. Finite element simulation of transmission and reflection of acoustic waves in the ultrasonic transducer. Jpn. J. Appl. Phys. 2022, 61, SG1029. [Google Scholar] [CrossRef]
- He, C.; Li, Y.; Lyu, Y.; Song, G.; Wu, B. Ultrasonic reflection characteristics of FRP-to-FRP bonded joints with thick adhesive layers for bonding evaluation: Theoretical analysis. Compos. Struct 2020, 246, 112402. [Google Scholar] [CrossRef]
- Fu, L.; Yang, M.; Sun, Y.; Tao, M. The Genetic Algorithm-Based Optimization Method for the Geometric and Material Parameters of Underwater Anechoic Coating. IEEE Access 2022, 10, 58030–58039. [Google Scholar] [CrossRef]
- He, C.; Li, Y.; Lyu, Y.; Song, G. Finite element simulation of ultrasonic reflection/transmission characteristics for composite bonded joints with thick adhesive layers. J. Beijing Univ. Aeronaut. Astronaut. 2021, 47, 1721–1728. [Google Scholar]
- Courant, R.; Friedrichs, K.; Lewy, H. Über die partiellen Differenzengleichungen der mathematischen Physik. Math. Ann. 1928, 100, 32–74. [Google Scholar] [CrossRef]
- Liu, J. Research on Ultrasonic Testing Method of Adhesive Quality of Multilayer Structure Based on COMSOL. Master’s Thesis, North University of China, Taiyuan, China, 2021. [Google Scholar]


| Medium | Density (kg/m3) | Sound Velocity or Speed of Sound (m/s) |
|---|---|---|
| Q235 | 7850 | 5890 |
| Air | 1.29 | 340 |
| Silicone Gel | 1200 | 2300 |
| Air Layer Thickness Q/μm | Reflectance Coefficient R | Resonance Frequency f/MHz | Theoretical Thickness Q/μm | Deviation of Air Layer Thickness μm | Percentage Deviation of Air Layer Thickness % |
|---|---|---|---|---|---|
| 30 | 0.013 | 5.61 | 30.6 | 0.6 | 2.0 |
| 50 | 0.067 | 3.41 | 50.2 | 0.2 | 0.4 |
| 70 | 0.024 | 2.41 | 71.1 | 1.1 | 1.5 |
| 90 | 0.114 | 1.91 | 89.7 | 0.3 | 0.3 |
| 110 | 0.049 | 1.51 | 113.6 | 3.6 | 3.2 |
| Air Layer Thickness Q/μm | Angle of Incidence (°) | ||||||
|---|---|---|---|---|---|---|---|
| 10 | 20 | 30 | 40 | 50 | 60 | 70 | |
| 0.03 | 5.81 | 6.41 | 7.31 | 8.11 | 8.81 | 9.31 | 9.61 |
| 0.04 | 4.41 | 4.81 | 5.51 | 6.11 | 6.61 | 7.01 | 7.21 |
| 0.05 | 3.51 | 3.91 | 4.41 | 4.91 | 5.31 | 5.61 | 5.81 |
| 0.06 | 2.91 | 3.21 | 3.71 | 4.11 | 4.41 | 4.71 | 4.81 |
| 0.07 | 2.51 | 2.81 | 3.11 | 3.51 | 3.81 | 4.01 | 4.11 |
| 0.08 | 2.21 | 2.41 | 2.71 | 3.01 | 3.31 | 3.51 | 3.61 |
| 0.09 | 2.01 | 2.21 | 2.41 | 2.71 | 2.91 | 3.11 | 3.21 |
| 0.10 | 1.71 | 1.91 | 2.21 | 2.41 | 2.61 | 2.81 | 2.91 |
| 0.11 | 1.61 | 1.81 | 2.01 | 2.21 | 2.41 | 2.51 | 2.61 |
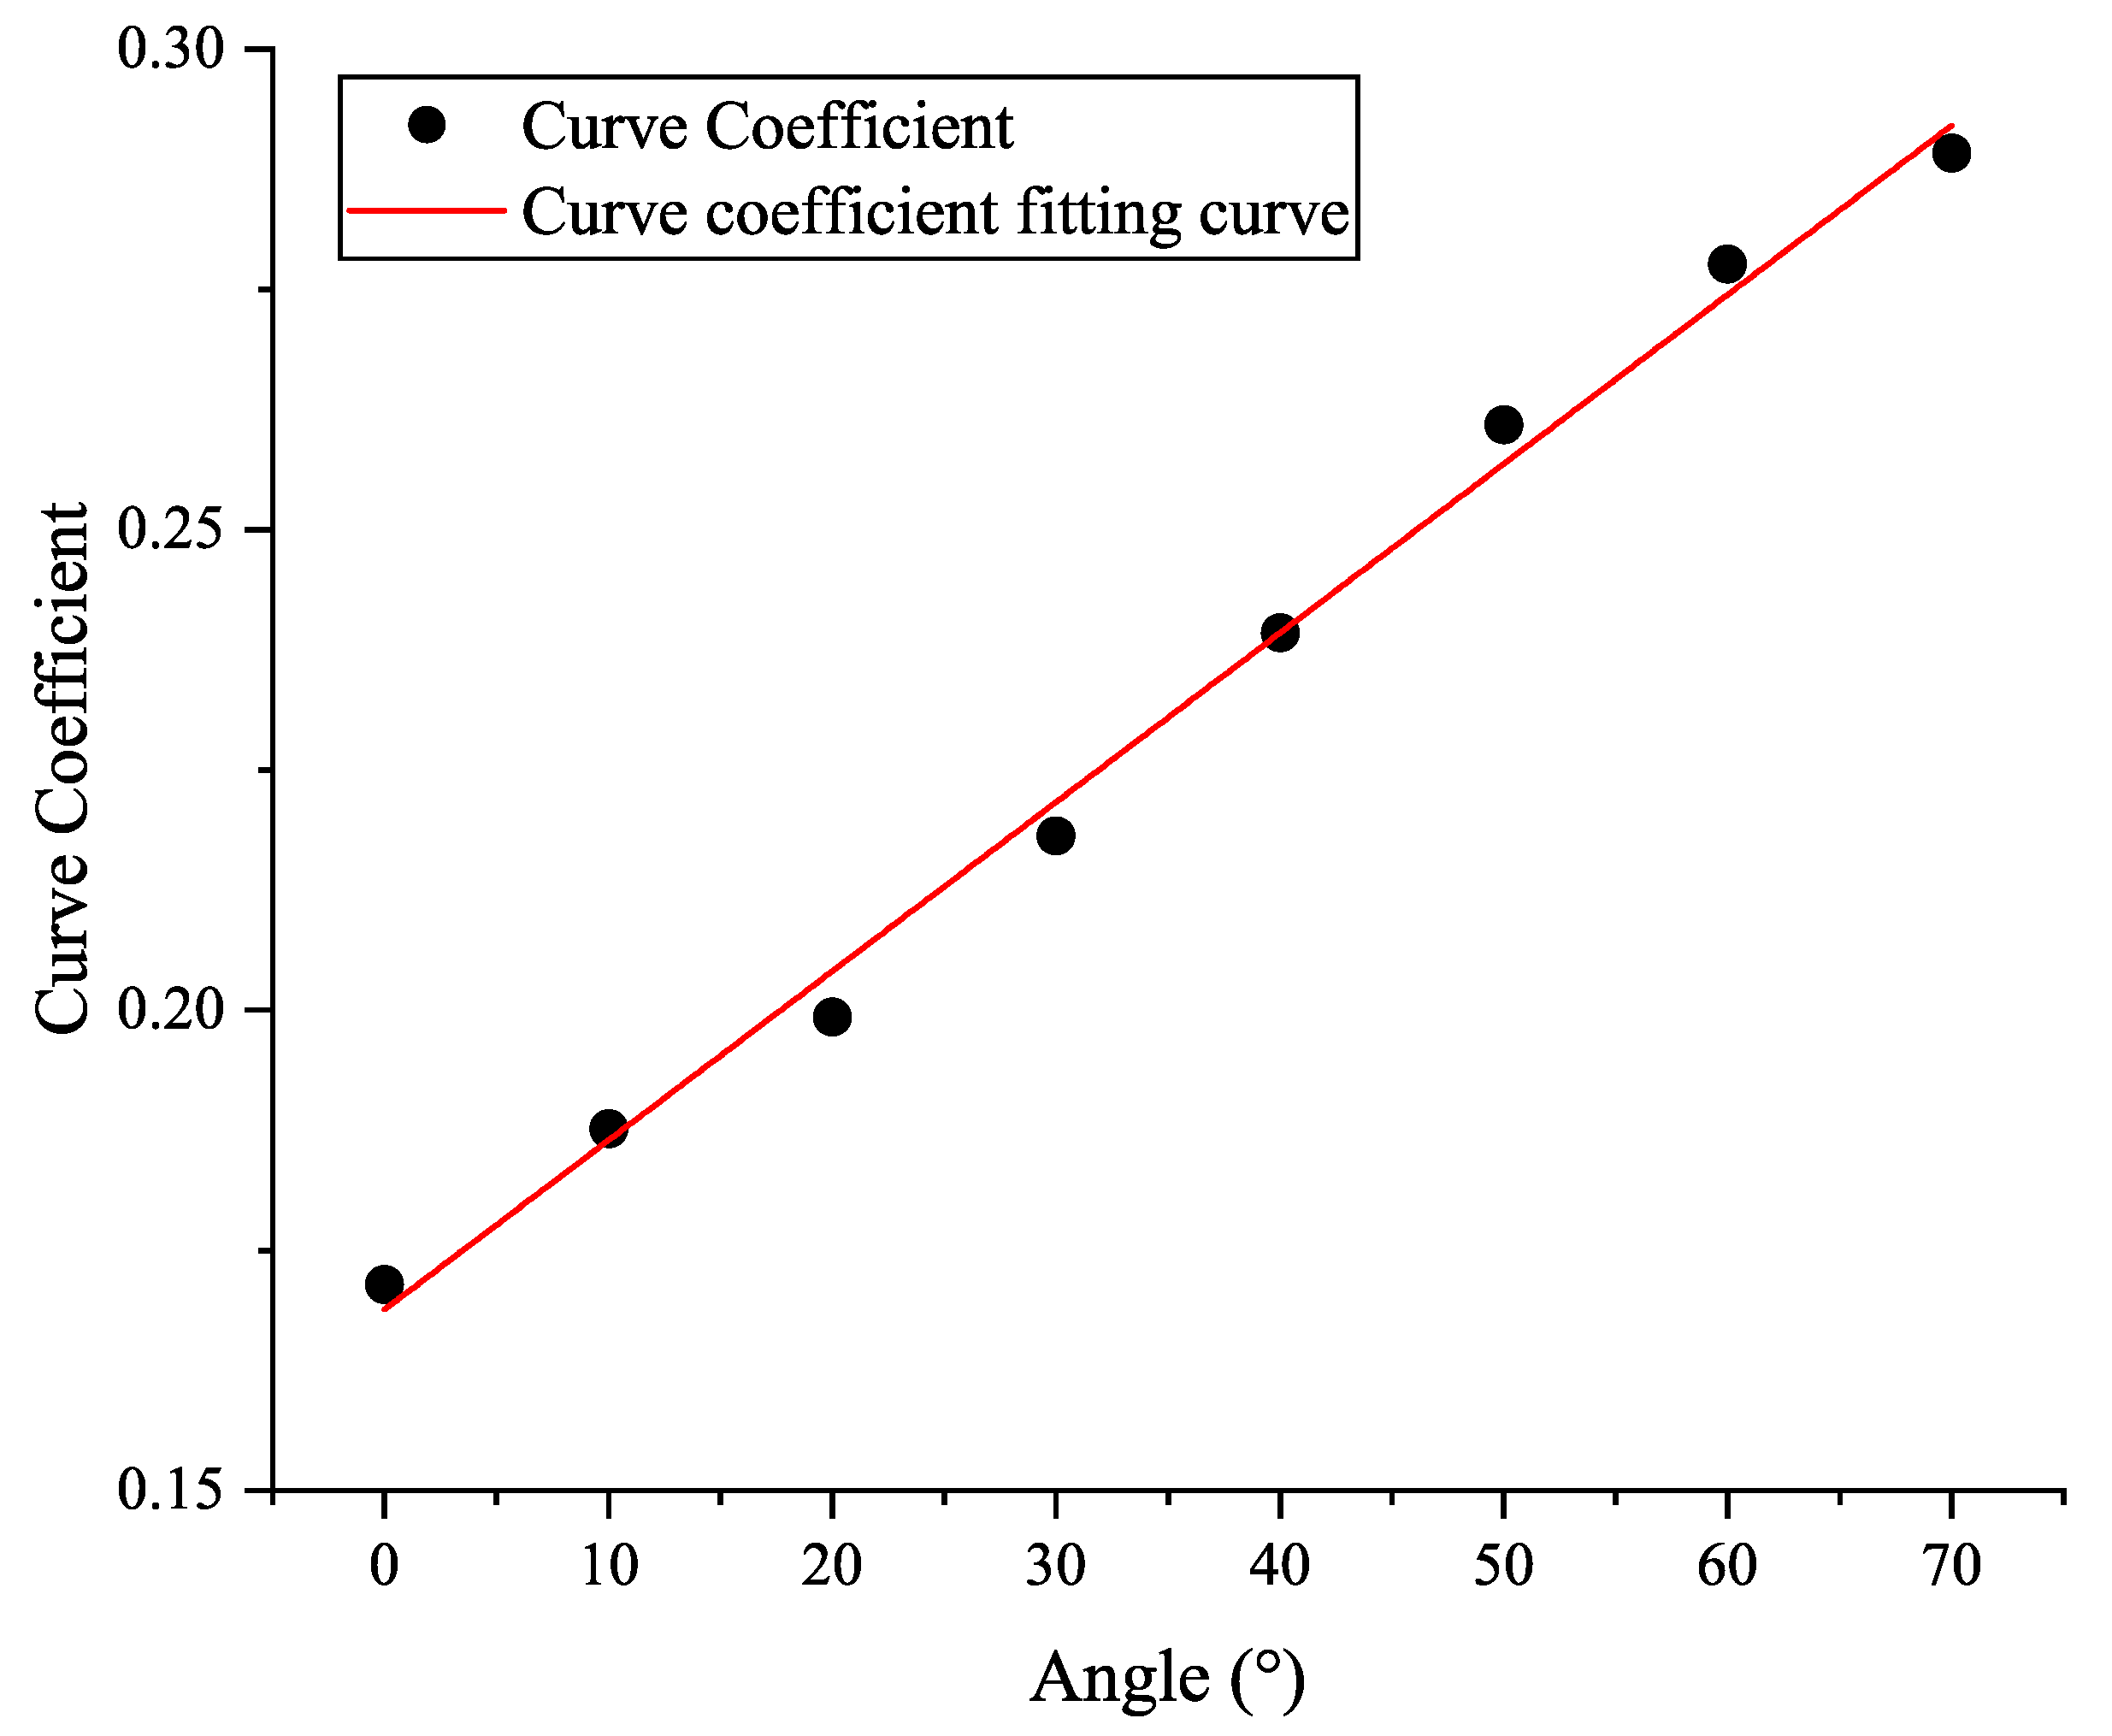
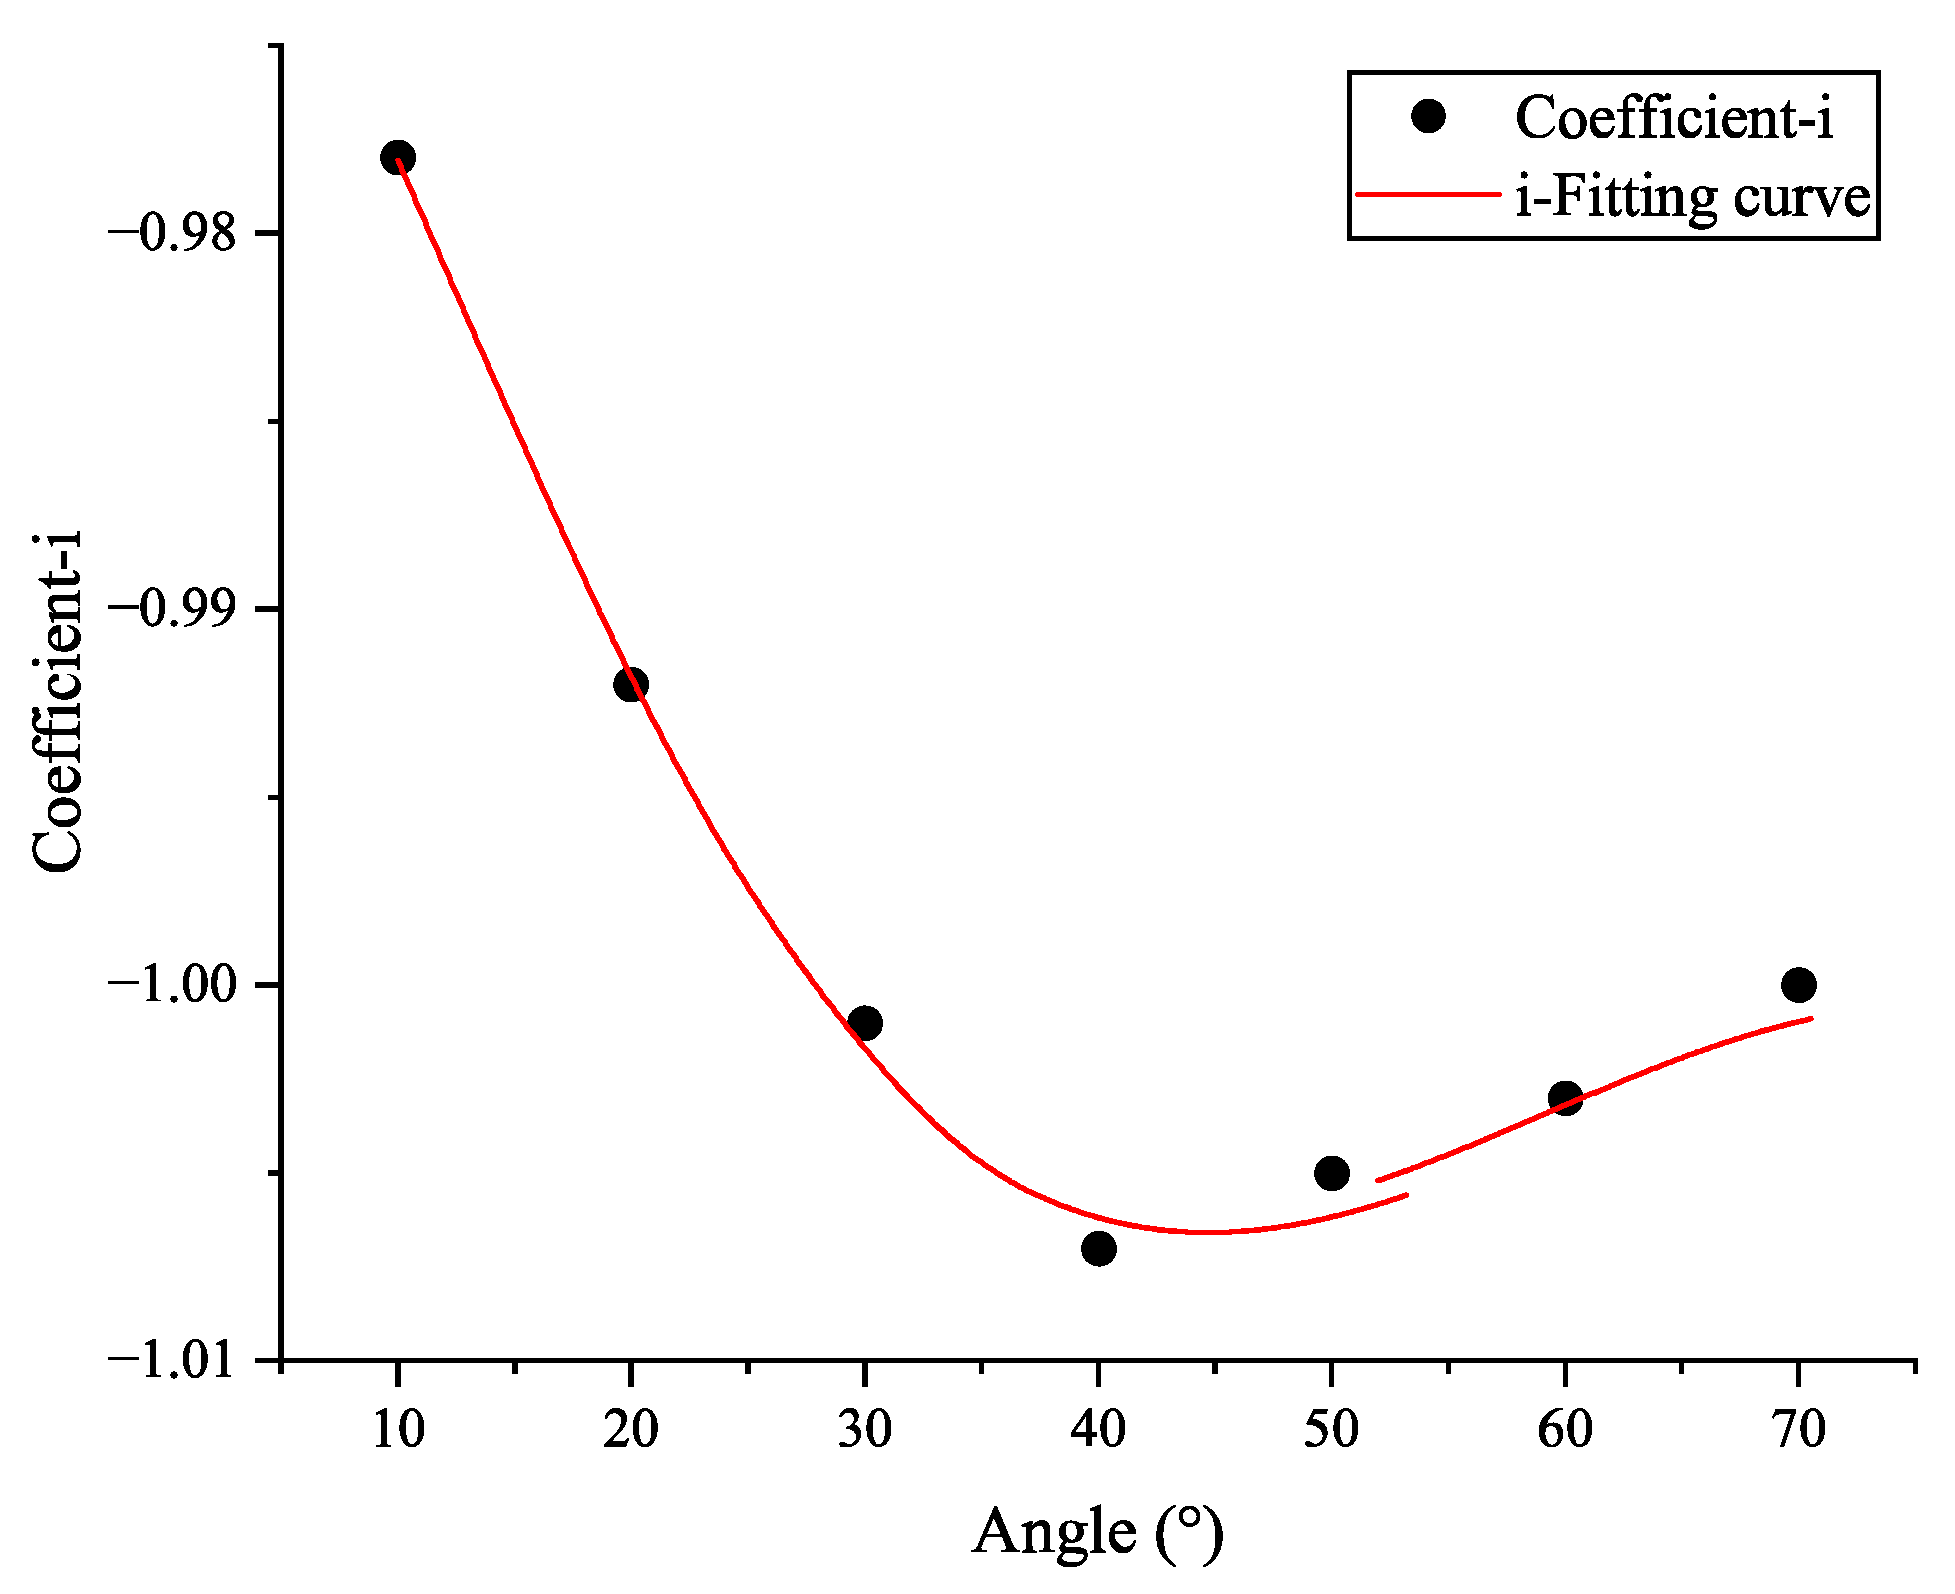
| Angle of Incidence (°) | 0 | 10 | 20 | 30 | 40 | 50 | 60 | 70 |
|---|---|---|---|---|---|---|---|---|
| Coefficient k | 0.1715 | 0.1877 | 0.1993 | 0.2182 | 0.2392 | 0.2609 | 0.2776 | 0.2891 |
| Exponent i | −1 | −0.978 | −0.992 | −1.001 | −1.007 | −1.005 | −1.003 | −1 |
| Type of Computation | Angle of Incidence (mm) | Air Layer Thickness (°) | |
|---|---|---|---|
| 0.03 | 0.05 | ||
| Mathematical calculation | 15 | 6.20 | 3.75 |
| 45 | 8.52 | 5.09 | |
| Finite element analysis | 15 | 6.11 | 3.61 |
| 45 | 8.41 | 5.01 | |
Disclaimer/Publisher’s Note: The statements, opinions and data contained in all publications are solely those of the individual author(s) and contributor(s) and not of MDPI and/or the editor(s). MDPI and/or the editor(s) disclaim responsibility for any injury to people or property resulting from any ideas, methods, instructions or products referred to in the content. |
© 2023 by the authors. Licensee MDPI, Basel, Switzerland. This article is an open access article distributed under the terms and conditions of the Creative Commons Attribution (CC BY) license (https://creativecommons.org/licenses/by/4.0/).
Share and Cite
Shang, F.; Sun, B.; Zhang, H. Measurement of Air Layer Thickness under Multi-Angle Incidence Conditions Based on Ultrasonic Resonance Reflection Theory for Flange Fasteners. Appl. Sci. 2023, 13, 6057. https://doi.org/10.3390/app13106057
Shang F, Sun B, Zhang H. Measurement of Air Layer Thickness under Multi-Angle Incidence Conditions Based on Ultrasonic Resonance Reflection Theory for Flange Fasteners. Applied Sciences. 2023; 13(10):6057. https://doi.org/10.3390/app13106057
Chicago/Turabian StyleShang, Fei, Bo Sun, and Honghui Zhang. 2023. "Measurement of Air Layer Thickness under Multi-Angle Incidence Conditions Based on Ultrasonic Resonance Reflection Theory for Flange Fasteners" Applied Sciences 13, no. 10: 6057. https://doi.org/10.3390/app13106057