1. Introduction
Investigation of seismic damage and experimental studies found [
1,
2,
3] that the failure of reinforced concrete columns is often the main reason for the collapse of building structures. Damage analysis of reinforced concrete columns under earthquakes can provide an important basis for revealing the collapse mechanism of building structures. Currently, solid element models combined with the corresponding concrete material damage models [
4,
5,
6,
7,
8] are usually used to analyze the damage of reinforced concrete members. However, due to the introduction of a large number of degrees of freedom, the computational cost is high, which makes the solid element model unsuitable for daily engineering applications. The fiber beam–column element model [
9,
10,
11,
12,
13,
14,
15] can not only simulate the mechanical properties of components macroscopically, but also provide deep insights into the local nonlinear characteristics of components; it also has high computational efficiency. Therefore, it has become the most active and widely used analysis model in the field of refined simulation of the nonlinear behavior of reinforced concrete structures. However, if the fiber element model is used to analyze the damage of reinforced concrete members, it is particularly important to combine it with the damage model of concrete and steel materials.
Heo [
16] proposed a damage model of reinforced concrete members based on material damage using the fiber element model. This model takes the damage index of the critical fiber of the compressive concrete in the core area and the critical fiber of the steel bar as the damage index of the section, ignoring the tensile damage of the concrete fiber. Saritas and Filippou [
17] combined a 3D plastic-damage concrete model with a fiber element to analyze the damage of reinforced concrete beams and columns, but did not consider the damage of steel materials. Li et al. [
18] and Gao et al. [
19] used the fiber element model combined with the Faria–Oliver uniaxial damage model [
20] to analyze the damage of reinforced concrete members, but the damage of steel material was not considered in their analysis. De Domenico et al. [
21] developed a fiber hinge formulation wherein the corrosion-induced mechanical degradation of concrete and steel was implemented. The yield load and the ultimate load of the corroded bars are calculated using the average mass loss. Gao et al. [
22] considered the damage and fracture of steel materials and analyzed the failure process of reinforced concrete columns under cyclic loading, but did not pay attention to the local damage of concrete, and the constitutive model of steel materials was not suitable for the simulation of members under earthquakes.
In order to analyze the seismic damage of reinforced concrete columns with a method that takes into account both the accuracy and efficiency of the calculation, based on the previously developed Refined Simulation and Analysis Platform for Structures (RSAPS) (formerly FENAP [
10]), this paper combines the previously established damage constitutive model of concrete and steel bar materials [
23] with the fiber element to establish the analysis method of damage simulation of reinforced concrete members. Using this method, the overall damage distribution and damage development process of the column can be visually presented. The possible damage degree and location of the column can be quickly predicted. The RSAPS platform was used to simulate the cyclic loading test and the shaking table test of reinforced concrete columns was used to verify the effectiveness of the established simulation method. Then, the seismic damage process of the reinforced concrete column was simulated and analyzed.
2. Analysis Model of Reinforced Concrete Columns
In this paper, the fiber beam–column element in the RSAPS platform was used to simulate the nonlinear mechanical properties of the reinforced concrete columns. The RSAPS platform was established on the basis of the user subroutine (UEL) interface of the software ABAQUS.
2.1. Fiber Beam–Column Element Model
The RSAPS platform includes a three-dimensional two-node fiber beam–column element model based on the stiffness method. The model is established based on the classical Euler–Bernoulli beam theory and the plane section assumption. The element displacement field is described using the following formula:
where,
is the axial displacement of the element calculated using Lagrange linear interpolation;
and
are the transverse displacements of the two orthogonal directions of the element, respectively, calculated using cubic Hermite polynomial interpolation;
is the matrix of the interpolation function; and
is the displacement vector of the node.
The relationship between the section deformation vector and the node displacement vector is as follows:
where,
is the axial strain of the
x section;
and
are the curvatures of the x section about the
y-axis and the
z-axis, respectively; and
is the geometric transformation matrix.
After the section deformation is determined, the strain of the
ith fiber in the section,
, can be determined according to the plane section assumption, where,
and
represent the geometric coordinates of the
ith fiber in the section, respectively. After that, the tangent stiffness
and stress
of the
ith fiber can be obtained according to the constitutive relationship of the fiber material. According to the contribution of all fiber stiffness in the section to the stiffness matrix of the section
and the contribution of fiber stress to the resistance vector of the section
, the following equations can be obtained:
where,
is the cross-sectional area of the
ith fiber.
According to the principle of virtual displacement, the resistance vector of the element
is derived as follows:
where,
is the element length.
According to Equation (5) and the section constitutive relation
, the stiffness matrix of the element
can be obtained as:
Equations (5) and (6) can be solved using the numerical integration method. The Gauss–Lobatto numerical integration method has integral points at the end of the element, which can consider the force of the end section of the element. Therefore, the Gauss–Lobatto numerical integration method was used in this paper. Four integral points were selected in the calculation, which meet the accuracy requirements.
2.2. Constitutive Model of the Material
2.2.1. Constitutive Model for Concrete
In this study, the concrete constitutive model proposed by Yassin [
24] (as shown in
Figure 1) was used. The model can simulate the continuous stiffness degradation effect and the hysteresis performance of concrete materials during unloading and reloading, as well as the constraint effect of stirrups on concrete.
To consider the damage behavior in the concrete model, the tensile and compressive damage indices were used to describe the tensile and compressive damage of concrete, respectively.
Based on the characteristics of the Yassin model and the basic principle of damage mechanics, the compression damage index is calculated as follows [
23]:
where,
is the concrete compression damage index;
is the initial compression damage module, determined according to the compression damage starting point
and the focus
; and
is the module of the current unloading point, determined according to the unloading point
and the focus
.
The concrete compressive damage occurs only in the loading stage, and new compressive damage will occur after the reloading reaches the previous unloading point. According to the study by Yue et al. [
25], the point with a stress of
on the skeleton curve is selected as the starting point of compressive damage. The compression damage index of concrete is shown in
Figure 2.
The tensile skeleton curve in the model is shown in
Figure 3.
is the maximum tensile stress;
is the strain corresponding to the maximum tensile stress;
is the initial tangent module; and
is the ultimate tensile strain.
The concrete tensile damage index is given as follows [
23]:
where,
is the secant module of the current unloading point; and
is the strain at the current unloading point.
The concrete tensile damage occurs only in the loading stage, and new tensile damage occurs after the reloading reaches the previous unloading point. The tensile damage index of concrete is shown in
Figure 4.
2.2.2. Constitutive Model for Steel Bar
In this study, the modified Menegotto–Pinto model [
26] was used to describe the stress–strain relationship of steel bars. The model can consider the isotropic strengthening effect [
27] and the Bauschinger effect under cyclic loading, and has high simulation accuracy and solution efficiency.
In order to make the modified Menegotto–Pinto constitutive model consider the damage and fracture behavior of steel bars, the Bonora damage model [
28] is used to simulate the damage characteristics of steel bars [
22]. The Bonora damage model, based on continuous damage mechanics, can simulate the damage performance of steel well using the nonlinear damage evolution criterion. The damage criterion of the Bonora damage model is as follows:
where,
is the damage increment;
is the initial damage value;
is the critical damage value;
is the cumulative damage value;
is the critical strain corresponding to the critical damage value;
is the threshold strain for the start of damage;
is the equivalent plastic strain increment;
is the equivalent plastic strain (plastic strain for the uniaxial constitutive model);
is the damage parameter; and
is the influence factor in the triaxial stress state, and is taken as 1 for the uniaxial constitutive model. In the analysis, the plastic strain
is obtained from the Menegotto–Pinto model. Other parameters are directly derived from Reference [
28].
The damage index
is calculated as follows:
Pirondi and Bonora [
29] modified the Bonora damage model to accommodate the cyclic loading. In the model, the steel bar is considered damaged only when it is subjected to tension. Therefore, only the tensile plastic strain is adopted when calculating the damage index. The stress–strain curve of the modified Menegotto–Pinto model considering damage is shown in
Figure 5, and the corresponding damage index is shown in
Figure 6.
3. Damage Simulation of Reinforced Concrete Columns
The fiber element model in the RSAPS platform was used to simulate the cyclic loading test and the shaking table test of reinforced concrete columns. The effectiveness of the RSAPS platform for damage analysis of reinforced concrete columns would be verified.
3.1. Cyclic Loading Test
Nagaya and Kawashima [
30] completed a series of quasi-static tests of reinforced concrete columns. In this paper, the specimen TP-29 was selected for simulation analysis. The effective height of the specimen was 1350 mm. The section size was 400 mm × 400 mm. The axial force was 150 kN. In the analysis model, specimen TP-29 was divided into ten fiber beam–column elements along with the height. Element division and section fiber discretization of specimen TP-29 are shown in
Figure 7. The mechanical properties of the concrete material and the steel material are given in
Table 1 and
Table 2, respectively.
Figure 8 shows a comparison between the analytical and experimental force–displacement hysteretic curves of the specimen TP-29. The result showed that numerical simulation can predict the force–displacement hysteretic curves of the specimen TP-29 with good accuracy. The RSAPS platform can provide a precise prediction of the stiffness and strength degradation of the specimen TP-29 under cyclic loading. However, the unloading stiffness of the specimen in the simulation is larger than that in the experiment. The main reason may be that the bond-slip between concrete and steel bars reduced the overall stiffness of the specimen, which was not considered in the simulation model. In the analysis, the steel bar was severely damaged and fractured. The stress–strain relationship of the steel bar is shown in
Figure 9.
Figure 10 shows the final damage distribution of the specimen TP-29. The ordinate represents the height of the specimen. The simulated tensile cracks on each surface (tensile damage index reached 1) were mainly within 30 cm at the bottom of the specimen. Surface E and surface W were more seriously damaged. Surface N and surface S showed large damage for the edge and relatively small damage for the central region. The simulated compression failure of each surface (compression damage index reached 1) was mainly within 20 cm at the bottom of the specimen. Surface E and surface W were damaged more seriously. The compression failure of surface N and surface S was mainly concentrated at the bottom edge, showing a triangular distribution inside. Through comparison, it was found that the simulated damage distribution of the specimen was consistent with the test result, which verified the validity of the damage analysis model.
3.2. Shaking Table Test
The RSAPS platform was used to simulate and analyze the two-direction loading shaking table test of the circular reinforced concrete column in Reference [
31]. The effective height of the specimen was 3000 mm. The section diameter was 600 mm. The element division and the fiber separation of the specimen are shown in
Figure 11. The mechanical properties of the concrete material and the steel material are given in
Table 3 and
Table 4, respectively. The Takatori station record during the Kobe Earthquake was used as the source of ground motion, as shown in
Figure 12. The maximum ground acceleration was 666 gal for the EW component (X-direction) and 642 gal for the NS component (Y-direction). The acceleration amplitude input in the test was 0.8 times that of the ground motion records.
The simulation results of the specimen displacement were compared with the experimental results in
Figure 13. It was found that the simulated displacement peak values and the corresponding moments in the X and Y directions were basically consistent with the experimental results, and the two curves were in good agreement before the displacement reached the peak. After the peak point, the specimen entered the plastic stage and the simulation results had a certain deviation from the experimental results. The main reason may be that the buckling of the longitudinal steel bars in the test reduced the overall stiffness of the specimen and increased the displacement response, which was not considered in the simulation model.
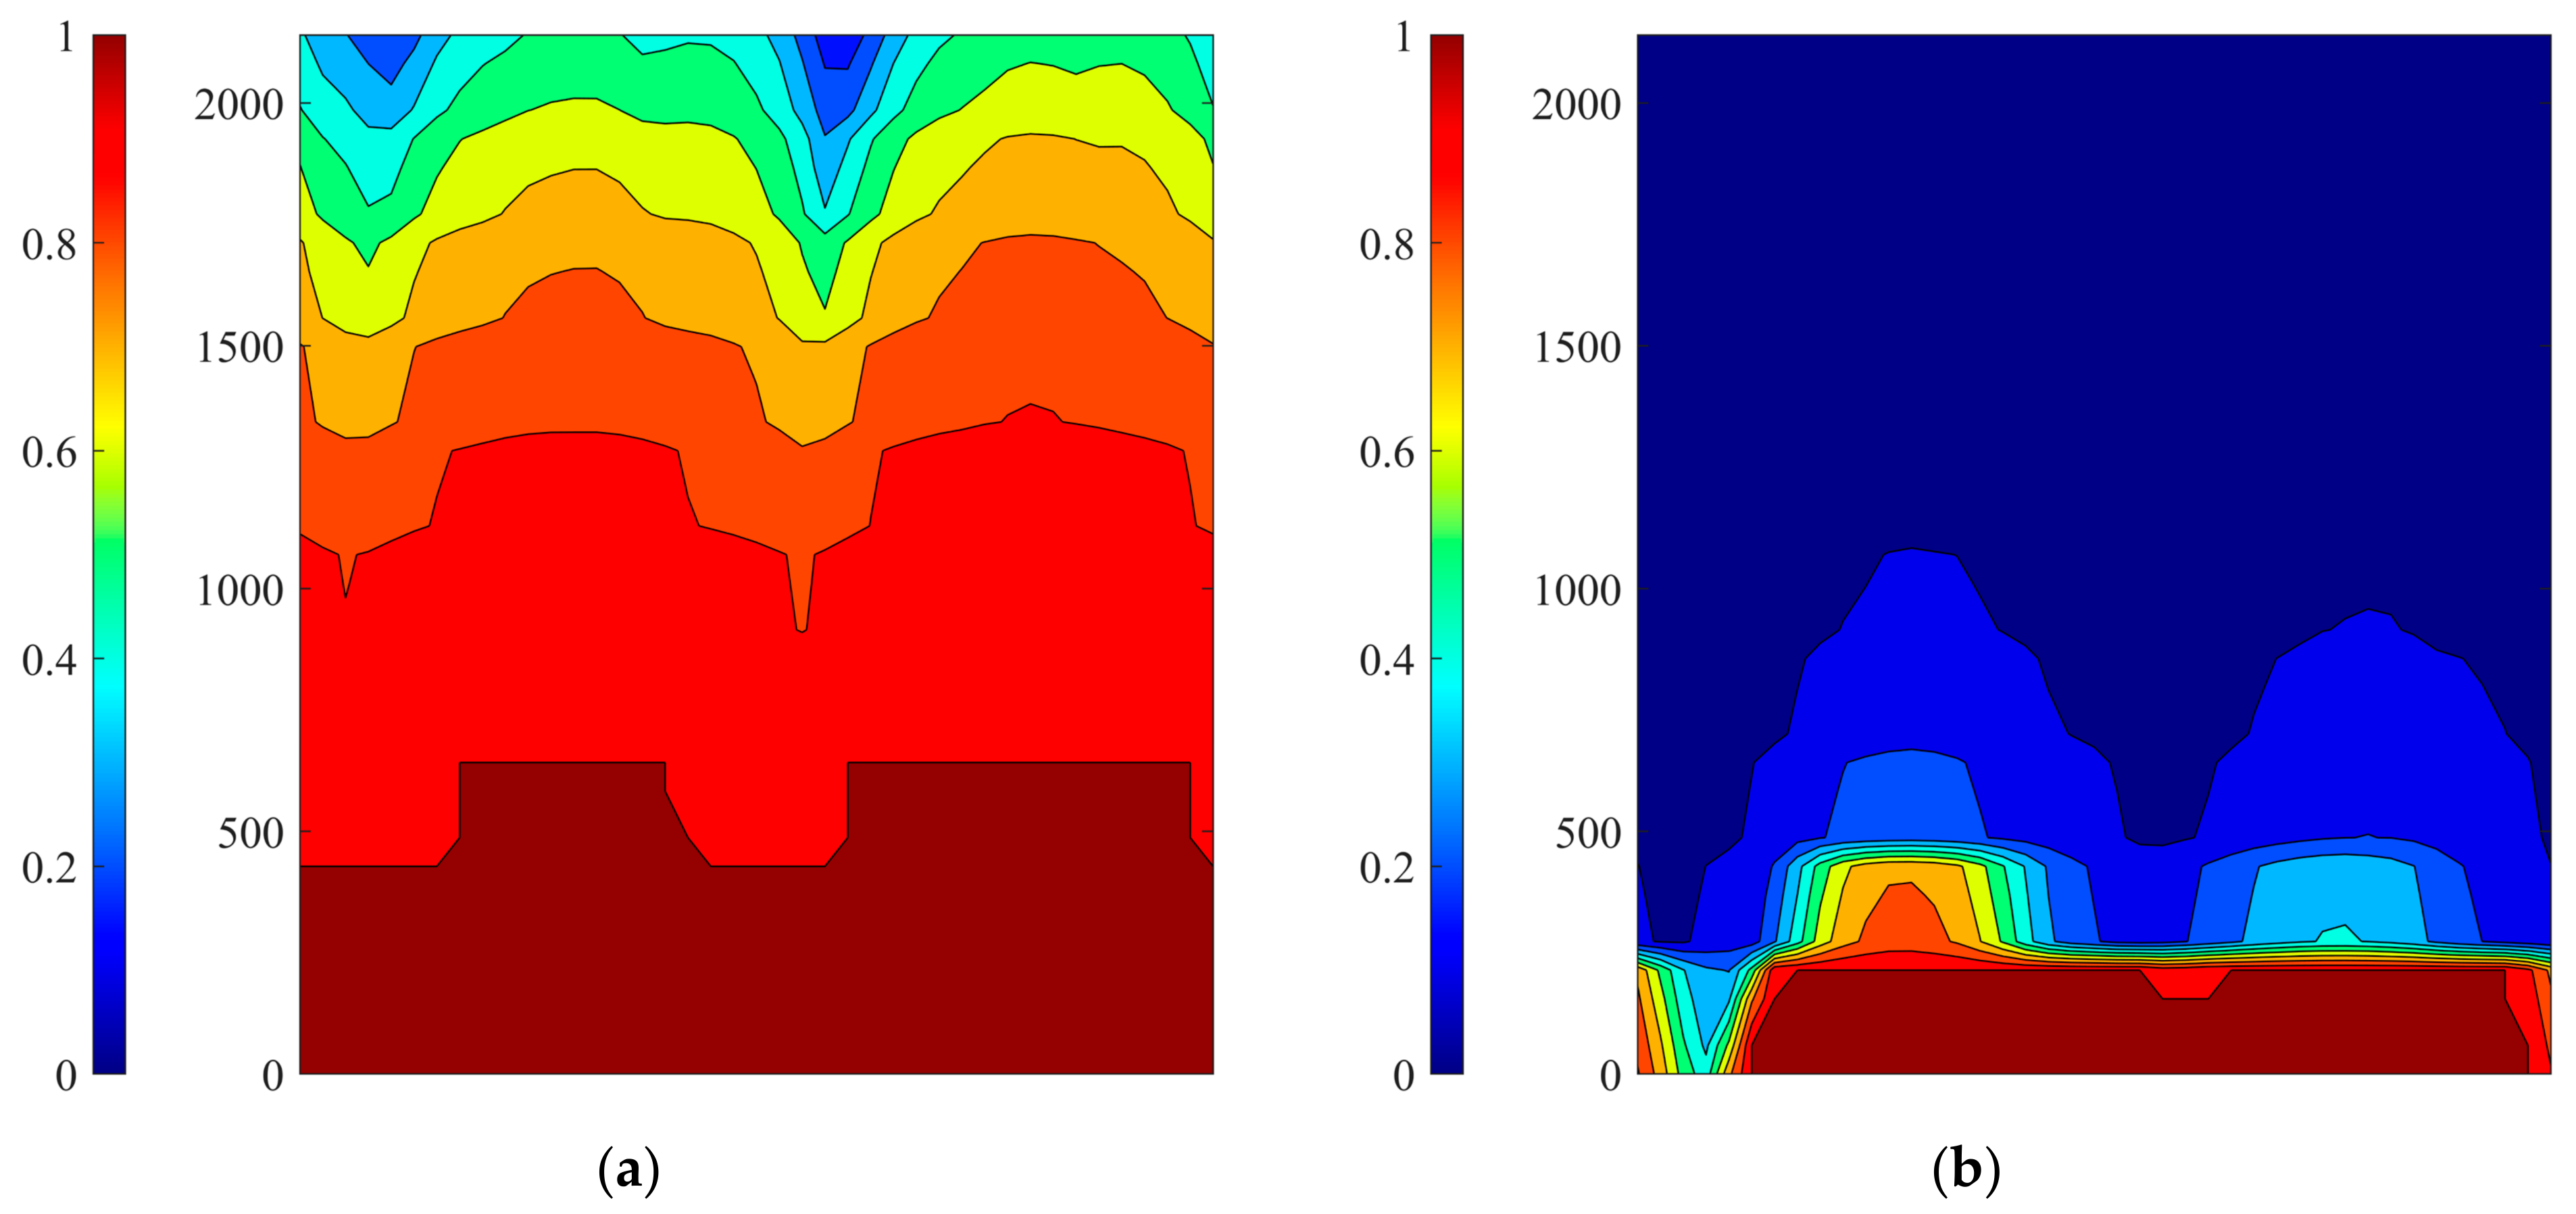
Figure 14 shows the final damage distribution of the specimen. The ordinate represents the height of the specimen. The simulated tensile cracks (tensile damage index reached 1) were found to be mainly within 700 mm at the bottom of the specimen, and the crack distribution was consistent with the experimental results. The simulated compressive failure (compressive damage index reached 1) was mainly within 250 mm at the bottom of the specimen. The compressive damage at the bottom edge was relatively small, which was consistent with the experimental results. The simulation results can show the failure parts of the specimen and the damage of the incomplete failure parts (damage index less than 1). The damage of the steel bars was found to be very small and no separate analysis was performed.
4. Analysis of the Seismic Damage Process of the Reinforced Concrete Column
In order to study the failure process of the specimen mentioned above and increase the damage response of the specimen, the amplitude of the ground motion was adjusted to 1.2 times of the ground motion record for input.
The displacement response is shown in
Figure 15. Due to the increasing amplitude of ground motion, the displacement response of the specimen also increased greatly. At 2.58 s, the displacement in the X-direction reached a maximum value of 174.50 mm. At 2.71 s, the displacement in the Y-direction reached the peak value of −244.51 mm.
The tensile damage of concrete at different times is shown in
Figure 16. The ordinate represents the height of the specimen. At 0.67 s, tensile damage occurred at all positions of the bottom of the specimen. The damage on the right side was greater than on the left side. The damage at the bottom of the specimen was the largest. At 1.10 s, the bottom of the specimen was fully damaged by tension. The height of the local damage reached 600 mm. At 2.04 s, the tensile failure occurred at a height of 500 mm at the bottom of the specimen. The most severe damage area changed from the middle lower part of the specimen to the right lower part. At 2.58 s, the displacement in the X-direction reached the maximum. Tensile failure occurred at a height of 600 mm at the bottom of the specimen. The height of tensile failure of the lower right part of the specimen reached 800 mm. At 2.71 s, the displacement in the Y-direction reached the maximum. The tensile failure range of the lower right part of the specimen increased slightly on both sides. The damage gradually developed to the upper part of the specimen. After that, although the specimen was still subjected to the earthquake, only the local tensile damage of the specimen increased slightly. At 7.75 s, the tensile damage of the specimen reached the final state. Although the ground motion continued, the damage did not continue to develop. At this time, the damage index in most areas of the specimen exceeded 0.5, and only a very small area at the top had less damage.
The compression damage of concrete at different times is shown in
Figure 17. The ordinate represents the height of the specimen. At 1.05 s, compression damage occurred in all areas of the bottom of the specimen, but the degree of damage was small. Only the small area on the lower right had large compression damage. At 2.04 s, compressive failure occurred in the middle of the bottom of the specimen and in the edges of both sides. The damage height was within 200 mm. At 2.58 s, the displacement in the X-direction reached maximum. The bottom compression failure areas increased in a wide range. The height of some compression failure areas was close to 500 mm. At 2.71 s, the displacement in the Y-direction reached maximum. The range and degree of compression damage only increased slightly. After that, the damage of the specimen slowly developed. At 5.43 s, only compressive damage in the lower left region of the specimen increased slightly. At 7.75 s, the damage of only a small part of the specimen increased slightly. At this time, the compressive damage of the specimen reached the final state. Although it was still subjected to ground motion, the damage did not continue to develop.
The damage of the steel bars was found to be very small and the maximum damage index is only 0.05, which was not analyzed separately.
5. Discussion
The RSAPS platform can accurately simulate the nonlinear mechanical properties of reinforced concrete members [
10,
19,
22], but it is still insufficient in the damage analysis of members considering the damage of steel and concrete materials. This study combined the fiber element model with the damage constitutive model of concrete and steel bars. Then, the RSAPS platform can consider the damage behavior of steel and concrete materials, and accurately simulate the nonlinear mechanical properties of members. The RSAPS platform can be applied to the seismic damage analysis of reinforced concrete members, which provides a basis for revealing the failure mechanism of members.
The RSAPS platform can display the damage distribution and material damage of the members. However, it cannot provide the damage index of the members. In future research, the damage model of members based on the damage of steel and concrete materials will be studied.
The fiber element model used in this paper does not consider the influence of shear deformation, and can only be used to simulate the mechanical properties of columns dominated by flexural failure. Some fiber element models [
12,
32] considering shear deformation have been proposed. In future research, the multi-dimensional damage constitutive model can be further combined with the fiber element to consider the damage of the members while considering the shear damage effect.
6. Conclusions
Based on the RSAPS platform developed previously, this paper combined the fiber element model with the damage constitutive model of concrete and steel bars. The method of damage analysis of reinforced concrete members was established on the basis of the fiber element model. The RSAPS platform was used to simulate the quasi-static test of a reinforced concrete column. It was found that the fiber element model can simulate the degradation of the strength and stiffness of the column. The obtained hysteresis curve was in good agreement with the test results. The damage distribution of the simulated specimen was consistent with the experimental results. Through the simulation analysis of the column in the shaking table test, it was found that the fiber element model can effectively simulate the nonlinear dynamic behavior and damage distribution of the reinforced concrete column. The simulated displacement peak values and the corresponding moments in the X and Y directions were basically consistent with the experimental results. Furthermore, the simulation model can predict the process of the column damage evolution and intuitively describe weak parts of the column with high computational efficiency and precision, providing a practical analysis method for the analysis of the seismic collapse process of building structures. The method proposed in this paper can quickly predict the possible damage degree and location of the columns, which can provide a basis for the rapid evaluation of the columns. In addition, this method can reproduce the post-earthquake damage of the columns and provide an important reference for the post-earthquake repair work of the columns.
However, in this model, the bond-slip between concrete and steel bars and the buckling of the longitudinal steel bars were not considered. This leads to an overestimation of the stiffness of the specimen in the simulation.
Author Contributions
Conceptualization, Y.G. and Y.H.; methodology, Y.G. and L.Z.; software, Y.G. and L.Z.; writing—original draft preparation, Y.G. and Z.Z.; writing—review and editing, Y.G. and Y.H.; funding acquisition, Y.G. All authors have read and agreed to the published version of the manuscript.
Funding
This research was funded by the National Natural Science Foundation of China (Grant No. 52108481)
and the Fundamental Research Program of Shanxi Province (Grant No. 202103021223211 and Grant No. 202203021212119).
Institutional Review Board Statement
Not applicable.
Informed Consent Statement
Not applicable.
Data Availability Statement
The data presented in this study are available on request from the corresponding author.
Conflicts of Interest
The authors declare no conflict of interest.
References
- Ye, L.; Lu, X.; Zhao, S.; Li, Y. Seismic collapse resistance of RC frame structures—Case studies on seismic damage of several RC frame structures under extreme ground motion in Wenchuan Earthquake. J. Build. Struct. 2009, 30, 67–76. (In Chinese) [Google Scholar]
- Gu, X.; Huang, Q.; Wang, X.; Lin, F.; Peng, B. Spatial collapse responses of reinforced concrete frame structures under earthquake—Test study and numerical simulation. China Civ. Eng. J. 2012, 45, 36–45. (In Chinese) [Google Scholar]
- Luo, H.; Du, K.; Sun, J.; Xu, W.; Ding, B. Shaking table test on complete collapse process of RC frame structure subjected to earthquake. J. Build. Struct. 2017, 38, 49–56. (In Chinese) [Google Scholar]
- Xue, X.; Yang, X. A damage model for concrete under cyclic actions. Int. J. Damage Mech. 2014, 23, 155–177. [Google Scholar] [CrossRef]
- Contrafatto, L.; Cuomo, M. A framework of elastic–plastic damaging model for concrete under multiaxial stress states. Int. J. Plast. 2006, 22, 2272–2300. [Google Scholar] [CrossRef]
- Al-Rub, R.K.A.; Kim, S.-M. Computational applications of a coupled plasticity-damage constitutive model for simulating plain concrete fracture. Eng. Fract. Mech. 2010, 77, 1577–1603. [Google Scholar] [CrossRef]
- Taqieddin, Z.N.; George, Z.V. Elastic plastic and damage model for concrete materials: Part II: Implementation and application to concrete and reinforced concrete. Int. J. Struct. Chang. Solids 2009, 1, 187–209. [Google Scholar]
- Gong, F.; Maekawa, K. Multi-scale simulation of freeze-thaw damage to RC column and its restoring force characteristics. Eng. Struct. 2018, 156, 522–536. [Google Scholar] [CrossRef]
- Spacone, E.; Filippou, F.C.; Taucer, F.F. Fibre beam-column model for non-linear analysis of R/C frames: Part I. Formulation. Earthq. Eng. Struct. Dyn. 1996, 25, 711–725. [Google Scholar] [CrossRef]
- Zhuo, Y.; Li, Z. A practical simulation platform of reinforced concrete fiber beam-column element. Eng. Mech. 2011, 28, 102–108. (In Chinese) [Google Scholar]
- Casarotti, C.; Pinho, R. Seismic response of continuous span bridges through fiber-based finite element analysis. Earthq. Eng. Eng. Vib. 2006, 5, 119–131. [Google Scholar]
- Li, Z.-X.; Gao, Y.; Zhao, Q. A 3D flexure–shear fiber element for modeling the seismic behavior of reinforced concrete columns. Eng. Struct. 2016, 117, 372–383. [Google Scholar] [CrossRef]
- Chen, T.; Huang, Z. Comparison between flexibility-based and stiffness-based geometrically nonlinear beam-column elements. Eng. Mech. 2005, 22, 31–38. (In Chinese) [Google Scholar]
- Chen, T.; Huang, Z. Flexibility-based finite element method for inelastic seismic response analysis of reinforced concrete space frames. J. Build. Struct. 2004, 25, 78–84. (In Chinese) [Google Scholar]
- Nie, J.; Tao, M. Theory of seismic response analysis of steel-concrete composite structures using fiber beam elements. J. Build. Struct. 2011, 32, 1–10. (In Chinese) [Google Scholar]
- Heo, Y.A. Framework for Damage-Based Probabilistic Seismic Performance Evaluation of Reinforced Concrete Frames. Ph.D. Thesis, University of California, Davis, CA, USA, 2009. [Google Scholar]
- Saritas, A.; Filippou, F.C. Numerical integration of a class of 3d plastic-damage concrete models and condensation of 3d stress–strain relations for use in beam finite elements. Eng. Struct. 2009, 31, 2327–2336. [Google Scholar] [CrossRef]
- Li, Z.; Chen, Y.; Li, N. A damage model for reinforced concrete members based on material damage. Eng. Mech. 2014, 31, 53–59. (In Chinese) [Google Scholar]
- Gao, Y.; Li, Z.-X.; Li, N. Damage analysis of reinforced concrete members based on RSAPS. J. Tianjin Univ. (Sci. Technol.) 2017, 50, 345–350. (In Chinese) [Google Scholar]
- Li, Z.; Hatzigeorgiou, G.D. Seismic damage analysis of RC structures using fiber beam-column elements. Soil Dyn. Earthq. Eng. 2012, 32, 103–110. [Google Scholar] [CrossRef]
- De Domenico, D.; Messina, D.; Recupero, A. Seismic vulnerability assessment of reinforced concrete bridge piers with corroded bars. Struct. Concr. 2023, 24, 56–83. [Google Scholar] [CrossRef]
- Gao, Y.; Liu, L.; Wang, W. Analysis of failure process of reinforced concrete columns under cyclic loading based on fiber beam-column element. Sci. Technol. Eng. 2019, 19, 219–226. (In Chinese) [Google Scholar]
- Gao, Y.; Chen, J.; Zheng, L. Seismic response and damage analysis of an isolated bridge subjected to near-fault ground motion. Appl. Sci. 2022, 12, 4878. [Google Scholar] [CrossRef]
- Mohd-Yassin, M.H. Nonlinear analysis of prestressed concrete structures under monotonic and cyclic loads. Ph.D. Thesis, University of California, Berkeley, CA, USA, 1994. [Google Scholar]
- Yue, J.; Qian, J.; Beskos, D.E. A generalized multi-level seismic damage model for RC framed structures. Soil Dyn. Earthq. Eng. 2016, 80, 25–39. [Google Scholar] [CrossRef]
- Menegotto, M.; Pinto, P.E. Slender RC compressed members in biaxial bending. J. Struct. Eng. 1977, 103, 587–605. [Google Scholar] [CrossRef]
- Filippou, F.C.; Popov, E.P.; Bertero, V.V. Effects of Bond Deterioration on Hysteretic Behavior of Reinforced Concrete Joints; EERC Report 83/19; Earthquake Engineering Research Center, University of California: Berkeley, CA, USA, 1983. [Google Scholar]
- Bonora, N. A nonlinear CDM model for ductile failure. Eng. Fract. Mech. 1997, 58, 11–28. [Google Scholar] [CrossRef]
- Pirondi, A.; Bonora, N. Modeling ductile damage under fully reversed cycling. Comput. Mater. Sci. 2003, 26, 129–141. [Google Scholar] [CrossRef]
- Nagaya, K.; Kawashima, K. Effect of Aspect Ratio and Longitudinal Reinforcement Diameter on Seismic Performance of Reinforced Concrete Bridge Columns; Report No. TIT/EERG 01; Tokyo Institute of Technology: Tokyo, Japan, 2001. [Google Scholar]
- Nishida, H.; Unjoh, H. Dynamic response characteristic of reinforced concrete column subjected to bilateral earthquake ground motions. In Proceedings of the 13th World Conference on Earthquake Engineering, Vancouver, BC, Canada, 6 August 2004. [Google Scholar]
- Salgado, R.A.; Guner, S. A comparative study on nonlinear models for performance-based earthquake engineering. Eng. Struct. 2018, 172, 382–391. [Google Scholar] [CrossRef]
Figure 1.
Yassin’s model for concrete.
Figure 1.
Yassin’s model for concrete.
Figure 2.
The concrete compression damage index.
Figure 2.
The concrete compression damage index.
Figure 3.
Tensile model of concrete.
Figure 3.
Tensile model of concrete.
Figure 4.
The concrete tensile damage index.
Figure 4.
The concrete tensile damage index.
Figure 5.
The modified Menegotto–Pinto model considering damage.
Figure 5.
The modified Menegotto–Pinto model considering damage.
Figure 6.
The damage index of the steel bar.
Figure 6.
The damage index of the steel bar.
Figure 7.
The element division and the fiber separation of the specimen TP-29.
Figure 7.
The element division and the fiber separation of the specimen TP-29.
Figure 8.
Force–displacement hysteretic curves of specimen TP-29.
Figure 8.
Force–displacement hysteretic curves of specimen TP-29.
Figure 9.
The stress–strain relationship of the steel bar.
Figure 9.
The stress–strain relationship of the steel bar.
Figure 10.
Final damage distribution of specimen TP-29. (
a) Tensile damage; (
b) Compression damage; (
c) Test result [
30].
Figure 10.
Final damage distribution of specimen TP-29. (
a) Tensile damage; (
b) Compression damage; (
c) Test result [
30].
Figure 11.
The element division and the fiber separation of the specimen.
Figure 11.
The element division and the fiber separation of the specimen.
Figure 12.
Takatori station record. (a) X-direction; (b) Y-direction.
Figure 12.
Takatori station record. (a) X-direction; (b) Y-direction.
Figure 13.
Time history of displacement. (a) X-direction; (b) Y-direction.
Figure 13.
Time history of displacement. (a) X-direction; (b) Y-direction.
Figure 14.
Final damage distribution of the specimen. (
a) Tensile damage; (
b) Compression damage; (
c) Test result [
31].
Figure 14.
Final damage distribution of the specimen. (
a) Tensile damage; (
b) Compression damage; (
c) Test result [
31].
Figure 15.
Time history of displacement. (a) X-direction; (b) Y-direction.
Figure 15.
Time history of displacement. (a) X-direction; (b) Y-direction.
Figure 16.
The tensile damage of concrete. (a) At 0.67 s; (b) At 1.10 s; (c) At 2.04 s; (d) At 2.58 s; (e) At 2.71 s; (f) At 7.75 s.
Figure 16.
The tensile damage of concrete. (a) At 0.67 s; (b) At 1.10 s; (c) At 2.04 s; (d) At 2.58 s; (e) At 2.71 s; (f) At 7.75 s.
Figure 17.
The compression damage of concrete. (a) At 1.05 s; (b) At 2.04 s; (c) At 2.58 s; (d) At 2.71 s; (e) At 5.43 s; (f) At 7.75 s.
Figure 17.
The compression damage of concrete. (a) At 1.05 s; (b) At 2.04 s; (c) At 2.58 s; (d) At 2.71 s; (e) At 5.43 s; (f) At 7.75 s.
Table 1.
Parameters of the concrete material.
Table 1.
Parameters of the concrete material.
| Concrete | | | | |
|---|
| Cover | −29.4 | −0.002 | −0.005 | 2.94 |
| Core | −32.3 | −0.0022 | −0.012 | 2.94 |
Table 2.
Parameters of the steel material.
Table 2.
Parameters of the steel material.
| | | | | | | |
|---|
| 210 | 372 | 0.015 | 0.259 | 1.4 | 0.065 | 0.0 | 0.2175 |
Table 3.
Parameters of the concrete material.
Table 3.
Parameters of the concrete material.
| Concrete | | | | |
|---|
| Cover | −33.7 | −0.002 | −0.005 | 3.37 |
| Core | −37.9 | −0.0031 | −0.012 | 3.37 |
Table 4.
Parameters of the steel material.
Table 4.
Parameters of the steel material.
| | | | | | | |
|---|
| 179 | 372 | 0.015 | 0.259 | 1.4 | 0.065 | 0.0 | 0.2175 |
| Disclaimer/Publisher’s Note: The statements, opinions and data contained in all publications are solely those of the individual author(s) and contributor(s) and not of MDPI and/or the editor(s). MDPI and/or the editor(s) disclaim responsibility for any injury to people or property resulting from any ideas, methods, instructions or products referred to in the content. |
© 2023 by the authors. Licensee MDPI, Basel, Switzerland. This article is an open access article distributed under the terms and conditions of the Creative Commons Attribution (CC BY) license (https://creativecommons.org/licenses/by/4.0/).


