Article

Investigation of the Mechanical Properties of Spur Involute Gearing by Infrared Thermography

1
Department of Applied Mechanics, Faculty of Mechanical Engineering, University of Zilina, Univerzitná 8215/1, 010 26 Žilina, Slovakia
2
Department of Applied Mechanics and Mechanical Engineering, Faculty of Mechanical Engineering, Technical University of Košice, Letná 9, 042 00 Košice, Slovakia
*
Author to whom correspondence should be addressed.
Appl. Sci. 2023, 13(10), 5988; https://doi.org/10.3390/app13105988
Submission received: 31 March 2023 / Revised: 10 May 2023 / Accepted: 11 May 2023 / Published: 12 May 2023
(This article belongs to the Special Issue Optical Methods in Applied Mechanics)

Abstract

:
The work aims at validating a methodology for 3D printing of gears with involute gearing and evaluating their mechanical properties using infrared camera. A general methodology for the setup of 3D printing of gears made of polymeric materials has been developed, which can be used in technical practice in order to replace parts produced by conventional methods. An experiment was prepared determination of the distribution of the 1st invariant of the stress tensor and phase shift using a modal exciter and an IR camera. The values of the 1st invariant of the stress invariant were found. For these measurements, the lock-in thermography method was used, using a modal exciter we force loaded a gear in which the response to the load was registered. The aim was to obtain the distribution of the strain or stress field on the loaded tooth. The experimental method used also belongs to the field of non-destructive testing (NDT), and with suitable experimental parameters we can also obtain information from the layers below the surface, as demonstrated in the phase images. The practical benefit is to provide a competitive advantage to companies that will exploit the properties of polymeric materials by knowing the mechanical properties of these materials.

1. Introduction

In current practice, we are faced with the requirement to reduce costs and make production more efficient. This requirement is often realised by reducing the weight of the manufactured objects and by using technologies that automate production, simplify it and reduce the required production time. Another technology that enables manufacturers to achieve the desired benefits is 3D printing. This is a major technological phenomenon that is fundamentally changing the approach to all areas of technology. This technology is variable and allows the production of very complex objects that would be impossible to produce using today’s conventional methods. Currently, one of the most widespread, most accessible and cheapest methods is the additive method. The availability of materials for the common user, if these materials are, for example, PLA (Polylactic acid), PETG (terephthalate), ABS (Arylonitrile butadiene styrene) and HIPS (high impact polystyrene), also contributes to the popularity of the method. Over time, however, companies have begun to offer more sophisticated 3D printing technologies in materials such as titanium, steel, aluminum, copper, rubber, and composite. The pace of technological growth in 3D printing is enormous and much of it is still unexplored [1,2].
The design of functional parts and their quality is critically dependent on accurate dimensions. With additive methods, it is necessary to be aware of the factors that enter as causes of inaccuracies. Inaccuracies can vary based on the materials that are used and also depend on the geometry of the part being printed. Inaccuracies can arise due to software reasons. When generating the model in STL format, some details may be converted to simpler surfaces or may be lost. Errors can also occur when interpolating the vertices of the STL file in the program that generates the G-code for the 3D print. There are also several ways in which inaccuracies can arise for mechanical reasons during printing of the object. These include 3D printer stepper motors, which have specified feedforward accuracy in three coordinate axes. Other inaccuracies can arise from inadequate tension in the belt drive, over or under extrusion of the filament [3].
The dimensional characteristics of gears are generally very sensitive to manufacturing precision. Therefore, gears with a smaller modulus may have a problem with manufacturing accuracy. Wheels that are dimensionally larger are stronger and better able to cope with tolerance errors in two-wheel engagement [4,5]. Also, shrinkage of internal holes is a common problem in 3D printing. Mostly it is caused by thermal contraction of the printed material. Another reason is the previously mentioned problem of generating the model in STL format. Then polygons are created and then the inner hole does not have the shape of a curved cylindrical surface, but on this surface there are detectable polygonal lines and this approximated shape is the starting point when generating the G-code for the 3D printer.
The vast majority of printed gears are made from one type of material such as nylon, PLA, PETG or ABS. This is because these technologies are more affordable and less costly for those materials. They have excellent wear resistance properties [6]. ABS has good impact strength. PLA cannot tolerate temperatures higher than 45 to 50 °C [7,8]. However, the problem of low production costs needs to be addressed along with the maintenance of the mechanical parameters of the wheels. In a publication [9], they compare the engagement of gears made of the materials: cast steel and carbon fiber (50%) in an epoxy matrix. Simulations in Ansys show that the induced stresses of the gear made of composite materials are smaller compared to the cast steel gear. The bending stress has been similarly simulated and experimentally tested in [10]. When comparing nylon and steel, it is important to note that the displacement values were one times higher than steel. The bending strength of the wheel tooth was experimentally tested, where the specific value for Nylon was a maximum of 4.6 kN, and for steel it was up to 65 kN. In a study [11], stress analysis was carried out and the stress values that were calculated for composite materials are approximately the same compared to structural steel, grey cast iron and aluminium alloy. So, from these analysis results, we concluded that the induced stress and strain of composite spur gear are almost equal compared to spur gear made of structural steel, grey cast iron and aluminium alloy. In this paper, they further publish the claim that substituting gears made by conventional methods for gears made of composite materials is a relevant alternative. After considering a number of input factors, this is an interesting claim that defies standard notions.
In this paper [12], tooth contact analyses of spur gears are carried out through finite element analysis for the materials: glass fiber/epoxy composite, PEEK (Polyetheretherketone) and steel. A general finite element model has been developed to evaluate the contact stress in spur gears of the same geometry. From the result, it can be concluded that the deformation of the gear made of composite material is a little higher compared to the steel gear but it is lower than the values determined for the plastic gear. Since the rotational speed of the gear affects the analyzed mechanical properties of the materials such as stress and strain, so these analyses were performed for 2 different rotational speeds. It was concluded that the composite material has better alternative for steel and plastic material. In this publication [13], gears were printed from four polymeric materials namely ABS, Nylon 12, PC (Polycarbonate) and PLA. The result confirmed that Nylon wheel has 35% better mechanical properties compared to the other mentioned materials. In terms of durability and operational ease, lubrication of Nylon is usually not necessary which is its advantage over other plastic materials. It has good strength, elasticity and, compared to other plastic gears mentioned, a high durability. This material has a low coefficient of friction, high melting point and high interlayer adhesion. The disadvantage of nylon is the tendency to absorb moisture, where the material deteriorates [14]. It should be noted that gear lubrication in low speed, low frequency applications is not necessary. However, if a more severe environment application is contemplated, a white lithium, PTFE or silicone based lubricant should be used. PLA and PETG are predominantly made of organic substances, i.e., they respond better to less viscous vegetable oils [14].
In the vast majority of scientific publications, composite gears printed on a 3D printer are considered as a suitable alternative to gears made by conventional methods from metallic materials. For polymer gears printed from a single material type, Nylon is the most suitable material according to several studies.
For the dimensional properties of gears, it is important to note that in general, gears are very sensitive to manufacturing precision. Therefore, wheels with a smaller modulus may have a problem with manufacturing accuracy. Wheels that are dimensionally larger are stronger and better able to handle the tolerance errors of a two-wheel shot [15]. When applying printed gears to practice in the long term, it is important to define the basic parameters and knowledge by which the gear should be evaluated, in case one would like to use it as an alternative for a metal gear: the 3D printing production technology, the original parameters and material of the gear, the dimensions and module of the gear, the operational lifetime of the gear. The technology of gear production using 3D printing is crucial in the first phase. Table 1 gives an overview of the most used 3D printing technologies and their tolerance limitations.

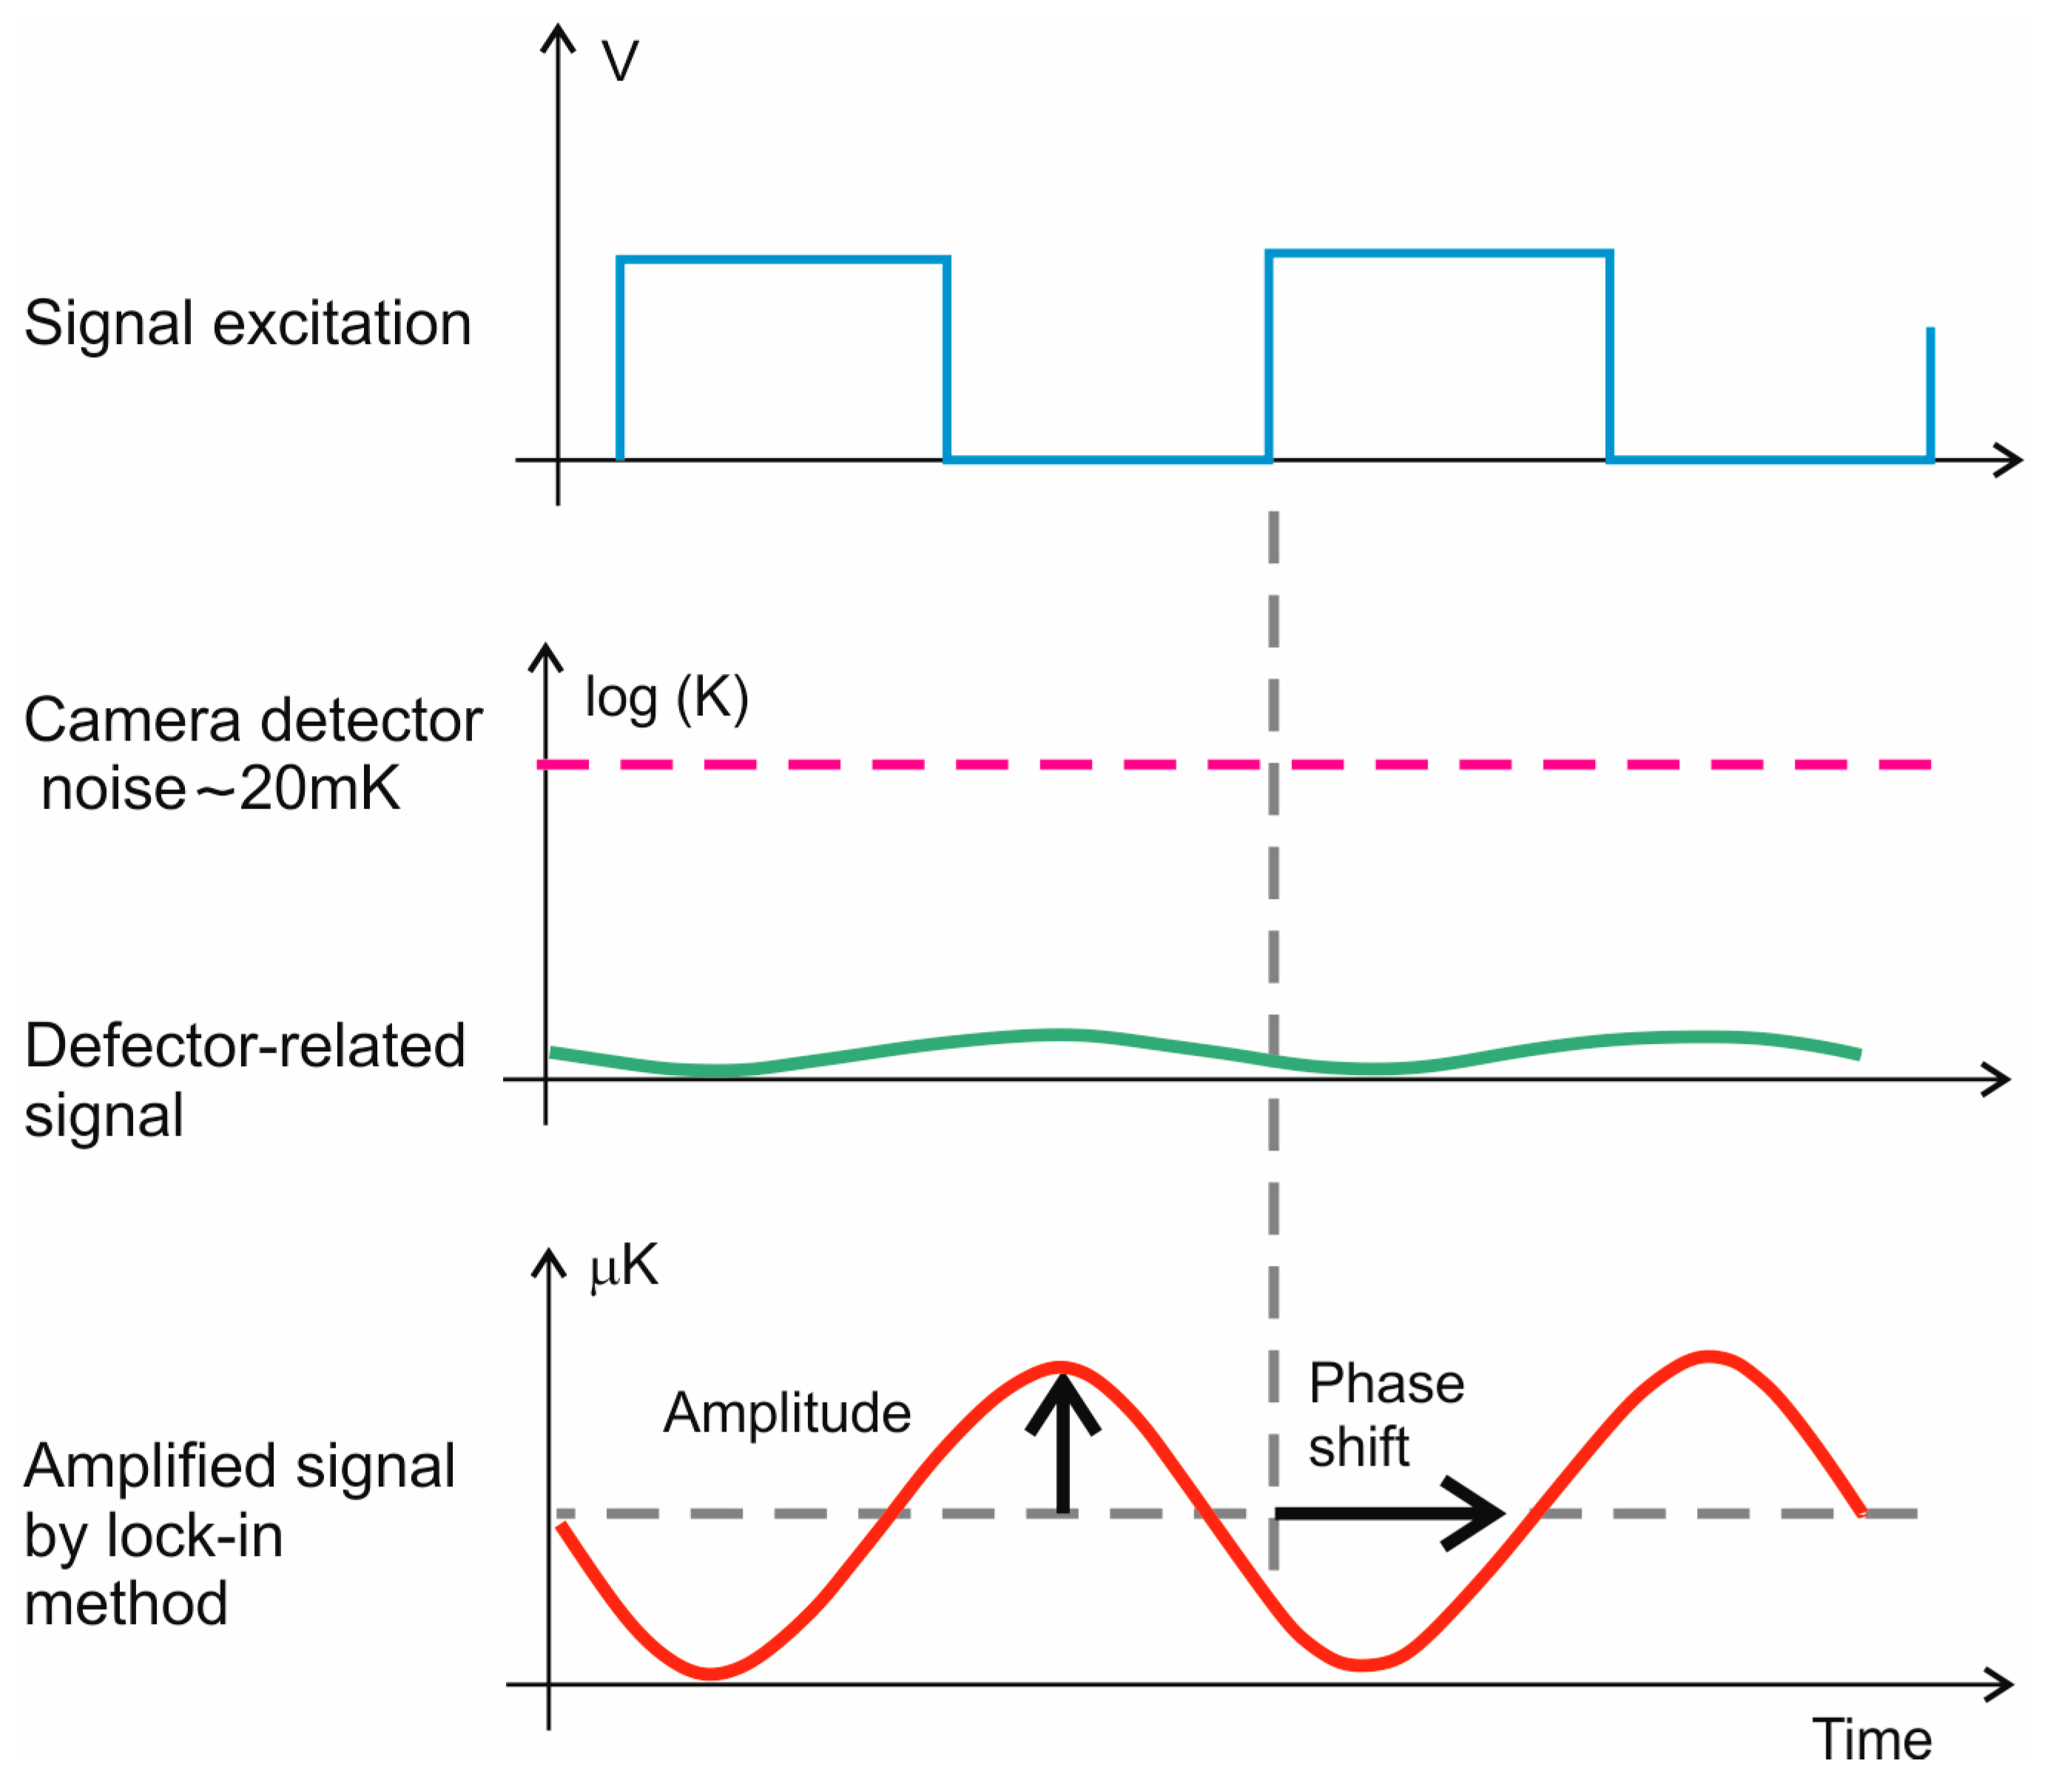
2. Thermoelastic Analysis and Lock-In Method

As already mentioned, the mechanical properties of non-metallic wheels are important in deciding whether these wheels will replace the original metal wheels. Methods are developed to model the wheel footprint and to learn the strain and stress fields. It is useful if the results of computational simulations are compared with the results of experimental measurements. These measurements use, for example, strain gauges installed in the tooth root [16], elasticitymetry [17,18] or the PhotoStress method [19]. Thermoelastic measurements are performed at the workplace of the authors of the paper, for example [20]. Therefore, the thermoelastic analysis method was chosen to determine the stress field on the loaded wheel tooth or in its surroundings. Let us describe the thermoelastic analysis as follows.
When a material is loaded in compression or tension in the elastic region, there is a reversible conversion between mechanical and thermal energy. This method of loading causes a change in temperature. In adiabatic action, there is a linear relationship between the change in temperature and the change in the first invariant of the mechanical stress and it is independent of the loading frequency. After adjustment, we can use the relationship in the thermoelastic region [21]:
Δ T = α ρ c p T 0 Δ σ i i   f o r   i = 1,2
where:
α —linear coefficient of thermal expansion of the material,
c p —heat capacity under constant pressure,
ρ —density,
σ i , j stress tensor and Δ σ i i is the change of the 1st invariant of the tensor,
Δ T —change of temperature,
T 0 —absolute temperature.
The detected temperature change (more precisely the radiation incident on the camera detector) is very small and determining its value by direct measurement is almost impossible. In order to measure the induced thermal modulations generated by the input pulse, they must exceed the noise level of the camera. This requires high excitation pulse energy [22]. Lock-in thermography, also known as thermal wave imaging technique, is offered as an alternative technique because it can be described by oscillatory temperature wave theory [23,24,25,26]. The excitation of heat in the body occurs periodically with a certain frequency [22]. Using the lock-in method it is possible to increase the signal-to-noise ratio many times [27,28,29]. This takes advantage of the fact that if the excitation signal (changing wheel load) is harmonic with period f l o c k i n then also the response of the object to this load is harmonic with the same frequency f l o c k i n , and hence the energy change that is detected by the camera will be periodic. If we perform a Fourier transform for the registered temperature (or radiation) values and express the result in the form of a series whose lowest frequency is f l o c k i n , then the amplitude of the series member for the frequency f l o c k i n will correspond to the detected temperature change Δ T .
Let the excitation source operate at the excitation frequency f l o c k i n . It produces a response, which we express by a harmonic function s(t), with amplitude A , with the same frequency f l o c k i n and with phase shift φ:
s t = A s i n 2 π f l o c k i n t + φ
Let there be in the signal S t , that is detected by the camera is included in the response s t and noise N t in the form of:
S t = s t + N t ,
S t we express using Fourier series as:
S t = A 0 2 + i = 1 + A i sin 2 π i f l o c k i n t + φ i = A 1 sin 2 π f l o c k i n t + φ 1 + A 0 2 + i = 2 + A i sin 2 π i f l o c k i n t + φ i
If we denote A = A 1 and φ = φ 1 , then the last member in square brackets in (4) expresses noise N t and the first member of the series (4) with index i = 1 is response S t [30]. Due to the orthogonality of the functions
sin 2 π i f l o c k i n t , cos 2 π i f l o c k i n t   a n d   1 ,   i   i s   a   n a t u r a l   n u m b e r
It is sufficient to specify only the member A 1 sin 2 π f l o c k i n t + φ 1 , i.e., values A 1 and φ 1 , A 1 determines the temperature change at excitation and φ 1 determines the phase shift between the load response to that load. Values A 1 and φ 1 can be determined, for example, using the 4-point method [30].
Although the temperature change that represents the excitation response is contained in the IR camera noise, thanks to the lock-in method we can detect and quantify the response. The level of noise suppression in this method is represented by Figure 1.
When the measured signal from the IR camera (red) is drowned in detector noise (green). The lock-in method is the amplified signal (blue) and the brown (DUT) represents the periodic excitation.
This method is used, for example, in electrical engineering and in the measurement of very small physical variables [31,32]. It is worth mentioning that the infrared camera is often used in experiments to monitor the temperature rise and steady state on gears. This nature of the output and interpretation of temperature data is related to the change in mechanical properties, usually the deterioration of these properties as the temperature rises when non-metallic gears work under load for long periods of time. For example, papers [33,34] are of this nature. In this paper, the camera will not be used as a sensor of the temperature that will be reached during the test, but as a detector of temperature changes. This type of detection in the infrared spectrum, together with the lock-in method, is also used at the authors’ workplace for plastic deformation detection [35], fatigue limit determination [36] and for non-destructive testing (crack and inhomogeneity detection) [37].

3. Using the Lock-In Method to Determine the Response to the Required Static Load

Experimental tasks are solved at the department of the authors of the article, in which an infrared camera is used for stress field evaluation (thermoelasticity), detection of plastic deformations, determination of fatigue limit and for non-destructive testing (detection of cracks and inhomogeneities). In addition, experimental modal analysis is also performed. The experimental work is related to computational problems in mechanics, using the finite element method.
In the following sections, the test device and the procedure for determining the first stress invariant (sum of principal stresses) on the gear surface around the loaded tooth are described.
If the gear tooth is to be loaded with a static force at one increase in the loading force to the value of the required static load, and if the temperature variation Δ T is at the level of the cam noise, then relation (1) is not applicable.
However, if periodic loading force of the wheel tooth occurs at a frequency f l o c k i n and the amplitude of the loading force reaches the value of the required static load, and if the lock-in method is used, then the term A 1 in (1) corresponds to the temperature change Δ T and the value of Δ σ i i determined by (1) is the 1st stress invariant at this static load.
However, in order to avoid heating of the sample it is necessary that it is an adiabatic process, i.e., that the loading frequency is sufficiently high. For steels a frequency of at least 8 Hz is recommended, for aluminium alloys at least 25 Hz [29,38,39].

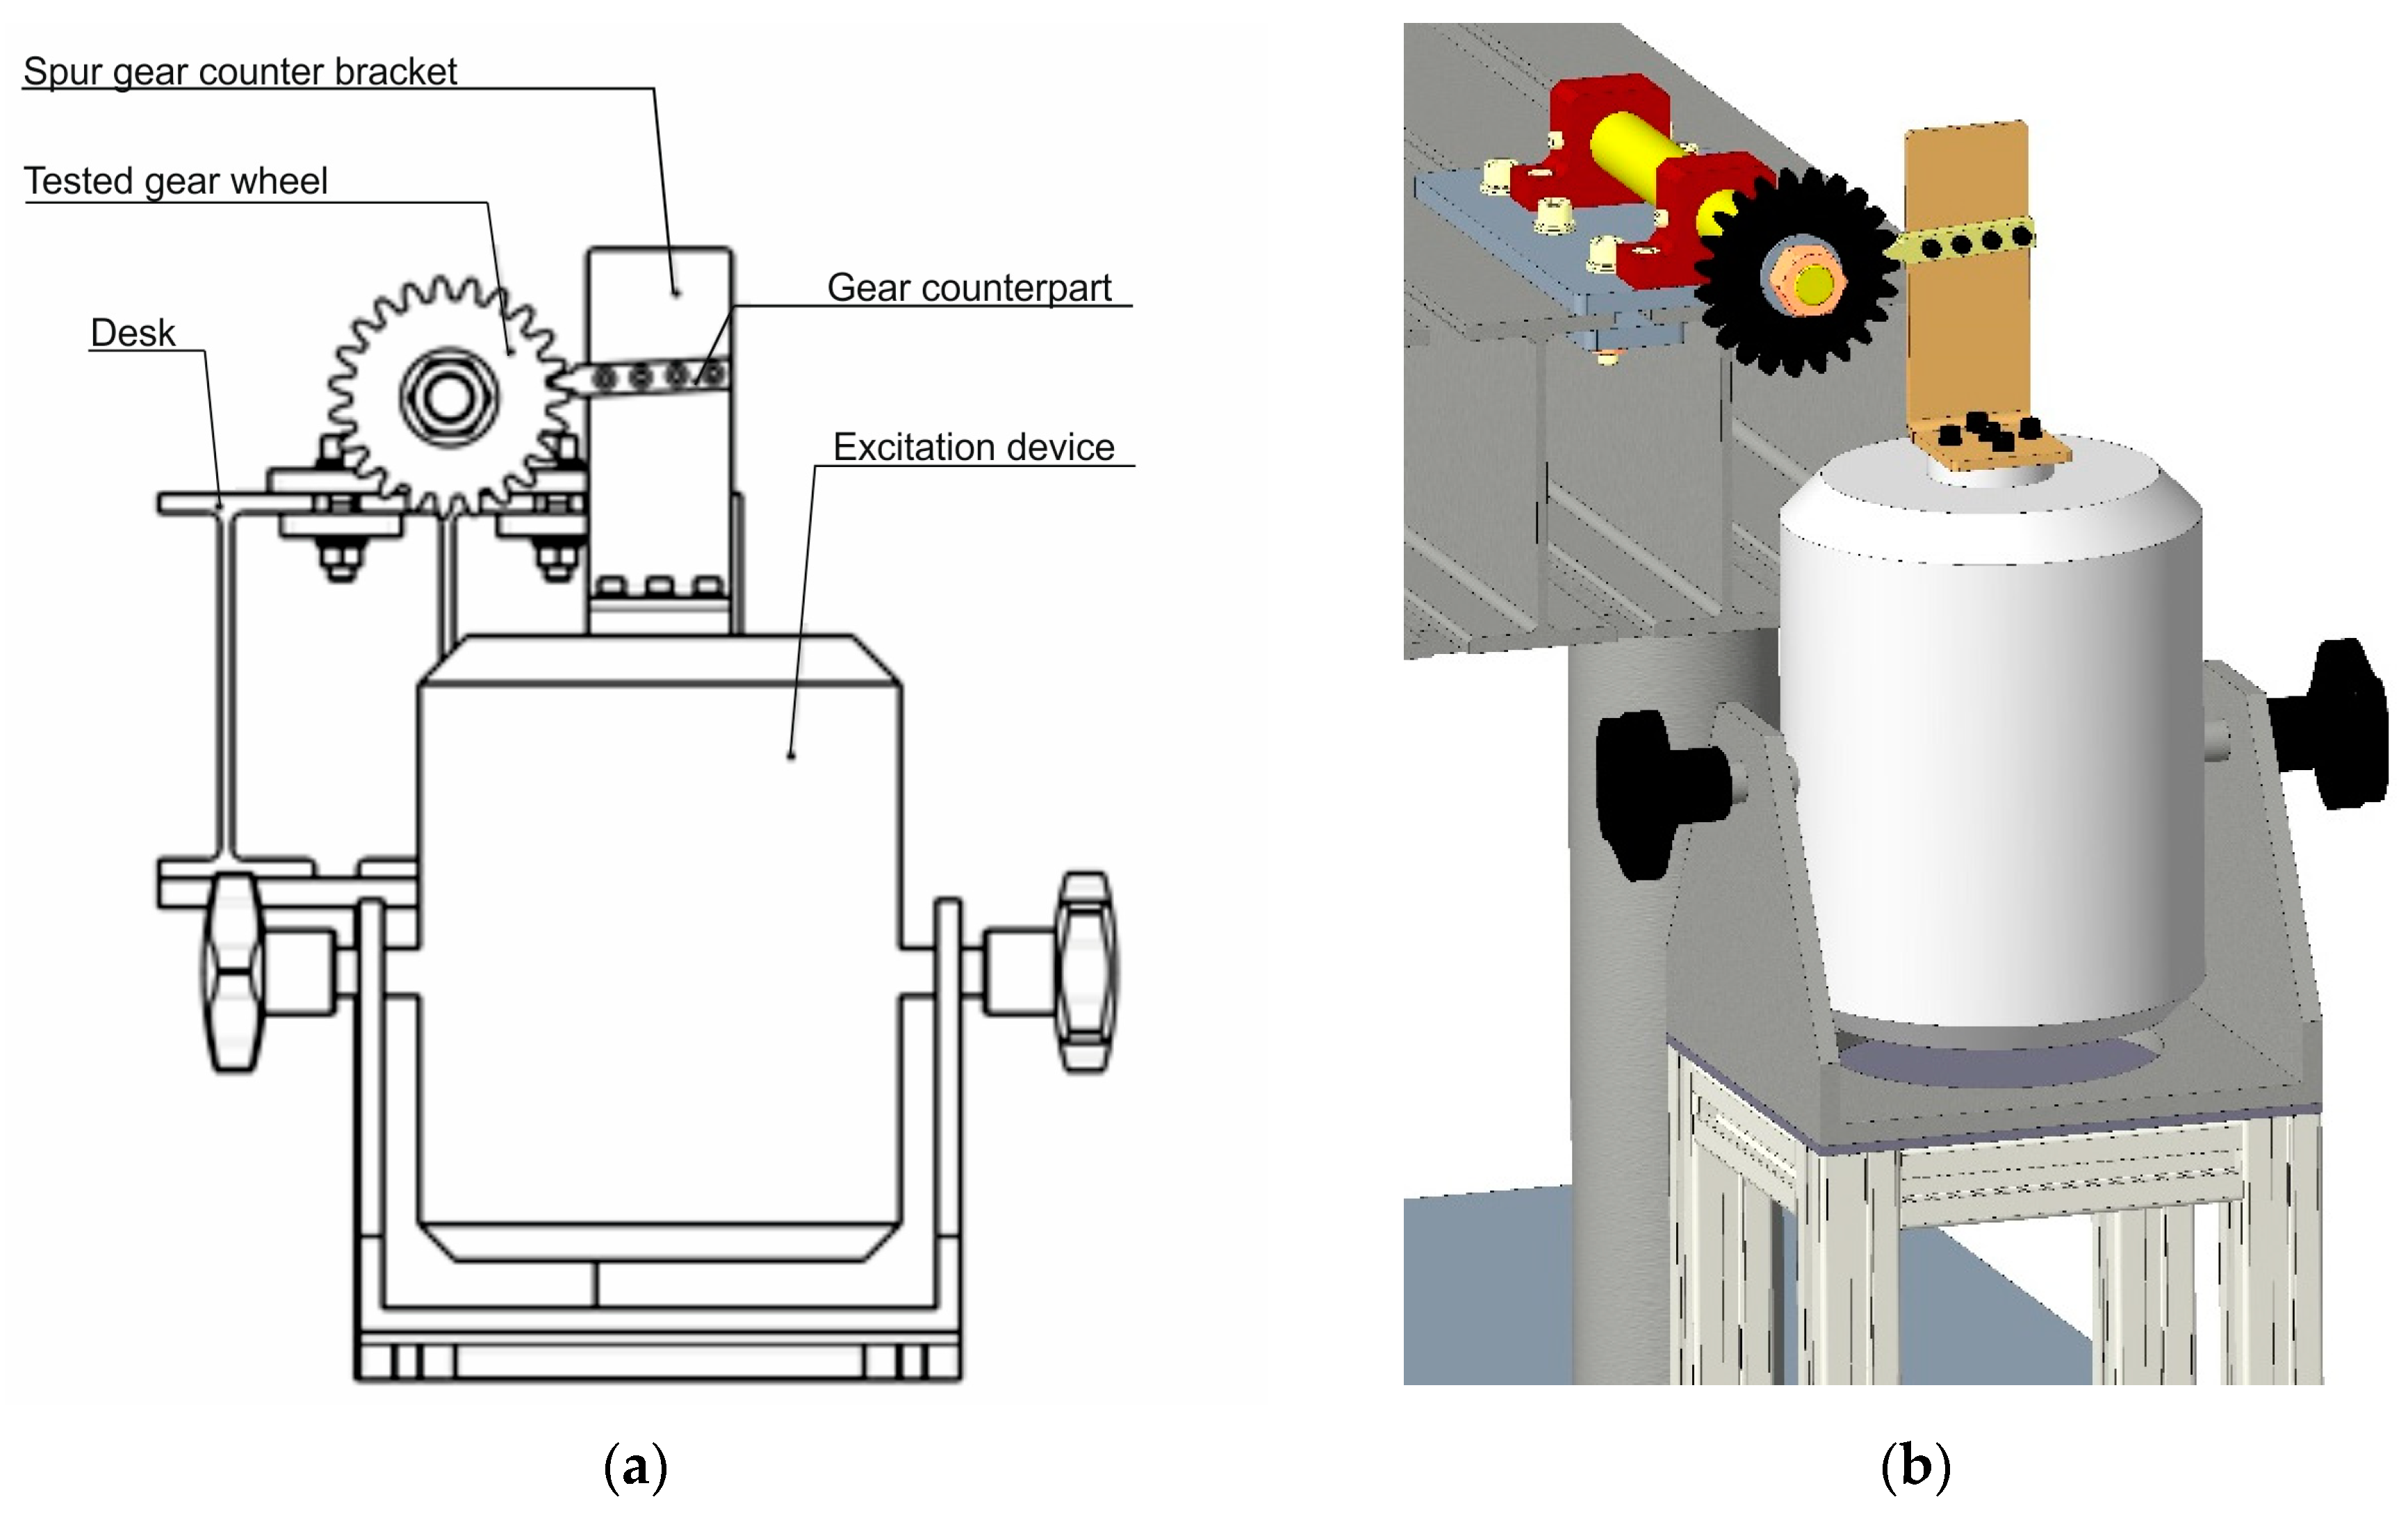
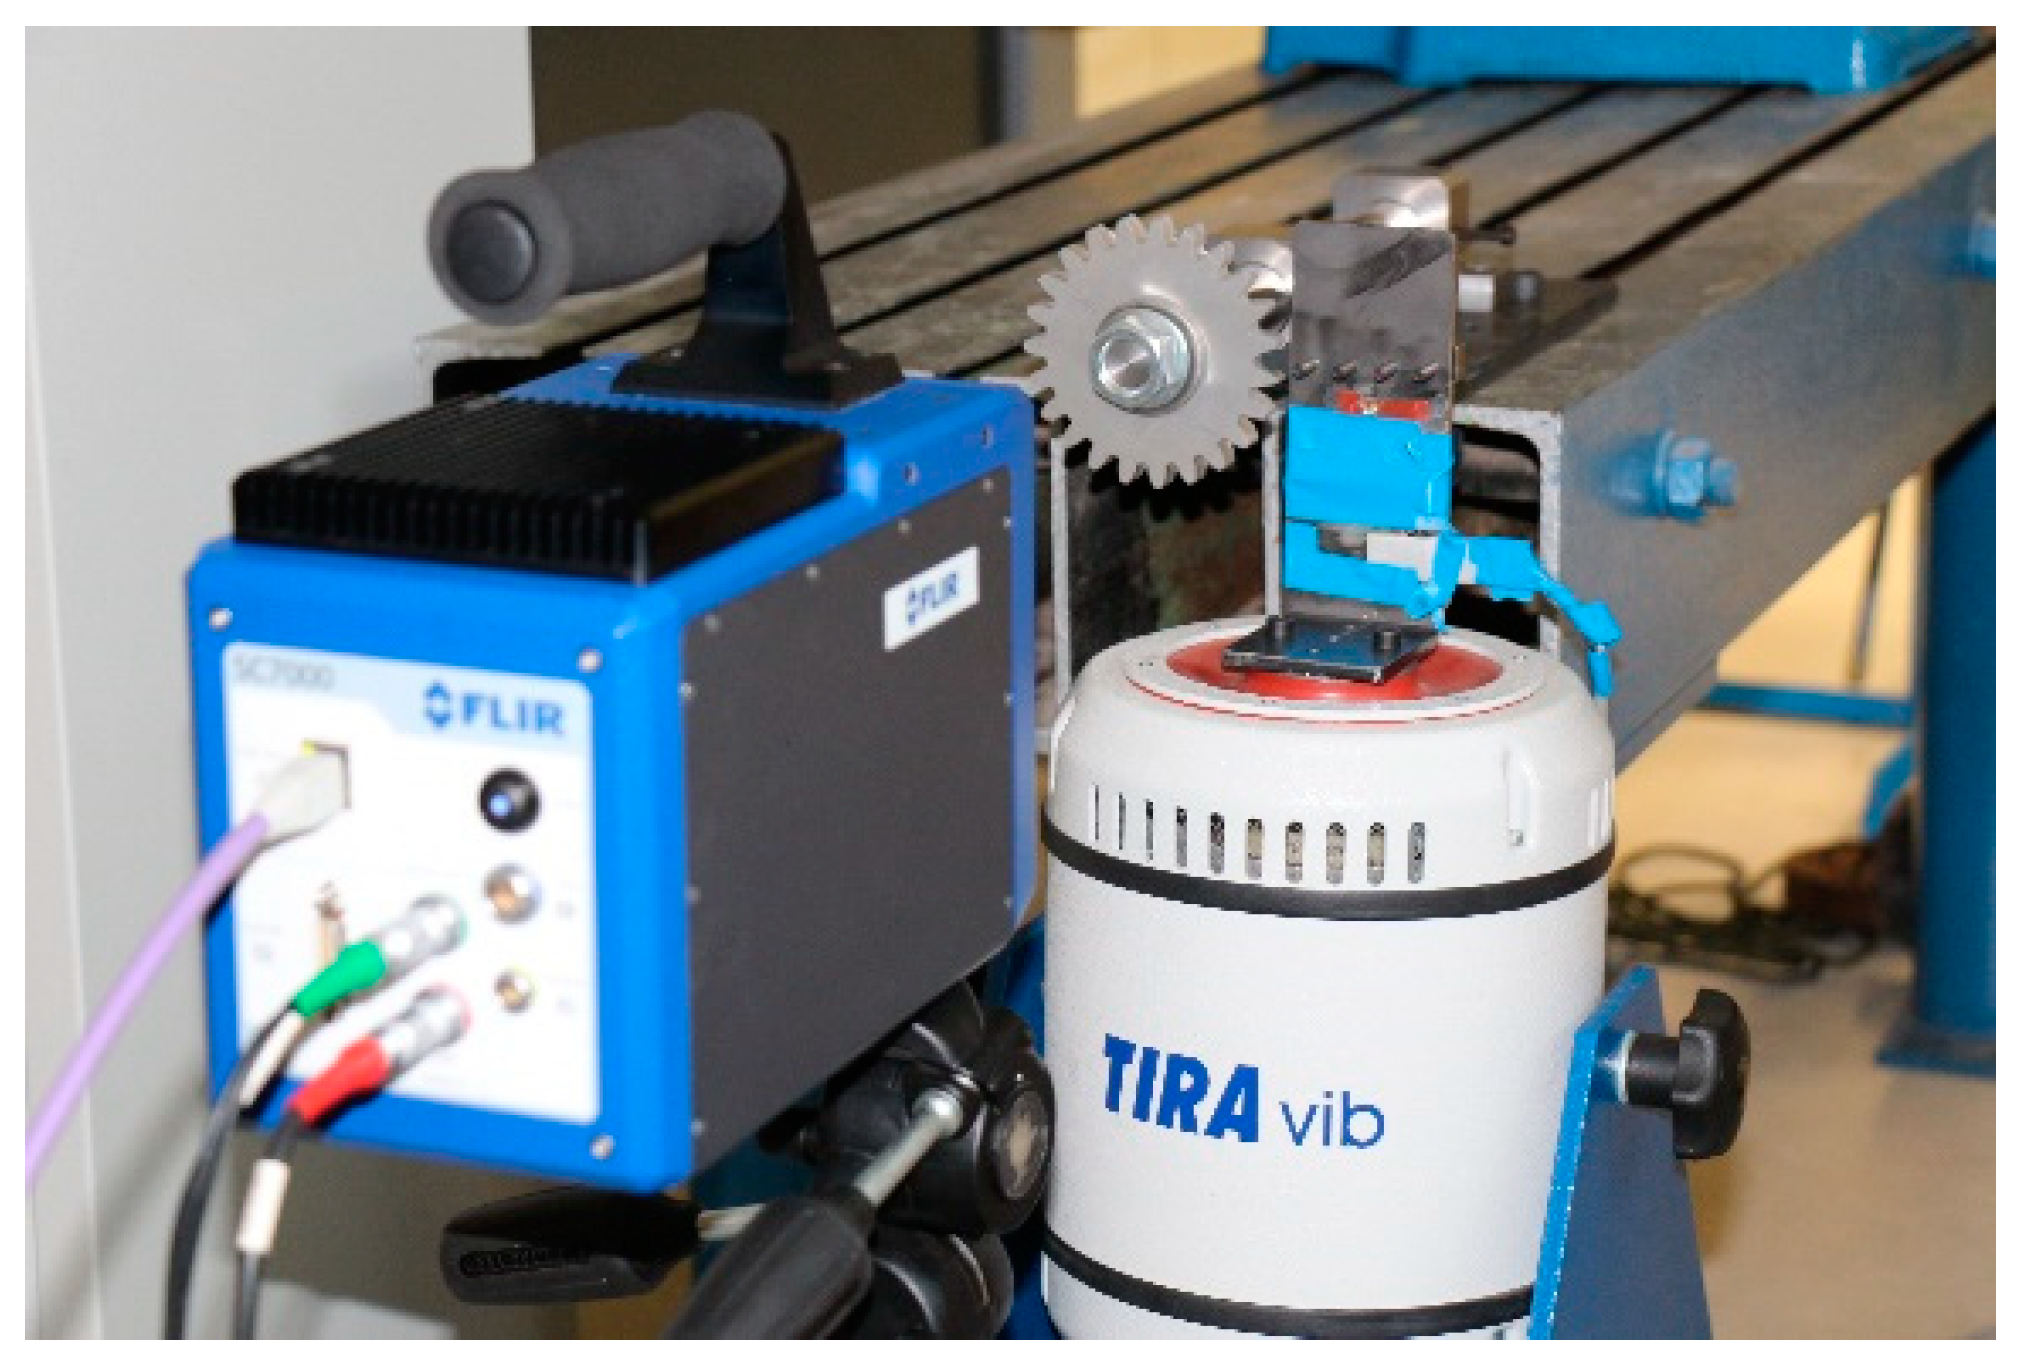
3.1. Test Stand for Gear Engagement

The test equipment used is shown in Figure 2 and Figure 3.
The polymer toothed wheel under test was fixed to the shaft using a nut and washer so that the wheel did not rotate relative to the frame (table). This toothed wheel was excited by a single steel toothed counter tooth. The counter tooth was mounted on the core of a modal exciter TV 51120 (TIRA GmbH, Schalkau, Germany). The exciter was controlled by an amplifier BAA 500 (TIRA GmbH, Schalkau, Germany).
The amplitude of the motion (force) was controlled by the set current and voltage on the exciter, the frequency of the harmonic signal and its shape was determined by the analog voltage signal applied to the input of the BAA 500 amplifier.
The core with the opposing tooth moved vertically within the range of the tooth clearance. When the core moved upwards, the tooth of the counter tooth contacted the gear and a loading force was induced, the force. Maximum value of this force which reached the value of the expected static load. The motion or oscillation of the core of the modal exciter was controlled by a sine function with frequency f l o c k i n .
The response of the gear to loading was captured by a FLIR SC 7500 high-speed infrared IR camera from FLIR SC7500, Ser. No. 210460 with an InSb detector—320 × 256 pixels, in the MWIR range, with a native frame rate of 383 Hz [28].
The acquired images from the infrared camera were processed in the Altair LI software (FLIR Systems, Inc-OEM Cores and Components, Goleta, CA, USA).
Vishay strain gauges CEA-06-250UW-120 (Micro-Measurement Division Vishay, North Carolina, USA) were installed on the counter tooth that loaded the gear to measure the compressive deformation of the counter tooth and to determine the loading force. By measuring the periodic compressive strain of the counter tooth, the actual frequency f l o c k i n was determined and the camera images were also synchronized with the load force waveform based on f l o c k i n .
LabVIEW 2020 software and hardware modules (LabVIEW modules NIcDAQ 9237, 9264 National Instruments, Budapest, Hungary) were used to control the amplifier of the modal exciter with sinusoidal signals, to measure the deformation on the opposite side of the modal exciter, to generate the signal for the synchronization of the camera.

3.2. Input Parameters for Measurement and Evaluation

The measurement and evaluation was performed with the following input data.
The camera frame rate was 17 Hz for all measurements, the integration time was also the same for all material types, namely 1509 µs. No filter was included in the carousel for the measurements.
The IR camera was positioned approximately 0.6 m from the face of the gear. The ambient temperature was 22 °C. We used a 50 mm lens of the IR camera L0106, Ser. No. 206998, with intermediate ring.
The TIRA modal exciter was controlled such that a loading force F ( t ) was induced in the interval from 0 N to 20 N.
F ( t ) = 20 sin 2 π f l o c k i n t + 10 N
The required force was controlled by strain gauges on the opposite side, it had a sinusoidal character (6) standard deviation of maximum force was lower than 1.8 N.
The loading frequency of f l o c k i n was 4 Hz, the maximum value of the load harmonic force was 20 N, the minimum 0 N.
The parameters for PLA and PETG materials, which were used in Equation (1), are given in Table 2.
In the contact between the wheel tooth and the counter tooth, the quality of the surfaces of the co-engaging teeth is significant. During the test, there was a relative micromotion of one tooth with respect to the other, which is explained by the deformation of the non-metallic tooth. Table 3 shows:
In addition to roughness, the coefficient of friction is also an important parameter. It should be noted that in [6] the friction coefficients for PLA and PETG were determined using a Nanovea Tribo-meter (steel ball, 5 mm diameter) as a function of sliding distance. In doing so, it is significant whether the area for which this coefficient was measured was the bottom surface of the sample (the surface on which the printing started) or the top surface of the sample (the surface on which the printing ended). Since we consider the issue of the friction coefficient to be important, then it should be addressed in the future; however, no such measurements were made in the preparation of the experiment described herein.

4. Analysis of Measured Data

During the experimental part, we observed and evaluated two types of images. Phase shift and first stress invariant for each kind of material. We processed the images in FLIR’s Altair LI software.

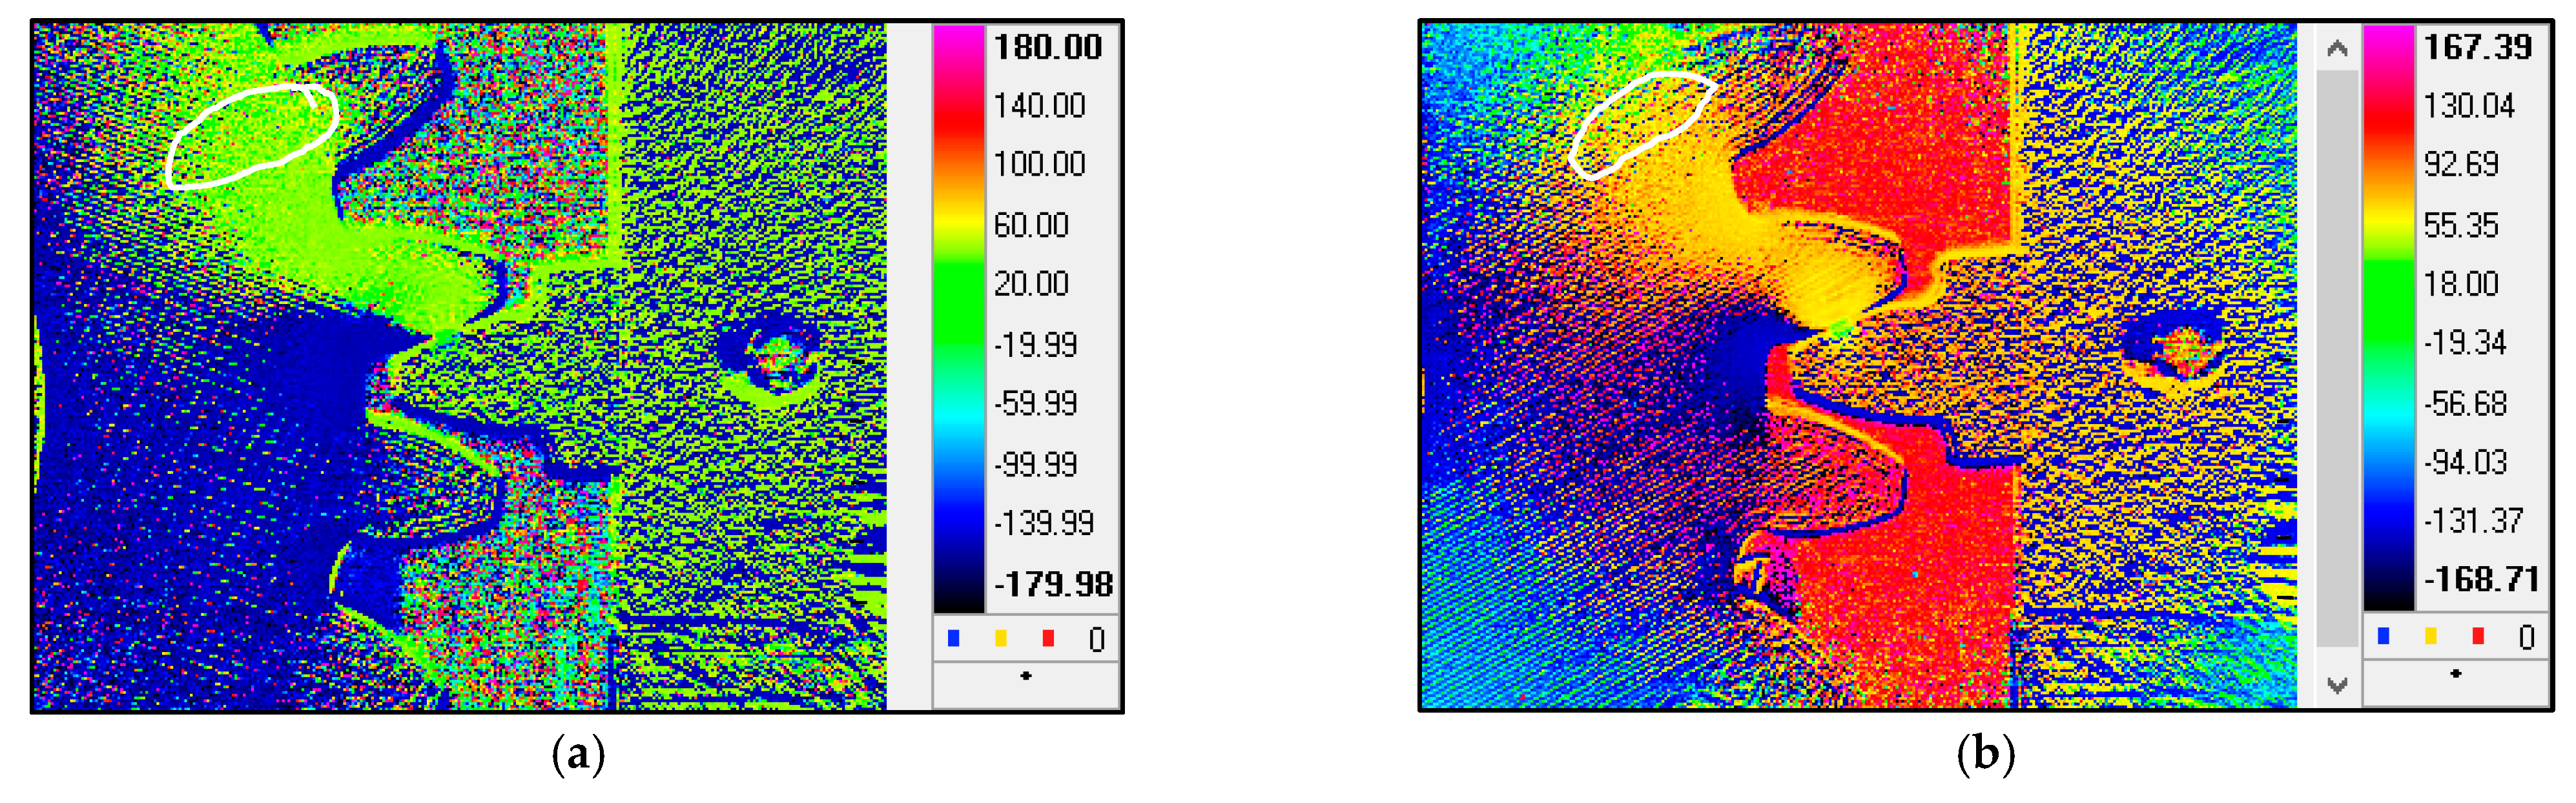
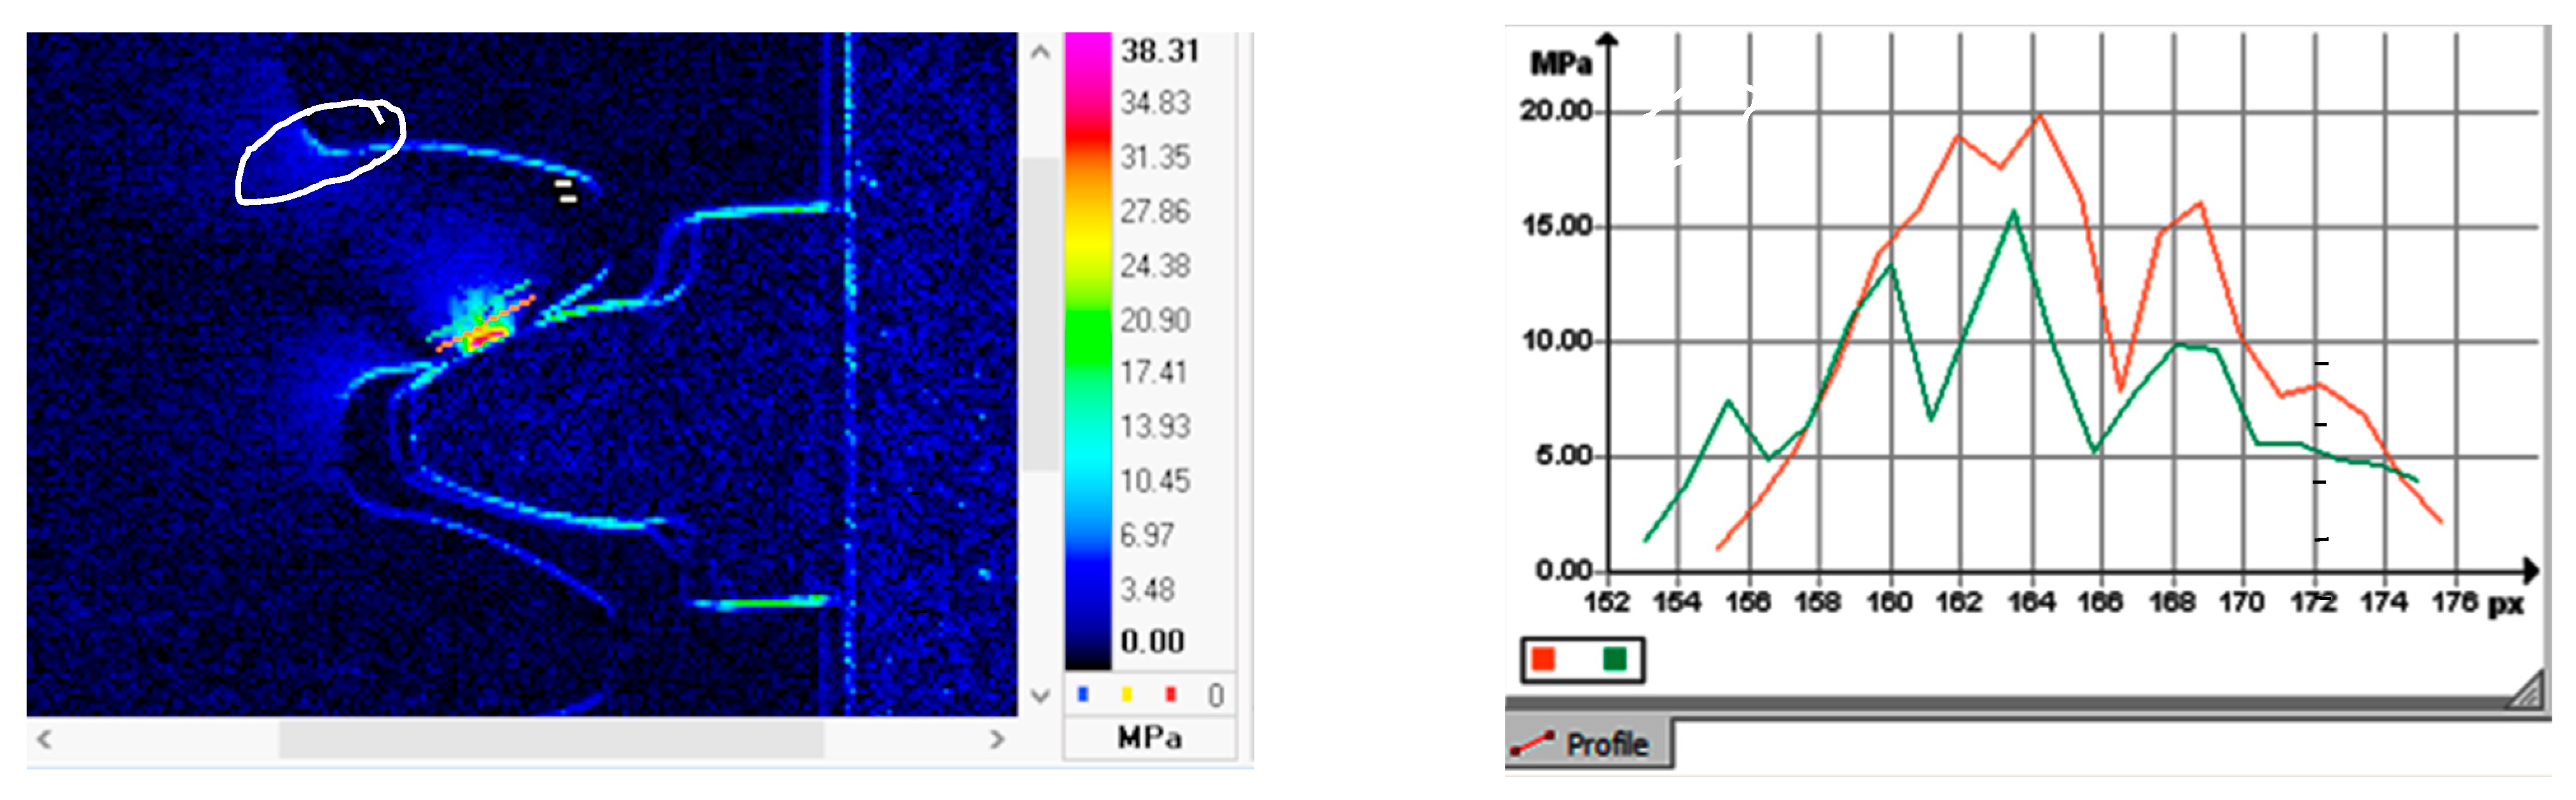
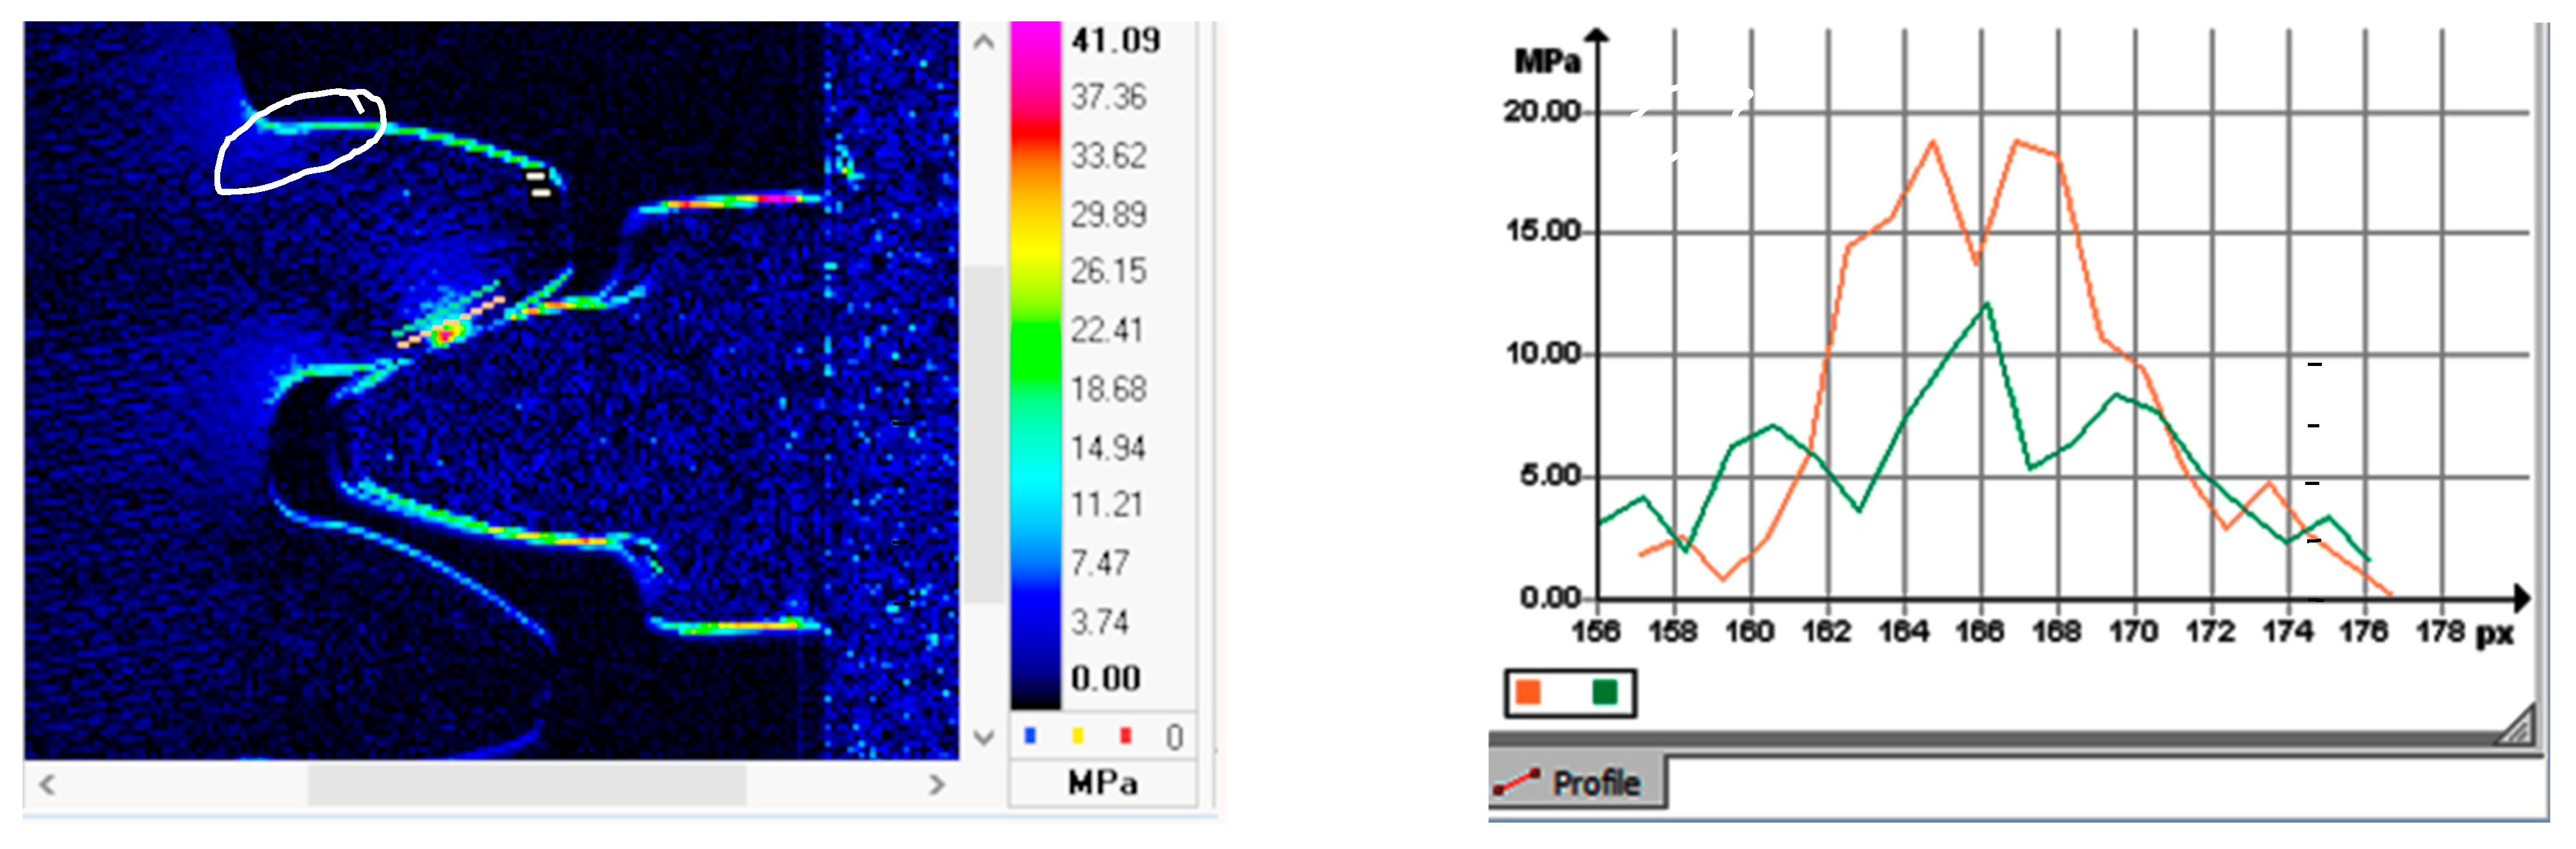
4.1. Analysis of Measured Phase Shift Images

For the phase-shift measurements, we based our measurements on theoretical considerations and in most cases measured values that could be expected. A tensile load is applied to part of the tooth and a compressive load to another part of the tooth. The above difference in the method of loading is detectable by the difference in the phase displacements between these parts of the object under analysis. So, if in two parts of the object the values of phase shifts (resp. angles) are detected and the difference of these shifts corresponds to 180°, then the loads in these parts of the object are in the opposite phase, which can be interpreted as the presence of a tensile load in one part of the wheel (I) and a compressive load in the other part (II), respectively, and a compressive load in (I) and a compressive load in (II).
For gears extruded from PLA material, Figure 4a shows in light green the area of compressive load (representing a phase shift of approximately 0°) that connects the area from the contact of the teeth of the wheel and the counter to the root of the adjacent tooth of the wheel, or extends up to half of the width of the adjacent tooth. The dark blue area represents a phase shift of approximately −180° and shows the tensile load area, the phase difference is approximately 180°.
In Figure 4b, the gear is printed from PETG material, the yellow color represents the compressive load region (phase shift of approximately 65°) and the dark blue region represents the phase shift of approximately −140° and shows the tensile load region. The difference in phase shift between these regions is approximately 205°. The value of 205° is contained within a tolerance interval of 180° ± 30°. This 180° ± 30° tolerance interval for the 180° phase shift assessment is the same as the tolerance interval for the detection of the phase shift value when passing through the resonance in the experimental modal analysis.
These measurements also highlight the surface and subsurface structure of the gears. In Figure 4a,b, concentric contour filaments in the printed gears are also detectable, for example indicated by the white closed curves. This phenomenon is due to the harmonic excitation of the tooth of the composite gear by the frequency f l o c k i n and the processing of the measured response mentioned earlier. This phenomenon is used in the field of non-destructive testing (NDT) [23].

4.2. Response Amplitude Image Analysis

The amplitude A of the response s t , Equation (2) corresponds to the amplitude A 1 of the first term of the series (4) and expresses the temperature change Δ T . Knowing the thermal diffusivity K (Table 1), we can determine the change of the first invariant Δ σ i i . according to the term (2), together with the knowledge of the term. For the given loads of 20 N, the modal exciter was built up by the load, which we evaluated through the IR camera as the I. invariant of the stress.
Figure 5 and Figure 6 on the left show the field (map) of the first invariant for the wheel made of PLA and PETG material. In the maps, 2 line segments are plotted. The line segment closer to the edge of the tooth (red) passes through the region with the occurrence of contour fibers. The line segment further away from the tooth edge (green color) corresponds to the area of the tooth matrix, without contour filament.
Figure 5 and Figure 6 on the right are plots showing the progression of the invariant along the line segments plotted in the map. On the horizontal axes of the graphs, the position of a point is expressed by the pixel number of the camera detector in the horizontal direction (the detector is 320 pixels by 256 pixels); the pixel numbers on the horizontal axes of the graphs in Figure 5 and Figure 6 can take values from 1 to 320.
If we compare the waveforms of the invariant plots, then in the contour fiber region (red color) the invariants take higher values for both materials than in the matrix.
Comparison the maximum values of the invariants in the matrix regions (green color), then higher invariant values are obtained for PLA than for PETG.
When we compare the maximum invariant values in the matrix regions, then higher invariant values are obtained for PLA than for PETG. We assume that the reason for this is the higher compliance of PETG than PLA.
Qualitatively, we consider the distribution of invariants for both materials to be approximately the same, with higher values of invariants being achieved only in the region of the contour and in the root of the teeth than in the matrix.
The determined values of the invariants along the used line segments show not a smooth but a “saw” signal If the filament was 0.2 mm in diameter and the pixel projected an image from an area on the sample smaller than approximately 0.3 × 0.3 mm, then there was uneven coverage of the area by the filaments on that 0.3 × 0.3 area. This problem has yet to be addressed.

5. Discussion

The contact of two gears can be simulated in several ways. For the design of the excitation device, we were inspired by publications such as [38,39]. We consider our test setup to be simple and the infrared camera image processing procedure used to be appropriate. However, it is necessary to discuss some issues that arose during the measurements and the processing of the results:
  • The design of the test condition. If the opposing tooth performs a translational movement, then due to the displacement of the tooth under test, there is a translation and rotation of this tooth. For large translation and rotations, image stabilization will need to be addressed, e.g., by using reference markers that will be detectable in the infrared range of the camera used.
  • Due to the micromotions of the test wheel and the countertooth, the boundaries of these objects appear in the images that could be misinterpreted as high values of the 1st invariant. We assume that one of the causes of this phenomenon is the rotation of the surface that represents the edge of the test tooth and countertooth. The algorithm of the lock-in method evaluates this periodic change in the position of the surface (with lock-in frequency) as a value of the 1st invariant. For this reason, the edge invariant values were not evaluated. We assume that the tooth aligment is improved if the countertooth does not act in translational motion but in rotational motion. The edge problem described above was also the reason why the line on which the 1st invariant is evaluated is not placed closer to the tooth edge. For the same reason, we have not yet evaluated the invariant directly in contact between the wheel and the countertooth.
  • For the measurements, we used an infrared camera with a 320 × 240 pixels detector. It is reasonable to expect that increasing resolution of the detector (increasing the number of pixels) will improve the resolution when evaluating the invariant. However, due to the micro displacement, this increase may require more precise image stabilization.
  • If we do not evaluate the method and test condition used for the spur gear testing described above, then the roughness of the contact surfaces, their coefficient of friction, the temperature of the teeth during the test, and also the test history for the wheel under test must also be considered to understand the mechanical properties. For longer duration tests or frequently repeated tests, the contact surface of the tested wheel teeth may be worn.

6. Conclusions

In this paper, we described the procedure of testing, measurement and evaluation of an experiment in which a force load was applied to a gear by means of a modal exciter.
  • We obtained the distribution of the first invariant stress field on the loaded tooth and its region.
  • We analyzed the gears made of two types of materials, namely PLA, PETG.
  • We see potential in the experiment conducted that we think should be developed. Therefore, we continue the experimental work by modifying the test condition in which the counterpart, or the gear simulating the counterpart, will perform a rotary motion approximately in the range of the tooth clearances of the pair: the loaded gear, i.e., the gear under test, and the load-bearing gear, i.e., the counter part.
  • The experimental results will also be compared with the FEM analysis results.

Author Contributions

Conceptualization, M.S. and V.D.; methodology, V.D.; software, M.K.; validation, V.D., M.S. and M.P.; formal analysis, A.S. and M.P.; investigation, M.K.; resources, M.P.; data curation, B.D.; writing—original draft preparation, B.D.; writing—review and editing, M.S.; visualization, A.S.; supervision, V.D.; project administration, M.P.; funding acquisition, A.S. All authors have read and agreed to the published version of the manuscript.

Funding

This work has been supported by Projects VEGA 1/0510/20, VEGA 1/0516/22 and KEGA 011ZU-4/2022.

Institutional Review Board Statement

Not applicable.

Informed Consent Statement

Not applicable.

Data Availability Statement

The data that support the findings of this study are available from the corresponding author upon request.

Conflicts of Interest

The authors declare no conflict of interest.

References

  1. Majko, J.; Vaško, M.; Handrik, M.; Sága, M. Tensile Properties of Additively Manufactured Thermoplastic Composites Reinforced with Chopped Carbon Fibre. Materials 2022, 15, 4224. [Google Scholar] [CrossRef]
  2. Vaško, M.; Sága, M.; Majko, J.; Vaško, A.; Handrik, M. Impact Toughness of FRTP Composites Produced by 3D Printing. Materials 2020, 13, 5654. [Google Scholar] [CrossRef] [PubMed]
  3. Galiki, O.; Kondo, H.; Wilson, Z. 3D Printing Tolerances: How to Test & Improve Them. Available online: https://all3dp.com/2/3d-printing-tolerances-test-fdm/ (accessed on 10 May 2023).
  4. Faust, J.L.; Kelly, P.G.; Jones, B.D.; Roy-Mayhew, J.D. Effects of Coefficient of Thermal Expansion and Moisture Absorption on the Dimensional Accuracy of Carbon-Reinforced 3D Printed Parts. Polymers 2021, 13, 3637. [Google Scholar] [CrossRef] [PubMed]
  5. Andleeb, Z.; Malik, S.; Abbas Khawaja, H.; Samuelsen Nordli, A.; Antonsen, S.; Hussain, G.; Moatamedi, M. Thermoelastic Investigation of Carbon-Fiber-Reinforced Composites Using a Drop-Weight Impact Test. Appl. Sci. 2021, 11, 207. [Google Scholar] [CrossRef]
  6. Yilmaz, S. Comparative Investigation of Mechanical, Tribological and Thermo-Mechanical Properties of Commonly Used 3D Printing Materials. Eur. J. Sci. Technol. 2021, 32, 827–831. [Google Scholar] [CrossRef]
  7. Carolo, L.; Pechter, D. 3D Printed Gears: How to Make Them. Available online: https://all3dp.com/2/3d-printed-gears-get-the-gear-that-fits-your-needs/ (accessed on 10 May 2023).
  8. Arceo, F. Best 3D Printing Material/Filament for Gears. Available online: https://3dsolved.com/best-3d-printing-filament-for-gears/ (accessed on 10 May 2023).
  9. Mahendran, S.; Eazhil, K.M.; Kumar, L.S. Design and Analysis of Composite Spur Gear. Int. J. Res. Sci. Innov. 2014, 1, 42–53. [Google Scholar]
  10. Pawar, P.B.; Utpat, A.A. Analysis of Composite Material Spur Gear under Static Loading Condition. Mater. Today: Proc. 2015, 2, 2968–2974. [Google Scholar] [CrossRef]
  11. Keerthi, M.; Sandya, K.; Srinivas, K. Static & Dynamic Analysis of Spur Gear using Different Materials. Int. Res. J. Eng. Technol. 2016, 3, 694–699. [Google Scholar]
  12. Rajeshkumar, S.; Manoharan, R. Design and analysis of composite spur gears using finite element method. IOP Conf. Ser. Mater. Sci. Eng. 2017, 263, 062048. [Google Scholar] [CrossRef]
  13. Kotkar, T.; Masure, P.; Modake, P.; Lad, C.; Patil, B. Modelling and Testing of Spur Gear made of Different 3D Printed Materials. Int. J. Sci. Res. Sci. Eng. Technol. 2018, 4, 42–53. [Google Scholar]
  14. Flynt, J. A Guide to 3D Printing Functional Gears. Available online: https://3dinsider.com/3d-printing-functional-gears/ (accessed on 10 May 2023).
  15. Brown, C.H. Mechatronica: 3D Printing Gears and Robots. Available online: https://www.fictiv.com/articles/mechatronica-3d-printing-gears-and-robots (accessed on 10 May 2023).
  16. Kim, T.; Seok, T.; Seol, J.; Lee, B.; Kwon, B.; Choi, J. Finite Element Model based on Strain Tests for Predicting Bending Strength of Small Gears for Aircraft. J. Aerosp. Syst. Eng. 2020, 14, 91–99. [Google Scholar] [CrossRef]
  17. Forte, P.; Paoli, A.; Raziona, A.V. A CAE approach for the stress analysis of gear models by 3D digital photoelasticity. Int. J. Interact. Des. Manuf. 2015, 9, 31–43. [Google Scholar] [CrossRef]
  18. Raptis, K.G.; Savaidis, A.A. Experimental investigation of spur gear strength using photoelasticity. Procedia Struct. Integr. 2016, 10, 33–40. [Google Scholar] [CrossRef]
  19. Rahate, H.P.; Marne, R.A. Contact stress analysis of composite spur gear using photo-stress method and finite element analysis. Int. Res. J. Eng. Technol. 2016, 3, 540–545. [Google Scholar]
  20. Sapieta, M.; Dekýš, V.; Štalmach, O.; Sapietová, A.; Svoboda, M. Detection of Elastic Deformation in Metal Materials in Infrared Spectral Range. Materials 2021, 14, 5359. [Google Scholar] [CrossRef]
  21. Pitarresi, G.; D’Acquisto, L.; Siddiolo, A.M. Thermoelastic stress analysis by means of an infrared scanner and a two dimensional fast Fourier transform based lock-in technique. J. Strain Anal. Eng. Des. 2003, 43, 493–506. [Google Scholar] [CrossRef]
  22. Stanley, P. Beginnings and early development of thermoelastic stress analysis. Strain 2008, 44, 285–297. [Google Scholar] [CrossRef]
  23. Torbali, M.E.; Zolotas, A.; Nicolas, P.; Avdelidis, N.P. A State-of-the-Art Review of Non-Destructive Testing Image Fusion and Critical Insights on the Inspection of Aerospace Composites towards Sustainable Maintenance Repair Operations. Appl. Sci. 2023, 13, 2732. [Google Scholar] [CrossRef]
  24. Pieczyska, E.A.; Gadaj, S.P.; Nowacki, W.K. Thermoelastic and Thermoplastic Effects during Loading and Unloading of Austenitic Steel. In Quantitative Infrared Thermography QIRT’98, Proceedings of the Eurotherm Seminar 60, Lodz, Poland, 7–10 September 1998; Editions Europeennes Termique & Industrie (EETI): Paris, France, 1992; pp. 112–116. [Google Scholar] [CrossRef]
  25. Plekhov, O.; Naimark, O. Theoretical and experimental study of energy dissipation in the course of strain localization in iron. J. Appl. Mech. Tech. Phys. 2009, 50, 127–136. [Google Scholar] [CrossRef]
  26. Misiewicz, R.; Moczko, P.; Bajcar, A. Accuracy Evaluation of Thermoelastic Stress Analysis with the Use of Experimental and Numerical Methods. Materials 2022, 15, 1961. [Google Scholar] [CrossRef]
  27. Bremond, P.; Potet, P. Lock-in thermography: A tool to analyze and locate thermomechanical mechanisms in materials and structures. Proc. SPIE 2001, 4360, 560. [Google Scholar] [CrossRef]
  28. Krapez, J.C.; Pascou, D.; Gardette, G. Lock-in Thermography and Fating Limits of Metals. In Quantitative Infrared Thermography QIRT’2000, Proceedings of the Eurotherm Seminar 64, Reims, France, 18–21 July 2000; Akademickie Centrum Grafiezno: Lodz, Poland, 2020; pp. 277–282. [Google Scholar] [CrossRef]
  29. Wright, E.; Dibiase, T.; Lundquist, T.; Wagner, L. Packaging Fault Isolation Using Lock-in Thermography. Available online: https://www.circuitnet.com/news/uploads/2/Packaging_Fault_Isolation_Using_LIT.pdf (accessed on 10 May 2023).
  30. Breitenstein, O. Lock-In Thermography, 2nd ed.; Springer: Berlin/Heidelberg, Germany, 2010; pp. 14–32. [Google Scholar]
  31. Stanford Research Systems. About Lock-In Amplifiers. Application Note #3. Available online: https://www.thinksrs.com/downloads/pdfs/applicationnotes/AboutLIAs.pdf (accessed on 10 May 2023).
  32. Zurich Instruments. Principles of Lock-in Detection and the State of the Art. Available online: https://www.zhinst.com/sites/default/files/documents/2020-06/zi_whitepaper_principles_of_lock-in_detection.pdf (accessed on 10 May 2023).
  33. Dimić, A.; Mišković, Ž.; Mitrović, R.; Ristivojević, M.; Stamenić, Z.; Danko, J.; Bucha, J.; Milesich, T. The influence of material on the operational characteristics of spur gears manufactured by the 3d printing technology. Strojnícky Časopis—J. Mech. Eng. 2018, 68, 261–270. [Google Scholar] [CrossRef]
  34. Černe, B.; Petkovšek, M.; Duhovnik, J.; Tavčar, J. Thermo-mechanical modeling of polymer spur gears with experimental validation using high-speed infrared thermography. Mech. Mach. Theory 2019, 146, 103734. [Google Scholar] [CrossRef]
  35. Dekys, V.; Kopas, P.; Sapieta, M.; Stevka, O. A detection of deformation mechanisms using infrared thermography and acoustic emission. Appl. Mech. Mater. 2014, 474, 315–320. [Google Scholar]
  36. Stankovicova, Z.; Dekys, V.; Uhricik, M.; Novak, P.; Strnadel, B. Fatigue limit estimation using IR camera. MATEC Web Conf. 2018, 157, 05021. [Google Scholar] [CrossRef]
  37. Sapieta, M.; Dekys, V.; Pastorek, P. Using of active thermography and lock-in method with ultrasound excitation for detection of material defects. Sci. J. Sil. Univ. Technol.—Ser. Transp. 2014, 84, 119–124. [Google Scholar]
  38. Zorko, D.; Demšart, I.; Tavčar, J. An investigation on the potential of bio-based polymers for use in polymer gear transmissions. Polym. Test. 2021, 93, 106994. [Google Scholar] [CrossRef]
  39. Zhang, Y.; Pursell, C.; Mao, K.; Leigh, S. A physical investigation of wear and thermal characteristics of 3D printed nylon spur gears. Tribol. Int. 2020, 141, 105953. [Google Scholar] [CrossRef]
  40. Wijnen, B.; Sanders, P.; Pearce, J. Improved model and experimental validation of deformation in fused filament fabrication of polylactic acid. Prog. Addit. Manuf. 2018, 3, 193–203. [Google Scholar] [CrossRef]
  41. Rigid.ink PETG Data Sheet. Available online: https://devel.lulzbot.com/filament/Rigid_Ink/PETG%20DATA%20SHEET.pdf (accessed on 10 May 2023).
Figure 1. Lock-in method technique that reduces the impact of noise and improves detection of smaller signals.
Applsci 13 05988 g001
Figure 2. Schematic description of the test rig (a) and 3D model (b).
Applsci 13 05988 g002
Figure 3. Test rig for gear engagement.
Applsci 13 05988 g003
Figure 4. The phase shift for gears made of (a) PLA, (b) PETG allows to distinguish the region of compressive and tensile load in the region of the loaded tooth of the gear. The highlighted part (white closed curve) indicates the highlighted concentric contour fibers.
Applsci 13 05988 g004
Figure 5. First stress invariant for the PLA wheel under the force load induced by the modal exciter, and the values of the invariants at the points on the line segments marked in the contour fiber region (red plot) and in the matrix region (green plot).
Applsci 13 05988 g005
Figure 6. First stress invariant for the PETG wheel under the force load induced by the modal exciter, and the invariant values at the points on the line segments marked in the contour fiber region (red plot) and in the matrix region (green plot).
Applsci 13 05988 g006
Table 1. 3D printing technology and its manufacturing tolerances [15].
3D Printing TechnologyTolerance
SLS0.06 mm
FDM0.25 mm
PolyJet0.016 mm
Table 2. Input material parameters for thermoelastic analysis.
Materialα
Coefficient of Linear Thermal Expansion
[K−1]
ρ
Density
[kg/m3]
cp
Heat Capacity [J/kg·K]
Source of Material Properties
PLA8.5 × 10−511701800[40]
PETG5.1 × 10−512701200[41]
Table 3. Parameter of roughness of profile determined on a line on the tooth width.
MaterialRz
Mean Peak to Valey Height
[μm]
Rsk
Skewness
[1]
PLA97.13−0.16
PETG61.930.32
Steel counter-piece8.551.17
Disclaimer/Publisher’s Note: The statements, opinions and data contained in all publications are solely those of the individual author(s) and contributor(s) and not of MDPI and/or the editor(s). MDPI and/or the editor(s) disclaim responsibility for any injury to people or property resulting from any ideas, methods, instructions or products referred to in the content.

