1. Introduction
Because of their outstanding combination of properties, aluminum-based alloys are widely used in a variety of industrial sectors. These alloys are predominantly composed of aluminum, with the incorporation of other metallic elements to produce specific properties. Alloying elements can have a major influence on the properties of aluminum-based alloys, such as strength, corrosion resistance, and wear resistance. Copper, silicon, magnesium, zinc, manganese, and lithium are the most typical alloying elements used in aluminum-based alloys. Understanding the relevance of these alloying elements is critical for selecting the most suitable material for certain applications, since each offers a distinct combination of properties suited for a variety of industrial uses [
1,
2,
3,
4].
Wrought and casting alloys are the two primary types of aluminum-based alloys, which are manufactured by rolling, forging, extruding, or casting. Aluminum-based alloys possess several advantages, including high strength-to-weight ratios, superior thermal conductivity, and corrosion resistance, making them ideal to be employed in the aerospace, automotive, construction, and packaging industries [
1,
2,
4]
Aluminum-chromium (Al-Cr) alloys are metallic materials that include different quantities of chromium. These alloys have good mechanical and thermal properties, making them appropriate for a wide range of industrial applications such as aerospace, automotive, sports equipment, and electrical. The addition of chromium improves the alloy’s strength, hardness, and resistance to wear and corrosion. By adjusting the amount of chromium and other alloying elements added to the alloy, the mechanical properties of Al-Cr alloys may be modified to satisfy specific needs. Several manufacturing methods can be used to manufacture Al-Cr alloys [
5,
6].
Aluminum-chromium (Al-Cr) alloys are developed employing a variety of techniques that typically include casting, extrusion, and rolling. These processes control the microstructure and characteristics of alloys, such as their mechanical and thermal properties, and influence their suitability for various applications. Additional alloying elements, such as copper, magnesium, and zinc, have an impact on the properties of Al-Cr alloys as well [
6,
7,
8,
9].
Mechanical alloying is a solid-state powder metallurgy technology that includes high-energy ball milling to repeatedly deform, fracture, and weld powder particles. This method is capable of being used to produce metal alloys, intermetallics, and composites with controlled microstructures and enhanced properties including hardness, strength, and wear resistance. Mechanical alloying is employed in a variety of fields, including aerospace, automotive, and biomedical engineering, as well as the development of novel materials for energy storage and conversion [
10,
11,
12,
13].
Powder metallurgy includes the process of sintering metal components, which comprises a variety of stages such as powder preparation, mixing, compacting, and sintering. Consolidation, in which the powder particles are pressed together to generate a solid mass, is a crucial stage in this process. The ultimate properties of the metal component, such as strength, density, and porosity, are influenced by the consolidation process. Consolidation can be achieved using a variety of processes, including cold pressing, hot pressing, and isostatic pressing, depending on the kind of metal powder and the required characteristics of the final product [
14,
15,
16,
17].
The properties of aluminum alloys must be improved in order to be suitable for the aerospace and automotive sectors, particularly at moderately increased temperatures. To accomplish this, alternative alloying systems, such as aluminum-based alloys containing trace amounts of transition metals such as chromium, molybdenum, zirconium, and iron, are being extensively investigated [
18].
Even at low concentrations, chromium has a significant influence on recrystallization in commercial wrought aluminum alloys. Higher chromium concentrations, on the other hand, cannot be produced using traditional casting and ingot metallurgy due to detrimental effects on toughness, strength, and formability. As a result, powder metallurgy is employed in their manufacture, which involves powder preparation using melt atomization or mechanical alloying, followed by powder compaction via hot extrusion. Powder metallurgy produces Al-TM alloys with a refined and homogenous structure, which improves their strength and thermal stability [
18,
19,
20,
21].
Polycrystalline metals and alloys’ mechanical properties are highly sensitive to grain size. It has been widely established that refining the grain size of a polycrystalline material can substantially increase its strength. Hall [
22] and Petch [
23] developed an important relationship, known as the Hall–Petch relationship, between the yield strength and grain size d of polycrystals.
The mechanical properties of nanocrystalline alloys or metals are greatly affected by grain size. Decreasing grain size results in a higher density of grain boundaries, which improves hardness, strength, and ductility. Although the high density of grain boundaries favors tensile strength, grain boundaries could also serve as a location for fracture initiation, resulting in a loss in ductility. To achieve the right combination of mechanical properties in nanocrystalline alloys or metals, rigorous optimization of grain size, composition, and processing conditions is required [
24,
25,
26].
Thus, the aim of this study is to investigate the benefits of applying powder metallurgy to produce Al5Cr- and Al7.5Cr-consolidated samples. In this regard, Al-Cr powder blends were mechanically milled and then consolidated to explore the effect of non-equilibrium processing parameters on micro-structural features such as crystallite size, lattice strain, dislocation density, and solid-phase transitions. A theoretical model was developed as well to predict some mechanical properties of the materials produced in this work. Microstructural characteristics such as porosity, volume fraction, and precipitate volume fraction were considered in this model.
2. Materials and Methods
Processing. This research developed a processing route that involved the following steps:
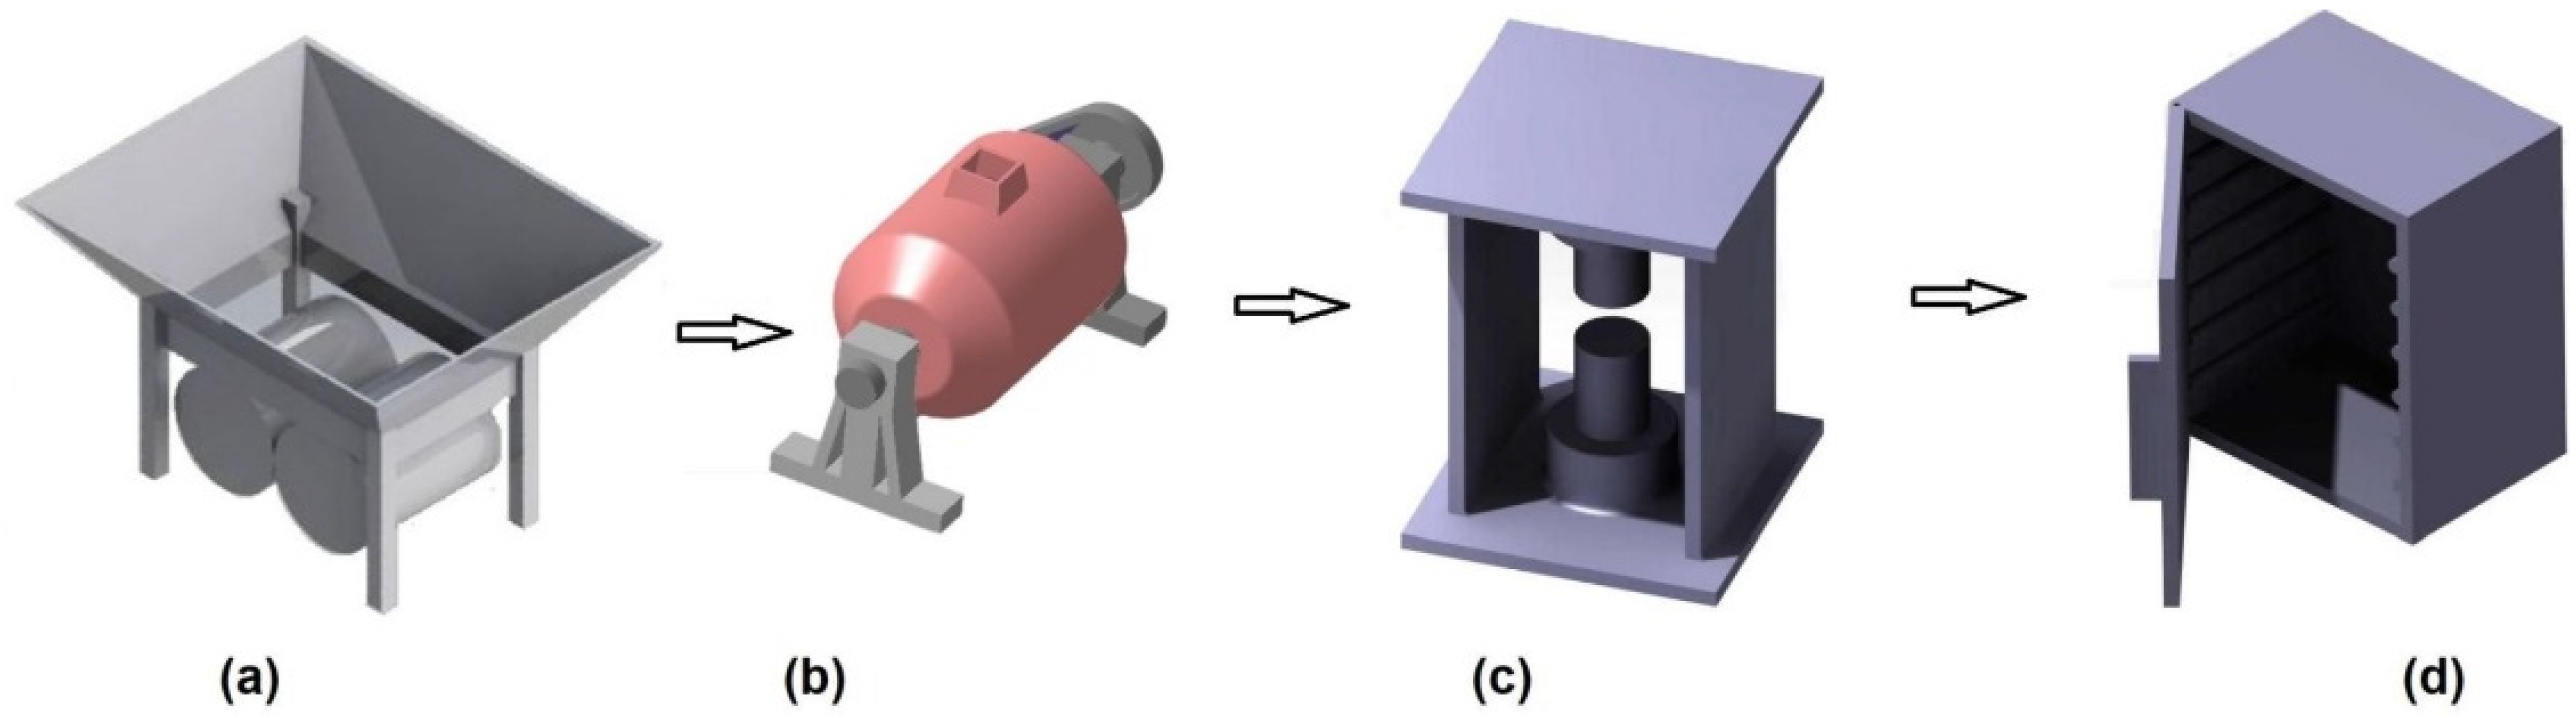
To begin, Cr pieces with sizes that ranged from 2 to 2.5 cm were carefully struck with a hammer to produce particles ranging in size from 0.5 mm to 1 mm. The Cr particles were then mechanically milled until they had an average particle size of 37.9 μm, as shown in
Figure 1b, which is a schematic representation of the ball mill where the ball milling process was carried out. The Al and Cr powder mixture was then mechanically milled for various periods of time to reduce the particle sizes of the metallic elements, achieve a uniform chemical blend of both Al and Cr elements, and promote Cr alloying into Al (see
Figure 1b). The Al and Cr powder mixture was pressed in a cylindrical mold at room temperature using one uniaxial press, as shown in
Figure 1c. Following that, the green compacts obtained from uniaxial pressing were sintered in an ultrahigh vacuum furnace, as shown in
Figure 1d.
The following sections detail the operating parameters involved in each stage developed throughout the powder metallurgical processing route established in this study.
Materials. Elemental powders of Cr and Al (both with a purity of 99.9%) were mixed in a mortar to obtain the compositions of Al-5Cr (wt.%) and Al-7.5Cr (wt.%).
Ball milling of powder mixture. In a hardened steel vial containing stainless steel balls, the powder mixture was placed. The process control agent (PCA) was analytical grade methyl alcohol, which was injected to the powder blend in a 0.003 mL/g ratio. Under an argon atmosphere, the metallic powder mixture was placed inside the reinforced steel vial and closed with a cover. The metallic powder blend was then mechanically milled in the specified mill at 400 RPM for various milling durations (in order to characterize the evolution of microstructure by X-ray diffraction technique) until a total process time of 20 h was reached. The mechanical milling process employed a balls-to-powder weight ratio of 10:1.
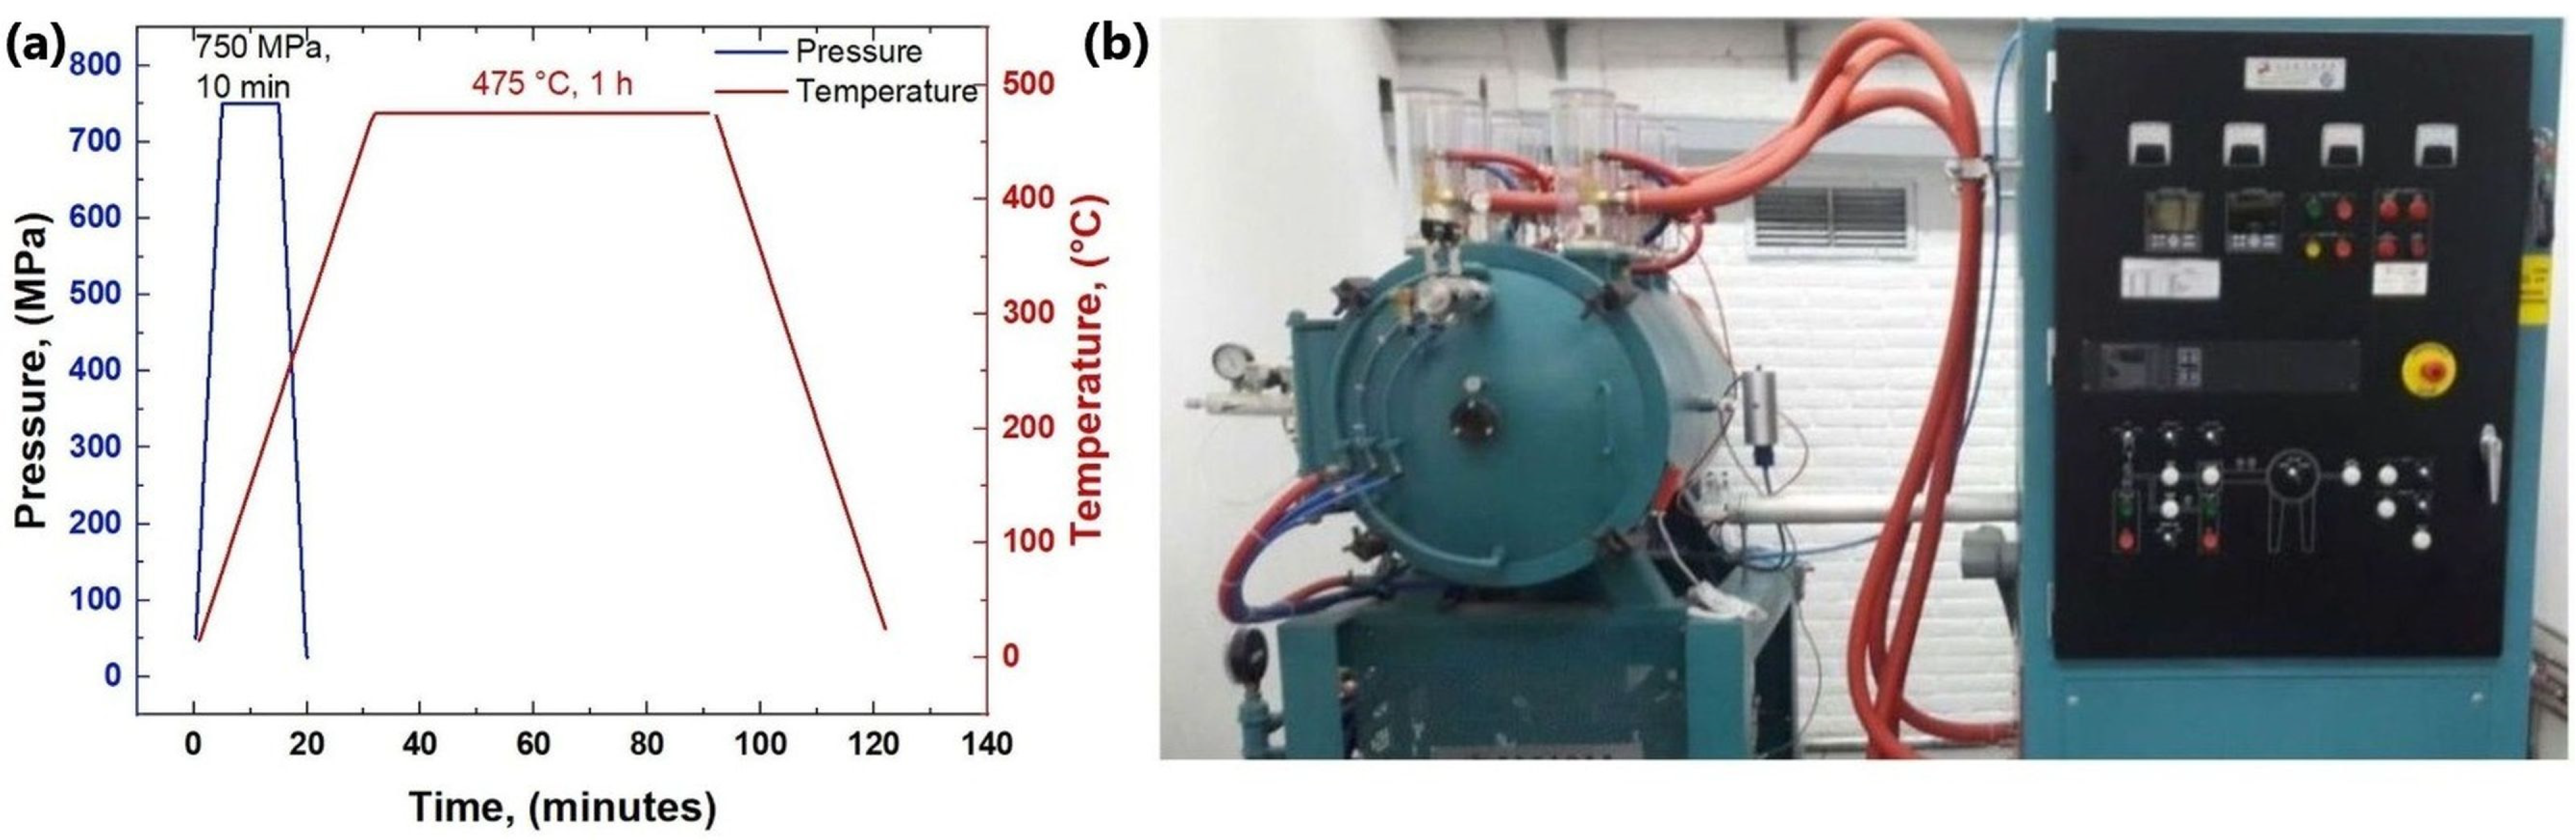
Consolidation of previously ball-milled powders. During the pressing process, the previously ball-milled Al-Cr powder mixture was subjected to uniaxial pressing at room temperature, a pressure of 750 MPa was employed. In addition, the pressing time was fixed at 10 min (see compaction cycle in
Figure 2a). Once the green compacts were obtained by the uniaxial pressing process, then the specimens produced under the specified conditions were subjected to sintering process. In this thermal processing, the specimens were heated from ambient temperature to 475 °C and retained there for 1 h. (see sintering cycle in
Figure 2a). The sintering process was performed inside an ultra-high vacuum furnace displayed in
Figure 2b.
Microstructural characterization. The consolidated specimens were chemically etched with a Keller reagent with a composition (% vol.) of 10 mL H2O, 3 mL HCl, 2 mL HF and 5 mL HNO3.
A scanning electron microscope ((SEM) mark HITACHI model SUI5IO) was used to analyze the evolution of powder morphology, particle size changes, and the tendency of chemical homogeneity of the powder mixture during the ball milling process. An X-ray energy dispersive (EDS) analyzer coupled with SEM was also utilized to conduct precise chemical analyses and X-ray mappings on un-milled and processed materials. In addition, while the milling period had elapsed, scanning electron microscopy was used to evaluate the chemical composition and phase distribution. In the same way, the sintered specimens were analyzed by SEM including the techniques mentioned above. The X-ray diffraction method was employed to display and identify the crystallinity of metallic phases developed during milling, as well as to quantify the size of nanosized grains, lattice strain, and dislocations density utilizing the X-ray diffraction peaks. This microstructural examination was conducted in a Siemens Diffractometer D500 at 30 kV and 20 mA. CuK radiation at a wavelength of 1.5418 nm and a step of 0.020°/0.6 s was utilized to scan the specimens over a range of 30° to 100°.
3. Results
3.1. Microstructural Investigation of Al, Cr, and Al-Cr Powder Mixtures
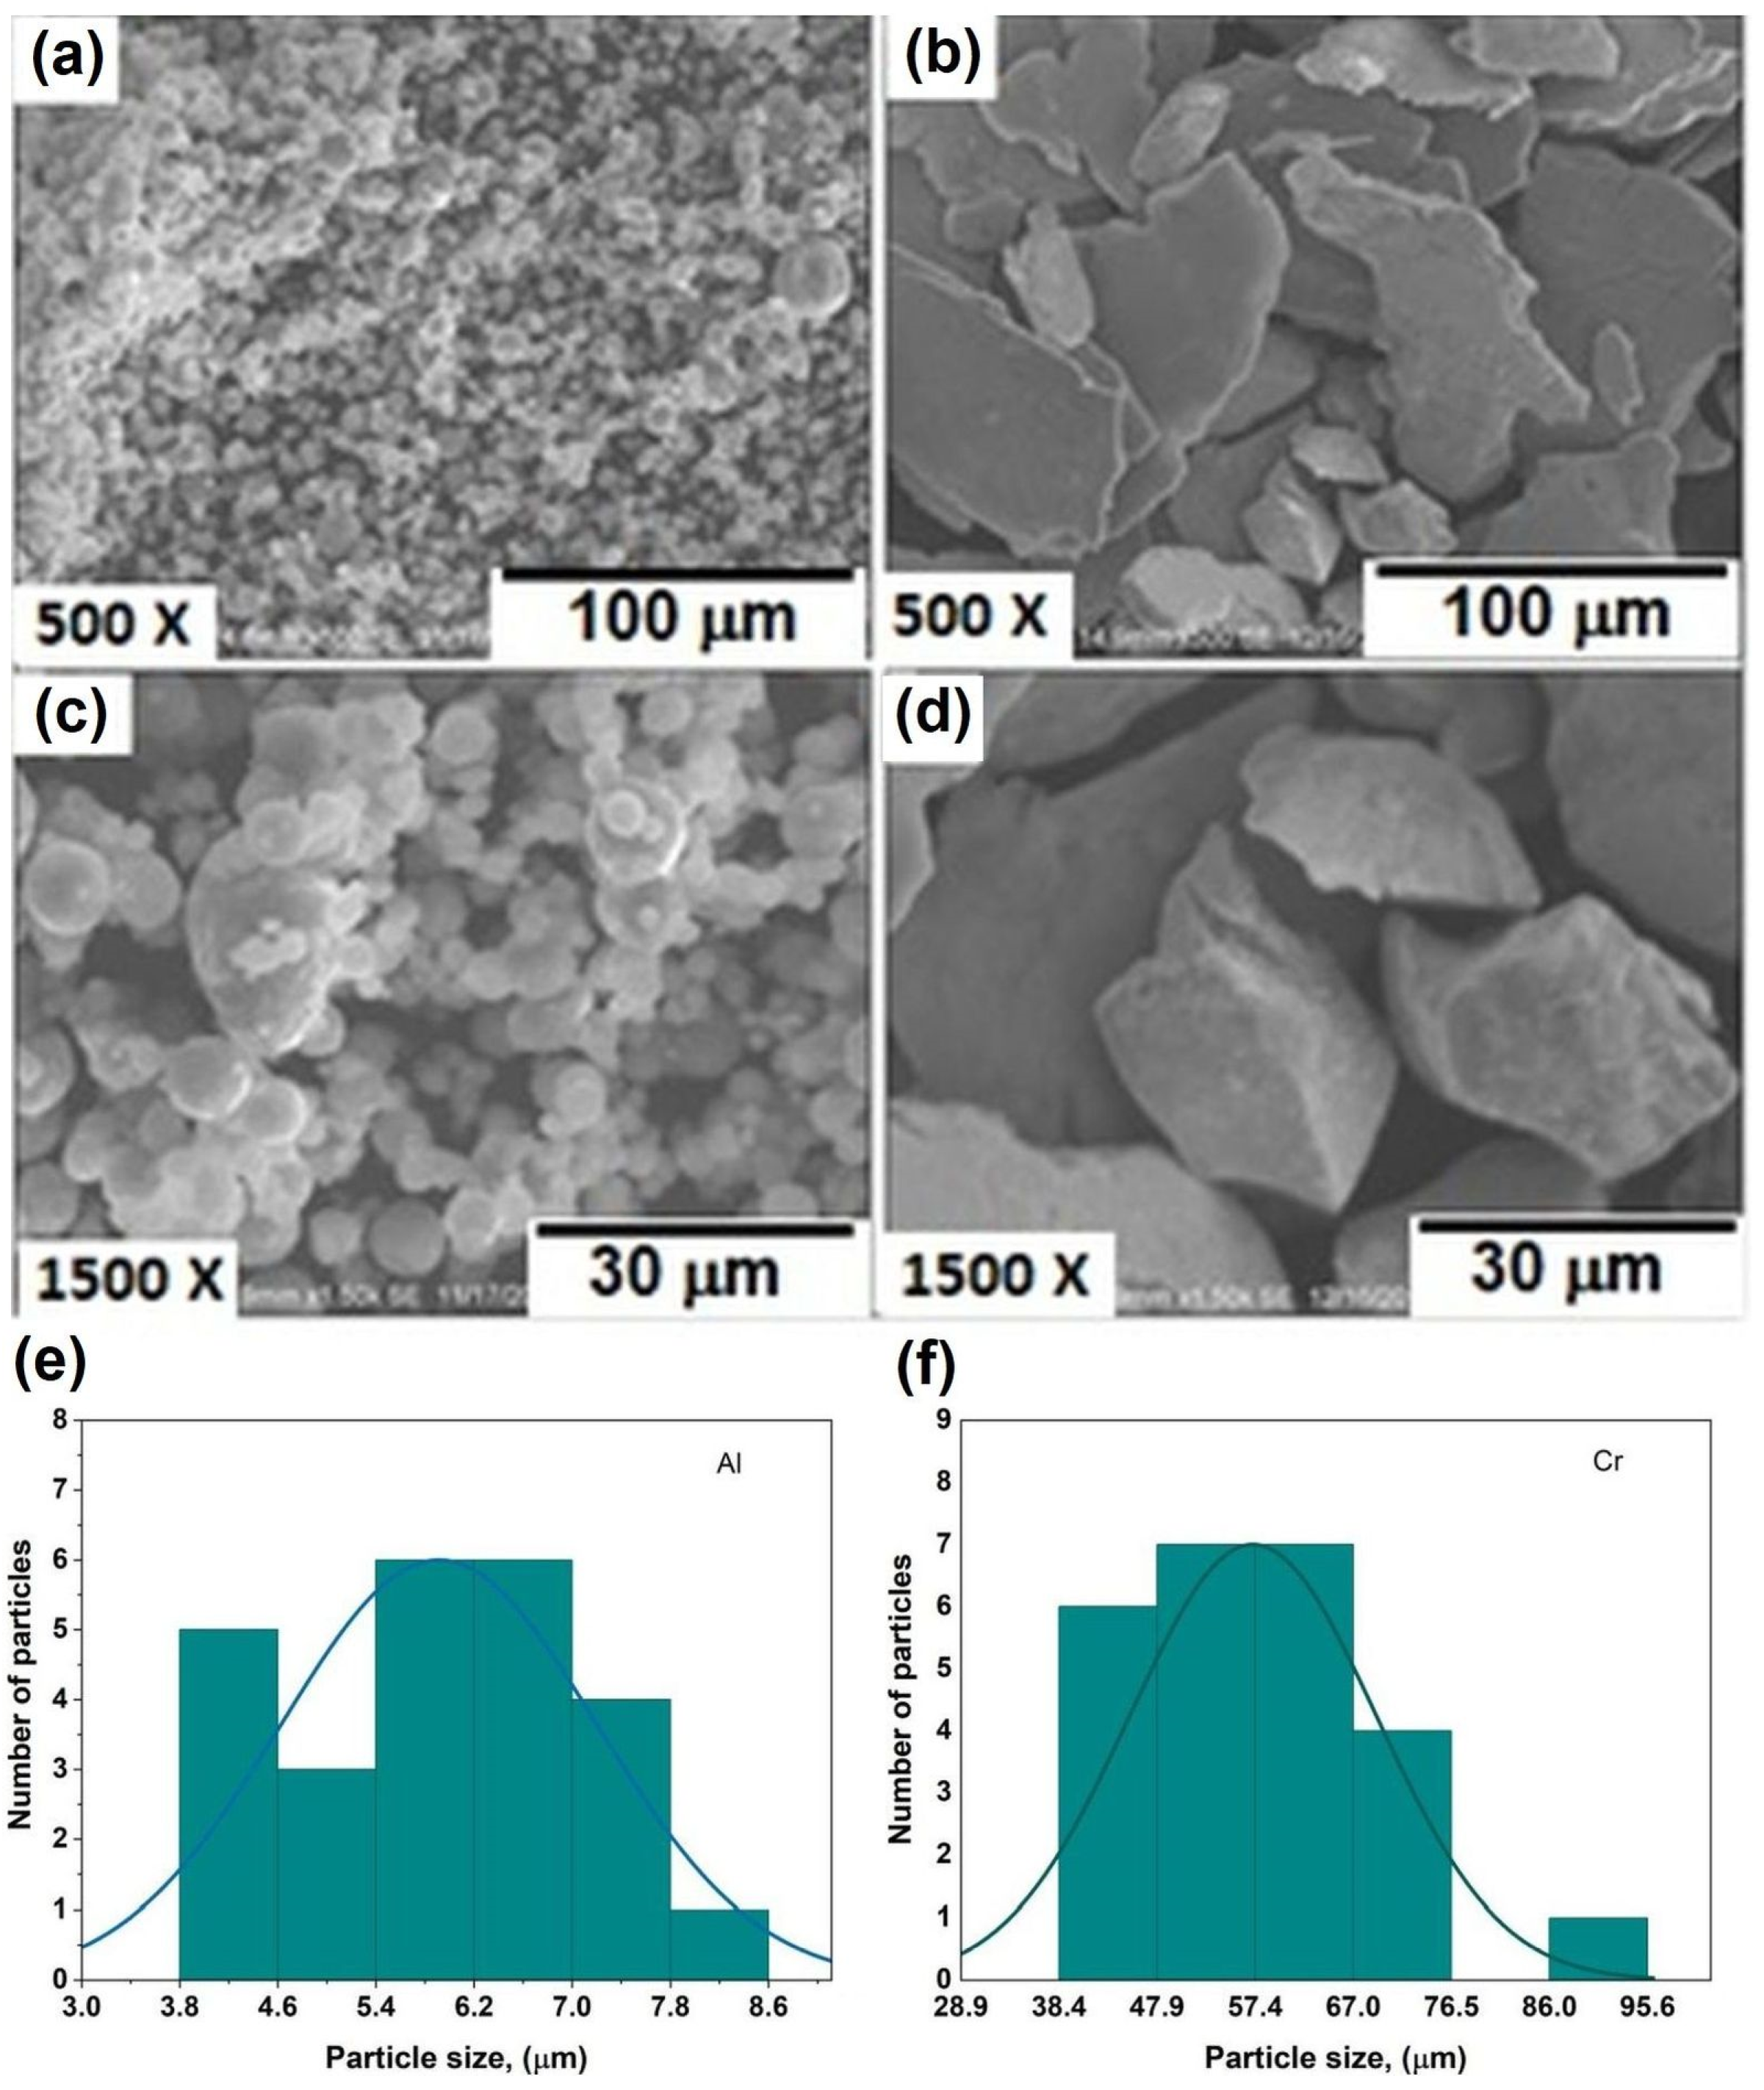
Figure 3 displays the secondary electron micrographs corresponding to (a) Al at 500×, (b) Cr at 500×, (c) Al at 1500×, (d) Cr at 1500×. From the mentioned micrographs it can be observed that Al possesses a spherical morphology with a mean particle size of 3.99 microns. Cr particles have a flake shape and are 37.9 microns in size on average.
Figure 3e,f also show the distributions of the particle sizes of Al and Cr, respectively. Both histograms denote that most Al particles have a particle size between 5.4 and 7 µm, while Cr particles have particle sizes between 47.9 and 67 microns.
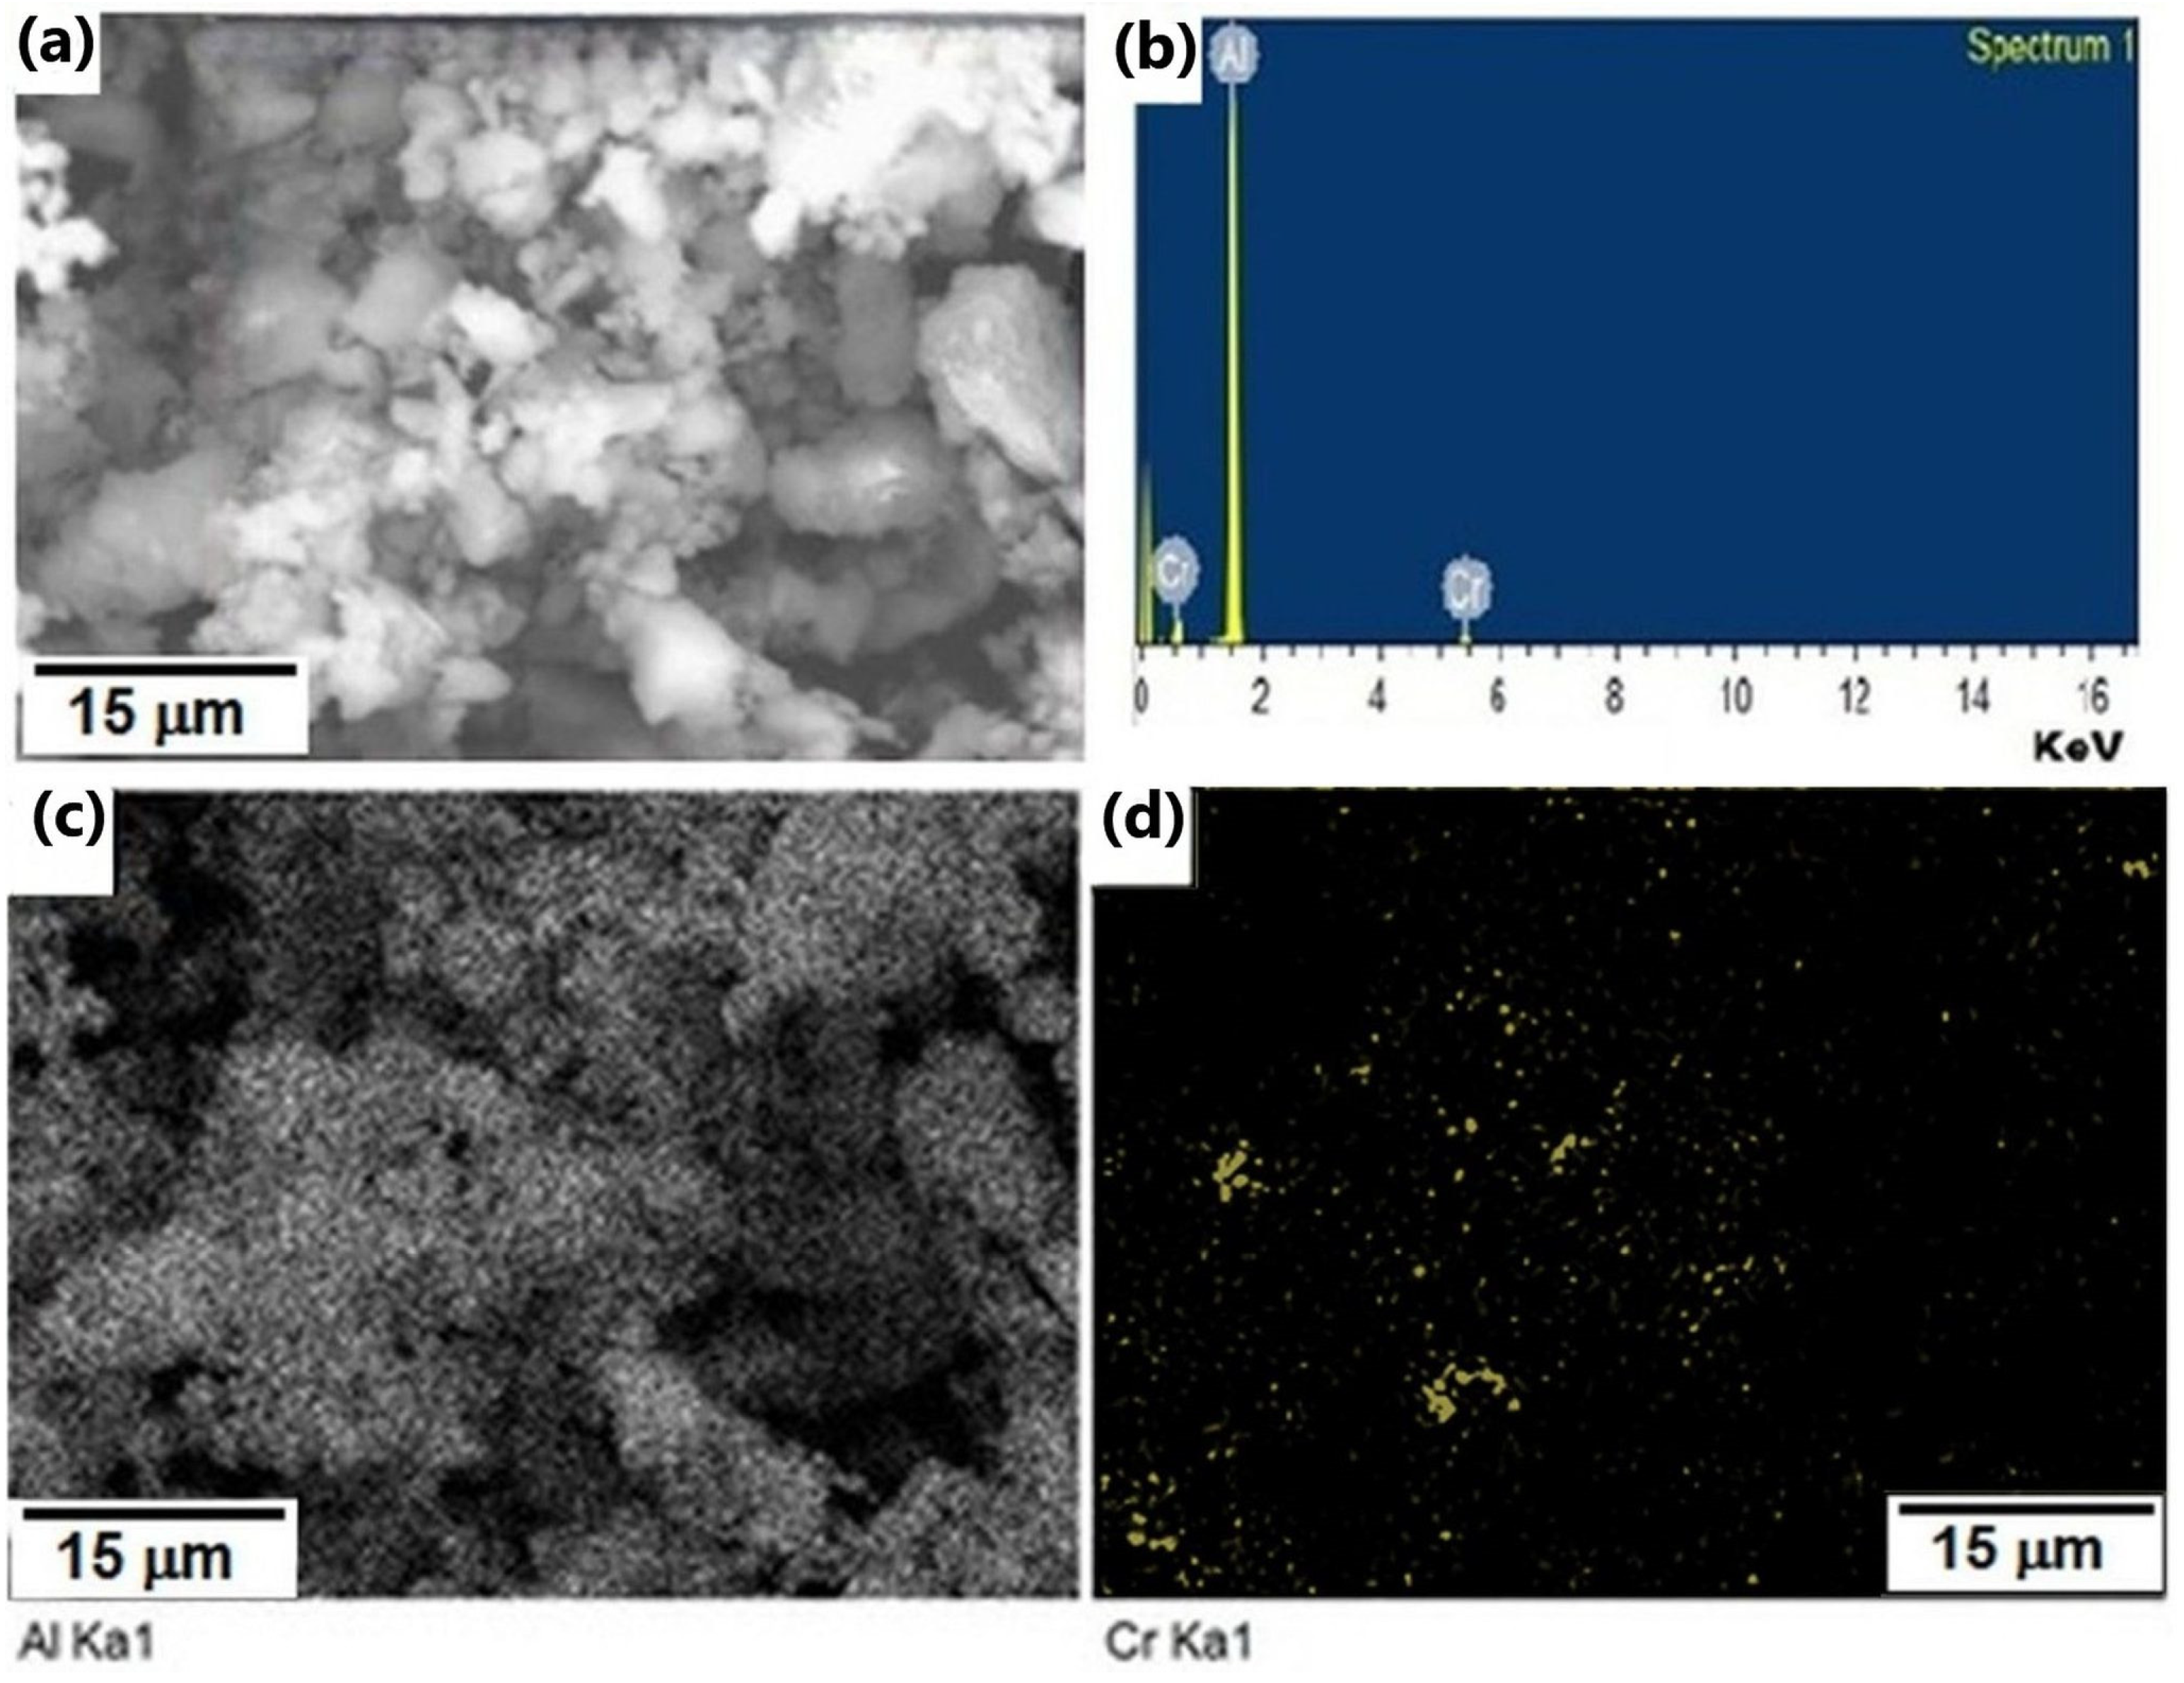
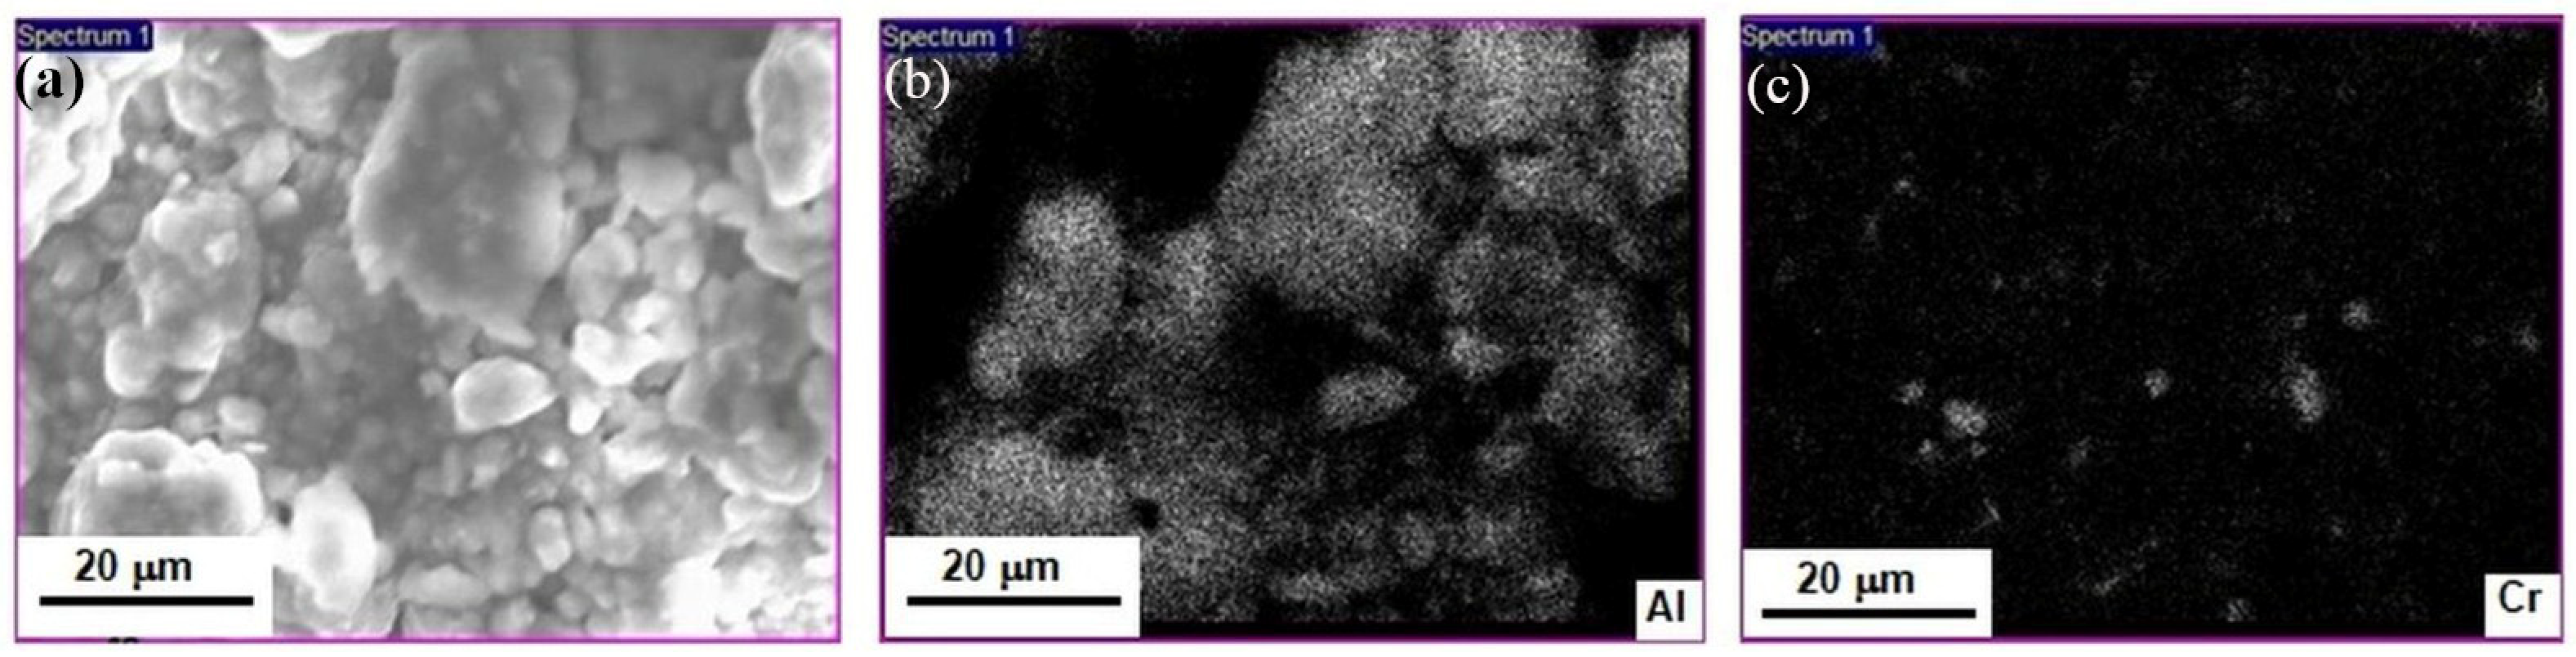
Figure 4b displays the EDS chemical analysis spectrum of Al-5Cr specimen subjected to 20 h of ball milling, this spectrum was obtained from all the surface of the sample presented in
Figure 4a. EDS chemical analyses denote the presence of solvent (Al) and solute (Cr) elements, the low intensity of Cr peaks is due to the relative low content of this element.
Figure 4d exhibits the X-ray chemical maps corresponding to the Al-5Cr specimen after being processed for 20 h. These chemical maps presented in these micrographs indicate that both elements (Al and Cr) are uniformly dispersed in the studied surface; however, the X-ray signals emitted by Cr are weak, where this behavior is due to the low concentration of this element acting partially as solute.
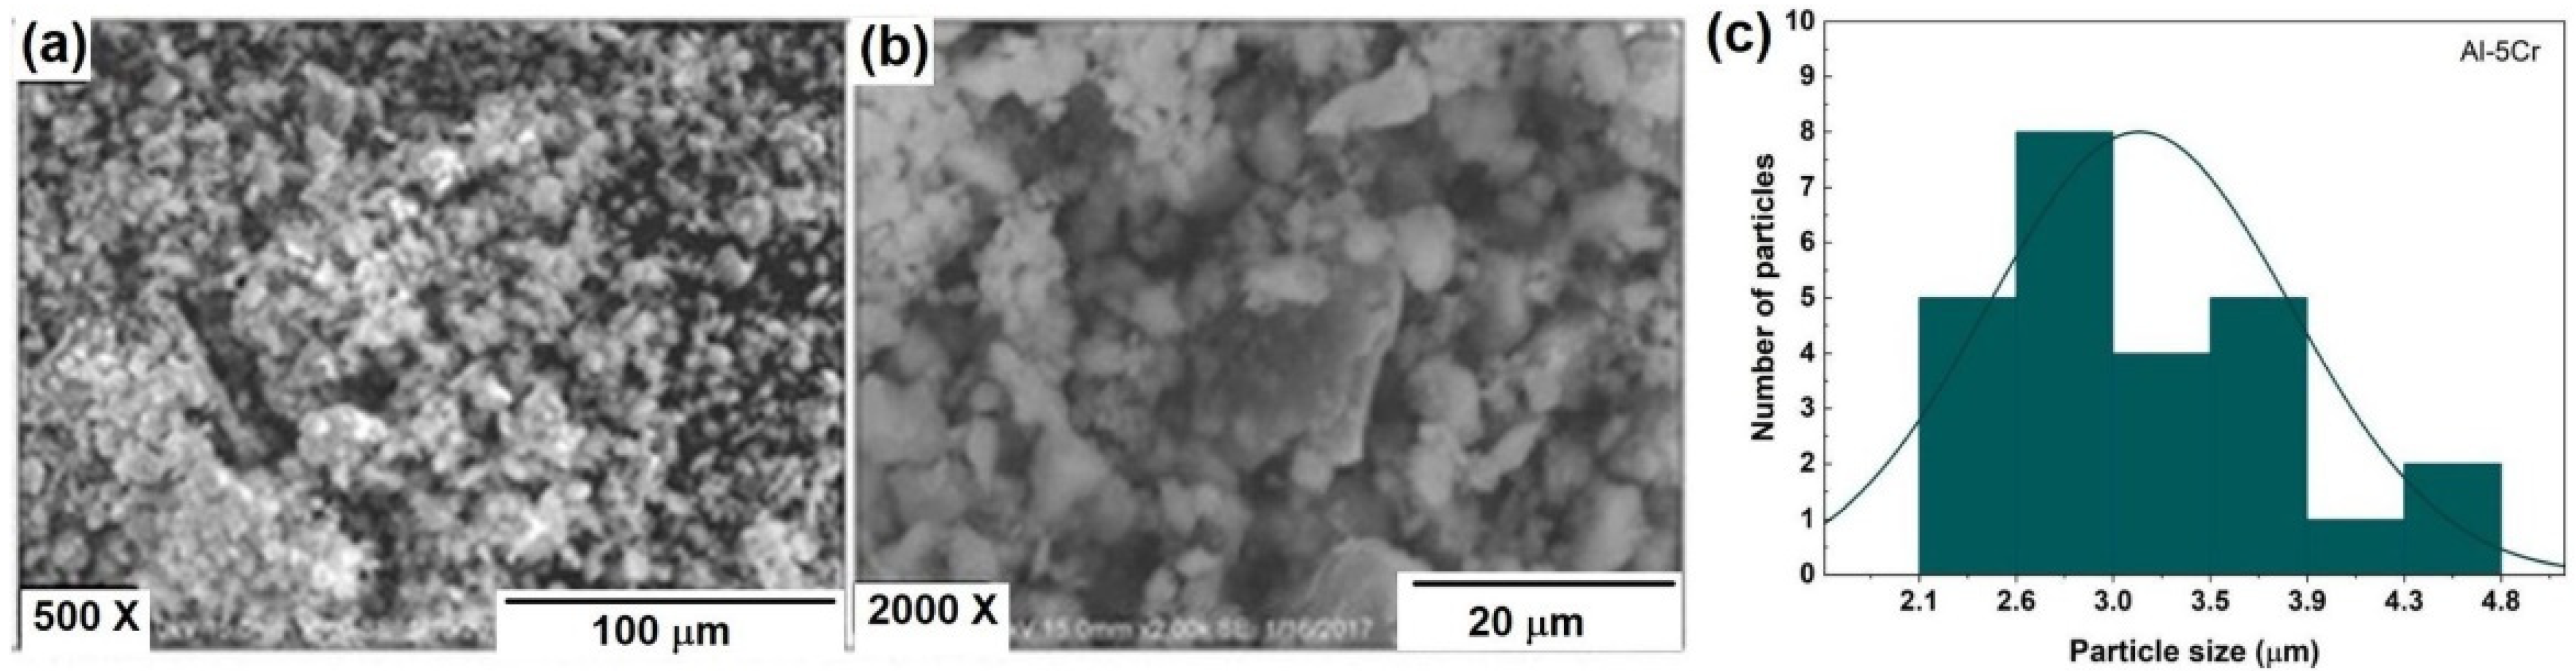
Figure 5 shows SEM micrographs of the previously ball-milled powder with composition of Al-5Cr for 20 h. Micrographs obtained at 500× and 2000× denote that the particles exhibit an irregular morphology with round borders with a mean size of particle of 3.14 μm.
Figure 5c exhibits the particle size distribution histogram of Al-5Cr powder mixture ball milled under the specified conditions, where it is observed that most Al-5Cr particles have particle sizes between 2.6 and 3 microns.
It should be noted that the particle size of the Al-5Cr powder mixture does not reach the original particle size of Cr; this behavior is due to the highest rate of fracture of Cr, since this element is brittle, and Al is ductile.
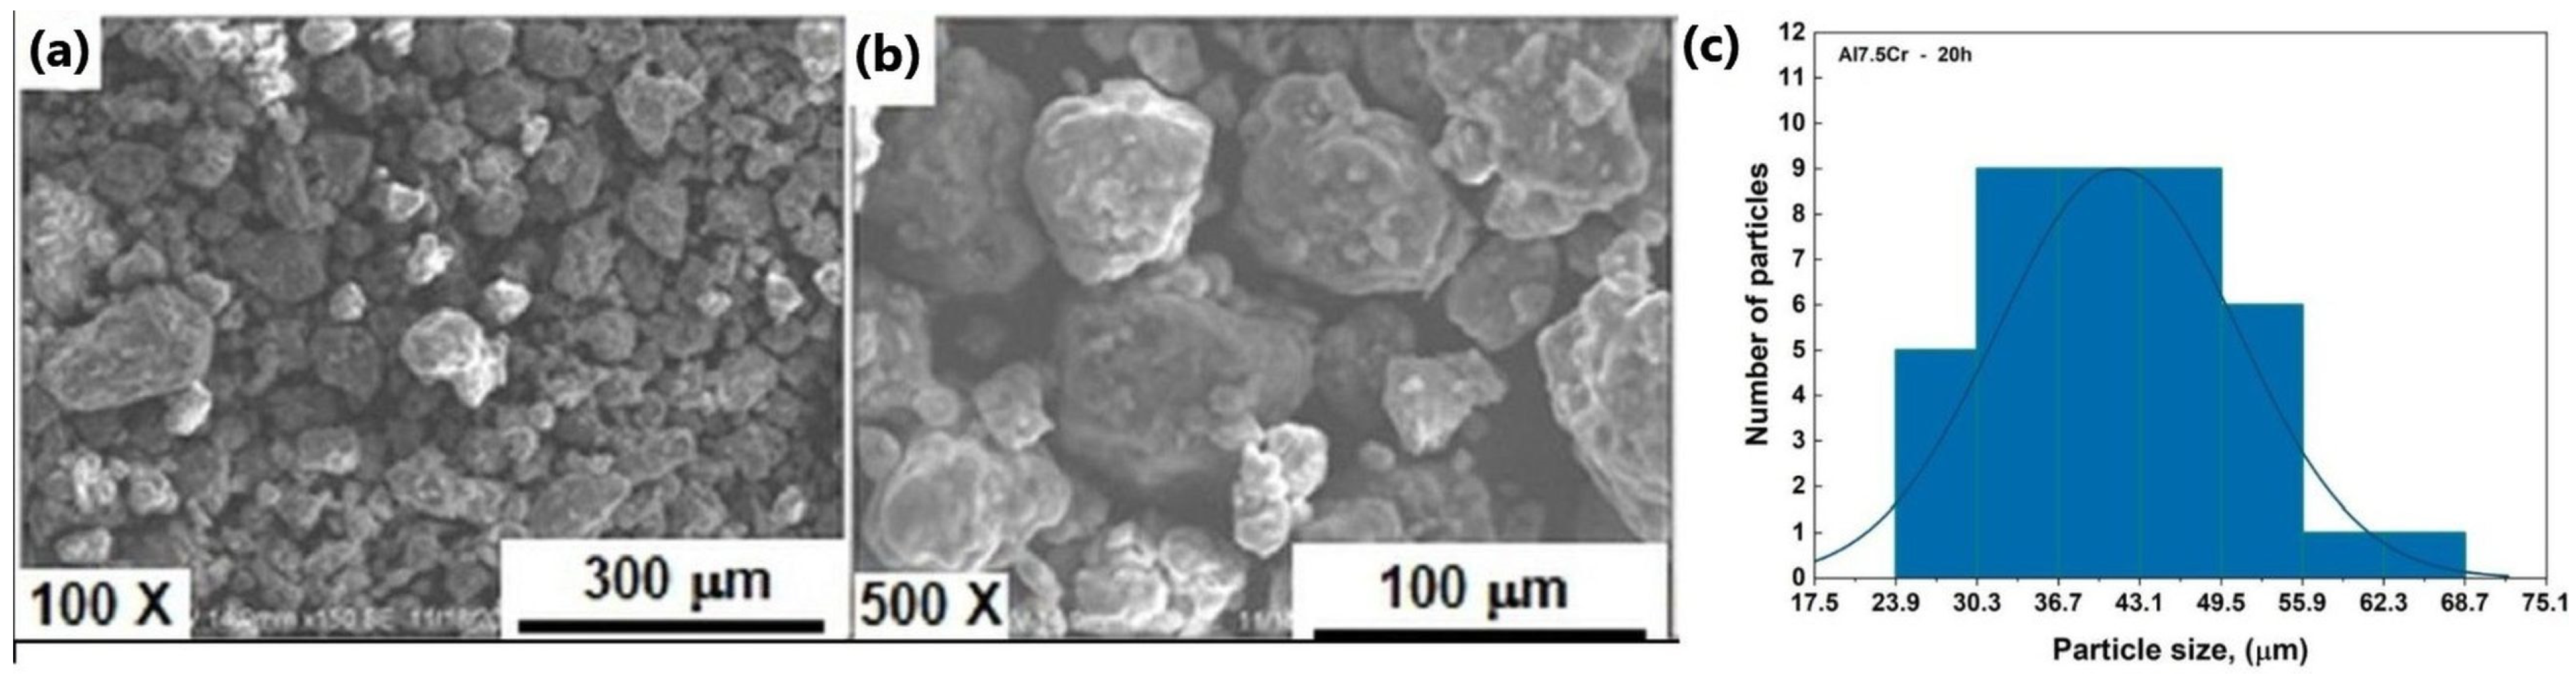
Figure 6a,b exhibits scanning electron micrographs of the powder mixture Al7.5Cr that was previously processed for 20 h. Micrographs attained at 100× and 500× indicate that particles show an irregular morphology with round borders with a mean size of particle of 41.3 μm.
Figure 6c illustrates the particle size distribution histogram of Al7.5Cr powder mixture ball milled for 20 h, where it is distinguished that most particles of Al7.5Cr powder mixture have particle sizes between 30.3 and 49.5 µm.
Figure 7b,c presents the X-ray chemical maps referring to the Al-7.5Cr exemplar after being processed for 20 h. These chemical maps suggest that both elements (Al and Cr) are uniformly distributed in the studied surface displayed in
Figure 7a; however, the X-ray signals radiated by Cr are weak, where this performance is due to the low content of this element acting partially as solute. In addition, it is worth noting that X-ray signals emitted by Cr element occupy more area fraction in the micrograph (
Figure 7c) than the same radiation emitted by the Al-5Cr specimen, see
Figure 4d.
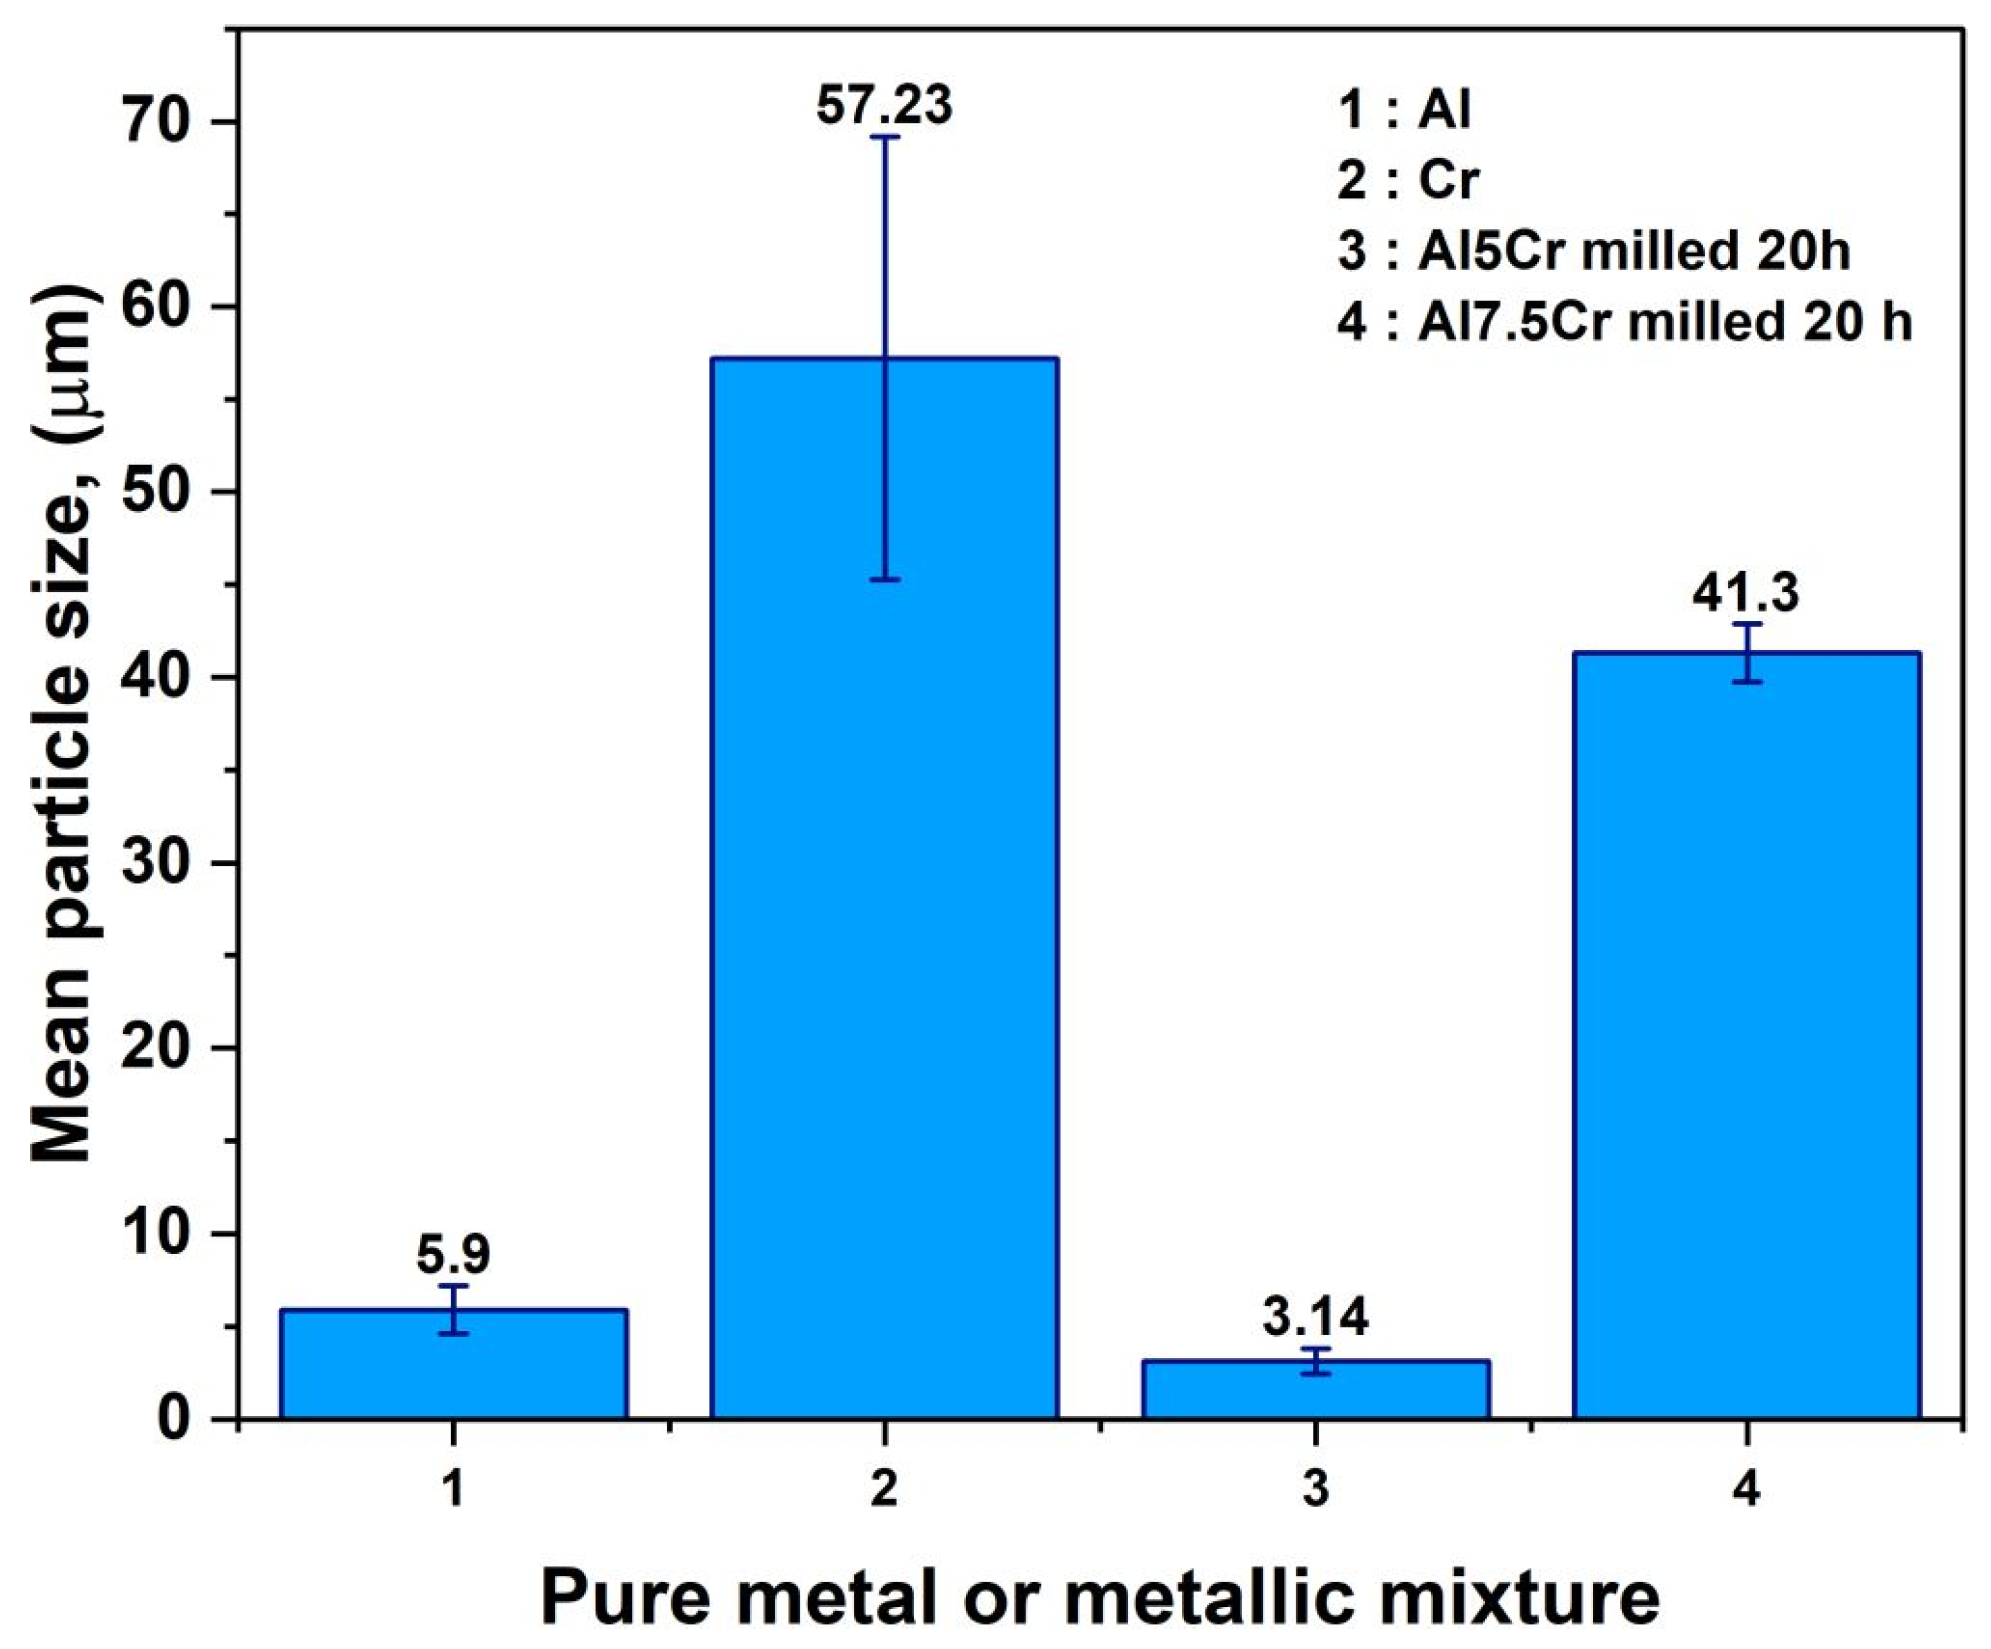
Figure 8 depicts the mean particle sizes together with error bars for pure Al and Cr, as well as Al5Cr and Al7.5Cr powder mixtures. This graph displays mean particle sizes of 5.9 and 57.23 microns for pure Al and Cr, respectively. Additionally, Al5Cr and Al7.5Cr powder mixtures exhibit mean particle sizes of about 3.1 and 41.3 microns, respectively. A decrease can be observed in the standard deviation for the specimens milled for 20 h. This trend could be ascribed to the uniformization of particle size after ball milling.
3.2. Microstructural Analysis of Al-Cr Powder Blends and Sintered Specimens Using X-ray Diffraction
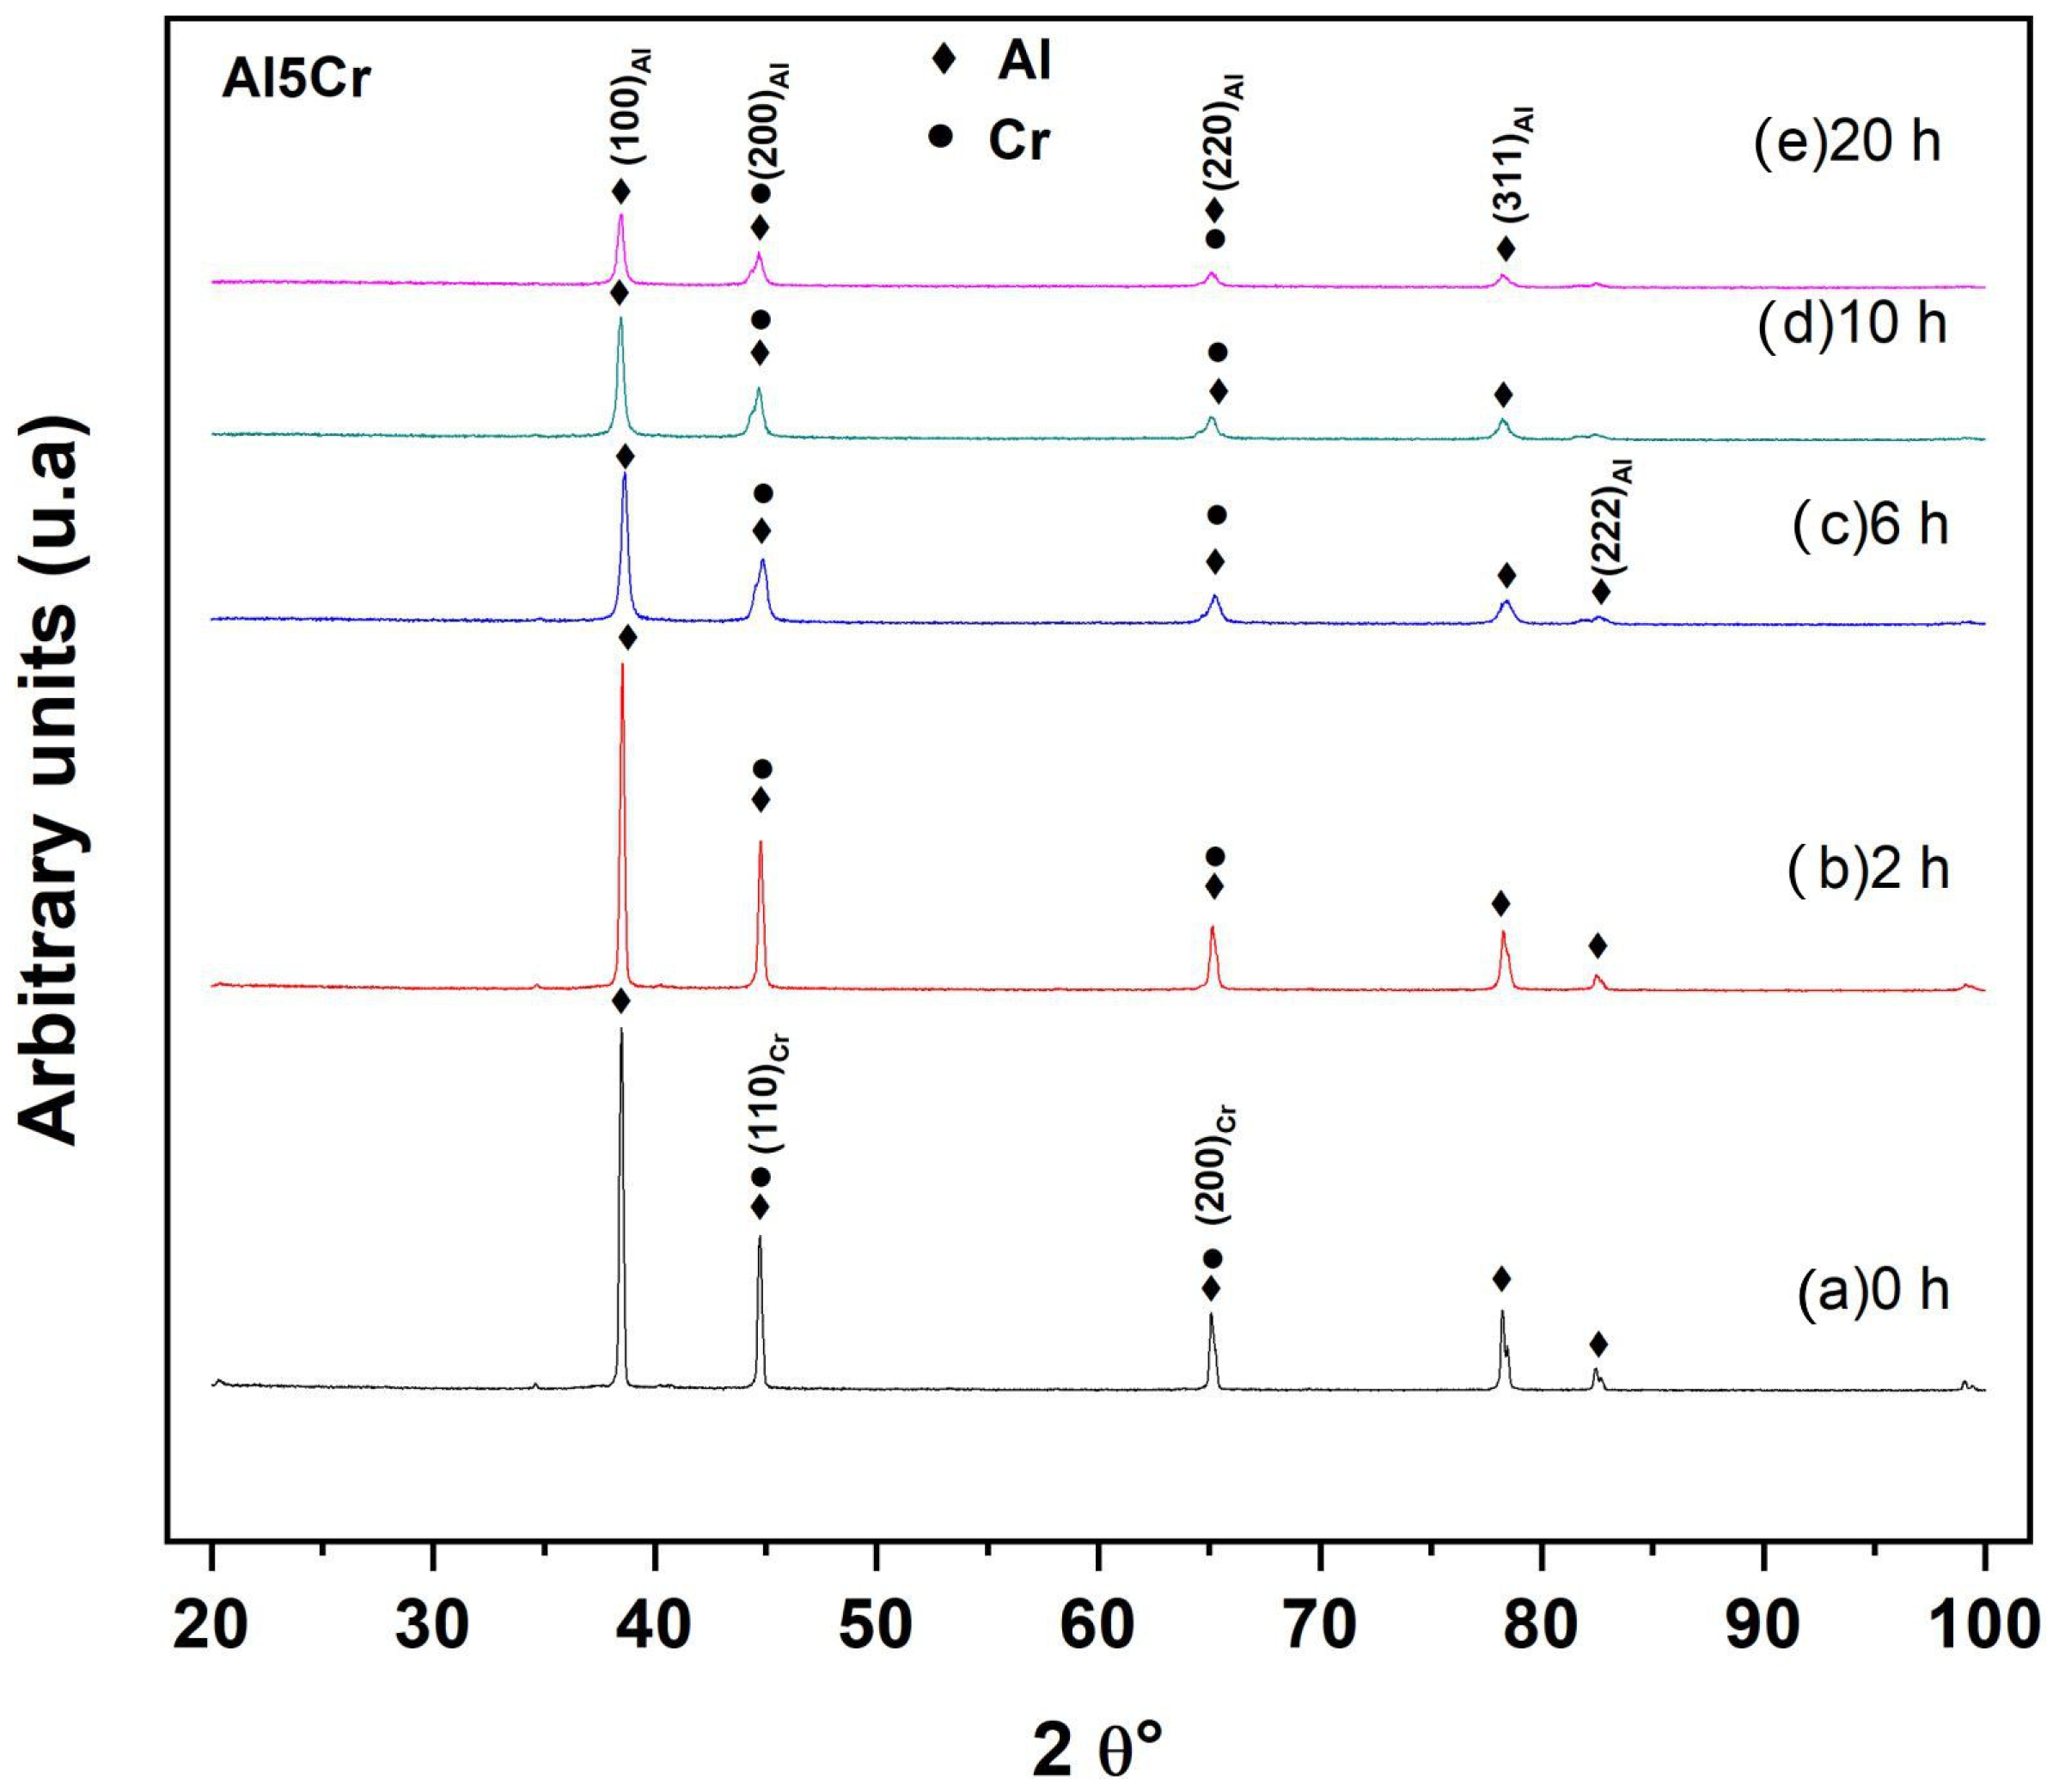
Figure 9 depicts the X-ray diffraction spectra of the ball-milled powder mixture Al-5Cr during various periods of time. The diffraction peaks associated with the Al phase were created via diffraction on the (111), (200), (220), (311), and (222) crystallographic planes, as shown in this X-ray spectrum. In the same way, the X-ray diffraction spectra shows that the diffraction peaks generated by the diffraction on the (200) and (220) crystal planes of Al overlap with the diffraction peaks produced by the (100) and (200) crystallographic planes of Cr.
It is worth noticing that the mechanical milling process did not cause second phases to emerge from Al and Cr components and this is because of the lack of diffraction peaks other than Al and Cr, where these second phases are usually formed by mechanochemical reactions.
In addition,
Figure 9 shows that the breadth of the diffraction peaks associated with Al at half its height was increased as the milling time advanced. The peaks become wider as the crystallite size decreases and the lattice strain increases due to mechanical impacts during the ball milling operation.
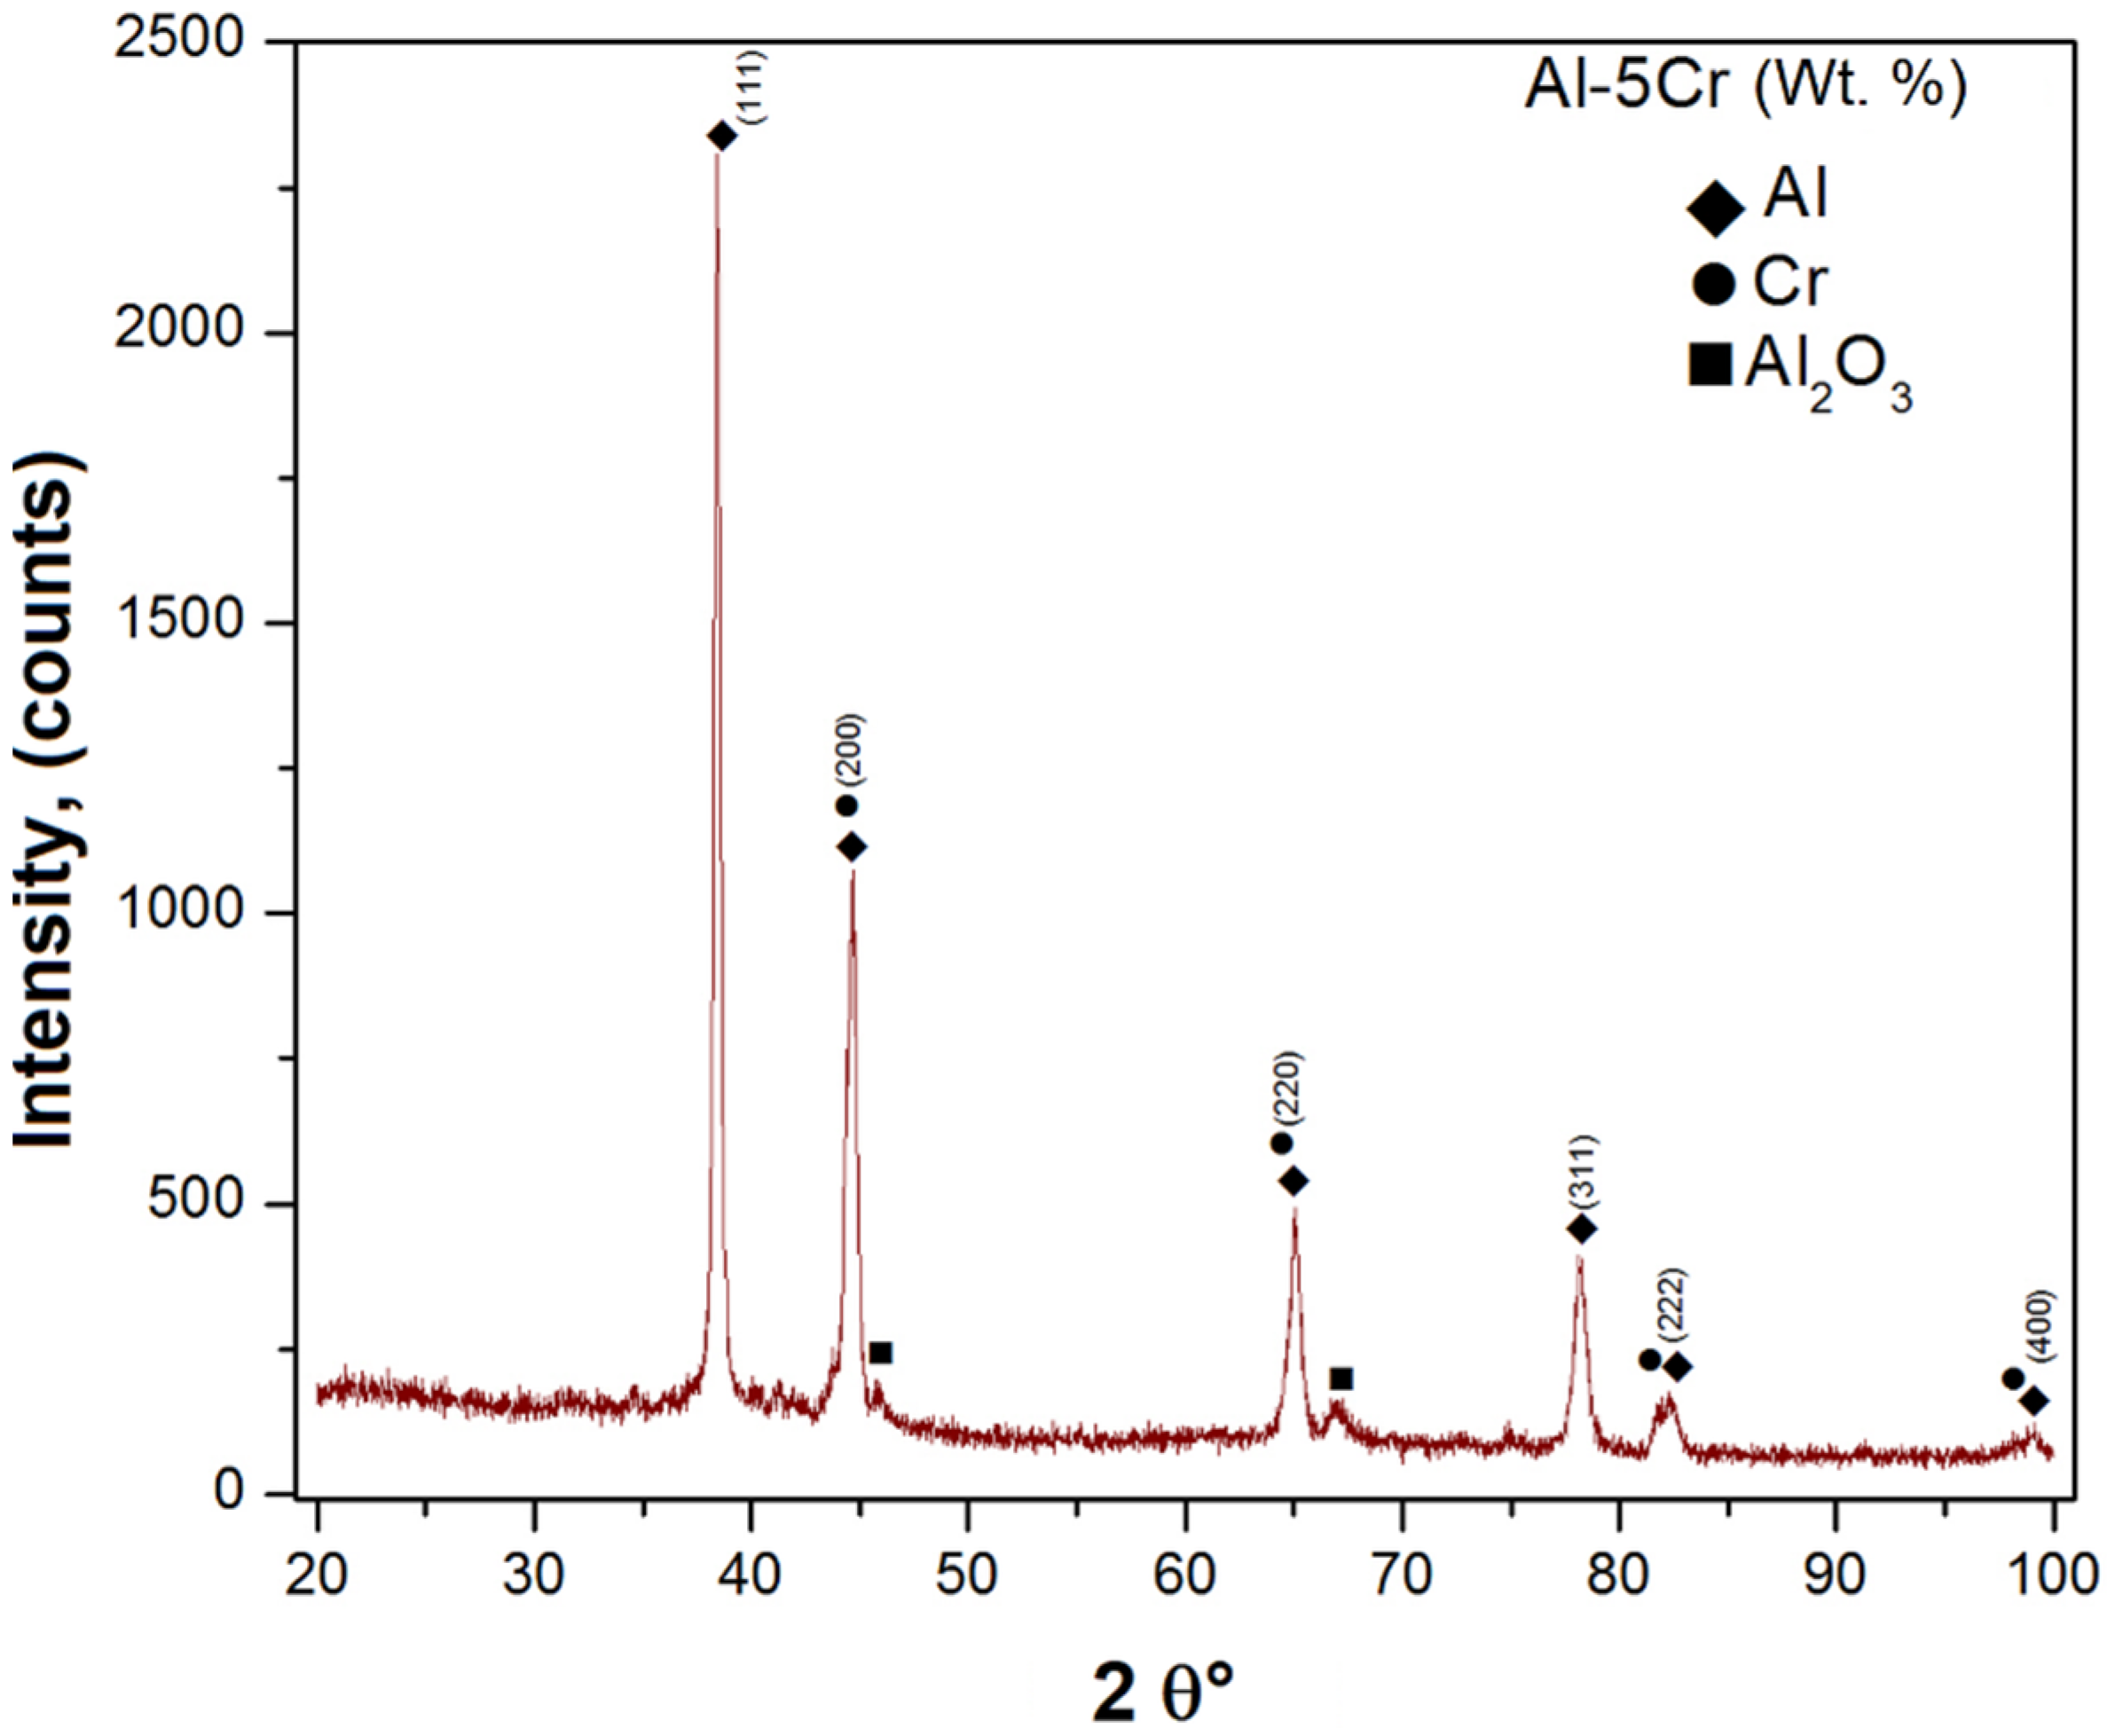
Figure 10 shows the XRD patterns corresponding to the specimen Al-5Cr in consolidated state. This X-ray diffraction profile exhibits the presence of both Al and Cr phases. Additionally, it can be affirmed that the sintering process did not induce the formation or precipitation of second phases that could have been formed by a combined effect of the mechanical activation process induced by the mechanical energy provided to the powder mixture by the repeated impacts of balls together to the thermic energy transferred to specimen during sintering process. In addition, X-ray profiles corresponding to the consolidated Al-5Cr specimen revealed the formation of Al-oxide that could have been formed by the oxidation of Al during thermal treatment.
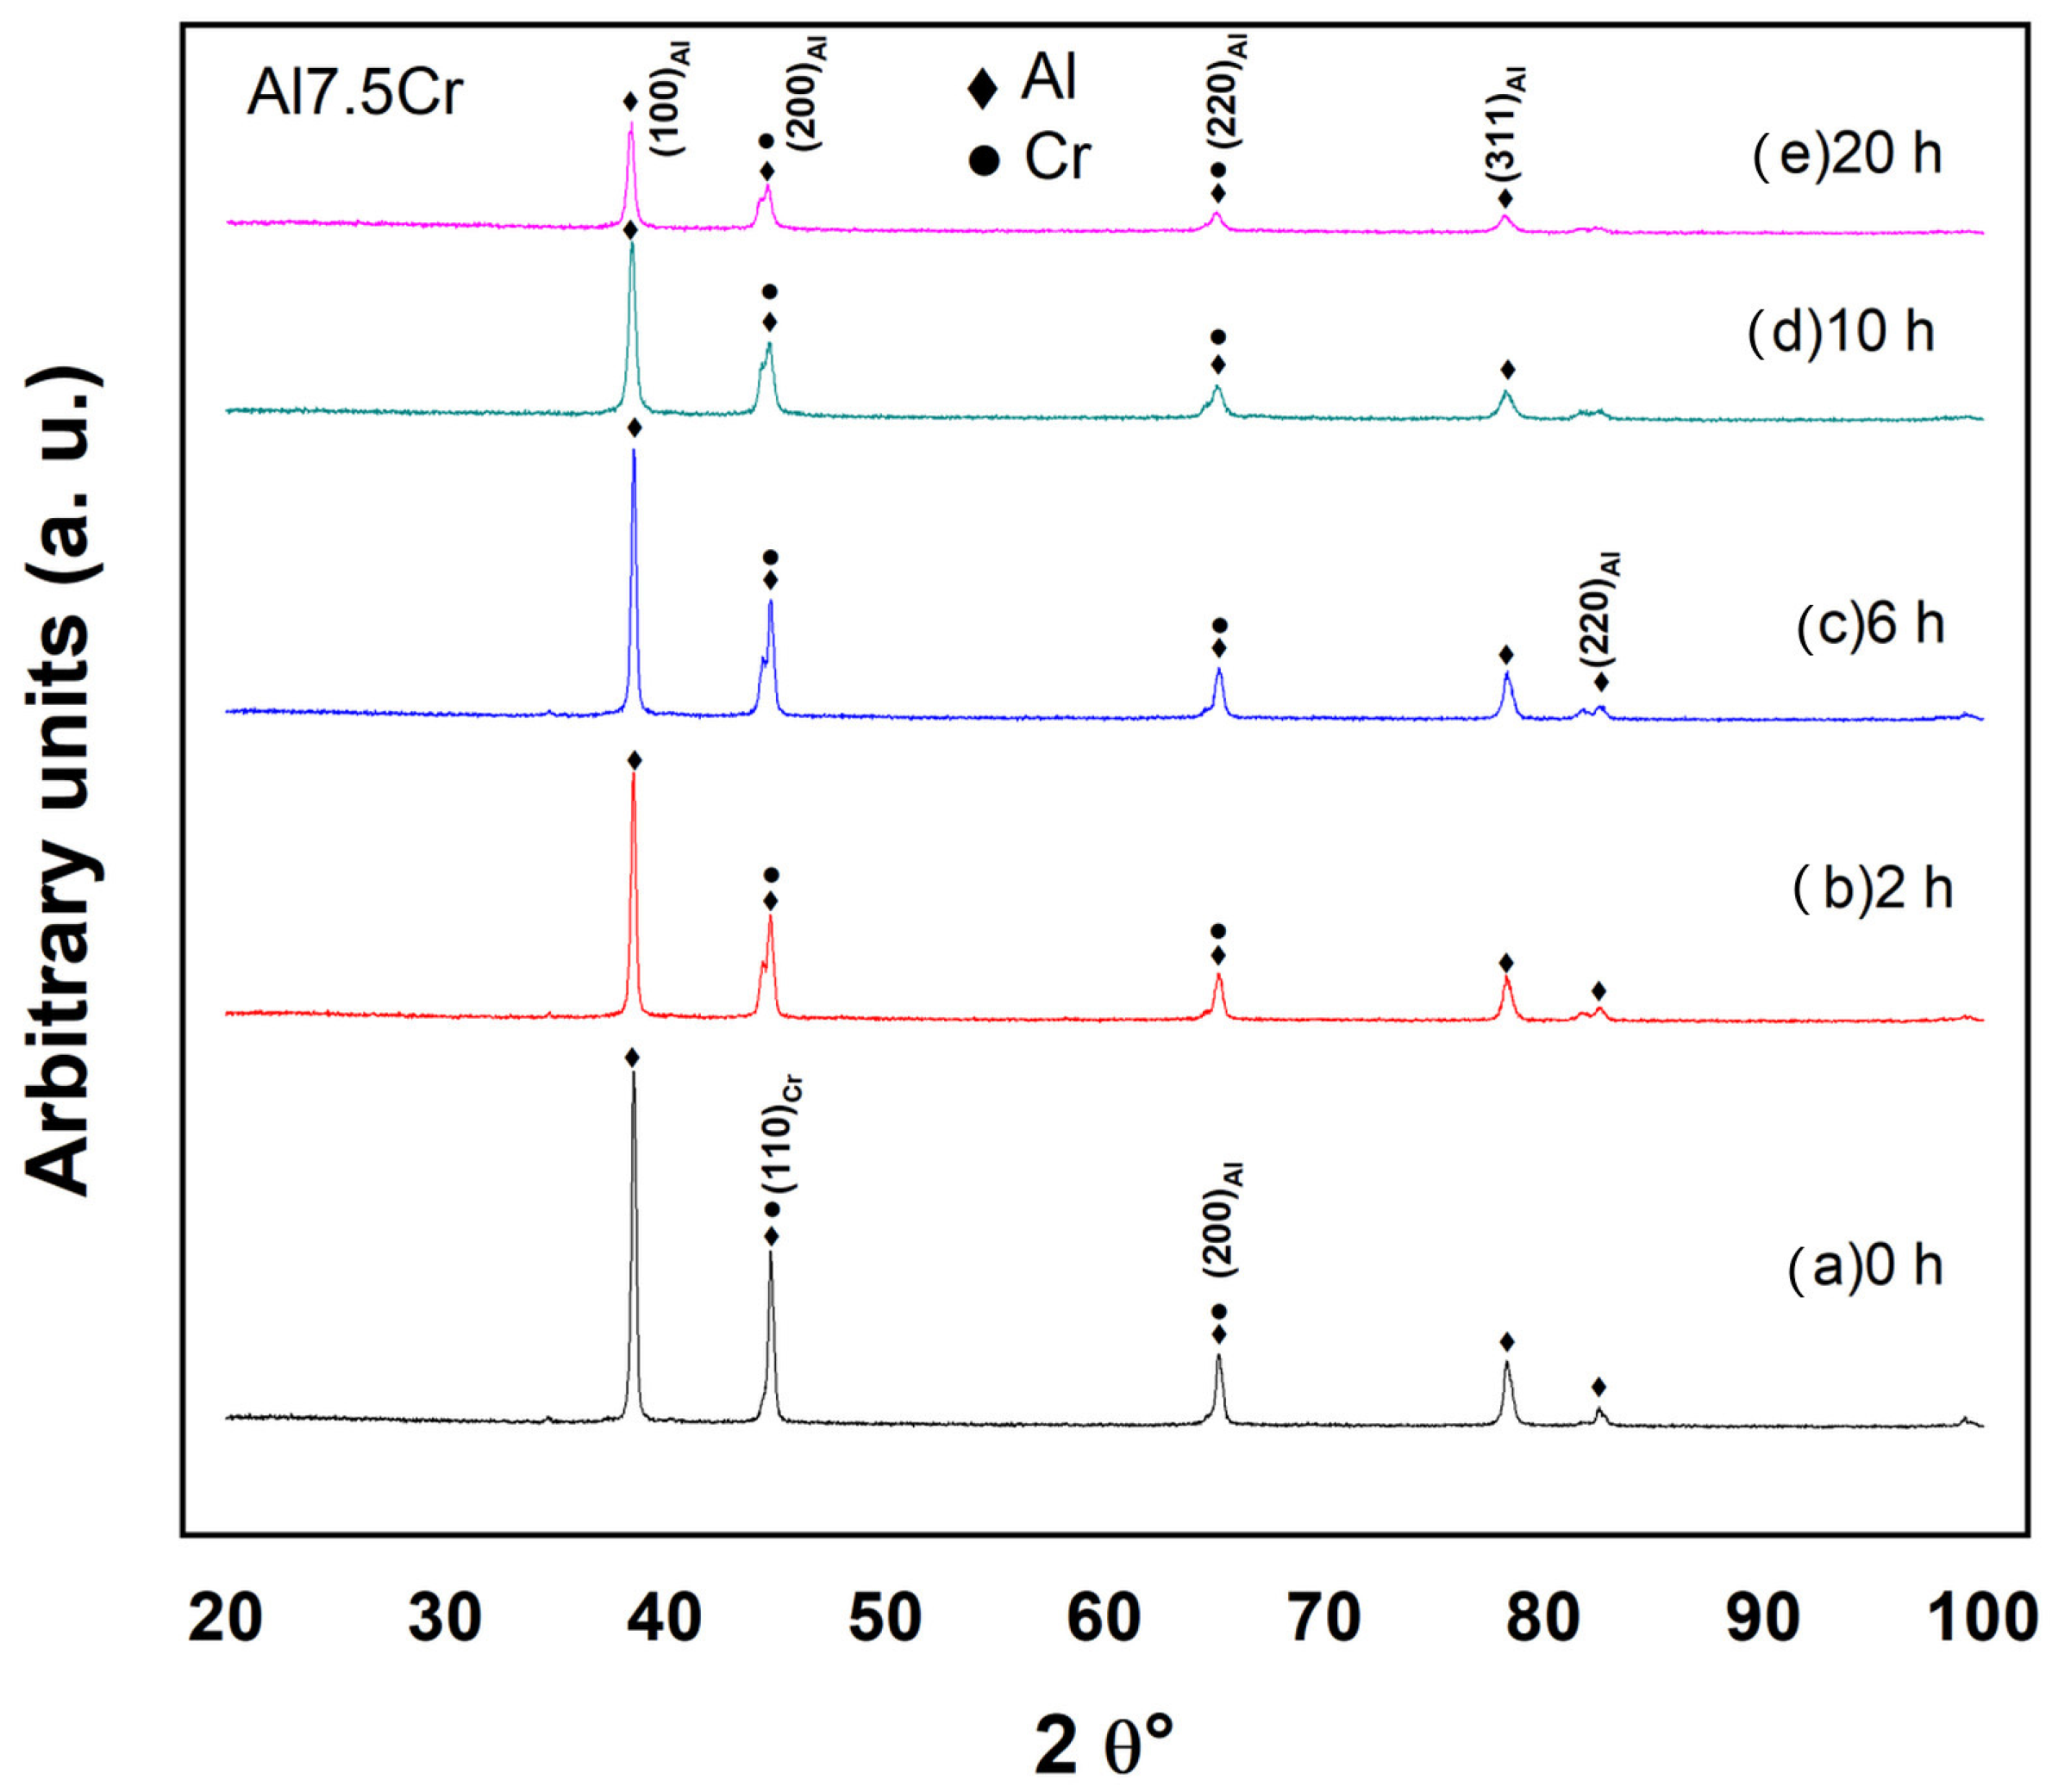
Figure 11 depicts the X-ray diffraction peaks of the processed powder composition Al-7.5Cr by ball milling during different intervals of time. These X-ray patterns, reveal the presence of Al phase with the following diffraction peaks: (111), (200), (220), (311), (222). Similarly, the X-ray diffraction profiles exhibit that the diffraction peaks produced by the diffraction on the (200) and (220) crystal planes of Al overlap with the diffraction peaks emitted by the (100) and (200) crystallographic planes of Cr. It is worth remarking that the ball milling process did not enable the production of second phases distinct from the Al-Cr components.
In addition,
Figure 11 indicates that when the milling time rose, the width of the diffraction peaks associated to Al at 50% its height increased. Peaks broadening is related to a decrease in crystallite size as well as lattice strain caused by mechanical deformation of the crystal structure induced by ball milling impacts.
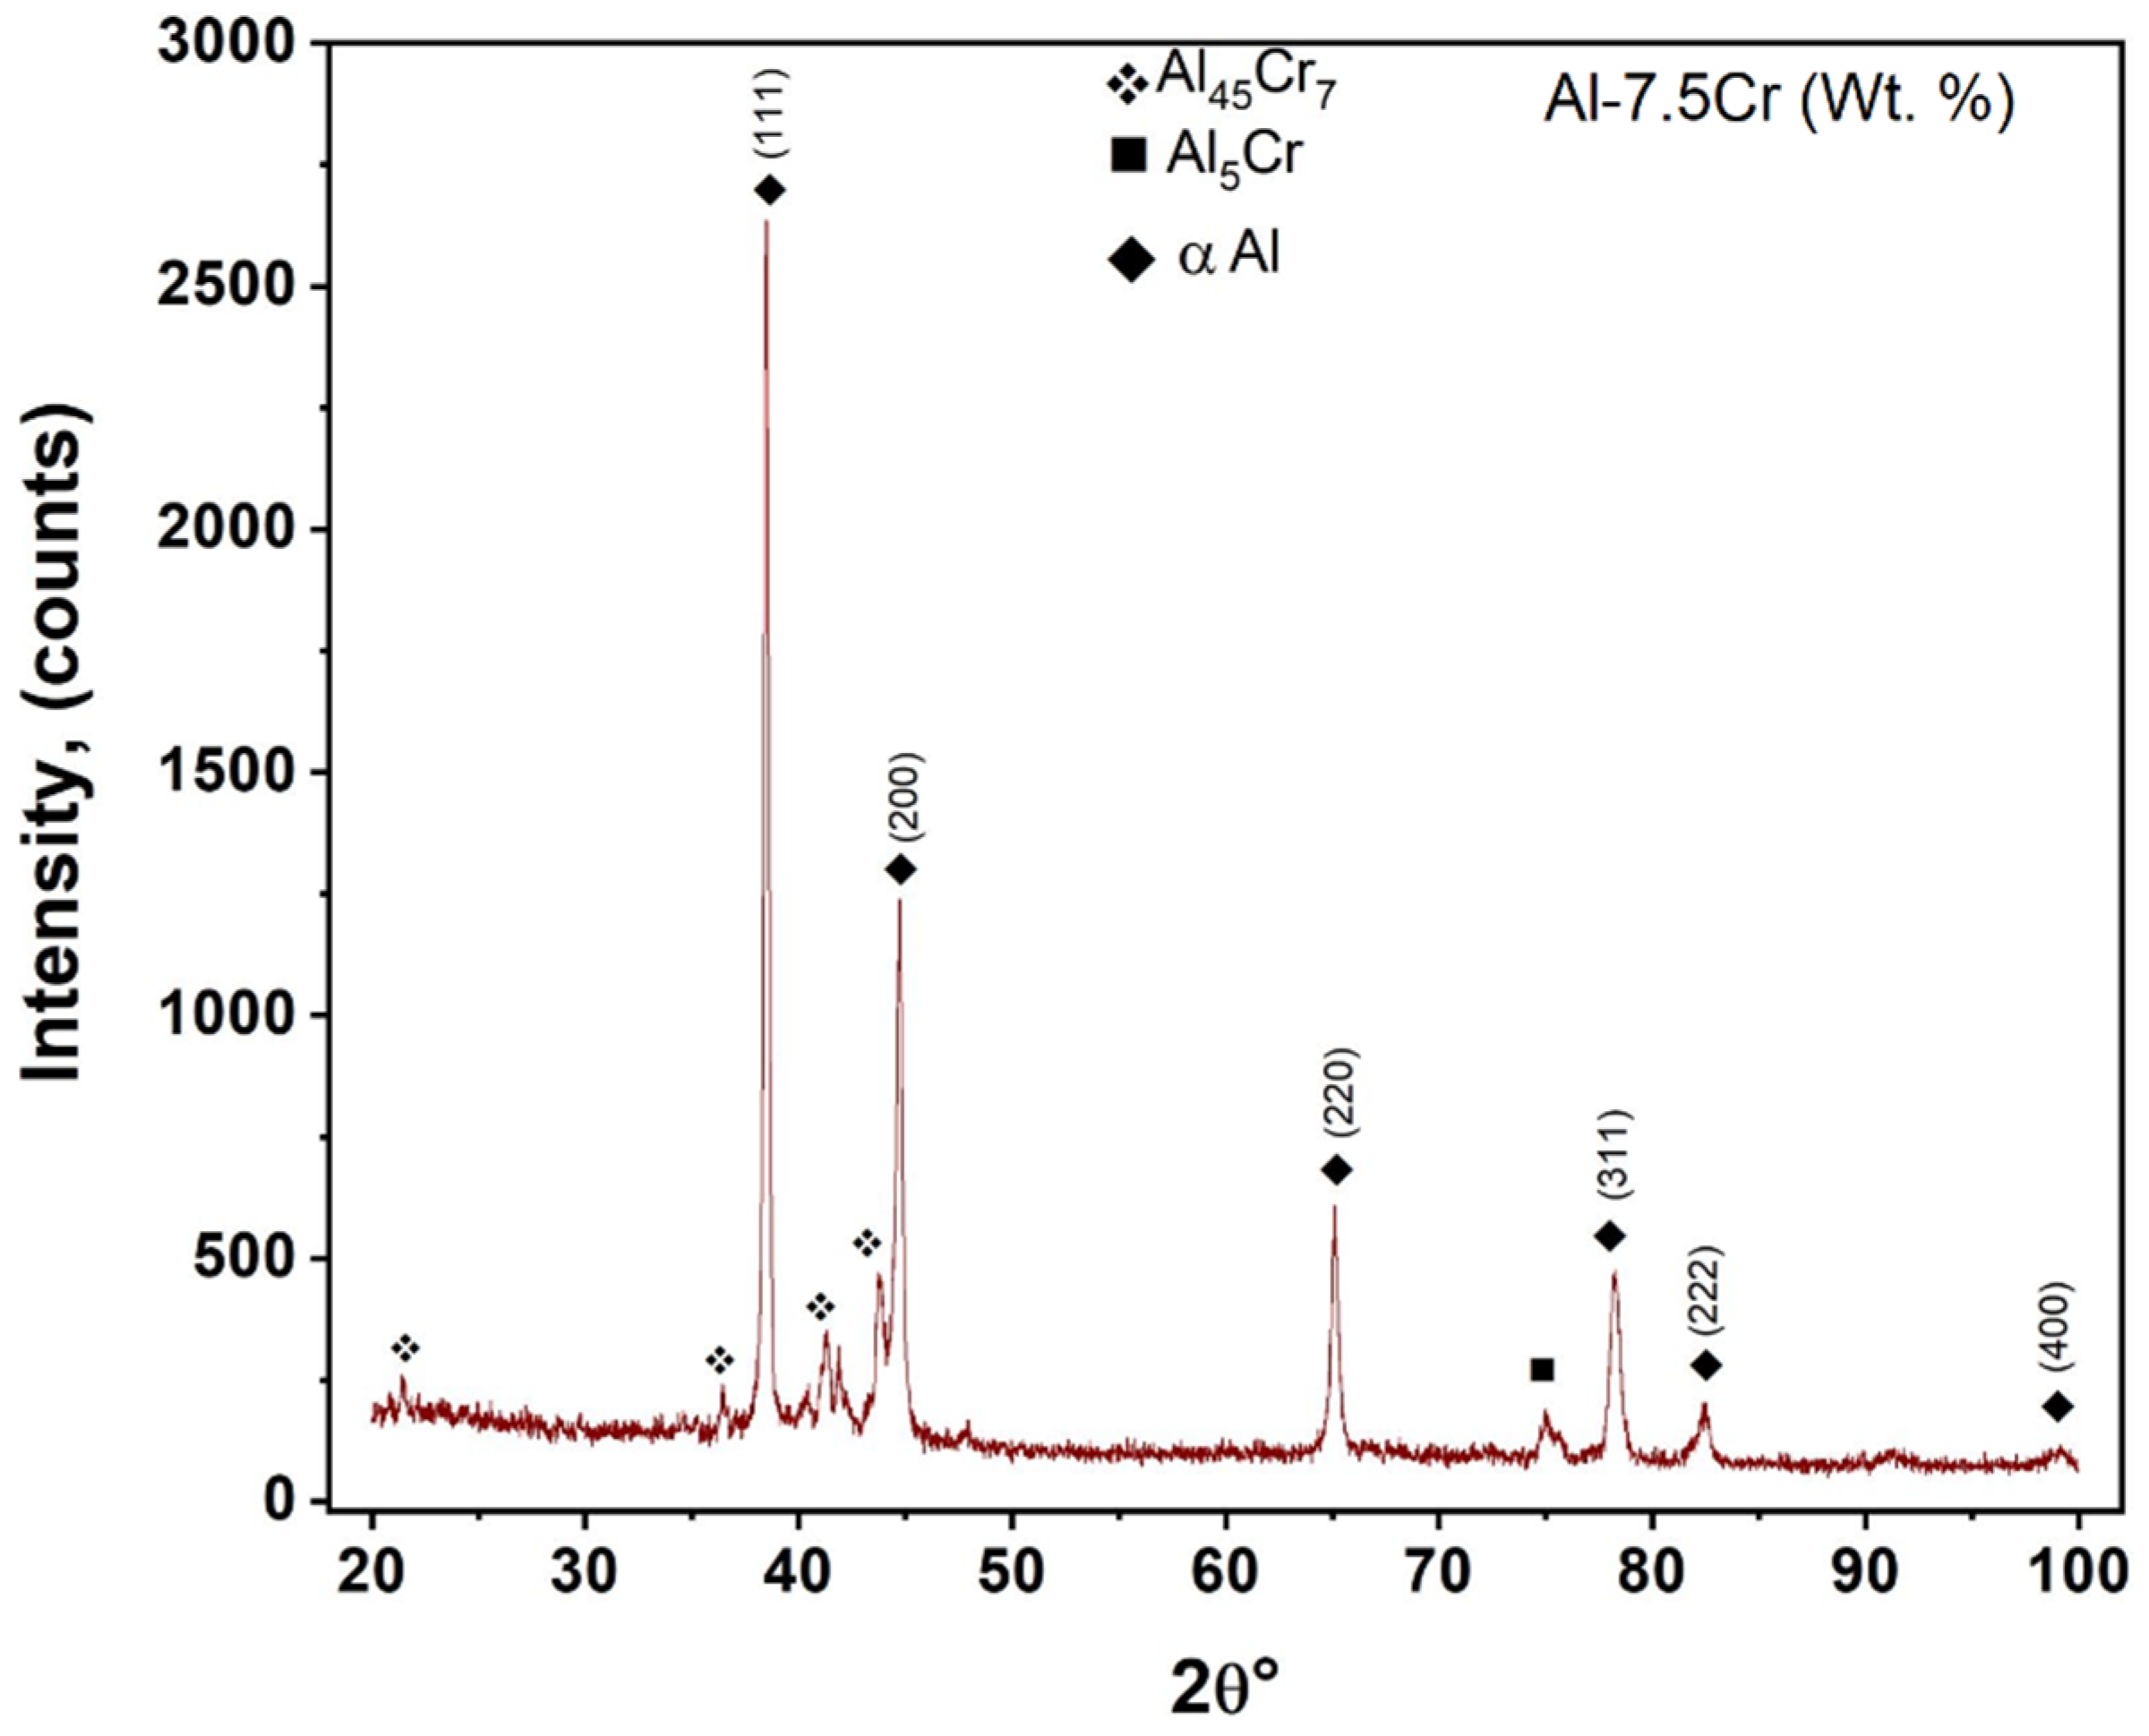
Figure 12 shows the XRD profiles corresponding to the sample Al7.5Cr after consolidation. These X-ray diffraction patterns reveal the existence of both Al and Cr phases. In addition, it can be affirmed that the sintering process gave place to the formation or precipitation of Al45Cr7 and Al5Cr compounds, where these second phases could have been formed by a combined effect of the mechanical activation process together to the thermic energy provided to sample during high vacuum sintering process.
3.3. Lattice Strain, Crystallite Size, and Dislocation Density
The nanometric grain sizes were employed to determine the dislocation density variation as a function of processing time. In a previous investigation [
27], a simple method as a first approximation was utilized to compute dislocation density. This method assumed that each crystallite had at least one dislocation, since, at quite small grain sizes, there may be lack of space to permit an array of more than 1–2 dislocations, which is hardly a pile-up, and there may also be insufficient space to maintain the core and hardened morphology.
In this sense, Equation (1) may be used to calculate dislocation density
(N):
In Equation (1), Lc is the crystallite size.
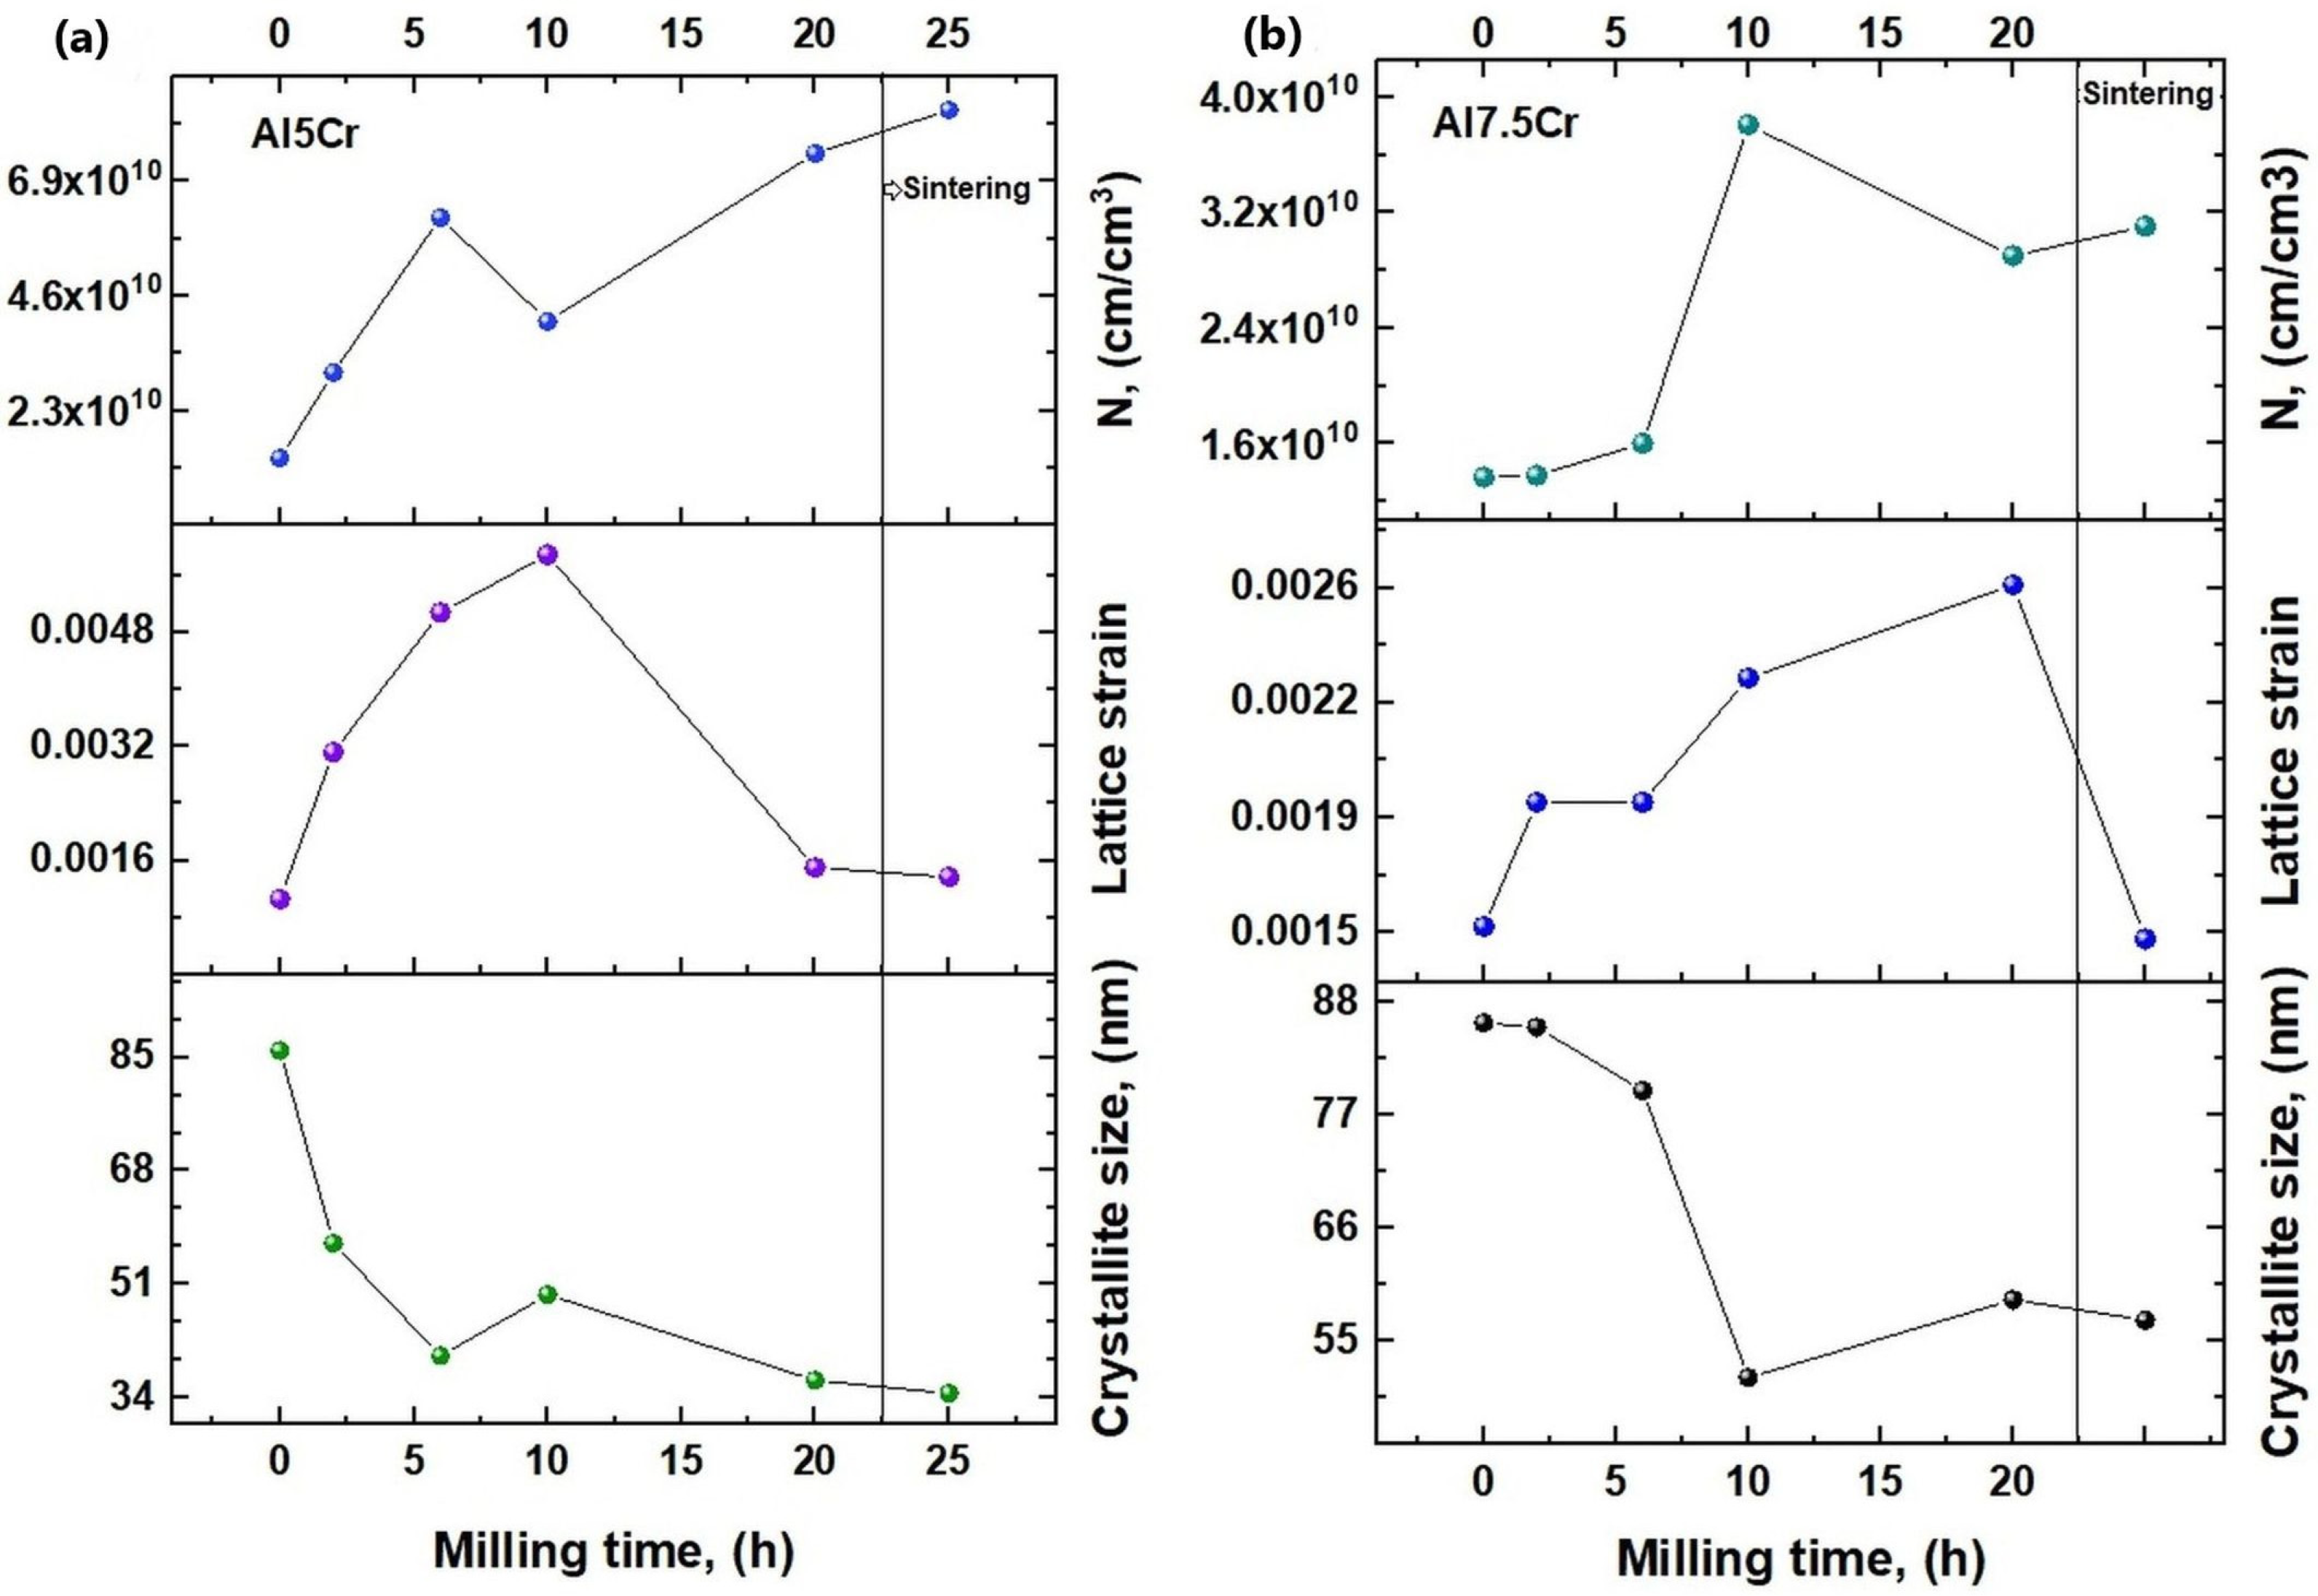
Figure 13a,b depicts how dislocation density (cm/cm
3) varies with processing time. This graph shows that dislocation density tends to grow from the start to the conclusion of ball milling processing periods both in the case of Al-5Cr and Al-7.5Cr alloys. This trend is justifiable since dislocations increment is generated by the plastic deformation mechanism induced by the repeated ball-powder-ball collisions that develop during milling.
Hence, the augmentation of dislocation density promotes particle hardening throughout the deformation process that happens during ball milling. This results in work hardening, which can often be considered as an advantage, from the point of view that the strength of solids can be controlled by the plastic deformation process. It has been known from the beginning of the formulation of the dislocation theory that work-hardening originates from the interaction of dislocations [
28,
29,
30].
However, in Al-5Cr alloy, the density of dislocations decreased from the sixth to the tenth hours of the ball milling operation, but subsequently rose again. In addition, in Al-7.5Cr alloy, dislocation density diminished from the 10th to 20th h of milling, but after increased again derive from the sintering treatment applied. This trend could be due to a recovery process of the previously deformed particles. This energy release phenomenon might have been caused by an increase in temperature as the mechanical alloying process progressed.
The stored energy of the material is released during the recovery stage by dislocations motion. There are two fundamental processes: dislocation annihilation and dislocation rearrangement to produce lower energy configurations. The glide, climb, and cross-slip of these linear crystal defects enable both processes [
31,
32,
33].
However,
Figure 13a,b shows that the dislocation density increased after the sintering process. This behavior indicates that there was no annihilation process of dislocations during the sintering treatment, instead a dislocation multiplication mechanism could have been developed. In this case, there is a very low probability that a homogeneous nucleation of dislocations could have occured [
34].
Instead, is more reasonable that a dislocation generation at local regions of stress concentration was developed because of the thermal energy provided during sintering process. The following paragraph exemplifies this dislocation multiplication mechanism. Mitchell [
35] added spherical glass inclusions into a crystal of AgCl which was subsequently given a thermal treatment to decrease the dislocation density to a minimum value. The crystal was held at 370 °C to homogenize the temperature and eliminate any internal strains associated with the impurity particles, afterward, it was chilled to room temperature. The results of the structural characterization of this research revealed that a system of prismatic dislocation loops was generated in a recrystallized, dislocation-free crystal AgCl to relax the strain field in the vicinity of the small glass sphere originated by differential contraction which occurs during cooling.
Figure 13a,b shows how the size of nanometric grains changes as a result of ball milling time. These graphs illustrate that as the milling process advances, the crystallite size has a significant tendency to decrease in a parallel way. The crystallite size and lattice strain were determined using the Williamson-Hall method [
36,
37,
38]. The mean value of nanosized grains was computed after obtaining the breadth of diffraction peaks at half their height sizes.
Figure 13a shows a considerable decrease in nanosized grains from about 85 to 35 nm when the powder blend was processed during 0 to 20 h, respectively. However, after sintering, crystallite size slightly diminished, this behavior can be due the nucleation and growth of new grains in the highly deformed Al matrix.
Moreover,
Figure 13b shows that when the milling period increased from 0 to 20 h, the lattice strain increased by approximately 0.0016 to 0.0027. Lattice strain is related to the deformation of reticular parameters caused by crystal defects or imperfections, such as lattice dislocations. The continuous rise in lattice strain can be attributed to the transfer of mechanical energy provided by the milling balls’ repeated impacts on the metallic powders. As a result, the derived energy storage takes the form of crystallographic imperfections in the milled elements [
39]. Strain formation is facilitated by the grain boundary triple junction, stacking faults, sinter stresses, coherency stresses, and other crystal defects [
37]. Dislocation distribution is investigated using X-ray line broadening.
In addition,
Figure 13a,b indicates that the lattice strain was decreased after the recrystallization process. This behavior could be ascribed to the thermal removal of crystalline punctual defects induced by the thermal energy provided during the heat treatment. However, the dislocation multiplication process could be associated by the generation of dislocations at local regions of stress concentration particles promoted by thermal energy provided during the sintering process.
3.4. Microstructural Analysis by SEM of the Consolidated Samples
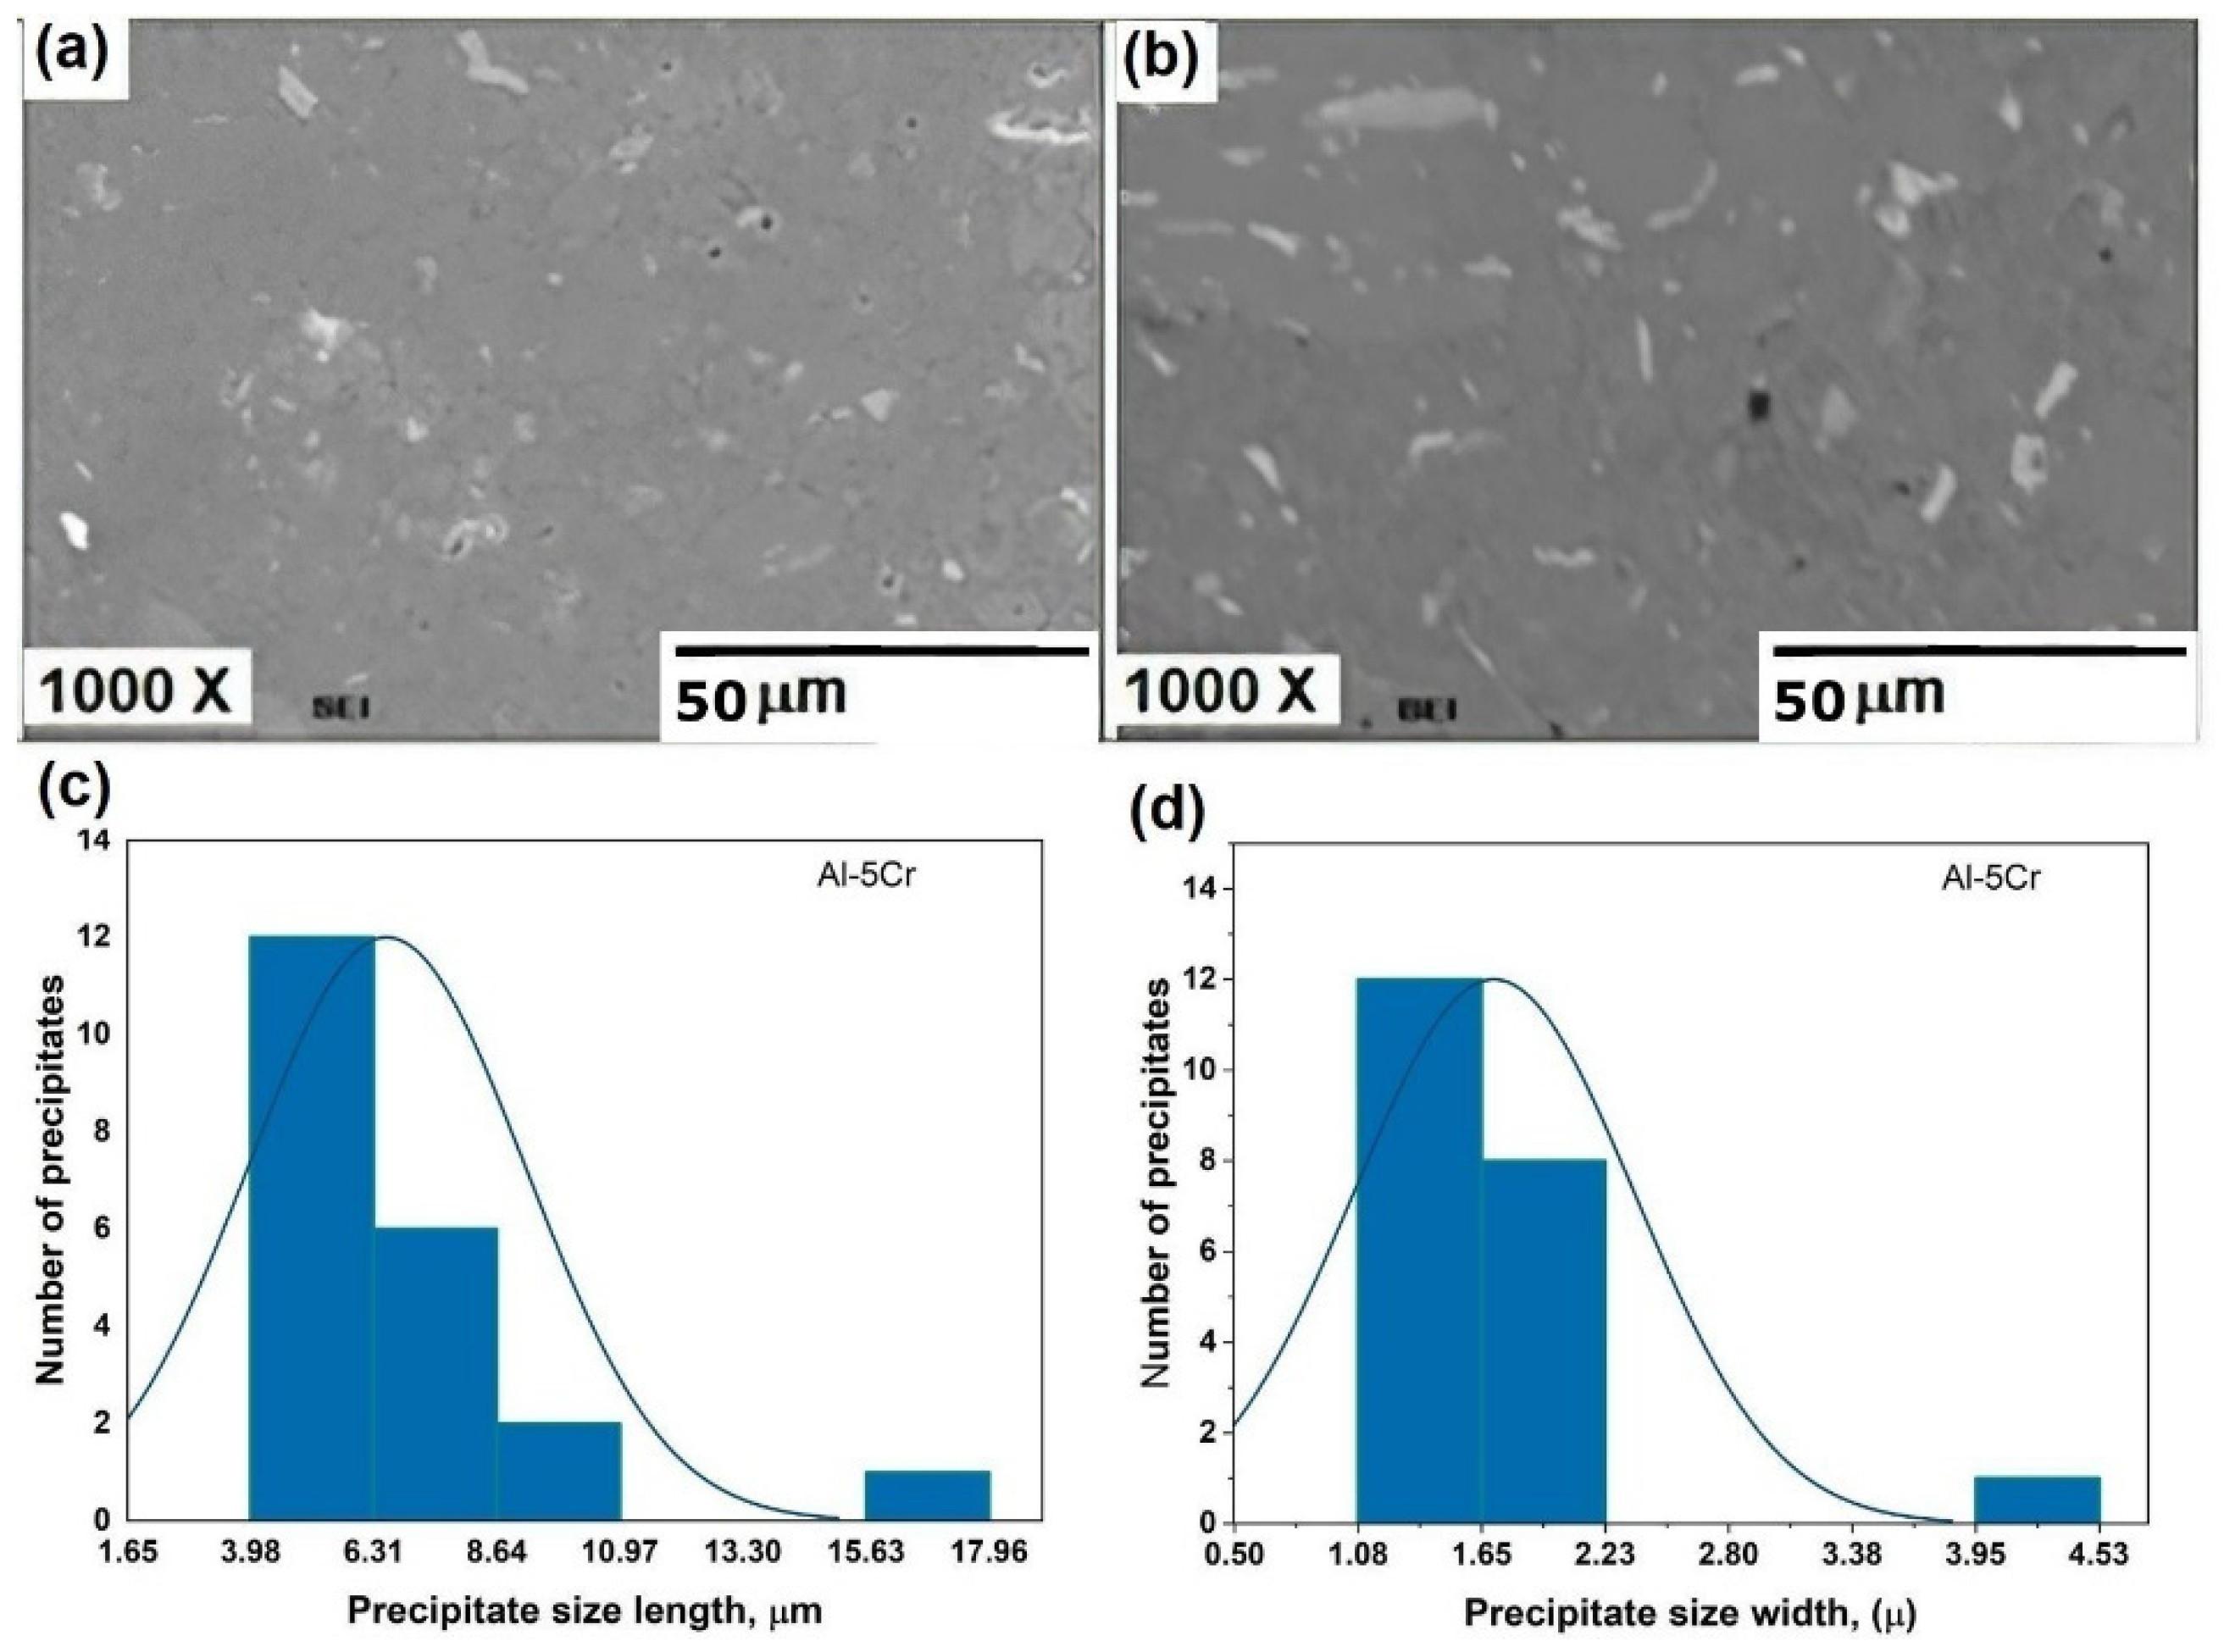
Figure 14a,b exhibits the electron micrographs corresponding to the sintered specimen Al-5Cr. In this case,
Figure 14a was obtained by secondary electron image mode and
Figure 14b was attained by backscattered electron image mode. These micrographs display bright precipitates with a flake morphology uniformly dispersed in Al matrix. As shown in the Al-Cr binary alloy phase diagram, these compounds appear as a result of Cr’s very low solid solubility in Al.
Figure 14c,d exhibits the precipitate size distributions considering its length and width. Derived from these histograms, the mean of precipitate width is 1.7 μm and the mean of precipitate length is 6.5 μm.
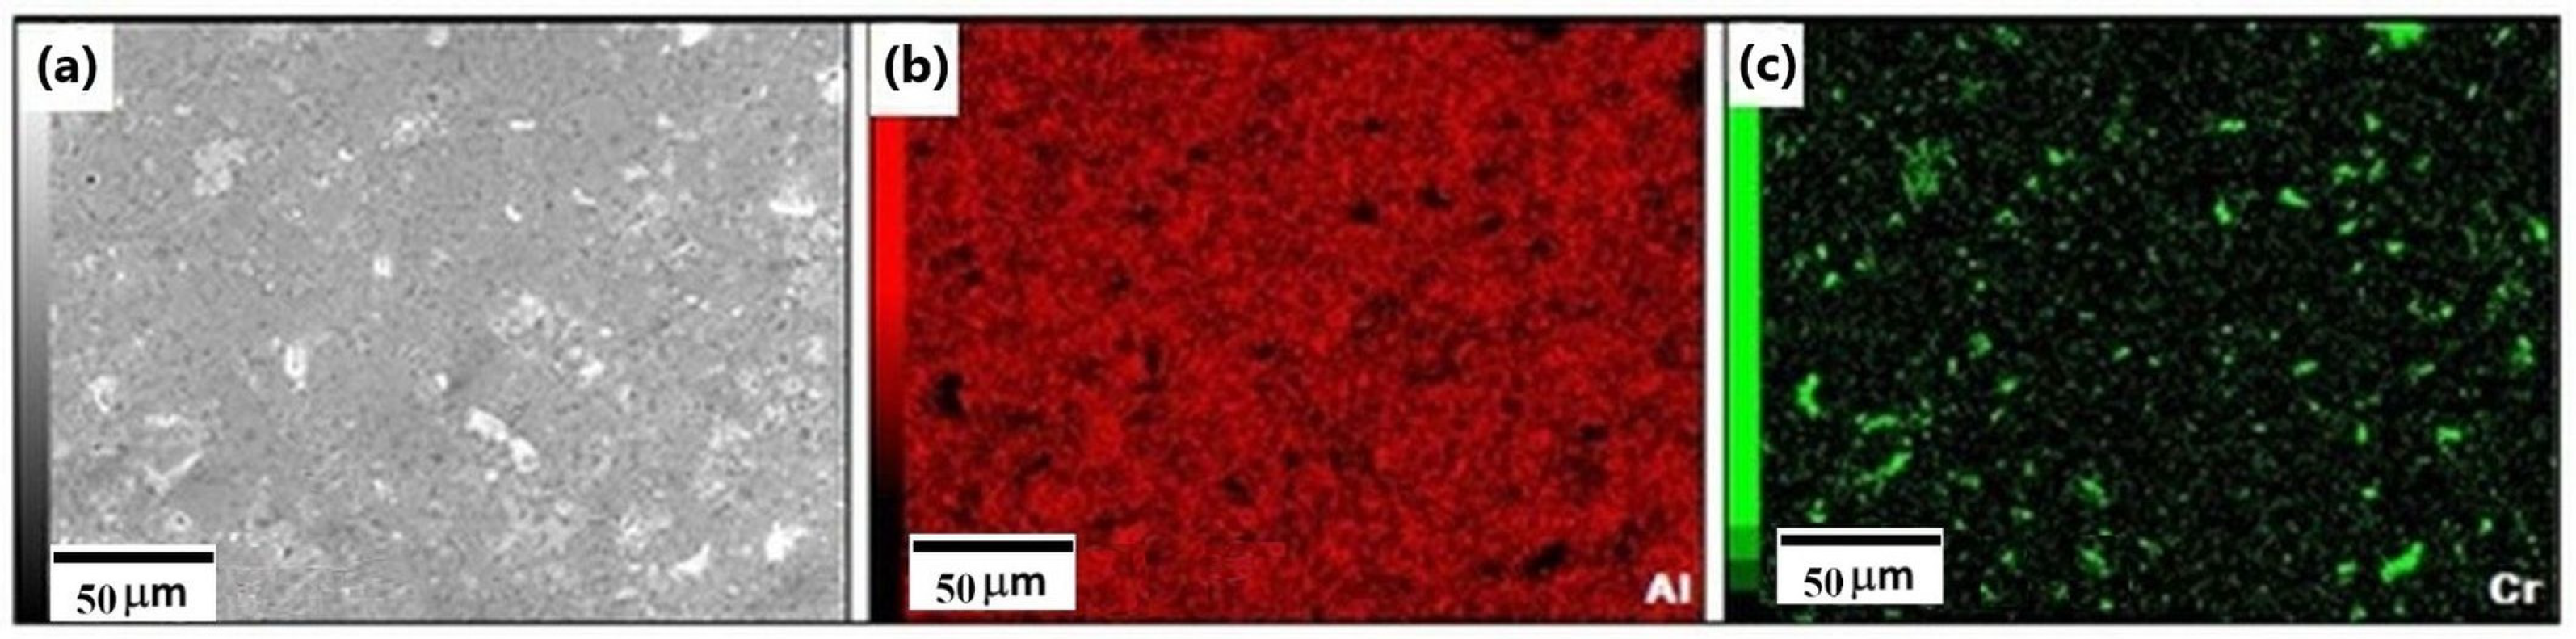
Figure 15a shows the studied surface of Al-5Cr consolidated piece, the X-ray mappings of Al and Cr corresponding to this area, as demonstrated in the subsections (b) and (c) of this figure in a respective way. Element’s mappings denote a homogeneous distribution of both Al, and Cr among the whole surface analyzed.
Figure 15c shows X-ray signals emitted from Cr element. These signals are grouped to form small “clusters”, this behavior is associated with the formation of Cr-rich precipitates in these small regions. In addition, part (b) of the same illustration indicate that Al is uniformly dispersed in the whole analyzed surface, it is worth noting that black holes can be seen spread throughout the Al matrix; it is essential to point out that these holes are accompanied by a Cr-rich precipitate.
The punctual chemical analyses performed on the bright precipitates revealed an approximate composition of 65 at. % Cr and 35 at. % Al. Based on the system’s binary alloy phase diagram Al-Cr, this composition corresponds to the Cr2Al phase which possesses a pearson symbol tl6 with a prototype phase of the kind MoSi2.
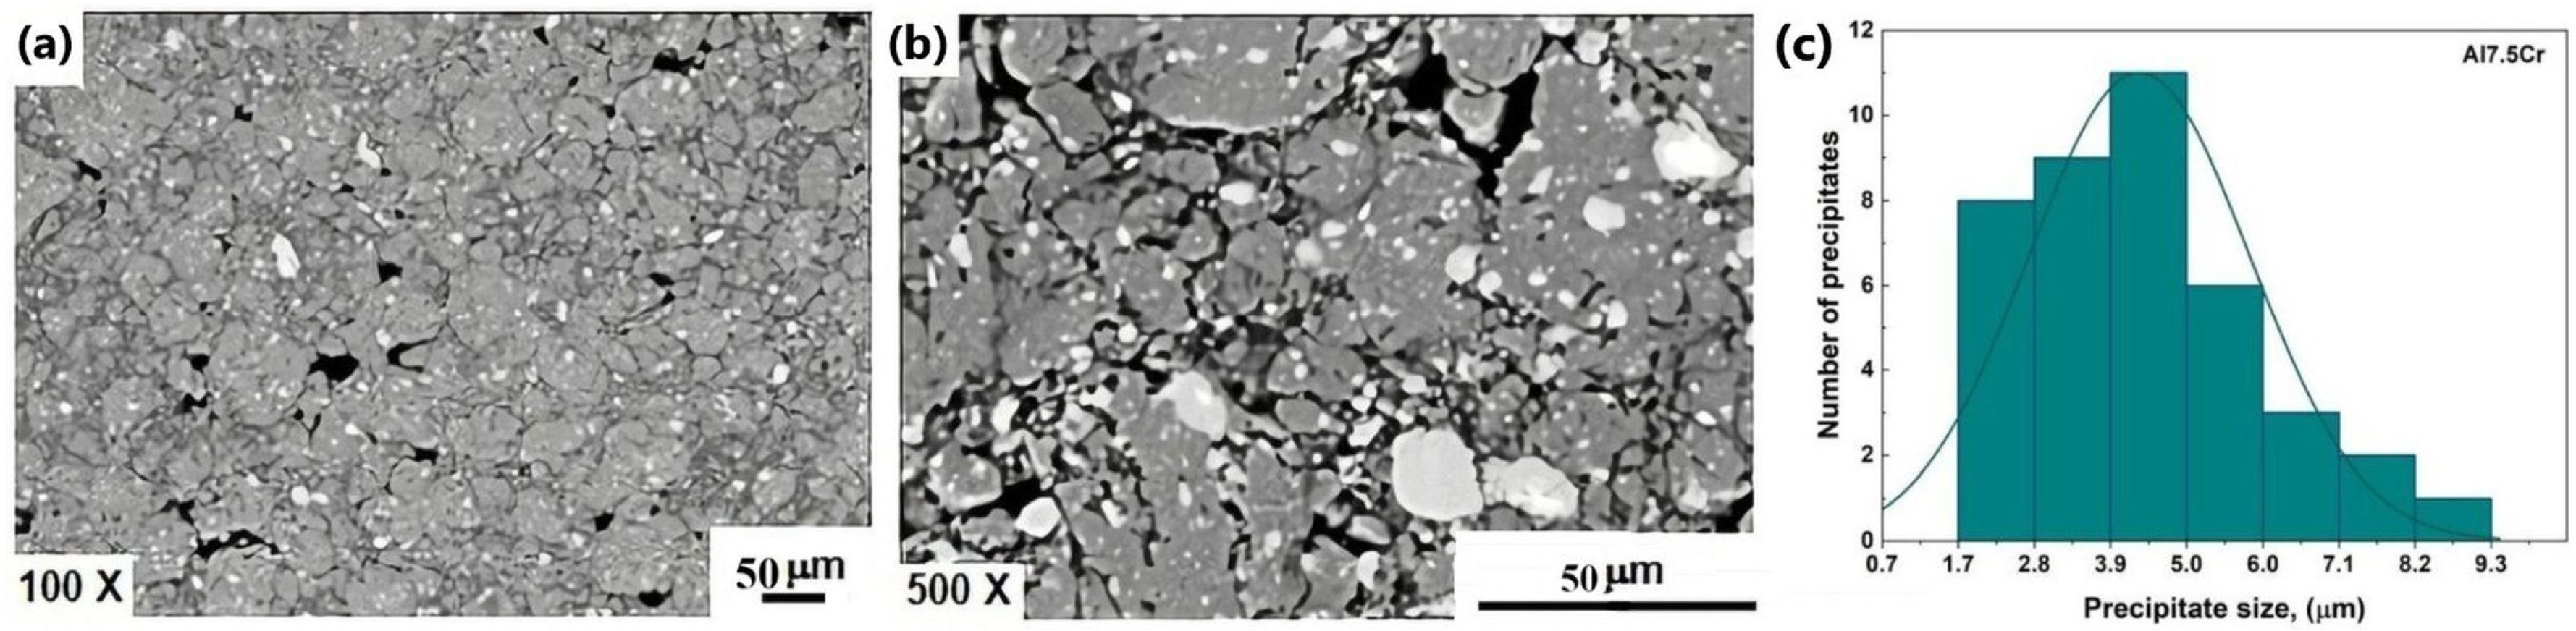
Figure 16a,b exhibits the SEM micrographs corresponding to the sintered exemplar Al-7.5Cr. In this case,
Figure 16a was obtained by secondary electron image mode and
Figure 16b was attained by backscattered electron image mode. These micrographs display bright precipitates with an irregular morphology with round borders uniformly distributed in Al matrix. However, the volume fraction of porosity increased considerably. The precipitation of these compounds is consistent with the binary alloy Al-Cr phase diagram, since Cr exhibits a low solubility in Al. Moreover,
Figure 16c displays the precipitate size distribution of AlxCry precipitates on the Al matrix, where is observed that most of the precipitates have sizes within the interval from 3.9 to 6 µm, with a mean size of 4.3 μm.
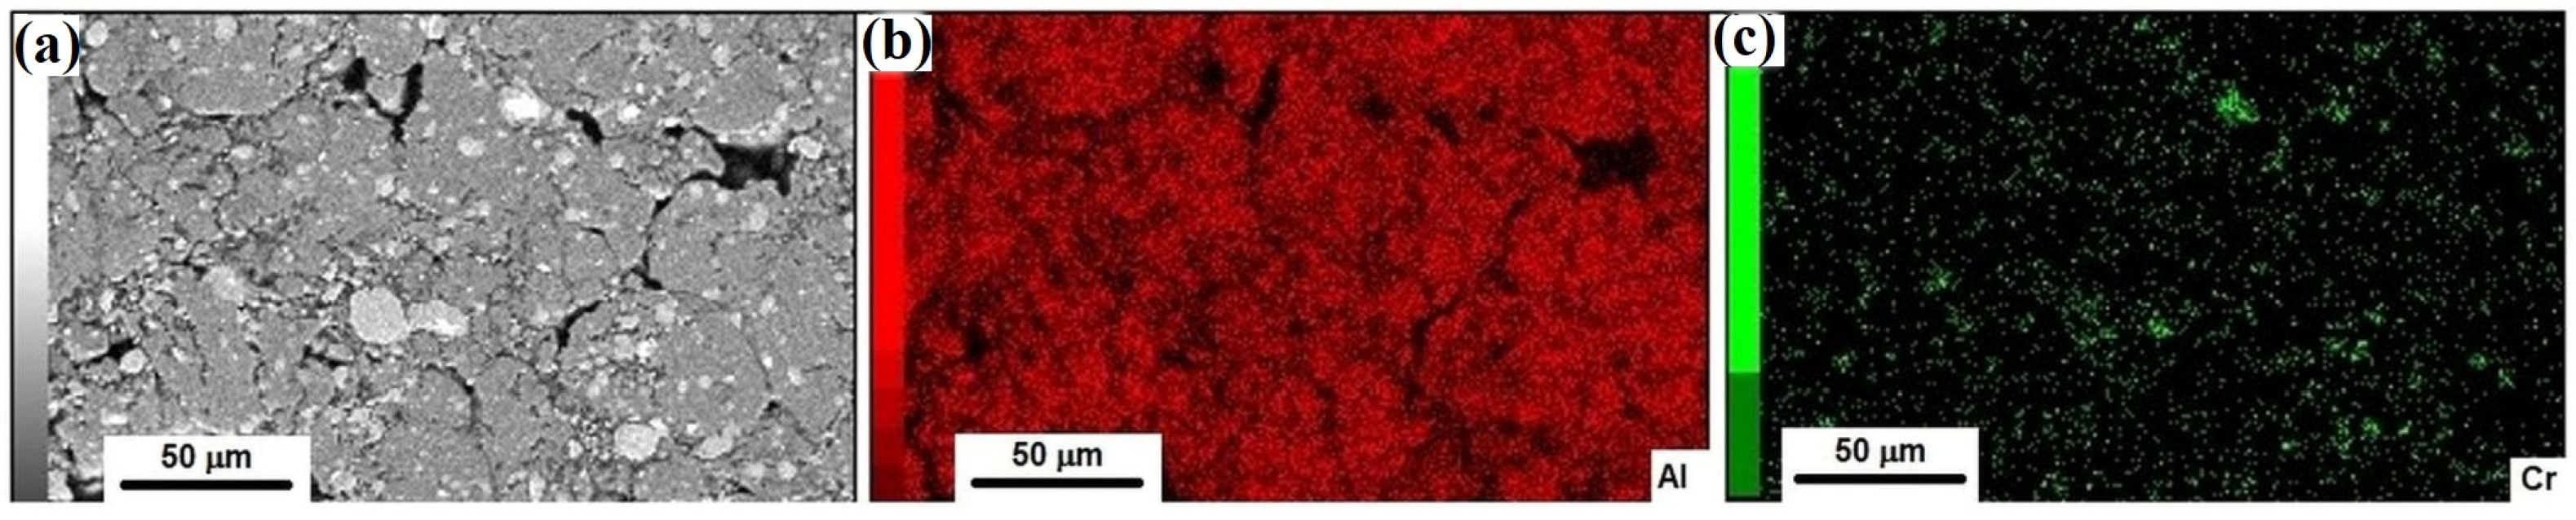
Figure 17a presents the analyzed surface of Al-7.5Cr consolidated specimen, the X-ray mappings of Al and Cr corresponding to this area, are shown in (b) and (c) of this figure, respectively. The elements’ mappings prove a homogeneous dispersion of both Al and Cr among the whole surface analyzed.
Figure 17c shows X-ray signals emitted from Cr element. These signals are grouped to form small “clusters”, this behavior is associated with the formation of Cr-rich precipitates in these small regions. In addition, subsection (b) of
Figure 17 exhibits that Al is uniformly distributed in the total analyzed surface, it is important to note that dark holes are observed also dispersed in Aluminum, it is essential to denote that in the places where these holes are detected, there is a precipitate rich in Cr.
The punctual EDS chemical analyses carried out on the bright precipitates indicate an approximate composition of 91.5 at. % Cr and 8.5 at. % Al. In conformity with the system’s binary alloy phase diagram, Al-Cr, this composition coincides with a supersaturated (Cr) phase which possesses a Pearson symbol cl2, space group Im3m, with a prototype phase of the kind W.
Table 1 shows microstructural features of Al based alloys, where the area fraction of Al5Cr is higher than that of Al7.5Cr. This finding is congruent, since a mayor volume fraction of precipitates is observed in the alloy with higher Cr content. Complementary, the area fraction of precipitates dispersed in Al matrix of Al5Cr resulted minor than that of Al7.5Cr alloy. In addition, the area fraction of pores resulted higher for Al7.5Cr alloy as compared with the minor Cr content alloy, this behavior could be related with the fact that a higher content of precipitates hinders the sintering process.
4. Theoretical Modelling of Mechanical Behavior
This section presents a theoretical model of the behavior of the most important mechanical characteristics. Properties like yield strength and hardness, for instance were expressed as functions of volume fraction of porosity. The hardness values for pure Al in this model were gathered from literature and ranged from 15 to 20 H
v, and they were utilized when performing the modeling procedure [
40,
41,
42].
Similarly, pure aluminum yield strength values obtained from literature research ranged from 30 to 40 MPa [
43,
44,
45]. And these values were used for the modeling process. In this model, it was assumed that the yield strength and hardness values of pure aluminum were assigned to the Al5Cr and Al7.5Cr alloys. Various yield strength and hardness values were taken for pure Al (which were assigned to the Al-Cr alloys studied here), and from those data, intermediate values were selected.
The following equation was used to describe hardness as a function of porosity volume fraction:
where
H is the hardness of the sintered material, H
0 is the hardness of the material without porosity (i.e., the theoretical or maximum hardness), f
v is the volume fraction of porosity in the material, and (1 − f
v) is the relative density factor of the sintered material [
46,
47,
48].
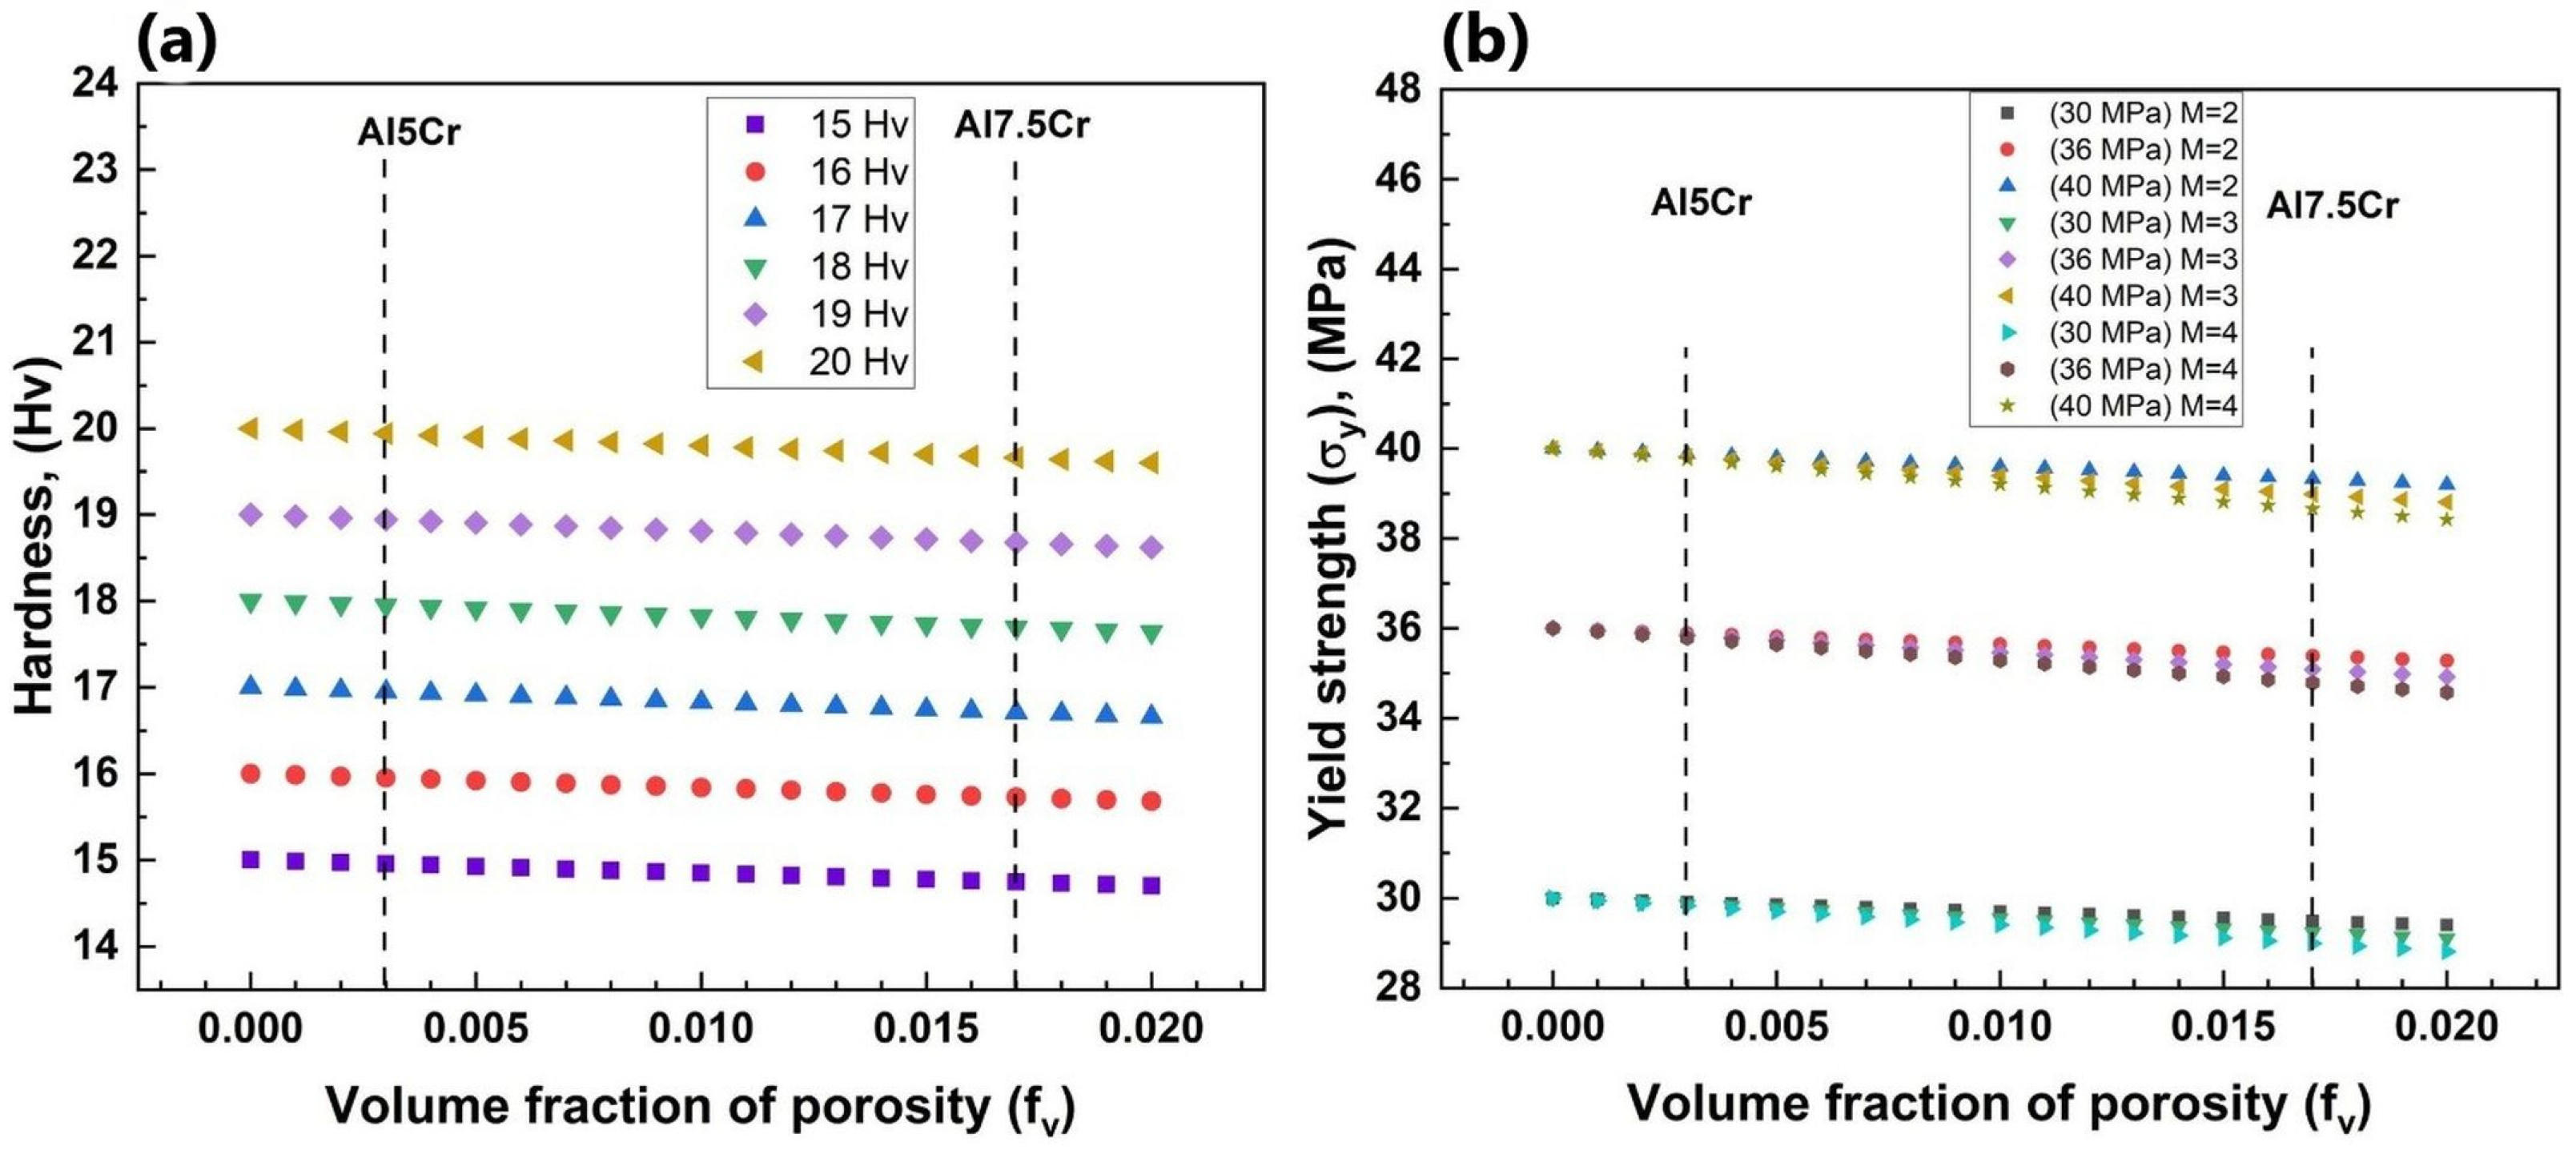
The volume fraction porosity values of sintered Al5Cr and Al7.5Cr in this work were 0.003 and 0.017, respectively. The hardness of Al5Cr, determined from Equation (2), ranged from 14.9 to 19.9 H
v (as mentioned above, with hardness values of pure Al ranging from 15 to 20 Hv). And the hardness values of the Al7.5Cr specimens (computed from Equation (2)) fluctuated from 14.7 to 19.66 H
v. (see
Figure 18a). Hardness as a function of volume fraction of porosity was calculated for both Al5Cr and Al7.5Cr samples using pure Al’s starting hardness.
To predict the yield strength values, the Gibson and Ashby model for porous materials was applied. The mathematical expression for this model is displayed in Equation (3).
where
σy is the yield strength of the material,
σo is the strength of the material without pores,
fv is the volumetric porosity fraction, and
m is the strength exponent, which depends on the geometry and distribution of pores in the material. In general, typical values of
m for sintered materials are in the range of 2 to 4 [
46,
47,
48,
49].
Results derived from modeling σ
y values from Equation (3) considering the starting yield strength values of 30, 36 and 40 MPa are presented in
Figure 18b and
Table 2. In this sense,
σy values were estimated using Equation (3) (with m = 2, 3, and 4).
For an Al5Cr specimen with a porosity of 0.003, the m exponent of Equation (3) had no significant effect on σy values. In this regard, the values of σy for this specimen were 39.7, 35.8, and 29.8 MPa, compared to pure Al starting values of 40, 36, and 30 MPa, respectively. On the other hand, Al7.5Cr yield strength values (with a volume fraction of porosity = 0.017) were sensitive to the m exponent in Equation (3). When σy of pure Al was established to 40 MPa, modeling yielded values of 39.7, 35.8, and 29.8 MPa for m = 2, 3, and 4, respectively.
Precipitation of Cr
2Al on Al5Cr “matrix” and Cr(Al) on Al7.5Cr “matrix” occurred during sintering treatment; for example, Al and Cr
2Al phases together can be considered a composite material. Thus, to compute hardness or yield strength values, the rule of mixtures can be applied and can be represented in Equation (4).
where
pc is the property of compound;
p1,
p2,
... pn are the properties of each of the constituents of composite material, and
f1,
f2,
... fn are the volume fractions of each of the components [
50].
For the modeling process, the following values of hardness and yield strength for Cr
2Al and Cr(Al) phases acting as “reinforcement” phases were employed: For Cr
2Al, a hardness of 600 H
v and σ
y of 600 MPa, and for Cr(Al), a hardness of 250 H
v and σ
y of 200 MPa [
51,
52,
53,
54,
55,
56].
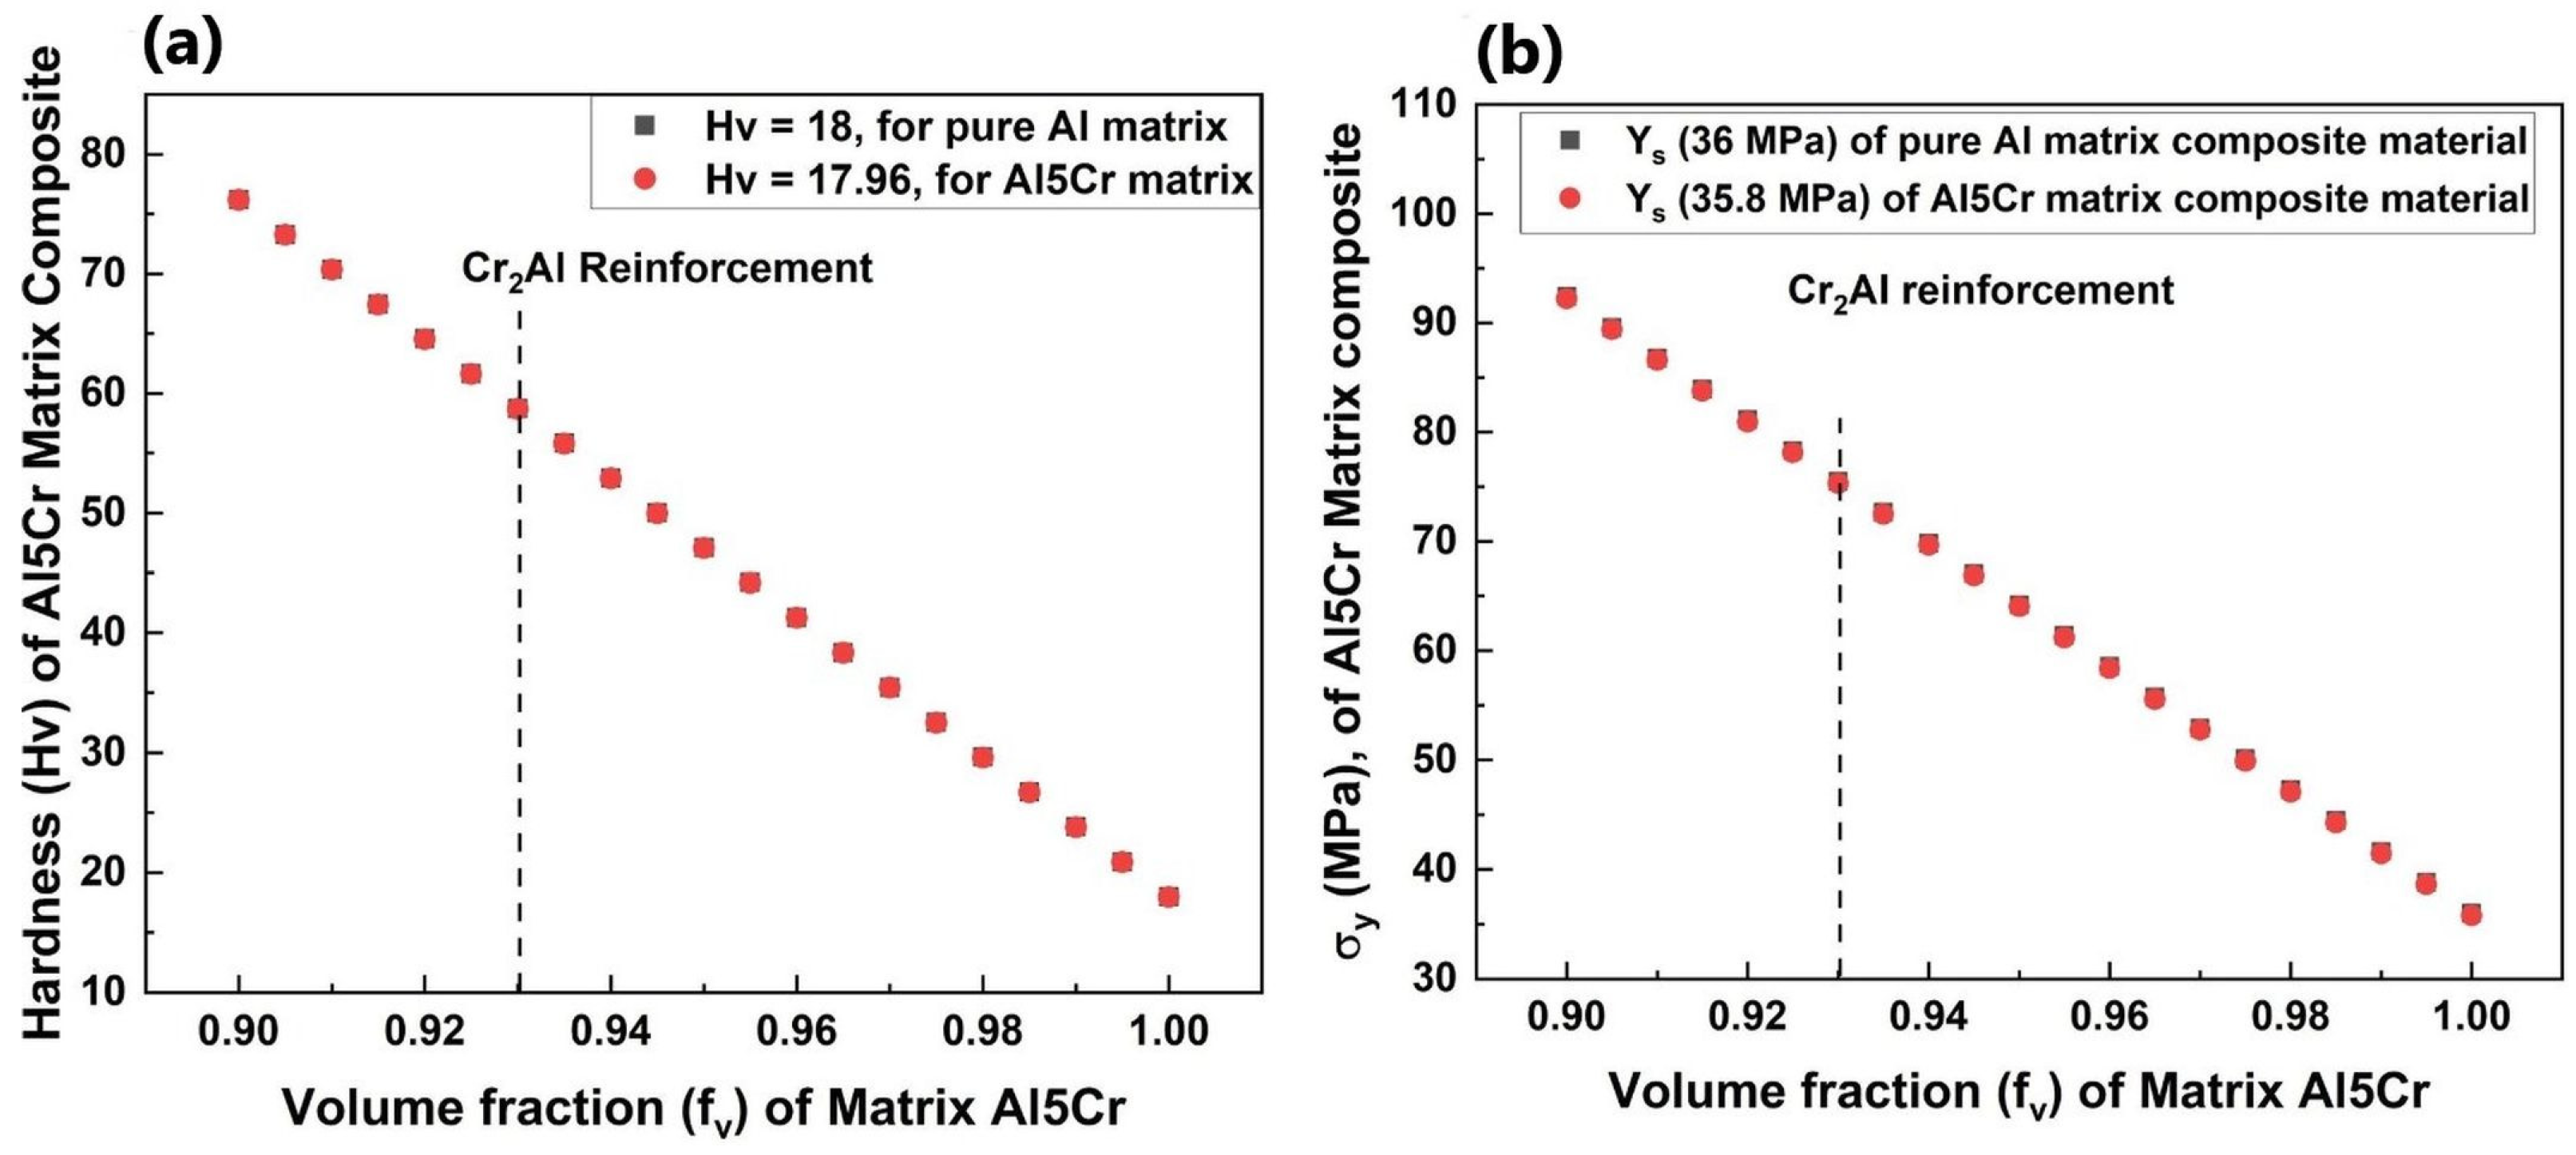
Hardness and yield strength oh Al5Cr composite were computed from Equation (4). In this case, starting hardness of Al5Cr “matrix” was 17.96 H
v (see
Figure 19a), and considering a volume fraction of Cr
2Al of 0.068, the resulting hardness was equal to 58.6 H
v.
Also, initial yield strength of Al5Cr “matrix” was 35.8 MPa (see
Figure 19), and considering a volume fraction of Cr
2Al of 0.068, the modeled σ
y was 75.39 MPa.
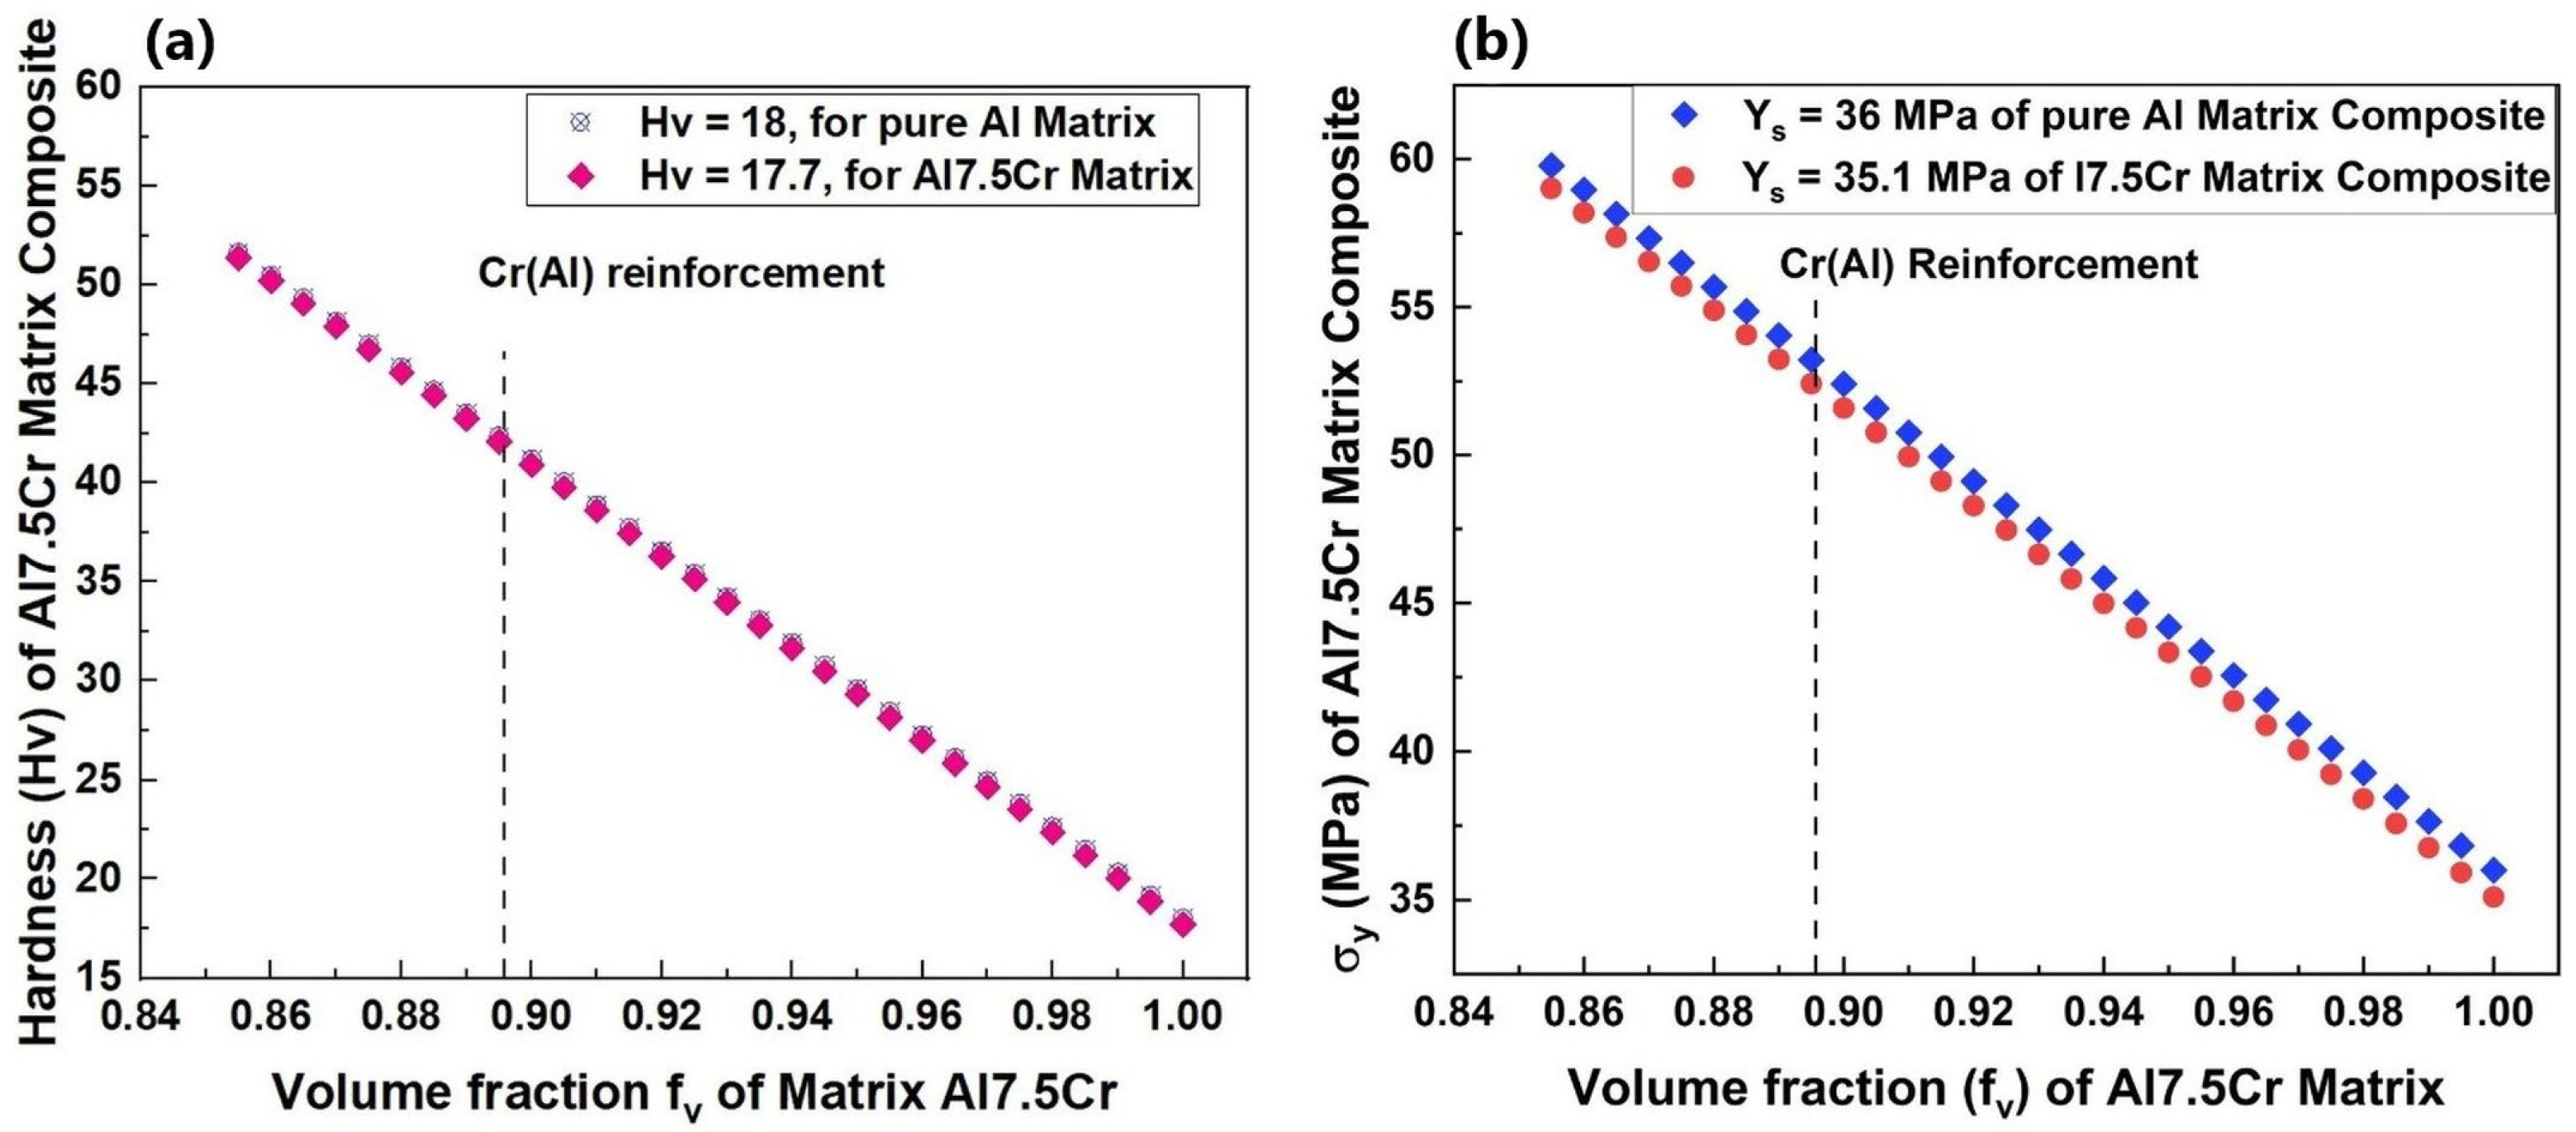
Hardness and yield strength of Al7.5Cr composites were calculated from Equation (4). In this case, the starting hardness of the Al7.5Cr “matrix” was 17.7 H
v (see
Figure 20a), and considering a volume fraction of Cr(Al) precipitates of 0.1, the resulting hardness was equal to 42.2 H
v.
Also, the initial yield strength of the Al7.5Cr “matrix” was 35.8 H
v (see
Figure 20b), and considering a volume fraction of Cr(Al) of 0.1, the modeled σ
y was 52.4 MPa.
5. Conclusions
There was no evidence of second-phase development throughout the milling process, as confirmed by the X-ray diffraction evaluation. This could be because the milling process was developed under low energy conditions, which means that there was not enough provision of mechanical energy to the mixture of powders to induce mechanochemical reactions. Scanning electron microscopy results, on the other hand, demonstrated the presence of Cr2Al precipitates in the Al matrix of the consolidated Al5Cr specimen. Furthermore, electron microscopy examination of the Al-7.5Cr consolidated specimen revealed the formation of a supersaturated (Cr) phase with the Pearson symbol cl2 and belonging to the space group Im3m, with a prototype phase of the kind W that corresponds to the binary alloy phase diagram of the system Al-Cr.
In addition, X-ray diffraction spectra denoted that the crystallite size experienced a continuous decrement as the milling time had elapsed, even after the sintering process, the crystallite size exhibited the same trend to diminish. This behavior could be explained by the pinning effect imposed by Al-Cr precipitates on grain boundary movement, which was uniformly precipitated in Al based matrix during sintering process.
The lattice strain determined from the Williamson–Hall method exhibited a continuous increase as the ball milling process had advanced; however, after the sintering treatment was applied, the lattice strain had a decrement. This behavior is related to the removal of crystalline defects, in particular, the large ones. This elimination of punctual defects originated from thermal energy provided during the sintering process.
The density of dislocations was computed using the size of nanosized grains as a rough reference. The dislocation density ascended as the milling process progressed, according to this estimate even after the sintering the multiplication of dislocations prevailed following the same tendency.
Results derived from a theoretical model of mechanical properties showed values of hardness and yield strength of 58.6 Hv and 75.9 MPa for Al5Cr specimens. In a similar way, estimated values of hardness and yield strength resulted in values equal to 42.2 Hv and 52.4 MPa for the Al7.5Cr specimen.


 ,
, 


