Article

A Cosine-Similarity-Based Deconvolution Method for Analyzing Data-Independent Acquisition Mass Spectrometry Data

School of Computer Science and Technology, Shandong University of Technology, Zibo 255049, China
*
Author to whom correspondence should be addressed.
Appl. Sci. 2023, 13(10), 5969; https://doi.org/10.3390/app13105969
Submission received: 27 February 2023 / Revised: 30 April 2023 / Accepted: 11 May 2023 / Published: 12 May 2023

Abstract

:
Although data-independent acquisition (DIA) has the ability to identify and quantify all peptides in a sample, highly complex mixed mass spectra present difficulties for accurate peptide and protein identification. Additionally, the correspondence between the precursor and its fragments is broken, making it challenging to perform peptide identification directly using conventional DDA search engines. In this paper, we propose a cosine-similarity-based deconvolution method: CorrDIA. This is achieved by reconstructing the correspondence between precursor and fragment ions based on the consistency of extracted ion chromatograms (XICs). A deisotope peak cluster operation is added and centered on the MS/MS spectrum to improve the accuracy of spectrum interpretation and increase the number of identified peptides. The resulting MS/MS spectra can be identified using any data-dependent acquisition (DDA) sequencing software. The experimental results demonstrate that the number of peptide results increased by 12 percent and 21 percent respectively, and the repetition rate decreased by 12 percent. This reduces mass spectra complexity and difficulties in mass spectra analysis without the need for any mass spectra libraries.

1. Introduction

Shotgun proteomics based on liquid chromatography–tandem mass spectrometry has become a mainstream method for the comprehensive analysis of proteins [1,2]. Proteomics typically involves preparing a protein sample, turning the protein into a peptide mixture via enzymology, producing a series of mass spectra, and then using tandem mass spectrometry to identify the peptide sequence. Lastly, the sample protein sequence can be put together. Protein identification is the most important step in the whole process. Bottom-up proteomics mainly uses three methods: data-dependent acquisition (DDA), to discover proteomics and achieve unbiased and complete coverage of the proteome; data-independent acquisition (DIA), which elutes all peptides from the high-performance liquid chromatography column for multiple fragmentations to generate a complete MS/MS spectrum of fragment ions for the sample; targeted proteomics (targeted), which aims to obtain a subset of known polypeptides of interest in a repeatable, sensitive and smooth manner [3]. No matter which method is used, the identification of peptides and proteins cannot be separated from the generation of mass spectrometry data.
Most existing methods of protein identification are based on DDA mass spectra data [4]. In the process of DDA fragmentation, the precursor ions with the highest intensity are usually selected for fragmentation to generate MS/MS spectra. Thus, mass spectrometers are not able to reliably isolate and acquire high-quality MS/MS spectra for all peptides in typical samples [5]. As a result, inaccurate sampling and poor repeatability of analysis will occur; thus, this method is not suitable for the analysis of complex samples. In contrast to data-dependent acquisition, DIA methods [6,7], alternative workflows to DDA, have recently made great advances; they select all precursor ions within a certain retention time and m/z range to generate MS/MS spectra. Every precursor ion in the MS1 spectrum is selected in the DIA method, and those with a lower intensity will also be recorded [8]. Usually, the instrument circulates through the m/z range of precursor ions in the specified width, generating highly multiplexed fragment mass spectra in each cycle. In addition, fragment ions in DIA mass spectrometry can be reconstructed to form MS/MS chromatograms, which can provide support for peptide identification and quantification.
While DIA ensures that each precursor ion within a predefined mass range is fragmented in one cycle, the complexity of the spectrum presents a significant challenge for subsequent analysis [9]. MS/MS spectra of DIA data are difficult to interpret because they are highly complex. Each mass spectrum contains fragment ions from more than one precursor; a remaining challenge is correctly and efficiently interpreting the connection between the precursor ion and its fragment ions. The identification of pseudo-MS/MS spectra is the primary method for data-independent acquisition mass spectrometry. Various tools have been proposed, such as DeMux [10], DIA-Umpire [5], Group-DIA [11], Specter [12], and CorrDec [13]. After the peptide identification results are obtained, the estimated false discovery rate (FDR) is used to evaluate the reliability of the identification results [14].
Here, we present a new method termed CorrDIA, which utilizes a cosine-similarity-based deconvolution approach to divide a DIA mass spectrum into multiple pseudo-MS/MS spectra, each representing a single peptide ion. The method has two main contributions:
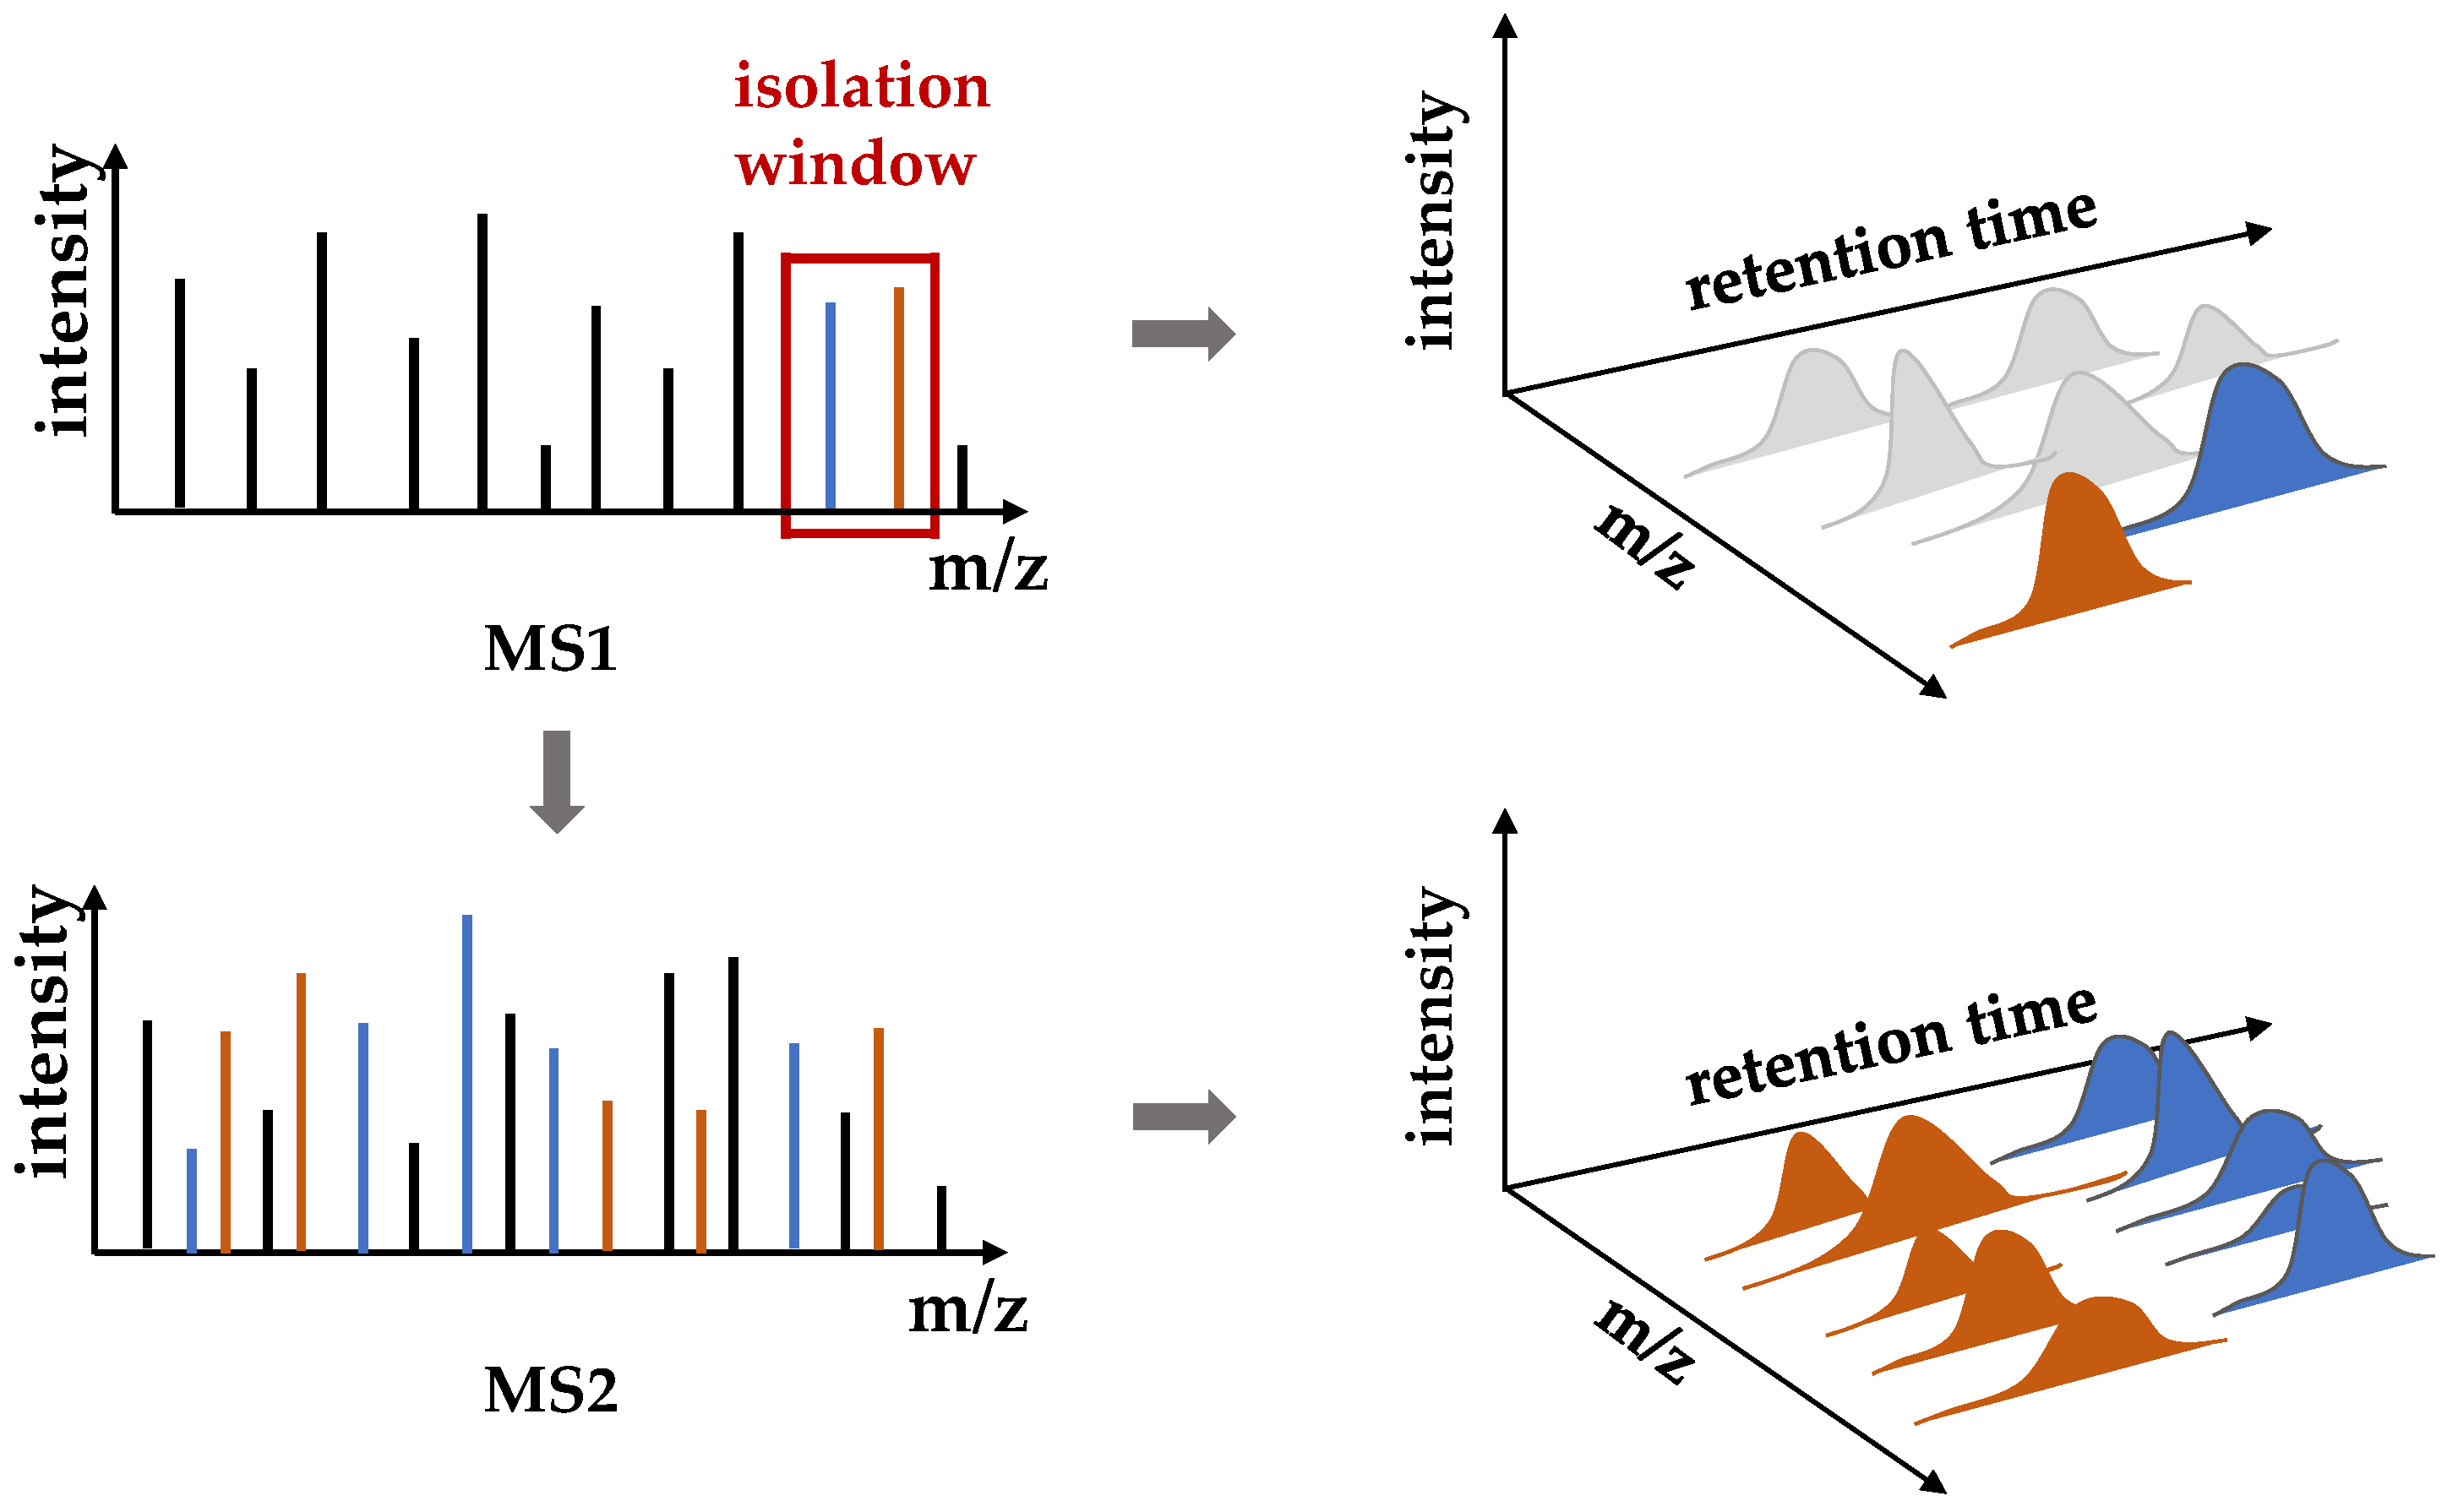
  • To address the issue of a large amount of data in chromatogram similarity comparison, which create a larger search space and require more calculations. In contrast to the prior method, the MS/MS spectra are at the center of our algorithm, and the information “isolation window” is added when extracting mass spectra data to reduce the comparison space, improving the accuracy of the experiment.
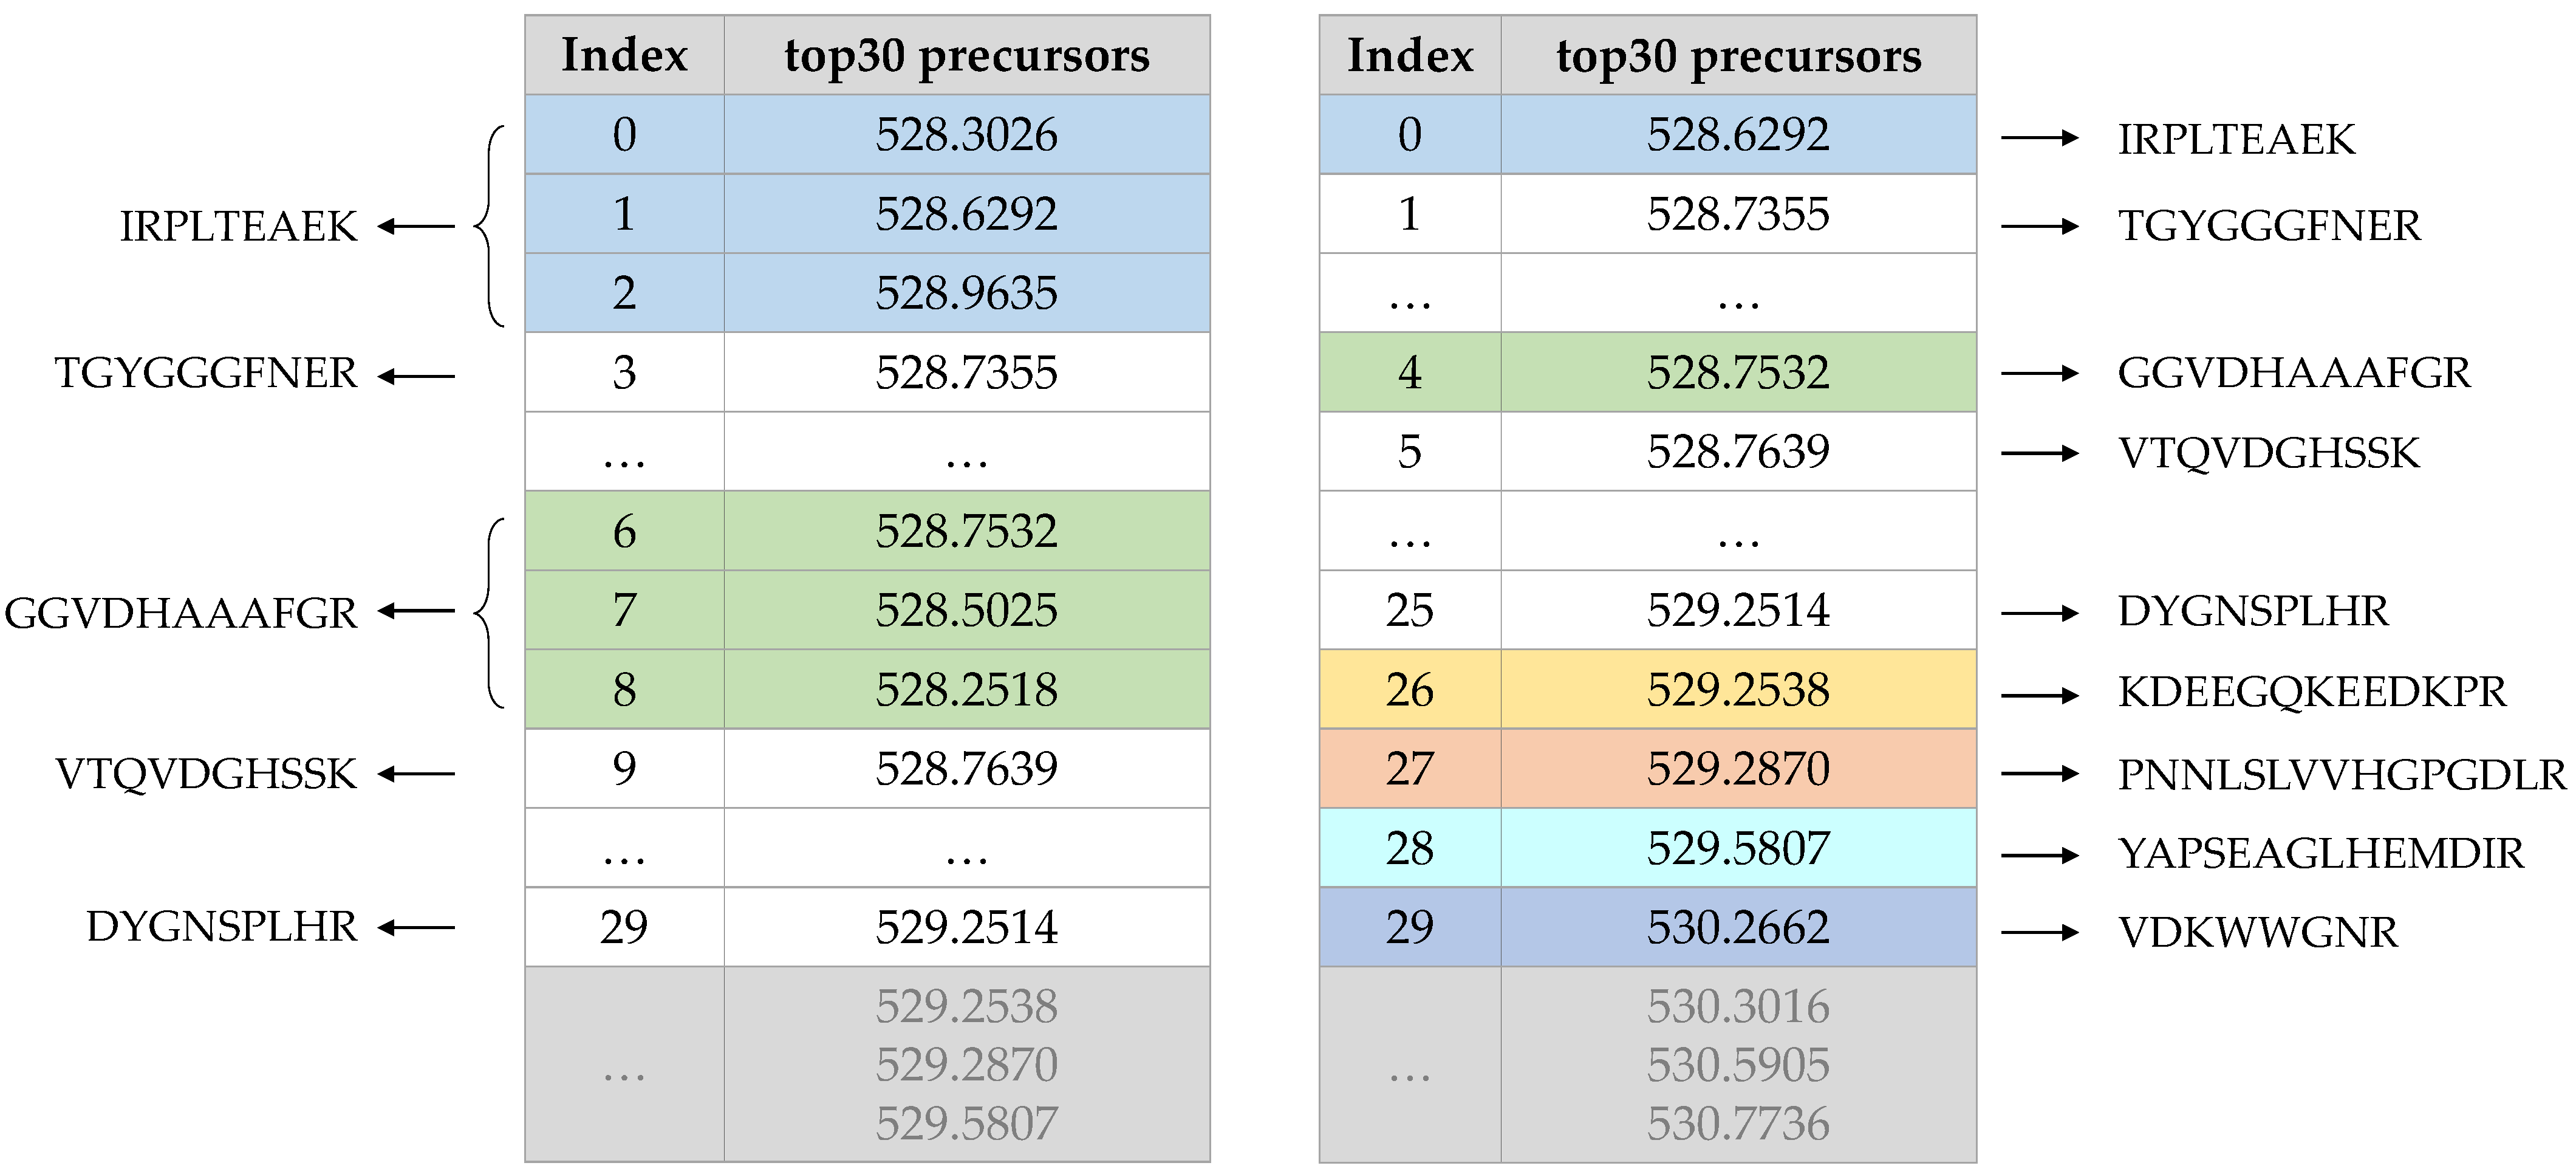
  • According to the characteristics of DIA data, there are a large number of isotopic peak clusters in the spectrum. We removed isotopic peak clusters from each MS1 spectrum and carried out an overall search to remove redundancy in each selection of candidate precursors. Reducing the repetition rate ensured that most of the pseudo-MS/MS spectra came from the same peptide.
Our method does not use the existing mass spectra library; it generates a spectrum library based on the obtained DIA data to reduce extra costs. Those pseudo-MS/MS spectra can be searched using conventional DDA sequence database-searching software or de novo software.

2. Materials and Methods

The analysis started by using the signal extraction algorithm to detect all possible precursors and fragment features in MS1 spectra data and MS/MS spectra data. Afterwards, precursor and fragment signatures were categorized based on the relevance of their chromatograms. Then, candidate precursors were ranked according to the obtained similarity. The tool generated “pseudo-MS/MS spectra” for untargeted MS/MS database searches to identify peptides and proteins. The workflow is shown in Figure 1.

2.1. Raw Mass Spectrometry Data

With the improvement of the mass spectrometer in quality, accuracy, speed and resolution, a variety of DIA acquisition strategies aimed at reducing the complexity of analysis have been proposed. The current DIA data acquisition methods can be divided into full window fragmentation, such as MSE [15], isolation window sequence fragmentation, such as SWATH [16], variable precursor isolation window, and 4D-DIA with increased data dimension [17].
The data we used were SWATH-based. We used public datasets to illustrate the performance of CorrDIA. Its identification performance was evaluated using a HeLa whole-proteome tryptic digest recorded on a nanoLC-coupled QExactive HF mass spectrometer (Thermo Fisher, Waltham, MA, USA), with 1 h chromatographic gradient lengths. The raw data were obtained from ProteomeXchange (PXD005573). Then, the raw file was directly converted to mzML format by msconvert.exe from the ProteoWizard package with the default parameters (version 3.0.111537) [18].

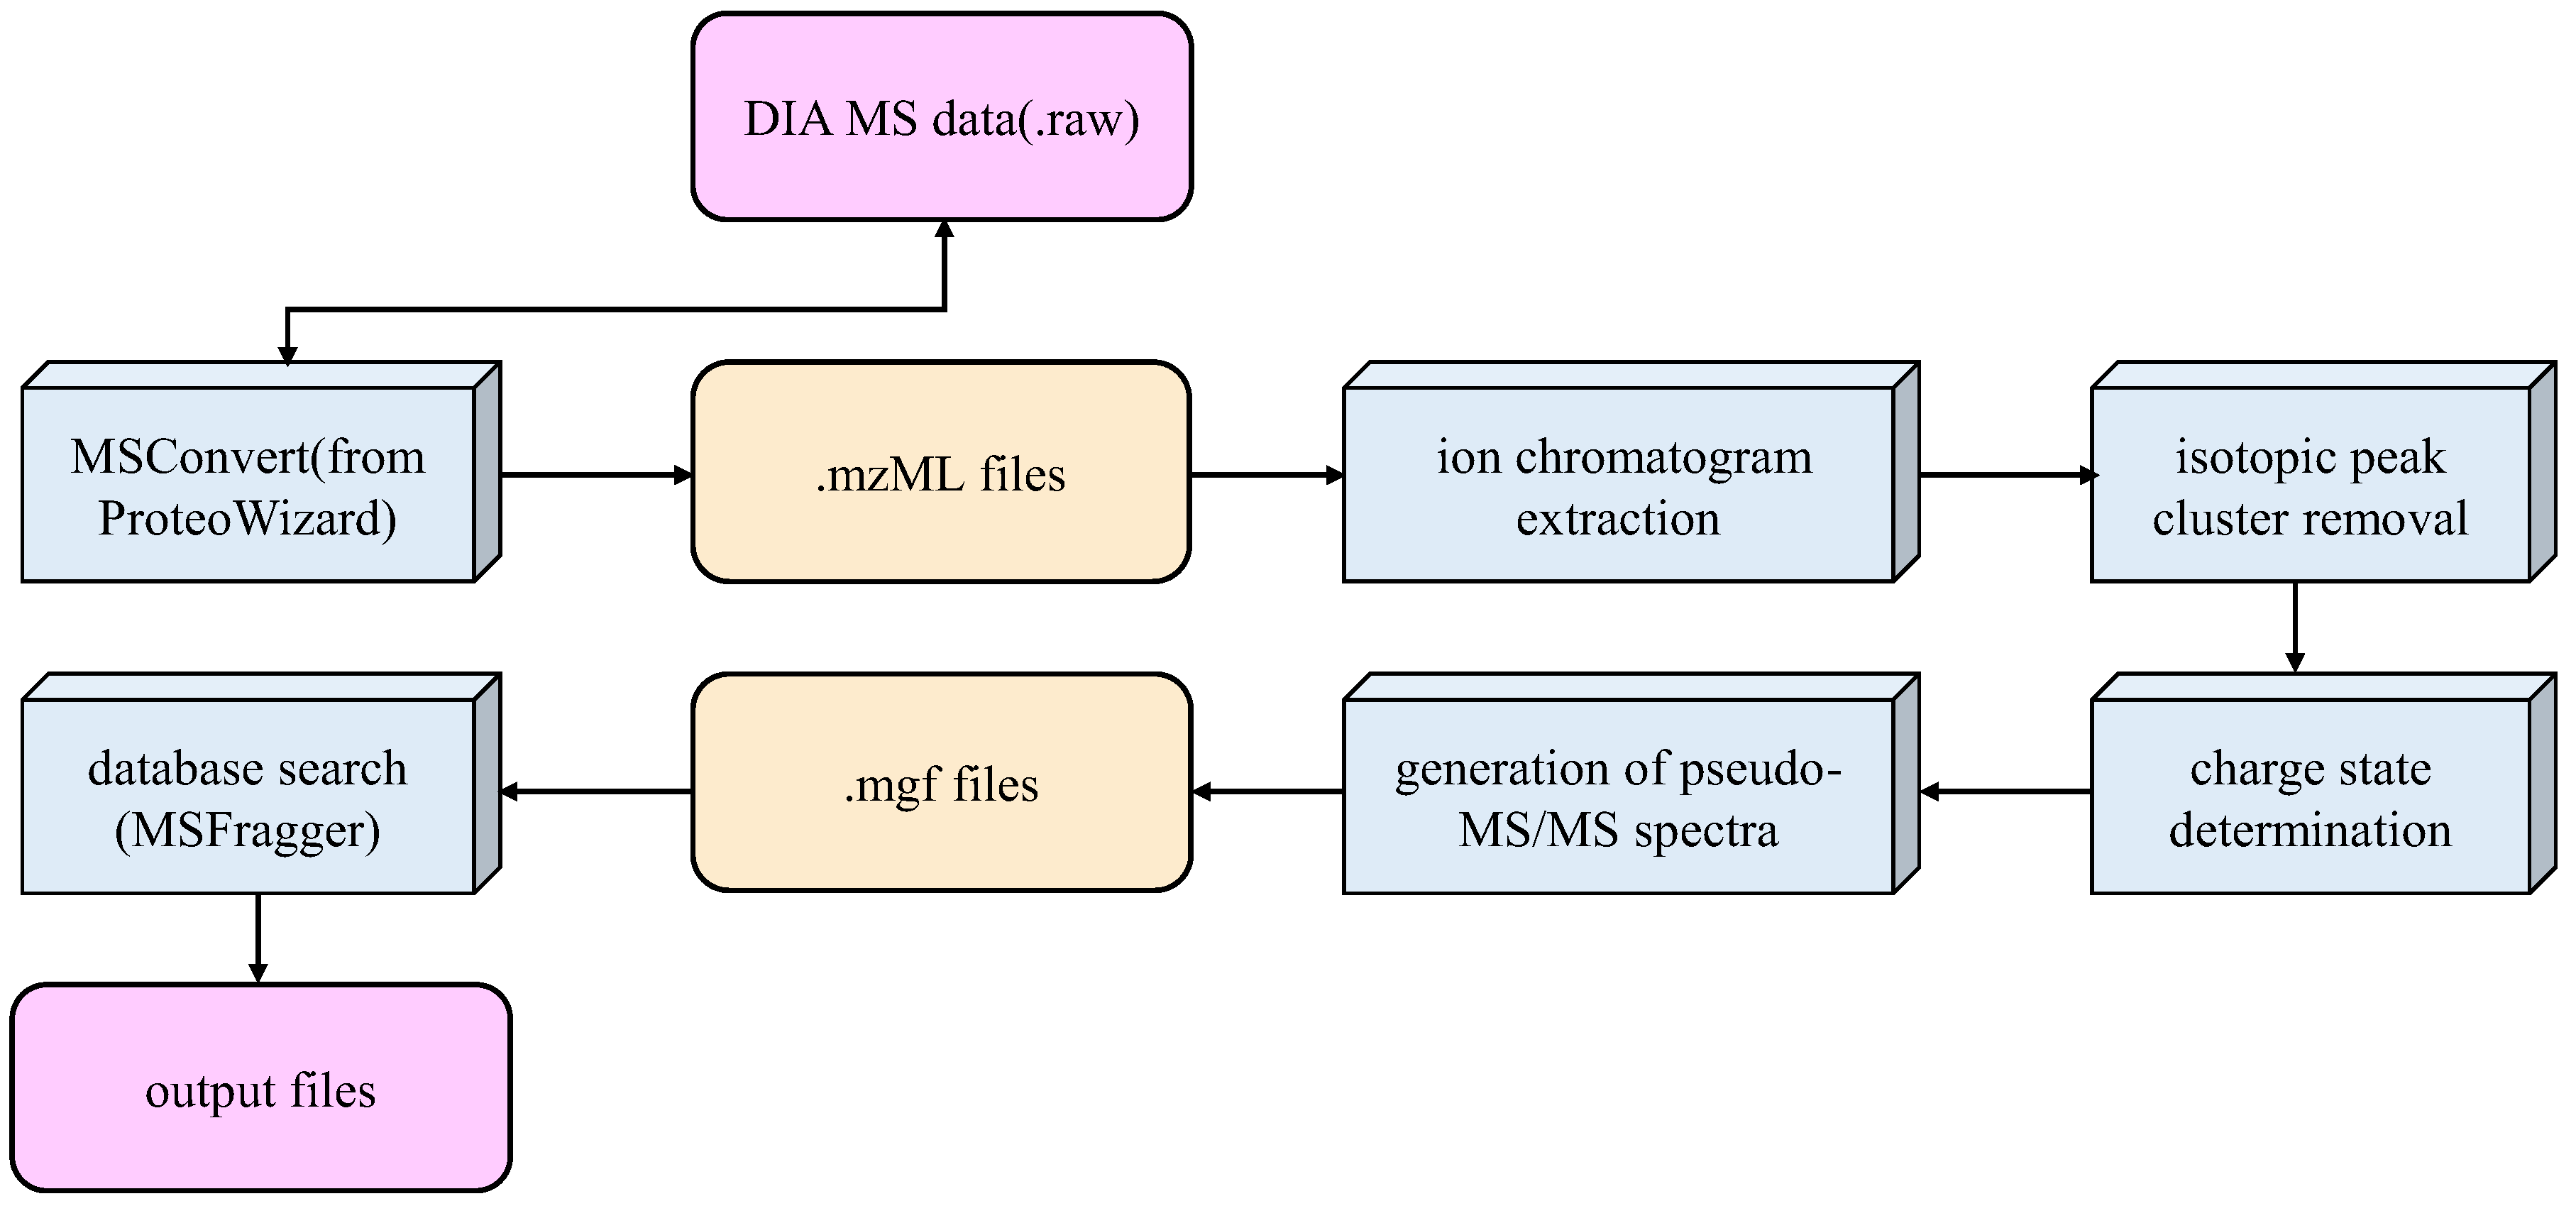
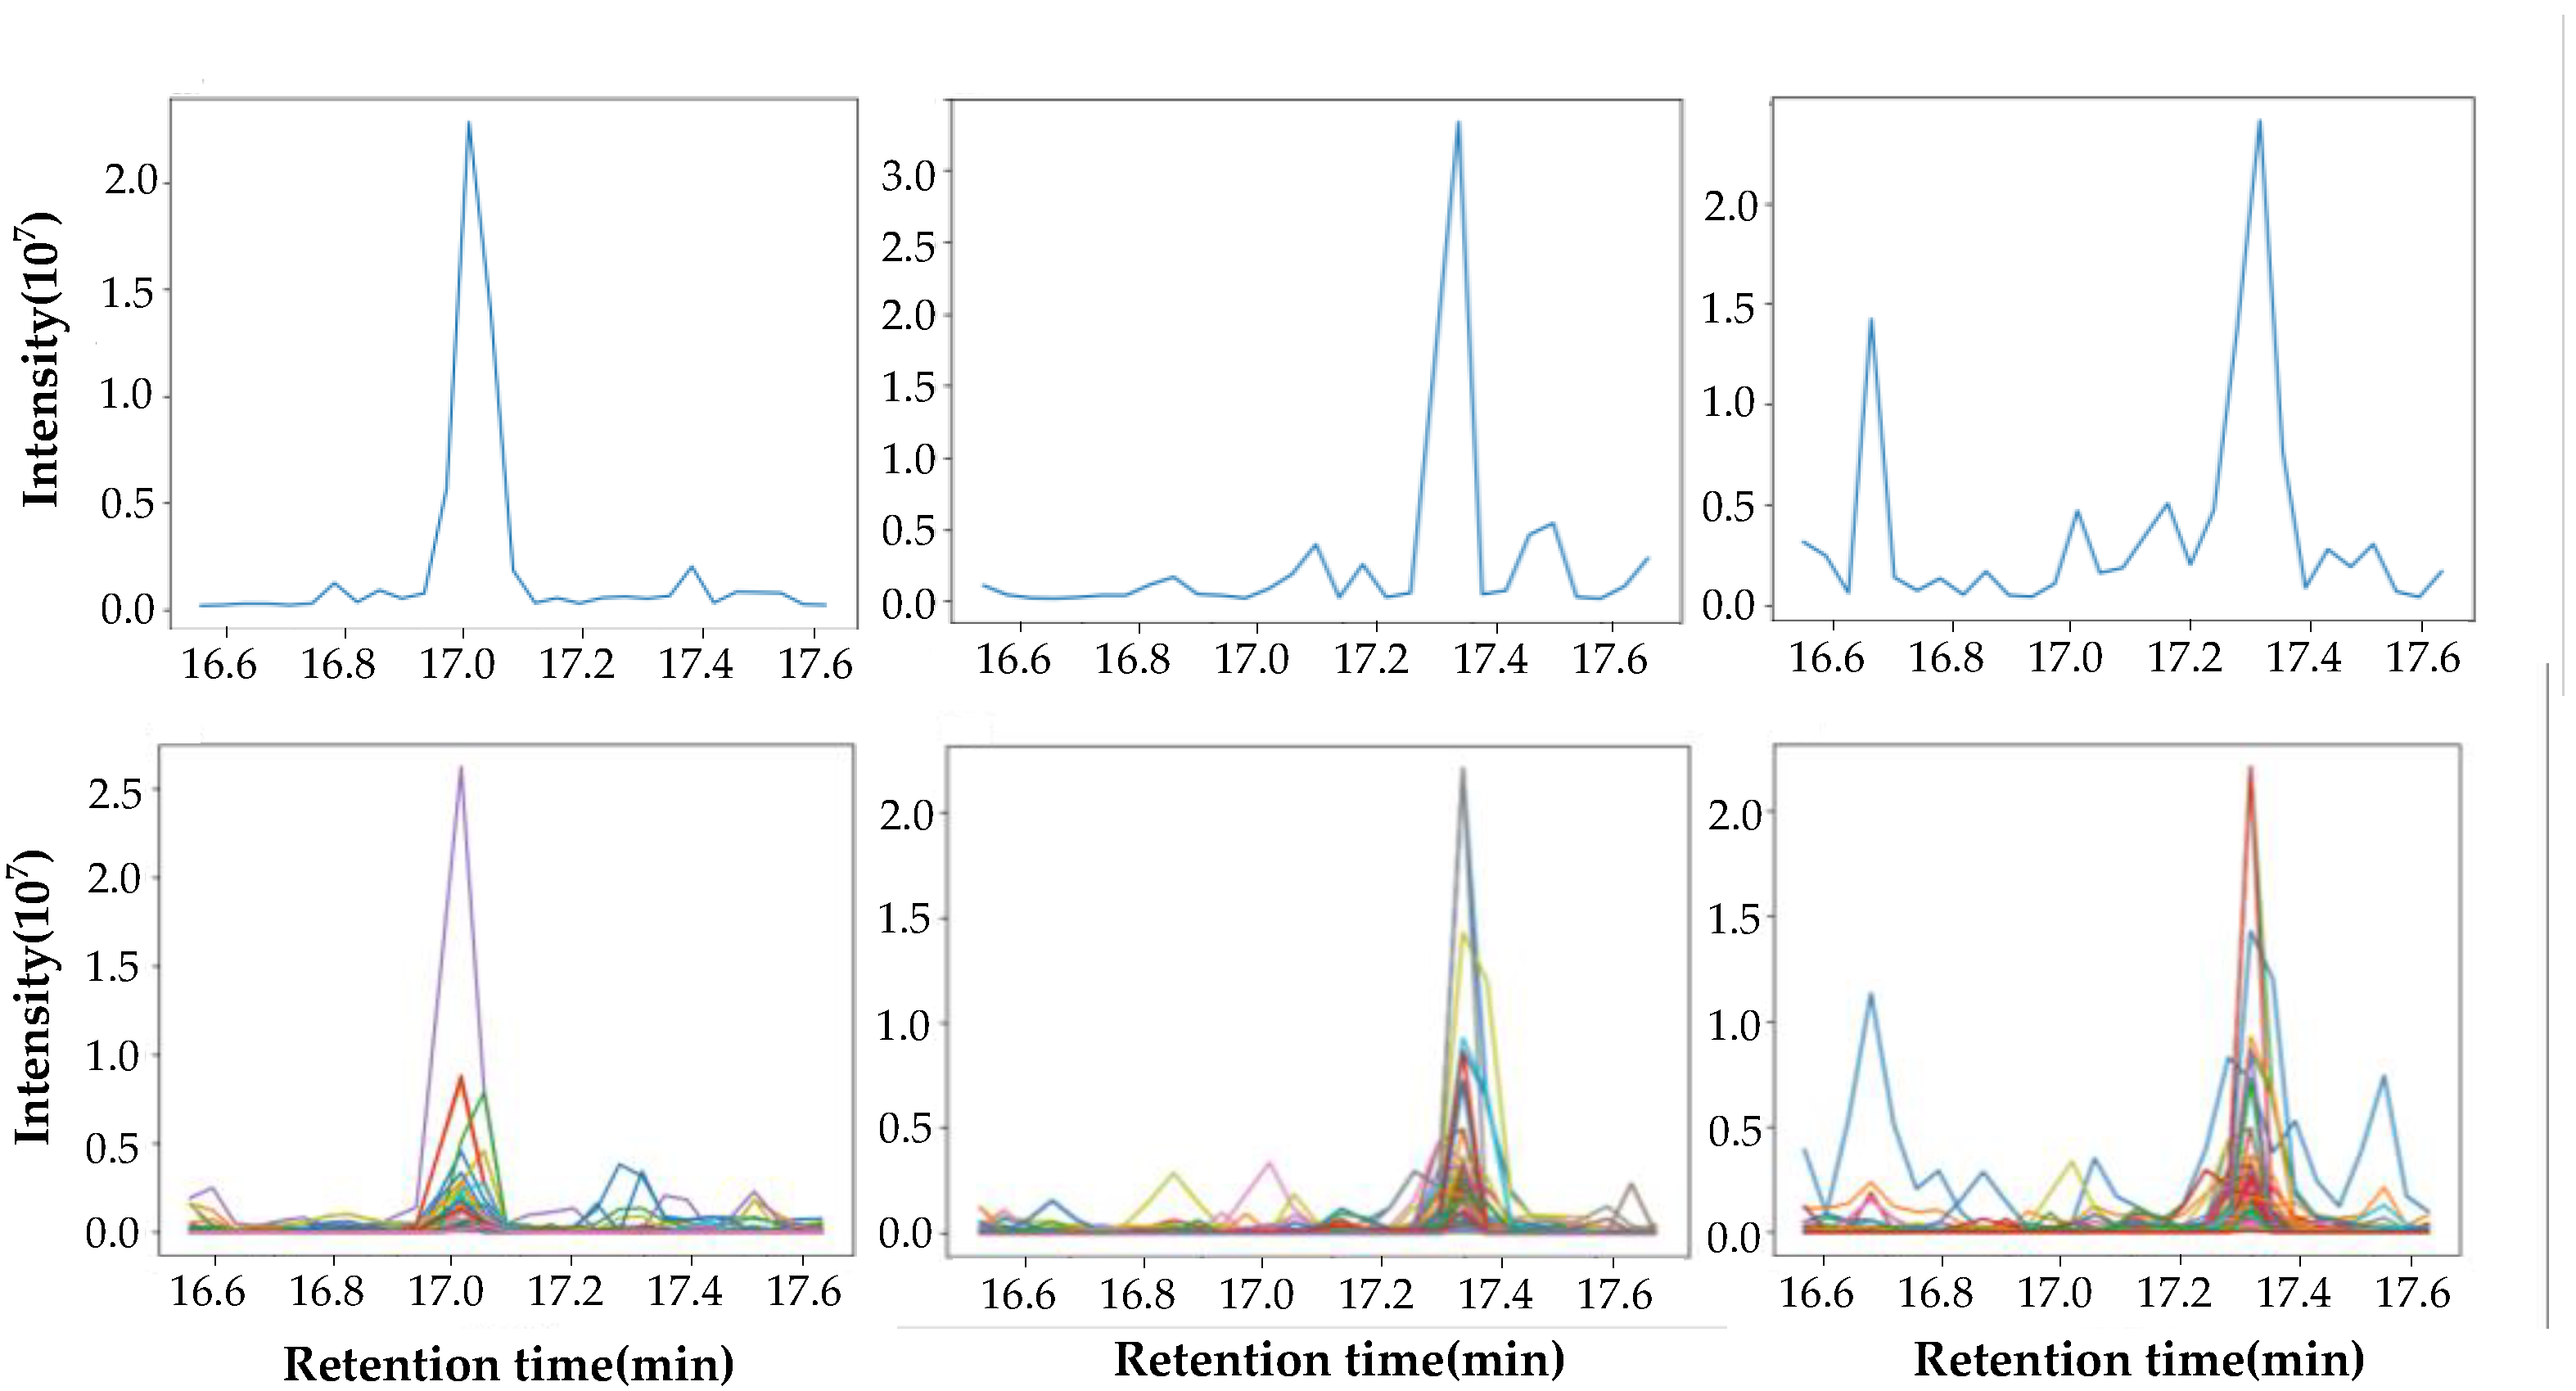
2.2. Data Extraction

In order to reconstruct the extracted ion chromatograms (XICs), we first had to extract information from the mass spectrometry data. Biologists use an enzyme to cleave protein samples into short peptides. When the peptide mixture enters the mass spectrometer, the output spectrum is denoted as the MS1 spectrum. Then, precursor ions are selected to be fragmented into daughter ions to obtain the MS2 spectrum [2]. In this paper, we define the MS1 spectrum as the precursor ion mass spectrum and the MS2 spectrum as the MS/MS spectrum.
It is assumed that as peptides move through the chromatograph, only ions with a specific m/z range will be able to move through, creating a chromatogram. We can see the generated chromatograms in Figure 2. The recorded information for the three axes contains their m/z, retention time, and peak intensity. The traditional pseudo-MS/MS spectrum method does not divide the precursor ion mass spectrum when extracting the mass spectrum data information, which leads to a large search space in the process of similarity comparison and increases the amount of calculation. In this paper, we added the information of the isolation window to the MS/MS spectra data. This represents a m/z range value, that is, the minimum m/z of the fragmented precursor ion to the maximum m/z.
In the experiment, we use the scan number of the mass spectrum as the unique identifier. For each detected precursor ion mass spectrum, our algorithm reports each mass spectrum’s scan, m/z value, intensity, and retention time; for each detected MS/MS spectrum, our algorithm reports each spectrum’s scan, isolation window, m/z value, intensity, and retention time. One precursor ion mass spectrum is fragmented by multiple MS/MS spectra; we can determine the corresponding relationship between one precursor ion mass spectrum and several MS/MS spectra based on the order of the retention time (RT). The isolation window information, which spans the minimal and maximal m/z of the chosen precursor ions, allows us to determine which precursor ions from the associated precursor ion mass spectrum are responsible for fragmenting the current MS/MS spectrum. The search space is narrowed, improving the experimental accuracy.

2.3. Similarity Comparison

Coelution is important to reveal the relationships between a precursor ion and its fragment ions [19]. The purpose of our experiment is to reconstruct the corresponding relationship between precursor and fragment ions through their high similarity. As shown in Figure 2, the XICs can be defined as the curve of the intensity of mass spectra peak signal changing with retention time within a certain period. In this work, we set the retention time interval value of 1 min. For example, to extract the chromatogram of the precursor p in a precursor ion mass spectrum, it is necessary to find precursor ion mass spectra with a retention time of ±0.5 min from the current precursor ion mass spectrum and then extract the peak intensity in these mass spectra within the threshold m/z range. When extracting the peak intensity, we extracted the peak intensity whose m/z difference with the ion was 0.02 Da, then combined these intensities to generate a chromatogram. Correlation has been widely used to generate pseudo-MS/MS spectra. We took advantage of the XICs’ consistency between the precursor and fragment ions and interpreted the MS/MS spectrum based on the ranking of precursor and fragment similarities.
We calculated the cosine similarity C = corr (P, F) between all possible precursor XICs and their fragment XICs. P (p1, p2, …, pn), F (f1, f2, …, fn), as mentioned in the paper, refer to the extracted ion chromatogram profile (1 ∗ n). This is a list of peak intensity values, and n represents the number of ions. The formula is as follows:
C = c o r r P , F = P · F | P | | F | = i = 1 n p i * f i i = 1 n ( p i ) 2 * i = 1 n ( f i ) 2
In this representation, one fragment ion can have multiple precursors, and several precursors can share the same fragment. The corr (F, Pi) of a fragment ion F is calculated based on the cosine similarity between the fragment and all candidate precursors. For a precursor ion P, the corr (Fi, P) is calculated based on the cosine similarity between the precursor and all possible fragments. The pseudo-code for the similarity calculation is shown in Algorithm 1.
Algorithm 1: Calculating cosine_similarity of chromatograms of precursors and fragments.
Input: Peak intensity list of each precursor item1,
peak intensity list of each fragment item2
Output: Cosine_similarity two-dimensional matrix result
1   device ← torch.device (‘cuda’ if torch.cuda.is_available () else ‘cpu’)
2   for i, pre in enumerate (item1) do
3     for j, frg in enumerate (itme2) do
4       x, y ← torch.tensor (np.array([pre, frg]), dtype = torch.float64, device = device)
5       cos ← torch.nn.CosineSimilarity (dim = 0)
6       similar ← cos (x, y)
7       tmp_list ← similar.cpu ()
8     result[i] ← tmp_list
9 return   result
All similarities form a two-dimensional matrix, as shown in Table 1.
Then, we obtained the similarity of all candidate precursor ions and their fragment ions. As shown in Table 1, each row represents one precursor; we calculated the number of cosine similarity values greater than 0.6 in each row as the sorting method for all precursors within the isolation window range. Through the experimental test, we selected the top 30 precursor ions for each MS/MS spectra: one MS/MS spectrum was disassembled into 30 new pseudo-MS/MS spectra, corresponding to 30 precursor m/z (pepmass). We took all the fragment ions with a cosine similarity greater than 0.6 with the current precursor ion as the fragment ions of the newly generated pseudo-MS/MS spectrum. It is worth noting that, here, we needed to de-redundant the precursor before selecting the top precursor ion for each MS/MS spectrum. As the error range between some precursors is small, there will be a large number of repeat identical identification results.

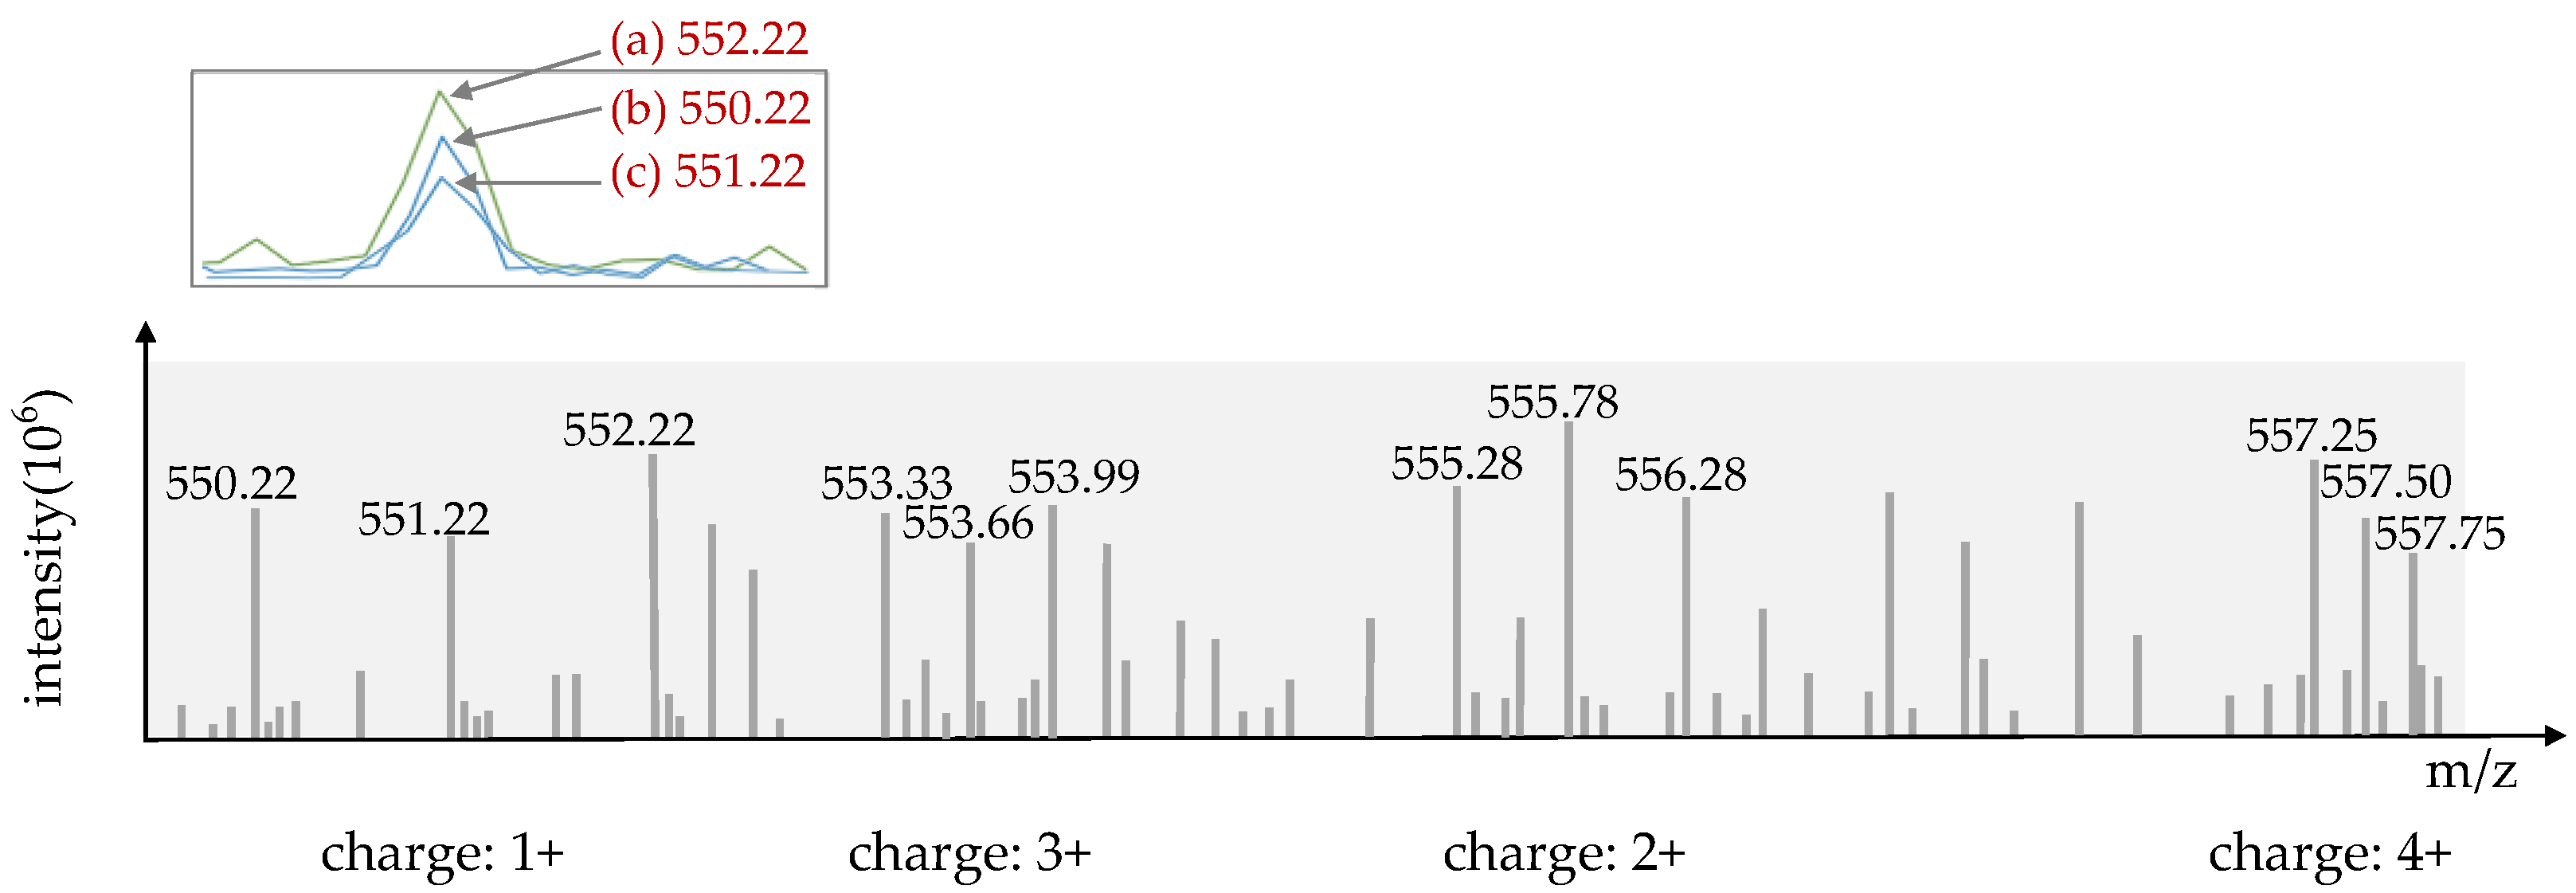
2.4. Remove the Isotopic Peak Cluster and Determine a Precursor’s Charge State

The charge state for each pseudo-MS/MS spectrum is determined by the characteristics of the precursor. The performance of the CorrDIA algorithm with different combinations of threshold parameters, as described above, can be evaluated using data subsets (for additional detail, see results Section 3) According to the two-dimensional matrix obtained above, we retained the number of cosine similarity results greater than 0.6 in each row of the matrix and ranked all candidate precursors according to the number of cosine similarity greater than 0.6.
We determined a precursor candidate P’s charge state (in this work, +1, +2, +3, and +4 only) by detecting the isotopic peak cluster. If we did not detect an isotopic peak cluster for a precursor, we defaulted its charge state to 2.
  • Confirm mass spectrum scan of the precursor and record its position I in the precursor ion mass spectrum. Each peak in the precursor ion mass spectrum is marked by 0 or 1 to record whether it has been visited;
  • Go through all peaks in the precursor ion mass spectrum to find the peak P0 with the highest intensity and record its position I0;
  • From I0, move left or right to determine whether the peak difference in mass-to-charge meets the set threshold of mass spectra peaks with P0 (+1: 1.003 da, +2: 0.5015 da, +3: 0.3343 da, +4: 0.2507 da);
  • If satisfied, these peaks are then recorded as isotopic clusters of P0, and their charge is confirmed by the threshold. If not, pass the peak;
  • Delete the P0 isotopic clusters found above in the original precursor ion mass spectrum so that only the peak with the highest peak intensity is retained; then, find the peak P1 with the highest intensity in all the unvisited peaks and record its position I1;
  • Repeat the previous step until all peaks in the precursor ion mass spectrum are visited.
Next, we found the isotopic peak cluster of position I; at this point, we could determine the precursor charge state. Figure 3 shows the correspondence between different isotopic peak clusters and charge states. In addition, chromatograms a, b, and c are the chromatograms of precursor ions with m/z of 552.22, 550.22, and 551.22, respectively. We can see that the chromatograms of these ions are highly consistent; the only difference is in their intensity. When we calculate the similarity of chromatograms, it is possible to repeat the selection. Therefore, this is likely to result in complete consistency in the sequence of identification results. During the experiment, if we do not process these results, there will be much redundancy, which will miss the real ion signal peak that should be extracted and reduce the efficiency of mass spectral analysis. Therefore, when we extract the precursor ion chromatograms, we should remove the isotopic peak cluster and only retain the precursor ion with higher intensity.

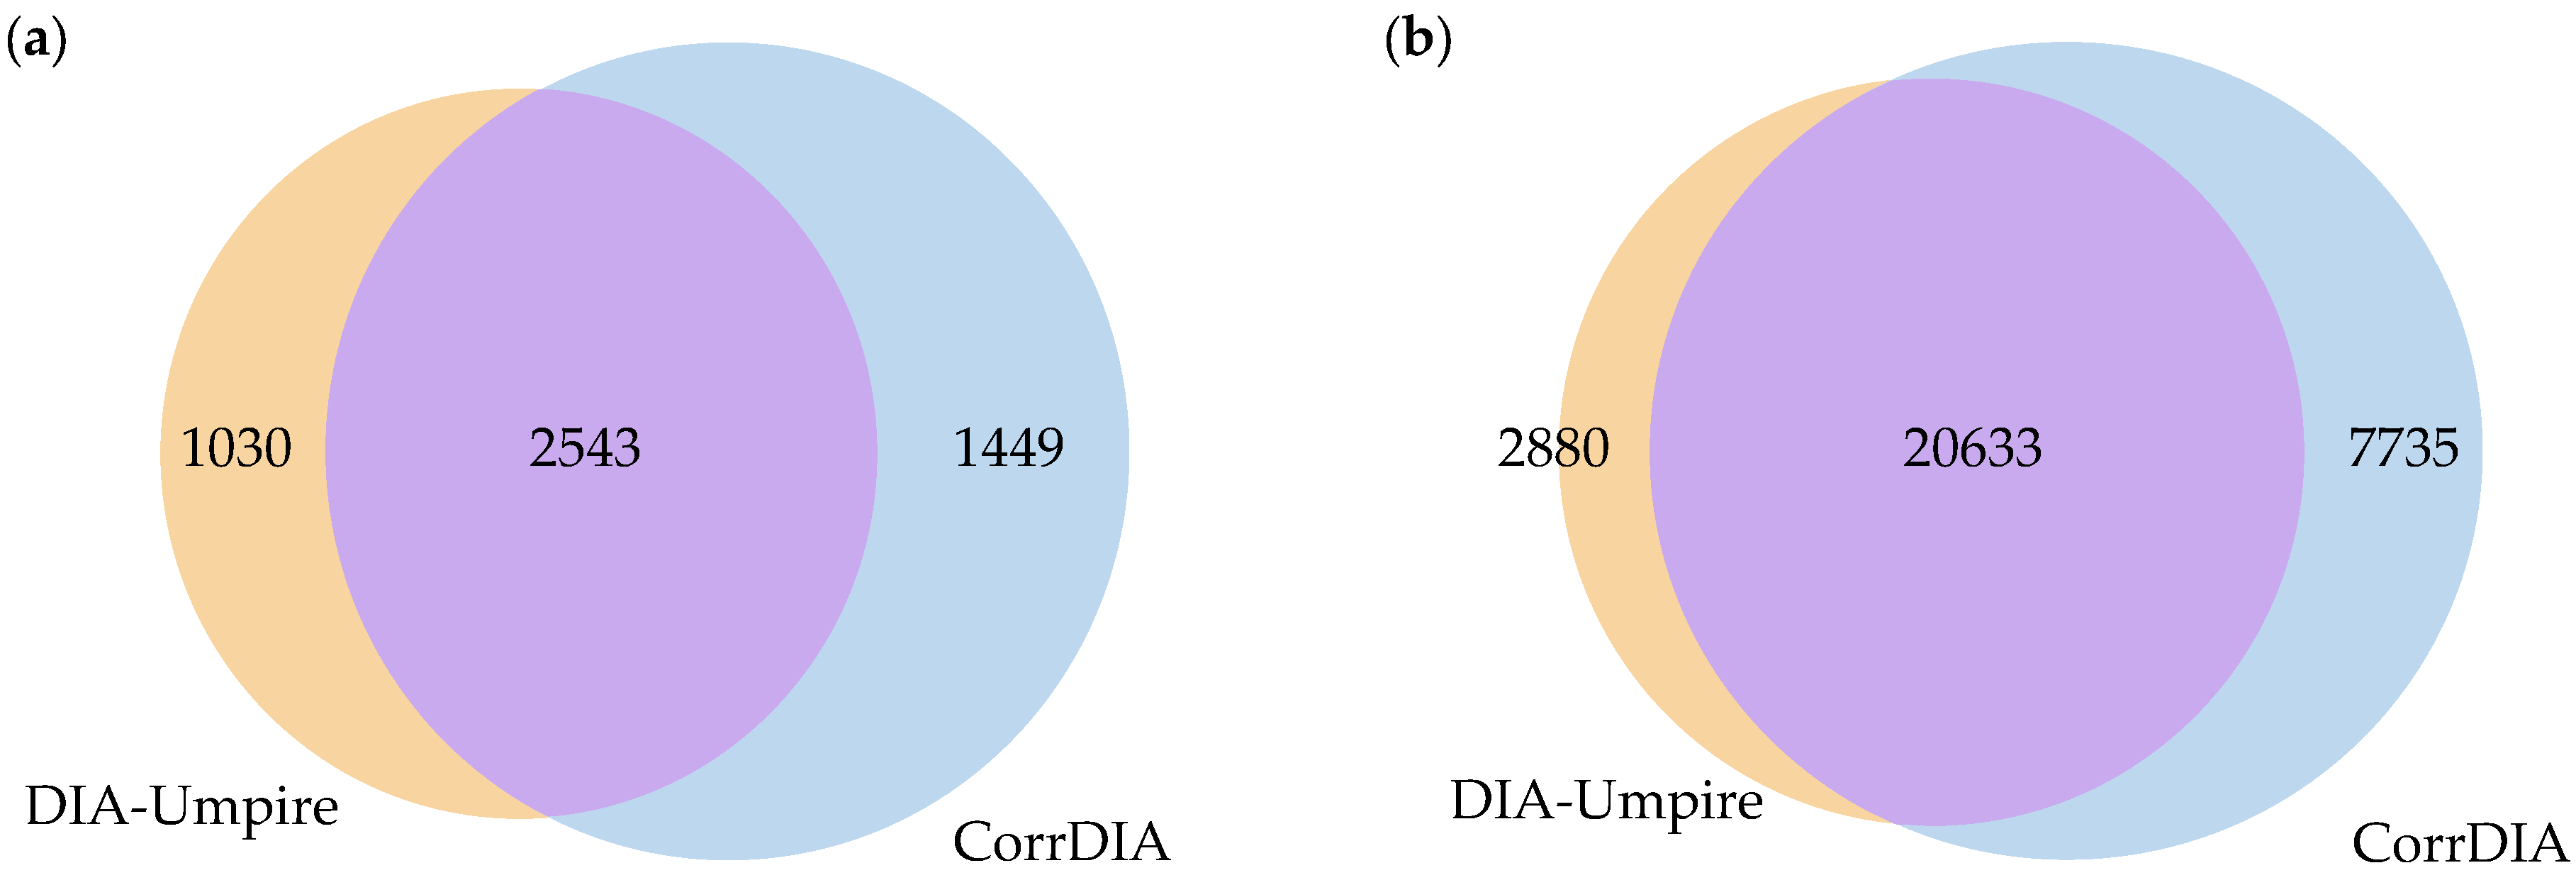
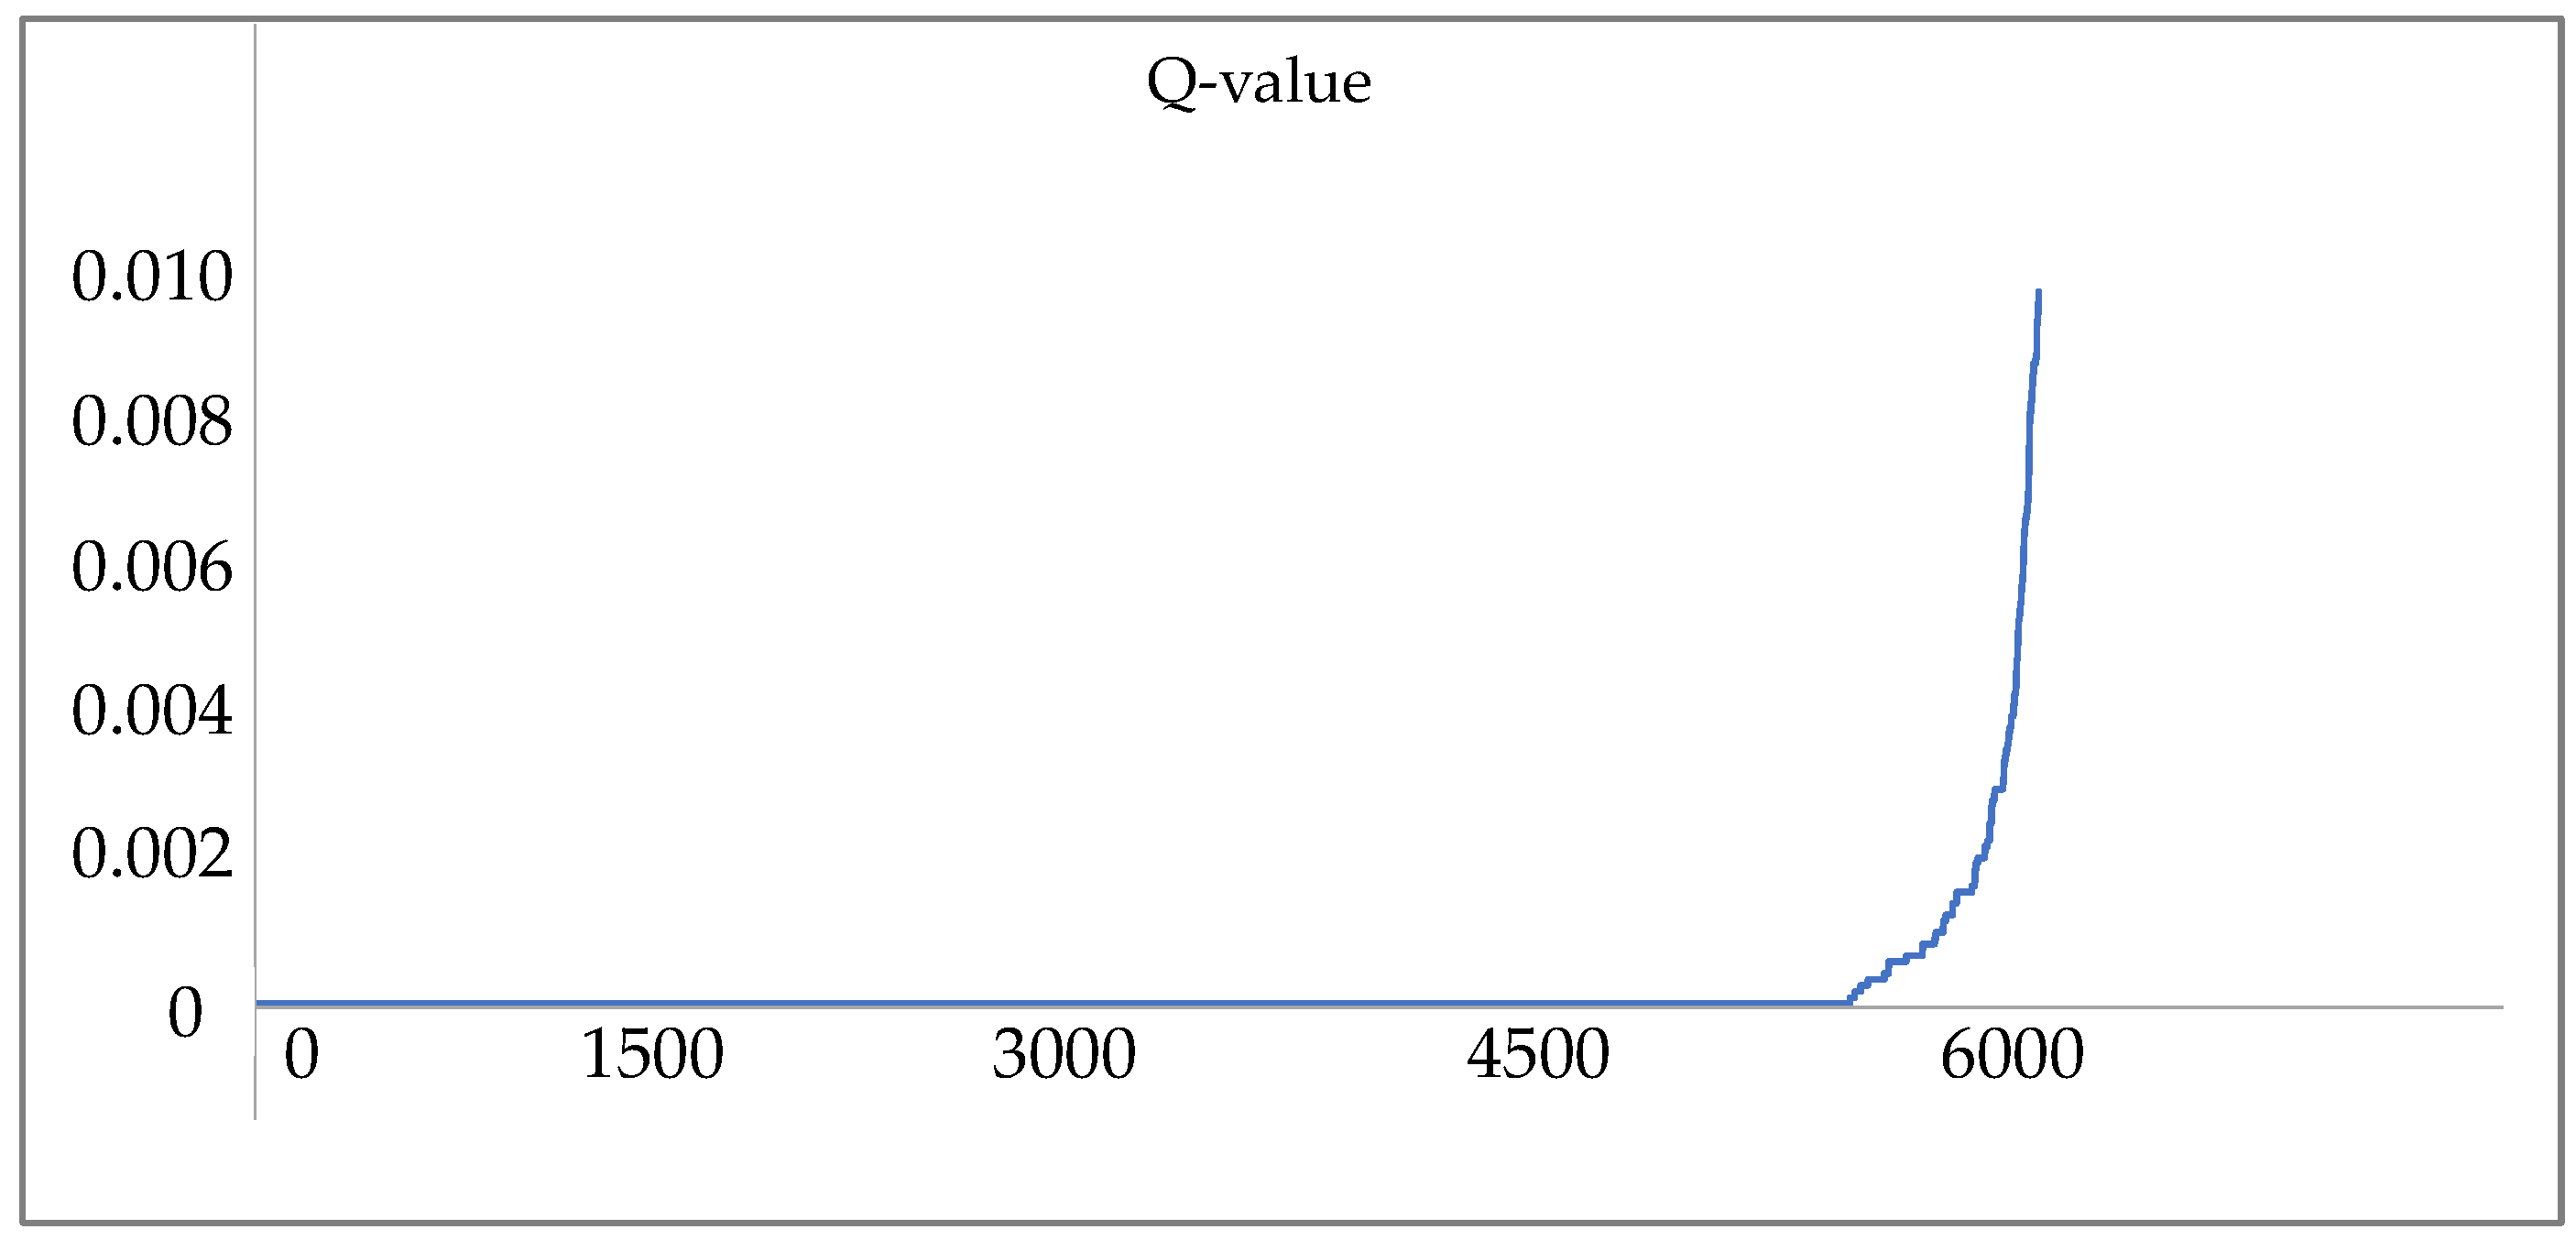
2.5. Peptide and Protein Identification

The pseudo-MS/MS spectra are stored using the traditional .mgf format of DDA. Therefore, when performing a database search, all conventional database-searching software can be used, such as pFind [20,21], MSFragger [22], and de novo peptide identification software. In this work, we used MSFragger to enable peptide identification and compared its identification result performance with DIA-Umpire. The parameters in the database search process are the same as the DIA-Umpire shown in Table 2.

3. Results

First, we determined the influence of different parameter settings on the experimental results, as shown in Figure 4.
The ordinate means the number of identified peptides. We chose 1000 MS/MS spectra for testing. Considering the cost and experimental efficiency, the following thresholds led to the most identification number results when using MSFragger searches for pseudo-MS/MS spectra extracted in different settings (at 1% filter) and were selected as default values in our algorithm: the cosine similarity was set to a threshold of 0.6, the top 30 ranked precursors for each MS/MS spectrum were used, and we chose a 1-min retention time interval.
Next, we extracted ion chromatograms (XICs) for all fragment and candidate precursor ions in the isolation window. According to the consistency between the precursor and its fragment ion chromatograms, the entire MS/MS spectrum was interpreted, and the correspondence between precursor and fragment ions was found. The charge state of the precursor was also determined. In this way, we could obtain the pseudo-MS/MS spectra. In Figure 5, we show the chromatograms of the precursors and their fragment ions with high similarity. The three curves in the upper part of Figure 5 are precursor ion XICs, and the curves in the lower part of Figure 5 are their corresponding fragment ion XICs.
Then, we tested the effect of removing the isotopic peak cluster in the process of interpreting the spectrum. In the Materials and Methods section, we mentioned that for each MS/MS, we chose the top 30 precursor ions. Because the chromatograms of the precursor and its isotopic peaks are consistent, we took the top 30 precursor ions and their identification results before and after removing the isotopic peak cluster; an example is shown in Figure 6. The table on the left represents the top 30 precursor ions selected before removing the isotopic peak cluster and their identification result sequences. The identification results of the blue and green isotope peak clusters are completely consistent, and there is redundancy, which is not conducive to improving the result performance. The right side shows the top 30 precursor ions that were selected after removing the isotopic peak cluster and their identification result sequences, and the number of identification results significantly increased.
In previous works, there was one traditional, main pseudo-MS/MS spectra method, known as DIA-Umpire. We compared the performance of CorrDIA and DIA-Umpire for analyzing the HeLa or Human dataset.
The output .mgf file format was found to be consistent with the conventional DDA .mgf files; thus, any DDA database search software or de novo software can be used for the identification of peptides and proteins. In this work, we used the database-searching software MSFragger to identify peptides and saved the result mass spectra files under the filter (1%) controlled.
First, we compared the number of different identified peptide ions of CorrDIA and DIA-Umpire. In Figure 7a (the numbers in the figure are the numbers of identified peptides), about 63% of the peptides identified by CorrDIA were also identified by DIA-Umpire, and about 71% of the peptides identified by DIA-Umpire were also identified by CorrDIA, a 12% increase compared to DIA-Umpire. As shown in Figure 7b, approximately 73% of the peptides identified by CorrDIA were also identified by DIA-Umpire, and approximately 88% of the peptides identified by DIA-Umpire were also identified by CorrDIA, a 21% increase compared to DIA-Umpire.
As shown in Table 3, we recorded the number of identified mass spectra and the number of identified peptides using the two respective methods. We can see that the number of identified peptides accounted for 81 percent of the total number in the mass spectra by CorrDIA and only 69 percent when analyzed by DIA-Umpire. It was clear that a large number of the results in the mass spectra came from the same peptide in DIA-Umpire. In our method, by removing redundancy and removing isotopic peak clusters, the repetition rate of most interpreted pseudo-MS/MS spectra from the same peptide was greatly reduced.
We also present the precursor ion information of the same identified sequence with a different precursor m/z interpreted by CorrDIA and DIA-Umpire.
Some examples are provided in Table 4. We calculated the theoretical precursor m/z of the sequence, and we can see that the precursor interpreted by DIA-Umpire is not as accurate as CorrDIA.
Finally, to verify the correctness of the peptides that CorrDIA individually identified and the correctness of our pseudo-MS/MS spectra algorithm, we used pFind to identify peptides again for the .mgf files of this part on the human dataset. In Figure 8, we show the distribution of q-value in the identification results by pFind. The abscissa represents the peptides. Using a false discovery rate of 1%, almost 85 percent of the peptide sequences in the differential set were also searched in pFind. Part of the theoretical precursor m/z of these peptides and the precursor m/z identified by CorrDIA for these peptides is also recorded in Table 5. It can be concluded that this part of the results was also correct.
Different from DIA-Umpire, in our experiment, we took the MS/MS spectrum as the center. According to the above experiments, it can be concluded that the quality and quantity of the identification results were improved. Under the condition of setting the retention time interval value, the high similarity of chromatograms demonstrated increased efficiency. The number of recognized peptides increased. Additionally, under the control of a filter (1%), the correctness of the experiments was ensured. The accuracy of interpreted precursor ions also significantly increased when deleting the isotope peak cluster. The number of peptide results increased by 12% and 21%, and the repetition rate decreased by 12%.

4. Discussion

The core of the pseudo-MS/MS spectrum deconvolution method is to reconstruct the correspondence between the precursor and the fragment ions by calculating the similarity of the chromatograms between the precursor and its fragment ions. However, the number of peaks in the chromatogram comparison process is large, resulting in a huge amount of calculation, and the DIA data have a large number of isotope peak clusters, which will bring repeatability to the results. Based on these problems, we proposed CorrDIA, which takes the MS/MS spectrum as the center to process the mass spectra one by one and uses the isolation window information of each MS/MS spectrum to narrow the search space. CorrDIA also removes isotopic peak clusters from each precursor ion mass spectrum and carries out an overall search to remove redundancy in each selection of candidate precursor ions. CorrDIA reconstructs the corresponding relationship between the precursor and its fragment ions, reducing the complexity and difficulty of spectrum analysis.
We compared CorrDIA with the DIA-Umpire. Our experiments show that both the number of identified peptides and the resolution rate of the spectrum improved. In addition, CorrDIA could also solve the redundancy problem caused by isotopic peak clusters and reduce the redundancy of the same peptide.
However, CorrDIA was unable to analyze peptides without a precursor ion signal. In addition, due to the ion interference, ion suppression, and spectrum split algorithm of the MS/MS spectra, the number of MS/MS spectra obtained by the pseudo-MS/MS method was relatively small, resulting in a lower identification number than the mass spectra library [23] search method. With the development of mass spectrometry instruments, a correspondence between precursor and fragment ions could be regained by the acquisition of new dimensional information. The ion mobility acquisition technology and the latest sliding quadrupole technology were introduced, and the additional dimensions of collected information were developed into 4D-DIA data acquisition methods as a supplement to the traditional 3D-DIA, which only contains mass-to-charge ratios, strengths, and retention times. 4D-DIA methods, such as DIA-PASEF [17] and Scanning SWATH [16], reconstruct the relationship between mother ions and fragment ions in the secondary spectrum to a certain extent by recording additional ion mobility and four-stage rod dimensional master-ion information, and further improve the data resolution. In the future, the MS/MS spectra-splitting ability could be improved by combining it with deep learning algorithms to identify the high-dimensional characterization of the mother ion and fragment ion chromatograms and by using the higher selectivity of the precursor provided by the 4D-DIA data.

Author Contributions

Methodology, X.Z.; Investigation, R.W.; Writing—original draft, X.Z.; Writing—review & editing, X.Z.; Supervision, Z.Q. All authors have read and agreed to the published version of the manuscript.

Funding

This research was funded by Youth Innovation Team Development Plan of Shandong Province Higher Education grant number 2019KJN048.

Institutional Review Board Statement

Not applicable.

Informed Consent Statement

Not applicable.

Data Availability Statement

The raw data mentioned in this study can be downloaded from the ProteomeXchange with the accession number PXD005573. The MS/MS spectra of the hela and human data sets were searched against the UniProt hela database (released in August 2022, 459 protein entries) and the UniProt human database (released in September 2022, 20,398 protein entries), respectively.

Conflicts of Interest

The authors declare no conflict of interest.

Software Availability

CorrDIA is implemented in Python. The source code is provided on GitHub (https://github.com/zx/CorrDIA).

References

  1. Steen, H.; Mann, M. The ABC’s (and XYZ’s) of peptide sequencing. Nat. Rev. Mol. Cell Biol. 2004, 5, 699–711. [Google Scholar] [CrossRef] [PubMed]
  2. Cottrell, J.S. Protein identification using MS/MS data. J. Proteom. 2011, 74, 1842–1851. [Google Scholar] [CrossRef] [PubMed]
  3. Aebersold, R.; Mann, M. Mass-spectrometric exploration of proteome structure and function. Nature 2016, 537, 347–355. [Google Scholar] [CrossRef] [PubMed]
  4. Bantscheff, M.; Lemeer, S.; Savitski, M.M.; Kuster, B. Quantitative mass spectrometry in proteomics: Critical review update from 2007 to the present. Anal. Bioanal. Chem. 2012, 404, 939–965. [Google Scholar] [CrossRef]
  5. Tsou, C.C.; Avtonomov, D.; Larsen, B.; Tucholska, M.; Choi, H.; Gingras, A.C.; Nesvizhskii, A.I. DIA-umpire: Comprehensive computational framework for data-independent acquisition proteomics. Nat. Methods 2015, 12, 258–264. [Google Scholar] [CrossRef] [PubMed]
  6. Venable, J.D.; Dong, M.Q.; Wohlschlegel, J.; Dillin, A.; Yates, J.R. Automated approach for quantitative analysis of complex peptide mixtures from tandem mass spectra. Nat. Methods 2004, 1, 39–45. [Google Scholar] [CrossRef]
  7. Röst, H.L.; Rosenberger, G.; Navarro, P.; Gillet, L.; Miladinović, S.M.; Schubert, O.T.; Wolski, W.; Collins, B.C.; Malmström, J.; Malmström, L.; et al. OpenSWATH enables automated, targeted analysis of data-independent acquisition MS data. Nat. Biotechnol. 2014, 32, 219–223. [Google Scholar] [CrossRef]
  8. Tran, N.H.; Qiao, R.; Xin, L.; Liu, C.Y.; Zhang, X.L.; Shan, B.Z.; Ghodsi, A.; Li, M. Deep learning enables de novo peptide sequencing from data-independent-acquisition mass spectrometry. Nat. Methods 2019, 16, 63–66. [Google Scholar] [CrossRef]
  9. Bilbao, A.; Varesio, E.; Luban, J.; Strambio-De-Castillia, C.; Hopfgartner, G.; Müller, M.; Lisacek, F. Processing strategies and software solutions for data-independent acquisition in mass spectrometry. Proteomics 2015, 15, 964–980. [Google Scholar] [CrossRef]
  10. Bern, M.; Finney, G.; Hoopmann, M.R.; Merrihew, G.; Toth, M.J.; MacCoss, M.J. Deconvolution of mixture spectra from ion-trap data-independent-acquisition tandem mass spectrometry. Anal. Chem. 2010, 82, 833–841. [Google Scholar] [CrossRef]
  11. Li, Y.Y.; Zhong, C.Q.; Xu, X.Z.; Cai, S.W.; Wu, X.R.; Zhang, Y.Y.; Chen, J.N.; Shi, J.H.; Lin, S.C.; Han, J.H. Group-DIA: Analyzing multiple data-independent acquisition mass spectrometry data files. Nat. Methods 2015, 12, 1105–1106. [Google Scholar] [CrossRef]
  12. Peckner, R.; Myers, S.A.; Jacome, A.S.V.; Egertson, J.D.; Abelin, J.G.; MacCoss, M.J.; Carr, S.A.; Jaffe, J.D. Specter: Linear deconvolution for targeted analysis of data-independent acquisition mass spectrometry proteomics. Nat. Methods 2018, 15, 371–378. [Google Scholar] [CrossRef] [PubMed]
  13. Tada, I.; Chaleckis, R.; Tsugawa, H.; Meister, I.; Zhang, P.; Lazarinis, N.; Dahlén, B.; Wheelock, C.E.; Arita, M. Correlation-based deconvolution (CorrDec) to generate high-quality MS/MS spectra from data-independent acquisition in multisample studies. Anal. Chem. 2020, 92, 11310–11317. [Google Scholar] [CrossRef] [PubMed]
  14. Kall, L.; Storey, J.D.; Maccoss, M.J.; Noble, W.S. Posterior error probabilities and false discovery rates: Two sides of the same coin. J. Proteome Res. 2008, 7, 40–44. [Google Scholar] [CrossRef] [PubMed]
  15. Plumb, R.S.; Johnson, K.A.; Rainville, P.; Smith, B.W.; Wilson, I.D.; Castro-Perez, J.M.; Nicholson, J.K. UPLC/MS(E); a new approach for generating molecular fragment information for biomarker structure elucidation. Rapid Commun. Mass Spectrom. 2006, 20, 1989–1994. [Google Scholar] [CrossRef]
  16. Messner, C.B.; Demichev, V.; Bloomfield, N.; Yu, J.S.; White, M.; Kreidl, M.; Egger, A.S.; Freiwald, A.; Ivosev, G.; Wasim, F.; et al. Ultra-fast proteomics with Scanning SWATH. Nat. Biotechnol. 2021, 39, 846–854. [Google Scholar] [CrossRef]
  17. Meier, F.; Brunner, A.D.; Frank, M.; Ha, A.; Bludau, I.; Voytik, E.; Kaspar-Schoenefeld, S.; Lubeck, M.; Raether, O.; Bache, N.; et al. diaPASEF: Parallel accumulation–serial fragmentation combined with data-independent acquisition. Nat. Methods 2020, 17, 1229–1236. [Google Scholar] [CrossRef]
  18. Demichev, V.; Messner, C.B.; Vernardis, S.I.; Lilley, K.S.; Ralser, M. DIA-NN: Neural networks and interference correction enable deep proteome coverage in high throughput. Nat. Methods 2020, 17, 41–44. [Google Scholar] [CrossRef]
  19. Silva, J.C.; Gorenstein, M.V.; Li, G.Z.; Vissers, J.P.; Geromanos, S.J. Absolute quantification of proteins by LCMSE: A virtue of parallel MS acquisition. Mol. Cell. Proteom. 2006, 5, 144–156. [Google Scholar] [CrossRef]
  20. Chi, H.; Liu, C.; Yang, H.; Zeng, W.F.; Wu, L.; Zhou, W.J.; Niu, X.N.; Ding, Y.H.; Zhang, Y.; Wang, R.M.; et al. Open-pFind enables precise, comprehensive and rapid peptide identification in shotgun proteomics. Nat. Biotechnol. 2018, 36, 1059–1066. [Google Scholar] [CrossRef]
  21. Shao, G.; Cao, Y.; Chen, Z.L.; Liu, C.; Li, S.T.; Dong, M.Q. How to use open-pFind in deep proteomics data analysis?—A protocol for rigorous identification and quantitation of peptides and proteins from mass spectrometry data. Biophys. Rep. 2021, 7, 207–226. [Google Scholar]
  22. Yu, F.C.; Teo, G.C.; Kong, A.T.; Li, G.X.; Demichev, V.; Nesvizhskii, A.I. One-stop analysis of DIA proteomics data using MSFragger-DIA and FragPipe computational platform. Nat. Biotechnol. 2022. preprint. [Google Scholar] [CrossRef]
  23. Hou, X.H.; Zhou, P.Y.; Gong, P.Y.; Fu, J.L.; Liu, C.; Wang, H.P. Progress in data analysis methods for proteome mass spectrometry based on data-independent acquisition. Prog. Biochem. Biophys. 2022, 49, 2364–2386. [Google Scholar]
Figure 1. The workflow of the CorrDIA method.
Applsci 13 05969 g001
Figure 2. Isolation window in MS1.
Applsci 13 05969 g002
Figure 3. Different isotopic peak clusters and different charge states.
Applsci 13 05969 g003
Figure 4. Influence of different parameter settings on experimental results.
Applsci 13 05969 g004
Figure 5. The XIC consistency of precursor with its fragment ions.
Applsci 13 05969 g005
Figure 6. The XICs of the top 30 precursors and identification sequences before and after removing the isotopic peak cluster.
Applsci 13 05969 g006
Figure 7. (a) Venn diagram of peptide ions of HeLa dataset identified by CorrDIA and DIA-Umpire; (b) Venn diagram of peptide ions of human dataset identified by CorrDIA and DIA-Umpire.
Applsci 13 05969 g007
Figure 8. The Q-value curve of differential set part obtained by pFind.
Applsci 13 05969 g008
Table 1. The two-dimensional matrix used to calculate the cosine similarity.
F1F2F3Fm – 1Fm
P1corr(P1, F1)corr(P1, F2)corr(P1, F3)corr(P1, Fm – 1)corr(P1, Fm)
P2corr(P2, F1)corr(P2, F2)corr(P2, F3)corr(P2, Fm – 1)corr(P2, Fm)
Pn – 1corr(Pn – 1, F1)corr(Pn – 1, F2)corr(Pn – 1, F3)corr(Pn – 1, Fm – 1)corr(Pn – 1, Fm)
Pncorr(Pn, F1)corr(Pn, F2)corr(Pn, F3)corr(Pn, Fm – 1)corr(Pn, Fm)
Table 2. Database search parameters of MSFragger.
ParameterValue
Precursor tolerance±20 ppm
Fragment tolerance±20 ppm
Max variable mods3
Peptide length5–50
Peptide mass range100–5000
Filter1%
Table 3. The number of mass spectra and peptides by identified CorrDIA and DIA-Umpire.
MethodSpectraPeptideProportion
CorrDIA34,98928,36881%
DIA-Umpire33,99323,51369%
Table 4. The same identified sequence with a different precursor m/z, interpreted by CorrDIA and DIA-Umpire.
SequenceTheoretical m/zCorrDIA m/zDIA-Umpire m/z
ALVSGKPAESSAVAATEK572.64571.93571.63
QLQQAQAAGAEQEVEK864.43864.42863.42
VAVEEVDEEGK602.29601.79601.28
LDASESLR445.73445.23444.73
LYKEELEQTYHAK551.28550.61550.28
Table 5. The experimental m/z and theoretical m/z of the sequence identified by CorrDIA.
SequenceTheoretical m/zCorrDIA m/zChargeQ-Value
VKATNTQHAVEAIR513.29512.9230
WQYGDSAVGR380.18379.5130
GHYTEGAELVDSVLDVVR979.99979.9920
EALEAYR426.21425.7120
HIADLAGNSEVILPVPAFNVINGGSHAGNK753.65752.8940
Disclaimer/Publisher’s Note: The statements, opinions and data contained in all publications are solely those of the individual author(s) and contributor(s) and not of MDPI and/or the editor(s). MDPI and/or the editor(s) disclaim responsibility for any injury to people or property resulting from any ideas, methods, instructions or products referred to in the content.

