Article

Multi-Factor Analysis on the Stability of High Slopes in Open-Pit Mines

1
School of Civil and Resources Engineering, University of Science and Technology Beijing, Beijing 100083, China
2
State Key Laboratory for Geomechanics and Deep Underground Engineering, China University of Mining and Technology, Beijing 100083, China
3
BGRIMM Technology Group, Beijing 100160, China
*
Author to whom correspondence should be addressed.
Appl. Sci. 2023, 13(10), 5940; https://doi.org/10.3390/app13105940
Submission received: 17 March 2023 / Revised: 28 April 2023 / Accepted: 9 May 2023 / Published: 11 May 2023
(This article belongs to the Topic Geotechnics for Hazard Mitigation)

Abstract

:
During the production of open-pit mines, the stability of slopes can be affected by various factors such as structural surfaces, production blasting vibrations, and mining areas. In this study, the researchers focused on the slope of the open-pit mine at Yinshan and employed UAV mapping technology to conduct an on-site geological engineering investigation. Information on the yield, trace length, spacing, and density of the structural surface of the south slope was obtained. The researchers also carried out vibration blasting tests in combination with the production blasting activities in the mine to determine the blasting vibration attenuation law and whether the blasting vibration speed met safety specifications. Additionally, numerical simulation methods were used to examine the influence of the mining area on the stability of the current slope and the designed excavation slope. The slope stability was evaluated using the limit equilibrium method, and the researchers separately discussed the influence of self-weight load and self-weight load plus blasting vibration force on the stability of the high slope of the open pit. The results showed the following: (1) The rock mass structural plane in the south slope of the mining area was mainly dominated by a medium-large dip structural plane, and three faults and joint fissures in the investigation area combined to form cutting and sliding surfaces in the rock mass that were prone to collapse and sliding. (2) The maximum blasting vibration speed met safety requirements. (3) There was no large range of plastic zone damage in the entire slope, and the overall stability of the slope was good. (4) The present slope was relatively stable when considering only self-weight stress and the blasting vibration force. However, there was a certain risk of instability in the design of the excavation slope.

1. Introduction

With the increasing mining depth of medium and large open-pit mines, a number of high and steep slopes are inevitably formed. The stability of these slopes poses a huge hidden danger to the daily functioning of mines and to the safety of the lives and property of construction personnel [1,2]. There are many unfavorable factors affecting the safety and stability of open-pit mine slopes [3,4,5]. First of all, the traditional method of geological surveying requires manual standing at the foot of the open-pit slope and using geological survey tools such as a compass and measuring tape to measure and record on site, which requires the participation of many people and requires a large survey area, resulting in low survey efficiency. The general height of the slope of the open-pit mine is large, and the height of the slope after merging sections is often as high as 30 m, while manual measurements can only be carried out within a very limited range of 2–3 m at the top of the slope. The structural surface measured is not very representative. On-site surveyors stand under the slope for a long time, but the upper part of the slope is affected by high wind, self-weight, and production activities, and there is a risk of falling pumice, which poses a great threat to the safety of on-site surveyors, often impeding the ability to conduct geological investigations. Secondly, the risks posed to slope safety by blasting vibrations generated in the process of mine production cannot be ignored [6,7,8]. As open-pit mining becomes increasingly challenging, its mining costs are rising, prompting many mines to transition from open-pit mining to combined open-pit and underground mining. Underground mining destroys the original geological structure, and the influence of the leftover goaf on slope stability needs to be studied [9,10,11,12]. Therefore, it is necessary to study the influence of the goaf on slope stability. In conjunction with the current mining situation, the research and evaluation of mine slope stability is a major concern for ensuring the safety of mine production. By carrying out investigation and test analysis on the slope of the excavated area, the current slope stability situation and the potential landslide risk in the lower mining process are further analyzed and evaluated. This study provides beneficial recommendations and guidance for the subsequent safe working of the mine, and it makes a significant contribution to the safety, damage prevention, and control of the mine slope, as well as to efficient deep mining.
The study of slope stability is based on the study of the rock mass structure. The development degree of the structural plane seriously affects the stability of the slope rock mass. Although traditional geological survey methods, such as the survey line method and the window statistics method, are more accurate, the efficiency is low and the workload is large [13]. In order to solve these problems, the method of using three-dimensional laser scanning [14,15] and UAV mapping technology for geological surveying and structural plane information acquisition has gradually emerged; this method provides significant benefits to slope engineering geological surveys. Among them, aerial survey technology with small UAVs has been rapidly applied, and has a broad prospect of widely implemented applications in major engineering construction, mining resource development, land monitoring, disaster emergency and treatment, geological survey and mapping, digital city construction, et cetera [16,17,18]. In 2014, Yathunanthan Vasuki et al. [19] studied the measurement data of rock based on UAV aerial images and developed a photogrammetric dataset that can be used to generate the rock surface by UAV aerial images. C. Michele et al. [20] used UAV aerial images to generate a digital grid of the rock mass and obtained the geometric parameters of the grid, and further compared the differences between the geometric parameters collected by the UAV and the actual project. Jin et al. [21] obtained the digital elevation model of a slope by using UAV aerial photography and evaluated the stability of the slope model using FLAC3D 6.0 (Itasca Consulting Group, Minneapolis, MN, USA) software.
Most open-pit mines frequently produce blasting operations, and blasting seismic waves have a great impact on slope stability. A large number of experts and scholars have conducted relevant research on the impact of blasting vibrations on slopes. Zhou et al. [22] studied the influence of blasting amplitude and frequency on slope stability, based on the established slope instability mutation theory. Wu et al. [23] studied the safety control standard value of blasting vibrations through analyzing slope stability during blasting. Zhang et al. [24] discussed the weakening law of blasting damage based on the disturbance factor D value in the Hoek–Brown strength criterion, and they discussed the influence of the D value on the slope safety factor. Cui et al. [25] used PFC3D 6.0 (Itasca Consulting Group, Minneapolis, MN, USA) software to simulate the variation in internal cracks and the displacement of the slope with blasting height. With increases in mining depth, the operational costs of open-pit mines are also increasing. Most mines have changed from open-pit mining to underground mining or open-pit combined mining. The goaf left by underground mining seriously threatens the stability of the slope. Therefore, Yang et al. [26] conducted research based on the strength reduction theory and elastic plastic mechanics; they used FLAC3D software to study the influence of the underground goaf on slope stability. Li et al. [27] studied the influence of the goaf on the instability of red clay slopes using a numerical simulation and the limit equilibrium method. Sun et al. [28] explored the characteristics and evolution of slope slip under different mining sequence combinations of open-pit and underground combined mining. Shi et al. [29] carried out an analysis and evaluation of the potentially dangerous area division, slope stability characteristics, and isolation thickness of an open-pit slope according to the theoretical deduction of the goaf and the results of borehole detection.
A large number of experts and scholars have made fruitful studies on various factors affecting slope stability respectively, but due to the complex environment of open-pit mines, there are more factors that may cause slope instability, whether they are the preferred structure plane, production blasting vibration, or underground mining area. In order to solve this problem, all kinds of factors that may cause slope instability damage need to be analyzed.

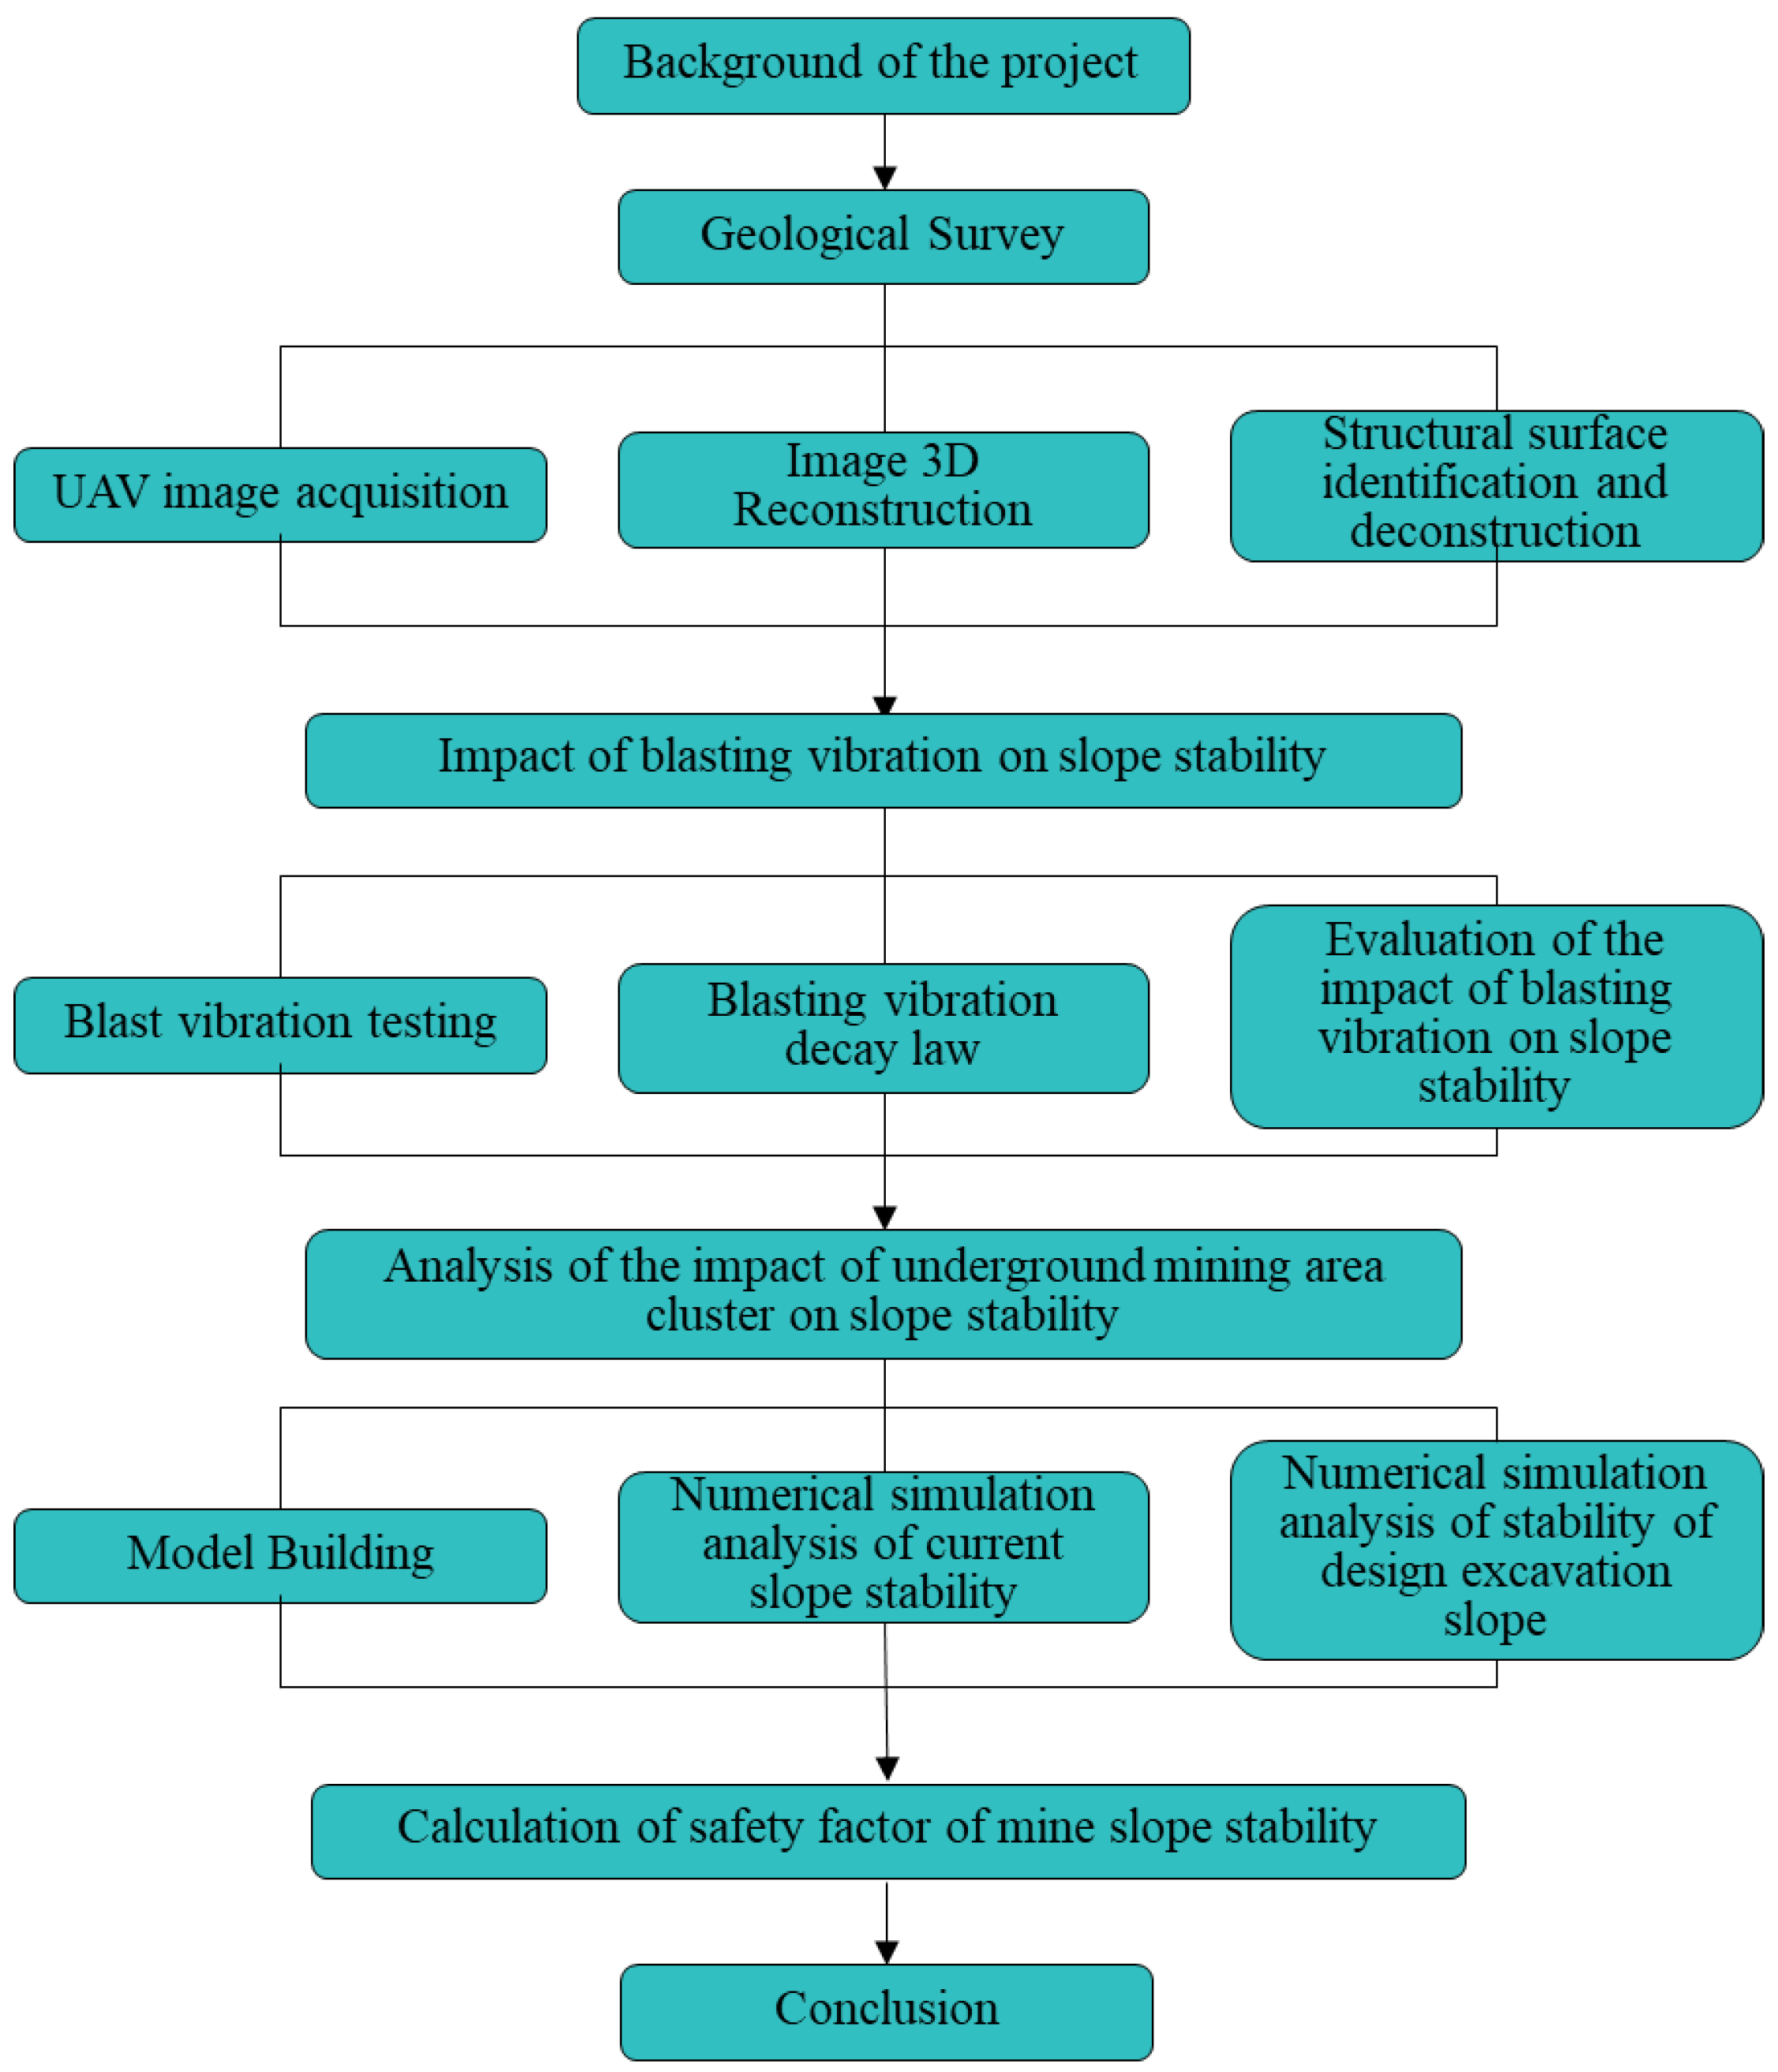
2. Background of the Project and Technical Route

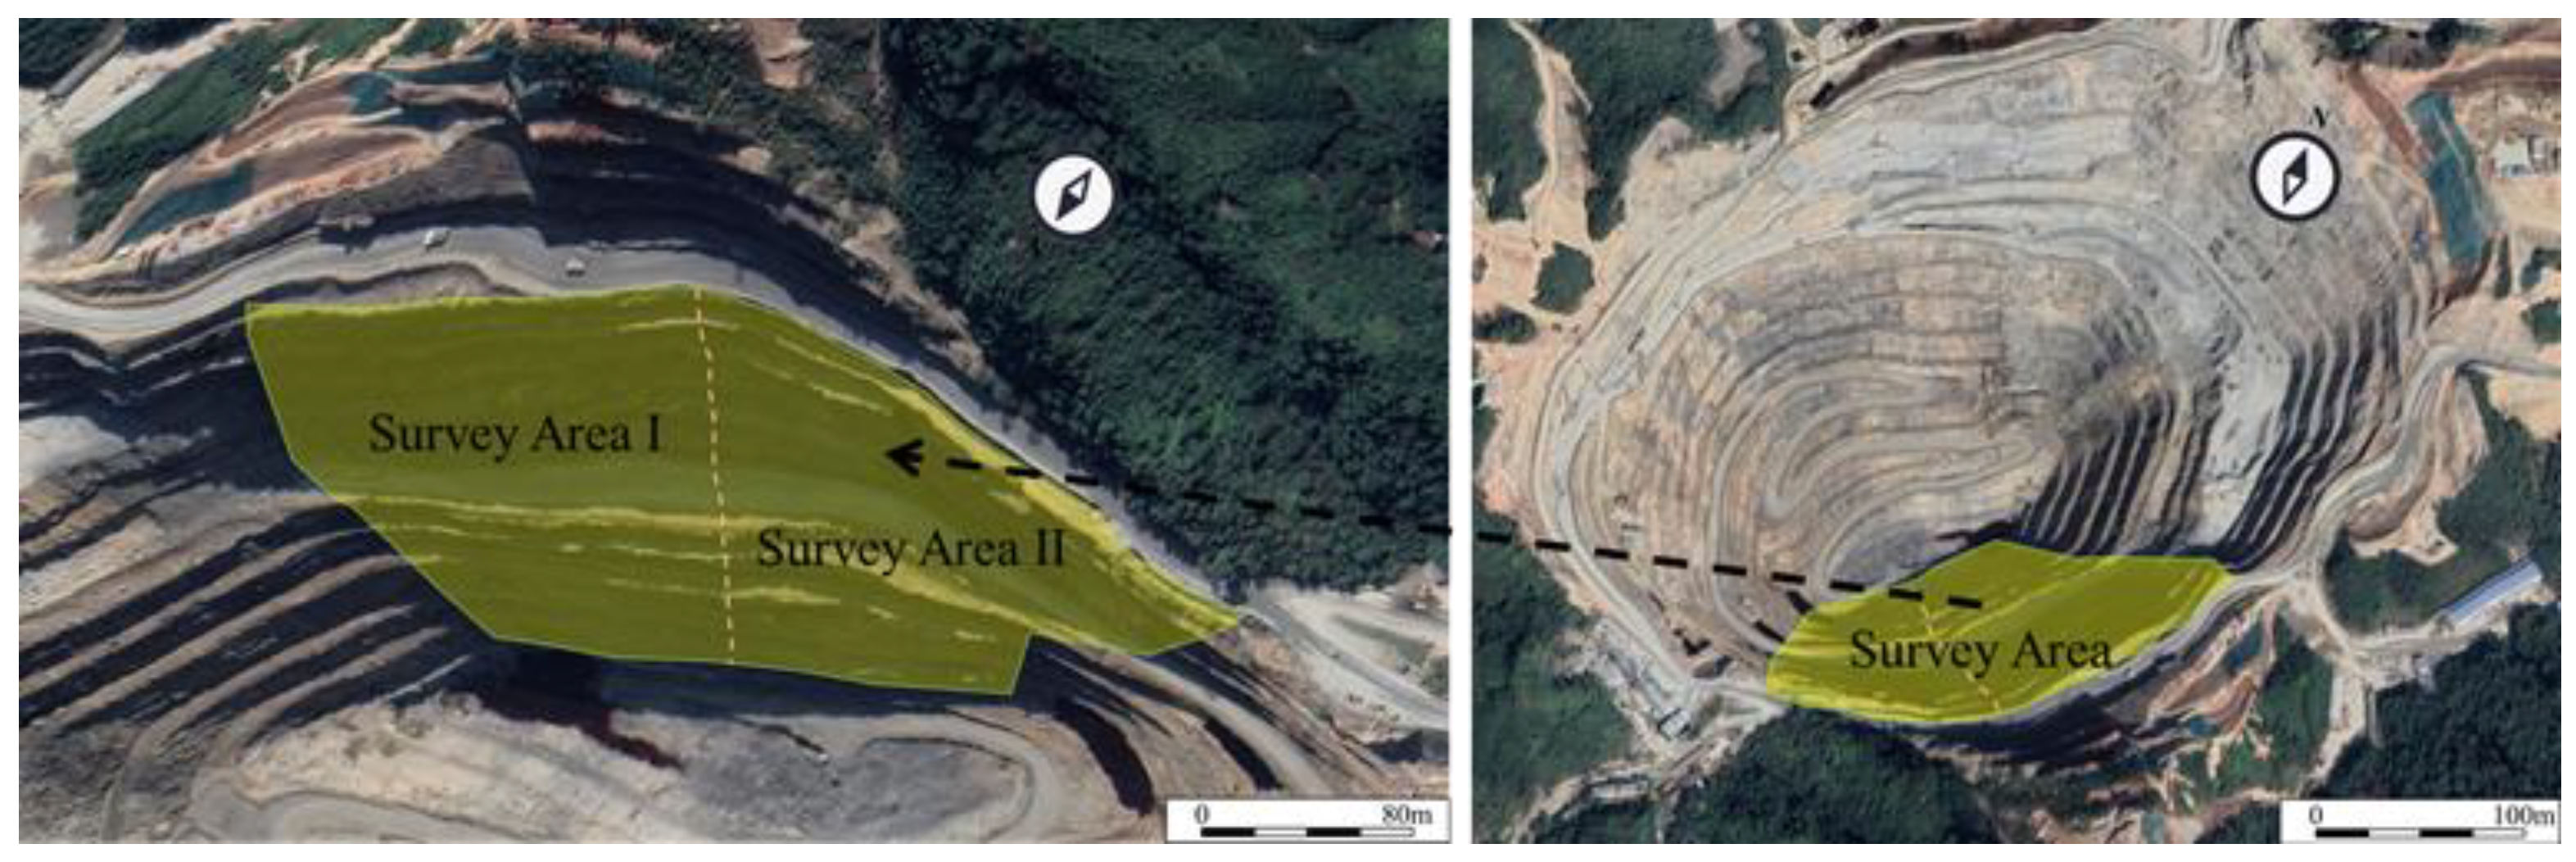
2.1. Overview of Regional Project

This study is based on the copper-gold open-pit mine in the ninth district of Yinshan Mining Co., Ltd., Jiangxi Copper Industry Group. The site is located in the northern suburbs of Dexing City, Jiangxi Province, at the northwest foot of the Damaoshan branch of the Huaiyu Mountains (Figure 1). It is a typical hilly mountain landform. The mining area is 2.7 km long from north to south and 2.15 km wide from east to west, with an area of about 4.36 km2 and a production capacity of 5000 t/d. The Neoproterozoic Zhangcun Group is widely exposed in the mining area, followed by the Mesozoic Lower Cretaceous Daguding Formation and a small amount of the Shixi Formation. The Zhangcun Group is the basement strata of the mining area, which is composed of metamorphic rocks. The Daguding Formation is a continental volcanic rock series covering the Zhangcun Group, which is distributed in the southwest of the mining area and near the Xishan crater. Its distribution is characterized by a northeast zonal distribution. The Zhangcun Group and the Daguding Formation are the main ore-bearing surrounding rocks in the mining area. The Shixi Formation is unconformably covered by the Zhangcun Group and the Daguding Formation, and a small amount is distributed in the southwest of the mining area. The main lithology of the mining area includes phyllite, quartz porphyry, and Quaternary residual deposits. Phyllite is the most important and widely distributed rock mass in the mining area, mainly comprising sericite phyllite and mixed with quartz. The quartz porphyry is a small dyke, which is nearly east–west to northeast-east, with an inclination angle of 80–90°, a length of 300–800 m, a width of 2–20 m, and a depth of more than 500 m. The Quaternary is the Quaternary residual slope and alluvial loose accumulation layer, widely distributed in the mining area. The lithofacies are mainly clay, mixed with breccia such as slate and phyllite, mostly gravel with a diameter of less than 2 cm. The surrounding rock of the ore body is mainly phyllite, quartz porphyry, and a small amount of dacite porphyry. The surrounding rock is relatively stable. The factors affecting the stability of the surrounding rocks are the development of phyllite schist and faults in local sections.

2.2. Technology Lines

The technical route of this study is shown in Figure 2.

3. Geological Survey

3.1. UAV Technology

Due to the influence of the geological structure and external conditions, a large number of fracture structural surfaces with different directions and scales are left in the rock mass. The fractured structural surfaces are the parts of the rock mass with the lowest strength and the weakest resistance to deformation, and their existence leads to significant weakening and strong anisotropy of the overall mechanical properties of the rock mass. Rock mechanics emphasizes that the deformation and damage of the rock mass is in general the deformation and damage of the structural faces and their networks, mainly through the tension and shear deformation of the structural faces. In order to fully understand the appearance quality as well as distribution state of rock joints in each area of the mine, and to derive the dominant orientation of structural face production in the investigated area, this paper uses UAV mapping technology to conduct on-site geological investigation of slopes. UAV mapping geological surveying is a new non-contact slope engineering geological survey method, the principle of which is to use a digital camera carried on the UAV to collect aerial images by remote control, and finally use professional interpretation software to interpret the collected images. Compared with conventional geological survey methods, the UAV mapping geological survey method has the advantages of high degree, low cost, and high safety. The flight platform used in this survey is a DJI brand (Shenzhen, China) Phantom 4 Pro V2.0 quadrotor UAV, the 20-megapixel FC6310 camera on the UAV is used for image acquisition, and the 3D reconstruction system based on Sfm algorithm is used to reconstruct the aerial images [30]. Finally, the 3D reconstructed point cloud model is used for intelligent recognition and information resolution of the structural surface [31] to obtain information on the yield, location, trace length, spacing, and density of the structural surface.

3.2. Scope and Content of the Survey

Due to the influence of the geological structure and external conditions on the south slope of the stope, historically, small landslides have occurred on the south slope in December 2014 and June 2016. Therefore, geological surveying work has been carried out in this area to gather information about its structural plane and to provide the basis for slope stability evaluation and future disaster prevention and control. The survey is divided into two areas, namely, survey area I and survey area II, as shown in Figure 3. The geological survey includes (1) the yield of the structural surface, including its tendency and dip angle, (2) the location and scale of the traces of the structural surface, and (3) the spacing and density of the structural surface.

3.3. Analysis Result

According to the on-site survey, the survey area was determined by the UAV mapping method, of which six ground control target sites were set up in the survey areas I and II. There were a total of eight steps in the effective area of the point cloud generated in area I, with a length of about 230 m and a height of about 180 m, and a total of seven steps in the effective area of the point cloud generated in survey area II.
The point cloud data of the investigation area I is shown in Figure 4. The numbers 1–9 in Figure 4 represent the number of faults or joints. Two large-scale interlayer faults have developed in the slope of survey area I, accompanied by several joint fissures. Fault 1 has an exposure length of about 120 m, and an occurrence of 290–320°∠45–55°. The lower part forms a wedge with joint 8 (335–355°∠60–70°, outcrop length of about 40 m), causing a rock landslide there. Fault 2 has an outcrop length of about 105 m, and the occurrence is 280–300°∠60–70°. We surveyed the lower part of the mud: a section about 2–3 m thick. The joints 3, 5, 6, and 9 are in the same group of joints: the occurrence is 295–320°∠50–60°, and the exposure length is 13 m, 18 m, 16 m, and 29 m, respectively. The joints 4 and 7 are in the same group of joints: the occurrence is 355–025°∠50–60°, and the exposure length is 10 m and 14 m, respectively.
The point cloud data of the investigation area II is shown in Figure 5. The numbers 1–3 in Figure 5 represent the numbers of faults or joints. A large-scale interlayer fault has developed in slope II of the survey area, accompanied by several joint fissures of the same occurrence. The exposure length of fault 1 is about 148 m, and the attitude is 300°∠50°. The exposure length of joint 2 is 57 m, and that of joint 3 is 60 m.
There are large faults with several joint fissures in investigation areas I and II, and the average joint spacing is about 5–30 m. The average joint density is 0.033–0.2/m. DIPS software was used to map the nodal strike rosettes of the two out survey areas, as shown in Figure 6.

4. Analysis of the Influence of Blasting Vibrations on Slope Stability

Blasting operations are frequent in most open-pit mining processes. The blasting of seismic waves is an important factor affecting slope stability. Due to the existence of structural planes in the rock and soil of the slope, when the vibration wave generated by blasting passes through the weak structural plane, the reflection of the vibration wave at the structural plane is enhanced, which may cause the slope to be destroyed at the structural plane. On the other hand, the blasting vibration wave exerts a dynamic load on the weak structural plane. When the load exceeds the bearing capacity of the structural plane, the slope is destroyed. At the same time, due to the heterogeneity and discontinuity of the slope rock mass, the vibration wave causes a certain relative displacement of the internal structure of the slope rock mass, which then causes the slope to be destroyed.

4.1. Blasting Vibration Test

4.1.1. Testing Method

Usually, the bumping and shaking of all nearby objects caused by blasting is called the blasting seismic effect. When the distance is more than 150 times the radius of the explosive package, the intensity of the vibration wave caused by the blasting is weakened; this means that the particles can only undergo elastic vibration and cannot cause rock mass damage. This is called an elastic wave. A seismic wave is an elastic wave, which is composed of a body wave and a surface wave. The body wave is divided into a longitudinal wave and a transverse wave. The longitudinal wave has the characteristics of low amplitude, short duration, and high speed, while the transverse wave has a long duration, and its amplitude is larger than that of the longitudinal wave. The surface wave is formed by the multiple reflection and superposition of the body wave on the free surface. Its propagation speed is slower than that of the body wave, but the carrying energy is larger. The seismic damage caused by blasting is mainly the effect of a surface wave. When the distance is short, the longitudinal wave, shear wave, and surface wave arrive almost at the same time, so it is difficult to identify the type of wave. When the distance is large, the three waves begin to separate, and can therefore be identified, and then the parameters of the blasting vibration are determined. This vibration monitoring was conducted using the Mini series blasting vibration meter (Figure 7) produced by Chengdu Tai Ce Technology Co., Ltd., (Chengdu, China) which facilitates the online monitoring of blasting vibration velocity and frequency.

4.1.2. Vibration Test Scheme Design

According to the time sequence of on-site production blasting, the blasting vibration monitoring is divided into four blasting areas: A, B, C, and D. Five monitoring points are set up in each blasting area. The blasting area and vibration monitoring points are shown in Figure 8.
The center coordinates of each blasting area are shown in Table 1. The coordinate system used for all coordinates in Table 1 is China Geodetic Coordinate System 2000 (CGCS2000), and the unit of coordinates is m. The blasting area A is located on the −36 m platform on the north side of the stope, and its maximum one-stage charge is 410 kg. The vibration parameters of blasting area A are monitored by the A1–A5 vibration points. The blasting area B is located on the −48 m platform on the southwest side of the stope. The maximum one-stage charge is 250 kg. The vibration parameters of blasting area B are monitored by the B1-B5 vibration points. The blasting area C is located on the −48 m platform on the east side of the stope. The maximum one-stage charge is 400 kg. The blasting area D is located on the −60 m platform on the east side of the stope. The vibration parameters of blasting area C and blasting area D are monitored by the C1–C5 vibration measuring points. The coordinates of each vibration point are shown in Table 2.

4.1.3. Blasting Vibration Monitoring Results

According to the Technical Code for the Safety Monitoring of Slopes of Metallic and Non-metallic Open-Pit Mines (AQ2063-2018), the monitoring points of blasting vibration velocity should be set at the foot of the slope in the main sliding direction of the slope, and there should be more than three monitoring points. The velocity of the particle in the three directions of X, Y, and Z should be monitored at the same time, and the maximum value in the three directions should be taken as the maximum value of the particle. Monitoring accuracy should be less than 0.001 cm/s. After monitoring, 13 groups of effective data for the peak vibration velocity, acceleration, and main vibration frequency of the particles were obtained. The monitoring results of each blasting vibration are shown in Table 3.
For specific seismic wave propagation conditions, the particle vibration velocity is related to the charge weight and the distance from the particle to the center of the explosion source. The relationship of peak particle vibration velocity with charge weight, distance, site factor K, and the attenuation index α conforms to Sadaovsk’s formula:
V = K ( Q 1 3 R ) α = K ρ α
In Formula (1), V is the peak vibration velocity of particle, and the unit is cm/s. Q is the amount of explosive, and the unit is kg. R is the distance between the measuring point and the center of the explosion source, and the unit is m. K is a coefficient related to rock properties, blasting methods, and other factors, namely the site factor. α is the seismic wave attenuation index, related to geological conditions. ρ is the proportional dose.
Because V and ρ in the above attenuation formula are not linear, it is necessary to convert the formula into a linear relationship for regression, so as to obtain the corresponding K and α values. By taking logarithms on both sides of the equal sign of the formula, the following linear form is obtained:
l g V = α l g ρ + l g K
When the effective data are sufficient, the above equation is regressed by the least square method of mathematical statistics.

4.2. Evaluation of the Influence of Blasting Vibrations on Slope Stability

After eliminating the obvious data noise, the least square method is used to analyze Equation (2), and the coefficient K and attenuation coefficient α, which are related to the terrain and geological conditions between the blasting point and the measuring point, are fitted. The fitting results are shown in Figure 9. The site coefficient K = 328.02 and the attenuation index α = 1.809 are calculated. The formula for the vibration velocity attenuation of blasting vibration particles in the monitoring area of the Yinshan Mine is:
V = 328.02   ×   ( Q 3 R ) 1.809
Three blasting vibration tests were carried out on the blasting vibration measuring points. The following conclusions are drawn from the analysis. According to China‘s “Technical Code for Non-coal Open-pit Slope Engineering” (GB51016-2014) and Technical Code for Safety Monitoring of Slope of Metallic and Non-metallic Open-Pit Mines (AQ2063-2018), the particle vibration velocity of the slope should be less than 24 cm/s. According to the monitoring results, the maximum one-stage charge of the three blastings is 410 kg, and the maximum blasting vibration is measured to be 7.8745 cm/s in the vertical direction (vector combined velocity 8.8547 cm/s), which meets the requirements of the safety specifications.

5. Analysis of the Influence of the Underground Goaf Area Group on Slope Stability
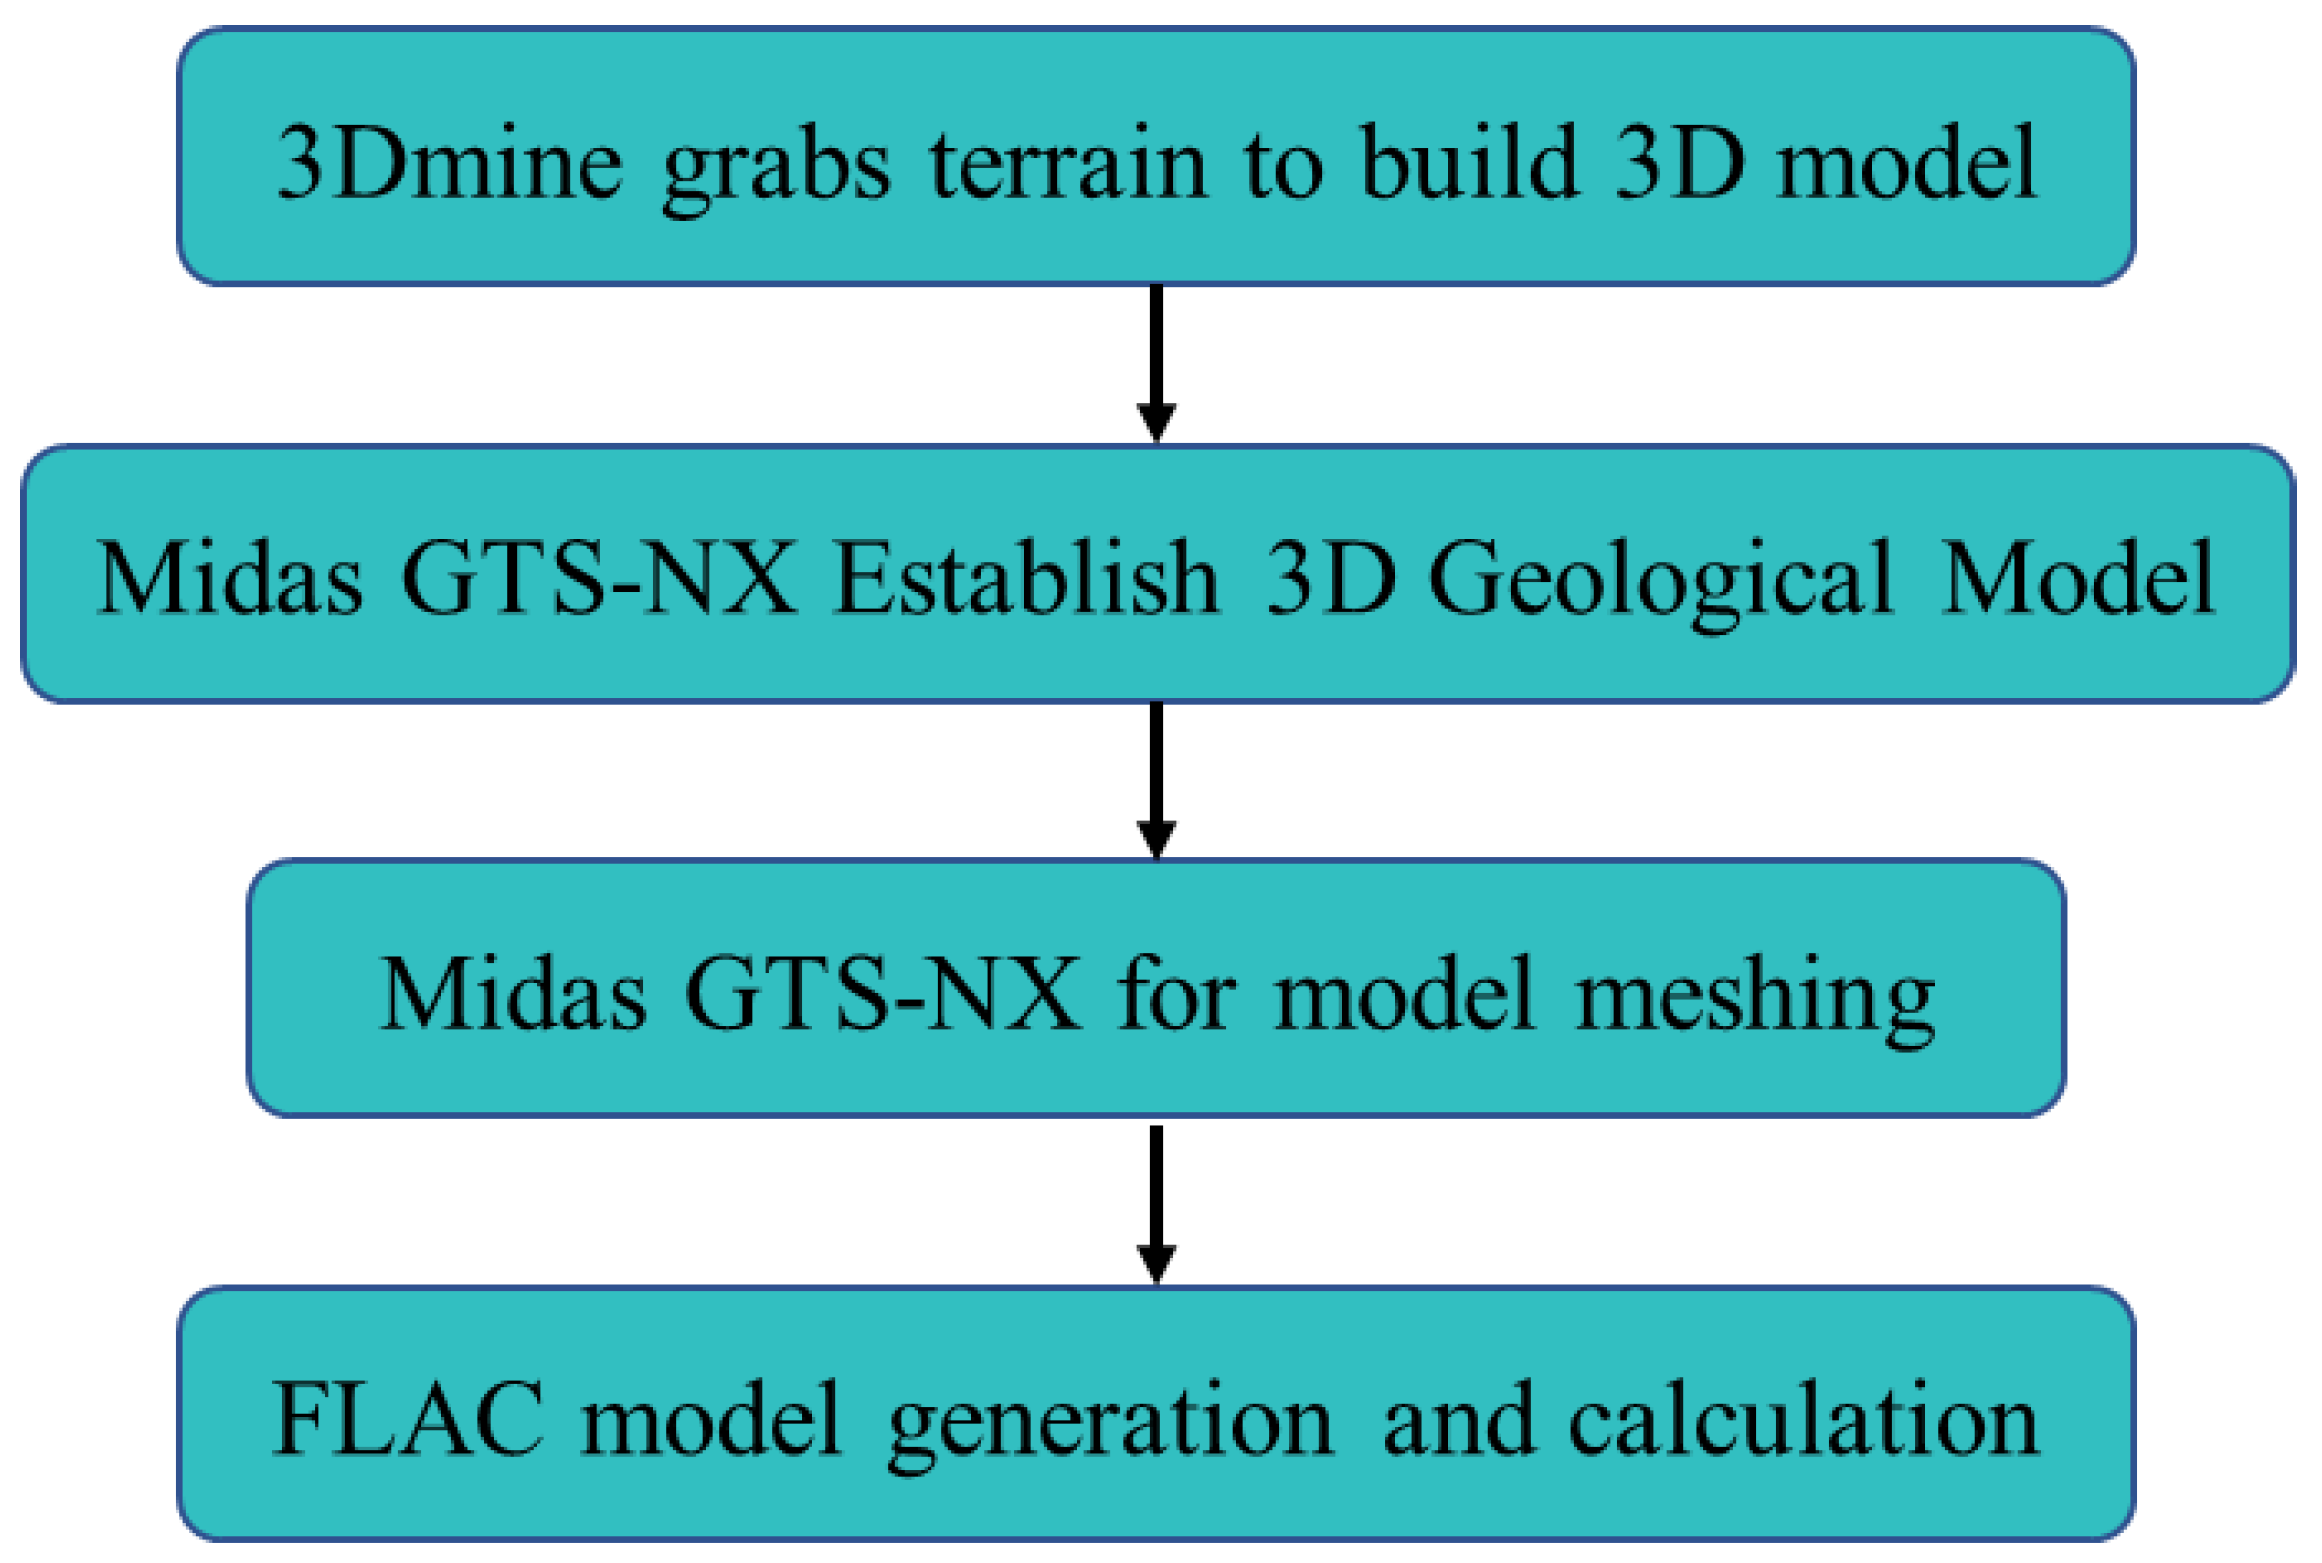
5.1. Model Building

Due to the increasing depth of mining and the increasing difficulty of mining in large and medium-sized open-pit mines at home and abroad, the cost of open-pit mining has also increased. Therefore, more and more open-pit mines have begun to shift from open-pit mining to a combination of open-pit mining and underground mining. Underground mining is carried out above a certain mining depth, and open-pit mining is still used below the depth. The influence of the goaf left by underground mining on the stability of the slope cannot be ignored. The mined-out area near the slope of the Yinshan open-pit mine is mainly distributed in the south of the stope, which contains a total of thirteen partitions. The maximum width of the mined-out area is about 3 m, the maximum length is about 75 m, and the maximum height is about 35 m. In order to study the influence of the mined-out area on the slope stability of the Yinshan Mine, this chapter uses 3Dmine 2021 (Beijing, China) mining engineering software and Midas GTS NX 2021 (Seoul, Republic of Korea) software to complete the establishment of a three-dimensional slope model. The three-dimensional model is shown in Figure 10. FLAC3D three-dimensional numerical simulation software is used to analyze the influence of the mined-out area on the stability of the Yinshan open-pit slope under the conditions of the mined-out area group. FLAC3D is a fast 3D Lagrangian analysis program that uses explicit Lagrangian algorithms and hybrid discrete partitioning techniques to simulate the 3D mechanical properties of geotechnical or other geotechnical materials [32]. The analysis process is shown in Figure 11.
Considering the size effect, the size of the calculation model is 800 m × 1410 m × 774 m, and a total of 181,272 nodes and 1,032,056 meshes are generated. The final calculation model is shown in Figure 12. The calculation is divided into two phases: on the one hand, the influence of the goaf on slope stability under the current slope conditions is analyzed, while on the other hand, the influence of the goaf on slope stability in the later mining process is analyzed. Since the mined-out area group is located in the southern slope of the stope, the main control lithology is quartz porphyry and phyllite, so the numerical calculation model strata are dominated by these two kinds of lithology. The mechanical parameters of the rock mass are shown in Table 4.
The model calculation considers the self-weight stress field and the initial stress in the three directions of X, Y, and Z according to the ratio of horizontal stress to vertical stress, and it solves the equilibrium under this condition. According to the selected mechanical parameters of rock mass, the elastic constitutive model is used to quickly balance the model. After the initial stress field is formed by solving the balance, the displacement is initialized, and then the Mohr–Coulomb constitutive model is used to complete the balance again. After that, the Null constitutive model is used for the subsequent excavation calculation. The boundary conditions are set as follows: the top of the model is a free surface, with normal constraints applied to the surrounding boundaries and full constraints applied to the bottom.

5.2. Numerical Simulation Analysis of Slope Stability

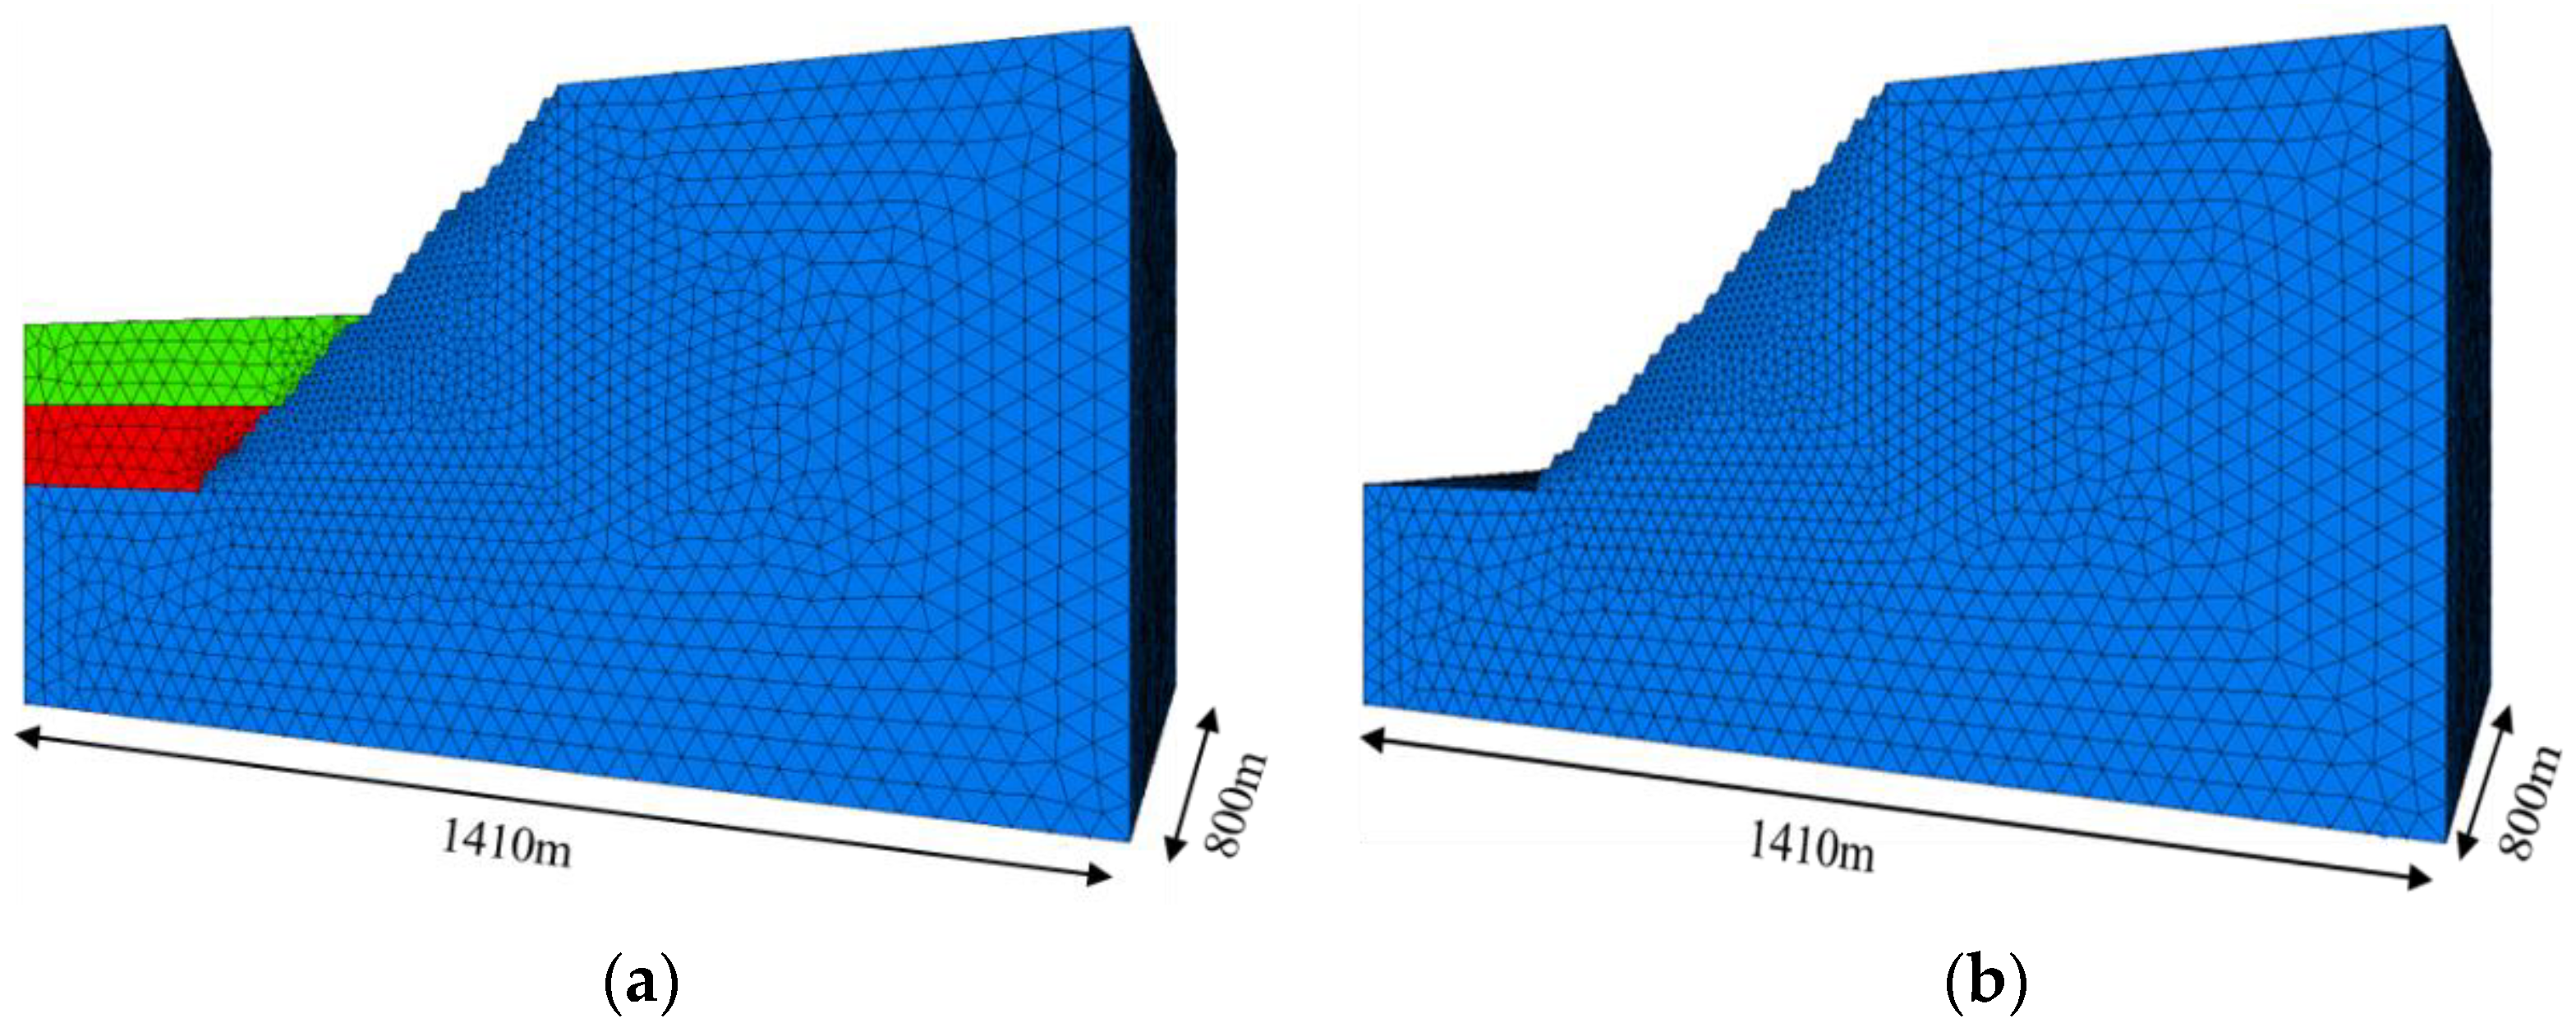
5.2.1. Numerical Simulation Analysis of the Current Slope Stability

Because there are many existing mined-out areas, the relative position of each mining area to the slope of the quarry is not the same, and the interaction between the mined-out areas and the influence degree of each mined-out area on the slope stability is not the same. This paper mainly studies the mined-out areas H and I, which have the most obvious influence on the current slope and the designed excavation slope.
The numerical calculation results of the profile of the current slope H mining hollow area and I mining hollow area are shown in Figure 13. The existence of I mining hollow area above H mining hollow area makes the plastic zone around the upper left corner of H mining hollow area extend upward to the bottom of the current slope, and the overall stability of the slope is less affected by the plastic zone penetration. However, in order to avoid further inducing the plastic zone to be penetrated in a large scale in the later mining, the mining area measures should be advanced to deal with the mining hollow area I and H, focusing on the stability of the upper left area of the H mining hollow area. From the vertical displacement cloud map, it can be seen that the vertical displacement gradually increases from the inside of the slope to the slope surface, and the displacement from the top of the slope to the foot of the slope also gradually increases. The maximum vertical displacement of the slope surface appears at the broken foot of the slope, which is 7 cm, and the impact of H and I mining areas on the internal displacement of the slope is limited. There is no large vertical displacement around the two mining areas.

5.2.2. Design Excavation Slope Stability Numerical Simulation Analysis

The results of the numerical calculation of the profile of H and I mining area of the design excavation slope are shown in Figure 14. The H and I mining areas interact with each other, making a plastic zone appearing around the two mining areas, and the plastic zone extends upward and penetrates the step slope. The plastic zone gathers at the foot of the design excavation slope, while the plastic zone does not appear or appears in a small amount at other locations. The vertical displacement of the designed excavation slope has increased compared with the current slope, and the maximum displacement appears at the slope surface near the foot of the slope, reaching 10 cm.

6. Safety Factor Calculation for the South Slope of the Open Pit

6.1. Stability Analysis Method

The limit equilibrium analysis method is one of the most commonly used methods for slope stability research. The limit equilibrium method includes the Fellenius method, the simplified Bishop method, the simplified Janbu method, and the Spencer method. The technical code for building slope engineering (GB50330-2013) recommends the simplified Bishop method for calculating slope stability. At the same time, a large number of practices have proved that the Bishop method has high accuracy, and it has become the most popular safety factor calculation method in engineering. Therefore, this paper uses the simplified Bishop method to analyze the slope stability of each partition of the Yinshan open-pit mine, using Rocscience Slide 6.0 software (Toronto, ON, Canada).

6.2. Calculation Load Combination and Calculation Method

According to the specific conditions of the Yinshan open-pit mine, two load combinations were analyzed and designed for this slope analysis. Load combination I is the self-weight of the slope, and load combination II is the self-weight of the slope + the blasting vibration force. In this analysis, the horizontal blasting vibration force of each slice can be calculated according to the following formula:
F i = α i β i W i g
α i = 2 π f V i
In Formulas (4) and (5), F i is the horizontal equivalent static of the blasting vibration force in kN. α i is the maximum horizontal acceleration of the blasting vibration particle in m/s2, its value is shown in Table 5. β i is the blasting vibration force coefficient, which may take values from 0.1–0.3. W i is the weight of the slice in kN. g is the gravitational acceleration in m/s2. f is the blasting vibration frequency in Hz. V i is the horizontal vibration velocity of the particle at the center of gravity. The calculation method is shown in Formula (1), and the unit is m/s.
When considering the influence of blasting vibration force in slope stability software calculations, it is necessary to determine the influence coefficient of the blasting vibration force level ε   :
ε = α i β i g
According to the calculation of the blasting vibration test results, the average blasting vibration force level influence coefficient of each zone is between 0.01 and 0.03, and the maximum value of 0.03 is used to calculate the slope stability under the action of the blasting vibration force.

6.3. Safety Factor Calculation of Mine Slope Stability

The section selected for the calculation of the safety factor of the mine slope is shown in Figure 15. The calculated safety factor of the current slope is shown in Figure 16. The safety factor of the designed excavation slope is shown in Figure 17. The calculated safety factor and the planned excavation slope parameters are shown in Table 6. According to the relevant provisions of China’s Non-ferrous Metal Mining Design Specification (GB50771-2012) and Technical Specification for Slope Engineering of Non-Coal Open-Pit Mines (GB51016-2014), safety factor 1.20 is selected as the design stability safety factor. Combining the above limit equilibrium calculation results, it can be seen that:
(1)
The safety factors of the current slope under combined load I and load combination II are 1.473 and 1.409, respectively, which meet the requirements of safety factor 1.20 specified in the code, meaning that the overall slope is stable.
(2)
The safety factor of the designed excavation slope is 1.130 when only the self-weight load is considered, and the safety factor after considering the self-weight load and blasting vibration is 1.081, which does not meet the requirements of the safety factor of 1.20. Because of the final slope angle or slope height in this area, and because faults and goafs occur under some slopes in this area, there is a certain risk of instability.
(3)
The bottom of the final slope of the Yinshan open-pit mine is affected by the fault and the original underground mined-out area. The slope rock mass structure is broken, and prone to wedge failure and local collapse.

7. Discussion

This paper presents the results of a geological survey conducted on the southern slope of the open-pit slope of the Yinshan Mine, utilizing UAV mapping technology and the digital structural surface recognition method. Additionally, a production blasting vibration test was performed to analyze the influence of blasting vibration on the rock mass of the slope. Using FLAC3D software, the impact of the underground goaf on the stability of the slope was analyzed, and the limit balance analysis method was applied to evaluate the status quo of the open-pit slope and the stability of the design excavation slope. The following results were obtained:
(1)
The southern slope of the mining area primarily exhibits a medium-large inclination angle structural surface. The development of thousands of rock fragments in each area was traced from the statistical results of joint fractures in the entire measurement site, where the average joint spacing was found to be 5–30 m, and the average joint density was 0.033–0.2/m.
(2)
A total of three blasting vibration tests were conducted using the blasting vibration monitoring system, in accordance with the specification. Based on the monitoring results, the maximum one-stage charge of the three blasts was 410 kg, and the measured value did not exceed 24 cm/s. The analysis of the measured data allowed for the blasting vibration attenuation law for the Yinshan Mine to be obtained, and the vibration velocity attenuation law formula was fitted.
(3)
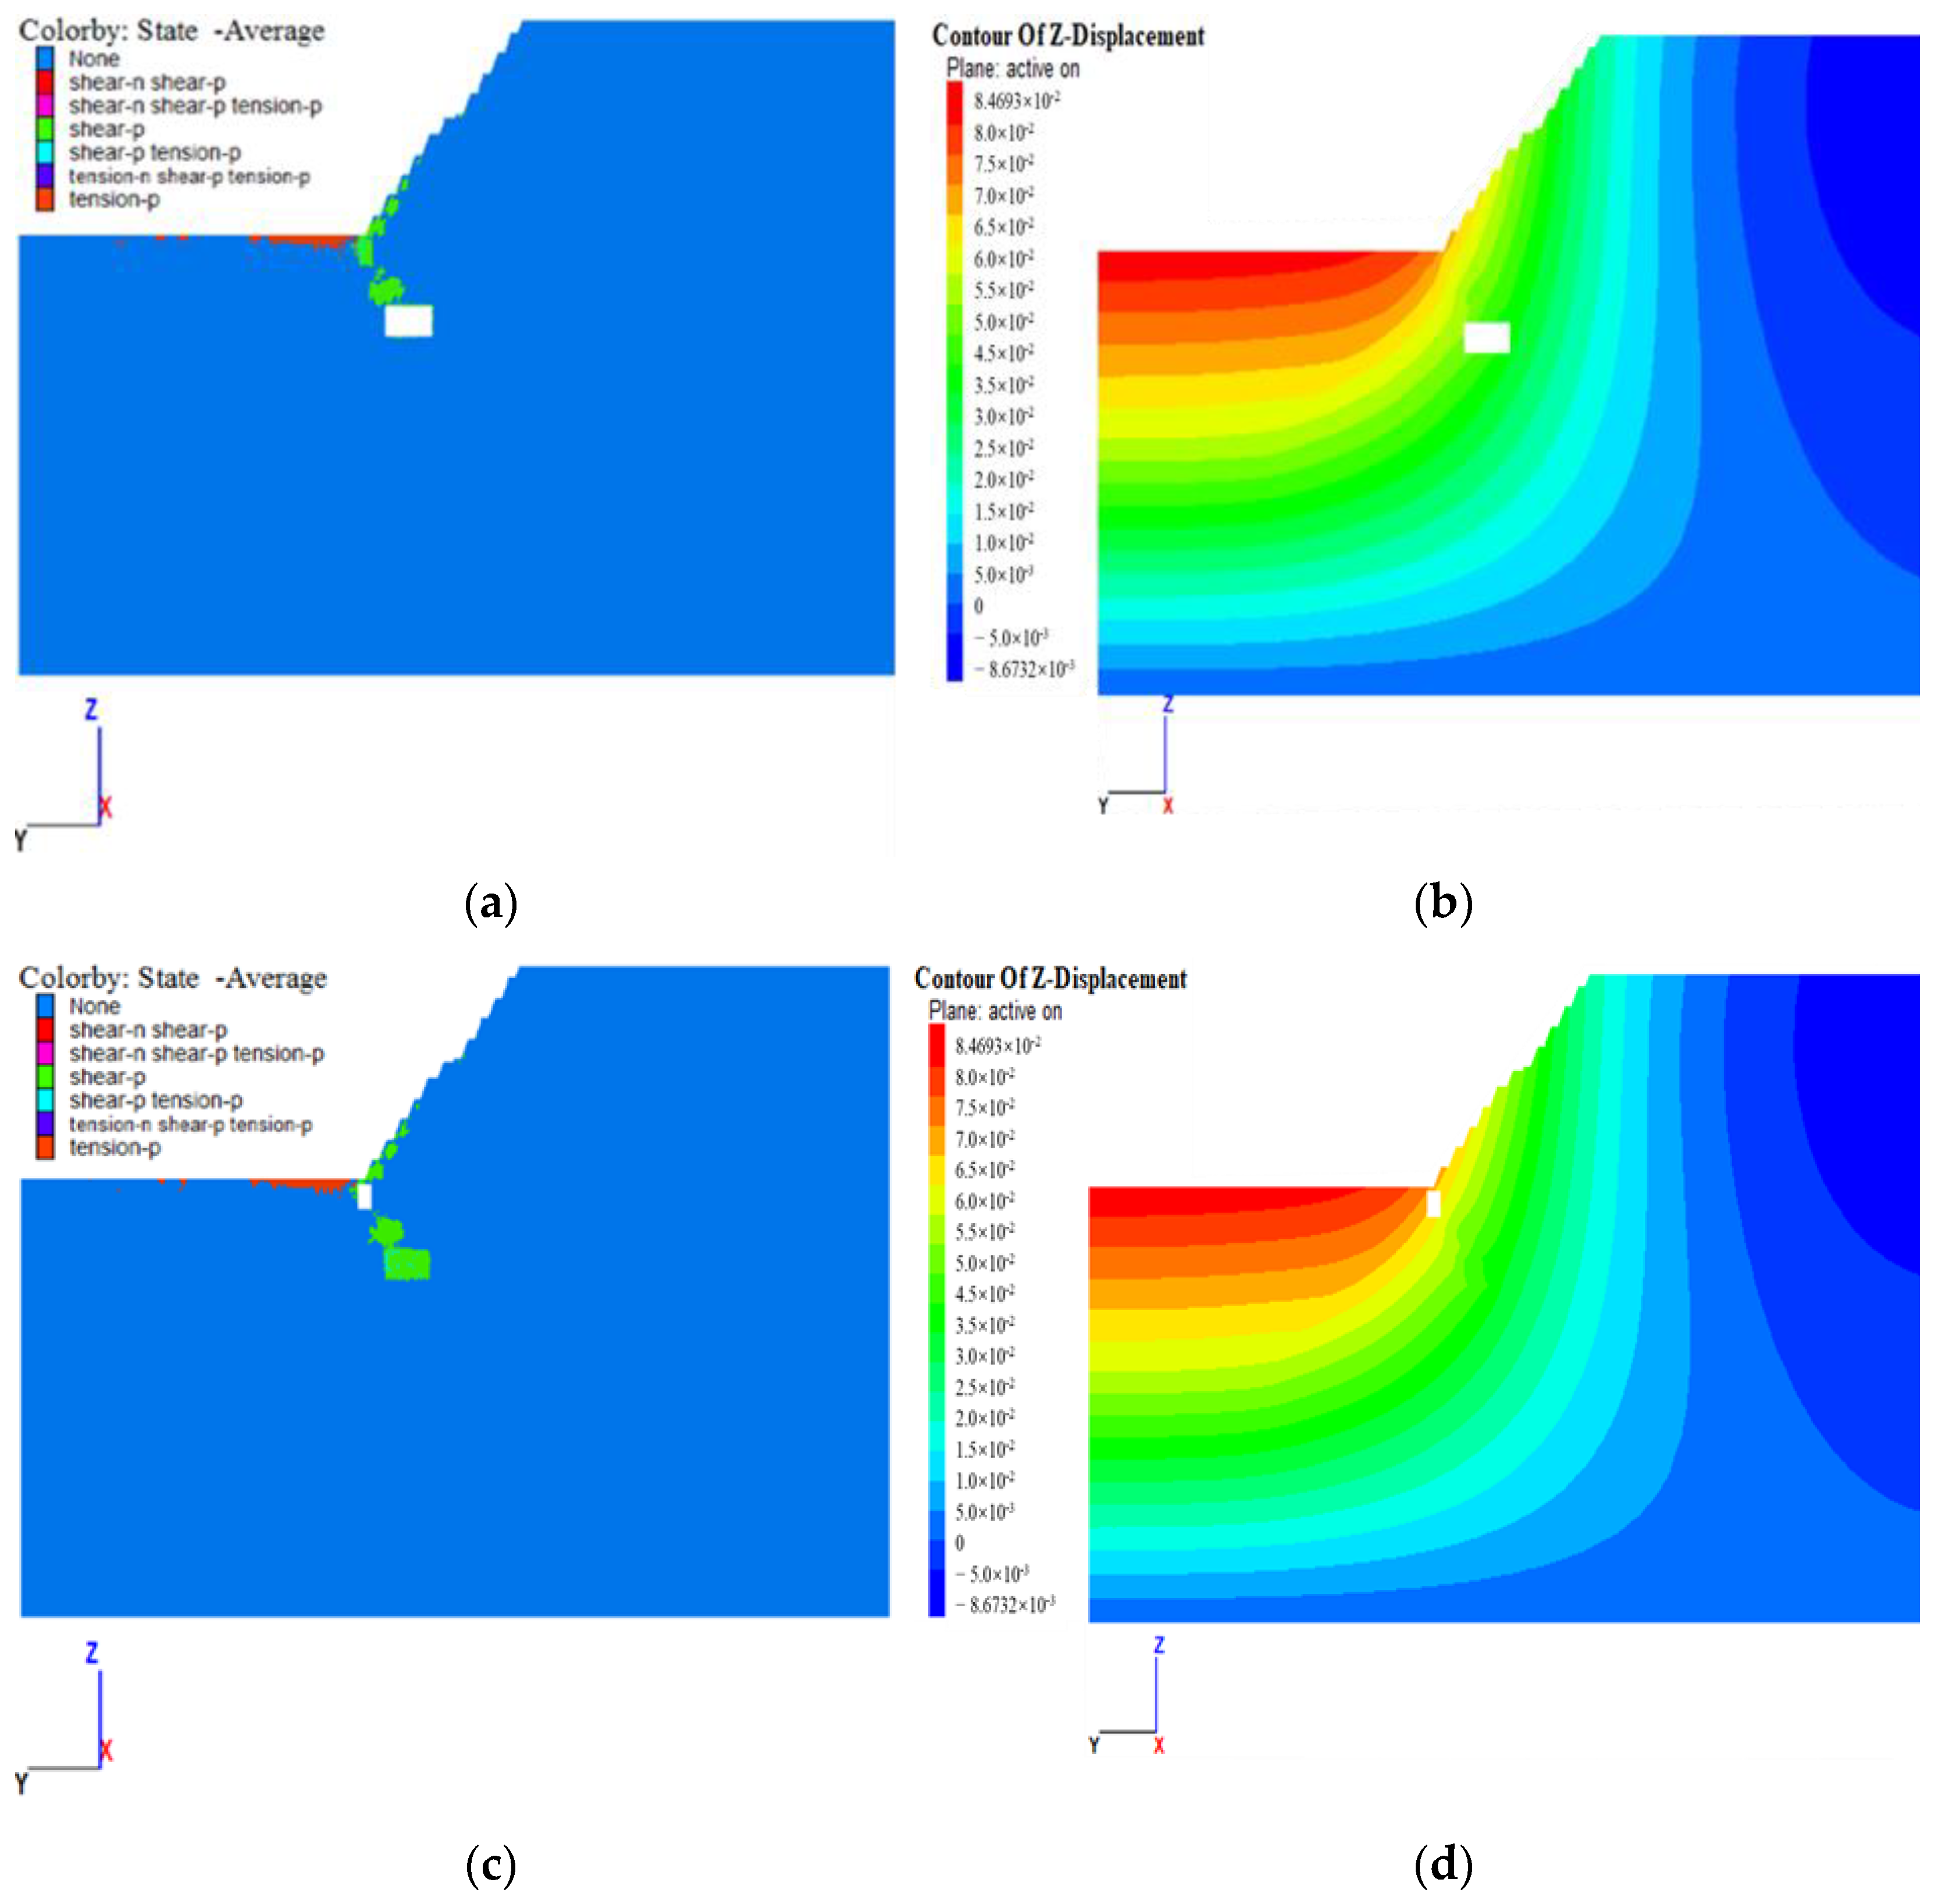
According to the three-dimensional finite element analysis, the entire slope exhibits no large range of plastic zone damage, with only a small range of plastic zone generated on the step slope above the location of the empty area, which is mainly shear failure.
(4)
A typical section was selected to carry out the limit equilibrium analysis. Load combination I (considering only the self-weight stress) and load combination II (which includes the blasting vibration force) of the current slope meet the safety factor of 1.20, and the overall slope is stable. However, the designed excavation slope is near the critical value of the safety factor specified in the code under the conditions of load combination I and load combination II, and, thus, poses a certain risk of instability.

8. Conclusions and Recommendations

In this paper, we analyzed the engineering geology of the mining area of Yinshan open pit in detail, and carried out on-site engineering geological investigation work by using small low-speed UAV and image reconstruction and interpretation. We carried out a production blasting vibration test in the Yinshan Mine, obtained the blasting vibration attenuation law, and analyzed the impact of blasting vibration on the slope rock. We analyzed the stability of the slope of the mining site by using FLAC3d software and the limit equilibrium method. Based on the analysis of the data, the following conclusions and recommendations were made on the stability of the south slope of the open pit of the Yinshan Mine:
(1)
The main lithology of the mining area includes phyllite, quartz porphyry, and Quaternary residual deposits. The rock integrity of the slope ranges from “broken” to “more complete”. There are three faults in the geological investigation area, which are combined with joints and fissures, constituting cutting and sliding surfaces in the rock mass, and easily forming wedges and other conditions favorable to collapse and sliding. It is suggested to pay close attention to the distribution of the newly revealed fault fragmentation zone and dense structure surface, further analyze and summarize the destabilization and damage characteristics of the slope, and, if necessary, take reinforcement measures for the potentially dangerous slope body or partially slow down the slope.
(2)
The maximum one-stage charge of the three blasts was 410 kg, and the maximum blast vibration was measured as 7.8745 cm/s in vertical direction (vector combined velocity 8.8547 cm/s), which did not exceed 24 cm/s and met the safety requirements. It is recommended that pre-cracking blasting and light surface blasting technology should be used when blasting against the gang slope adjacent to the final boundary of the quarry or the permanent slope, optimizing blasting parameters and further strengthening the research on vibration reduction control technology.
(3)
According to the results of numerical simulation analysis, the top plastic zones of mining area H and mining area I are penetrated with the upper step slope, suggesting that damage may occur to the slope at local locations due to the impact of the mining area. The influence of the dense area of the empty zone is more obvious. According to the result of the ultimate equilibrium analysis, the current slope meets the requirements of the safety code when considering only the self-weight and taking into account the blasting vibration force load, and the slope stability is good. However, the design excavation slope is close to the critical value of the safety coefficient specified in the code under both combinations of load, and there is the risk of instability. It is suggested that the final slope angle of some slopes should be optimally adjusted during the design mining process, and relevant technical measures should be taken to over-detect and timely deal with the potential mining void area to effectively guarantee production safety.

Author Contributions

Software, P.L. and X.Q.; Investigation, C.W.; Writing—original draft, H.C. and G.M.; Writing—review & editing, J.L. All authors have read and agreed to the published version of the manuscript.

Funding

This research was funded by the Fundamental Research Funds for the Central Universities, grant number 06500229.

Institutional Review Board Statement

Not applicable.

Informed Consent Statement

Not applicable.

Data Availability Statement

The original contributions presented in the study are included in the article. Further inquiries can be directed to the corresponding authors.

Conflicts of Interest

The authors declare no conflict of interest.

References

  1. Yang, T.H.; Zhang, F.C.; Yu, Q.L.; Cai, M.F.; Li, H.Z. Research situation of open-pit mining high and steep slope stability and its developing trend. Rock Soil Mech. 2011, 32, 1437–1451+1472. [Google Scholar] [CrossRef]
  2. Du, S.G. Method of equal accuracy assessment for the stability analysis of large open-pit mine slopes. Chin. J. Rock Mech. Eng. 2018, 37, 1301–1331. [Google Scholar] [CrossRef]
  3. Yang, T.H.; Wang, H.; Dong, X.; Liu, F.Y.; Zhang, P.H.; Deng, W.X. Current situation, problems and countermeasures of intelligent evaluation of slope stability in open pit. J. China Coal Soc. 2020, 45, 2277–2295. [Google Scholar] [CrossRef]
  4. Zhong, C.B.; Zhou, Y.M.; Gao, P.T. The Influencing Factors and Control of Slope Stability in Open-pit Mine of Qinghai-Tibet Plateau. Saf. Coal Mines 2012, 43, 203–206. [Google Scholar] [CrossRef]
  5. Wang, J.Q.; Li, J.; Li, Q.; Chen, L. Analysis of influence factors of high slope stability of loess: Taking the Baojixia Water Division Project for example. Rock Soil Mech. 2009, 30, 2114–2118. [Google Scholar] [CrossRef]
  6. Sun, P.C.; Lu, W.B.; Lei, Z.; Chen, M.; Li, R.Z.; Li, F.Q. Blasting vibration response and control of high rock slopes of thin mountain. Chin. J. Geotech. Eng. 2021, 43, 877–885. [Google Scholar] [CrossRef]
  7. Hu, Y.G.; Wu, X.X.; Zhao, G.; Liu, M.S.; Li, P.; Lu, W.B. Determination of safety control standard for high rock slopes under blasting vibration. Chin. J. Rock Mech. Eng. 2016, 35, 2208–2216. [Google Scholar] [CrossRef]
  8. Zhou, H.Y.; Chi, E.A.; Ouyang, T.Y.; Yu, H.K.; Gao, Z.H. Analysis of Stability of Open Slope under Blasting Load. Blasting 2021, 38, 80–87. [Google Scholar] [CrossRef]
  9. Zhao, J.J.; Xiao, J.G.; Xiang, X.Q.; Huang, R.Q.; Wang, Y.C.; Shi, W.B. Failure mechanism numerical simulation of mining landslide with gentle bedding coal strata. J. China Coal Soc. 2014, 39, 424–429. [Google Scholar] [CrossRef]
  10. Wang, C.Y.; Li, J.P.; Liu, W.; Zhang, Q. Study on the Stability and Timeliness of Slope Mining by the Combination of Open Pit and Underground. Min. Res. Dev. 2017, 37, 107–110. [Google Scholar] [CrossRef]
  11. Xie, L.K.; Xiong, D.Y.; Yang, T.H.; Wan, C.C.; Hu, J.J. Analysis on disaster impact of concealed goaves underneath open-pit slope and its treatment. Chin. J. Nonferrous Met. 2020, 30, 2505–2512. [Google Scholar]
  12. Yin, G.Z.; Li, X.S.; Li, Y.J. Simulation on the deformation and failure response features and stability of a slope from open pit mining to underground mining under the effecting of excavation goaf by the floor friction model. Chin. J. Eng. 2012, 34, 231–238. [Google Scholar] [CrossRef]
  13. Jia, S.G.; Jin, A.B.; Zhao, Y.Q. Application of UAV oblique photogrammetry in the field of geology survey at the high and steep slope. Rock Soil Mech. 2018, 39, 1130–1136. [Google Scholar] [CrossRef]
  14. Dong, X.J.; Huan, R.Q. Application of 3D laser scanning technology to geologic survey of high and steep slope. Chin. J. Rock Mech. Eng. 2006, 2006, 3629–3635. [Google Scholar] [CrossRef]
  15. Huan, J.; Shi, Y.C.; Ji, F. Discussion on the Application of 3-D Laser Scanning Technology to the Investigation of High Slop Perilous Rockmass. J. Yangtze River Sci. Res. Inst. 2013, 30, 45–49. [Google Scholar] [CrossRef]
  16. Yang, L.L. Application of Aerial Photogrammetry Based on Light and Small Unmanned Aerial Vehicle in Geometric Information Survey of High and Steep Slope. Master’s Thesis, Southwest Jiaotong University, Chengdu, China, 3 May 2017. [Google Scholar]
  17. Fang, K. Application of aerial photography technology in topographic map repairing and surveying engineering. Fujian Build. Mater. 2018, 5, 47–48. [Google Scholar]
  18. Wang, G.; Jiang, R.B.; Xiao, H.H.; Zhang, D. Research on slope reconstruction technique based on UAV oblique photogrammetry. China Min. Mag. 2017, 26, 158–161. [Google Scholar]
  19. Vasuki, Y.; Holden, E.J.; Kovesi, P.; Peter, K.; Steven, M. Semi-automatic mapping of geological Structures using UAV-based photogrammetric data: An image analysis approach. Comput. Geosci. 2014, 69, 22–32. [Google Scholar] [CrossRef]
  20. Michele, C.; Rita, A. Advanced 3D Photogrammetric Surface Reconstruction of Extensive Objects by UAV Camera Image Acquisition. Sensors 2018, 18, 2815. [Google Scholar] [CrossRef]
  21. Jin, A.B.; Chen, S.J.; Zhao, A.Y.; Sun, H.; Zhang, Y.S. Numerical simulation of open-pit mine slope based on unmanned aerial vehicle photogrammetry. Rock Soil Mech. 2021, 42, 255–264. [Google Scholar] [CrossRef]
  22. Zhou, Z.H.; Chen, Z.H.; Wang, J.M.; Zhang, L.F.; Nian, G.Q. Catastrophe analysis of open-pit slope stability under blasting load. Rock Soil Mech. 2020, 41, 849–857. [Google Scholar] [CrossRef]
  23. Wu, X.X.; Rao, Y.; Hu, Y.G.; Cai, C.Z. Determination method of control standard under blasting vibration based on stop stability. Eng. Blasting 2021, 27, 11–18. [Google Scholar] [CrossRef]
  24. Zhang, H.; Wu, Z.X.; Xu, S.; Wu, C.F.; Lv, Q. Influence of Blasting Damage Zone on Slope Stability based on Hoek-brown Criterion. Blasting 2022, 39, 134–139. [Google Scholar]
  25. Cui, T.J.; Ma, Y.D.; Wang, L.G. Simulated study on the influence of the slope blasting height on the slope stability. J. Saf. Environ. 2017, 17, 896–900. [Google Scholar] [CrossRef]
  26. Yang, X.J.; Geng, Q.; Liu, C.K.; Peng, W.Y.; Song, Z.G.; Zhao, D.D. Numerical Analysis for the Influence of Lower Goaf on the Slope Stability. Min. Res. Dev. 2018, 38, 71–74. [Google Scholar] [CrossRef]
  27. Li, W.; Ren, P.; Li, Q.Y.; Guo, X.F. Study on instability mechanism of red clay slope under the influence of goat. Saf. Coal Mines 2021, 52, 237–240. [Google Scholar] [CrossRef]
  28. Sun, S.G.; Zhang, Y.J.; Zhang, Y.H.; Guo, W.C. Research on Influencing Mechanism of the Synchronous Mining of Open-pit and Underground on Slope Deformation. Met. Mine 2016, 2016, 58–62. [Google Scholar]
  29. Shi, F.W.; Xiao, Y.T.; Yao, G.H.; Cao, H. Safety Evaluation and Countermeasures of the Open-pit Mning under the Goaf Occurrence. Mod. Min. 2019, 35, 130–134. [Google Scholar]
  30. Westoby, M.J.; Brasington, J.; Glasser, N.F.; Hambrey, M.J.; Reynolds, J.M. ‘Structure-from-Motion’ photogrammetry: A low-cost, effective tool for geoscience applications. Geomorphology 2012, 179, 300–314. [Google Scholar] [CrossRef]
  31. Kong, D.H.; Wu, F.Q.; Saroglou, C. Automatic identification and characterization of discontinuities in rock masses from 3D point clouds. Eng. Geol. 2020, 265, 105442. [Google Scholar] [CrossRef]
  32. Xie, J.H.; Yu, B.X.Z.H.; Zhang, Y.H. Brief introduction of numerical simulation software flac and its application on geosciences. Geol. Explor. 2005, 2, 77–80. [Google Scholar]
Figure 1. Project location diagram.
Applsci 13 05940 g001
Figure 2. Research technology lines.
Applsci 13 05940 g002
Figure 3. UAV Geological survey area.
Applsci 13 05940 g003
Figure 4. Investigation area I point cloud data.
Applsci 13 05940 g004
Figure 5. Investigation area II point cloud data.
Applsci 13 05940 g005
Figure 6. Rose diagram of rock joint surface strike.
Applsci 13 05940 g006
Figure 7. Composition of blasting vibration meter.
Applsci 13 05940 g007
Figure 8. Layout of measuring points in the blasting area and vibration measuring area.
Applsci 13 05940 g008
Figure 9. Fitting curve of the particle velocity of the blasting vibration.
Applsci 13 05940 g009
Figure 10. Three-dimensional model of the relative position between mine and goaf.
Applsci 13 05940 g010
Figure 11. Modeling process.
Applsci 13 05940 g011
Figure 12. Three-dimensional slope model. (a) Present slope mesh model. (b) Design excavation slope mesh model.
Applsci 13 05940 g012
Figure 13. Numerical calculation result cloud of the current slope mining area H and mining area I profile. (a) H mining area plastic zone. (b) Vertical displacement cloud map of H mining area. (c) I mining area plastic zone. (d) Vertical displacement cloud map of I mining area.
Applsci 13 05940 g013
Figure 14. Numerical calculation result cloud of the design excavation slope mining area H and mining area I profile. (a) H mining area plastic zone. (b) Vertical displacement cloud map of H mining area. (c) I mining area plastic zone. (d) Vertical displacement cloud map of I mining area.
Applsci 13 05940 g014
Figure 15. Safety factor calculation section.
Applsci 13 05940 g015
Figure 16. Current slope safety factor. (a) Load combination I. (b) Load combination II.
Applsci 13 05940 g016
Figure 17. Planned excavation slope safety factor. (a) Load combination I. (b) Load combination II.
Applsci 13 05940 g017
Table 1. Center coordinates of the blasting area.
Blast AreaBlasting Zone Center Coordinates
XYZ
A566,644.72813,201,628.888−31.3655
B566,624.63583,201,261.0618−42
C566,965.44423,201,443.7396−42
D566,890.10923,201,446.9961−56
Table 2. Vibration point coordinates.
Blast AreaMaximum
One-Stage Charge (kg)
Measuring PointDistance between the Center of Blasting Area and the Measuring Point (m)
LevelVerticalStraight Line
A410A1242.461.13242.47
A2223.981.28223.98
A3210.071.13210.08
A424.6411.9227.37
A546.1112.0547.66
B250B1140.22114.62181.11
B2226.98113.15253.62
B3266.25113.81289.56
B4393.24113.74409.36
B5416.99114.42432.40
C400C1155.16113.79192.41
C2149.96114.04188.39
C3149.66113.90188.08
C4148.56113.52186.97
C5158.02113.59194.61
D380C1225.14127.79258.88
C2224.09128.04258.09
C3224.90127.90258.73
C4223.96127.52257.71
C5232.47127.59265.18
Table 3. Blasting vibration monitoring data.
Measuring PointPeak Vibration Velocity in the X Direction (cm/s)Peak Vibration Velocity in the Y Direction (cm/s)Peak Vibration Velocity in the Z Direction (cm/s)Superposition Vibration
Velocity (cm/s)
A10.83150.02550.47730.2453
A22.93276.96577.87458.8547
A30.47190.62740.26290.6832
A40.07310.46940.00570.4706
B20.03150.34210.24830.4014
B30.43480.46700.28610.5179
B40.17620.13380.09740.2008
B50.00520.12980.00140.1298
C10.12600.00750.66000.6605
C21.01470.93071.18841.4475
C30.92271.58591.40362.0280
C40.09160.90700.98941.0875
C50.34340.92781.06211.2176
Table 4. Mechanical parameters of the rock mass.
Lithologic CharactersCompressive Strength (MPa)Poisson RatioForce of
Cohesion (MPa)
Angle of
Internal Friction (°)
Elastic Modulus (GPa)Tensile Strength (MPa)
Quartz porphyry114.060.3411.80635.75361.06
Phyllite64.430.3341.00123.2524.90.93
Table 5. Maximum horizontal acceleration data for blast vibration.
Measuring PointMaximum Horizontal Acceleration of a Mass (cm/s2)
A10.4063
A22001.3306
A3186.2939
A456.9758
B285.2876
B3134.2878
B419.2972
B531.4129
C161.8013
C2243.3945
C3571.9120
C4306.6573
C5324.5797
Table 6. Planned excavation slope safety factor.
Present Safety Slope
Coefficient
Planned Excavation Slope Safety FactorPlanned Excavation Slope
Parameters
Load
Combination I
Load
Combination II
Load
Combination I
Load
Combination II
Final Slope
Angle (°)
Maximum Height (m)
1.4731.4091.1301.08144.8540
Disclaimer/Publisher’s Note: The statements, opinions and data contained in all publications are solely those of the individual author(s) and contributor(s) and not of MDPI and/or the editor(s). MDPI and/or the editor(s) disclaim responsibility for any injury to people or property resulting from any ideas, methods, instructions or products referred to in the content.

